Submitted:
02 August 2024
Posted:
04 August 2024
You are already at the latest version
Abstract

Keywords:
1. Introduction
2. Methodology
2.1. Chemical reagents
2.2. Graphene production
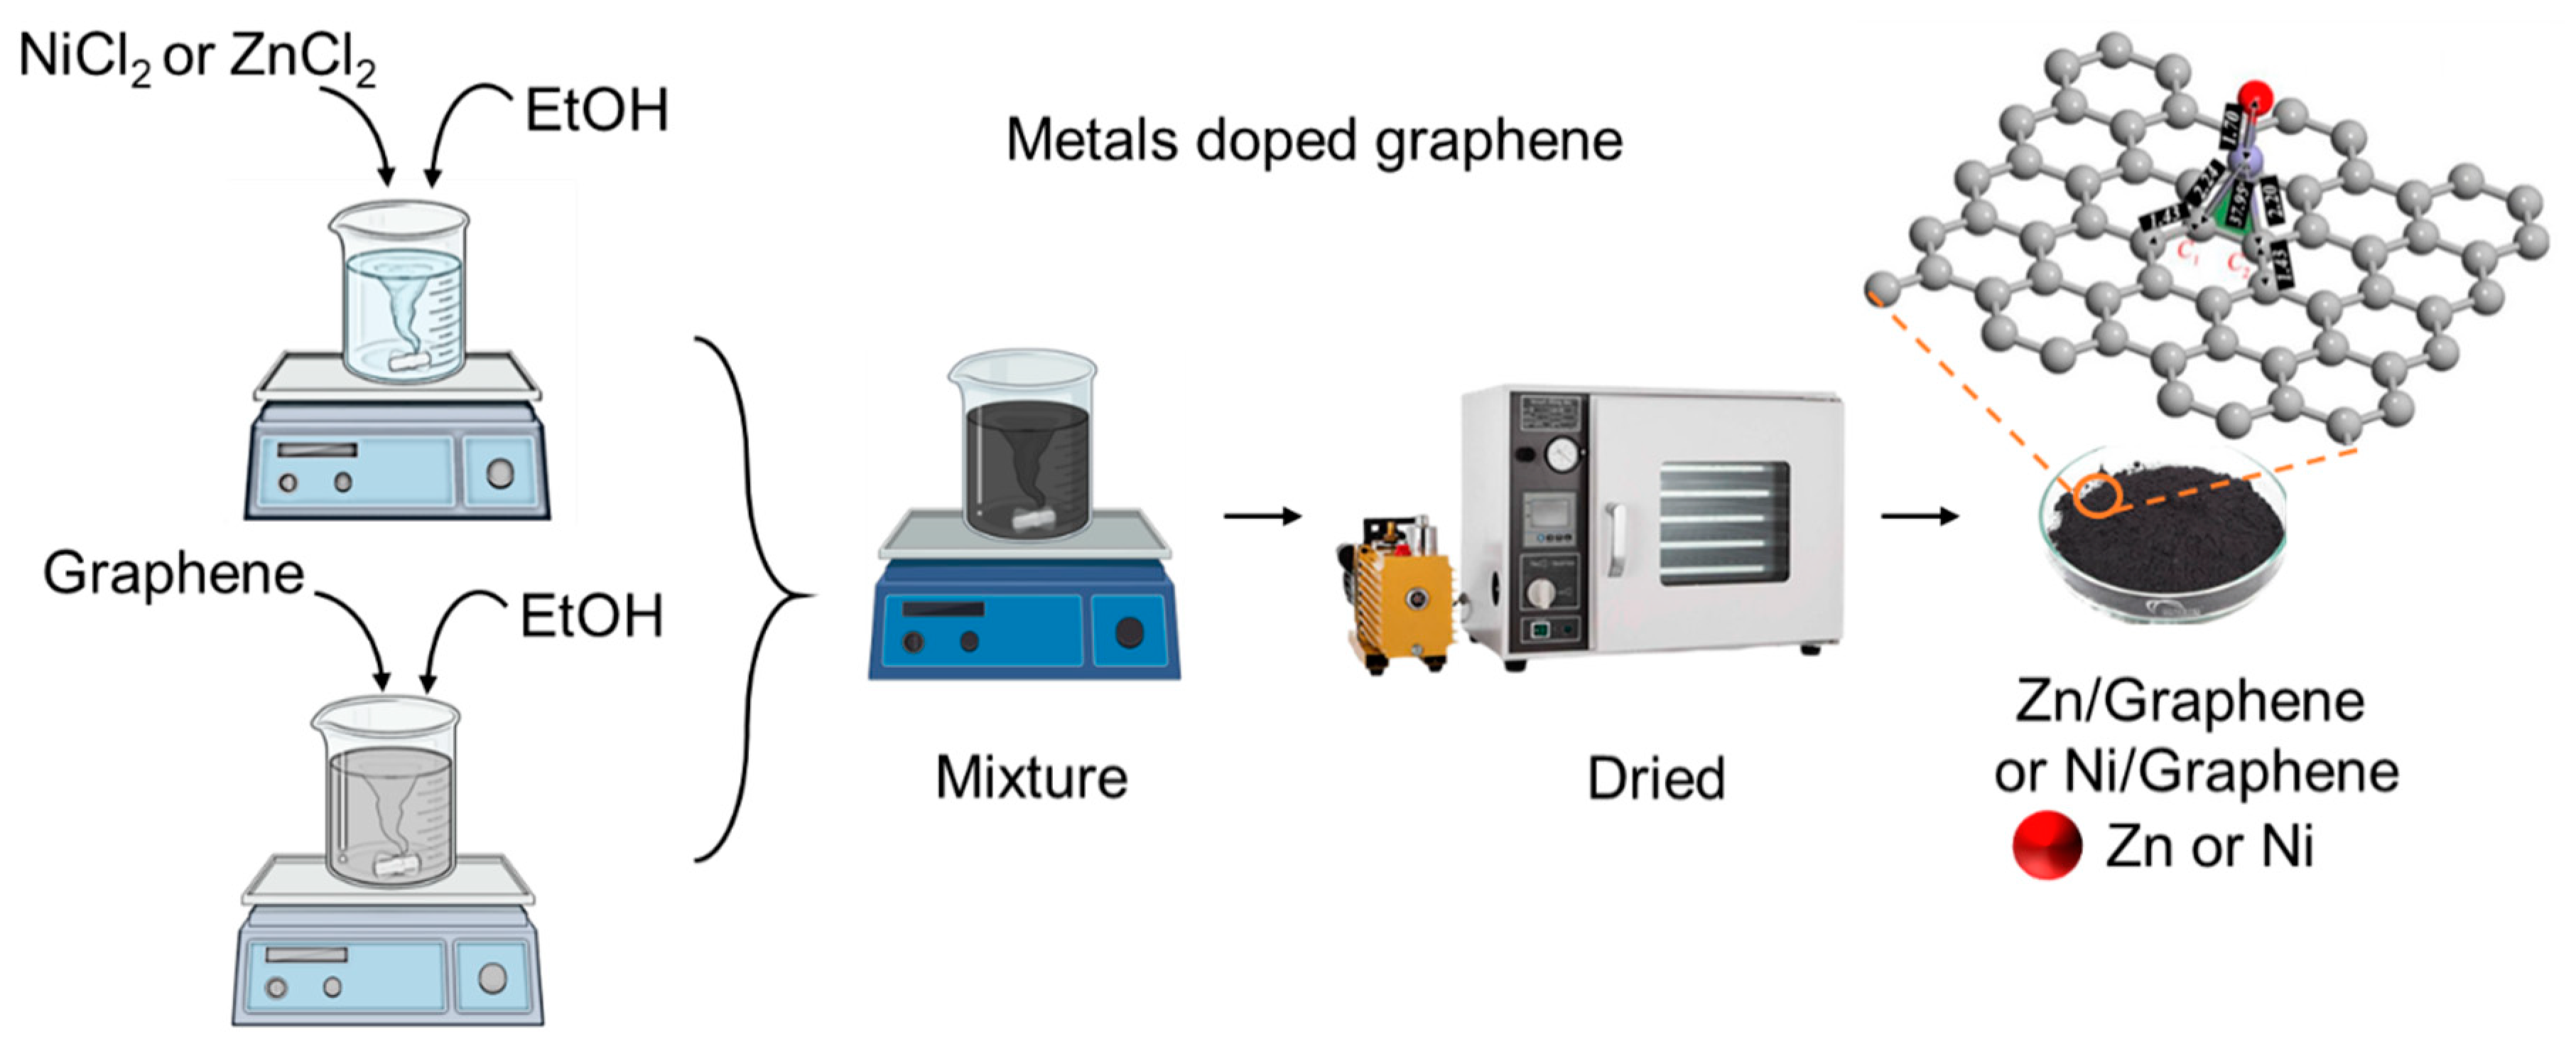
2.3. Preparation of Ni/Graphene and Zn/Graphene
2.4. Characterizations
3. Results and Discussion
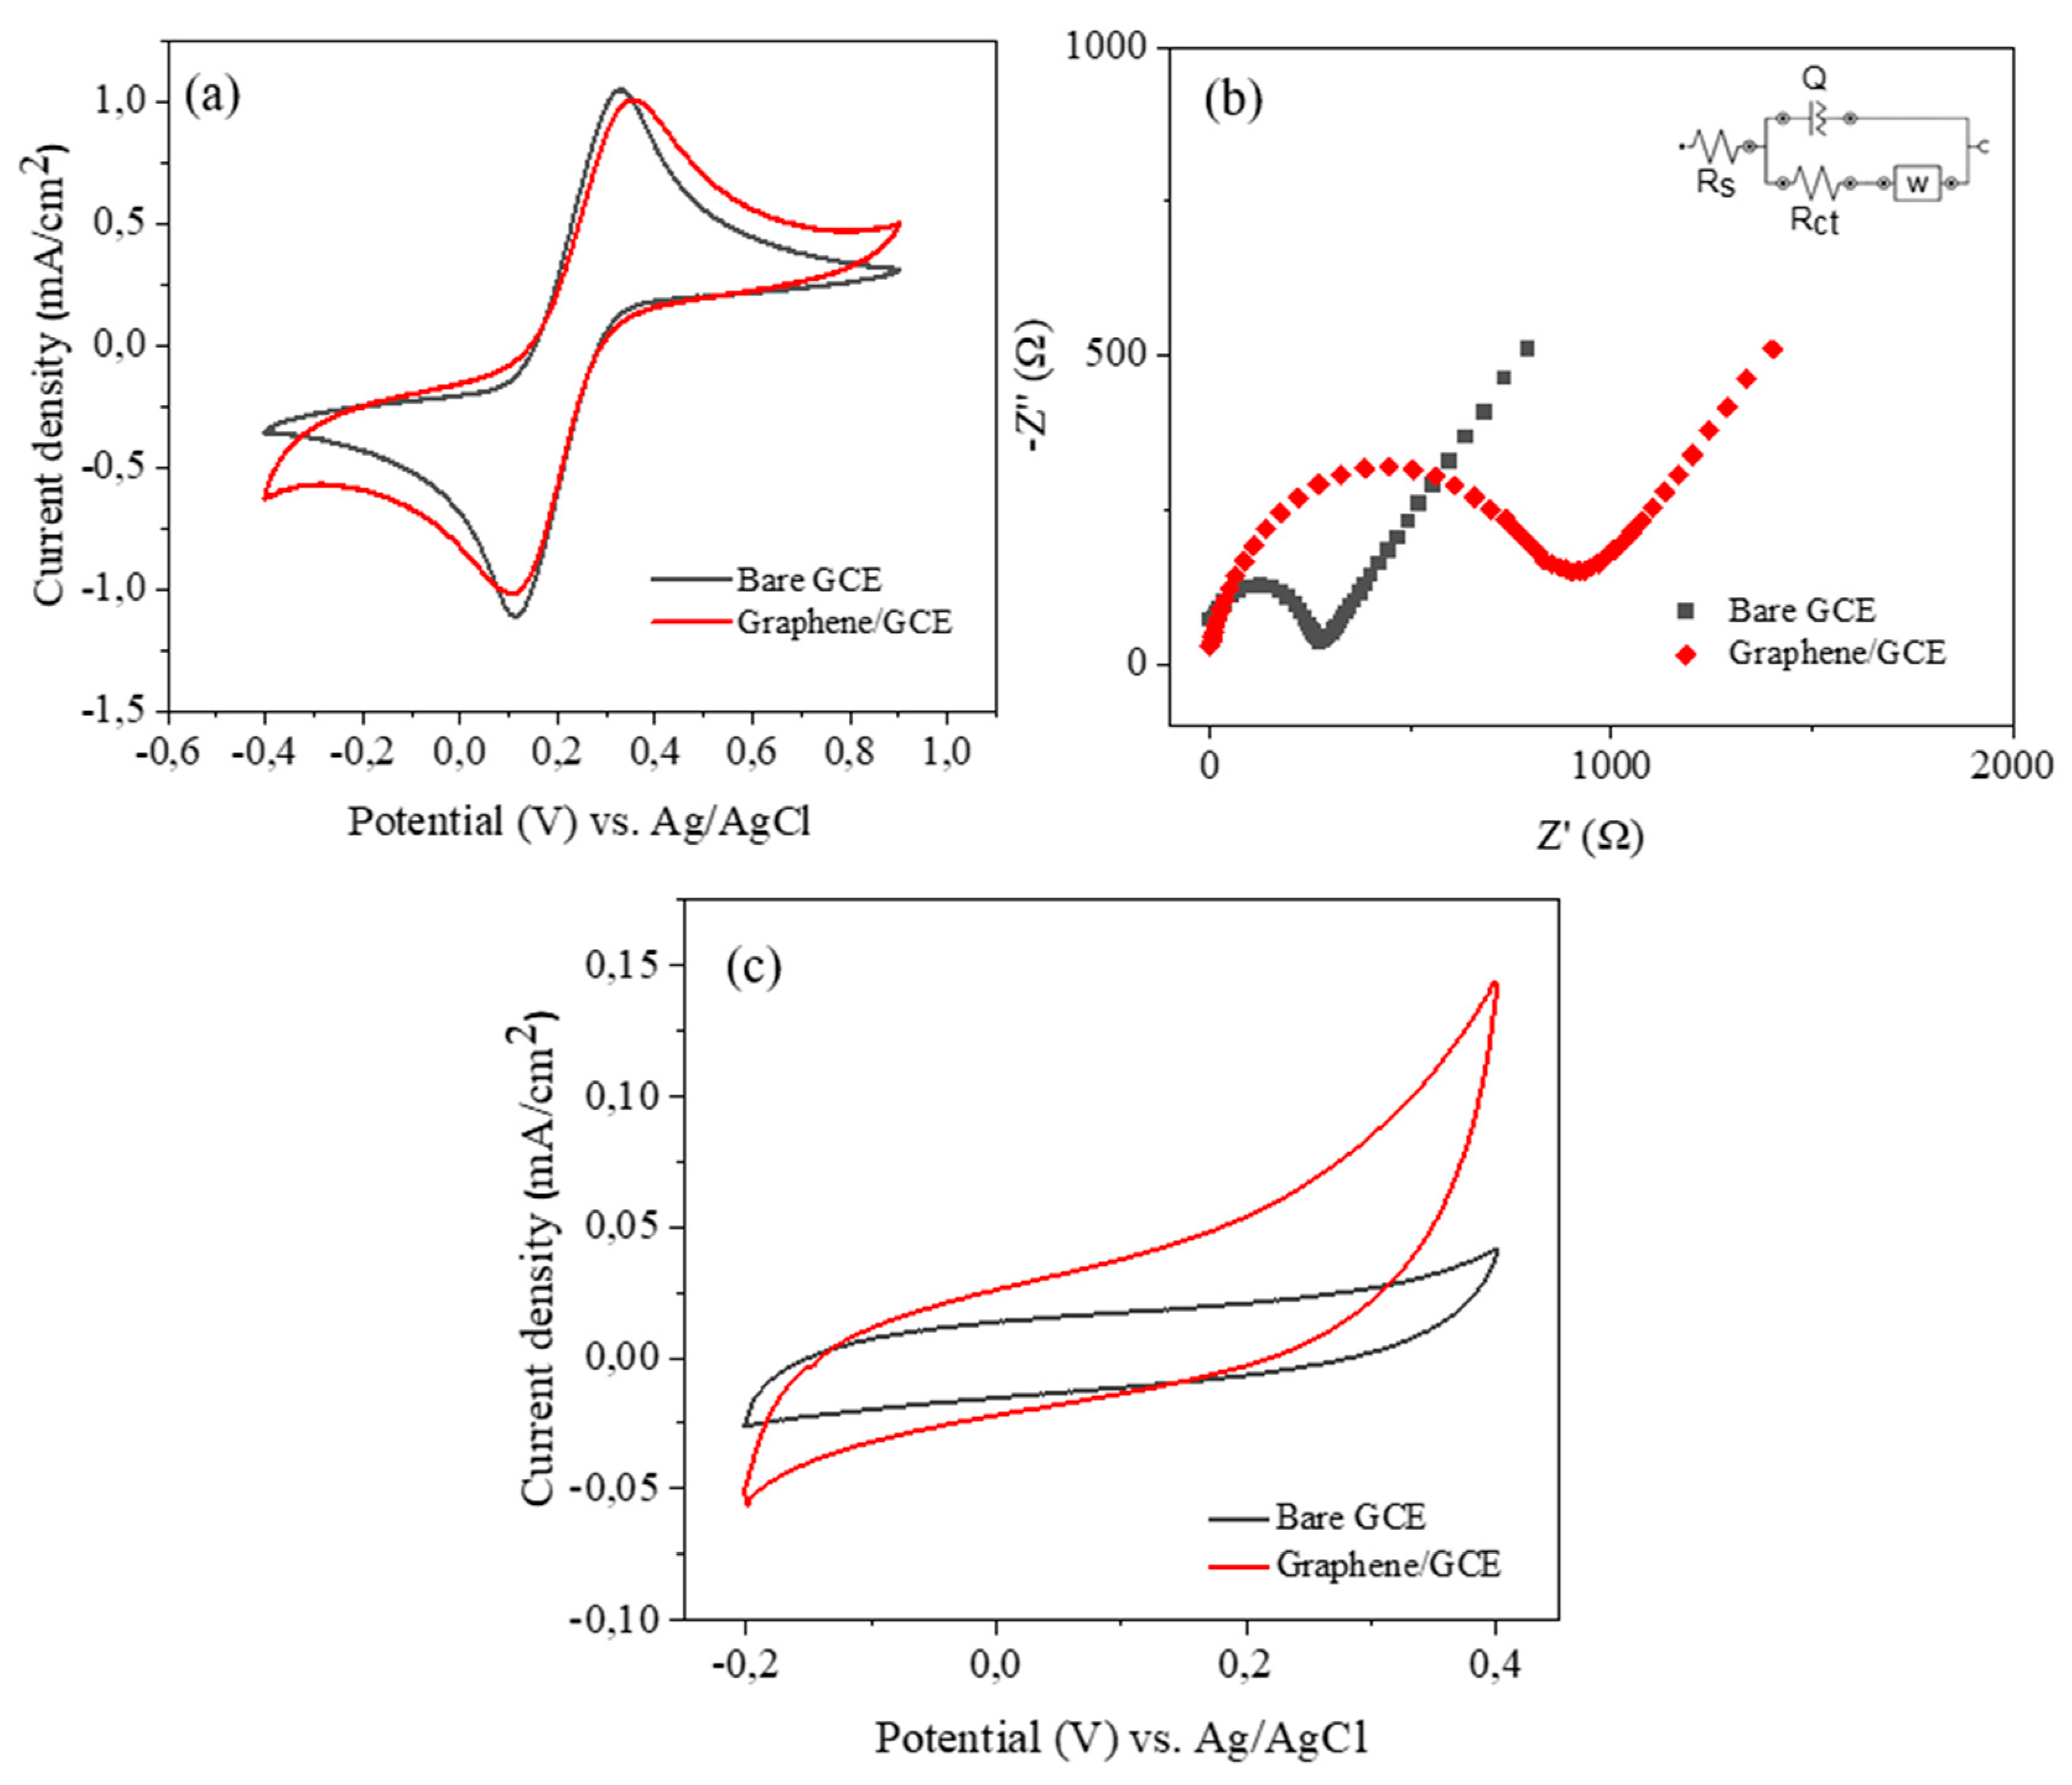
3.1. Graphene characterization and electrochemical performance
3.2. Ni or Zn decorated on graphene study
3.3. Ni/Graphene and Zn/Graphene electrode performance
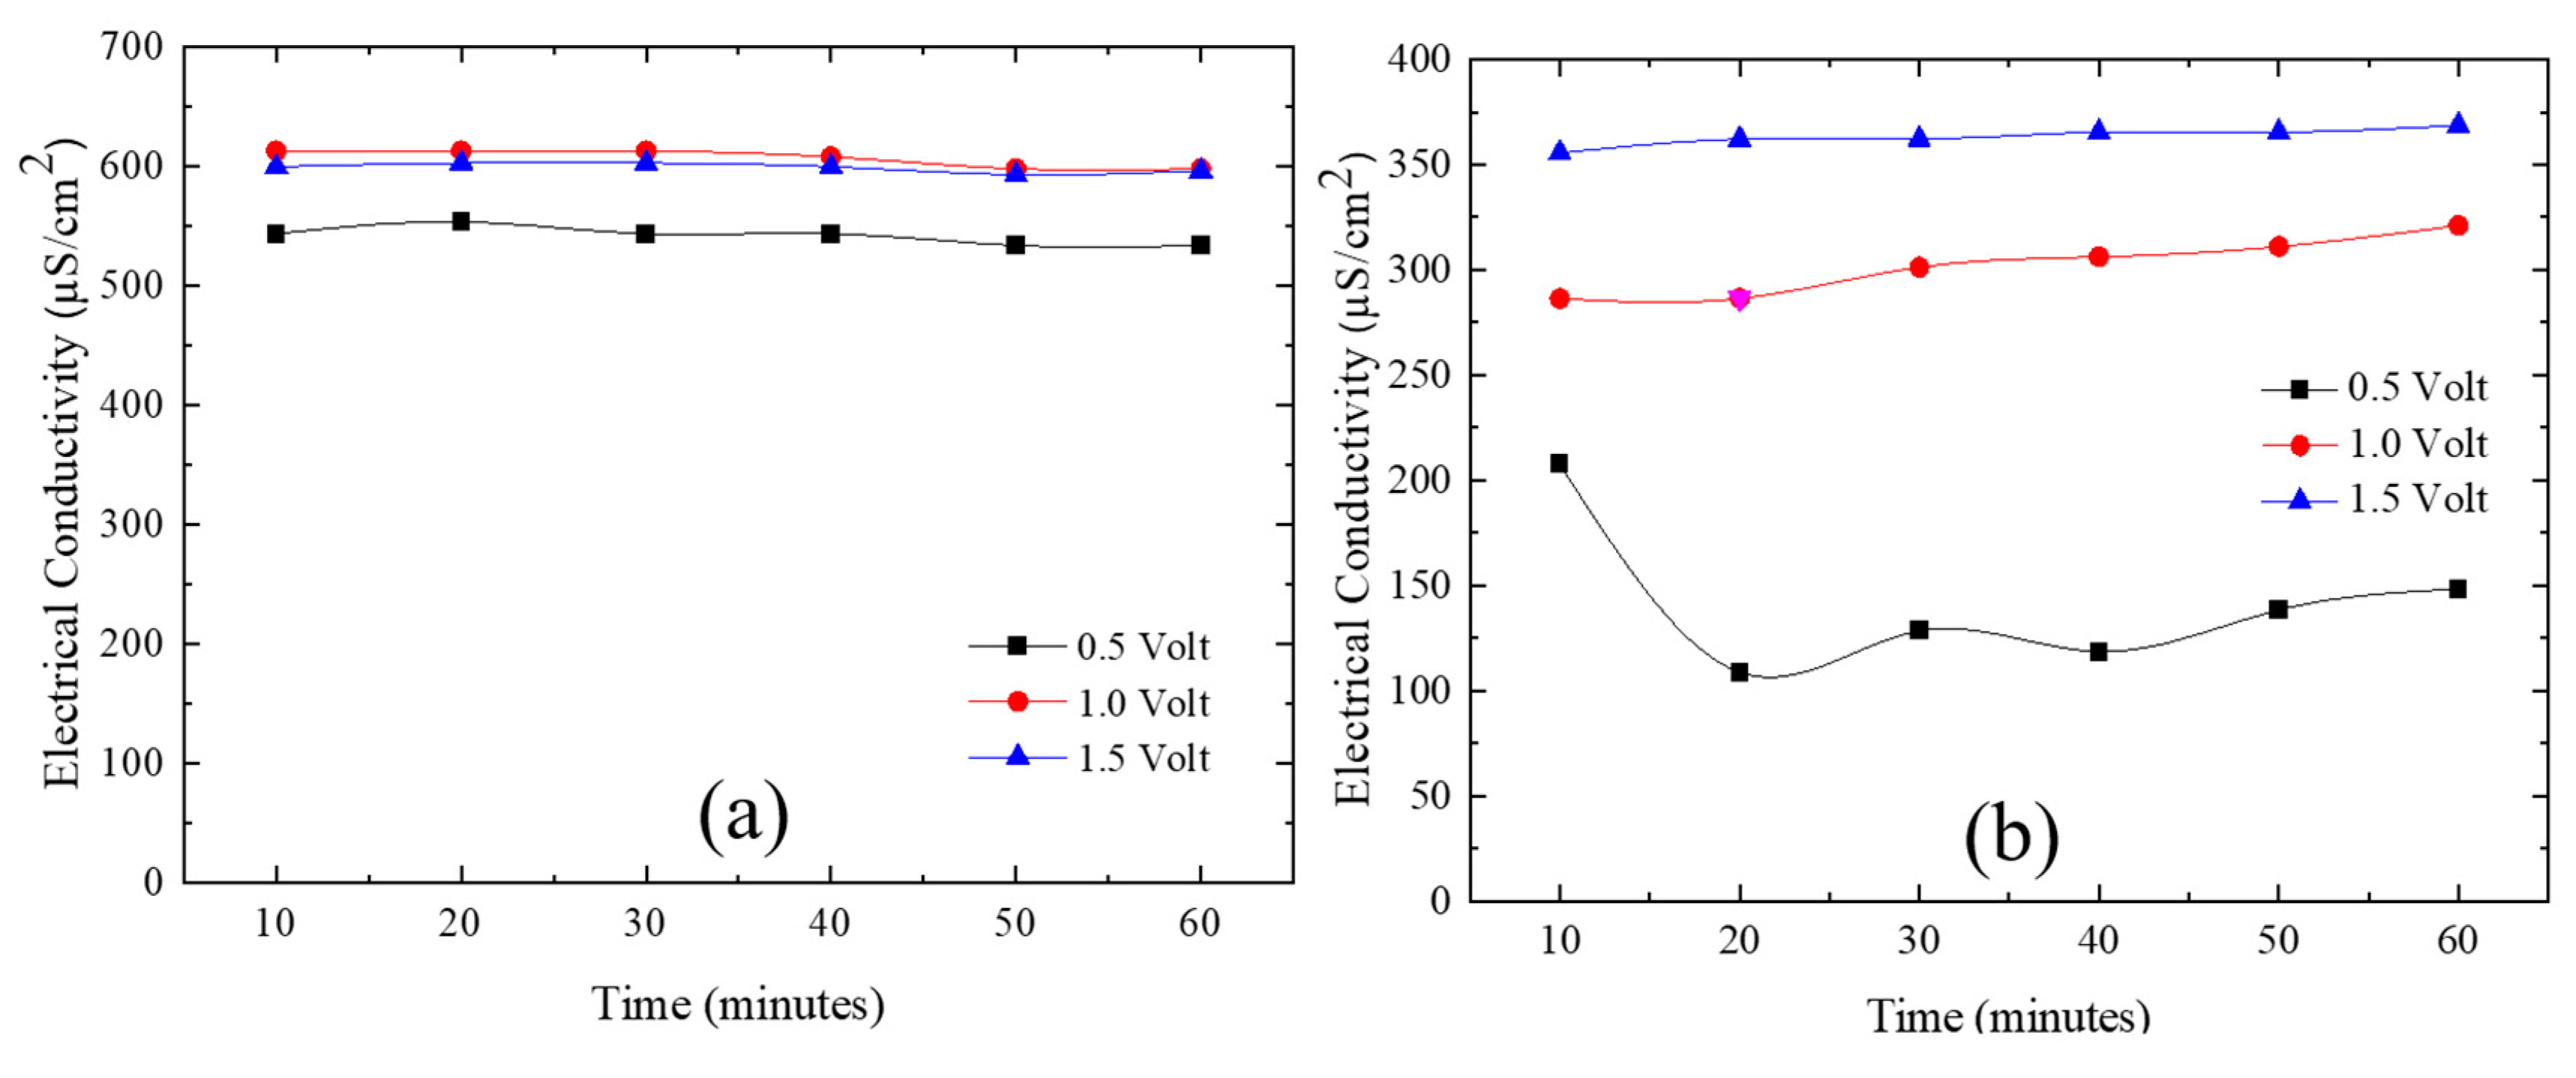

4. Conclusions
Funding
Acknowledgments
Conflicts of Interest
References
- R. Borah, F.R. Hughson, J. Johnston, T. Nann, On battery materials and methods, Mater. Today Adv. 6 (2020) 100046. [CrossRef]
- F. Omenya, M. Paiss, X. Li, D. Reed, Energy and Power Evolution Over the Lifetime of a Battery, ACS Energy Lett. 8 (2023) 2707–2710. [CrossRef]
- S. Mahmud, M. Rahman, M. Kamruzzaman, M.O. Ali, M.S.A. Emon, H. Khatun, M.R. Ali, Recent advances in lithium-ion battery materials for improved electrochemical performance: A review, Results Eng. 15 (2022) 100472. [CrossRef]
- X. Tang, S. Lv, K. Jiang, G. Zhou, X. Liu, Recent development of ionic liquid-based electrolytes in lithium-ion batteries, J. Power Sources 542 (2022) 231792. [CrossRef]
- H.M. Fahmy, E.S. Abu Serea, R.E. Salah-Eldin, S.A. Al-Hafiry, M.K. Ali, A.E. Shalan, S. Lanceros-Méndez, Recent Progress in Graphene- and Related Carbon-Nanomaterial-based Electrochemical Biosensors for Early Disease Detection, ACS Biomater. Sci. Eng. 8 (2022) 964–1000. [CrossRef]
- K. Amini, A.N. Shocron, M.E. Suss, M.J. Aziz, Pathways to High-Power-Density Redox Flow Batteries, ACS Energy Lett. 8 (2023) 3526–3535. [CrossRef]
- J.L. Schaefer, Toward High-Energy Batteries: High-Voltage Stability via Superstructure Control, Joule 4 (2020) 296–298. [CrossRef]
- S. Ge, R.S. Longchamps, T. Liu, J. Liao, Y. Leng, C.Y. Wang, High safety and cycling stability of ultrahigh energy lithium ion batteries, Cell Reports Phys. Sci. 2 (2021) 100584. [CrossRef]
- S. Barcellona, S. Colnago, G. Dotelli, S. Latorrata, L. Piegari, Aging effect on the variation of Li-ion battery resistance as function of temperature and state of charge, J. Energy Storage 50 (2022) 104658. [CrossRef]
- L. Xu, Y. Liu, Z. Ding, X. Xu, X. Liu, Z. Gong, J. Li, T. Lu, L. Pan, Solvent-Free Synthesis of Covalent Organic Framework/Graphene Nanohybrids: High-Performance Faradaic Cathodes for Supercapacitors and Hybrid Capacitive Deionization, Small 20 (2024) 2307843. [CrossRef]
- Y. Xiao, N. Yan, Battery and biomass refining: A cost-effective integration, Chem Catal. 3 (2023). [CrossRef]
- H.J. Oh, H.K. Kang, H. Ahn, J. Park, J. Choi, H.Y. Kim, E. Lee, S.Y. Yeo, Y.O. Choi, B.J. Yeang, S.-B. Son, B.-S. Lee, Layered oxide cathode-inspired secondary hard carbon microsphere anode material for high-power and long-life rechargeable batteries, Chem. Eng. J. 454 (2023) 140252. [CrossRef]
- D. Wang, G. Wang, M. Zhang, Y. Cui, J. Yu, S. Shi, Composite cathode materials for next-generation lithium fluorinated carbon primary batteries, J. Power Sources 541 (2022) 231716. [CrossRef]
- J. Song, J. Zheng, A. Yang, H. Liu, Z. Zhao, N. Wang, F. Yan, Metal–organic framework transistors for dopamine sensing, Mater. Chem. Front. 5 (2021) 3422–3427. [CrossRef]
- F. Duffner, L. Mauler, M. Wentker, J. Leker, M. Winter, Large-scale automotive battery cell manufacturing: Analyzing strategic and operational effects on manufacturing costs, Int. J. Prod. Econ. 232 (2021) 107982. [CrossRef]
- Y. Liu, R. Zhang, J. Wang, Y. Wang, Current and future lithium-ion battery manufacturing, IScience 24 (2021) 102332. [CrossRef]
- M. Supeno, C. Simanjuntak, R. Siburian, Facile and Benign Method to Produce Large Scale Graphene Nano Sheets, Iranian Journal of Chemistry and Chemical Engineering 39 (2020) 211–214. [CrossRef]
- Ababay Ketema Worku, Delele Worku Ayele, Recent advances of graphene-based materials for emerging technologies, Results Chem. 5 (2023) 100971. [CrossRef]
- S.K. Tiwari, S. Sahoo, N. Wang, A. Huczko, Graphene research and their outputs: Status and prospect, J. Sci. Adv. Mater. Devices 5 (2020) 10–29. [CrossRef]
- A. Chaudhuri, A. Chaudhuri, A. Joydhar, Graphene nanocomposites and applications in electrochemical energy storage materials, Mater. Today Proc. 64 (2022) 1569–1581. [CrossRef]
- P. Ares, K.S. Novoselov, Recent advances in graphene and other 2D materials, Nano Mater. Sci. 4 (2022) 3–9. [CrossRef]
- A. Hayat, M. Sohail, A. El Jery, K.M. Al-Zaydi, S. Raza, H. Ali, Z. Ajmal, A. Zada, T.A. Taha, I.U. Din, M.A. Khan, M.A. Amin, Y. Al-Hadeethi, A.Z. Barasheed, Y. Orooji, J. Khan, M.Z. Ansari, Recent advances, properties, fabrication and opportunities in two-dimensional materials for their potential sustainable applications, Energy Storage Mater. 59 (2023) 102780. [CrossRef]
- E. Umar, M. Ikram, J. Haider, W. Nabgan, M. Imran, G. Nazir, 3D graphene-based material: Overview, perspective, advancement, energy storage, biomedical engineering and environmental applications a bibliometric analysis, J. Environ. Chem. Eng. 11 (2023) 110339. [CrossRef]
- H. Ba, L. Truong-Phuoc, T. Romero, C. Sutter, J.-M. Nhut, G. Schlatter, G. Giambastiani, C. Pham-Huu, Lightweight, few-layer graphene composites with improved electro-thermal properties as efficient heating devices for de-icing applications, Carbon N. Y. 182 (2021) 655–668. [CrossRef]
- B. Xiong, F. Peng, W. Chen, C. Li, Q. Zhu, Z. Niu, F. Zheng, D. Cheng, Outstanding strength and toughness in graphene reinforced Nb/Nb5Si3 composites with interfacial nano-phases, J. Mater. Res. Technol. 25 (2023) 6886–6897. [CrossRef]
- G. Chang, L. Wang, Y. Zhang, X. Li, K. Chen, D. Kan, W. Zhang, S. Zhang, L. Dong, L. Li, X. Bai, H. Zhang, W. Huo, Superior Thermal Conductivity of Graphene Film/Cu-Zr Alloy Composites for Thermal Management Applications, ACS Appl. Mater. Interfaces 14 (2022) 56156–56168. [CrossRef]
- T.B. Naveen, D. Durgalakshmi, J. Mohanraj, A.K. Kunhiraman, S. Balakumar, R.A. Rakkesh, Insights on the electrochemical properties of lattice strain induced layered V2O3–Al2O3 nanocomposites derived from the carbonization process, J. Mater. Sci. Mater. Electron. 34 (2023) 1636. [CrossRef]
- S. Zhang, H. Wang, J. Liu, C. Bao, Measuring the specific surface area of monolayer graphene oxide in water, Mater. Lett. 261 (2020) 127098. [CrossRef]
- Q. Xue, D. Yang, L. Jiang, B. Li, P. Ming, Modifying Carbon Supports of Catalyst for the Oxygen Reduction Reaction in Vehicle PEMFCs, Automot. Innov. 4 (2021) 119–130. [CrossRef]
- R. Naraprawatphong, C. Chokradjaroen, S. Thiangtham, L. Yang, N. Saito, Nanoscale advanced carbons as an anode for lithium-ion battery, Mater. Today Adv. 16 (2022) 100290. [CrossRef]
- S. Jamnuch, T.A. Pascal, Electronic signatures of Lorentzian dynamics and charge fluctuations in lithiated graphite structures, Nat. Commun. 14 (2023) 2291. [CrossRef]
- Y.S. Choi, C. Yeo, S.J. Kim, J.-Y. Lee, Y. Kim, K.R. Cho, S. Ju, B.H. Hong, S.Y. Park, Multifunctional reduced graphene oxide-CVD graphene core–shell fibers, Nanoscale 11 (2019) 12637–12642. [CrossRef]
- J. Haruyama, S. Takagi, K. Shimoda, I. Watanabe, K. Sodeyama, T. Ikeshoji, M. Otani, Thermodynamic Analysis of Li-Intercalated Graphite by First-Principles Calculations with Vibrational and Configurational Contributions, J. Phys. Chem. C 125 (2021) 27891–27900. [CrossRef]
- S. Scaravonati, M. Sidoli, G. Magnani, A. Morenghi, M. Canova, J.-H. Kim, M. Riccò, D. Pontiroli, Combined capacitive and electrochemical charge storage mechanism in high-performance graphene-based lithium-ion batteries, Mater. Today Energy 24 (2022) 100928. [CrossRef]
- M. Kotal, S. Jakhar, S. Roy, H.K. Sharma, Cathode materials for rechargeable lithium batteries: Recent progress and future prospects, J. Energy Storage 47 (2022) 103534. [CrossRef]
- G. Utkan, G. Yumusak, B.C. Tunali, T. Ozturk, M. Turk, Production of Reduced Graphene Oxide by Using Three Different Microorganisms and Investigation of Their Cell Interactions, ACS Omega 8 (2023) 31188–31200. [CrossRef]
- J. Zhan, Z. Lei, Y. Zhang, Non-covalent interactions of graphene surface: Mechanisms and applications, Chem 8 (2022) 947–979. [CrossRef]
- J. Han, X. Tang, S. Ge, Y. Shi, C. Zhang, F. Li, S. Bai, Si/C particles on graphene sheet as stable anode for lithium-ion batteries, J. Mater. Sci. Technol. 80 (2021) 259–265. [CrossRef]
- C. Simanjuntak, R. Siburian, H. Marpaung, Tamrin, Properties of Mg/graphite and Mg/graphene as cathode electrode on primary cell battery, Heliyon 6 (2020) e03118. [CrossRef]
- S. on Tung, S.L. Fisher, N.A. Kotov, L.T. Thompson, Nanoporous aramid nanofibre separators for nonaqueous redox flow batteries, Nat. Commun. 9 (2018). [CrossRef]
- K.K. Sarigamala, S. Shukla, A. Struck, S. Saxena, Graphene-Based Coronal Hybrids for Enhanced Energy Storage, Energy Mater. Adv. 2021 (2021). [CrossRef]
- K. Ullah, N. Shah, R. Wadood, B.M. Khan, W.C. Oh, Recent trends in graphene based transition metal oxides as anode materials for rechargeable lithium-ion batteries, Nano Trends 1 (2023) 100004. [CrossRef]
- G. Shen, J. Kong, Y. Fei, L. Xu, L. Zhang, X. Jie, D. Ning, Z. Chen, Zn/Ni composite coating modified by reduced graphene oxide and layered double hydroxide with synergistic effect for superior corrosion protection of Mg alloys, Appl. Surf. Sci. 645 (2024) 158849. [CrossRef]
- L. Malyala, S. Thatipamula, V.R. Jetti, Magnesium–Graphene Composite Coated on SS Mesh as Cathode Material for Rechargeable Magnesium ion Battery, Trans. Indian Inst. Met. 72 (2019) 2503–2510. [CrossRef]
- Y. Gong, B. Wang, H. Ren, D. Li, D. Wang, H. Liu, S. Dou, Recent Advances in Structural Optimization and Surface Modification on Current Collectors for High-Performance Zinc Anode: Principles, Strategies, and Challenges, Springer Nature Singapore, 2023. [CrossRef]
- Q. Liu, H. Zhang, J. Xie, X. Liu, X. Lu, Recent progress and challenges of carbon materials for Zn-ion hybrid supercapacitors, Carbon Energy 2 (2020) 521–539. [CrossRef]
- R. Siburian, L.W. Tang, Y. Alias, A.I.Y. Tok, R. Goei, C. Simanjuntak, K. Tarigan, S. Paiman, B.T. Goh, I. Anshori, C. Kurniawan, Coconut waste to green nanomaterial: Large scale synthesis of N-doped graphene nano sheets, Nano-Structures and Nano-Objects 36 (2023) No. 101061. [CrossRef]
- G. Tatrari, C. Tewari, M. Pathak, D. Bhatt, M. Solanki, F.U. Shah, N.G. Sahoo, Coconut-husk derived graphene for supercapacitor applications: comparative analysis of polymer gel and aqueous electrolytes, Mater. Adv. 4 (2023) 3310–3322. [CrossRef]
- R. Siburian, A.M.M. Ali, K. Sebayang, M. Supeno, K. Tarigan, C. Simanjuntak, S.P. Aritonang, F. Hutagalung, The loading effect of Pt clusters on Pt/graphene nano sheets catalysts, Sci. Rep. 11 (2021). [CrossRef]
- G. Lou, Y. Chen, J. Xu, Y. Qian, H. Cheng, Z. Wei, Y. Yang, L. Shen, C. Shuai, Preparation of Graphene Oxide-loaded Nickel with Excellent Antibacterial Property by Magnetic Field-Assisted Scanning Jet Electrodeposition, Int. J. Bioprinting 8 (2022) 1–15. [CrossRef]
- M.A. Baqiya, A.Y. Nugraheni, W. Islamiyah, A.F. Kurniawan, M.M. Ramli, S. Yamaguchi, Y. Furukawa, S. Soontaranon, E.G.R. Putra, Y. Cahyono, Risdiana, Darminto, Structural study on graphene-based particles prepared from old coconut shell by acid–assisted mechanical exfoliation, Adv. Powder Technol. 31 (2020) 2072–2078. [CrossRef]
- M. González-Hourcade, G. Simões dos Reis, A. Grimm, V.M. Dinh, E.C. Lima, S.H. Larsson, F.G. Gentili, Microalgae biomass as a sustainable precursor to produce nitrogen-doped biochar for efficient removal of emerging pollutants from aqueous media, J. Clean. Prod. 348 (2022). [CrossRef]
- H. Budde, N. Coca-López, X. Shi, R. Ciesielski, A. Lombardo, D. Yoon, A.C. Ferrari, A. Hartschuh, Raman Radiation Patterns of Graphene, ACS Nano 10 (2016) 1756–1763. [CrossRef]
- J. Shah, J. Lopez-Mercado, M.G. Carreon, A. Lopez-Miranda, M.L. Carreon, Plasma Synthesis of Graphene from Mango Peel, ACS Omega 3 (2018) 455–463. [CrossRef]
- E.E. Nazarov, D.A. Aksyonov, E. V. Antipov, S.S. Fedotov, A Comprehensive Review of Defects Genealogy in Olivines: From the Mineral World to Modern Electrode Materials, Energies 16 (2023). [CrossRef]
- T. Prasankumar, S. Jose, P.M. Ajayan, M. Ashokkumar, Functional carbons for energy applications, Mater. Res. Bull. 142 (2021) No. 111425. [CrossRef]
- T. Li, X. Wang, P. Liu, B. Yang, S. Diao, Y. Gao, Synthesis of graphene/polyaniline copolymer for solid-state supercapacitor, J. Electroanal. Chem. 860 (2020) 113908. [CrossRef]
- S. Li, G. Song, Y. Zhang, Q. Fu, C. Pan, Graphene-Reinforced Zn-Ni Alloy Composite Coating on Iron Substrates by Pulsed Reverse Electrodeposition and Its High Corrosion Resistance, ACS Omega 6 (2021) 13728–13741. [CrossRef]
- P.N. Dave, R. Sirach, Influence of BaZnCuO3 and BaZnCuO3/rGO on the thermal decomposition of ammonium perchlorate and 3-nitro-3H-1,2,4-triazol-5-one (NTO), Asia-Pacific J. Chem. Eng. 18 (2023) e2894. [CrossRef]
- D. Zhang, X. Cui, G. Jin, Y. Jiao, D. Li, Preparation, deposited behavior and hydrophobic property of modified graphene oxide reinforced Ni composite coatings by magnetic field assisted electro-brush plating, Surf. Coatings Technol. 403 (2020) 126363. [CrossRef]
- M.E. Mohamed, P.S. Mekhaiel, F.M. Mahgoub, Construction of superhydrophobic graphene-based coating on steel substrate and its ultraviolet durability and corrosion resistance properties, Sci. Rep. 13 (2023) 590. [CrossRef]
- S. Srivastava, G.C. Jadeja, J. Parikh, Synergism studies on alumina-supported copper-nickel catalysts towards furfural and 5-hydroxymethylfurfural hydrogenation, J. Mol. Catal. A Chem. 426 (2017) 244–256. [CrossRef]
- M. Yoo, E. Kang, H. Choi, H. Ha, H. Choi, J.-S. Choi, K.-S. Lee, R. Celestre, D.A. Shapiro, J.Y. Park, C. Kim, Y.-S. Yu, H.Y. Kim, Enhancing the inherent catalytic activity and stability of TiO2 supported Pt single-atoms at CeOx–TiO2 interfaces, J. Mater. Chem. A 10 (2022) 5942–5952. [CrossRef]
- R. Siburian, R. Goei, H. Manurung, S.P. Aritonang, C. Simanjuntak, F. Hutagalung, I. Anshori, Y. Alias, S. Paiman, J. Affi, A.I.Y. Tok, Distribution model of Iron (Fe) on Fe/Graphene Nano Sheets, Ceram. Int. 49 (2023) 28571–28579. [CrossRef]
- M. Khodaee, N. Dalir, F. Feghhi, N. Ansari, M. Mohammadimasoudi, A. Goudarzi, A.F. Nasiri, M. Kolahdouz, S. Mohseni, Enhancement in electrical conductivity of liquid crystals by graphene metal oxide composites, Sci. Rep. 13 (2023) 1–11. [CrossRef]
- A. Ahmad, S. Shaheen, S. Majeed, M. Pervaiz, Z. Saeed, U. Younas, M.S. Javed, R. Luque, L. Gnanasekaran, RETRACTED: Recent developments in metal/metalloid nanomaterials for battery applications; a comparative review, Fuel 340 (2023) 127399. [CrossRef]
- K. Park, J. Kwon, S. Jo, S. Choi, E. Enkhtuvshin, C. Kim, D. Lee, J. Kim, S. Sun, H. Han, T. Song, Simultaneous electrical and defect engineering of nickel iron metal-organic-framework via co-doping of metalloid and non-metal elements for a highly efficient oxygen evolution reaction, Chem. Eng. J. 439 (2022) 135720. [CrossRef]
- K.O. Kim, S.-H. Park, H.-B. Chun, W.Y. Lee, B.-Y. Jang, D. Kim, J.H. Yu, K.S. Yun, J. Kim, O.L. Li, Y.-J. Han, Design and Optimization of Composite Cathodes for Solid-State Batteries Using Hybrid Carbon Networks with Facile Electronic and Ionic Percolation Pathways, ACS Appl. Mater. Interfaces 15 (2023) 36748–36758. [CrossRef]
- R. Siburian, F. Hutagalung, O. Silitonga, S. Paiman, L. Simatupang, C. Simanjuntak, S.P. Aritonang, Y. Alias, L. Jing, R. Goei, A.I.Y. Tok, The New Materials for Battery Electrode Prototypes, Materials (Basel). 16 (2023). [CrossRef]
- S. Sulaiman, I. Sudin, U.M.B. Al-Naib, M.F. Omar, Review of the Nanostructuring and Doping Strategies for High-Performance ZnO Thermoelectric Materials, Crystals 12 (2022). [CrossRef]
- S. Sivakumar, Y. Robinson, N.A. Mala, Pseudocapacitance behavior of copper and nickel co-doped zinc oxide nanoparticles with enhanced photocatalytic performance, J. Mater. Sci. Mater. Electron. 34 (2023) 978. [CrossRef]
- M. Sajjad, I. Ullah, M.I. Khan, J. Khan, M.Y. Khan, M.T. Qureshi, Structural and optical properties of pure and copper doped zinc oxide nanoparticles, Results Phys. 9 (2018) 1301–1309. [CrossRef]
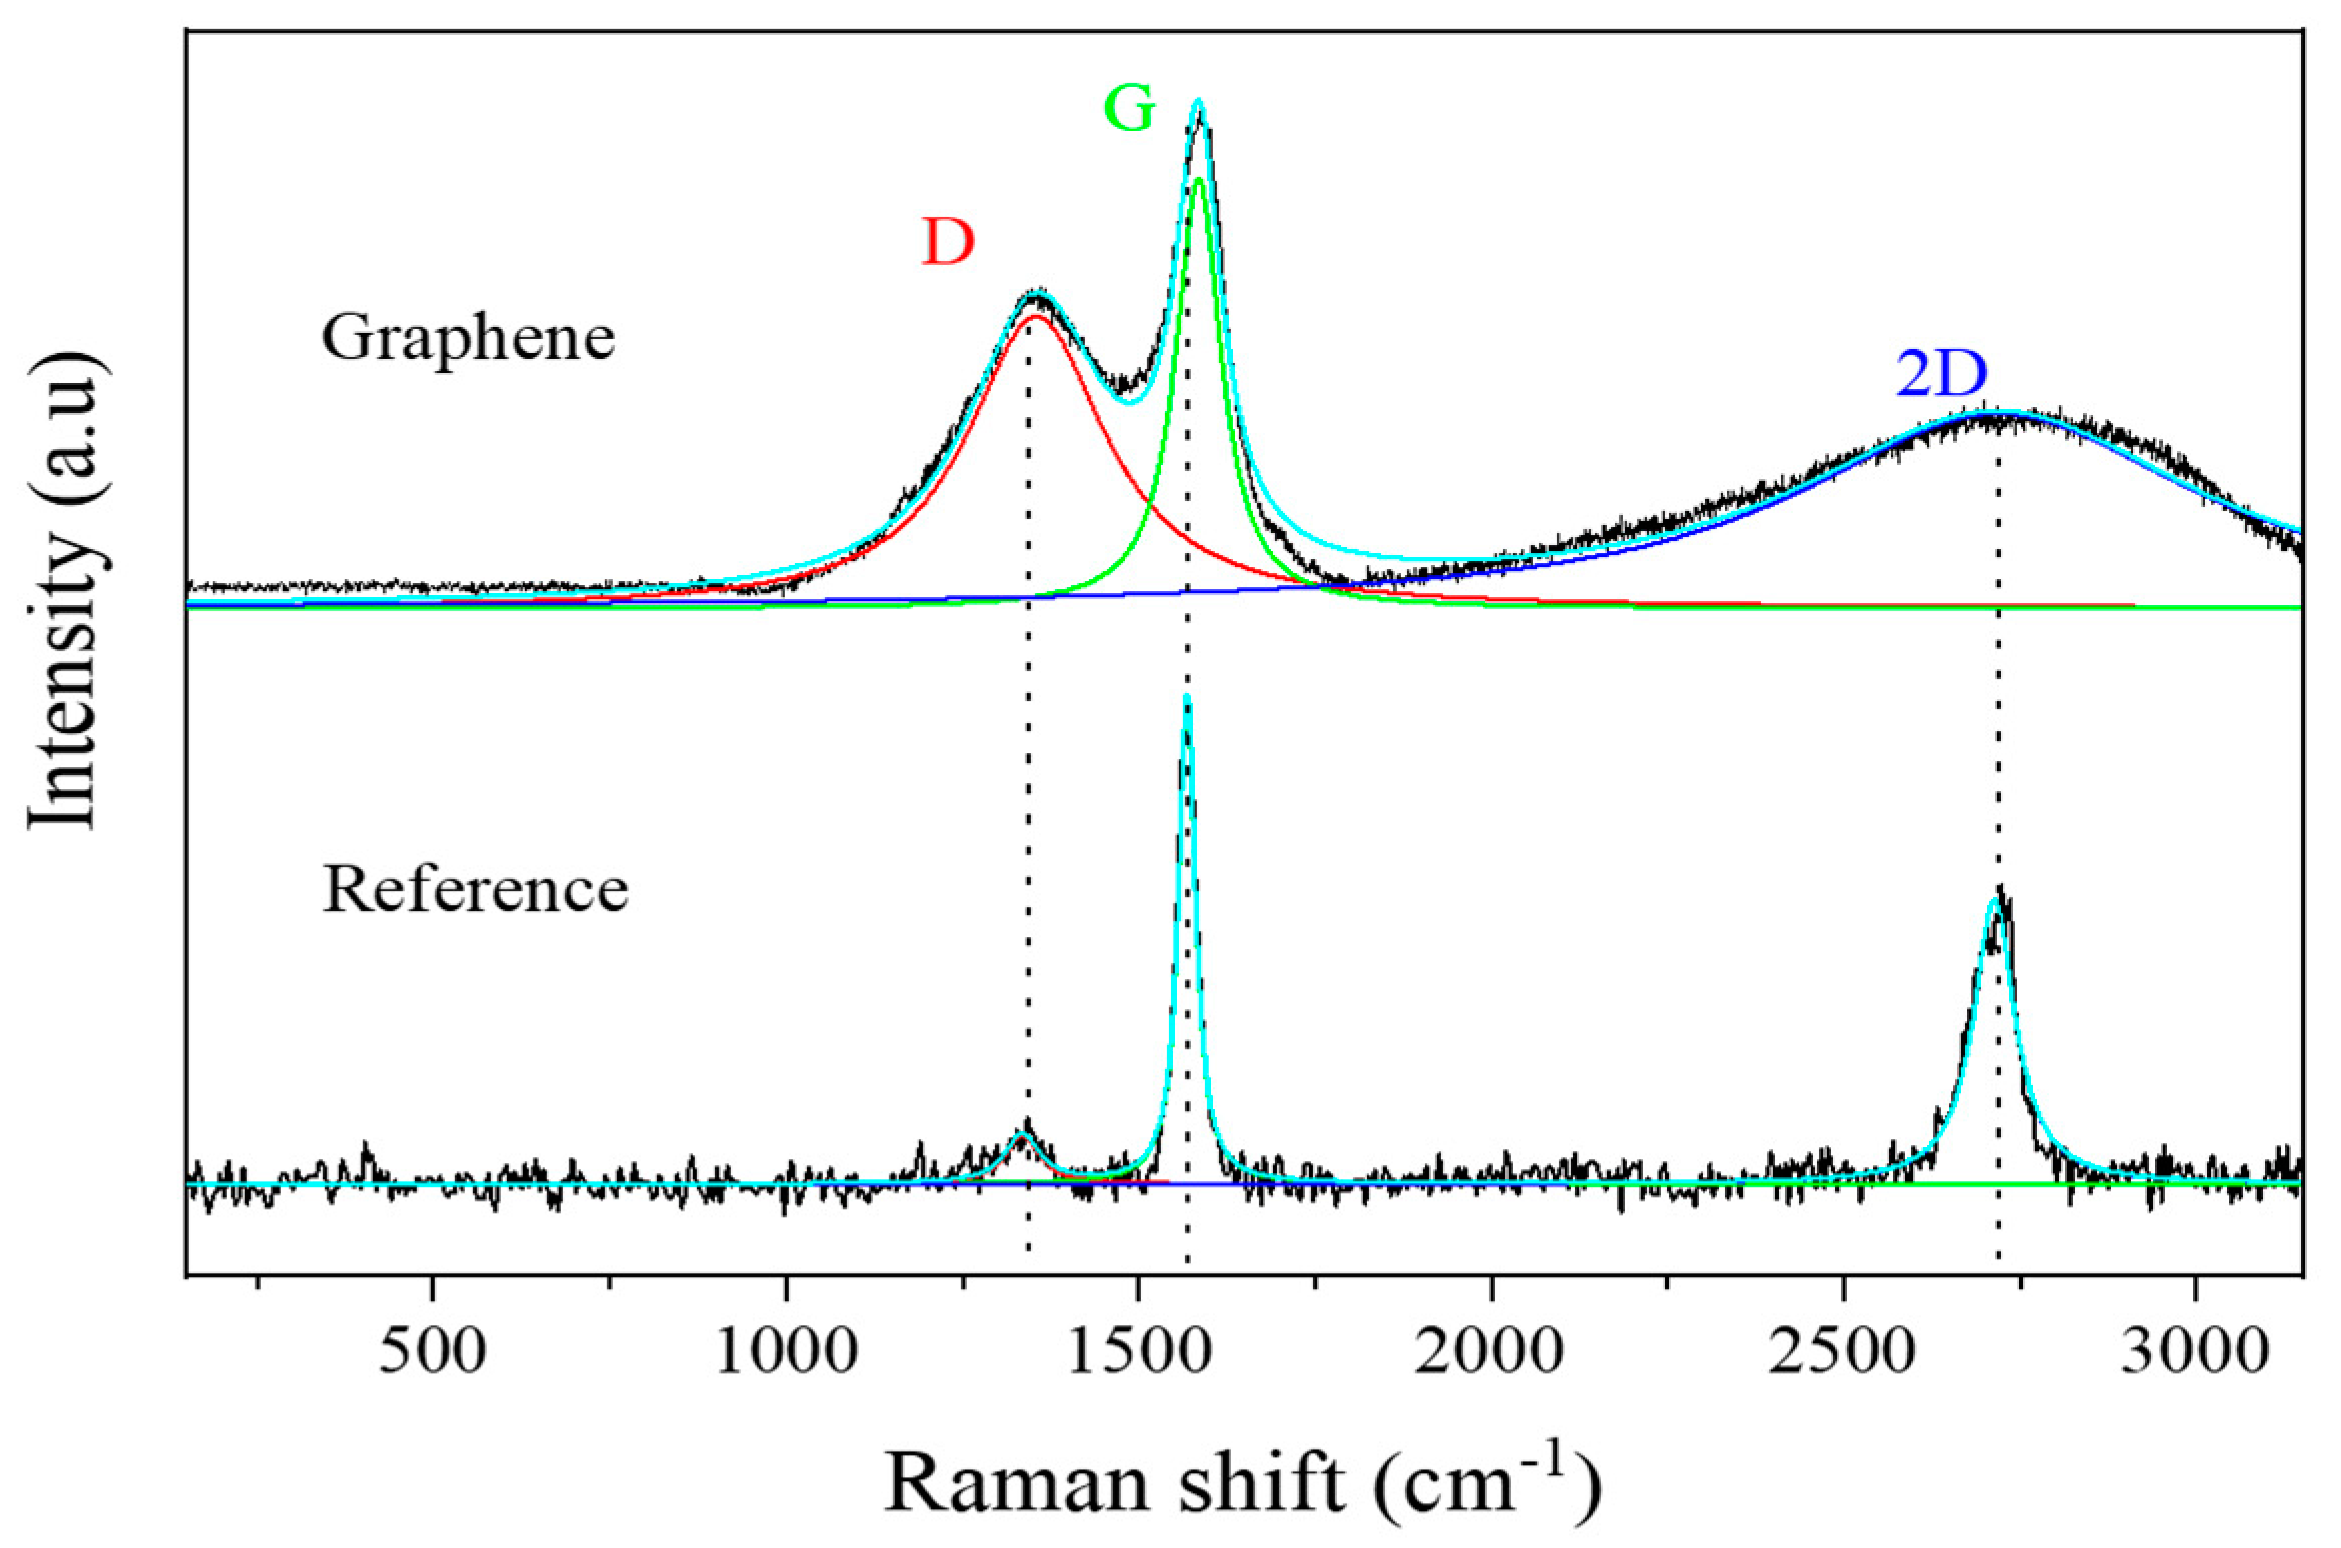


| D FWHM | G FWHM | 2D FWHM | |
| Graphene | 239,9219 ± 2,6650 | 78,4642 ± 0,8587 | 690,2105 ± 6,2355 |
| Reference | 28.1999 ± 10,2399 | 28,9196 ± 0,8610 | 64,4692 ± 2,1774 |
| Element | Ni/Graphene | Zn/Graphene | Graphene |
| C | 89.54 (wt. %) | 71.29 (wt. %) | 90.72 (wt. %) |
| O | 10.25 (wt. %) | 25.75 (wt. %) | 9.28 (wt. %) |
| Ni | 0.21 (wt. %) | - | - |
| Zn | - | 2.95 (wt. %) | - |
| Sample | Measurement of Conductivity (µS/cm2) |
| Graphene | 227 |
| Ni/Graphene | 264 |
| Zn/Graphene | 340 |
| Commercial primary battery anode | 400 |
| Commercial primary battery cathode | 580 |
Disclaimer/Publisher’s Note: The statements, opinions and data contained in all publications are solely those of the individual author(s) and contributor(s) and not of MDPI and/or the editor(s). MDPI and/or the editor(s) disclaim responsibility for any injury to people or property resulting from any ideas, methods, instructions or products referred to in the content. |
© 2024 by the authors. Licensee MDPI, Basel, Switzerland. This article is an open access article distributed under the terms and conditions of the Creative Commons Attribution (CC BY) license (http://creativecommons.org/licenses/by/4.0/).


