Submitted:
02 August 2024
Posted:
06 August 2024
You are already at the latest version
Abstract
Keywords:
1. Introduction
2. Results
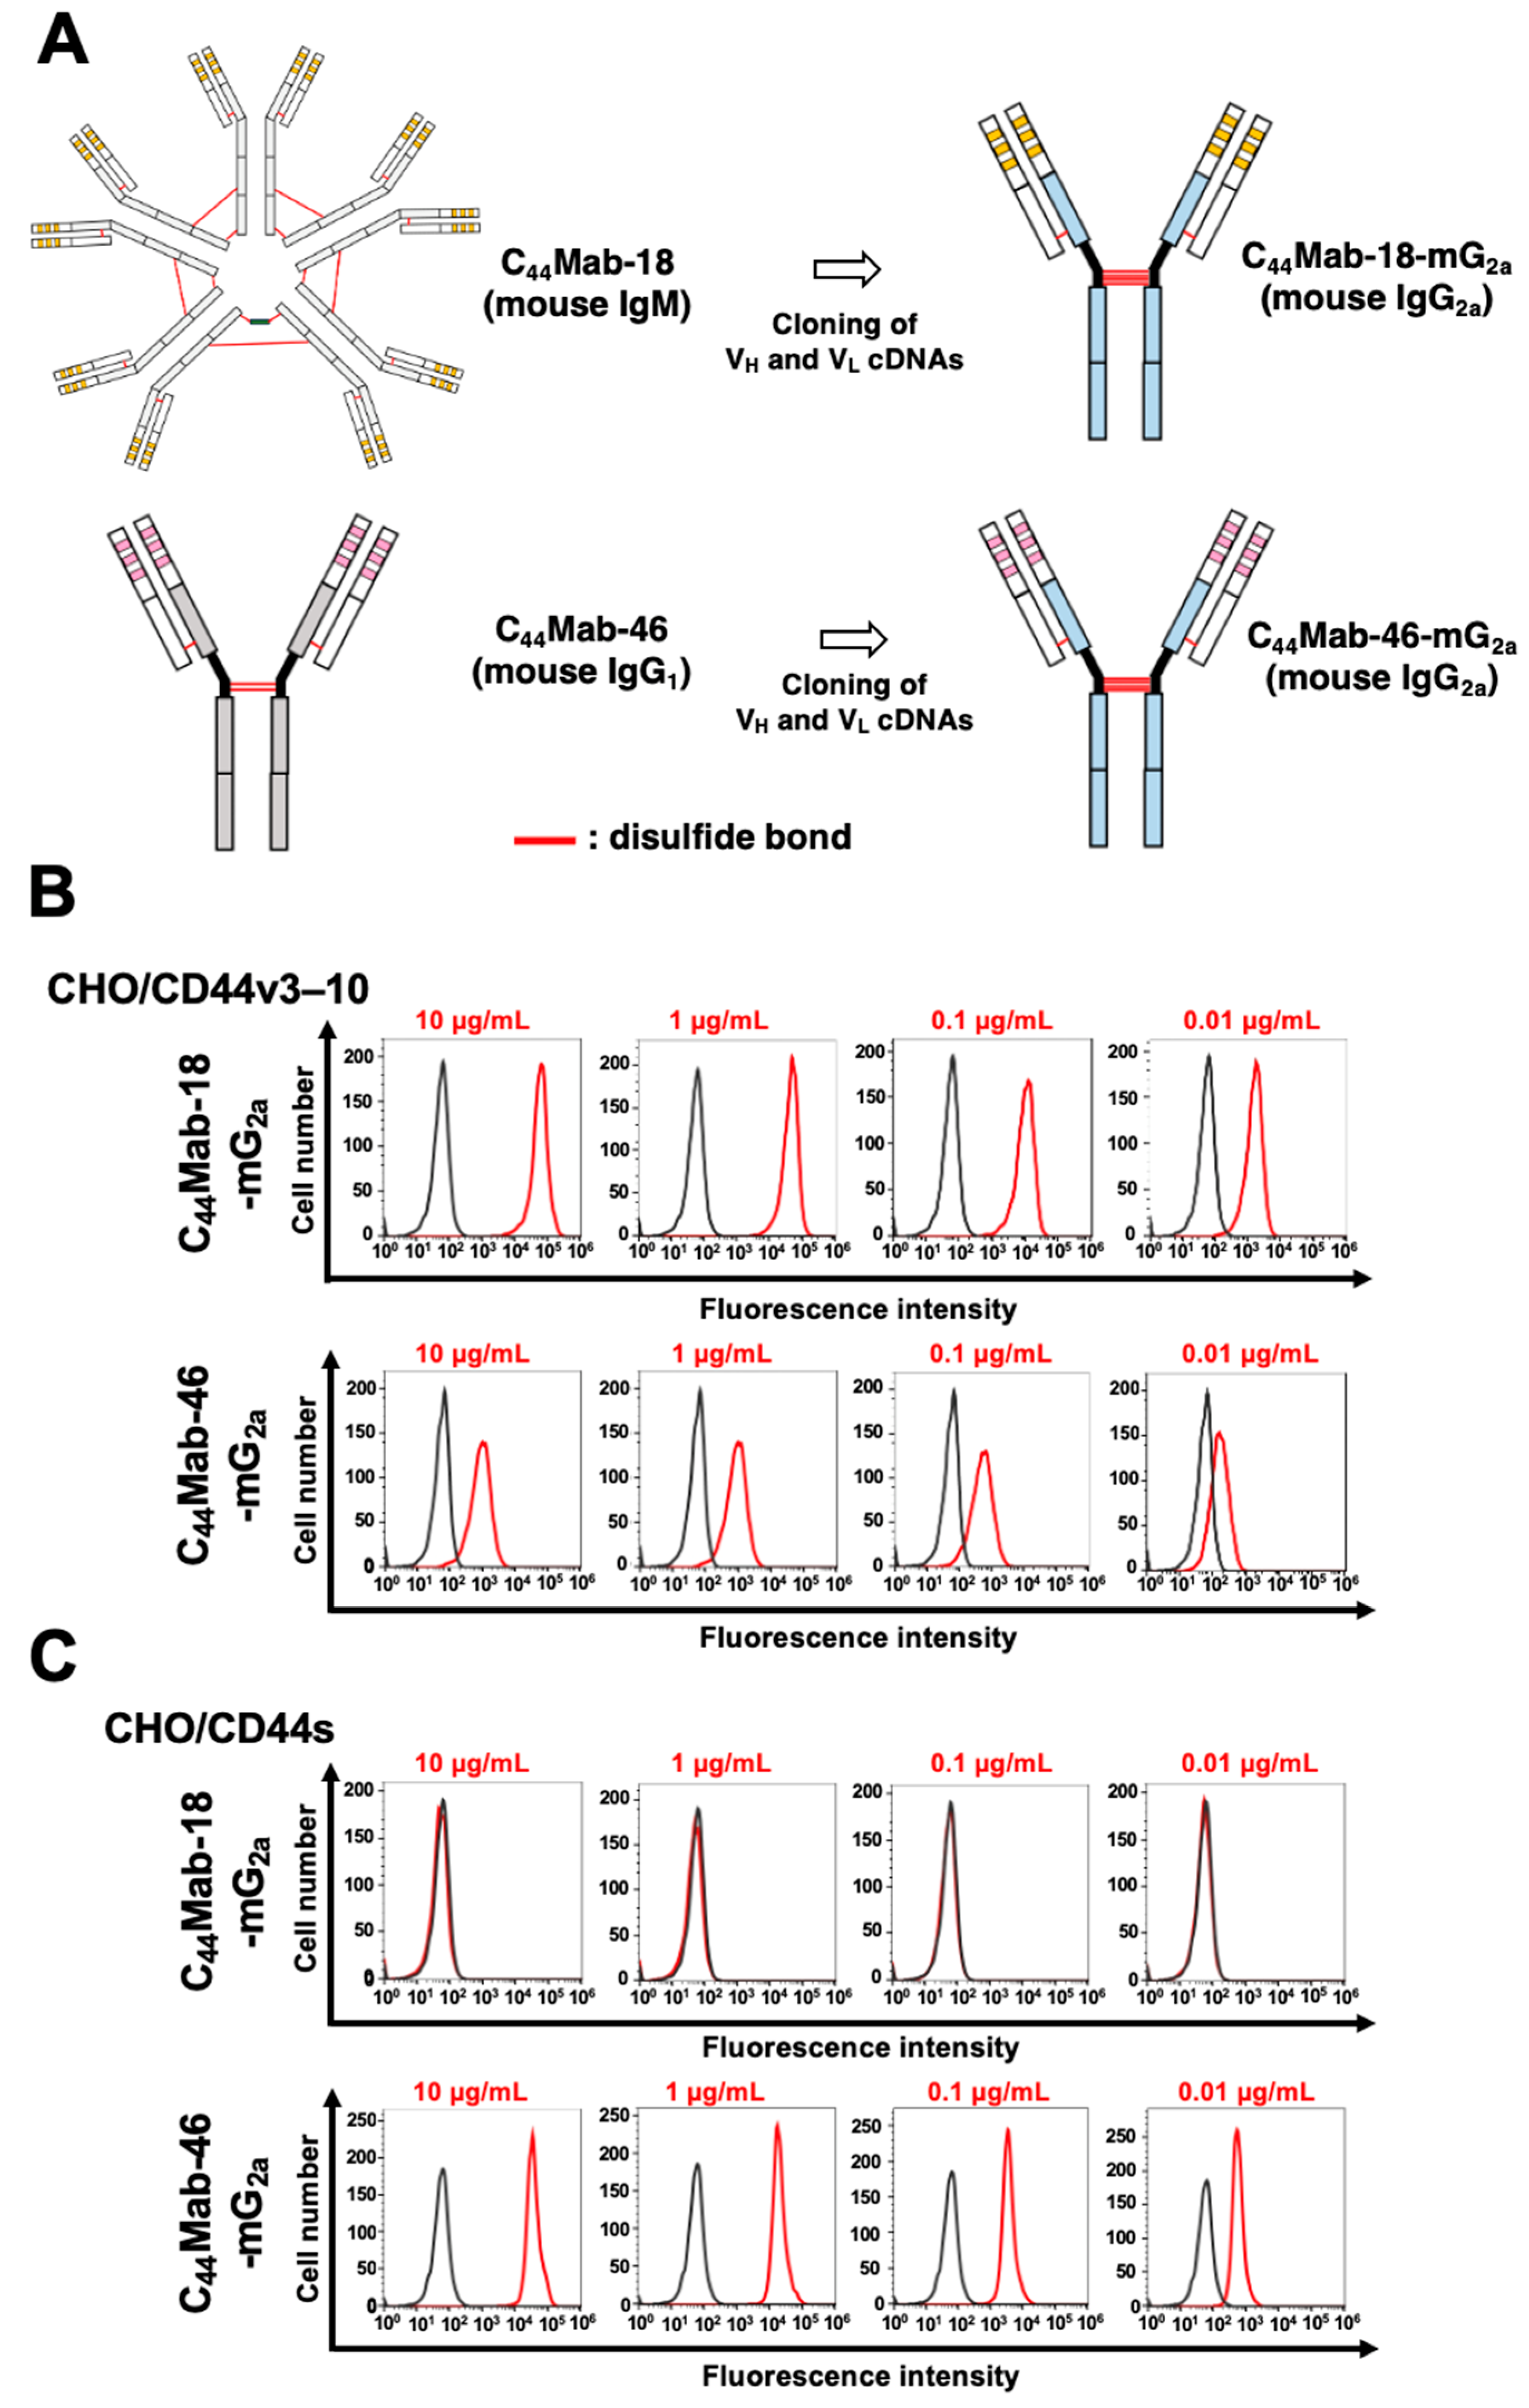
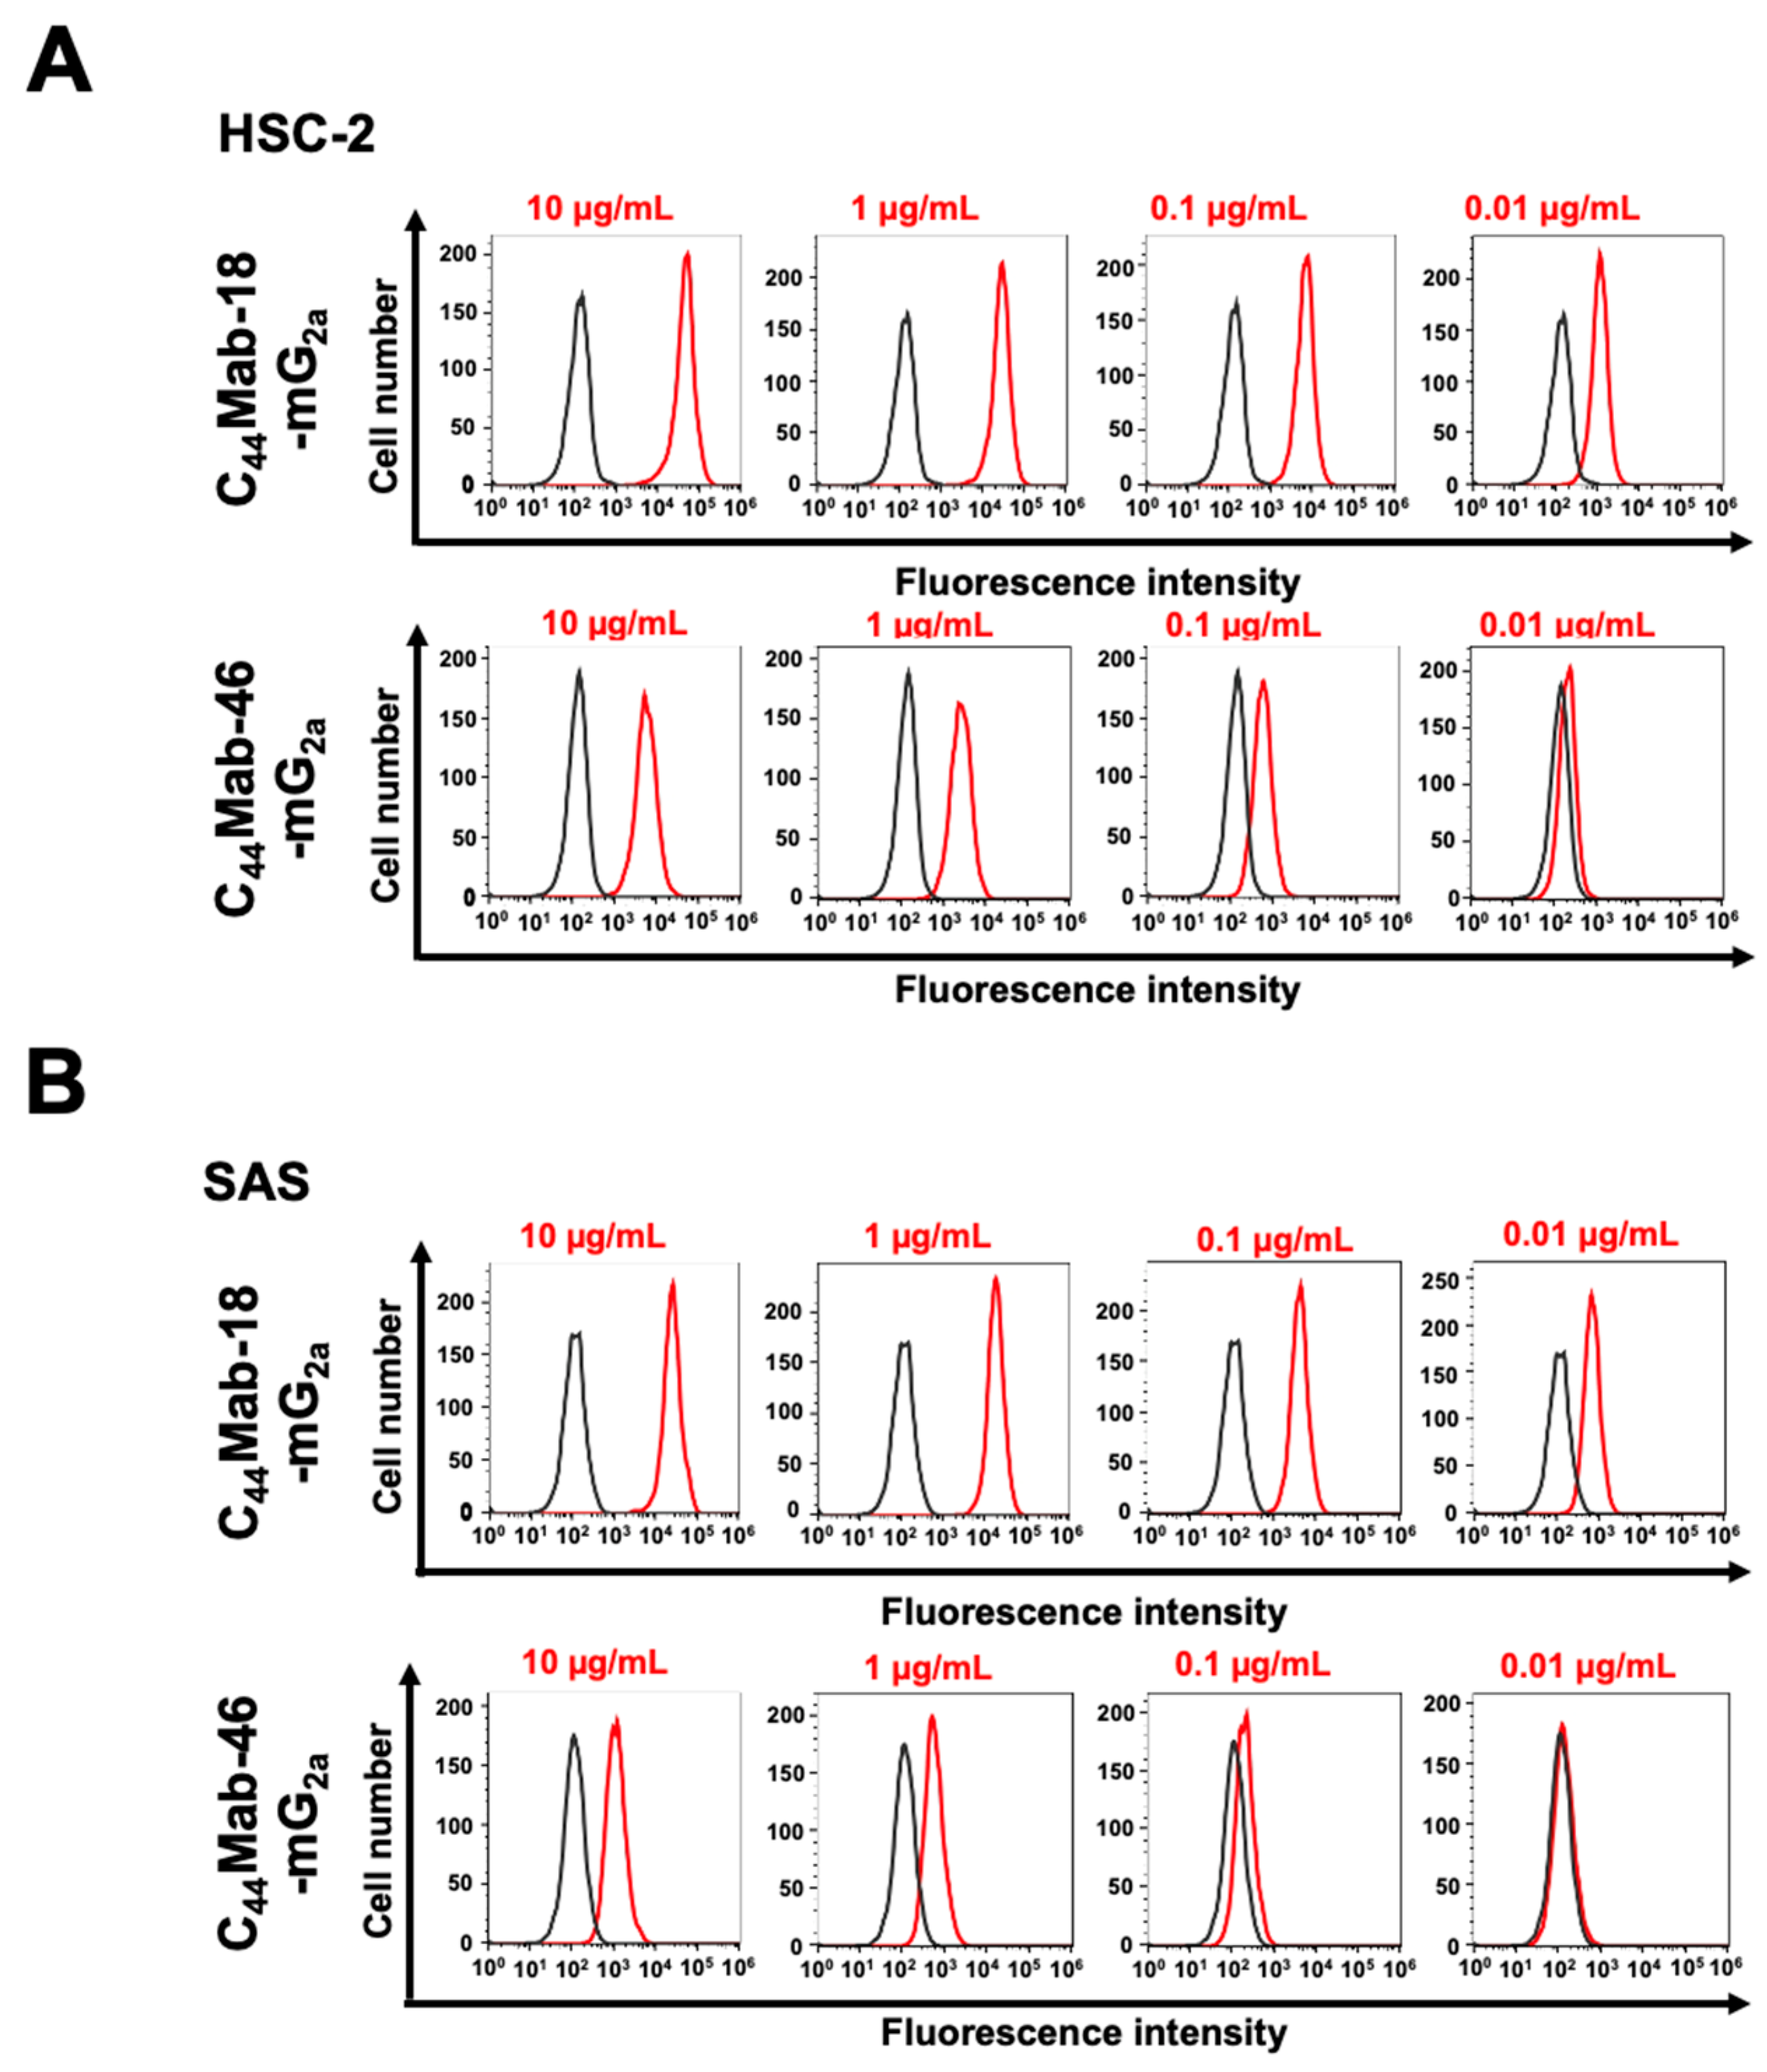
2.1. Flow Cytometric Analysis against CHO/CD44v3–10, HSC-2, and SAS Cells Using C44Mab-18-mG2a and C44Mab-46-mG2a
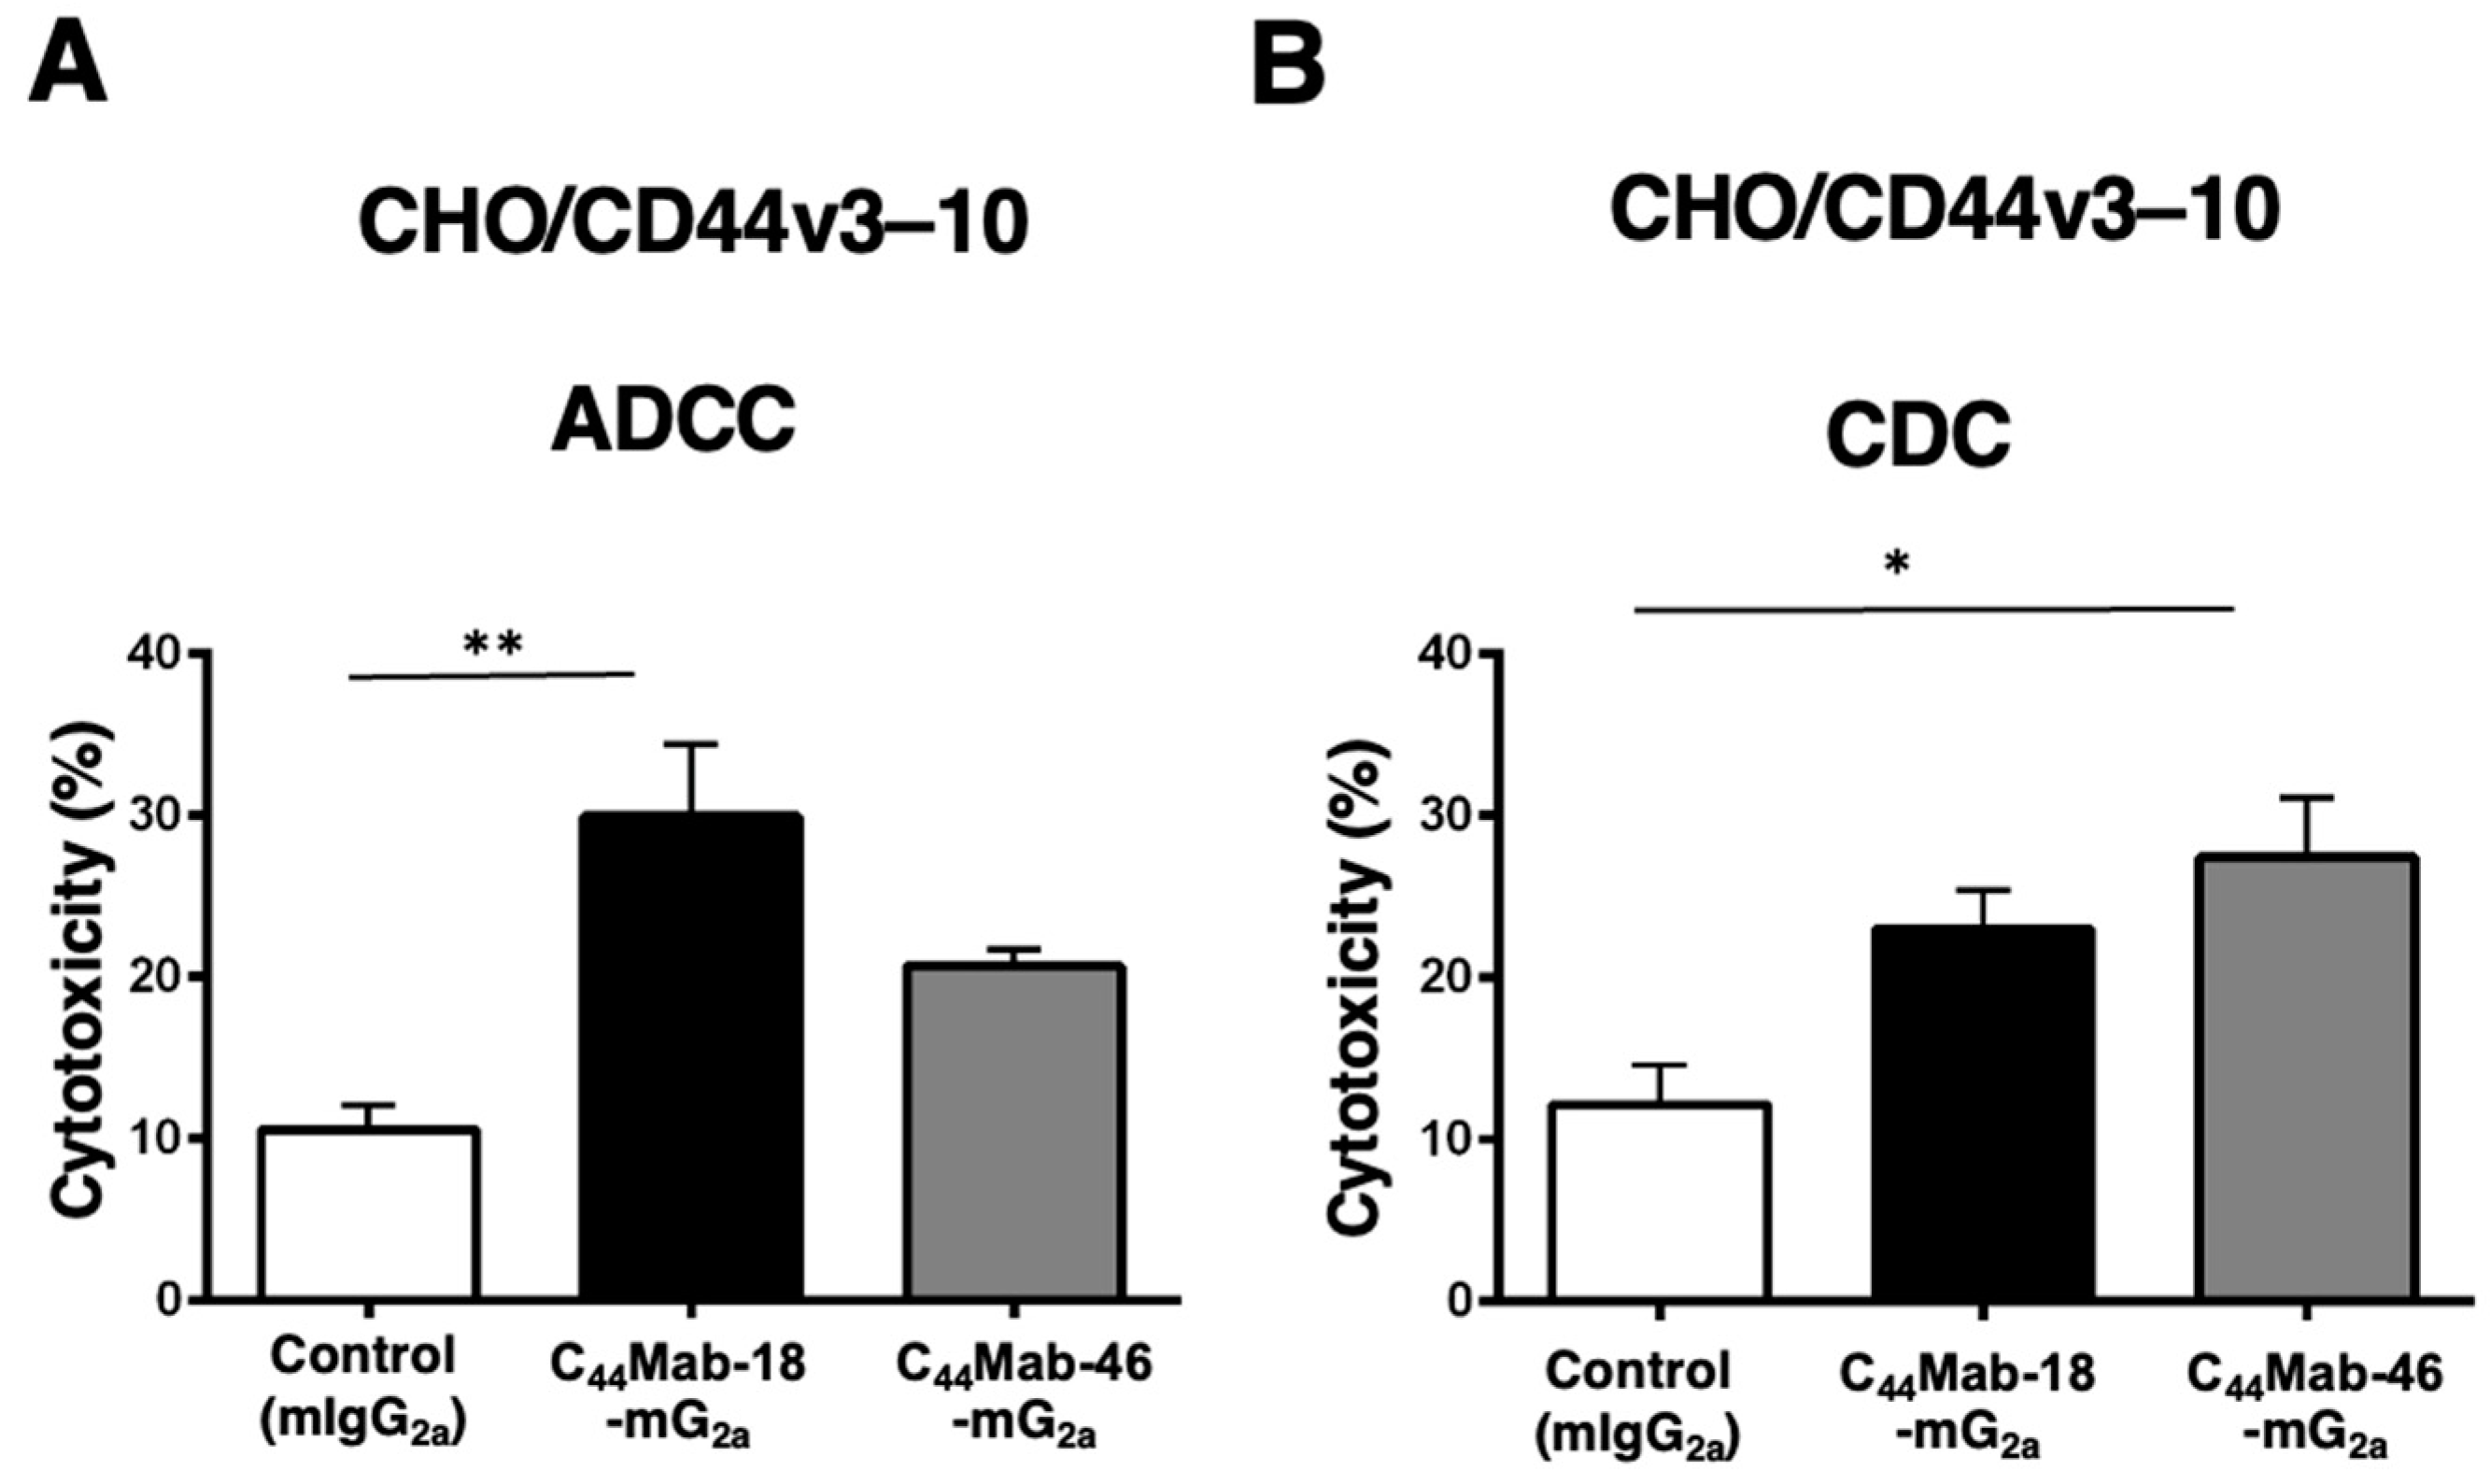
2.2. Induction of ADCC and CDC by C44Mab-18-mG2a and C44Mab-46-mG2a against CHO/CD44v3–10 Cells
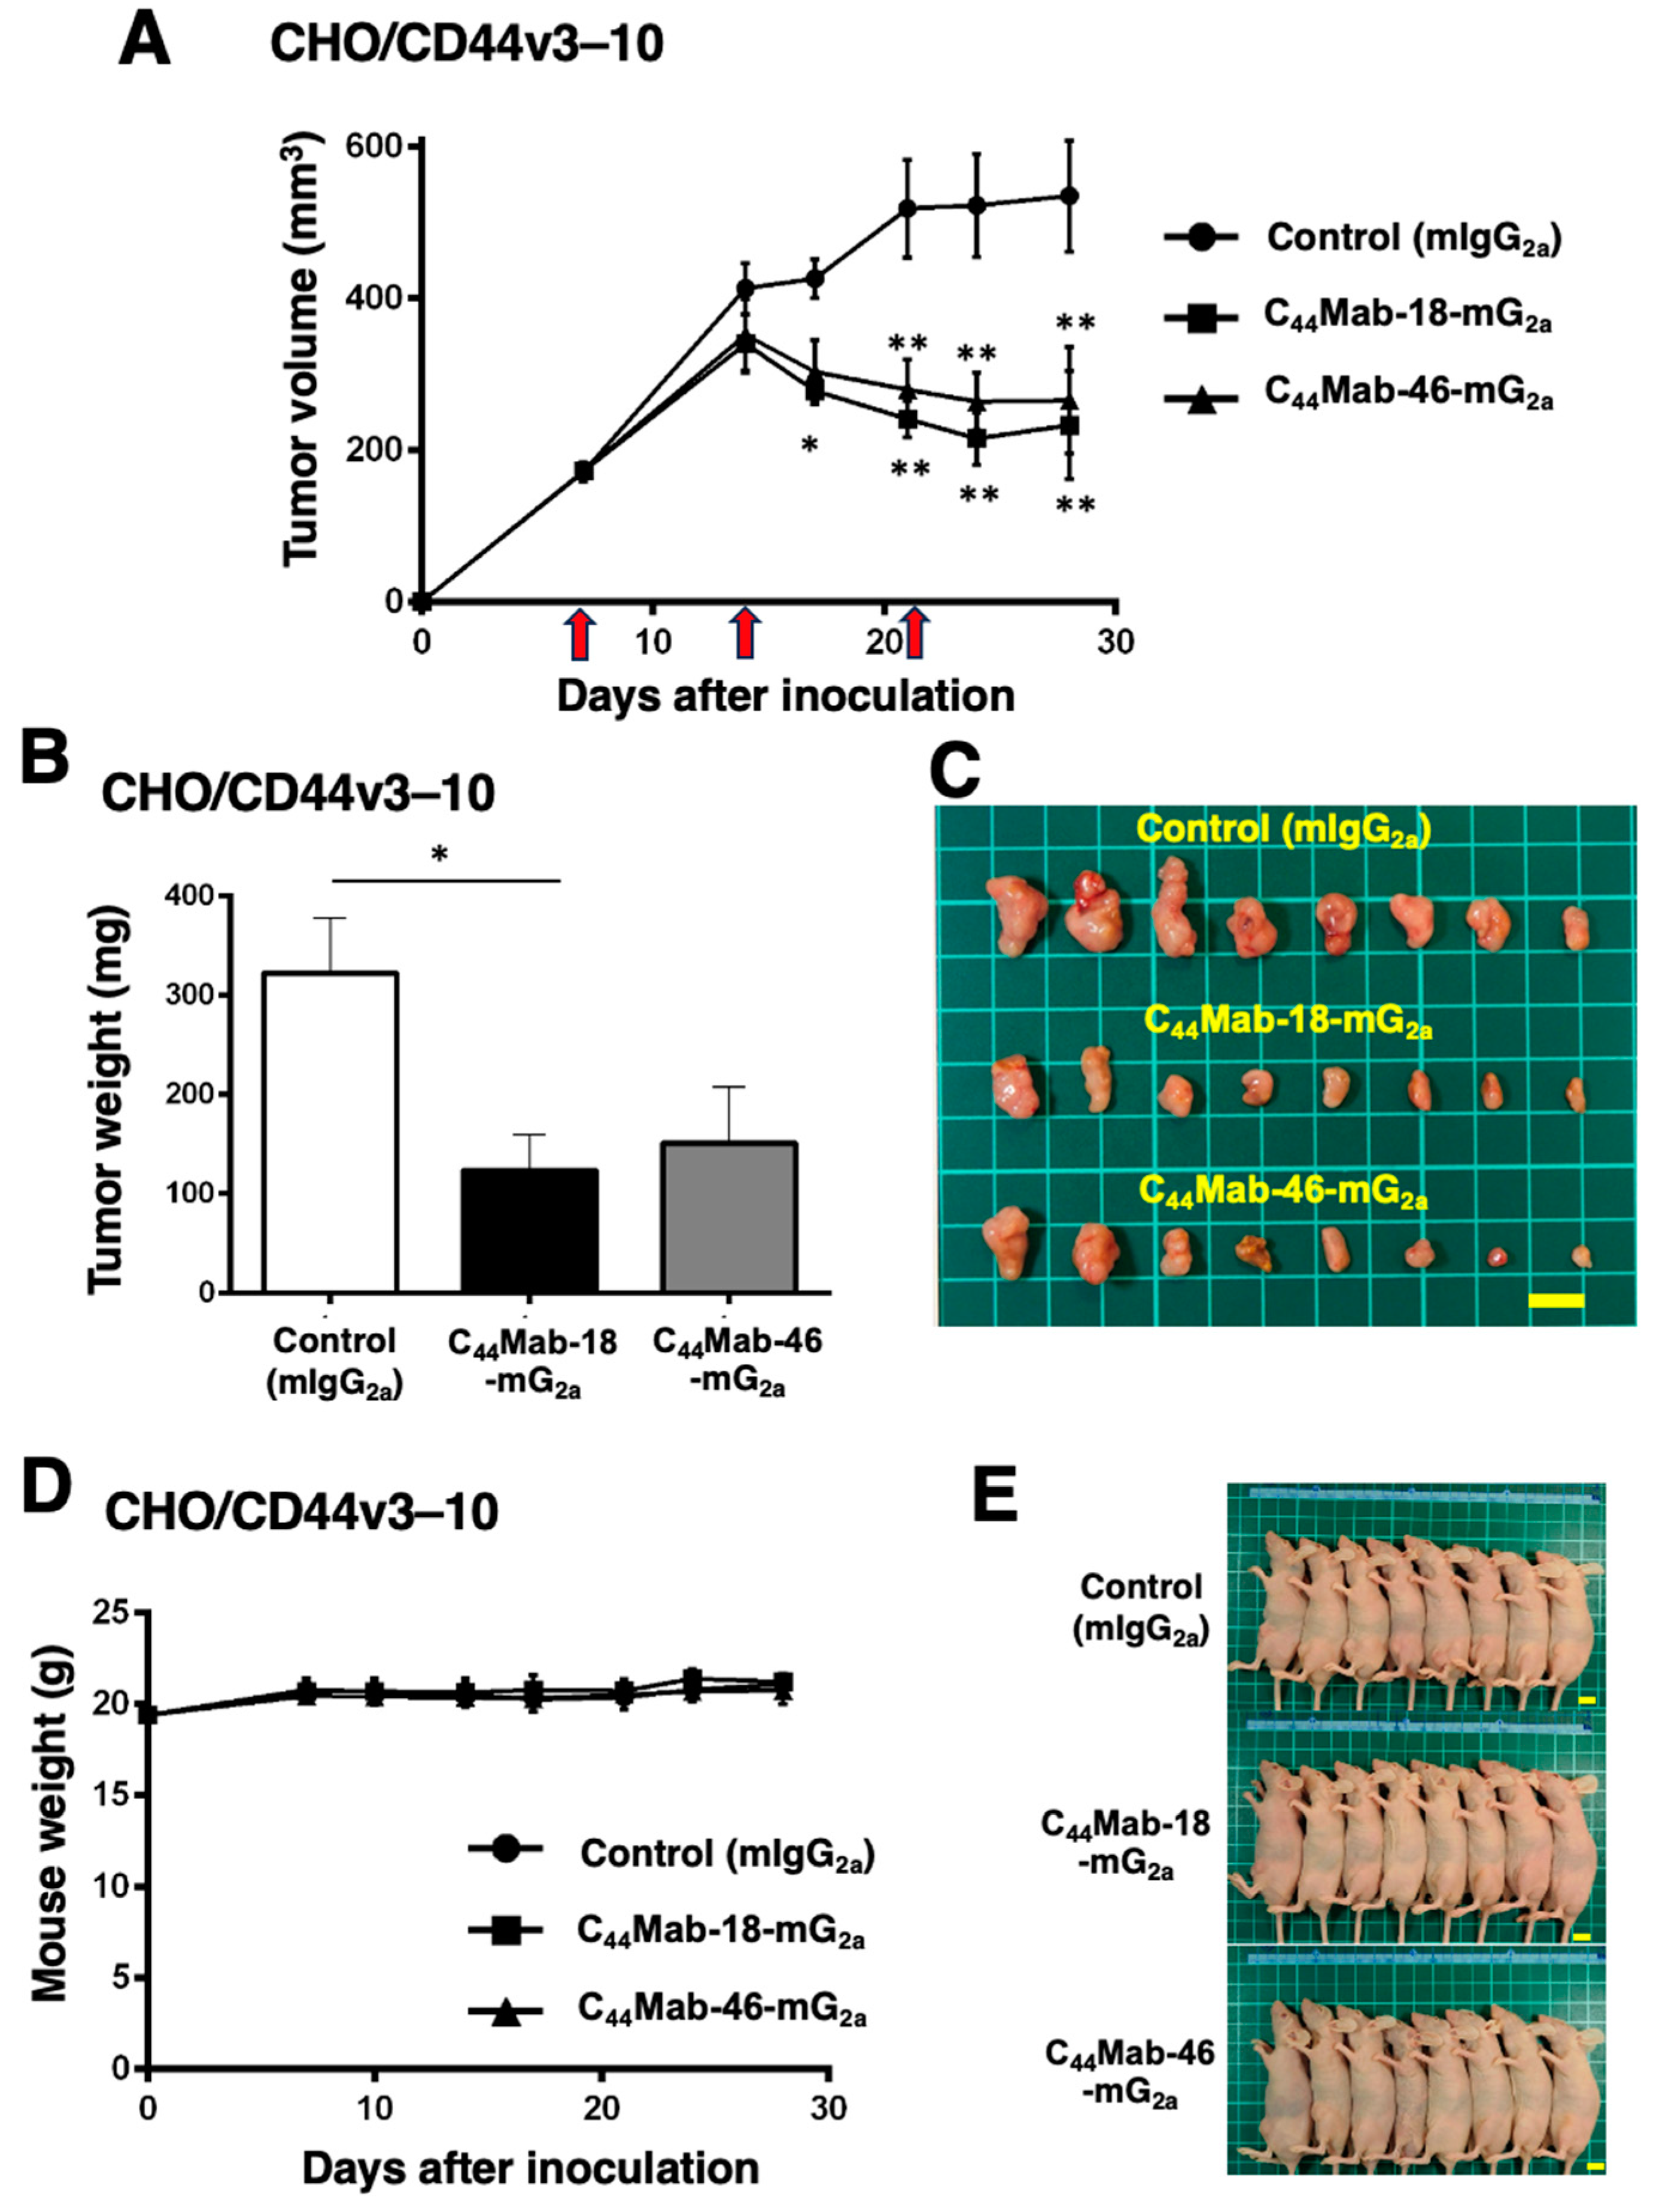
2.3. Antitumor Effects of C44Mab-18-mG2a and C44Mab-46-mG2 in the Mouse Xenografts of CHO/CD44v3–10
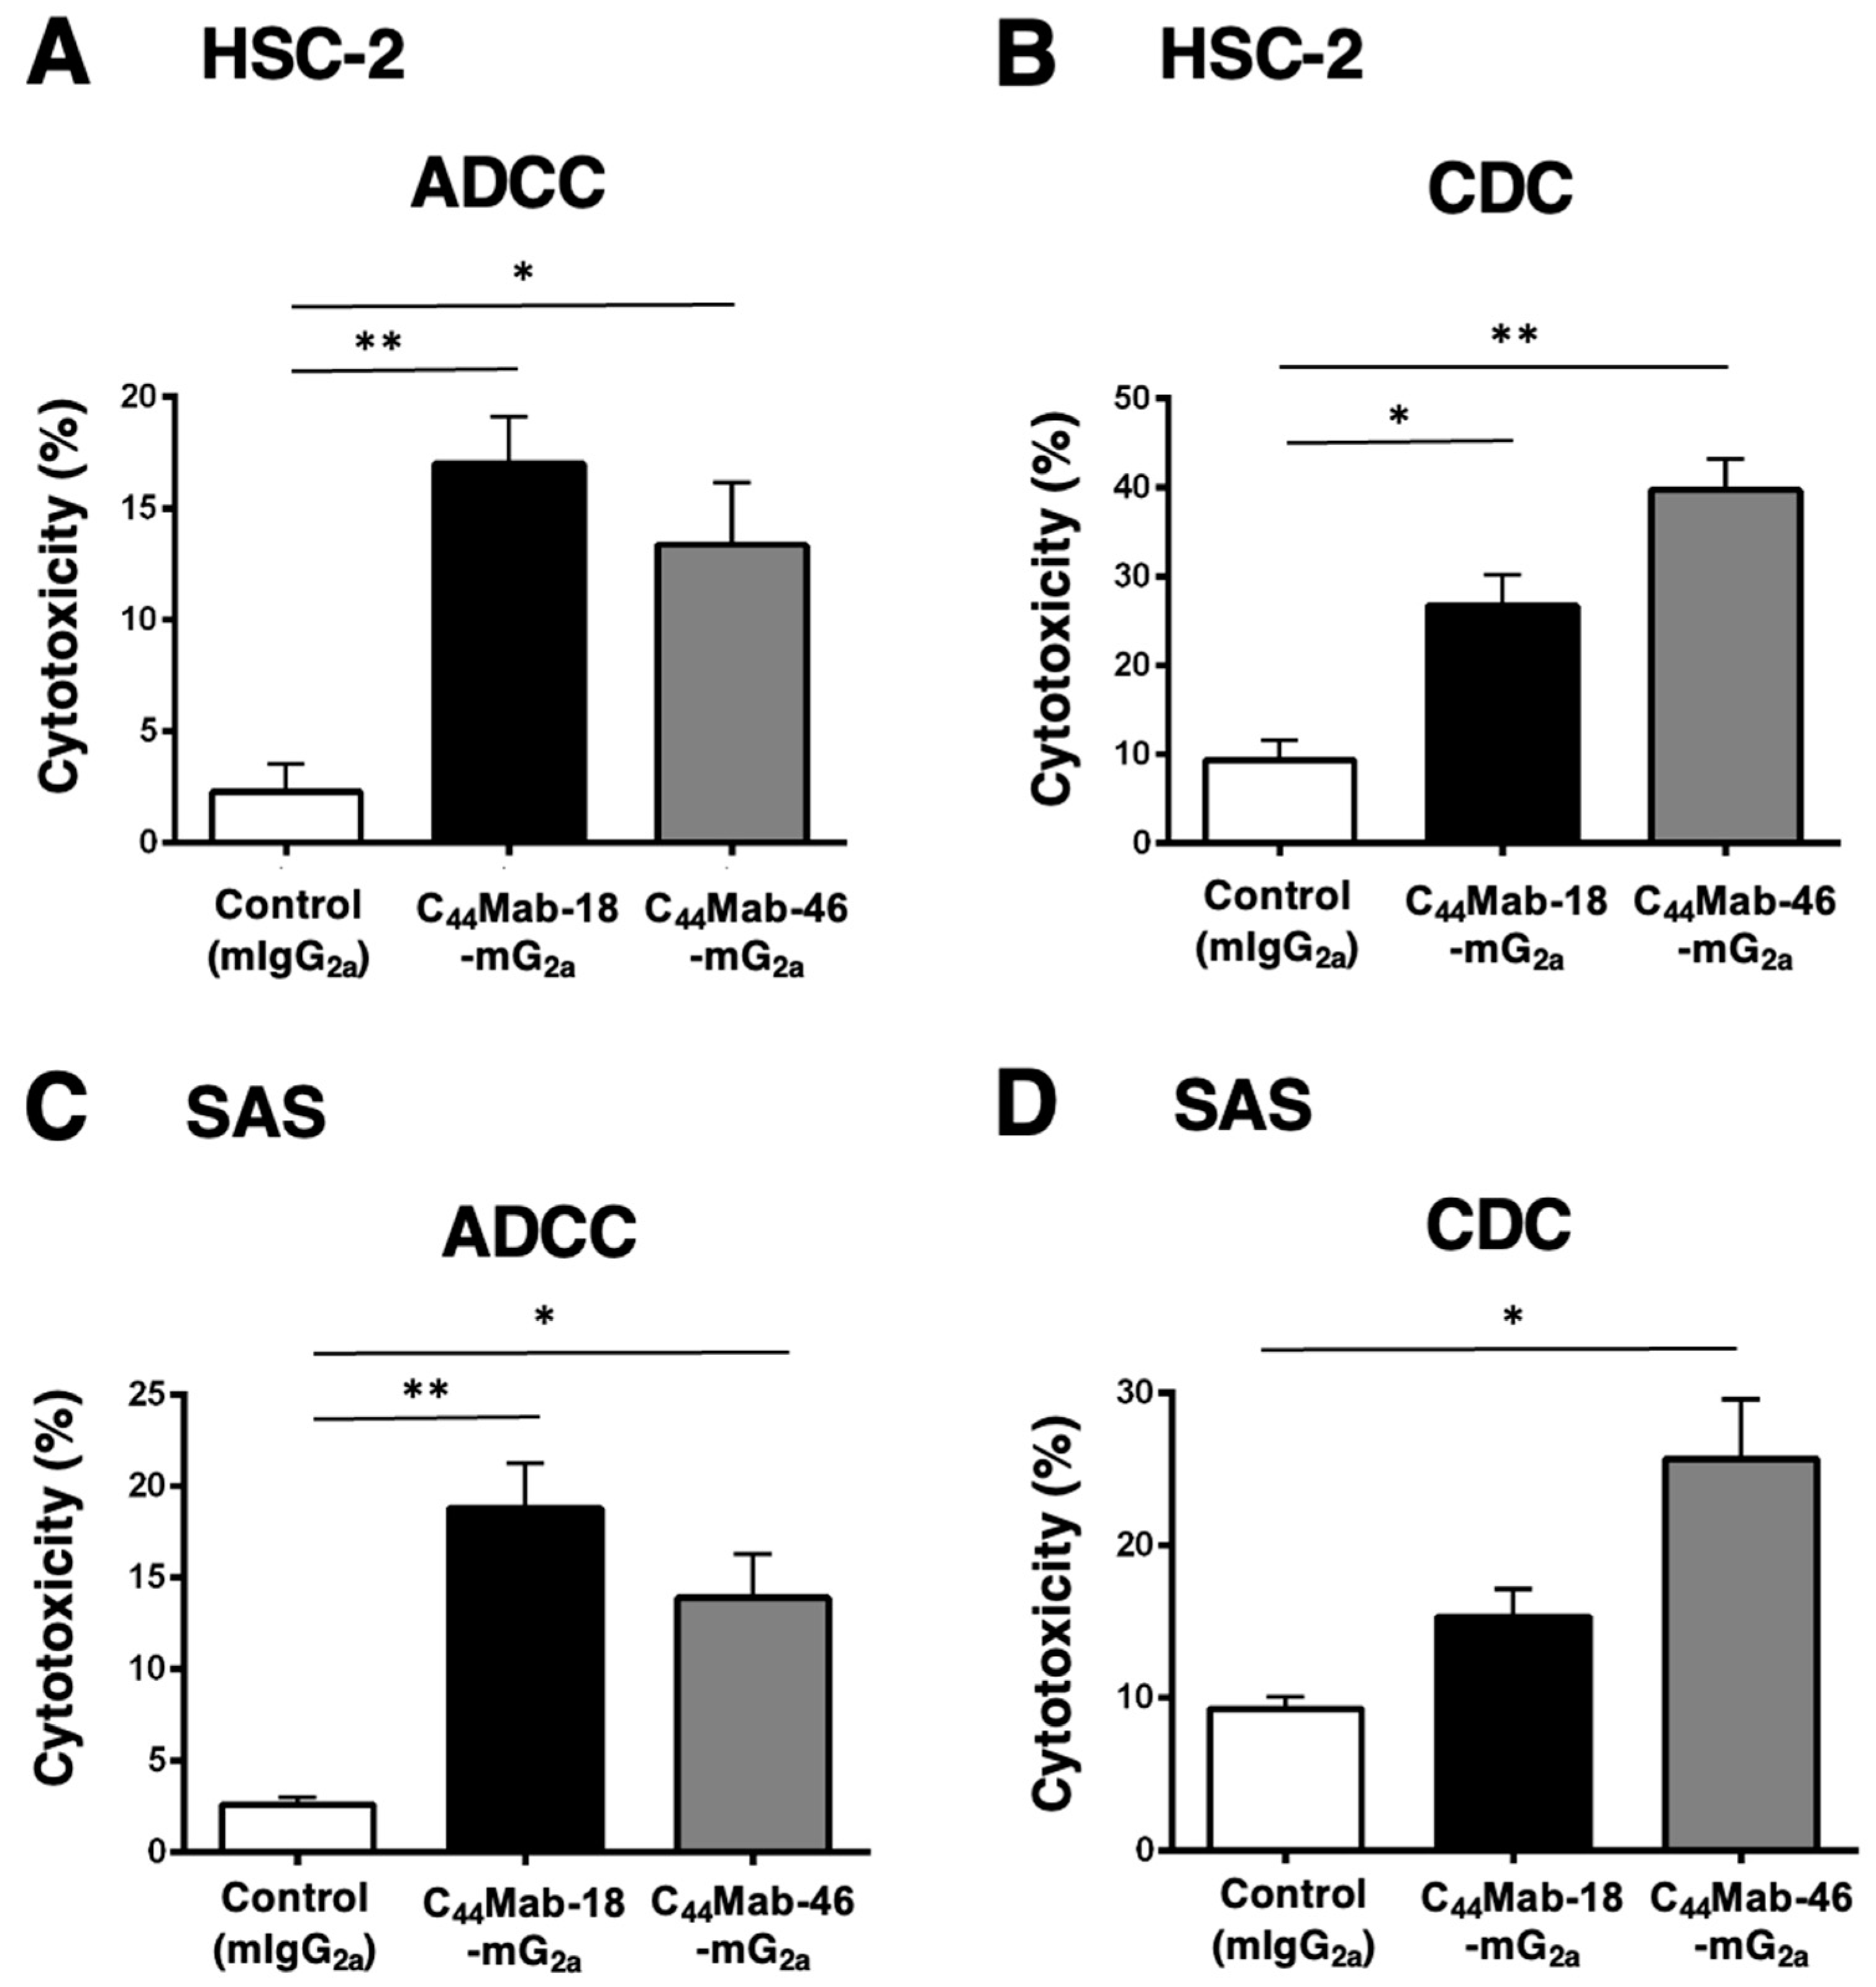
2.4. Induction of ADCC and CDC by C44Mab-18-mG2a and C44Mab-46-mG2a against HSC-2 and SAS Cells
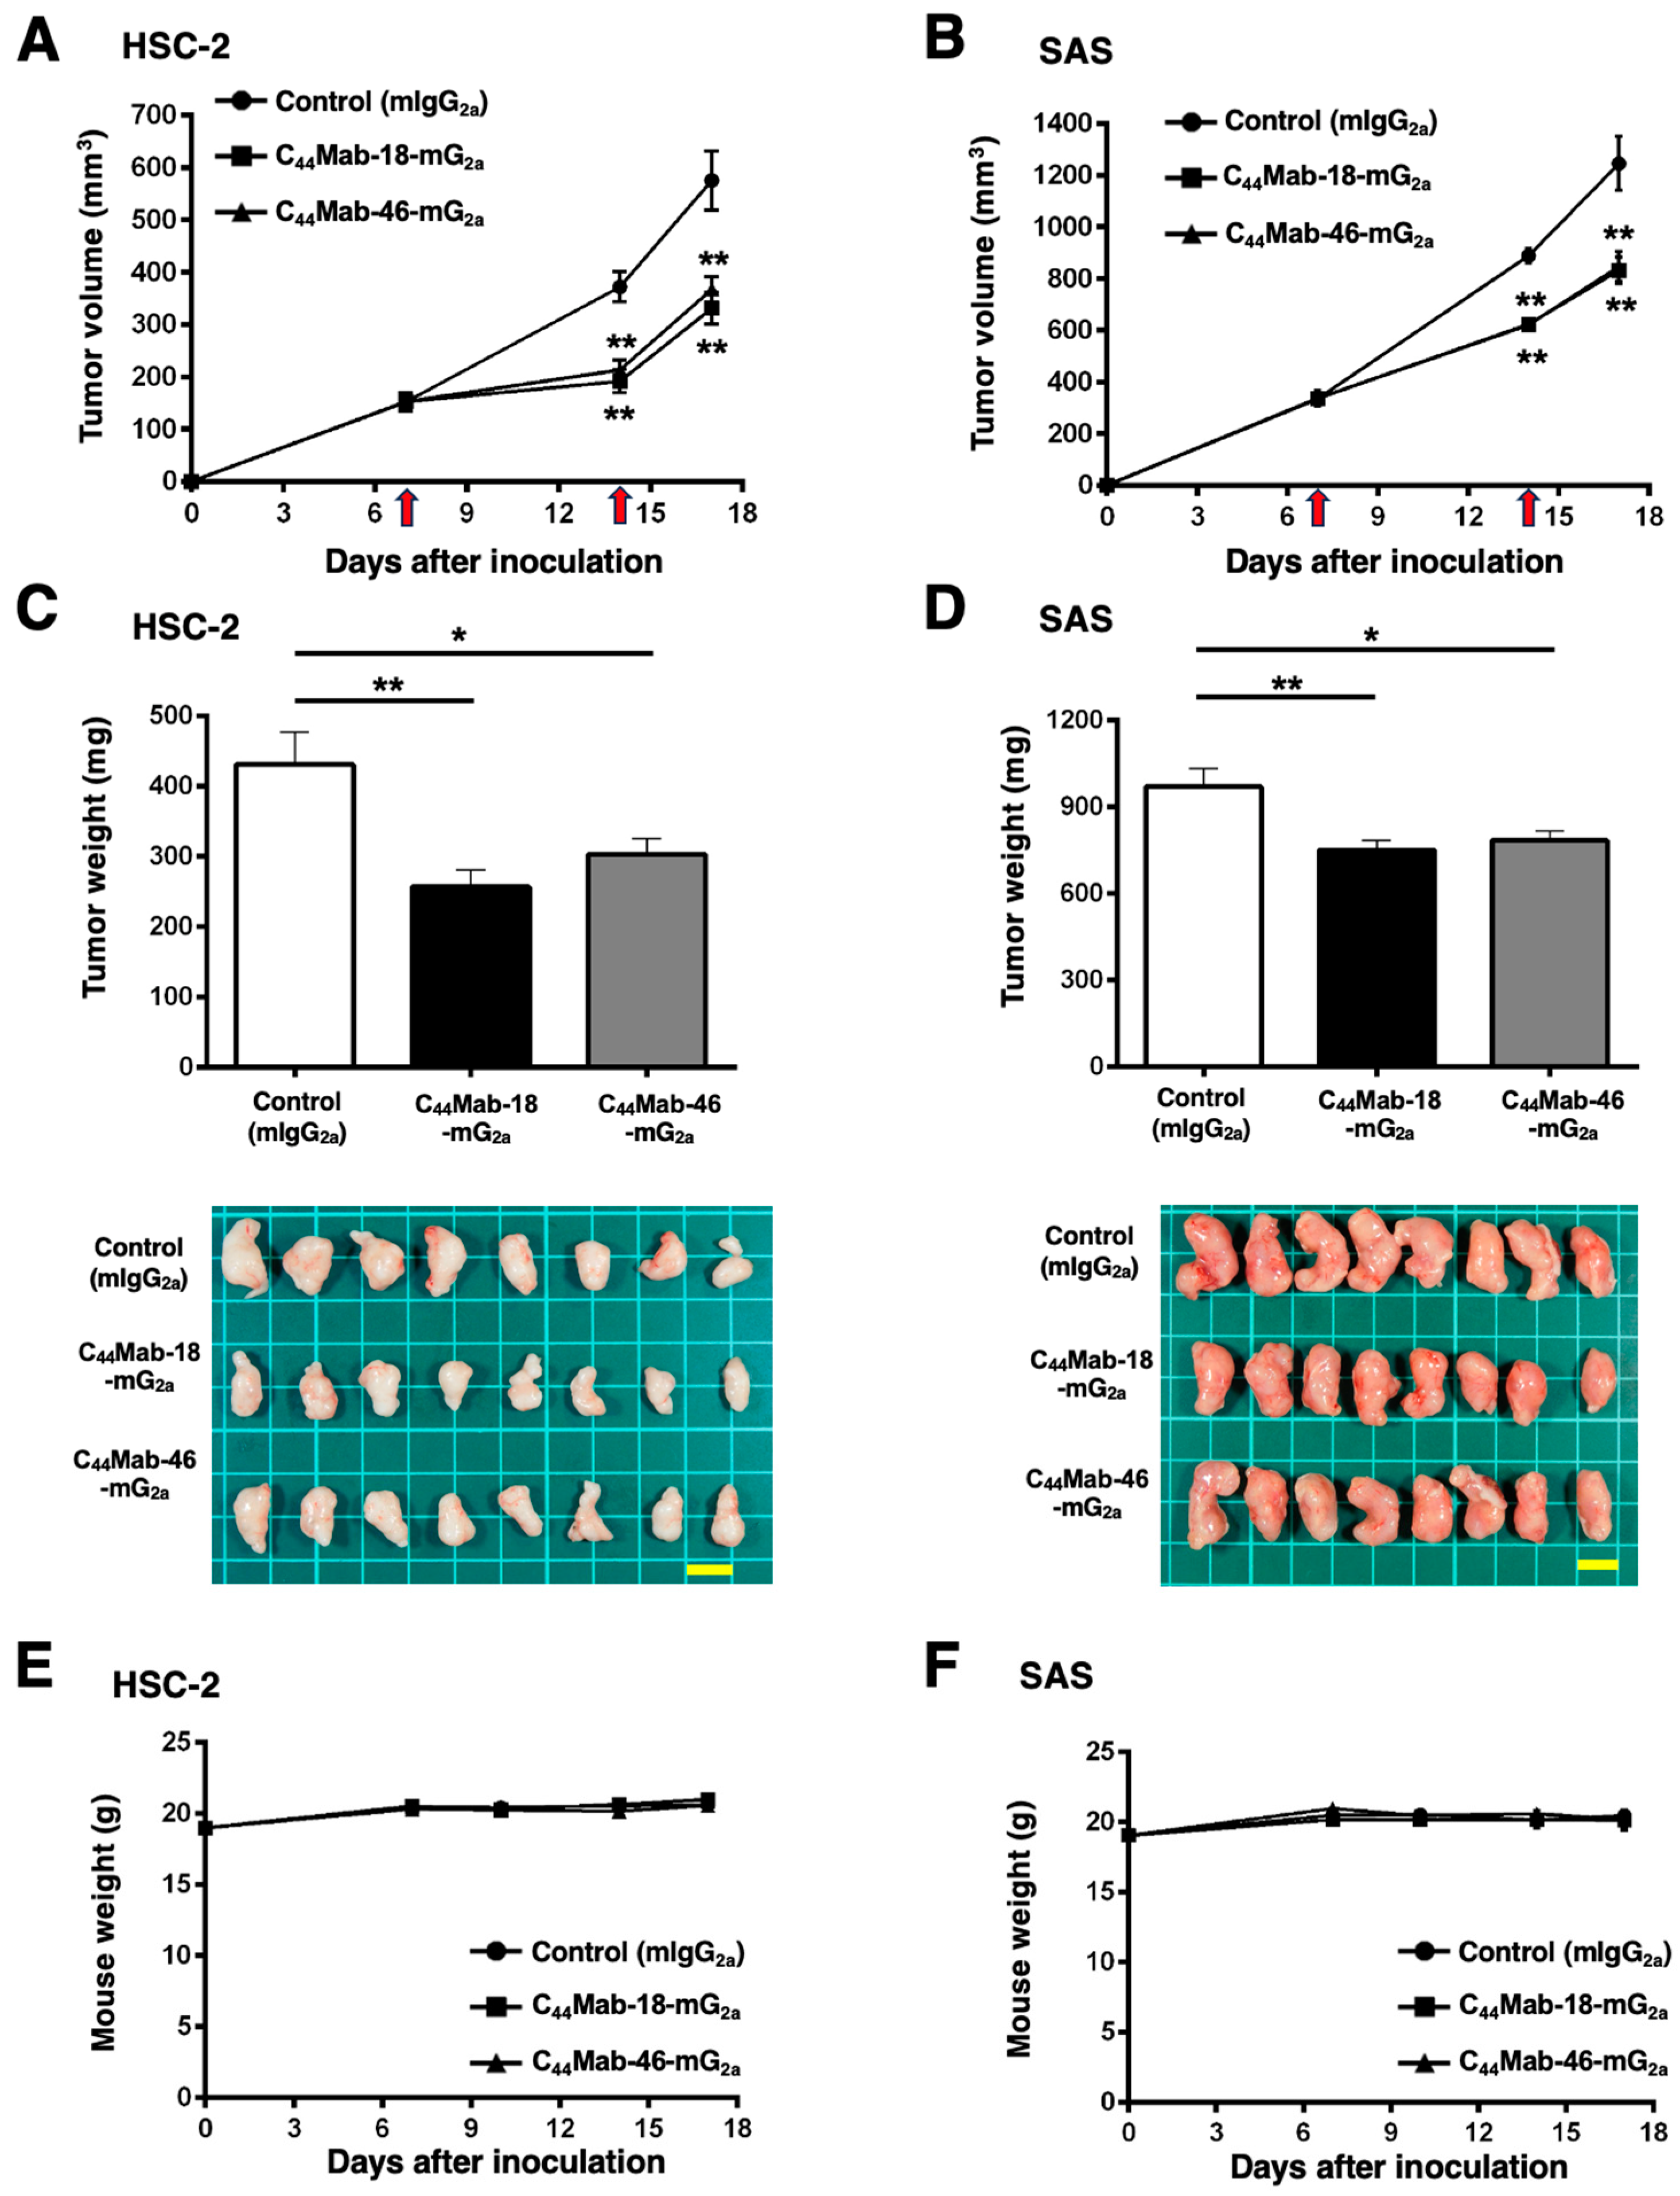
2.5. Antitumor Effects of C44Mab-18-mG2a and C44Mab-46-mG2 in the Mouse Xenografts of HSC-2 and SAS
3. Discussion
4. Materials and Methods
4.1. Cell Lines and Cell Culture
4.2. Antibodies
4.3. Flow Cytometry
4.4. ADCC
4.5. CDC
4.6. Antitumor Activity of C44Mab-18-mG2a and C44Mab-46-mG2a in Xenografts of CHO/CD44v3–10, HSC-2, and SAS
Supplementary Materials
Author Contributions
Funding
Institutional Review Board Statement
Informed Consent Statement
Data Availability Statement
Acknowledgments
Conflicts of Interest
References
- Ponta, H.; Sherman, L.; Herrlich, P.A. CD44: from adhesion molecules to signalling regulators. Nat Rev Mol Cell Biol 2003, 4, 33–45. [Google Scholar] [CrossRef] [PubMed]
- Zöller, M. CD44: can a cancer-initiating cell profit from an abundantly expressed molecule? Nat Rev Cancer 2011, 11, 254–267. [Google Scholar] [CrossRef] [PubMed]
- Prochazka, L.; Tesarik, R.; Turanek, J. Regulation of alternative splicing of CD44 in cancer. Cell Signal 2014, 26, 2234–2239. [Google Scholar] [CrossRef] [PubMed]
- Guo, Q.; Yang, C.; Gao, F. The state of CD44 activation in cancer progression and therapeutic targeting. Febs j 2021. [Google Scholar] [CrossRef] [PubMed]
- Zöller, M. CD44, Hyaluronan, the Hematopoietic Stem Cell, and Leukemia-Initiating Cells. Front Immunol 2015, 6, 235. [Google Scholar] [CrossRef] [PubMed]
- Jackson, D.G.; Bell, J.I.; Dickinson, R.; Timans, J.; Shields, J.; Whittle, N. Proteoglycan forms of the lymphocyte homing receptor CD44 are alternatively spliced variants containing the v3 exon. J Cell Biol 1995, 128, 673–685. [Google Scholar] [CrossRef] [PubMed]
- Bennett, K.L.; Jackson, D.G.; Simon, J.C.; Tanczos, E.; Peach, R.; Modrell, B.; Stamenkovic, I.; Plowman, G.; Aruffo, A. CD44 isoforms containing exon V3 are responsible for the presentation of heparin-binding growth factor. J Cell Biol 1995, 128, 687–698. [Google Scholar] [CrossRef] [PubMed]
- Matzke, A.; Sargsyan, V.; Holtmann, B.; Aramuni, G.; Asan, E.; Sendtner, M.; Pace, G.; Howells, N.; Zhang, W.; Ponta, H.; et al. Haploinsufficiency of c-Met in cd44-/- mice identifies a collaboration of CD44 and c-Met in vivo. Mol Cell Biol 2007, 27, 8797–8806. [Google Scholar] [CrossRef] [PubMed]
- Orian-Rousseau, V.; Chen, L.; Sleeman, J.P.; Herrlich, P.; Ponta, H. CD44 is required for two consecutive steps in HGF/c-Met signaling. Genes Dev 2002, 16, 3074–3086. [Google Scholar] [CrossRef]
- Ishimoto, T.; Nagano, O.; Yae, T.; Tamada, M.; Motohara, T.; Oshima, H.; Oshima, M.; Ikeda, T.; Asaba, R.; Yagi, H.; et al. CD44 variant regulates redox status in cancer cells by stabilizing the xCT subunit of system xc(-) and thereby promotes tumor growth. Cancer Cell 2011, 19, 387–400. [Google Scholar] [CrossRef]
- Wada, F.; Koga, H.; Akiba, J.; Niizeki, T.; Iwamoto, H.; Ikezono, Y.; Nakamura, T.; Abe, M.; Masuda, A.; Sakaue, T.; et al. High expression of CD44v9 and xCT in chemoresistant hepatocellular carcinoma: Potential targets by sulfasalazine. Cancer Sci 2018, 109, 2801–2810. [Google Scholar] [CrossRef]
- Birzele, F.; Voss, E.; Nopora, A.; Honold, K.; Heil, F.; Lohmann, S.; Verheul, H.; Le Tourneau, C.; Delord, J.P.; van Herpen, C.; et al. CD44 Isoform Status Predicts Response to Treatment with Anti-CD44 Antibody in Cancer Patients. Clin Cancer Res 2015, 21, 2753–2762. [Google Scholar] [CrossRef]
- Tijink, B.M.; Buter, J.; de Bree, R.; Giaccone, G.; Lang, M.S.; Staab, A.; Leemans, C.R.; van Dongen, G.A. A phase I dose escalation study with anti-CD44v6 bivatuzumab mertansine in patients with incurable squamous cell carcinoma of the head and neck or esophagus. Clin Cancer Res 2006, 12, 6064–6072. [Google Scholar] [CrossRef]
- Zhang, S.; Wu, C.C.; Fecteau, J.F.; Cui, B.; Chen, L.; Zhang, L.; Wu, R.; Rassenti, L.; Lao, F.; Weigand, S.; et al. Targeting chronic lymphocytic leukemia cells with a humanized monoclonal antibody specific for CD44. Proc Natl Acad Sci U S A 2013, 110, 6127–6132. [Google Scholar] [CrossRef]
- Vey, N.; Delaunay, J.; Martinelli, G.; Fiedler, W.; Raffoux, E.; Prebet, T.; Gomez-Roca, C.; Papayannidis, C.; Kebenko, M.; Paschka, P.; et al. Phase I clinical study of RG7356, an anti-CD44 humanized antibody, in patients with acute myeloid leukemia. Oncotarget 2016, 7, 32532–32542. [Google Scholar] [CrossRef]
- Menke-van der Houven van Oordt, C.W.; Gomez-Roca, C.; van Herpen, C.; Coveler, A.L.; Mahalingam, D.; Verheul, H.M.; van der Graaf, W.T.; Christen, R.; Rüttinger, D.; Weigand, S.; et al. First-in-human phase I clinical trial of RG7356, an anti-CD44 humanized antibody, in patients with advanced, CD44-expressing solid tumors. Oncotarget 2016, 7, 80046–80058. [Google Scholar] [CrossRef]
- Verel, I.; Heider, K.H.; Siegmund, M.; Ostermann, E.; Patzelt, E.; Sproll, M.; Snow, G.B.; Adolf, G.R.; van Dongen, G.A. Tumor targeting properties of monoclonal antibodies with different affinity for target antigen CD44V6 in nude mice bearing head-and-neck cancer xenografts. Int J Cancer 2002, 99, 396–402. [Google Scholar] [CrossRef]
- Riechelmann, H.; Sauter, A.; Golze, W.; Hanft, G.; Schroen, C.; Hoermann, K.; Erhardt, T.; Gronau, S. Phase I trial with the CD44v6-targeting immunoconjugate bivatuzumab mertansine in head and neck squamous cell carcinoma. Oral Oncol 2008, 44, 823–829. [Google Scholar] [CrossRef]
- Tsao, L.C.; Force, J.; Hartman, Z.C. Mechanisms of Therapeutic Antitumor Monoclonal Antibodies. Cancer Res 2021, 81, 4641–4651. [Google Scholar] [CrossRef]
- Reis, E.S.; Mastellos, D.C.; Ricklin, D.; Mantovani, A.; Lambris, J.D. Complement in cancer: untangling an intricate relationship. Nat Rev Immunol 2018, 18, 5–18. [Google Scholar] [CrossRef]
- Taylor, R.P.; Lindorfer, M.A. Cytotoxic mechanisms of immunotherapy: Harnessing complement in the action of anti-tumor monoclonal antibodies. Semin Immunol 2016, 28, 309–316. [Google Scholar] [CrossRef] [PubMed]
- Reff, M.E.; Carner, K.; Chambers, K.S.; Chinn, P.C.; Leonard, J.E.; Raab, R.; Newman, R.A.; Hanna, N.; Anderson, D.R. Depletion of B cells in vivo by a chimeric mouse human monoclonal antibody to CD20. Blood 1994, 83, 435–445. [Google Scholar] [CrossRef] [PubMed]
- de Weers, M.; Tai, Y.T.; van der Veer, M.S.; Bakker, J.M.; Vink, T.; Jacobs, D.C.; Oomen, L.A.; Peipp, M.; Valerius, T.; Slootstra, J.W.; et al. Daratumumab, a novel therapeutic human CD38 monoclonal antibody, induces killing of multiple myeloma and other hematological tumors. J Immunol 2011, 186, 1840–1848. [Google Scholar] [CrossRef] [PubMed]
- Zent, C.S.; Secreto, C.R.; LaPlant, B.R.; Bone, N.D.; Call, T.G.; Shanafelt, T.D.; Jelinek, D.F.; Tschumper, R.C.; Kay, N.E. Direct and complement dependent cytotoxicity in CLL cells from patients with high-risk early-intermediate stage chronic lymphocytic leukemia (CLL) treated with alemtuzumab and rituximab. Leuk Res 2008, 32, 1849–1856. [Google Scholar] [CrossRef] [PubMed]
- Schmudde, I.; Laumonnier, Y.; Köhl, J. Anaphylatoxins coordinate innate and adaptive immune responses in allergic asthma. Semin Immunol 2013, 25, 2–11. [Google Scholar] [CrossRef] [PubMed]
- Carroll, M.C.; Isenman, D.E. Regulation of humoral immunity by complement. Immunity 2012, 37, 199–207. [Google Scholar] [CrossRef] [PubMed]
- Weisser, N.E.; Sanches, M.; Escobar-Cabrera, E.; O'Toole, J.; Whalen, E.; Chan, P.W.Y.; Wickman, G.; Abraham, L.; Choi, K.; Harbourne, B.; et al. An anti-HER2 biparatopic antibody that induces unique HER2 clustering and complement-dependent cytotoxicity. Nat Commun 2023, 14, 1394. [Google Scholar] [CrossRef] [PubMed]
- Yamada, S.; Itai, S.; Nakamura, T.; Yanaka, M.; Kaneko, M.K.; Kato, Y. Detection of high CD44 expression in oral cancers using the novel monoclonal antibody, C(44)Mab-5. Biochem Biophys Rep 2018, 14, 64–68. [Google Scholar] [CrossRef] [PubMed]
- Goto, N.; Suzuki, H.; Tanaka, T.; Asano, T.; Kaneko, M.K.; Kato, Y. Development of a Novel Anti-CD44 Monoclonal Antibody for Multiple Applications against Esophageal Squamous Cell Carcinomas. Int J Mol Sci 2022, 23. [Google Scholar] [CrossRef]
- Takei, J.; Asano, T.; Suzuki, H.; Kaneko, M.K.; Kato, Y. Epitope Mapping of the Anti-CD44 Monoclonal Antibody (C44Mab-46) Using Alanine-Scanning Mutagenesis and Surface Plasmon Resonance. Monoclon Antib Immunodiagn Immunother 2021, 40, 219–226. [Google Scholar] [CrossRef]
- Asano, T.; Kaneko, M.K.; Takei, J.; Tateyama, N.; Kato, Y. Epitope Mapping of the Anti-CD44 Monoclonal Antibody (C44Mab-46) Using the REMAP Method. Monoclon Antib Immunodiagn Immunother 2021, 40, 156–161. [Google Scholar] [CrossRef]
- Asano, T.; Kaneko, M.K.; Kato, Y. Development of a Novel Epitope Mapping System: RIEDL Insertion for Epitope Mapping Method. Monoclon Antib Immunodiagn Immunother 2021, 40, 162–167. [Google Scholar] [CrossRef] [PubMed]
- Suzuki, H.; Kitamura, K.; Goto, N.; Ishikawa, K.; Ouchida, T.; Tanaka, T.; Kaneko, M.K.; Kato, Y. A Novel Anti-CD44 Variant 3 Monoclonal Antibody C(44)Mab-6 Was Established for Multiple Applications. Int J Mol Sci 2023, 24. [Google Scholar] [CrossRef] [PubMed]
- Kudo, Y.; Suzuki, H.; Tanaka, T.; Kaneko, M.K.; Kato, Y. Development of a Novel Anti-CD44 variant 5 Monoclonal Antibody C44Mab-3 for Multiple Applications against Pancreatic Carcinomas. Antibodies 2023, 12, 31. [Google Scholar] [CrossRef] [PubMed]
- Ejima, R.; Suzuki, H.; Tanaka, T.; Asano, T.; Kaneko, M.K.; Kato, Y. Development of a Novel Anti-CD44 Variant 6 Monoclonal Antibody C(44)Mab-9 for Multiple Applications against Colorectal Carcinomas. Int J Mol Sci 2023, 24. [Google Scholar] [CrossRef]
- Suzuki, H.; Ozawa, K.; Tanaka, T.; Kaneko, M.K.; Kato, Y. Development of a Novel Anti-CD44 Variant 7/8 Monoclonal Antibody, C44Mab-34, for Multiple Applications against Oral Carcinomas. Biomedicines 2023, 11, 1099. [Google Scholar] [CrossRef] [PubMed]
- Tawara, M.; Suzuki, H.; Goto, N.; Tanaka, T.; Kaneko, M.K.; Kato, Y. A Novel Anti-CD44 Variant 9 Monoclonal Antibody C44Mab-1 was Developed for Immunohistochemical Analyses Against Colorectal Cancers Curr. Issues Mol. Biol. 2023, 45, 3658–3673. [Google Scholar] [CrossRef] [PubMed]
- Ishikawa, K.; Suzuki, H.; Kaneko, M.K.; Kato, Y. Establishment of a Novel Anti-CD44 Variant 10 Monoclonal Antibody C(44)Mab-18 for Immunohistochemical Analysis against Oral Squamous Cell Carcinomas. Curr Issues Mol Biol 2023, 45, 5248–5262. [Google Scholar] [CrossRef] [PubMed]
- Suzuki, H.; Tanaka, T.; Goto, N.; Kaneko, M.K.; Kato, Y. Development of a Novel Anti-CD44 Variant 4 Monoclonal Antibody C44Mab-108 for Immunohistochemistry. Curr Issues Mol Biol 2023, 45, 1875–1888. [Google Scholar] [CrossRef]
- Ishikawa, K.; Suzuki, H.; Ohishi, T.; Nakamura, T.; Yanaka, M.; Li, G.; Tanaka, T.; Ohkoshi, A.; Kawada, M.; Kaneko, M.K.; et al. Antitumor activities of anti-CD44 monoclonal antibodies in mouse xenograft models of esophageal cancer. Oncology Reports in press. 2024. [Google Scholar]
- Zhang, H.; Brown, R.L.; Wei, Y.; Zhao, P.; Liu, S.; Liu, X.; Deng, Y.; Hu, X.; Zhang, J.; Gao, X.D.; et al. CD44 splice isoform switching determines breast cancer stem cell state. Genes Dev 2019, 33, 166–179. [Google Scholar] [CrossRef]
- Hiemstra, I.H.; Santegoets, K.C.M.; Janmaat, M.L.; De Goeij, B.; Ten Hagen, W.; van Dooremalen, S.; Boross, P.; van den Brakel, J.; Bosgra, S.; Andringa, G.; et al. Preclinical anti-tumour activity of HexaBody-CD38, a next-generation CD38 antibody with superior complement-dependent cytotoxic activity. EBioMedicine 2023, 93, 104663. [Google Scholar] [CrossRef]
- de Jong, R.N.; Beurskens, F.J.; Verploegen, S.; Strumane, K.; van Kampen, M.D.; Voorhorst, M.; Horstman, W.; Engelberts, P.J.; Oostindie, S.C.; Wang, G.; et al. A Novel Platform for the Potentiation of Therapeutic Antibodies Based on Antigen-Dependent Formation of IgG Hexamers at the Cell Surface. PLoS Biol 2016, 14, e1002344. [Google Scholar] [CrossRef]
- Mitsunaga, M.; Ogawa, M.; Kosaka, N.; Rosenblum, L.T.; Choyke, P.L.; Kobayashi, H. Cancer cell-selective in vivo near infrared photoimmunotherapy targeting specific membrane molecules. Nat Med 2011, 17, 1685–1691. [Google Scholar] [CrossRef] [PubMed]
- Nagaya, T.; Nakamura, Y.; Okuyama, S.; Ogata, F.; Maruoka, Y.; Choyke, P.L.; Allen, C.; Kobayashi, H. Syngeneic Mouse Models of Oral Cancer Are Effectively Targeted by Anti-CD44-Based NIR-PIT. Mol Cancer Res 2017, 15, 1667–1677. [Google Scholar] [CrossRef]
- Aasted, M.K.M.; Groen, A.C.; Keane, J.T.; Dabelsteen, S.; Tan, E.; Schnabel, J.; Liu, F.; Lewis, H.S.; Theodoropulos, C.; Posey, A.D.; et al. Targeting Solid Cancers with a Cancer-Specific Monoclonal Antibody to Surface Expressed Aberrantly O-glycosylated Proteins. Mol Cancer Ther 2023, 22, 1204–1214. [Google Scholar] [CrossRef]
- Arimori, T.; Mihara, E.; Suzuki, H.; Ohishi, T.; Tanaka, T.; Kaneko, M.K.; Takagi, J.; Kato, Y. Locally misfolded HER2 expressed on cancer cells is a promising target for development of cancer-specific antibodies. Structure 2024. [Google Scholar] [CrossRef]
- Kaneko, M.K.; Suzuki, H.; Kato, Y. Establishment of a Novel Cancer-specific Anti-HER2 Monoclonal Antibody H2Mab-250/H2CasMab-2 for breast cancers. Monoclon Antib Immunodiagn Immunother 2024, in press. [Google Scholar] [CrossRef]
- Kaneko, M.K.; Suzuki, H.; Ohishi, T.; Nakamura, T.; Tanaka, T.; Kato, Y. A Cancer-Specific Monoclonal Antibody against HER2 Exerts Antitumor Activities in Human Breast Cancer Xenograft Models. Int J Mol Sci 2024, 25. [Google Scholar] [CrossRef]
- Suzuki, H.; Ohishi, T.; Tanaka, T.; Kaneko, M.K.; Kato, Y. Anti-HER2 cancer-specific mAb, H2Mab-250-hG1 possesses higher complement-dependent cytotoxicity than trastuzumab. Int. J. Mol. Sci. 2024, 25. [Google Scholar] [CrossRef]
- Li, G.; Suzuki, H.; Ohishi, T.; Asano, T.; Tanaka, T.; Yanaka, M.; Nakamura, T.; Yoshikawa, T.; Kawada, M.; Kaneko, M.K.; et al. Antitumor activities of a defucosylated anti-EpCAM monoclonal antibody in colorectal carcinoma xenograft models. Int J Mol Med 2023, 51. [Google Scholar] [CrossRef] [PubMed]
Disclaimer/Publisher’s Note: The statements, opinions and data contained in all publications are solely those of the individual author(s) and contributor(s) and not of MDPI and/or the editor(s). MDPI and/or the editor(s) disclaim responsibility for any injury to people or property resulting from any ideas, methods, instructions or products referred to in the content. |
© 2024 by the authors. Licensee MDPI, Basel, Switzerland. This article is an open access article distributed under the terms and conditions of the Creative Commons Attribution (CC BY) license (http://creativecommons.org/licenses/by/4.0/).


