Submitted:
01 August 2024
Posted:
06 August 2024
You are already at the latest version
Abstract
Keywords:
1. Introduction
2. Materials and Methods
2.1. Breadth of Business Intelligence
2.2. Participants
2.3. Data Base and Process
3. Results and Discussion
3.1. Stage 1—Goal-Setting
3.2. Stage 2—Prototype Development
3.3. Stage 3—Prototype Validation
4. Conclusions
Supplementary Materials
References
- Deriba BK, Sinke SO, Ereso BM, Badacho AS. Health professionals’ job satisfaction and associated factors at public health centers in West Ethiopia. Hum Resour Health. 30 de maio de 2017;15(1):36. [CrossRef]
- Lunkes RJ, Naranjo-Gil D, Lopez-Valeiras E. Management Control Systems and Clinical Experience of Managers in Public Hospitals. Int J Environ Res Public Health. abril de 2018;15(4):776. [CrossRef]
- Shiri R, El-Metwally A, Sallinen M, Pöyry M, Härmä M, Toppinen-Tanner S. The Role of Continuing Professional Training or Development in Maintaining Current Employment: A Systematic Review. Healthcare. janeiro de 2023;11(21):2900. [CrossRef]
- Carrie H, Mackey TK, Laird SN. Integrating traditional indigenous medicine and western biomedicine into health systems: a review of Nicaraguan health policies and miskitu health services. Int J Equity Health. 14 de dezembro de 2015;14(1):129. [CrossRef]
- Mzimela JH, Moyo I. On the Efficacy of Indigenous Knowledge Systems in Responding to the COVID-19 Pandemic: Unsettling Coloniality. Int J Environ Res Public Health. junho de 2024;21(6):731. [CrossRef]
- Parter C, Gwynn J, Wilson S, Skinner JC, Rix E, Hartz D. Putting Indigenous Cultures and Indigenous Knowledges Front and Centre to Clinical Practice: Katherine Hospital Case Example. Int J Environ Res Public Health. janeiro de 2024;21(1):3. [CrossRef]
- Quadros FAA. Análise das práticas dos(as) enfermeiros(as) indígenas das etnias Guarani, Kaiowá e Terena na perspectiva do cuidado cultural [Internet]. [s.n.]; 2016 [citado 27 de julho de 2024]. Disponível em: https://repositorio.unicamp.br/acervo/detalhe/979304.
- Wenczenovicz TJ. Saúde indígena: reflexões contemporâneas. Indians health: contemporary reflections [Internet]. 2018 [citado 29 de julho de 2024]; Disponível em: https://www.arca.fiocruz.br/handle/icict/63940.
- Sandes LFF, Freitas DA, Souza MFNS de, Leite KB de S. Atenção primária à saúde de indígenas sul-americanos: revisão integrativa da literatura. Rev Panam Salud Pública. 18 de outubro de 2018;42:e163.
- Silva EC da, Silva NCD de L e, Café LA, Almeida PMO de, Souza LN de, Silva AD da. Dificuldades vivenciadas pelos profissionais de saúde no atendimento à população indígena. Rev Eletrônica Acervo Saúde. 7 de janeiro de 2021;13(1):e5413.
- Clifford A, McCalman J, Bainbridge R, Tsey K. Interventions to improve cultural competency in health care for Indigenous peoples of Australia, New Zealand, Canada and the USA: a systematic review. Int J Qual Health Care. 1o de abril de 2015;27(2):89–98. [CrossRef]
- Truong M, Paradies Y, Priest N. Interventions to improve cultural competency in healthcare: a systematic review of reviews. BMC Health Serv Res. 3 de março de 2014;14(1):99. [CrossRef]
- Agência de Notícias—IBGE [Internet]. 2012 [citado 27 de julho de 2024]. Censo 2010: população indígena é de 896,9 mil, tem 305 etnias e fala 274 idiomas | Agência de Notícias. Disponível em: https://agenciadenoticias.ibge.gov.br/agencia-sala-de-imprensa/2013-agencia-de-noticias/releases/14262-asi-censo-2010-populacao-indigena-e-de-8969-mil-tem-305-etnias-e-fala-274-idiomas.
- Thackrah RD, Thompson SC. Refining the concept of cultural competence: building on decades of progress. Med J Aust. 2013;199(1):35–8. [CrossRef]
- Lepesteur JD. A ATENÇÃO INTEGRAL EM SAÚDE JUNTO AOS INDÍGENAS. Rev FOCO. 24 de abril de 2024;17(4):e4959–e4959.
- Constituição [Internet]. [citado 27 de julho de 2024]. Disponível em: https://www.planalto.gov.br/ccivil_03/constituicao/constituicao.htm.
- UNFPA Brasil [Internet]. 2016 [citado 29 de julho de 2024]. Declaração das Nações Unidas sobre os Direitos dos Povos Indígenas. Disponível em: https://brazil.unfpa.org/pt-br/publications/declara%C3%A7%C3%A3o-das-na%C3%A7%C3%B5es-unidas-sobre-os-direitos-dos-povos-ind%C3%ADgenas.
- Cardoso MD. Saúde e povos indígenas no Brasil: notas sobre alguns temas equívocos na política atual. Cad Saúde Pública. abril de 2014;30:860–6.
- Becker LA, Loch MR, Reis RS. Barreiras percebidas por diretores de saúde para tomada de decisão baseada em evidências. Rev Panam Salud Pública. 3 de maio de 2018;41:e147.
- Cavalcanti PC da S, Oliveira Neto AV de, Sousa MF de. Quais são os desafios para a qualificação da Atenção Básica na visão dos gestores municipais? Saúde Em Debate. junho de 2015;39:323–36.
- Agência de Notícias—IBGE [Internet]. 2023 [citado 27 de julho de 2024]. Brasil tem 1,7 milhão de indígenas e mais da metade deles vive na Amazônia Legal | Agência de Notícias. Disponível em: https://agenciadenoticias.ibge.gov.br/agencia-noticias/2012-agencia-de-noticias/noticias/37565-brasil-tem-1-7-milhao-de-indigenas-e-mais-da-metade-deles-vive-na-amazonia-legal.
- Ministério da Saúde [Internet]. [citado 27 de julho de 2024]. Saúde indígena: mais de 53,7 milhões de atendimentos foram realizados em quatro anos. Disponível em: https://www.gov.br/saude/pt-br/assuntos/noticias/2022/dezembro/saude-indigena-mais-de-53-7-milhoes-de-atendimentos-foram-realizados-em-quatro-anos.
- Ministério da Saúde [Internet]. [citado 29 de julho de 2024]. Saúde Indígena. Disponível em: https://www.gov.br/saude/pt-br/composicao/sesai/saude-indigena.
- Xu H, Yuan F, Xie T. Intelligent Study on the Opening and Selecting Course Management Model of URP System Based on Individual Preference. Em: 2020 International Symposium on Advances in Informatics, Electronics and Education (ISAIEE) [Internet]. 2020 [citado 27 de julho de 2024]. p. 1–5. Disponível em: https://ieeexplore.ieee.org/document/9403267.
- Coimbra Junior CEA, Santos RV, Escobar AL, Associação Brasileira de Pós-Graduação em Saúde Coletiva, organizadores. Epidemiologia e saúde dos povos indígenas no Brasil. Rio de Janeiro, RJ: Editora Fiocruz : ABRASCO; 2003. 257 p.
- Ramalingam S, Subramanian M, Sreevallabha Reddy A, Tarakaramu N, Ijaz Khan M, Abdullaev S, et al. Exploring business intelligence applications in the healthcare industry: A comprehensive analysis. Egypt Inform J. 1o de março de 2024;25:100438. [CrossRef]
- Trincanato E, Vagnoni E. Business intelligence and the leverage of information in healthcare organizations from a managerial perspective: a systematic literature review and research agenda. J Health Organ Manag. 1o de janeiro de 2024;38(3):305–30. [CrossRef]
- Azzopardi PS, Sawyer SM, Carlin JB, Degenhardt L, Brown N, Brown AD, et al. Health and wellbeing of Indigenous adolescents in Australia: a systematic synthesis of population data. The Lancet. 24 de fevereiro de 2018;391(10122):766–82. [CrossRef]
- Antunes FM, Gleriano JS, Dias BM, Moura AA, Gasparini LVL. Informação como apoio para tomada de decisão de gestores públicos de saúde. Rev Adm Em Saúde [Internet]. 7 de abril de 2021 [citado 27 de julho de 2024];21(82). Disponível em: https://cqh.org.br/ojs-2.4.8/index.php/ras/article/view/283.
- Ekwebene OC, Umeanowai NV, Edeh GC, Noah GU, Folasole A, Olagunju OJ, et al. The burden of diabetes in America: a data-driven analysis using power BI. Int J Res Med Sci. 30 de janeiro de 2024;12(2):392–6. [CrossRef]
- Graves SM, He L. Covid-19 Mapping with Microsoft Power BI. Terra Digit. 31 de outubro de 2020;1–5. [CrossRef]
- Leão AP da S, Gomes BRA, Cruz JCS, Silva VV da, Sena C da C, Júnior FAVO. POWER BI PARA TOMADA DE DECISÕES ESTRATÉGICAS: ANÁLISE DE INDICADORES-CHAVE DE DESEMPENHO (KPIS). Rev FOCO. 18 de julho de 2023;16(7):e2472–e2472.
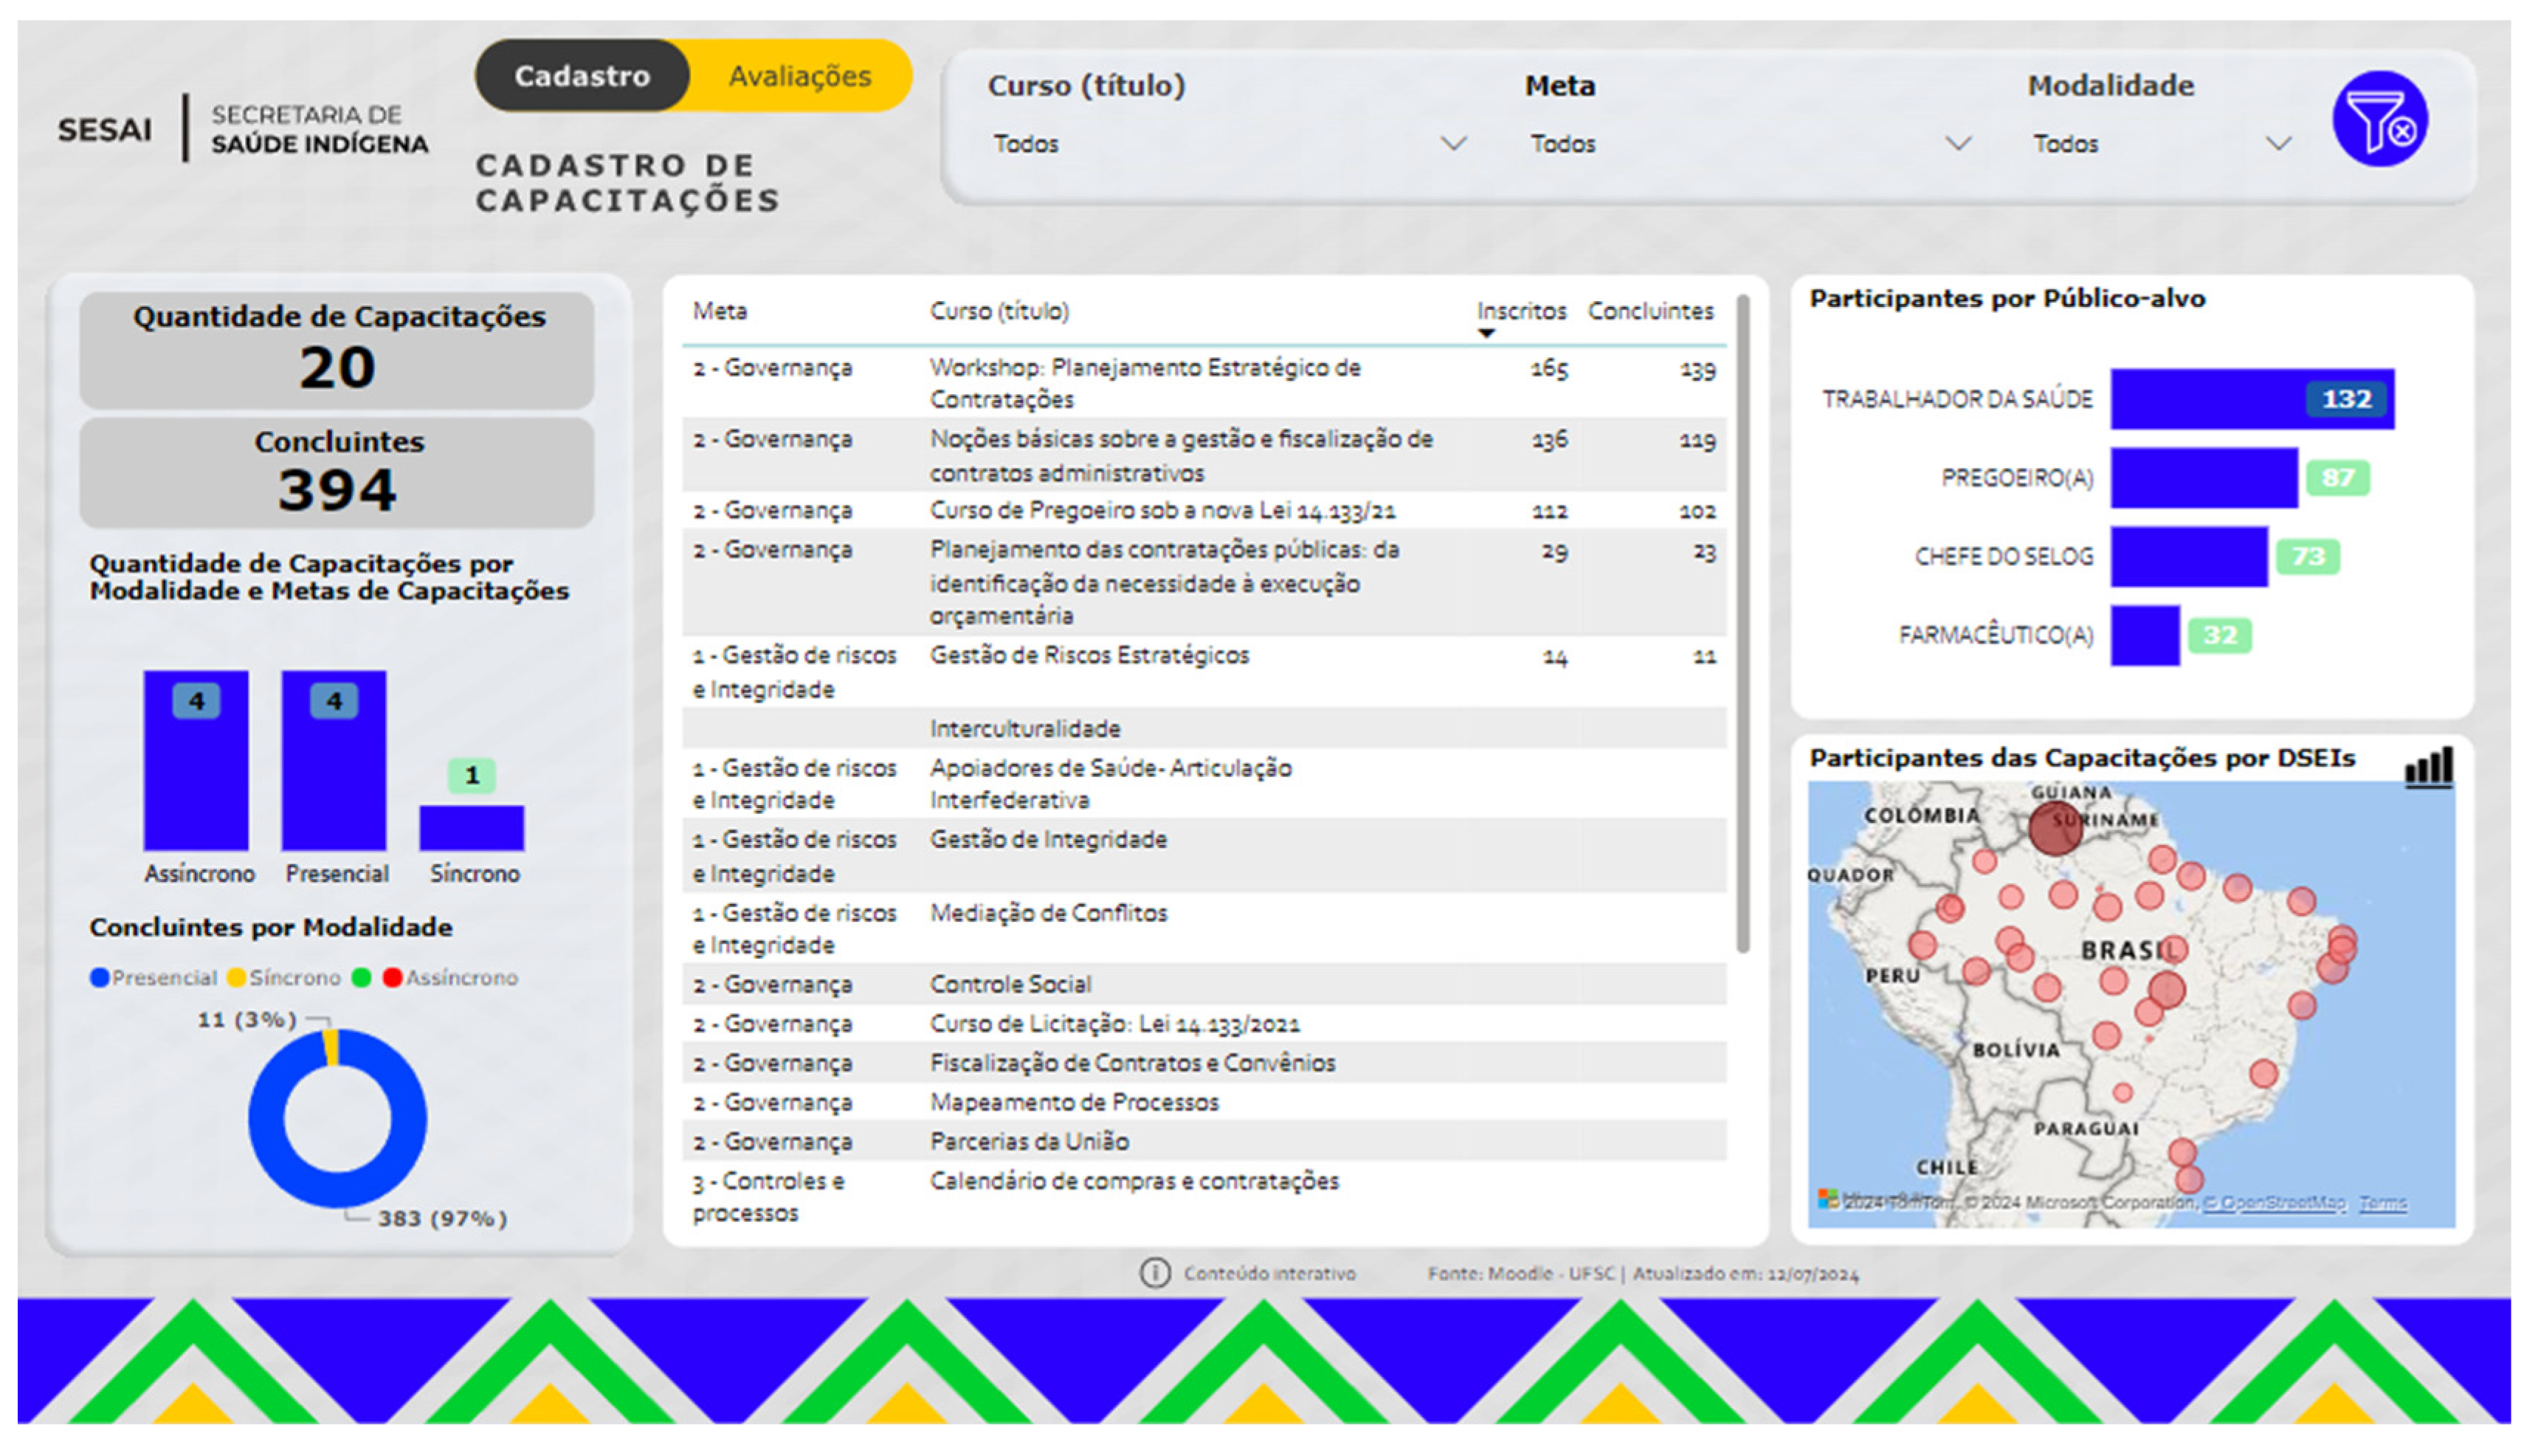
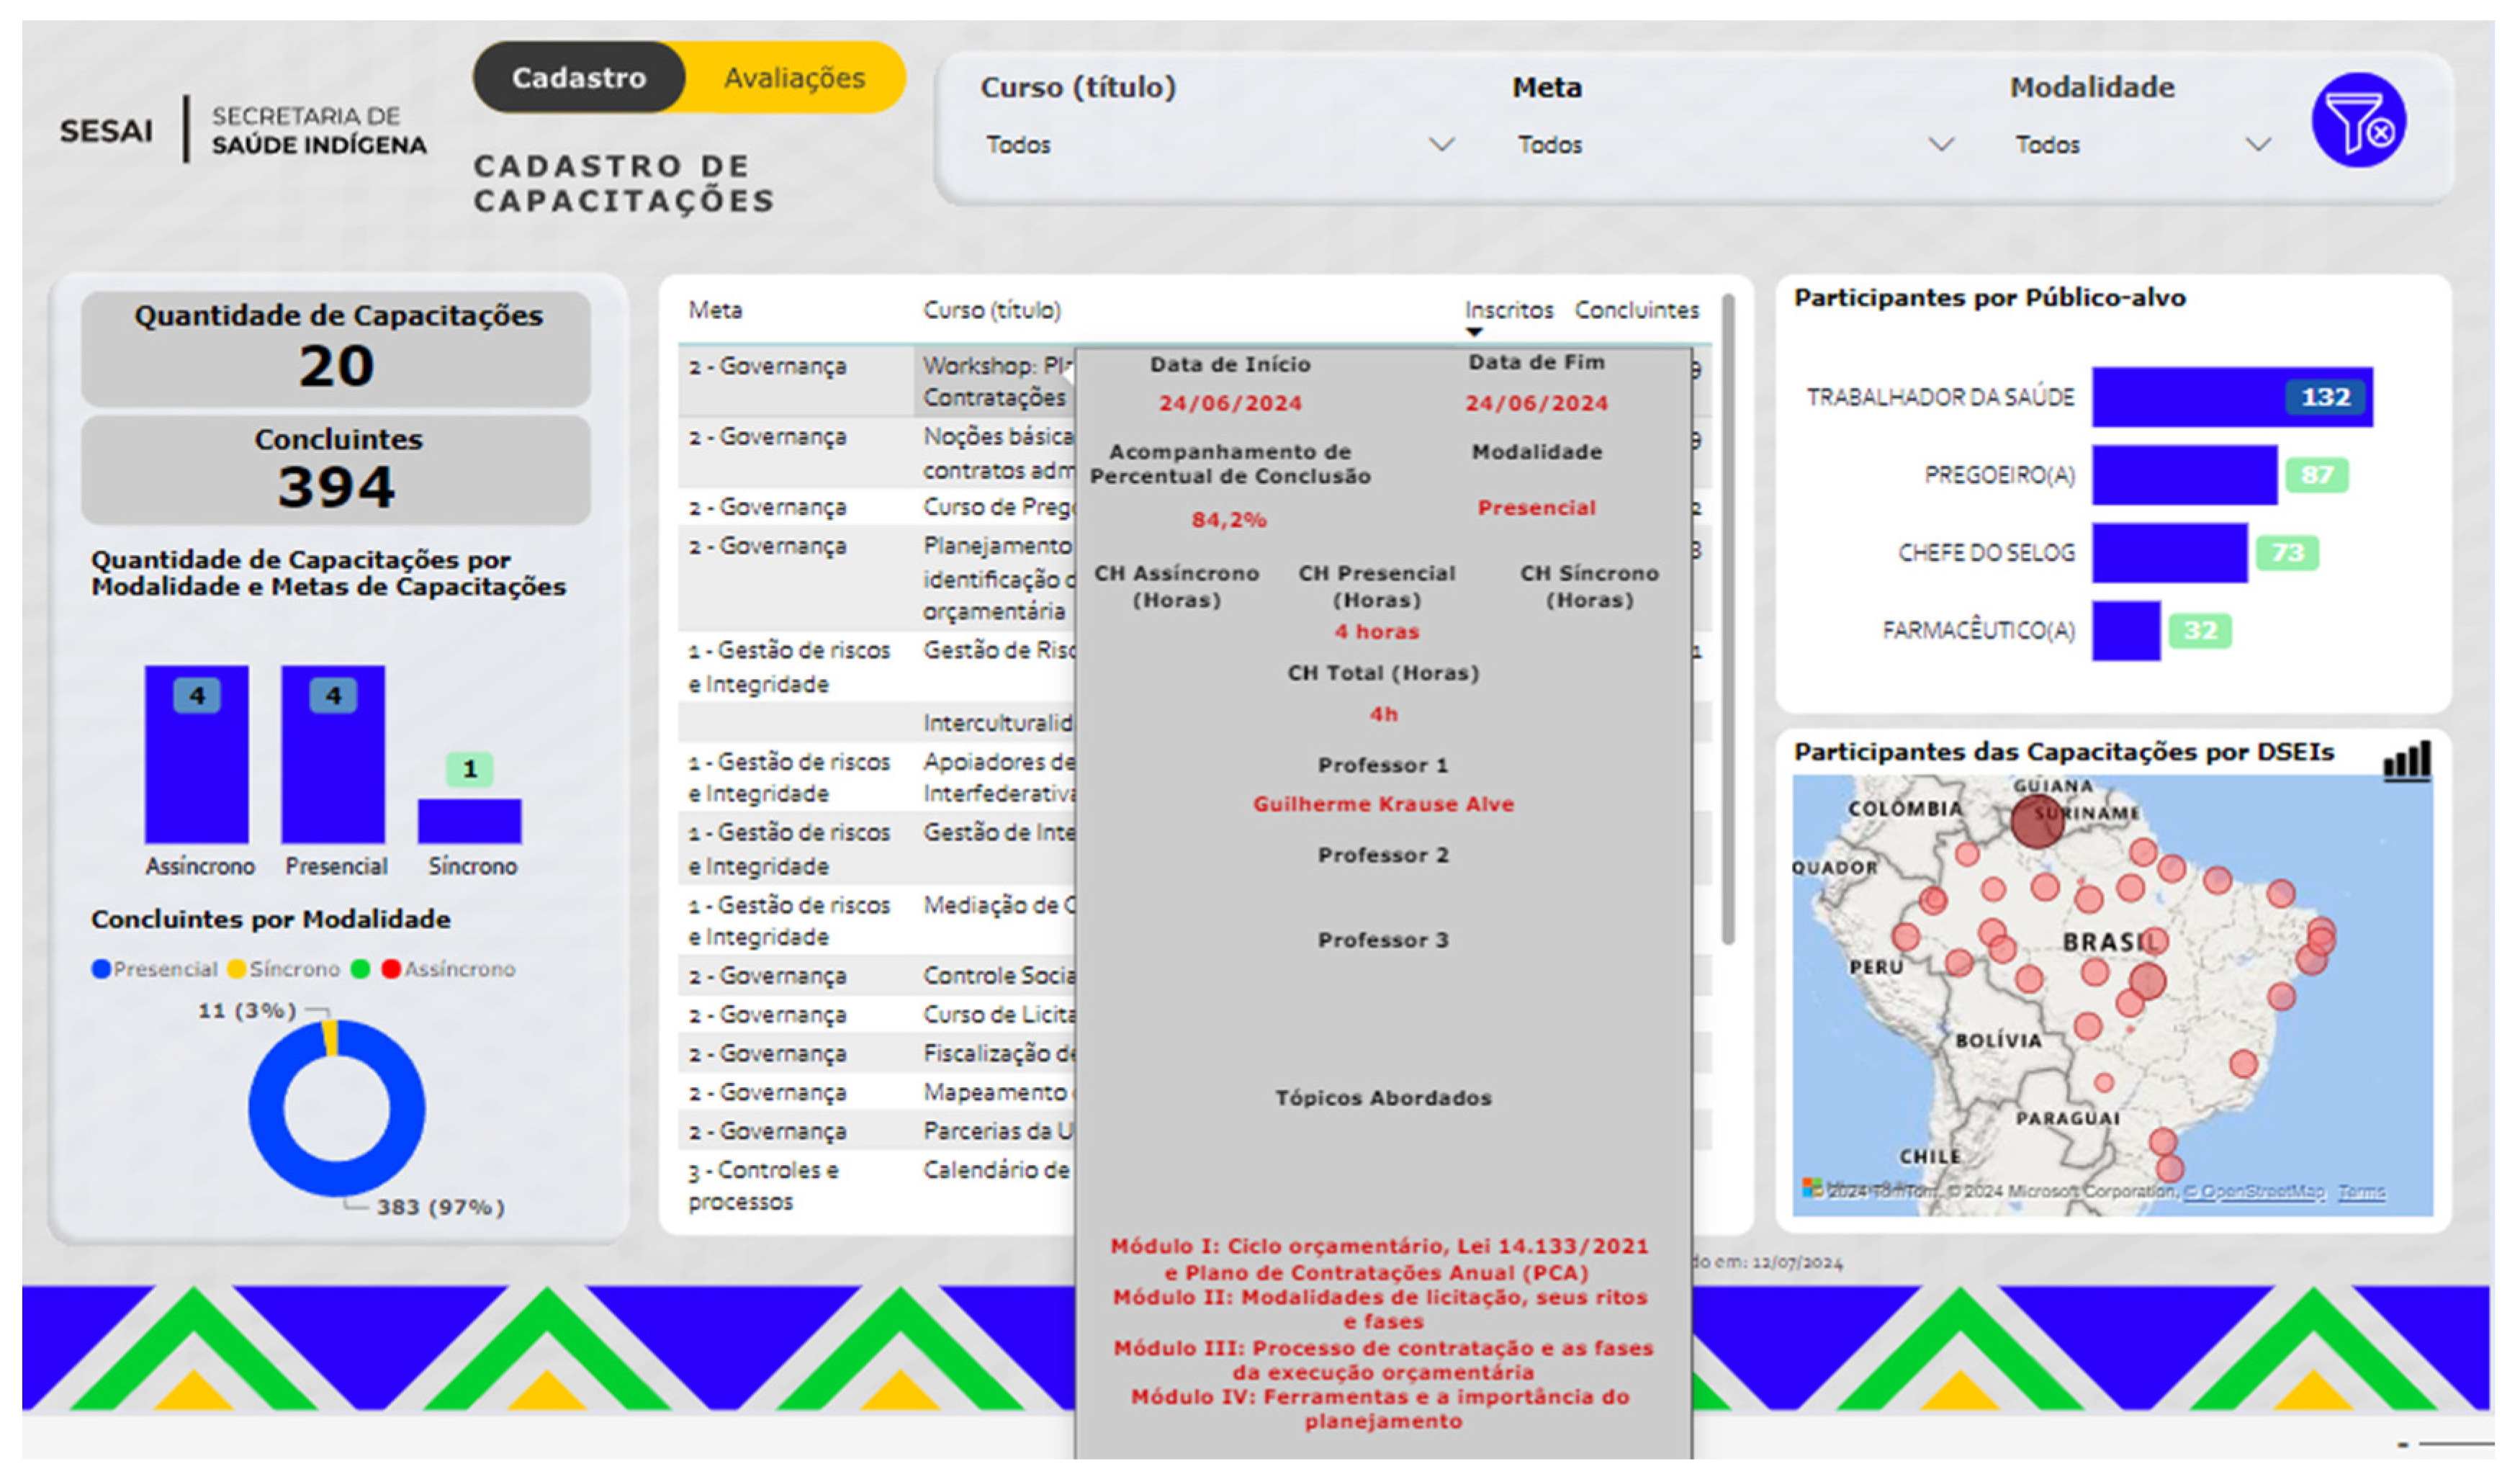
| Dashboard 1—Quantitative | |
|---|---|
| Indicator | Usefulness/Justification |
| Training quantity | Allows quickly viewing the number of training courses executed and planned. |
| Number of completers | Allows quickly identifying the reach that the project is having and, consequently, the number of people certified. |
| Number of training courses by modality | Allows checking whether the designed strategy is being carried out (achieved). |
| Completers by modality | Shows the number of completers by course type (face-to-face, synchronous, and asynchronous courses). |
| List of courses (target, enrollees, and completers) | Allows quickly viewing the courses and topics already offered or planned, and courses that have been completed, by showing the number of enrollees and completers. |
| List of courses with interactive details (date, workload, % completion, modality, teachers and content) | The details allow understanding the course breadth (hours and content). It also shows the proportion of people who enroll and do not complete a course, allowing for timely corrective actions. |
| Participants by target audience | It allows analyzing whether only the central administration is being trained or whether the training also covers operational employees (DSEIs). Also, given the variety of activities carried out by DSEIs, this indicator shows whether all these different functions are being covered. |
| Participants in training by DSEI | Shows the level (e.g., district, region, or national) that courses are reaching. |
| Filter | Usefulness/Justification |
| Course | Allows filtering all information about a given course, such as target audience, region of the country, course modality, number of participants, completers, and content, etc. |
| Target | Allows filtering all information about a given target, such as courses linked to this goal, target audience, region of the country, course modality, number of participants, completers, and content, etc. |
| Modality | Allows filtering information by type of course (face-to-face, synchronous, and asynchronous). |
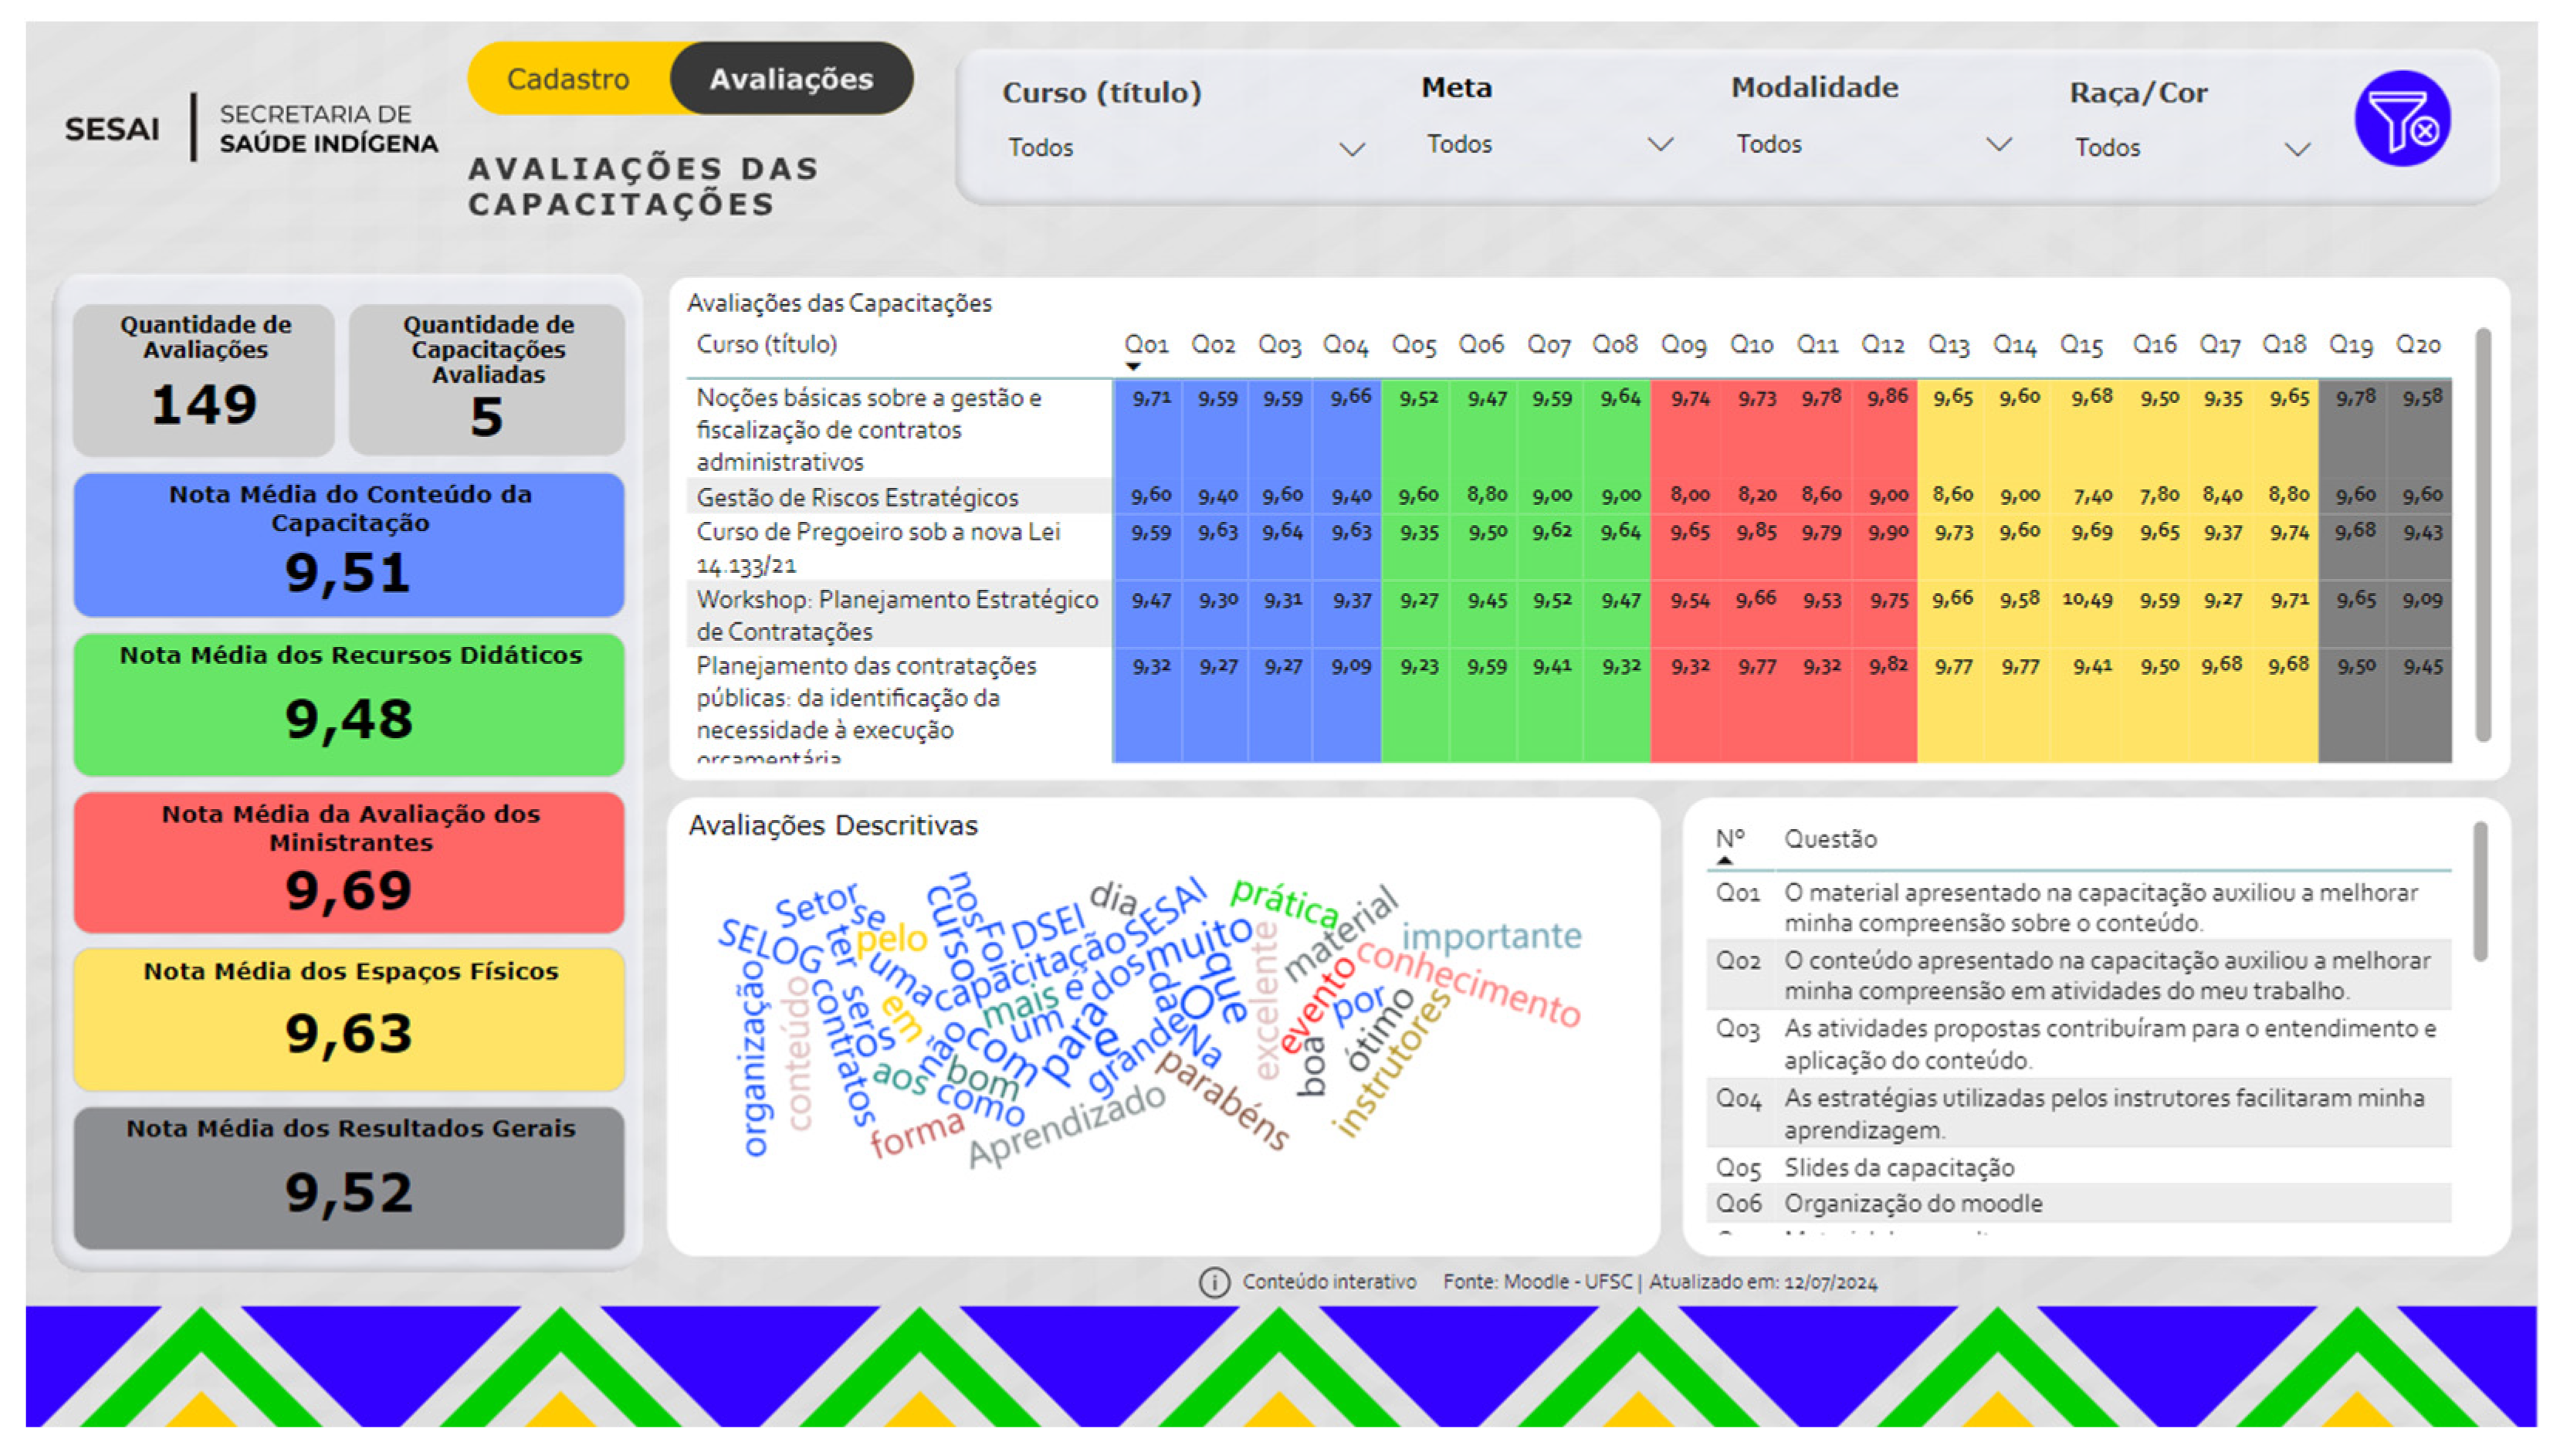
| Dashboard 2—Qualitative | |
|---|---|
| Indicator | Usefulness/Justification |
| Number of reviews | Allows viewing whether participants are voluntarily evaluating courses in order to generate feedback. |
| Number of courses evaluated | Shows the number of training courses completed and generates a list of evaluations by course. |
| Average score for evaluations of trainers, teaching resources, content, and facility | Each average score card allows identifying the general quality of each analysis construct and evaluating the quality/excellence achieved by the course, while also identifying correction aspects if the averages are not at the expected performance. |
| Average score for general results | In the same way as the other cards, the average score of the general results aims to identify numerically (a score from 0 to 10) the quality of training. However, this card summarizes participants’ perception in relation to the other constructs evaluated. |
| List of training evaluations (course and average score by question) | This table identifies the average scores by question evaluated, thus allowing to specifically analyze which question may have pushed the average (up or down). For example, if the facility received poor ratings, it is necessary to understand whether it was due to its lighting, air conditioning, or another aspect. |
| Word cloud | The word cloud provides an idea of whether participants are bringing more positive or negative words in relation to the general perception of courses. |
| Assessment questions | Allows viewing each (qualitative) evaluation question answered by course participants. |
| Filter | Usefulness/Justification |
| Course | It allows filtering all information about course punctuality, such as the average score a course obtained and what set of words describe it. |
| Target | Allows filtering all information by course target, subdivided by targets that can be translated into themes. |
| Modality | It allows analyzing how course quality is received and perceived in relation to the modality offered (face-to-face, synchronous, and asynchronous). |
| Race/color | Allows filtering all information by the race/color of trained professionals. |
Disclaimer/Publisher’s Note: The statements, opinions and data contained in all publications are solely those of the individual author(s) and contributor(s) and not of MDPI and/or the editor(s). MDPI and/or the editor(s) disclaim responsibility for any injury to people or property resulting from any ideas, methods, instructions or products referred to in the content. |
© 2024 by the authors. Licensee MDPI, Basel, Switzerland. This article is an open access article distributed under the terms and conditions of the Creative Commons Attribution (CC BY) license (http://creativecommons.org/licenses/by/4.0/).


