Introduction
The seismic performance of buildings is closely related to the seismic capacity of a city. The collapse of buildings results in casualties and economic loss [
1]. Beijing has complex and diverse building structures with large seismic performance differences. The seismic resistance of many important buildings in Beijing have not yet been tested. The construction characteristics and economic layout of Beijing result in a dense distribution of high-rise buildings, which causes a high risk of emergency evacuation and gives rise to great uncertainty in the simulation of regional earthquake disasters. Ensuring the regional structural seismic resistance has become an important research topic in earthquake engineering. Experimental studies and investigations have provided direct and valuable data for predicting earthquakes. However, it is still difficult to satisfy the analysis requirements of modern large-scale buildings. With the rapid development of numerical simulations and computer technology, it is possible to directly model the elastoplastic analysis of each building in a city [
1]. Recently, Hori [
2] conducted an integrated earthquake simulation (IES) based on the full computation of earthquake hazards and disasters. Sahin [
3] built a Turkish version of IES using MATLAB. Lu [
4] proposed the use of nonlinear multi-degree-of-freedom (MDOF) models and elastoplastic time-analysis methods to simulate earthquakes in urban buildings and developed the corresponding high-performance computing systems to provide scientifically accurate data for simulating urban seismic hazard scenarios [
4]. However, all these structural response prediction models simplify real structures to mass points. Therefore, they cannot be directly used to simulate urban-scale earthquakes because of the lack of surface information on buildings. Xu [
5] proposed a method for the vertical stretching of 2D-GIS floor planes based on the study of Lu [
4] to obtain three-dimensional (3D) geometric models of urban buildings. However, these models are still relatively rudimentary, and the realistic effect must be further improved. Based on the 2D-GIS data, Xiong [
6] obtained the attribution data of each structure and processed the 3D polygon model of the city to obtain the floor polygon model such that a 3D-GIS model of the urban scale with high realism could be established [
6]. The structural response prediction models were generated using the methods proposed in previous studies [
2,
4,
6,
7].
The current status of domestic and international research shows that input ground motions are often determined by fitting and comparing the target response spectra, and the degree of localization is insufficient. Additionally, model construction based solely on physical parameters may not truly reflect the dynamic properties of structures. Therefore, the existing structural dynamic response and seismic resilience simulation cannot accurately reflect the real situation of buildings in actual earthquakes. The seismic response monitoring of structures is the most effective way to understand the performance of structural systems under large earthquakes. The seismic response data recorded in the monitoring system are equivalent to a prototype structural test, and useful information regarding the seismic performance can be used to improve the seismic design and enhance the seismic design criteria [
8]. Furthermore, structural response records are used to verify the reliability of the numerical or testing model, and the structural optimization model is determined through updating [
9,
10], which provides the model foundation for structural response prediction. Consequently, research on simulation methods of earthquakes based on real-time monitoring records will help solve the problem of insufficient local ground motions and in accurately updating structural models, which is an effective way of improving the reliability of regional earthquake prediction.
1. Nearby Real-Time Simulation Method of Earthquakes on an Urban Scale
In this study, we propose a simulation method for regional earthquakes based on structural monitoring, in which real-time records, structural data, and seismic analysis data are integrated to visualize the effects of an earthquake in a simulation. The predicted results, including variations in the seismic response and damage level of buildings, can be applied to regional seismic analyses and urban disaster prevention [
11].
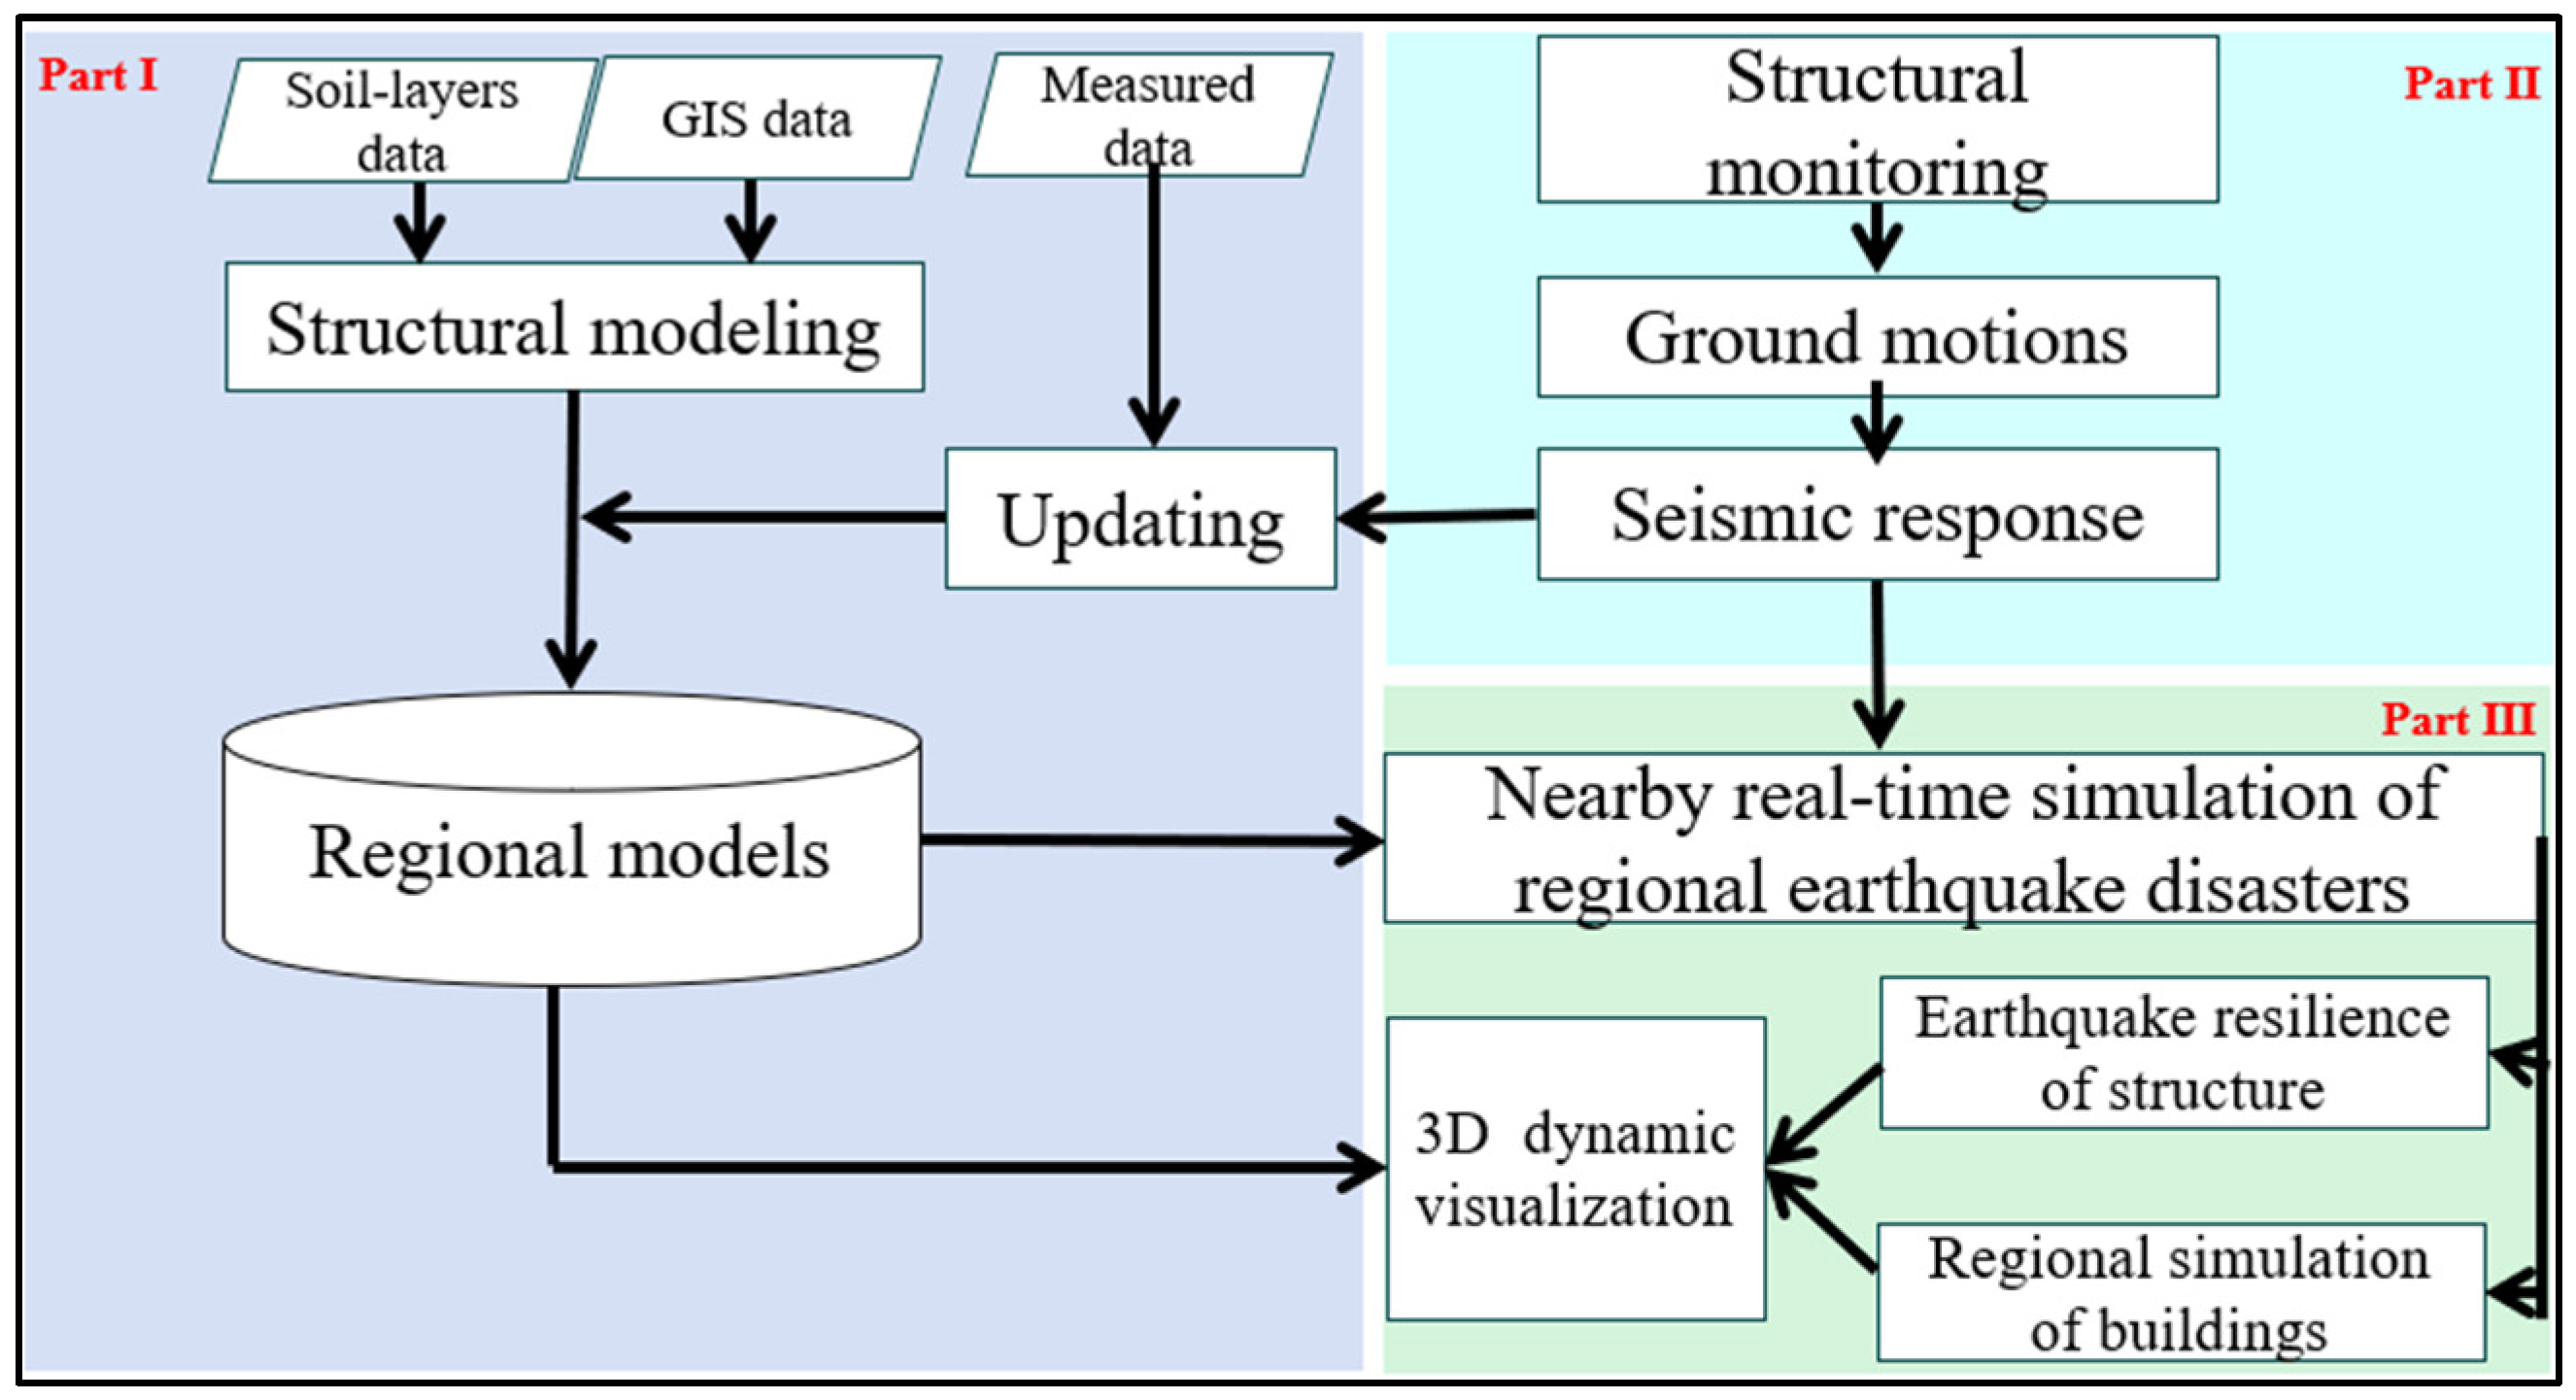
Figure 1 shows a flowchart of the entire simulation process, which consists of three main modules: (1) Module I, model construction of regional structures; (2) Module II, structural vibration monitoring and seismic response calculations; and (3) Module III, regional earthquake simulation and visualization.
1.1. Model Construction of Regional Structures
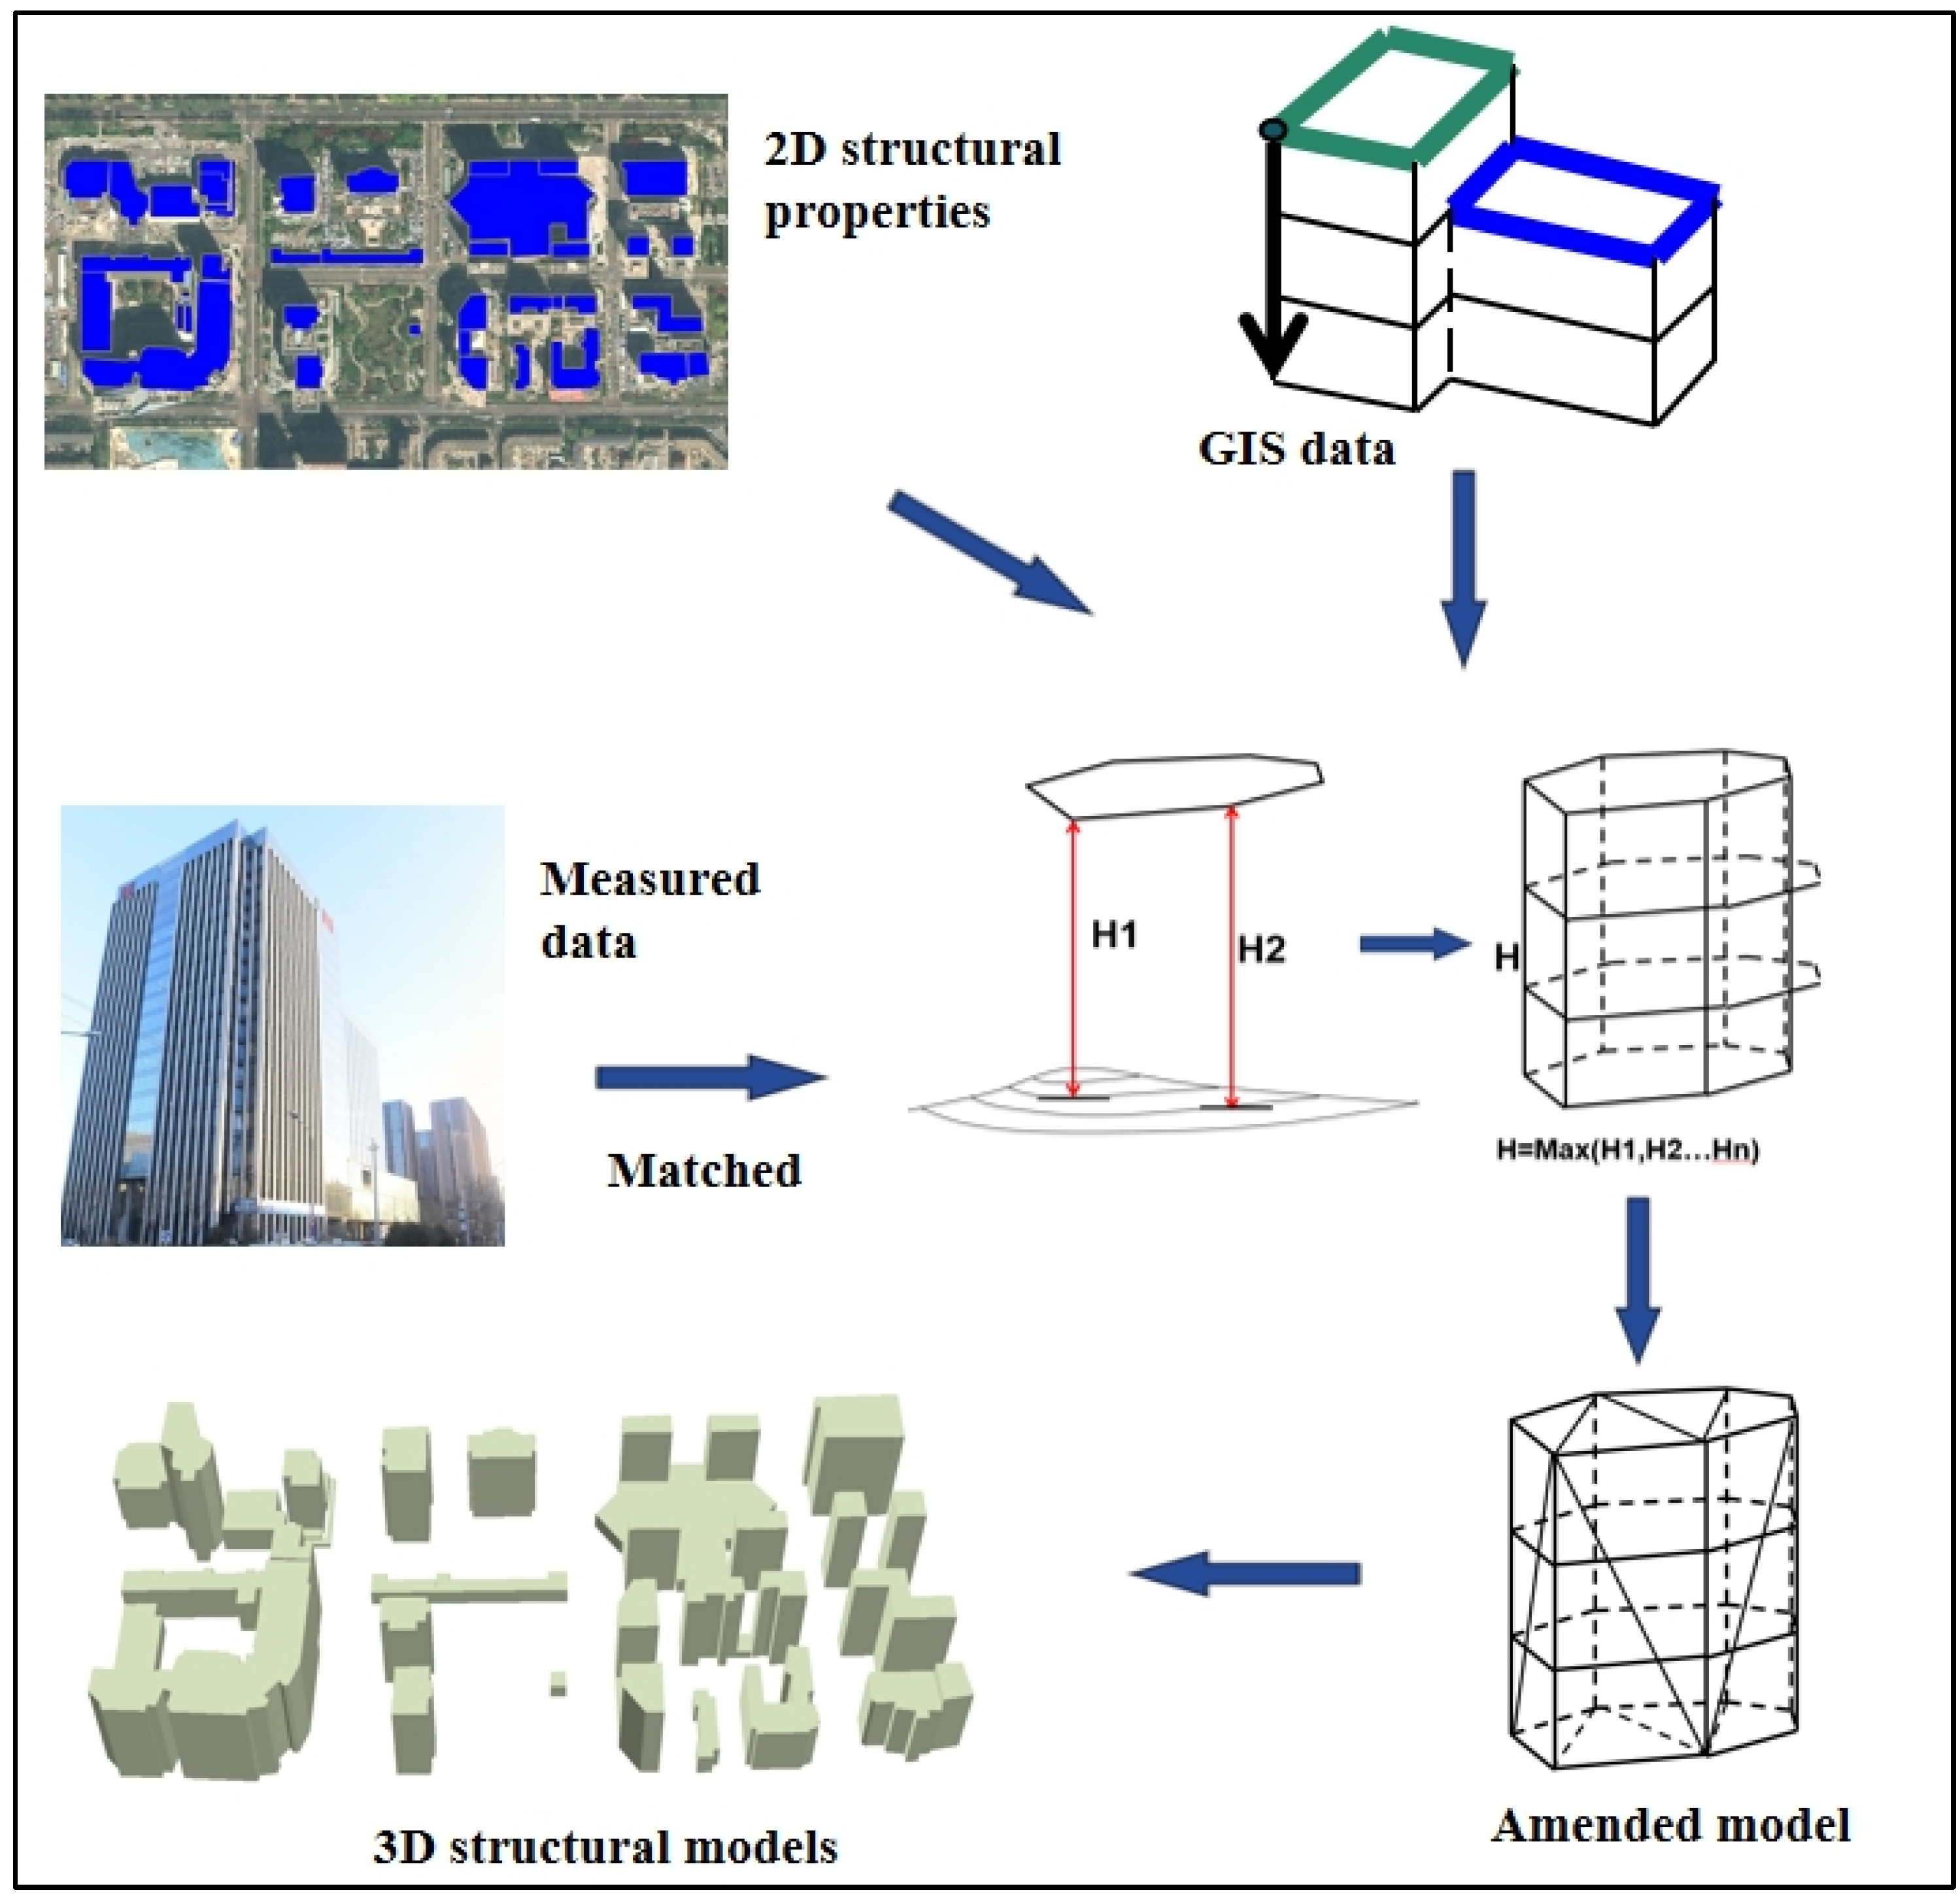
Figure 2 illustrates the method used to construct the 3D model used to visualize the results of the regional seismic simulation. The steps involved in the 3D model construction are described below. (1) The subsurface 2D structural properties were identified using borehole and soil layer data. The amplification effect of the basin was clarified, and a preliminary model of soil layer effects for the earthquake simulation was constructed. (2) Based on the data extraction technologies used in Google Earth and web images to obtain GIS attribution data, such as structural shapes and height, combined with the structural interlayer shear-displacement model [
12] and parameter calibration method, [
13] a 3D numerical model was constructed. (3) The measured data, including the types of structure and ages obtained from structural drawings, site surveys, street views, and remote sensing images, were matched to assign building attributes to each 3D model. Finally, the building attributes, GIS data, and polygon data were stored in a structural database, in which each 3D building model was included.
1.2. Structural Vibration Monitoring and Seismic Response Calculations
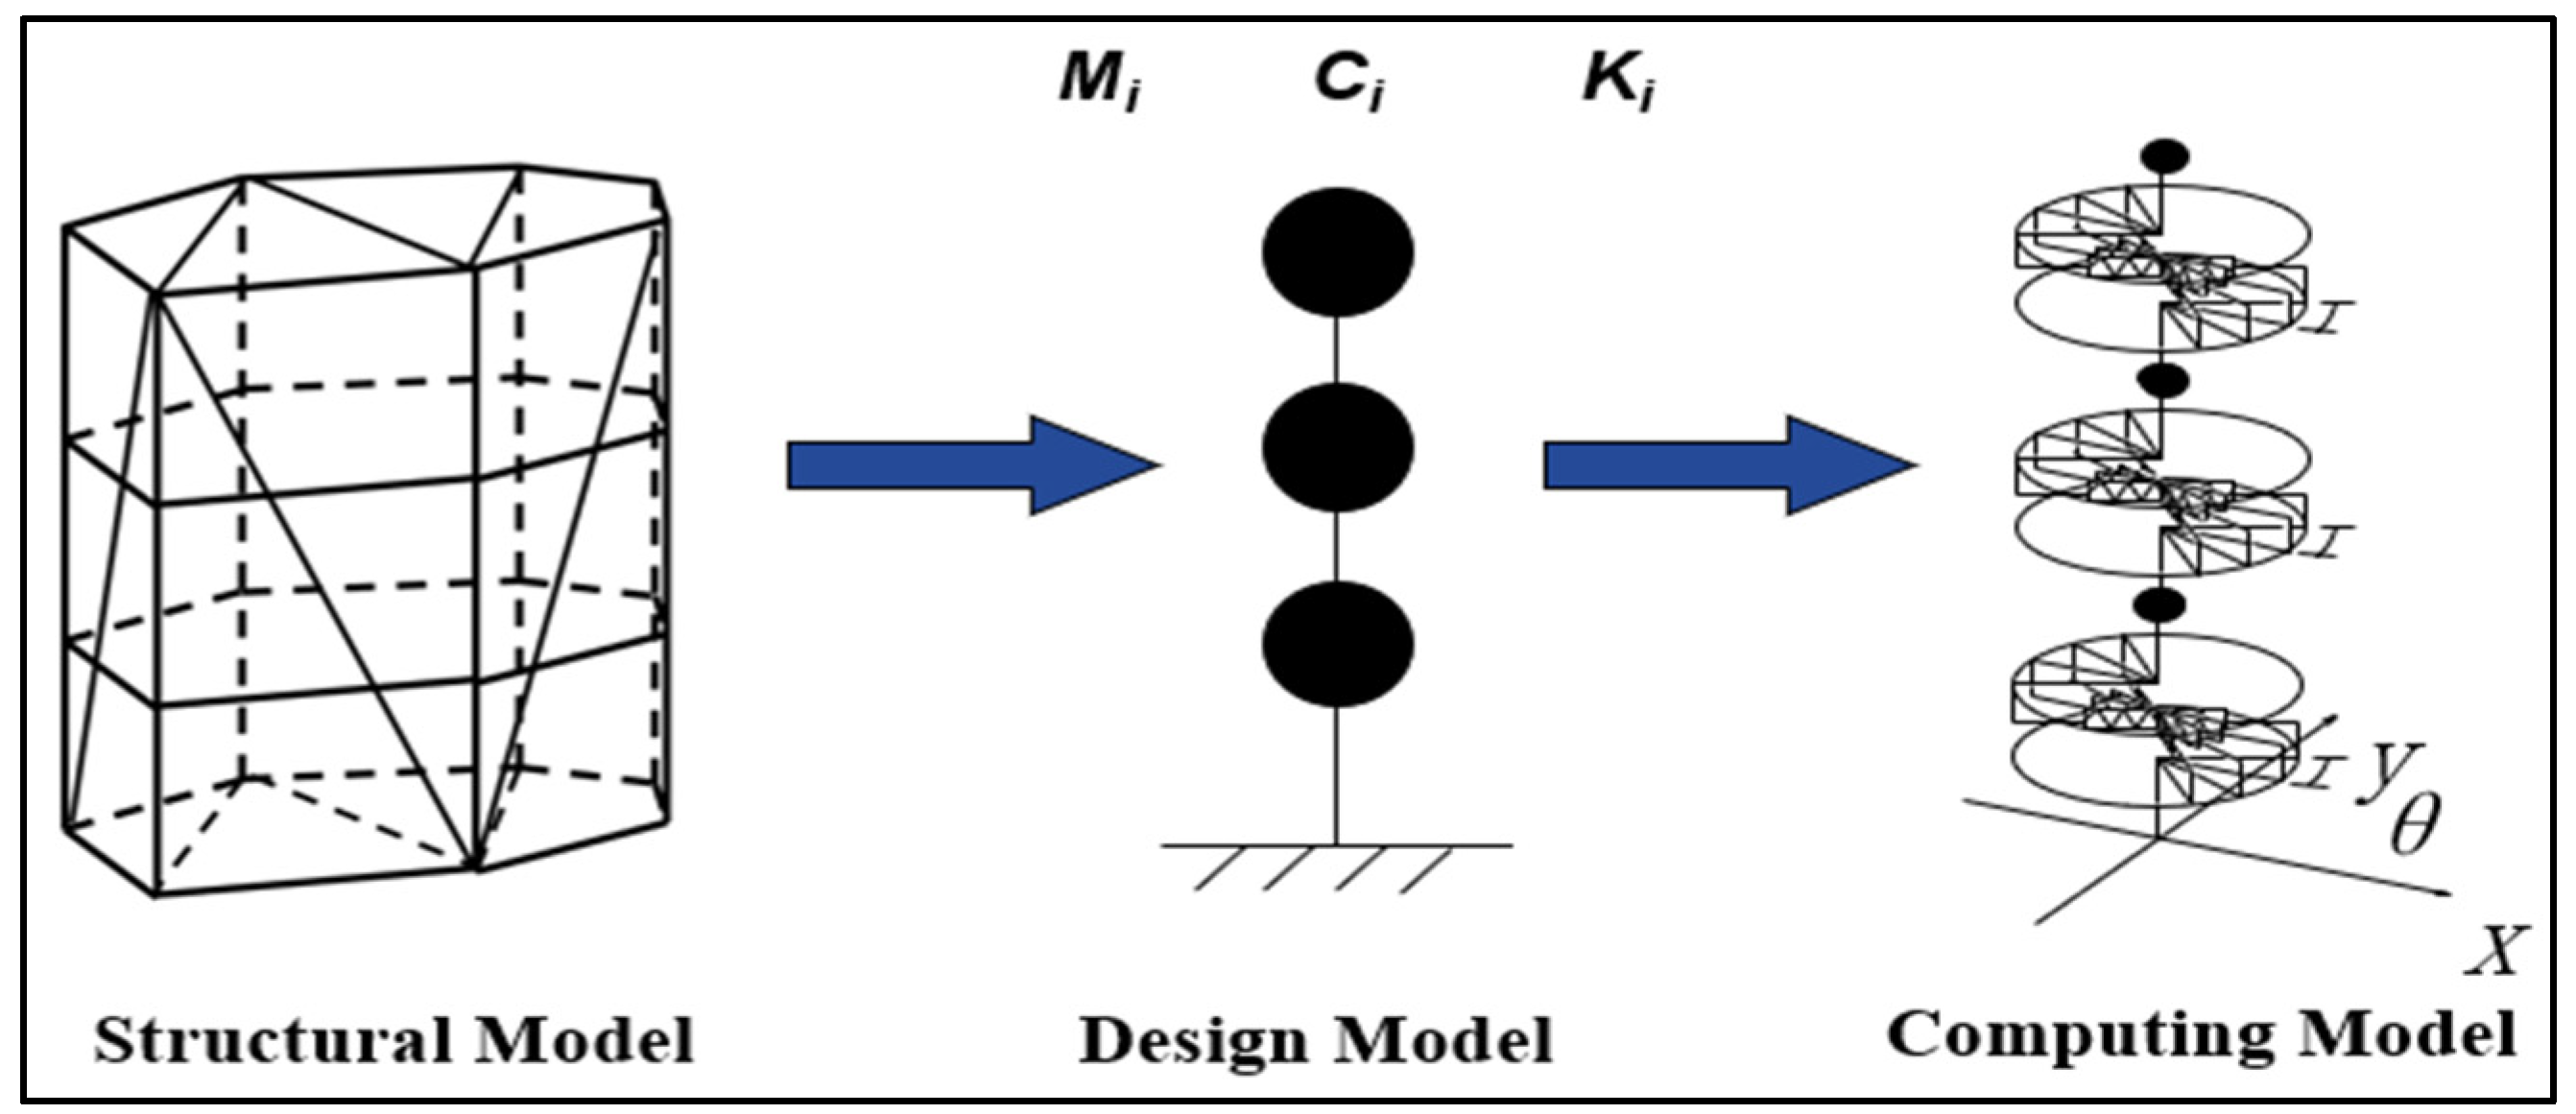
(1) The structure was simulated using a simplified multi-DOF shear model, [
11] and the mass points were connected by rigid rods and orthogonal horizontal springs simulated using two NodeLink with stiffness K
i, as shown in
Figure 3. The structural period and mass were derived from the height and floor area, respectively, and the inter-story stiffness was then calculated. The ultimate force was estimated by combining it with the China earthquake-response spectrum, and a shear model containing mass, strength, and stiffness parameters was constructed [
14]. (2) The natural structural characteristics were calculated using monitoring records provided by an established structural monitoring system, and the numerical models were modified by being compared with the natural period. (3) Real-time ground motions were input into the numerical models, and the structural elastoplastic analysis was conducted by combining the nonlinear incremental method of MDOF and Newmark-Beta numerical algorithm, as shown in Equations (1)–(4). The simulation of the earthquake resilience and safety state of structures were determined from the calculated damage parameters, such as acceleration, displacement, and story drift.
where [
M], [C], and [K] correspond to the matrix of mass, damping, and stiffness, respectively.
,
, and
mean the increment of acceleration, velocity, and displacement in
based on
,
, and
at
n moments, respectively.
is the increment in ground acceleration,
is a constant, whose values are between 0 and 0.25.
1.3. Regional Earthquake Simulation and Visualization
Earthquakes were simulated using the MODF model-analysis program to analyze the nonlinear time history of regional structures and obtain the seismic response for each floor. In this study, the real-time ground motions generated by the structural monitoring system were input into an urban earthquake disaster simulation system, [
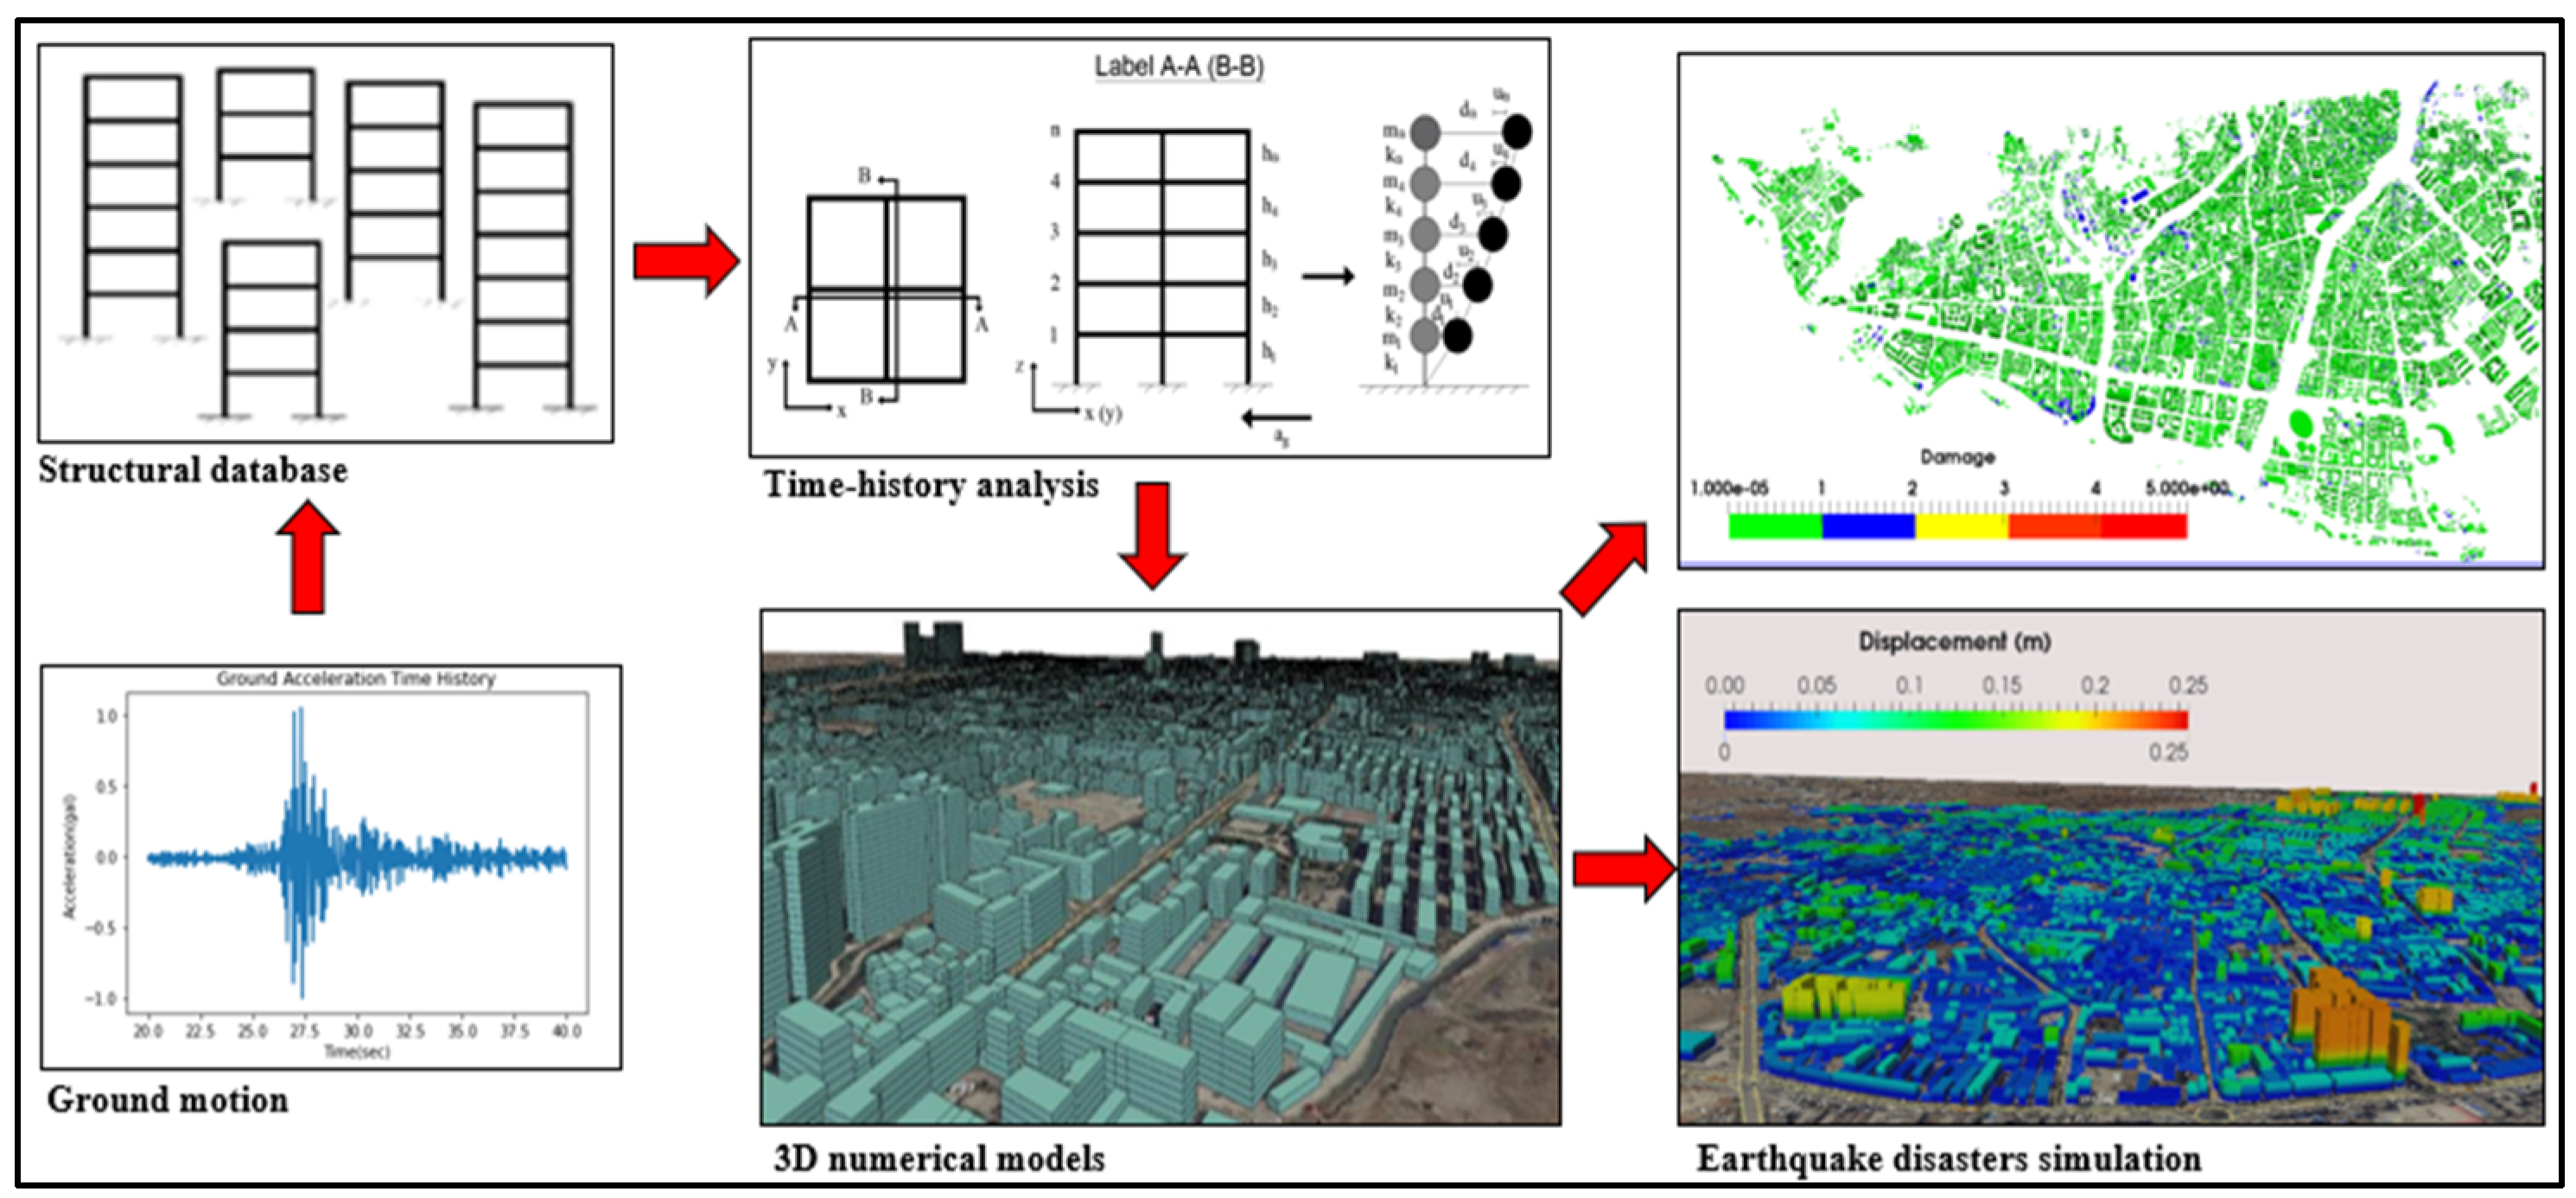
1] and the results of the structural elastoplastic calculation were integrated with the structural database to calculate the damage index. Based on the statistical results of the seismic response, the prediction of the regional structural damage was simulated for different earthquakes. Additionally, the predicted damage was imported into the corresponding 3D models to represent the earthquake disasters of urban buildings. ParaView was used to render 3D buildings with different colors to visualize the seismic disaster levels.
Figure 4 illustrates the calculated route for the seismic disaster simulation on an urban scale.
2. Structural Modeling and Seismic Resilience Analysis
To verify the feasibility and reasonability of the nearby real-time simulation method of regional earthquakes based on structural monitoring, a building where the structural monitoring system had been deployed was selected for constructing the finite element model. Using the results of the structural dynamic analysis from actual monitoring records to update the computational model, the structural earthquake resilience was analyzed.
2.1. Structural Real-Time Monitoring
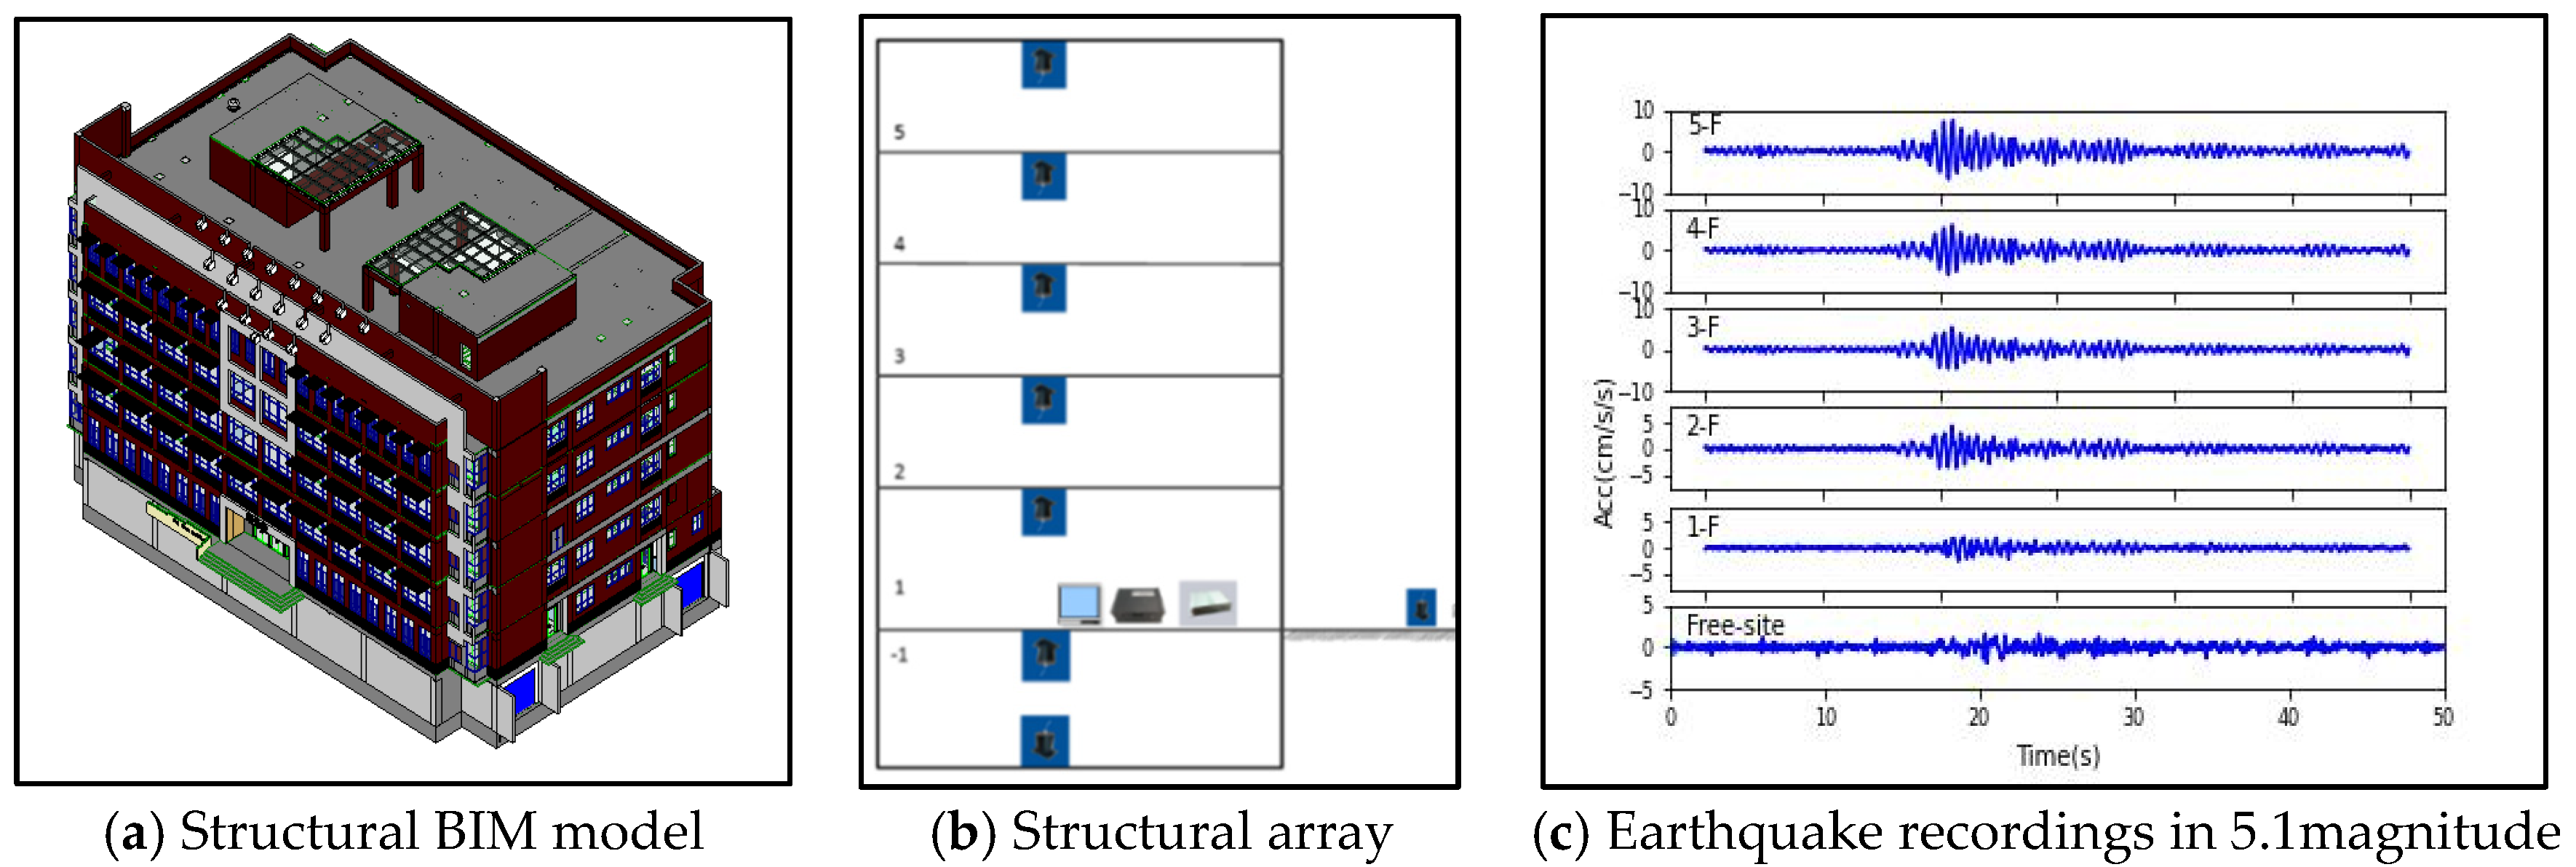
The structure used in this study is a building in Beijing Secondary School, which is a key building facility for daily teaching. This is a regular reinforced-concrete frame structure with a 4.2 m-high standard floor and total height of 23.1 m. The Building Information Modeling (BIM) shown in
Figure 5a was constructed according to architectural drawings and measurements, which provide essential conditions for the seismic resilience simulation using the complete information of structural and non-structural members. Based on the principles and requirements of the installation design, the structural monitoring system shown in
Figure 5b was built to collect earthquake records. 3D accelerometers were arranged on each floor (including the basement) and on the ground of a free site outside the building. Subsequently, several earthquakes were recorded by the monitoring system, including the 3.6 magnitude Beijing earthquake on May 26, 2020, 5.1 magnitude and 4.3 magnitude Tangshan earthquakes on July 22, 2020 and December 5, 2019, respectively. The recordings of the earthquake with 5.1 magnitude are illustrated in
Figure 5c.
2.2. Structural Modeling and Updating
OpenSees is a software framework for developing applications for simulating the performance of structural and geotechnical systems subjected to earthquakes and has the powerful function of nonlinear numerical simulations. A teaching building-deployed monitoring system was selected for refined modeling using OpenSees, in which the beam and column members were calculated by nonlinear units. The in-plane and out-of-plane stiffnesses of each floor were simulated by truss units and T-beam sections, respectively. The mode directions and natural periods were derived from a structural modal analysis.
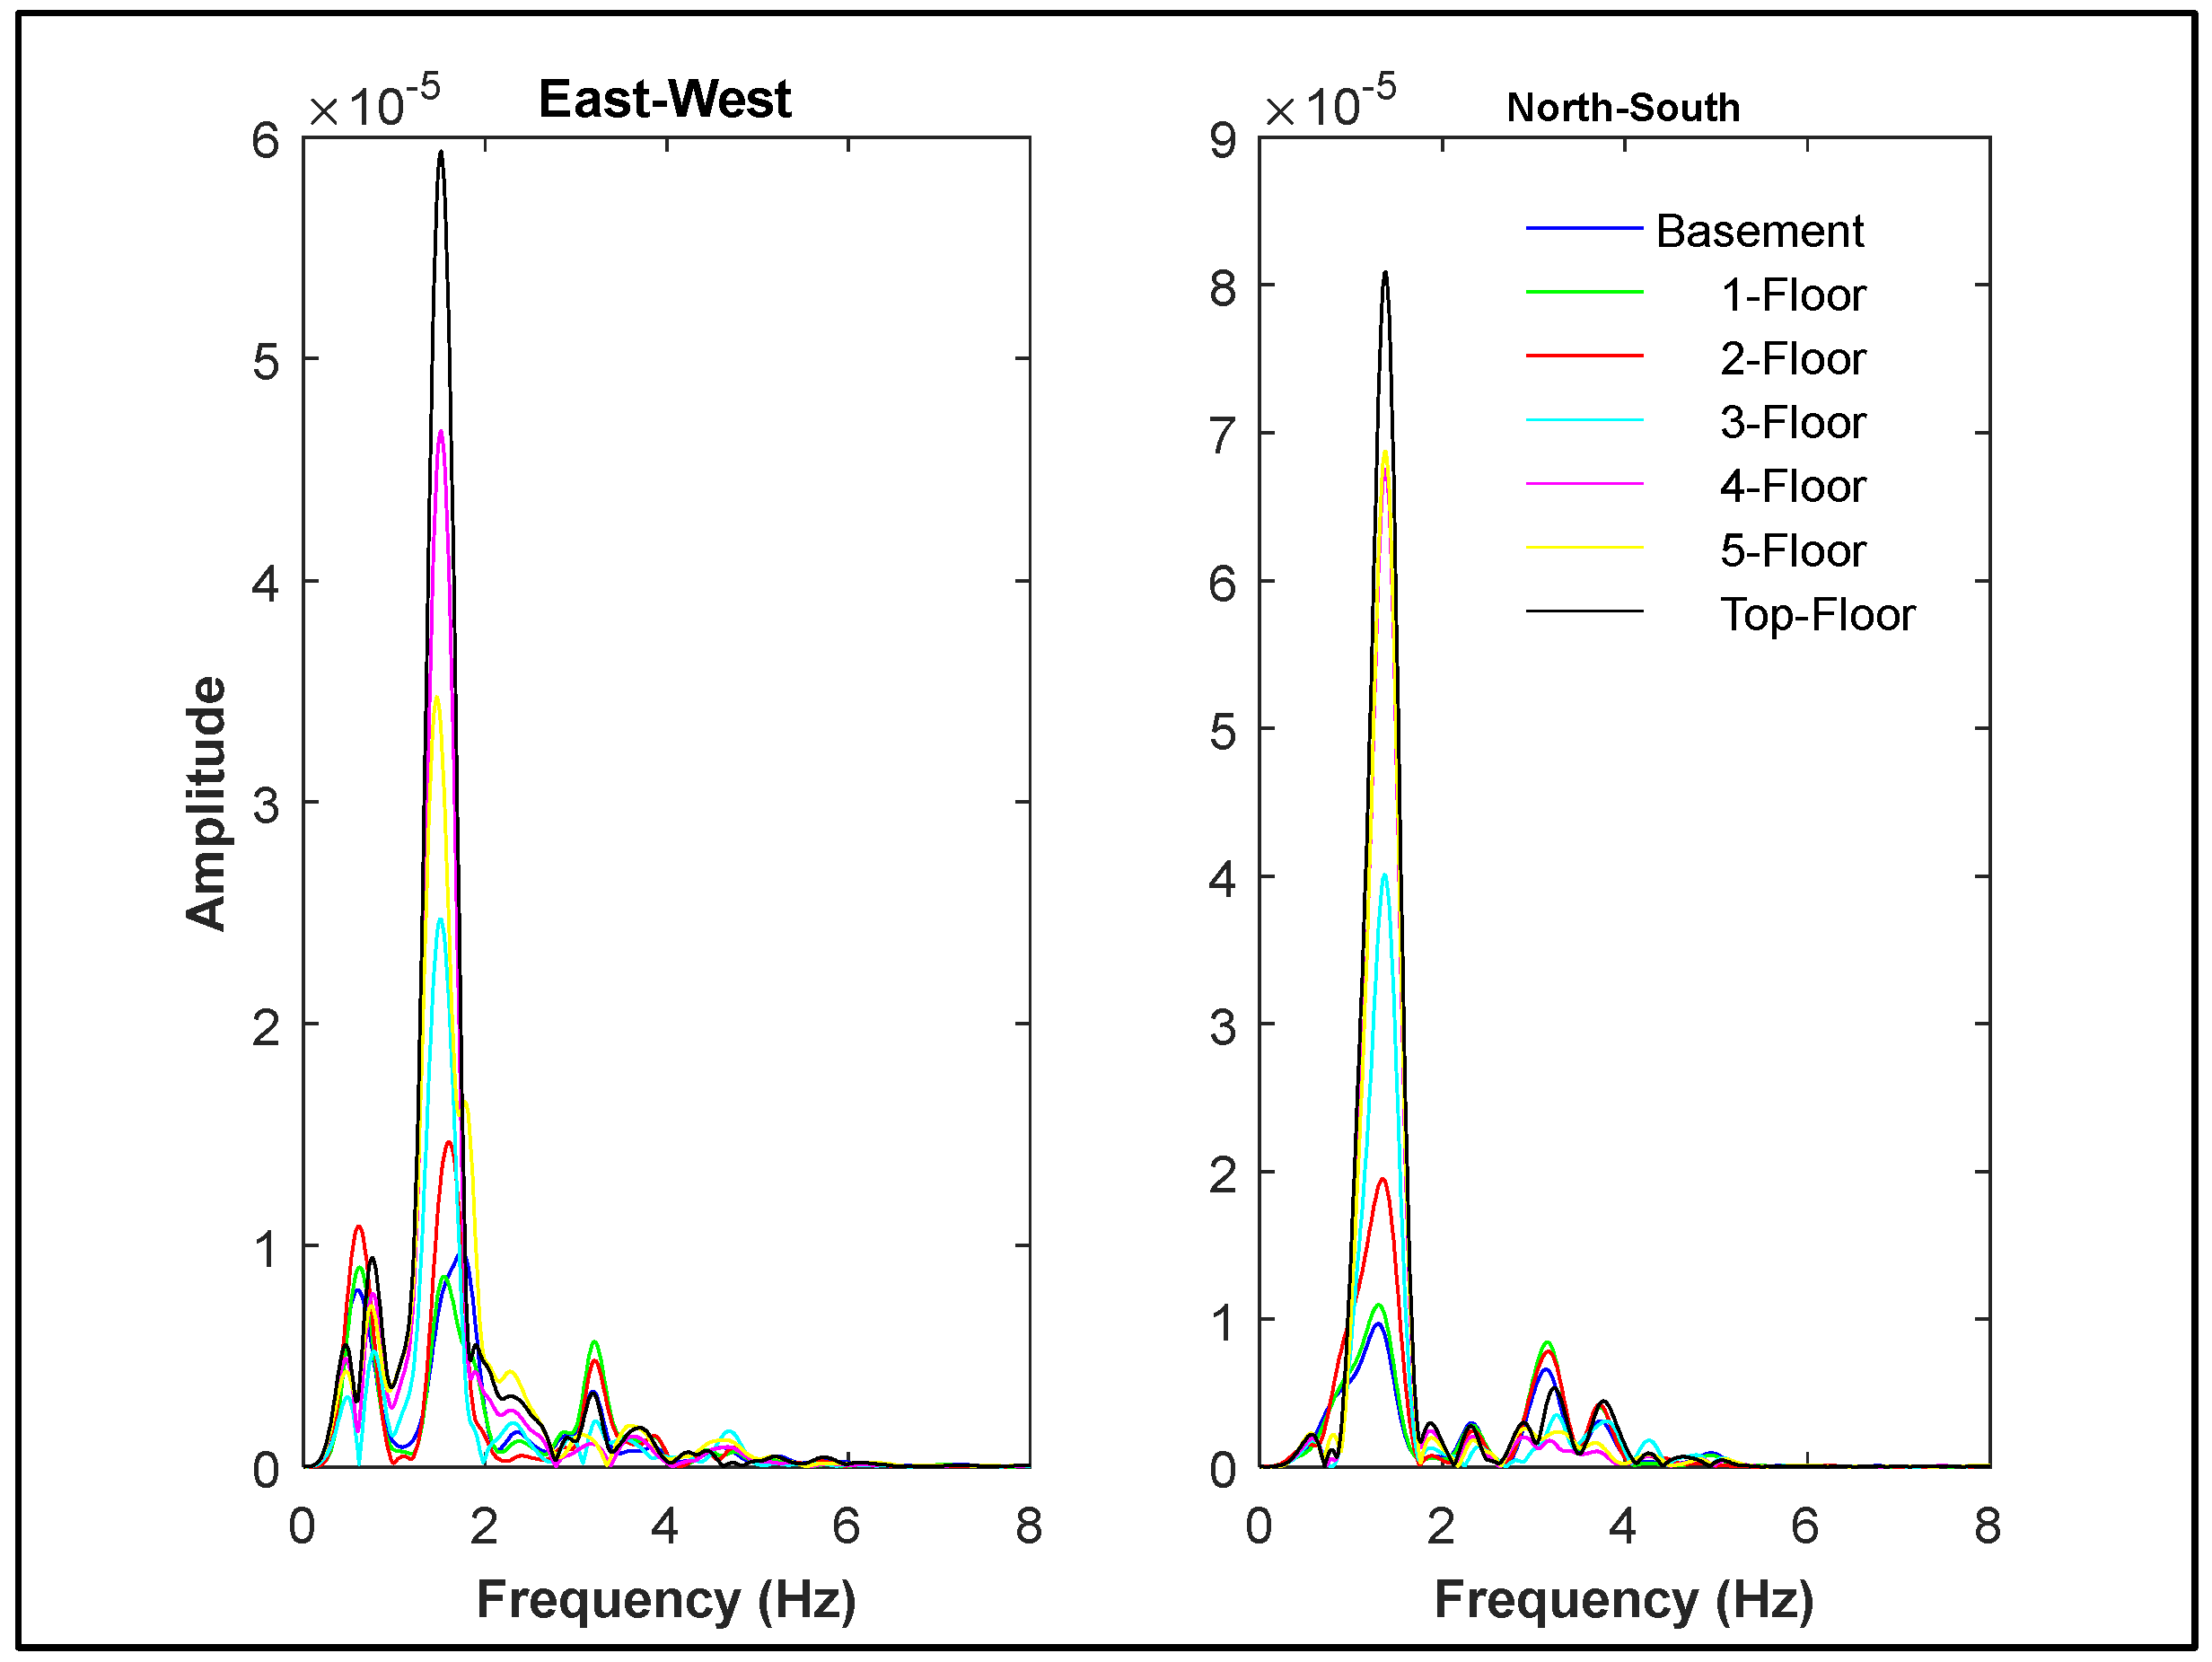
The floor accelerations recorded during the 5.1 magnitude Tangshan earthquake were selected to the excellent frequency of structure, Perform cross power spectrum analysis between the acceleration records of each floor and the acceleration records of the underground floor to obtain the structural transfer functions in the east-west and north-south directions, as shown in
Figure 6. The frequency corresponding to the maximum amplitude is the dominant frequency of the structure. The calculated dominant frequency in the east-west direction is 1.53 Hz, and the dominant frequency in the north-south direction is 1.52 Hz. The structure has a balanced shape, and there is not much difference between the dominant frequencies in the east-west and north-south directions.
Based on the structural finite element foundation model, structural modal analysis was carried out to obtain the simulation results of the first four vibration modes and natural vibration periods of the structure. Based on the aforementioned seismic records, structural system identification was carried out, and the identified natural vibration periods of the structure are shown in the fourth column of
Table 1 [
15]
. By adjusting the mass stiffness coefficient of the structural model, the structural model is continuously updated until the simulated period value gradually matches the identified period value, as shown in the third column of
Table 1. At this point, the natural vibration periods in the X and Y directions of the structure are similar to the measured results, with a comparison error of less than 5%, which can prove that the structural model is in good agreement with the solid structure. Based on this model, response prediction analysis of the solid structure can be carried out.
2.3. Seismic Resilience Simulation of a Single Structure
Building losses mainly comprise structural and functional losses. Structural losses can be determined by story drift, and functional losses are normally obtained by damage to non-structural components [
16]. El Centro waves were used to replace real-time recordings because of the small peak of accelerations recorded in the monitoring system, in which the maximal acceleration was calibrated to 400 cm/s
2 (rare earthquake) for structural elastoplastic analysis. Structural losses were neglected based on the standard limitations of the story drifts calculated in
Table 2. The function of a building is primarily affected by two types of non-structural components: the ceiling and infilled walls. Therefore, the prediction of functional losses containing the abovementioned types is considered. The loss ratios and probabilities of fast and difficult repairs were computed based on the statistical fragility curves of the ceiling [
17] and infilled wall [
18], respectively. The functional losses and building resilience were derived from Equations (5) and (6), as shown in
Table 3. The results indicate that approximately 70% of structural functions are lost in rare earthquakes. The functional losses of the ceiling increased layer-by-layer until the top floor, whereas the functional losses of the infilled wall increased in the opposite direction, Which is consistent with the analysis results that conform to the general seismic damage characteristics of frame structures, where the main structure of the building is intact, and non structural components such as ceilings and infill walls are severely damaged [
19].
where
and
correspond to the expected values of ceiling and infilled wall in j
th floor, respectively.
and
are the loss ratios of ceiling and infilled wall in the i
th damage state, respectively.
is the probability of the ceiling in the i
th damage state for a given PFA.
is the probability of infilled wall in the i
th damage state for a given IDA.
3. Regional Earthquake Simulation Based on Structural Monitoring
A structure and the surrounding area in 1500 × 1500 m2, where a real-time monitoring system was deployed were selected to verify the reliability of the proposed simulation method, and a reference for the application of the regional earthquake disaster prediction was provided. The nearby real-time seismic damages of regional structures were simulated based on real-time ground motions recorded in the 5.1 magnitude Tangshan earthquake and typical El Centro waves.
3.1. Urban Earthquake Simulation
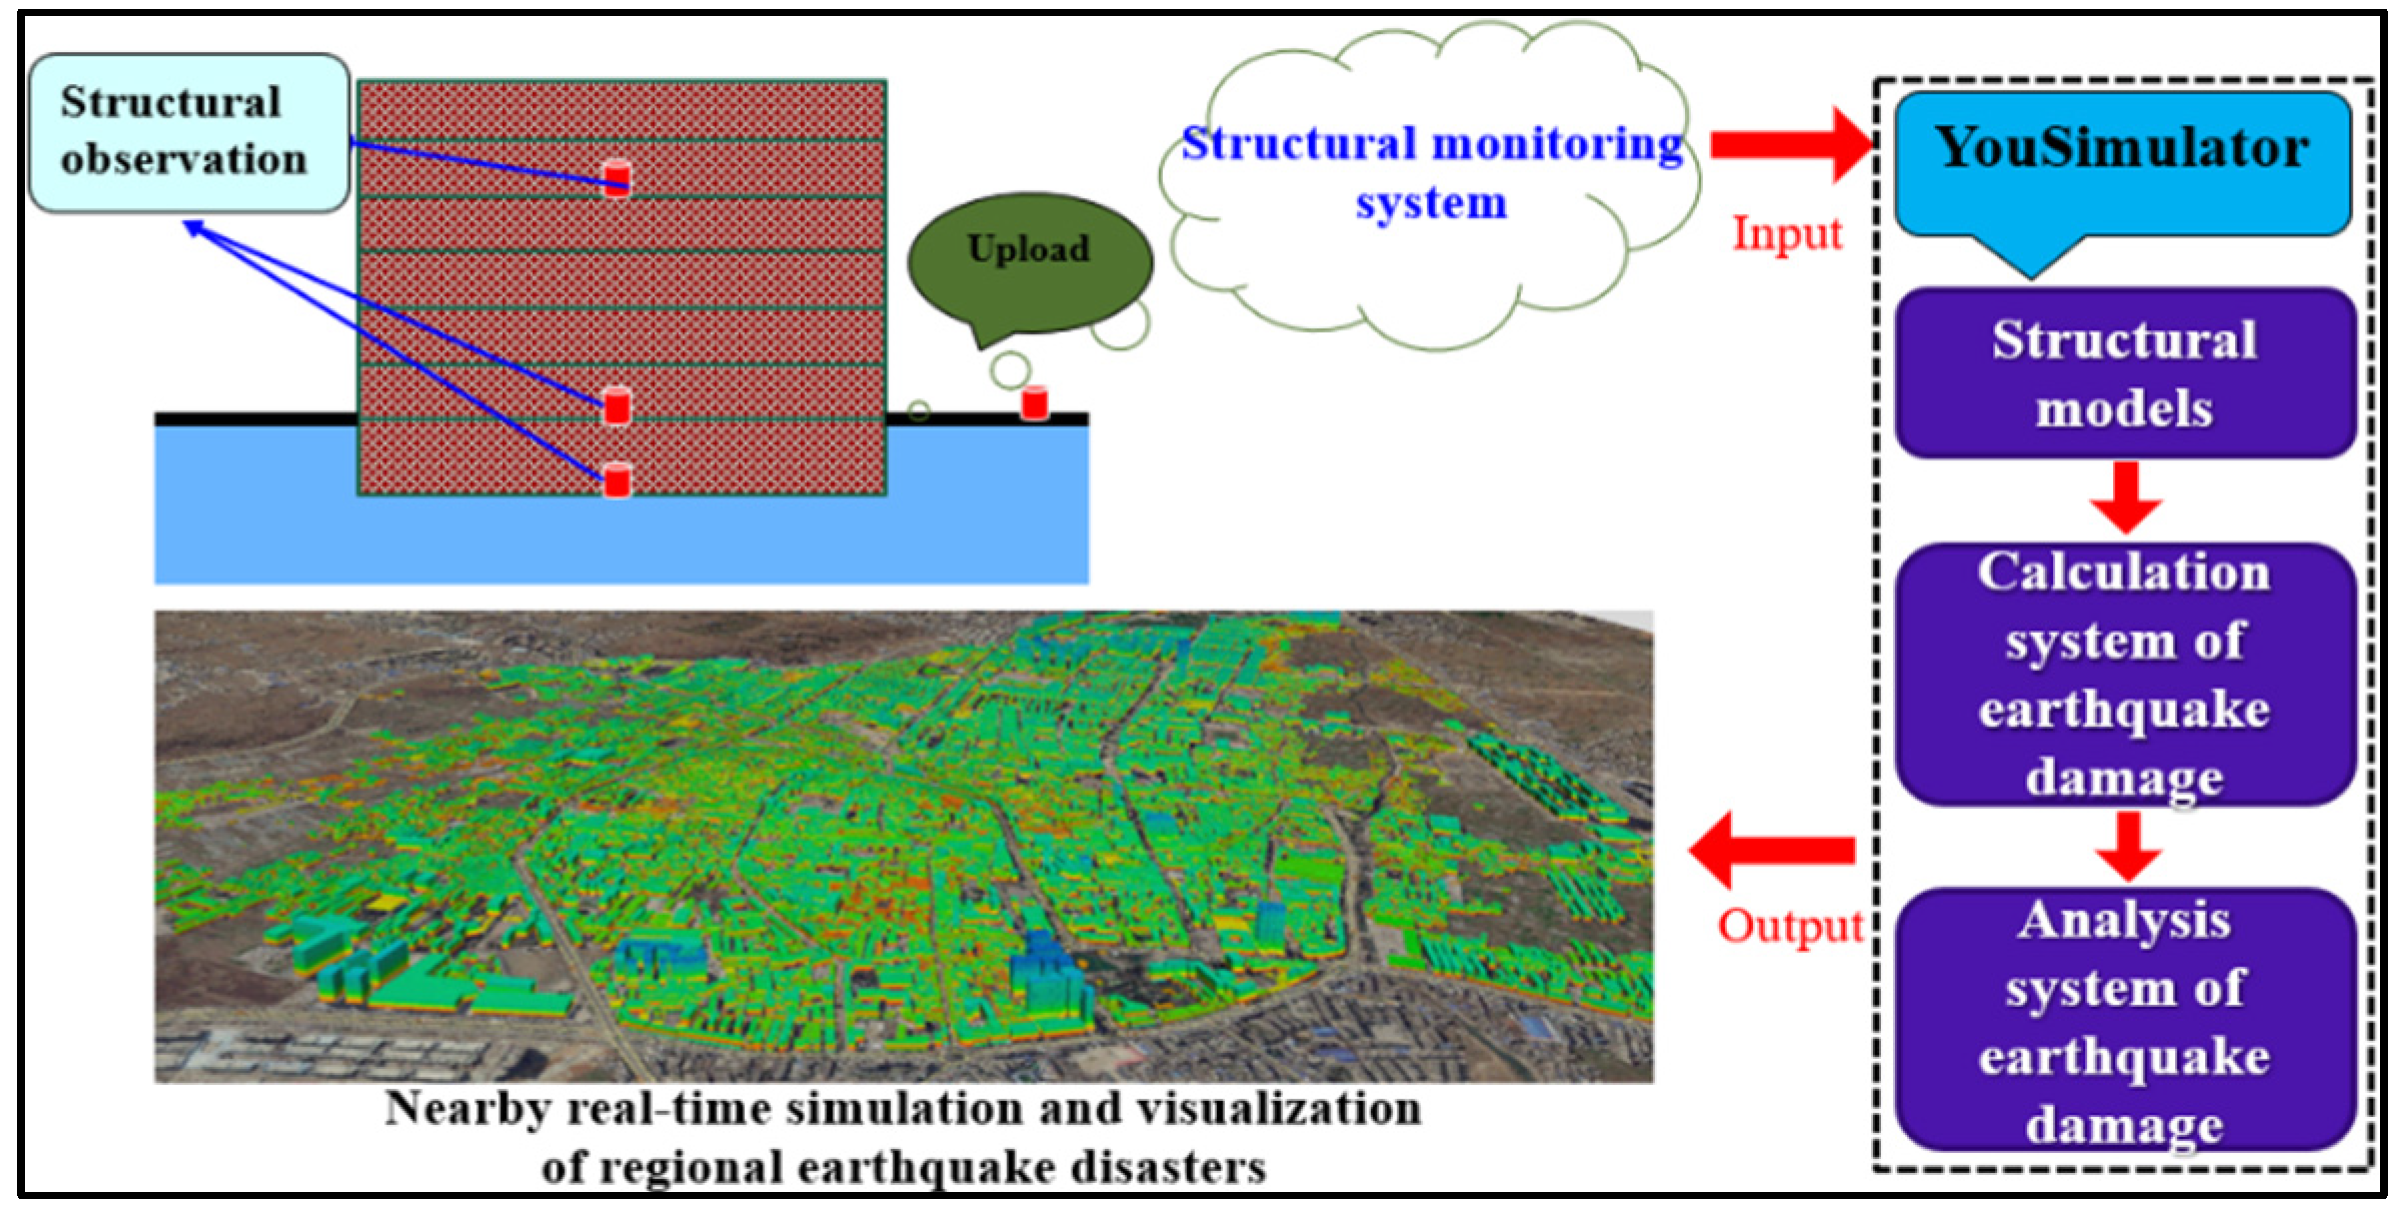
YouSimulator [
1], an urban earthquake simulation program, was developed by Lin to model, evaluate, and visualize the seismic behavior of cities based on the modern scalable simulation techniques of regional earthquakes [
14]. The simulation system was primarily developed using C++ code, which contains three modules for modeling, calculation, and analysis. Structural damages could be simulated quickly to clearly show the distribution of disasters on an urban scale and to further understand the mechanism of earthquake disasters. Recently, this platform was effectively applied to urban disaster simulations in Sichuan, Guangdong, and Tianjin. A new real-time monitoring module was added for exploration to optimize the numerical models and improve the accuracy of earthquake simulations.
Figure 7 shows a detailed flowchart of the technical process for nearby real-time earthquake disaster simulations.
3.2. Regional Modeling of Structures
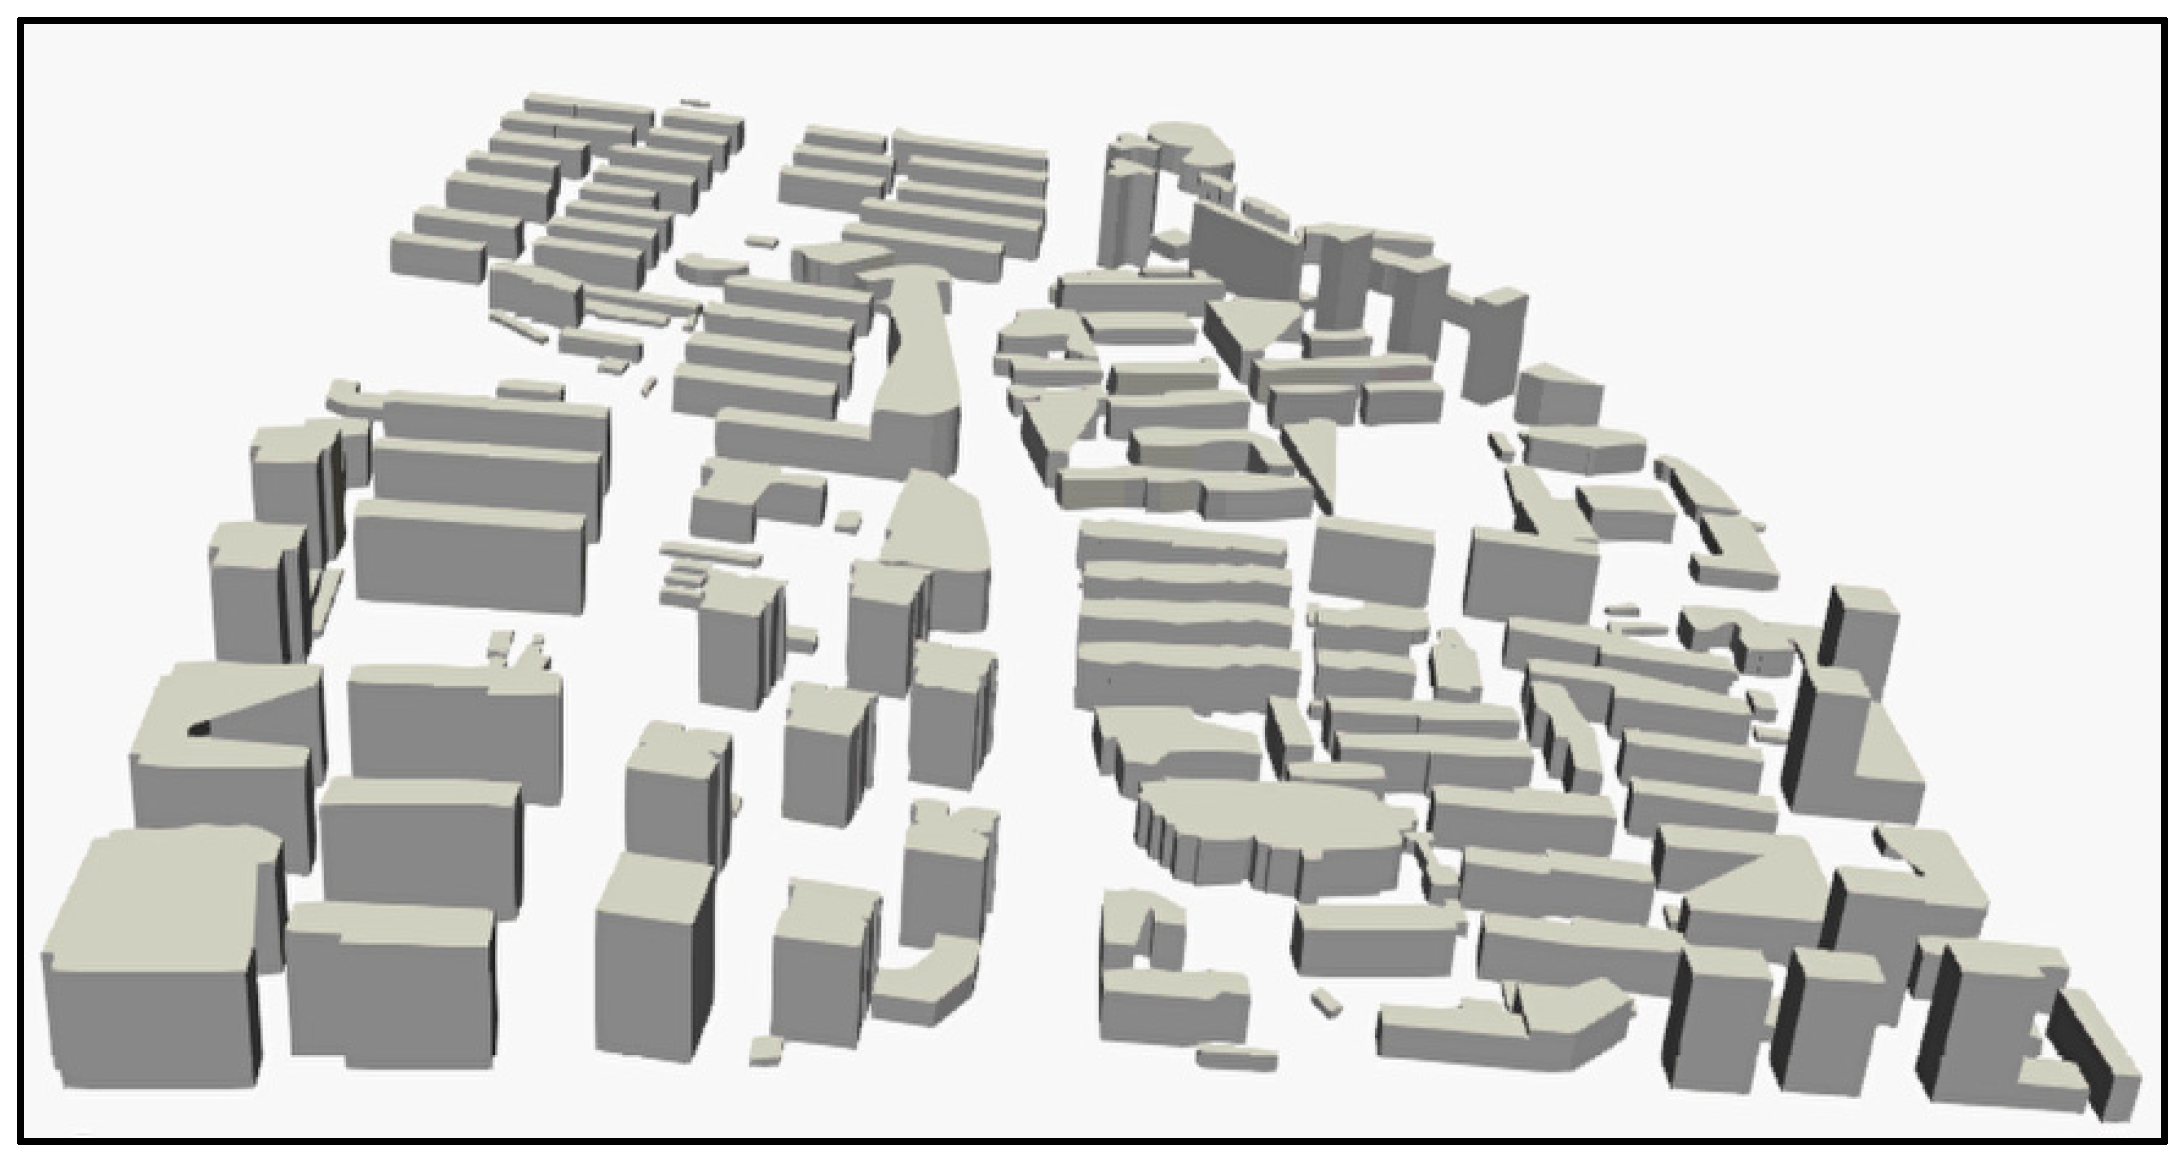
A structural database was used to establish the datasets of 216 numerical models, in which the proportions of structural types were 2.4%, 44%, 42%, and 11.6%, corresponding to steel, RC frames, resistant masonry, and non-resistant structures, respectively. The distribution of the types that mainly contain RC frames and resistant masonry structures is an obvious characteristic of large cities, indicating a rationalized selection for application. ParaView is the world’s leading open-source post-processing visualization platform that can interactively analyze extremely large 3D datasets [
20,
21,
22]. The datasets of the 216 numerical models modified according to the structural updating method were input into the urban earthquake simulation system to generate text for the 3D model, which can be visualized using ParaView, as shown in
Figure 8.
3.3. Regional Seismic Damage Simulation
3.3.1. Ground Motion Selection
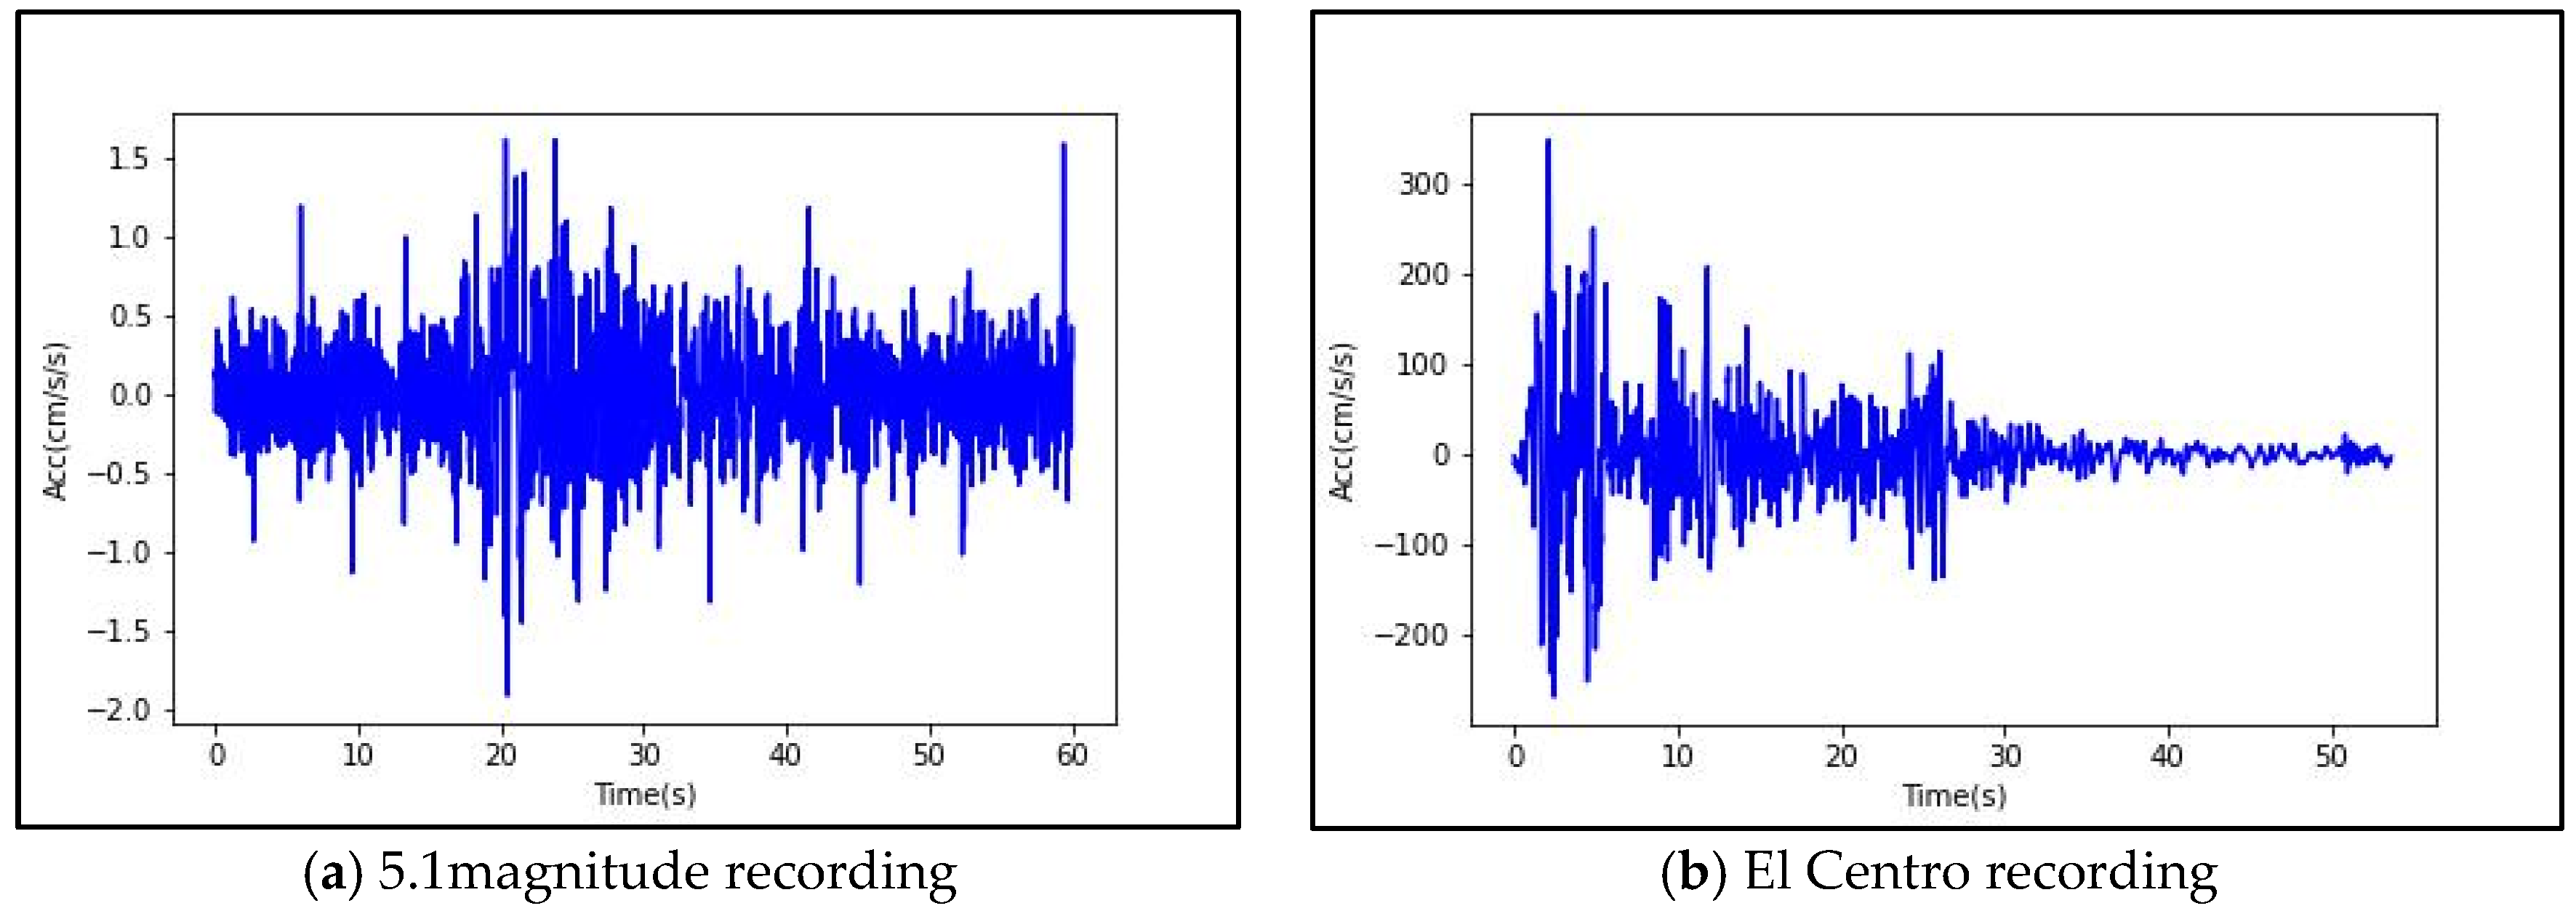
A 5.1 magnitude earthquake occurred in Tangshan at 6:38 AM, July 12, 2020, which elicited strong responses in Beijing. The epicenter was approximately 150 km from the monitored building, and the real-time monitoring data shown in
Figure 5c were recorded by sensors. The peak ground acceleration of the recorded free-site to top-floor accelerations were approximately 1.8 and 7.8 cm/s
2, respectively. The records located at the free site, shown in
Figure 9a, were selected as the input ground motions for the regional structural simulation. Small ground motions do not cause nonlinear deformations. Therefore, the typical El Centro waves shown in
Figure 9b were applied as other ground motions to compare earthquake predictions at different levels. The earthquake motion with 7.1 magnitude was recorded by a strong motion seismograph in South California, which is the first intact record by humans. The peak ground acceleration reached 326 cm/s
2.
3.3.2. Simplified Principles of Structural Damage Estimation
Currently, the damage state of RC structures are determined by the combined limitations of force and displacement [
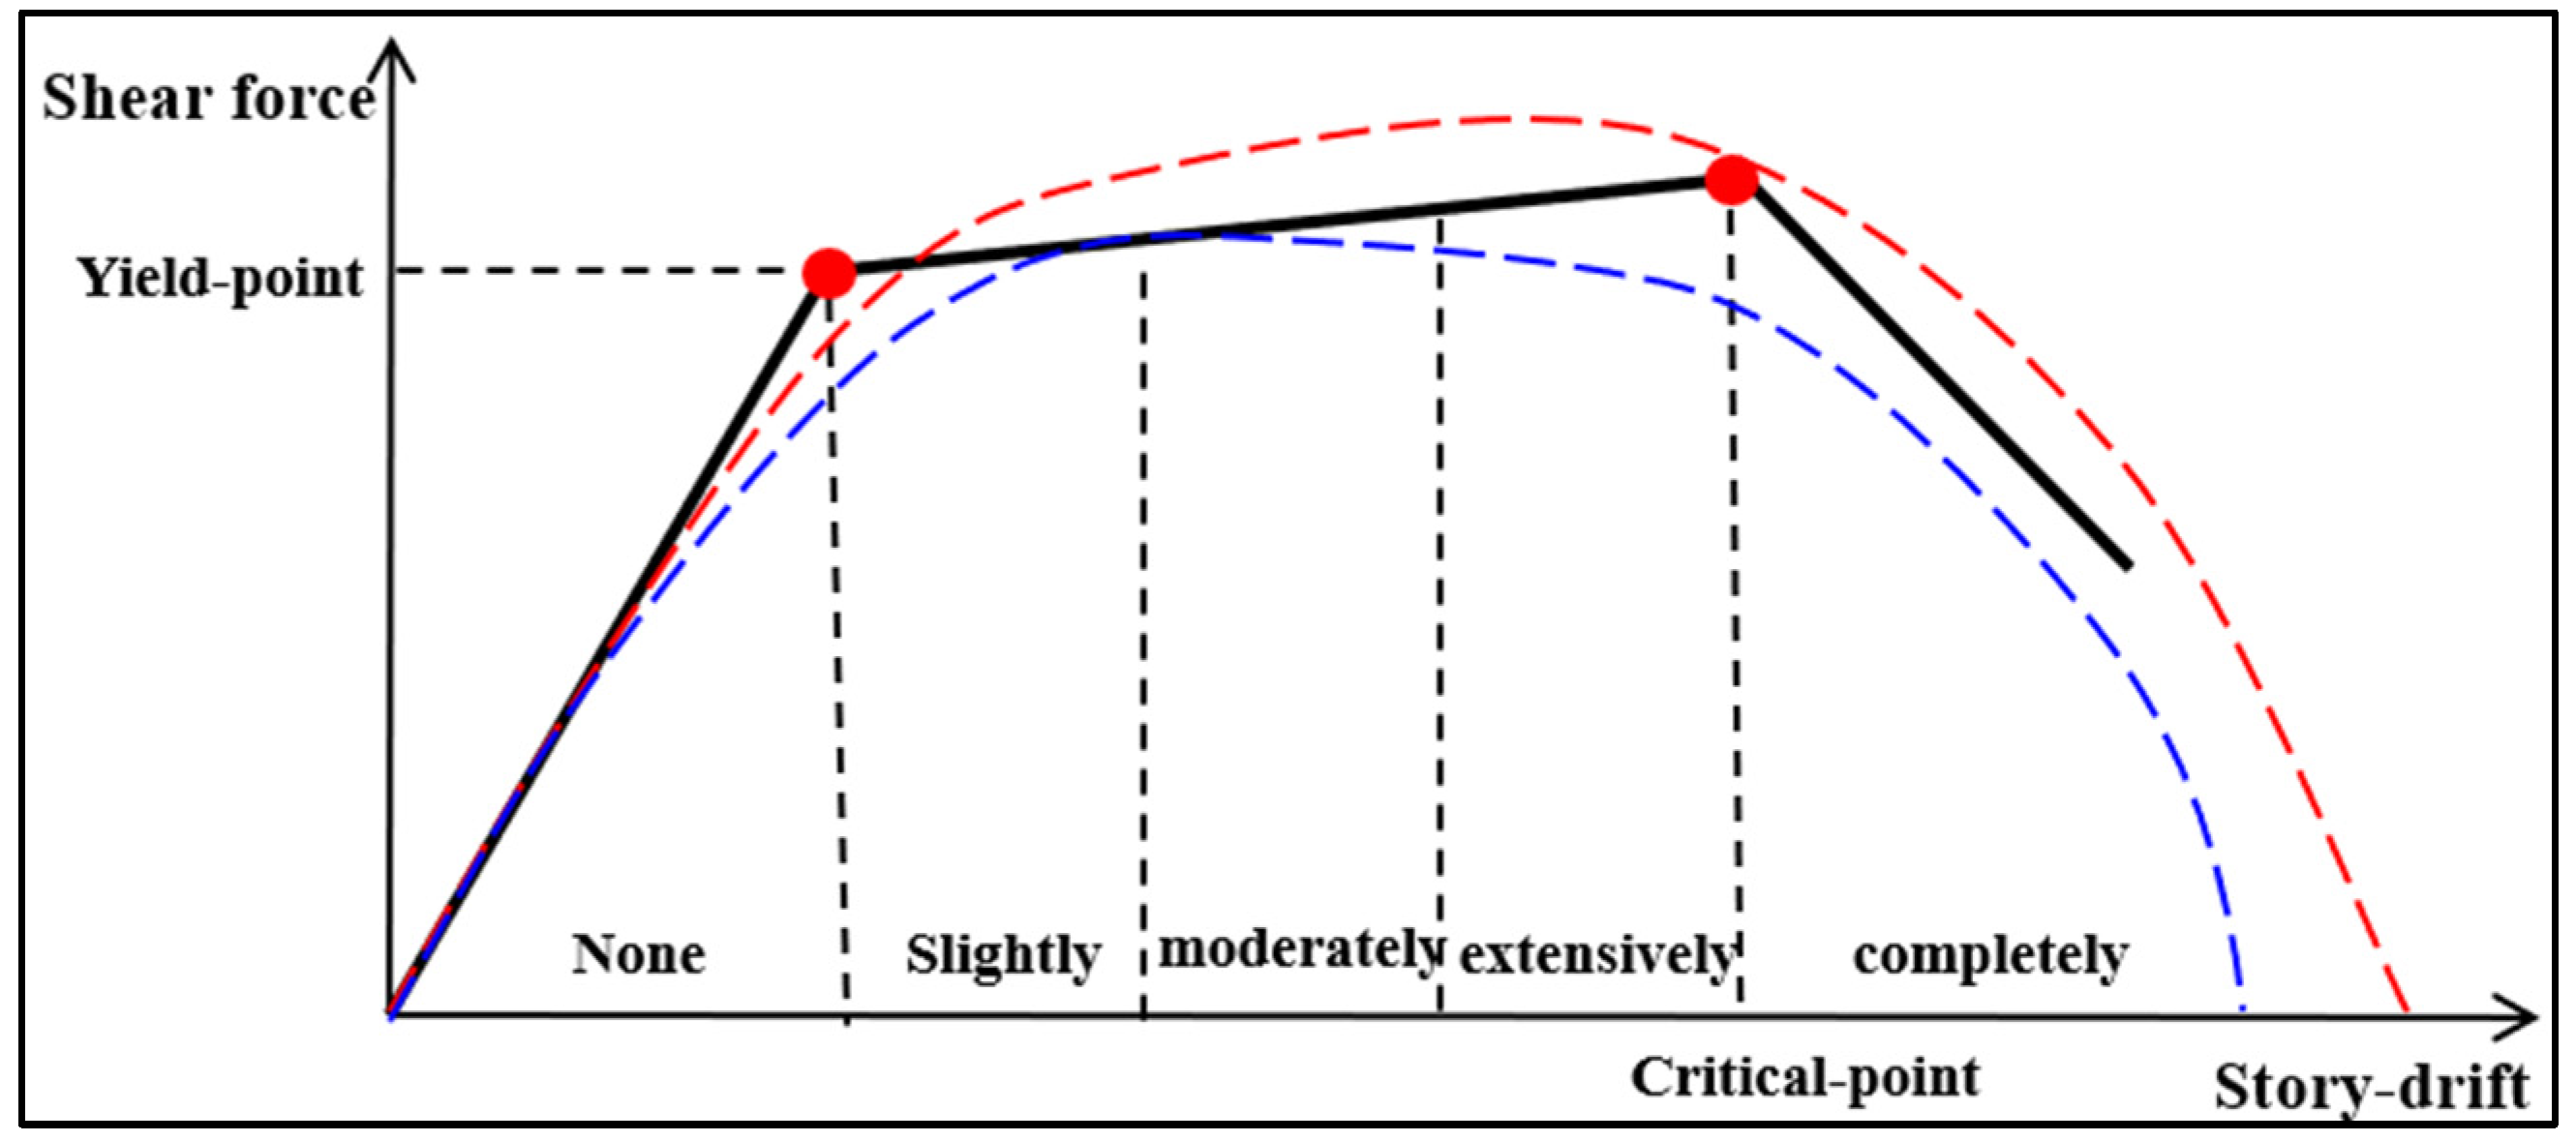
12]. A force-based damage limitation was used with a smaller displacement and larger stiffness, where a major shear force was caused by a minor deformation. A displacement-based damage limitation was inversely adopted. The accuracy of the structural damage discrimination was enhanced by the combination of the two damage limitations. As a simplified principle, the damage states of the structure were generated by the worst floors, which were divided into non-damaged, slightly damaged, moderately damaged, extensively damaged, and completely damaged floors, as shown in
Figure 10. The states of no and complete damage are classified into sections before the yield point and after the critical point, respectively, and the others are equalized between the two points. Owing to the damage index being effectively applied for structural disaster assessment for earthquakes, [
23] the damage indexes specified in “The Chinese seismic intensity scale” [
24] are defined for structural simulation, which corresponds to the damage states shown in
Table 4.
3.3.3. Regional Earthquake Simulation and Visualization
The damage parameters that contained story drift, yielding force, and displacement of the 216 buildings were computed based on two different levels of ground motion.
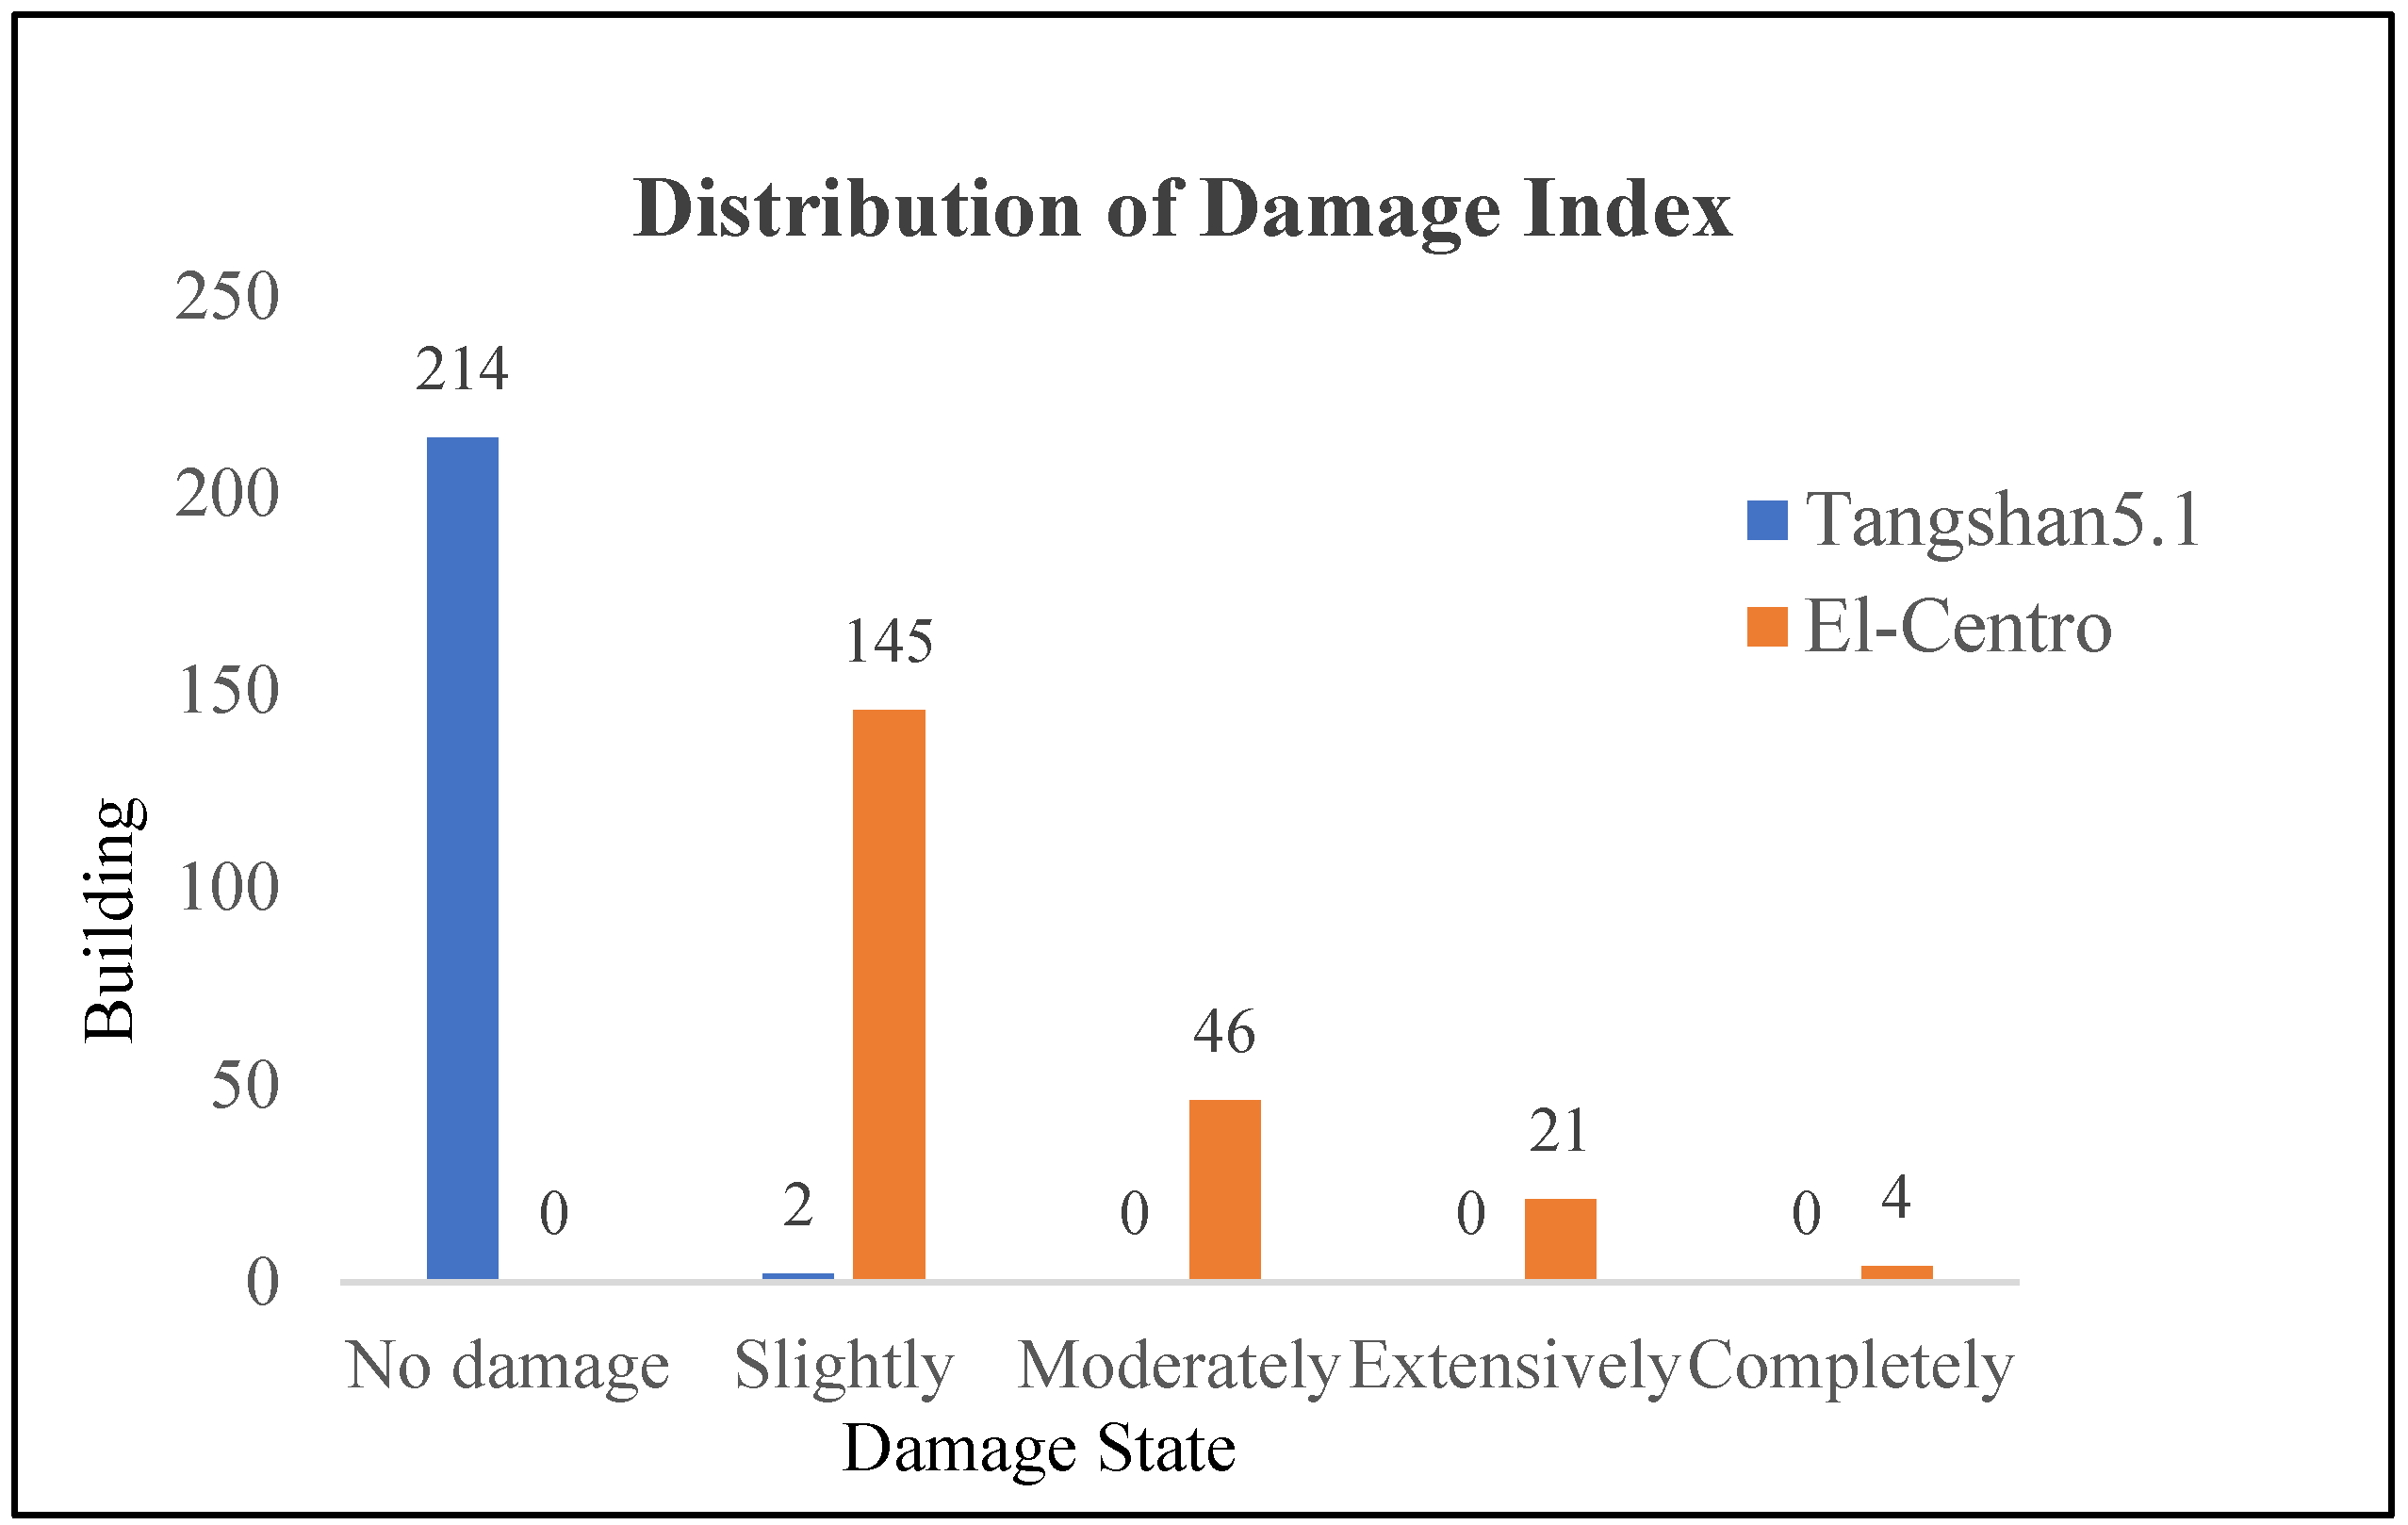
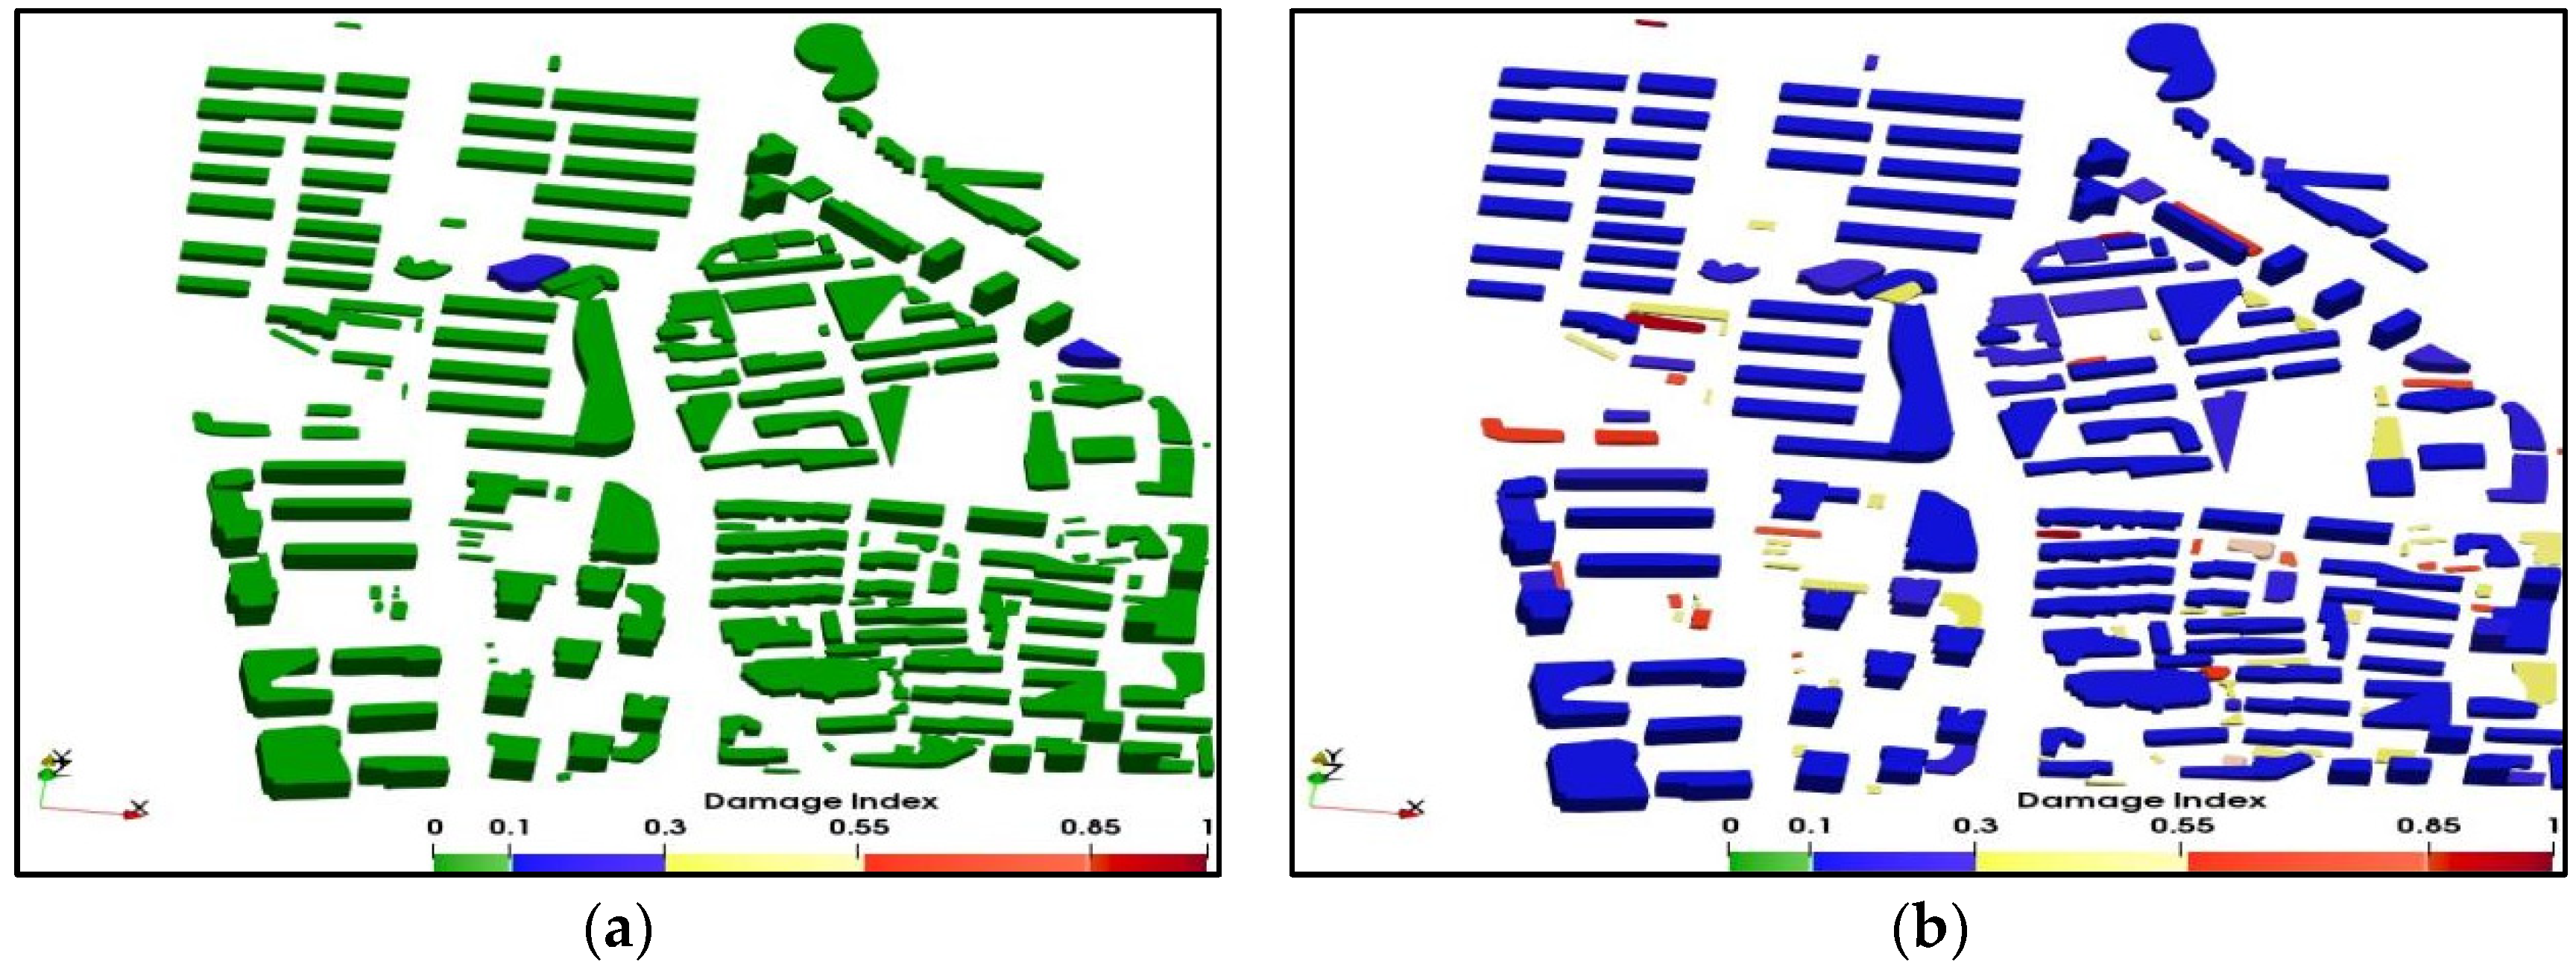
Figure 11 shows the distribution of the damage index, in which most structures were uniformly displayed at Tangshan earthquake and were differentially distributed under El Centro. The damage states of the 216 buildings were classified by the damage index, and their color clouds are indicated by green, blue, yellow, orange, and red. Finally, the color clouds of the levels were matched with the structural database to realize a 3D visualization of the regional earthquake simulation. The damage risk to each building was estimated, and the seismic behaviors of the buildings were investigated. A simulated map of regional seismic disasters at two different levels is shown in
Figure 12.
Figure 12a shows that most buildings were damage-free (defined as no damage), and only two structures presented minor damage (defined as slightly damaged), in accordance with the small ground motions of the Tangshan earthquake. The prediction results in
Figure 12b indicate that 145 buildings were neither damaged nor slightly damaged, 46 were moderately damaged, and 25 were extensively and completely damaged, corresponding to approximately 67.1%, 21.3%, and 11.6%, respectively. Particularly, non-resistant structures modeled as poor-quality unreinforced masonry buildings were all in a state of extensive or complete damage.
4. Conclusions
A nearby real-time simulation method for regional earthquakes was proposed based on the urban earthquake simulation. As an example, a structure-deployed monitoring system and 216 surrounding buildings were selected to predict regional earthquake damage to explore the feasibility of earthquake simulation on an urban scale. The main conclusions are as follows:
- (1)
A nearby real-time simulation method for regional earthquakes was proposed by adding a real-time monitoring module that contains the model construction of regional structures, structural vibration monitoring and seismic response calculation, and regional earthquake simulation and visualization to a simulation system.
- (2)
To verify the accuracy of the developed numerical models, real-time ground motions recorded in the 5.1 magnitude Tangshan earthquake by a monitoring system were utilized to calculate the structural natural characteristics. This updates and modifies the computing models, Make the calculation model more consistent with the actual building structure and the evaluation results reasonable.
- (3)
The El Centro waves were selected to replace real-time recordings owing to the small motions recorded in the monitoring system, and the maximal acceleration was calibrated to 400 cm/s2 for the structural seismic resilience analysis. The results showed that approximately 70% of the structural functions were lost during rare earthquakes, The analysis results conform to the general seismic damage characteristics of the frame structure, which states that the main structure of the building is intact and non structural components are severely damaged
- (4)
Numerical models of 216 buildings in 1500 × 1500 m2 were constructed by combining GIS and actual measured data. The data recorded during the Tangshan earthquake with 5.1 magnitude and typical El Centro waves were selected for inputting ground motions to analyze the structural seismic response. The damage indexes were computed based on story drifts and yielding forces. Combined with the simplified principles of structural damage estimation, the damage predictions of regional 216 buildings were simulated for different earthquake levels. Finally, the evaluation results were visualized in 3D using ParaView software.
The simulated results of earthquakes at the urban scale will promote the predictive abilities of local earthquake administration agencies and have great potential to provide essential information for emergency responses and regional disaster mitigation.
Acknowledgments
The research is supported by the Scientific Research Fund of Multi-Functional Shaking Tables Laboratory of Beijing University of Civil Engineering and Architecture, the Program of Science for Earthquake Resilience, and the General Program of Science and Technology Programs(Grant KT1626, No.XH23002A and No.BJMS-2024004, respectively). We are also grateful for the simulation platform provided by Professor Lin and his teams of IEM and installation conditions supported by authority of Beijing 19th Middle School for structural monitoring.
References
- Xuchuan Lin. Numerical simulation and risk controlling of earthquake disasters in urban buildings[J]. City and Disaster Reduction, 2019.
- Hori, M. Introduction to computational earthquake engineering[M]. 2nd edition. London: Imperial College Press, 2011.
- Sahin A, Sisman R, Askan, A, Hori M. Development of integrated earthquake simulation system for Istanbul, Earth[J]. Planets and Space, 68(115): 1-21.
- Lu X Z, Han B, Hori M, et al. A coarse-grained parallel approach for seismic damage simulations of urban areas based on refined models and GPU/CPU cooperative computing[J]. Advance in Engineering Software, 2014,70:90-103.
- Zhen Xu, Xinzheng Lu, Han Bo, et al. Realistic simulation for seismic damages of buildings in an urban area[J]. China Civil Engineering Journal, 2014, 47 (7): 46-52.
- Chen Xiong, Zhen Xu, Xinzheng Lu, et al. High-fidelity visualization of urban earthquake disaster scenario simulation [J]. China Civil Engineering Journal, 2016, 49 (11): 45-49.
- Chen Xiong, Zhen Xu, Xinzheng Lu, et al. An urban seismic damage analysis model for tall building groups[J]. Engineering Mechanics, 10. 6052/j. issn. 1000-4750. 2015. 08. 0713.
- Hongjing Li, Shiyun Zhu, Celebi Mehmet. Seismic response analysis of instrumented building structure[J]. Earthquake Engineering and Engineering Vibration, 2003, 23(6): 31-36.
- Fei Wang, Yinghua Liu, Zhilin Ren, et al. Structural seismic vibration observation and identification for the building of disaster reduction center in Beijing[J]. Technology for Earthquake Disaster Prevention, 2015, 10(3):539-546.
- Jianhua Yin, Kun Ji, Jianwen Cui, et al. Analysis of structural response by using strong ground motion recordings from middle and far-field small earthquake events[J]. Technology for Earthquake Disaster Prevention, 2018, 13(4): 911-920.
- Chih-Hao Hsu, Siao-Syun Ke, Tzu-Hsiu Wu. Development and application of a platform for multidimensional urban earthquake impact simulation[J]. Frontiers in Built Environment, 2022, 8: 1-18.
- Xiong C, Lu X Z, Lin X C, et al. Parameter determination and damage assessment for THA-based regional seismic damage prediction of multi-story buildings[J]. Earthquake Engineering, 2017, 21: 461–485.
- Cheng Q L, Xu Z, Lu X Z, et al. Building seismic damage prediction of Tangshan City based on the nonlinear time-history analysis of urban buildings[J]. Journal of Natural Disasters, 2018, 27(1): 71−80.
- Xuchuan Lin, Xianan Chen, Fei Wang, et al. Real-time physics-based regional earthquake disaster simulation using structural monitoring data[M]. 17th World Conference on Earthquake Engineering, 2020.
- Fei Wang, Xiandong Kang, Ying Liu, et al. Structural monitoring and seismic resilience evaluation of buildings[J]. Technology for Earthquake Disaster Prevention, 2022, 17(3): 569-578.
- Cimellaro G P, Reinhorn A M, Bruneau M. Framework for analytical quantification of disaster resilience[J]. Engineering Structures, 2010, 32(11):3639-3649.
- Qiqi Li, Zhe Qu, Quancai Xie. Seismic damage characteristics and fragility of suspended ceilings in Chinese public buildings[J]. Engineering Mechanics, 2019, 37(7): 207-214.
- Xianxin Xie, Lingxin Zhang, Zhe Qu. Reparability-based fragility analysis of masonry infills in buildings[J]. Journal of Building Structures, 2018, 39(12): 159-165.
- Xiandong Kang, Haoran Fu, Guang Zhao, et al. Research and application of evaluation methods for earthquake resilience of individual building structure[J]. China Civil Engineering Journal, 2021, 54(8): 37-42.
- Ahrens, James, Geveci, et al. ParaView: An End-User Tool for Large Data Visualization, Visualization Handbook, Elsevier, 2005, ISBN-13: 9780123875822.
- James Ahrens, Sébastien Jourdain, Patrick O’Leary, et al. An image-based approach to extreme scale in situ visualization and analysis. Proceedings of the International Conference for High Performance Computing, Nov-2014.
- Woodring, J., Ahrens J., Tautges T., et al. On-demand unstructured mesh translation for reducing memory pressure during in situ analysis. UltraVis ’13 Proceedings of the 8th International Workshop on Ultrascale Visualization, Oct-2014.
- Post earthquake field works-Part 3: Code for field survey. GB/T18208.3-2011.
- The Chinese seismic intensity scale. GB/T 17742-2020.
|
Disclaimer/Publisher’s Note: The statements, opinions and data contained in all publications are solely those of the individual author(s) and contributor(s) and not of MDPI and/or the editor(s). MDPI and/or the editor(s) disclaim responsibility for any injury to people or property resulting from any ideas, methods, instructions or products referred to in the content. |
© 2024 by the authors. Licensee MDPI, Basel, Switzerland. This article is an open access article distributed under the terms and conditions of the Creative Commons Attribution (CC BY) license (https://creativecommons.org/licenses/by/4.0/).
