Submitted:
05 August 2024
Posted:
06 August 2024
You are already at the latest version
Abstract
Keywords:
1. Introduction
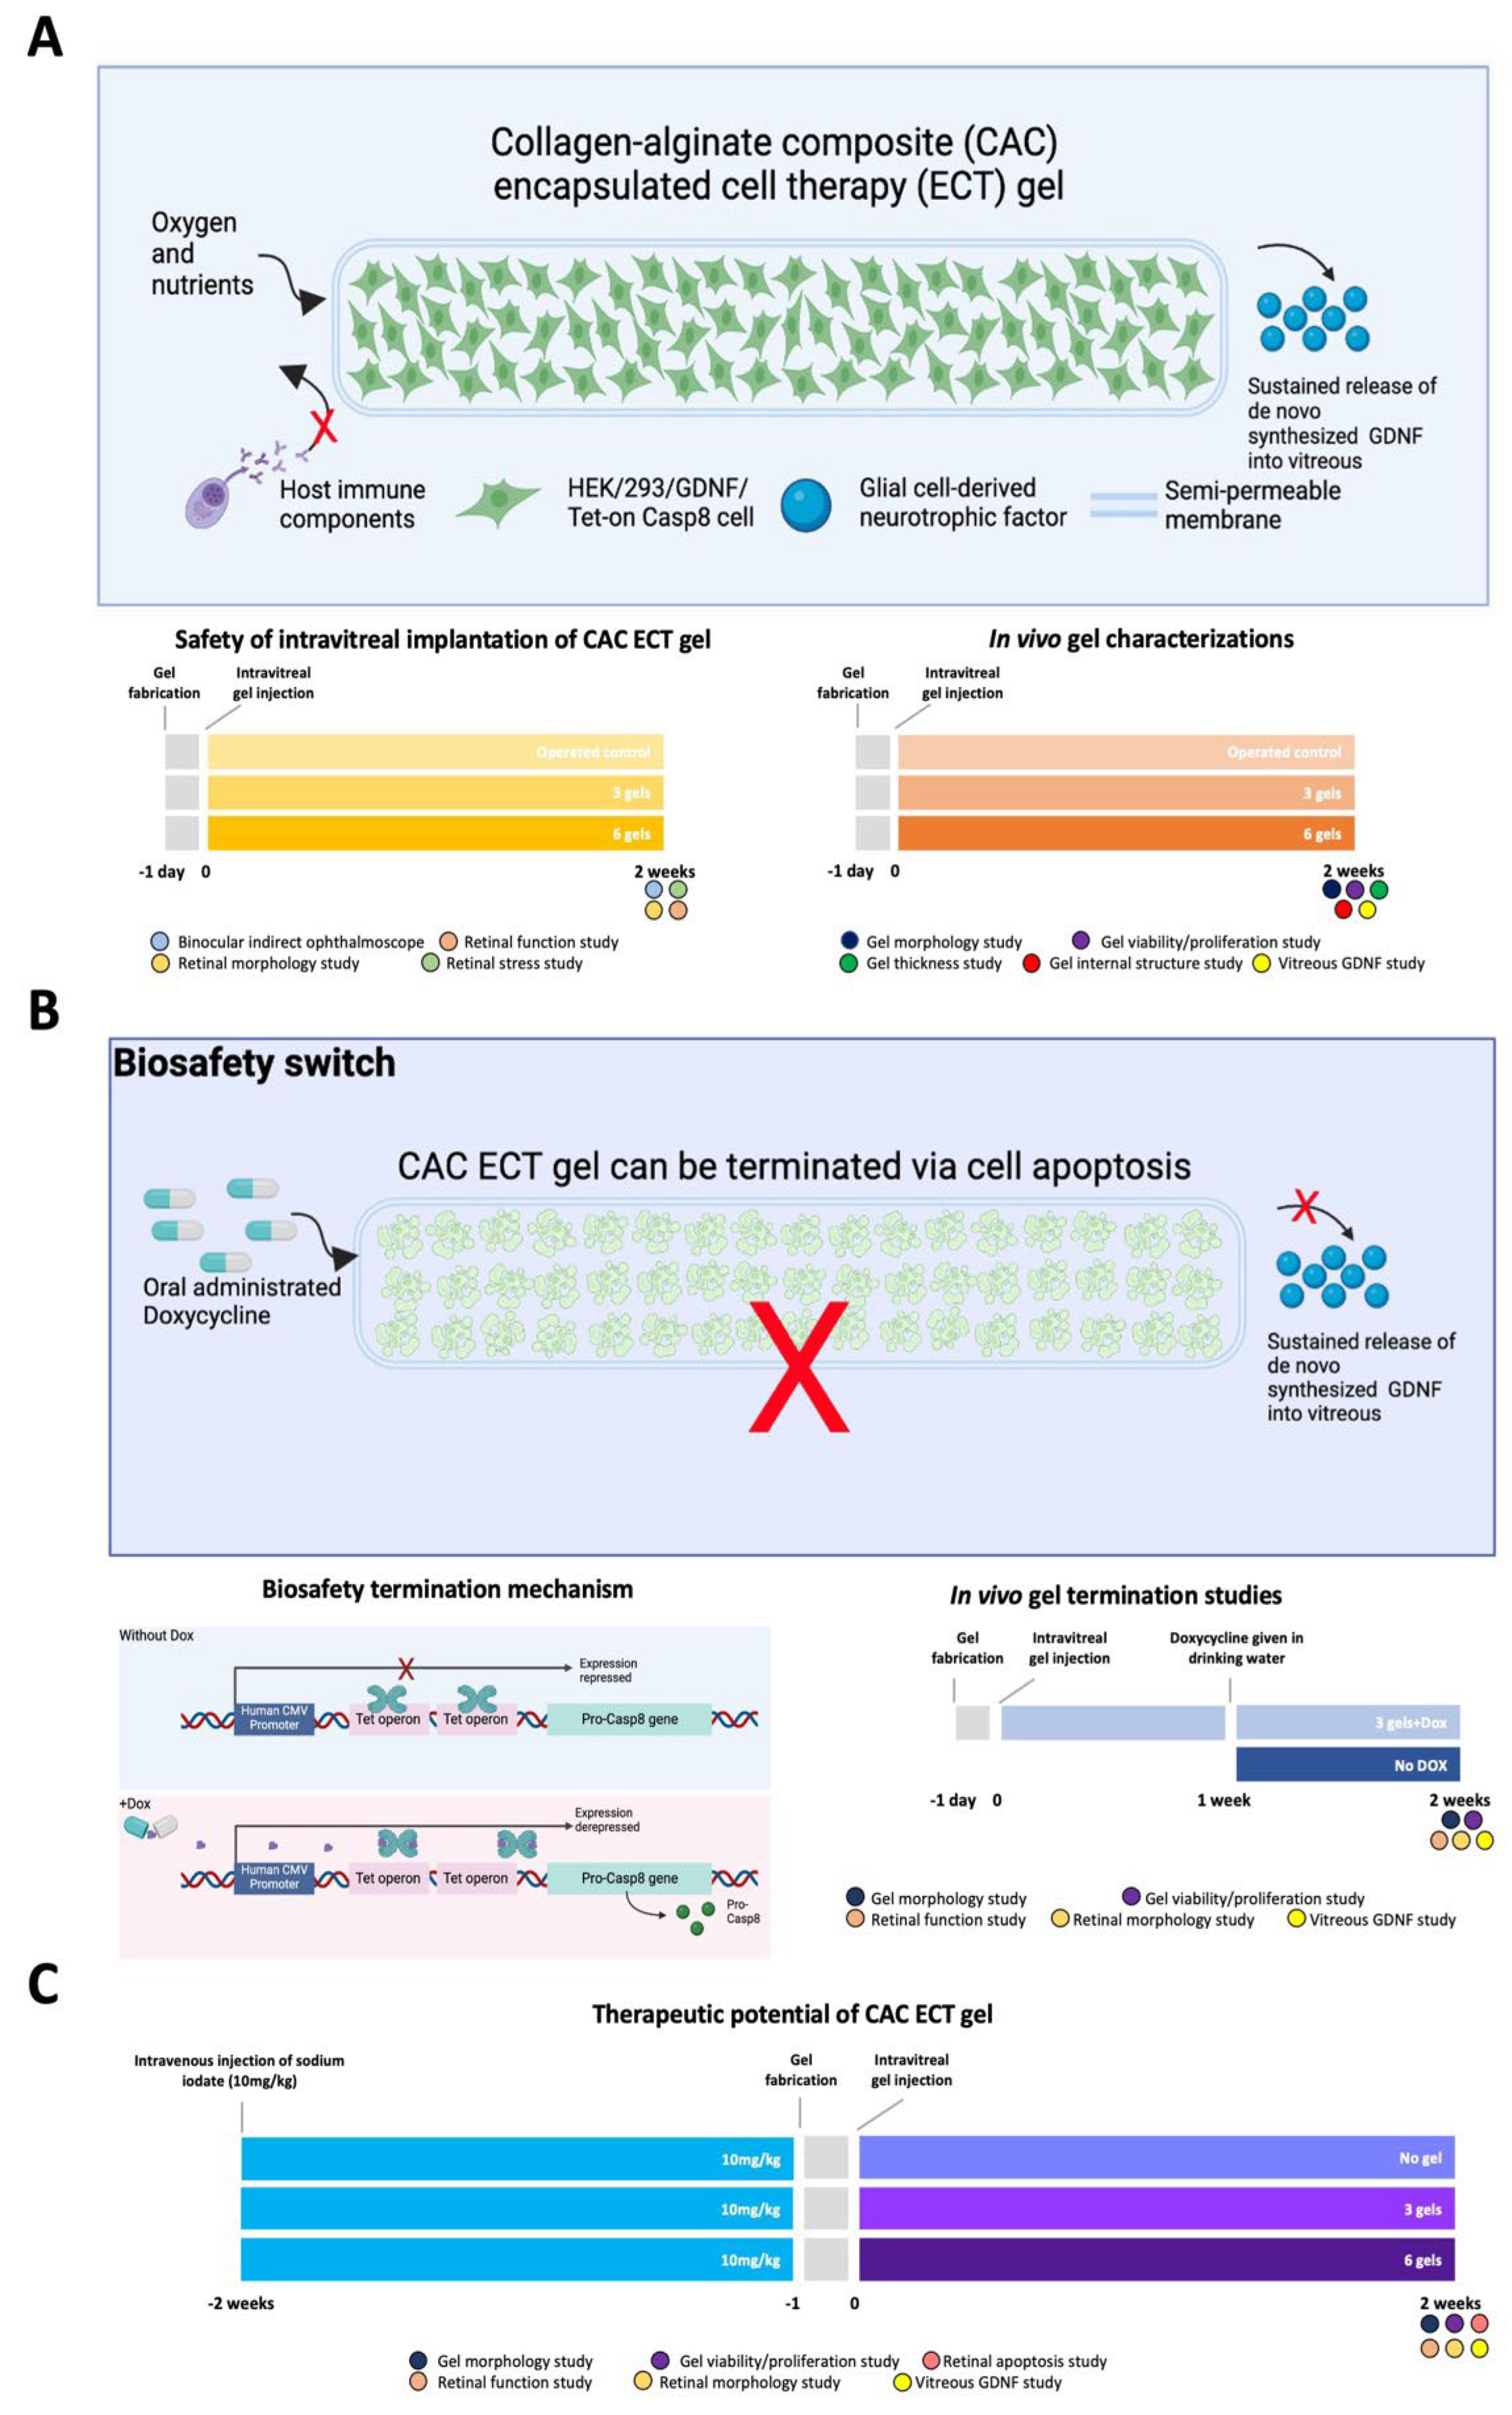
2. Results and discussion
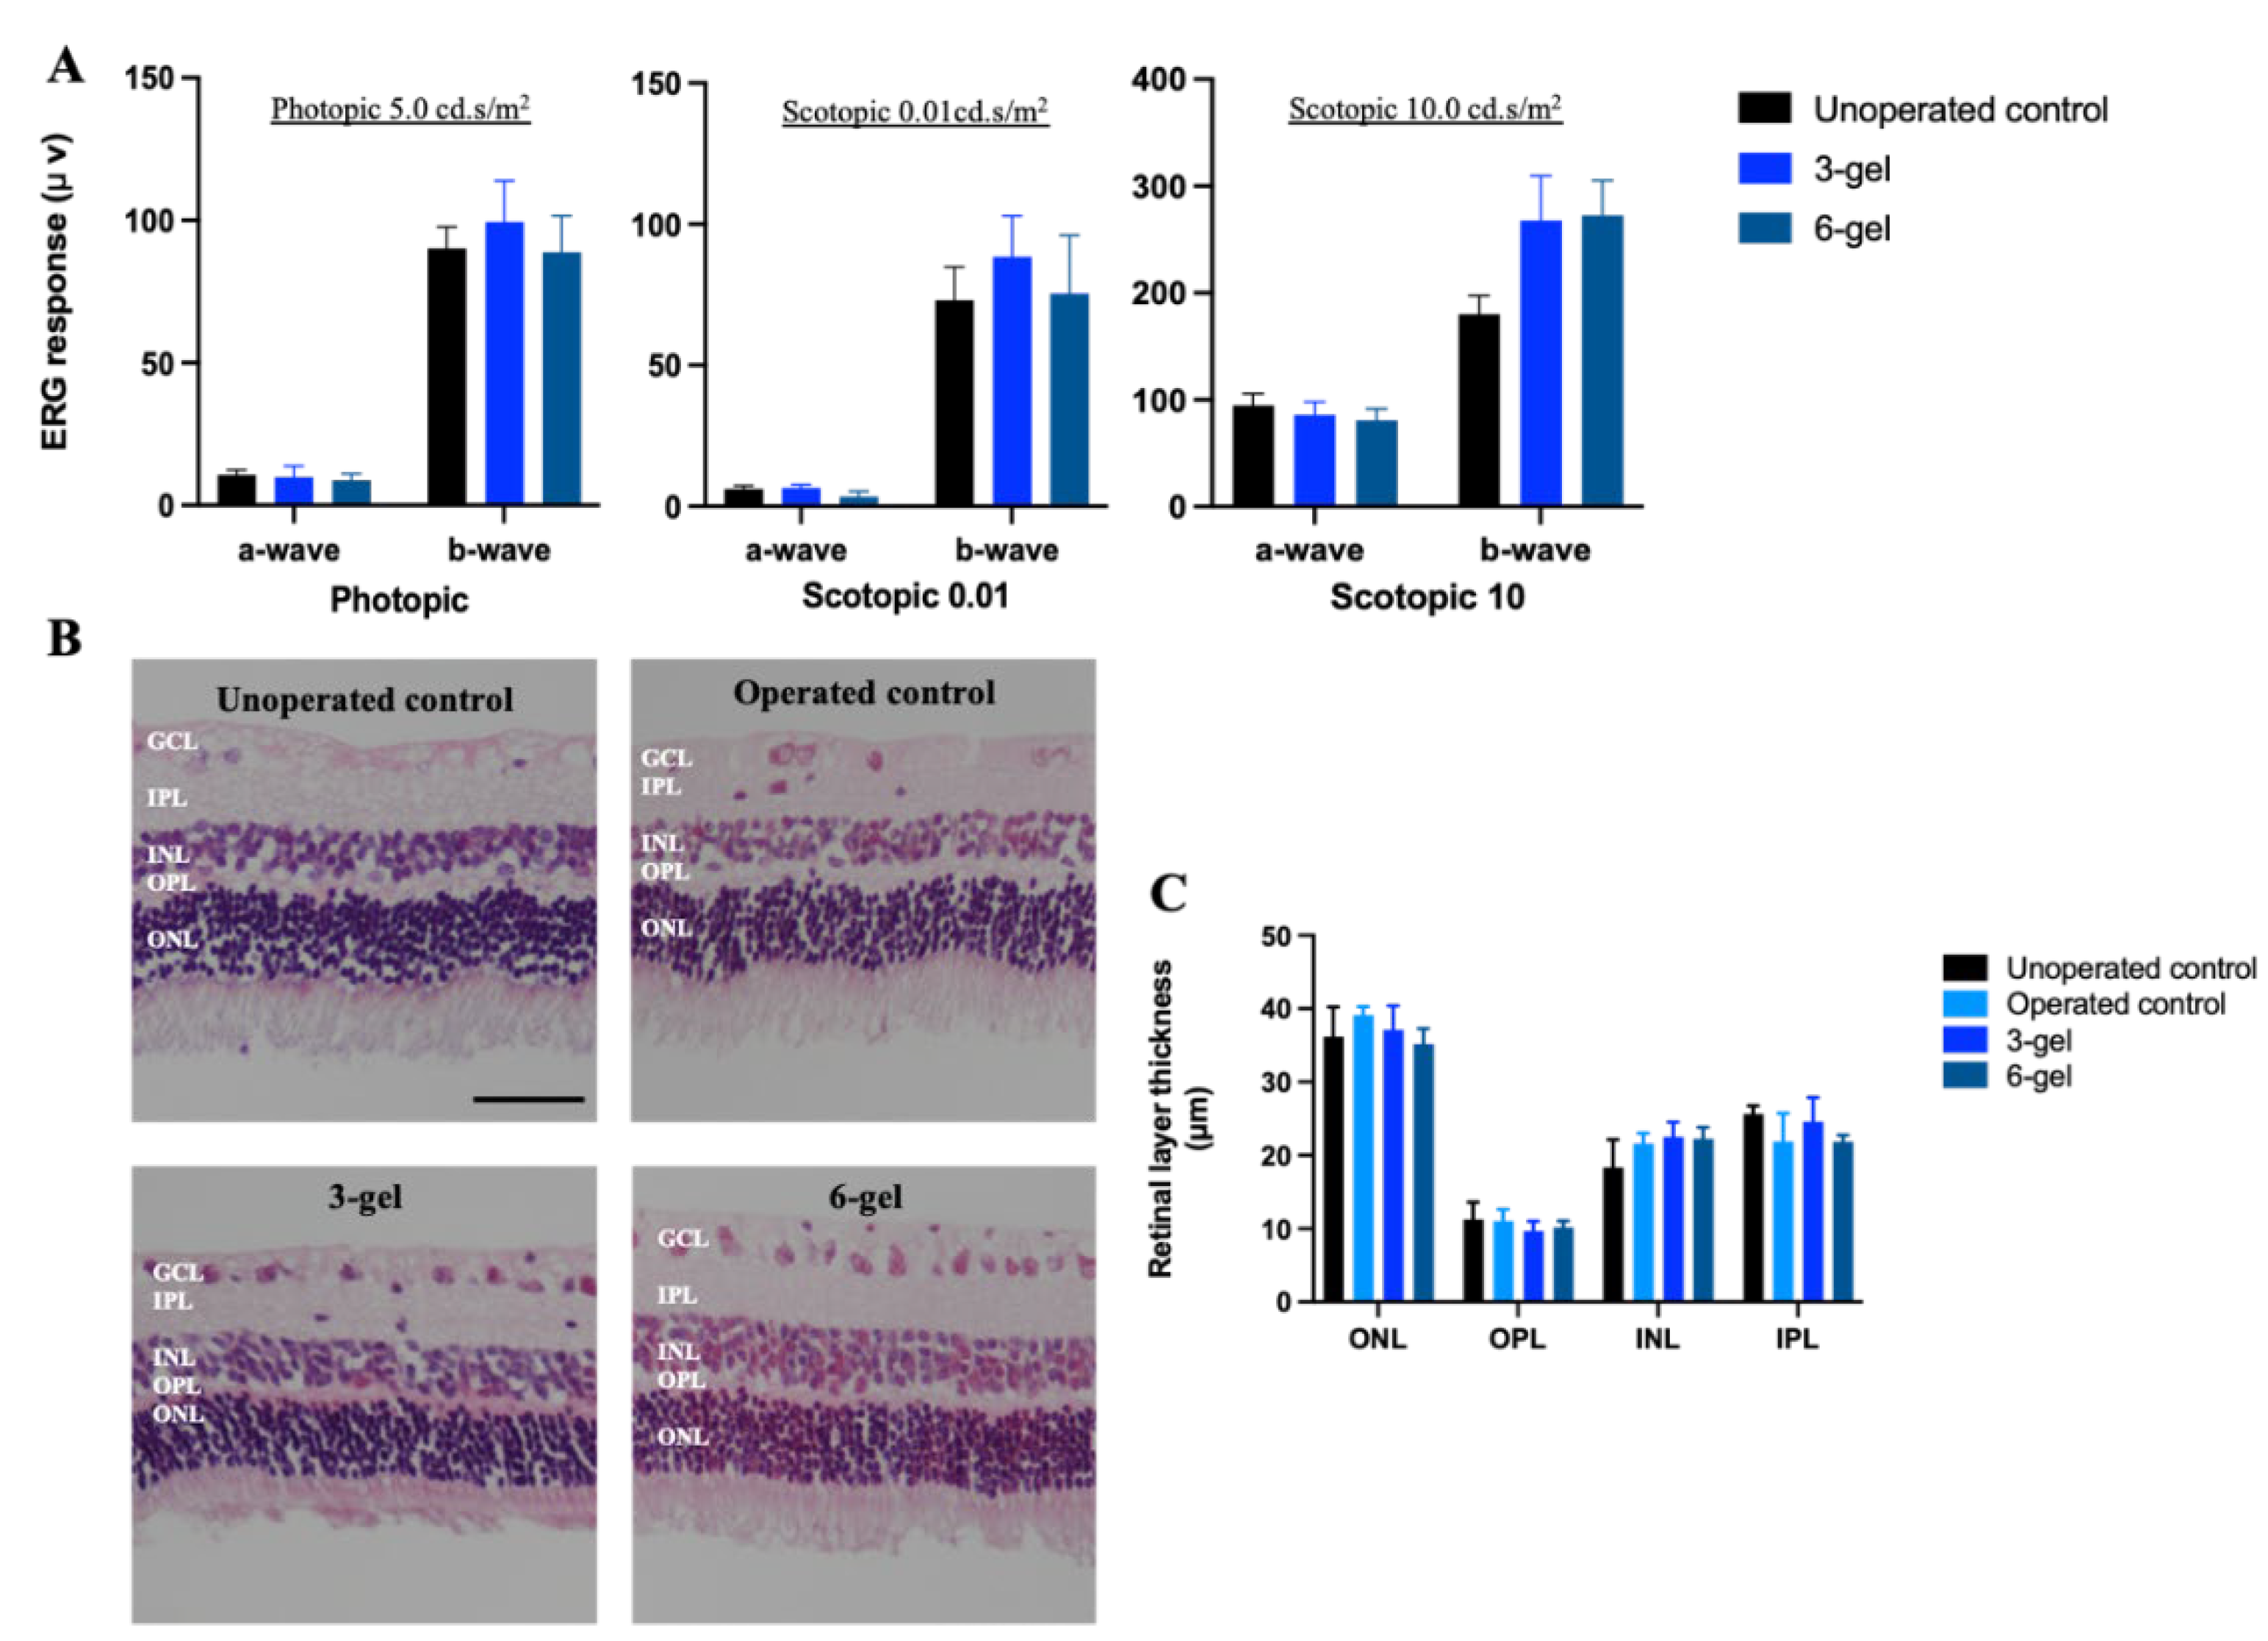
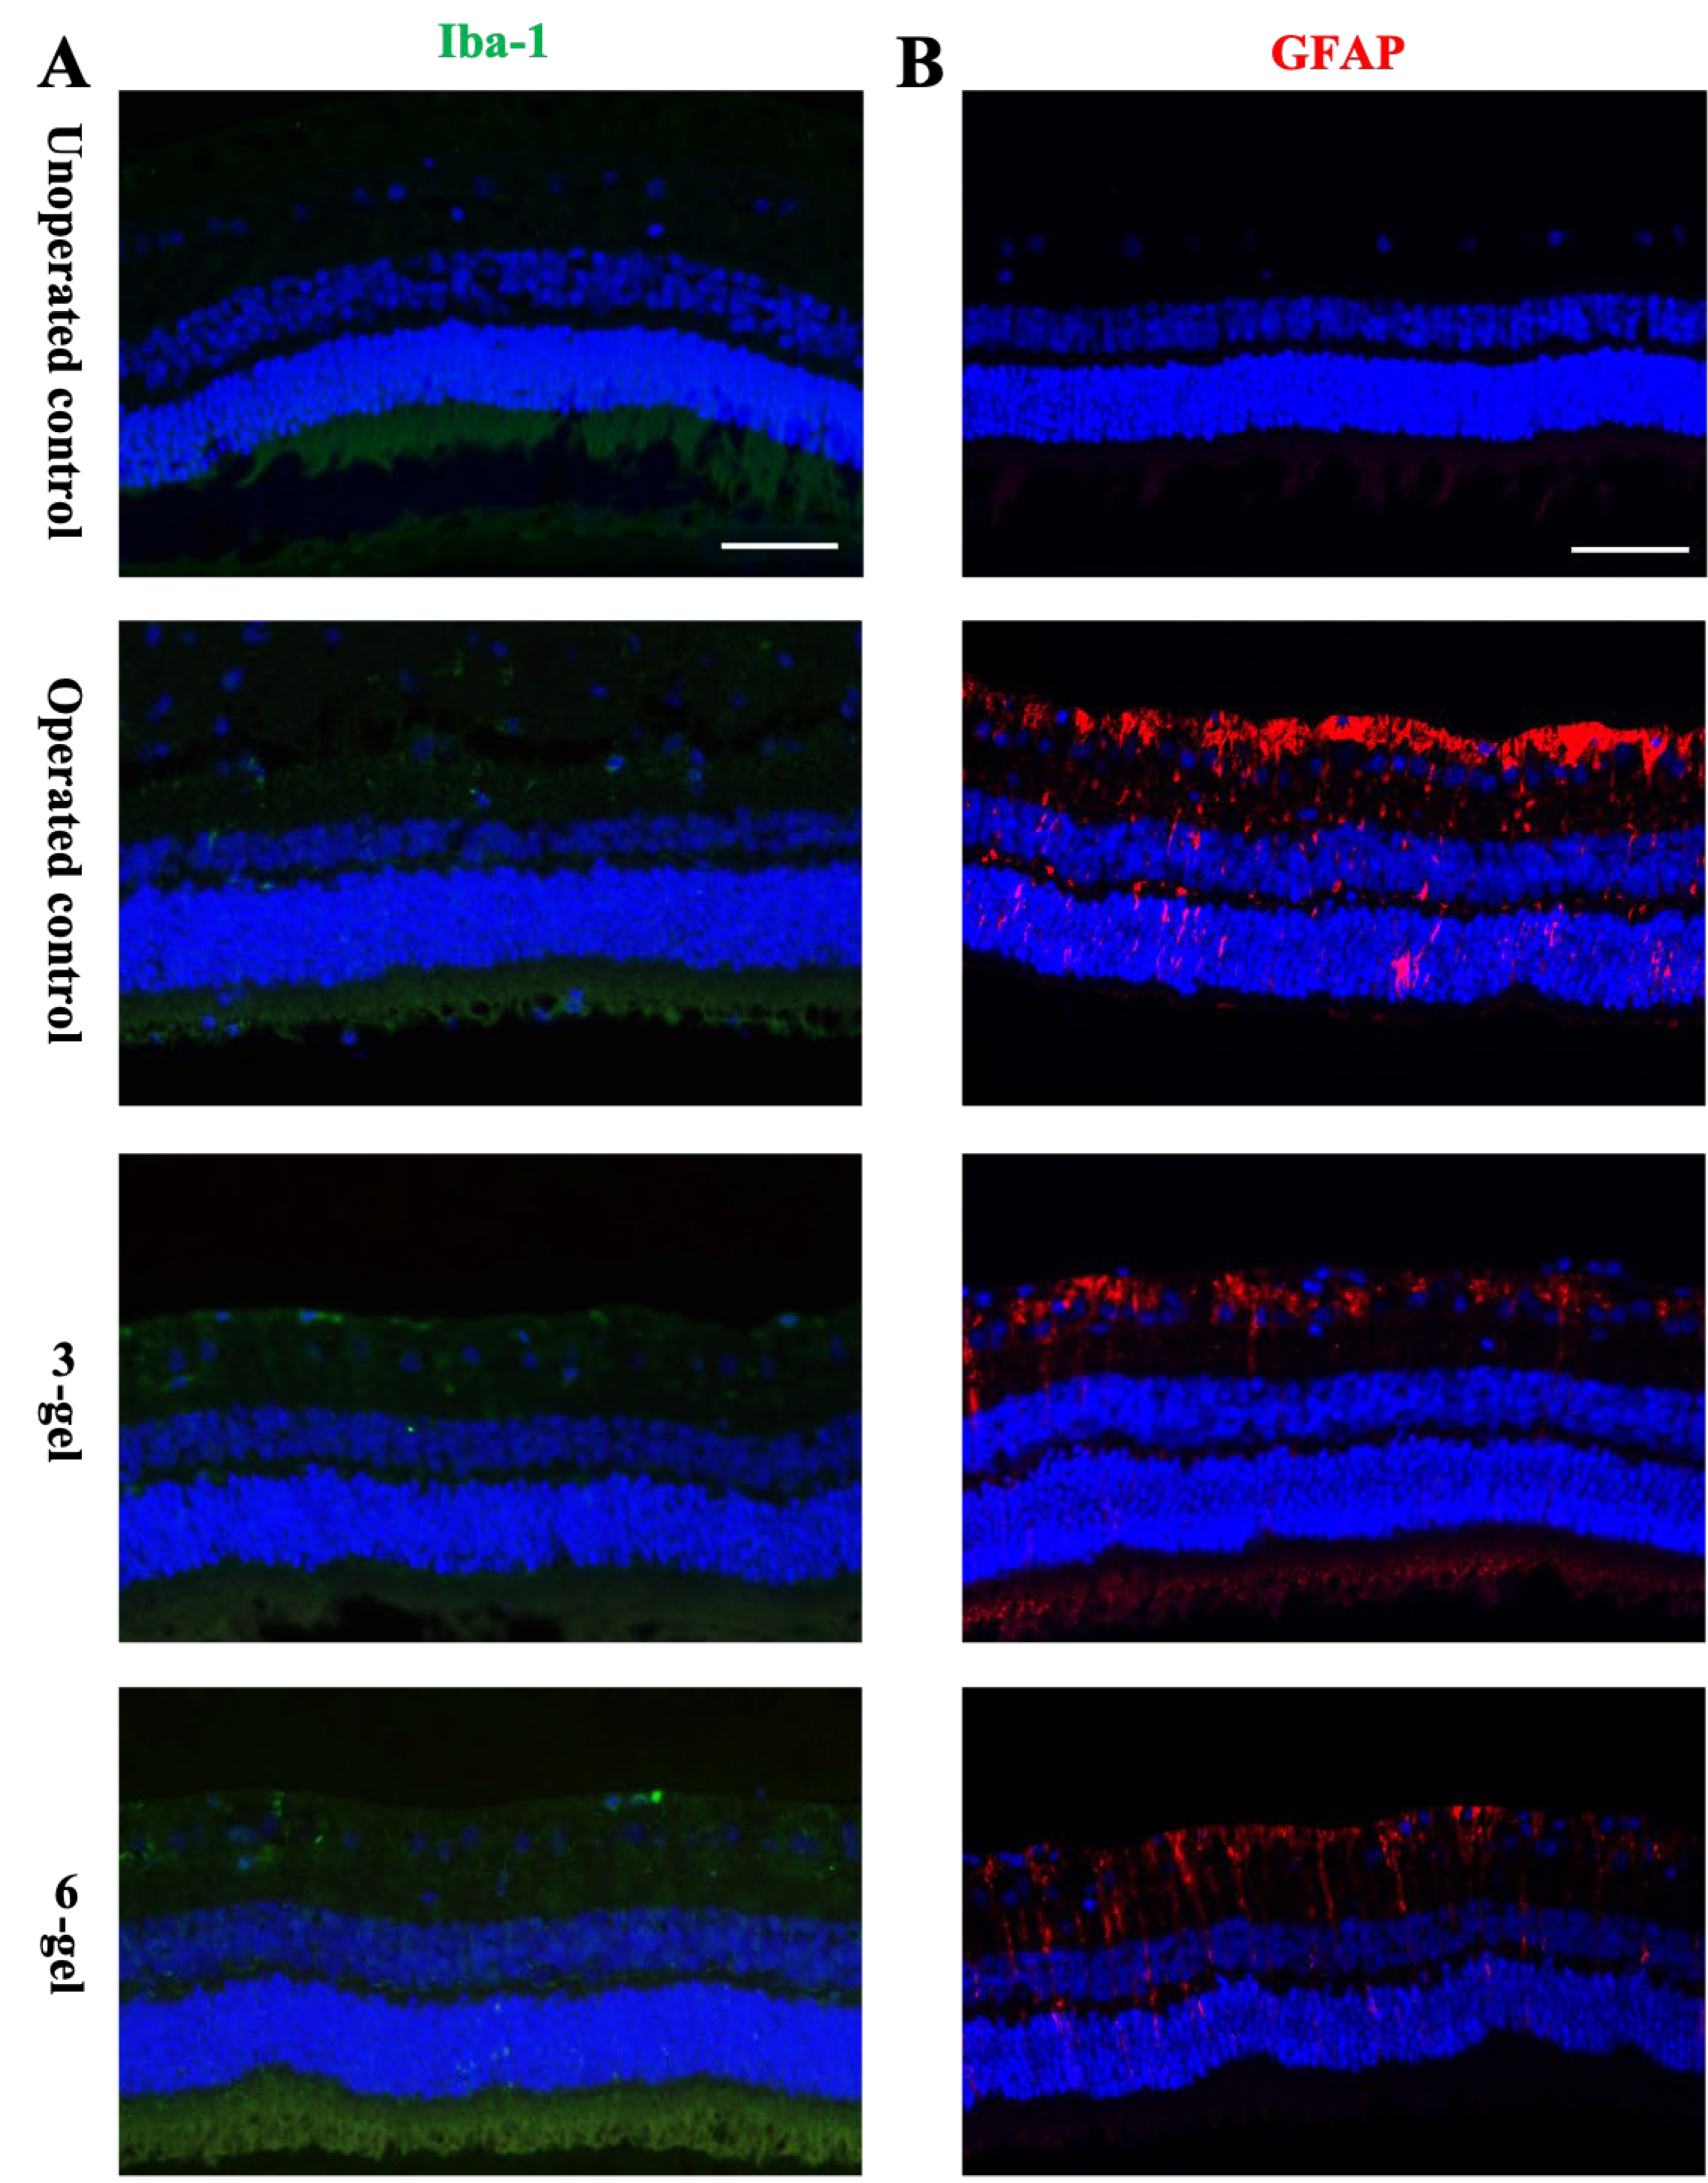
2.1. In vivo Evaluation of the Effects of CAC ECT Gels on Retinal Structure and Function and Glial Cells Reactivity
2.2. In Vivo Performance of CAC ECT Gel
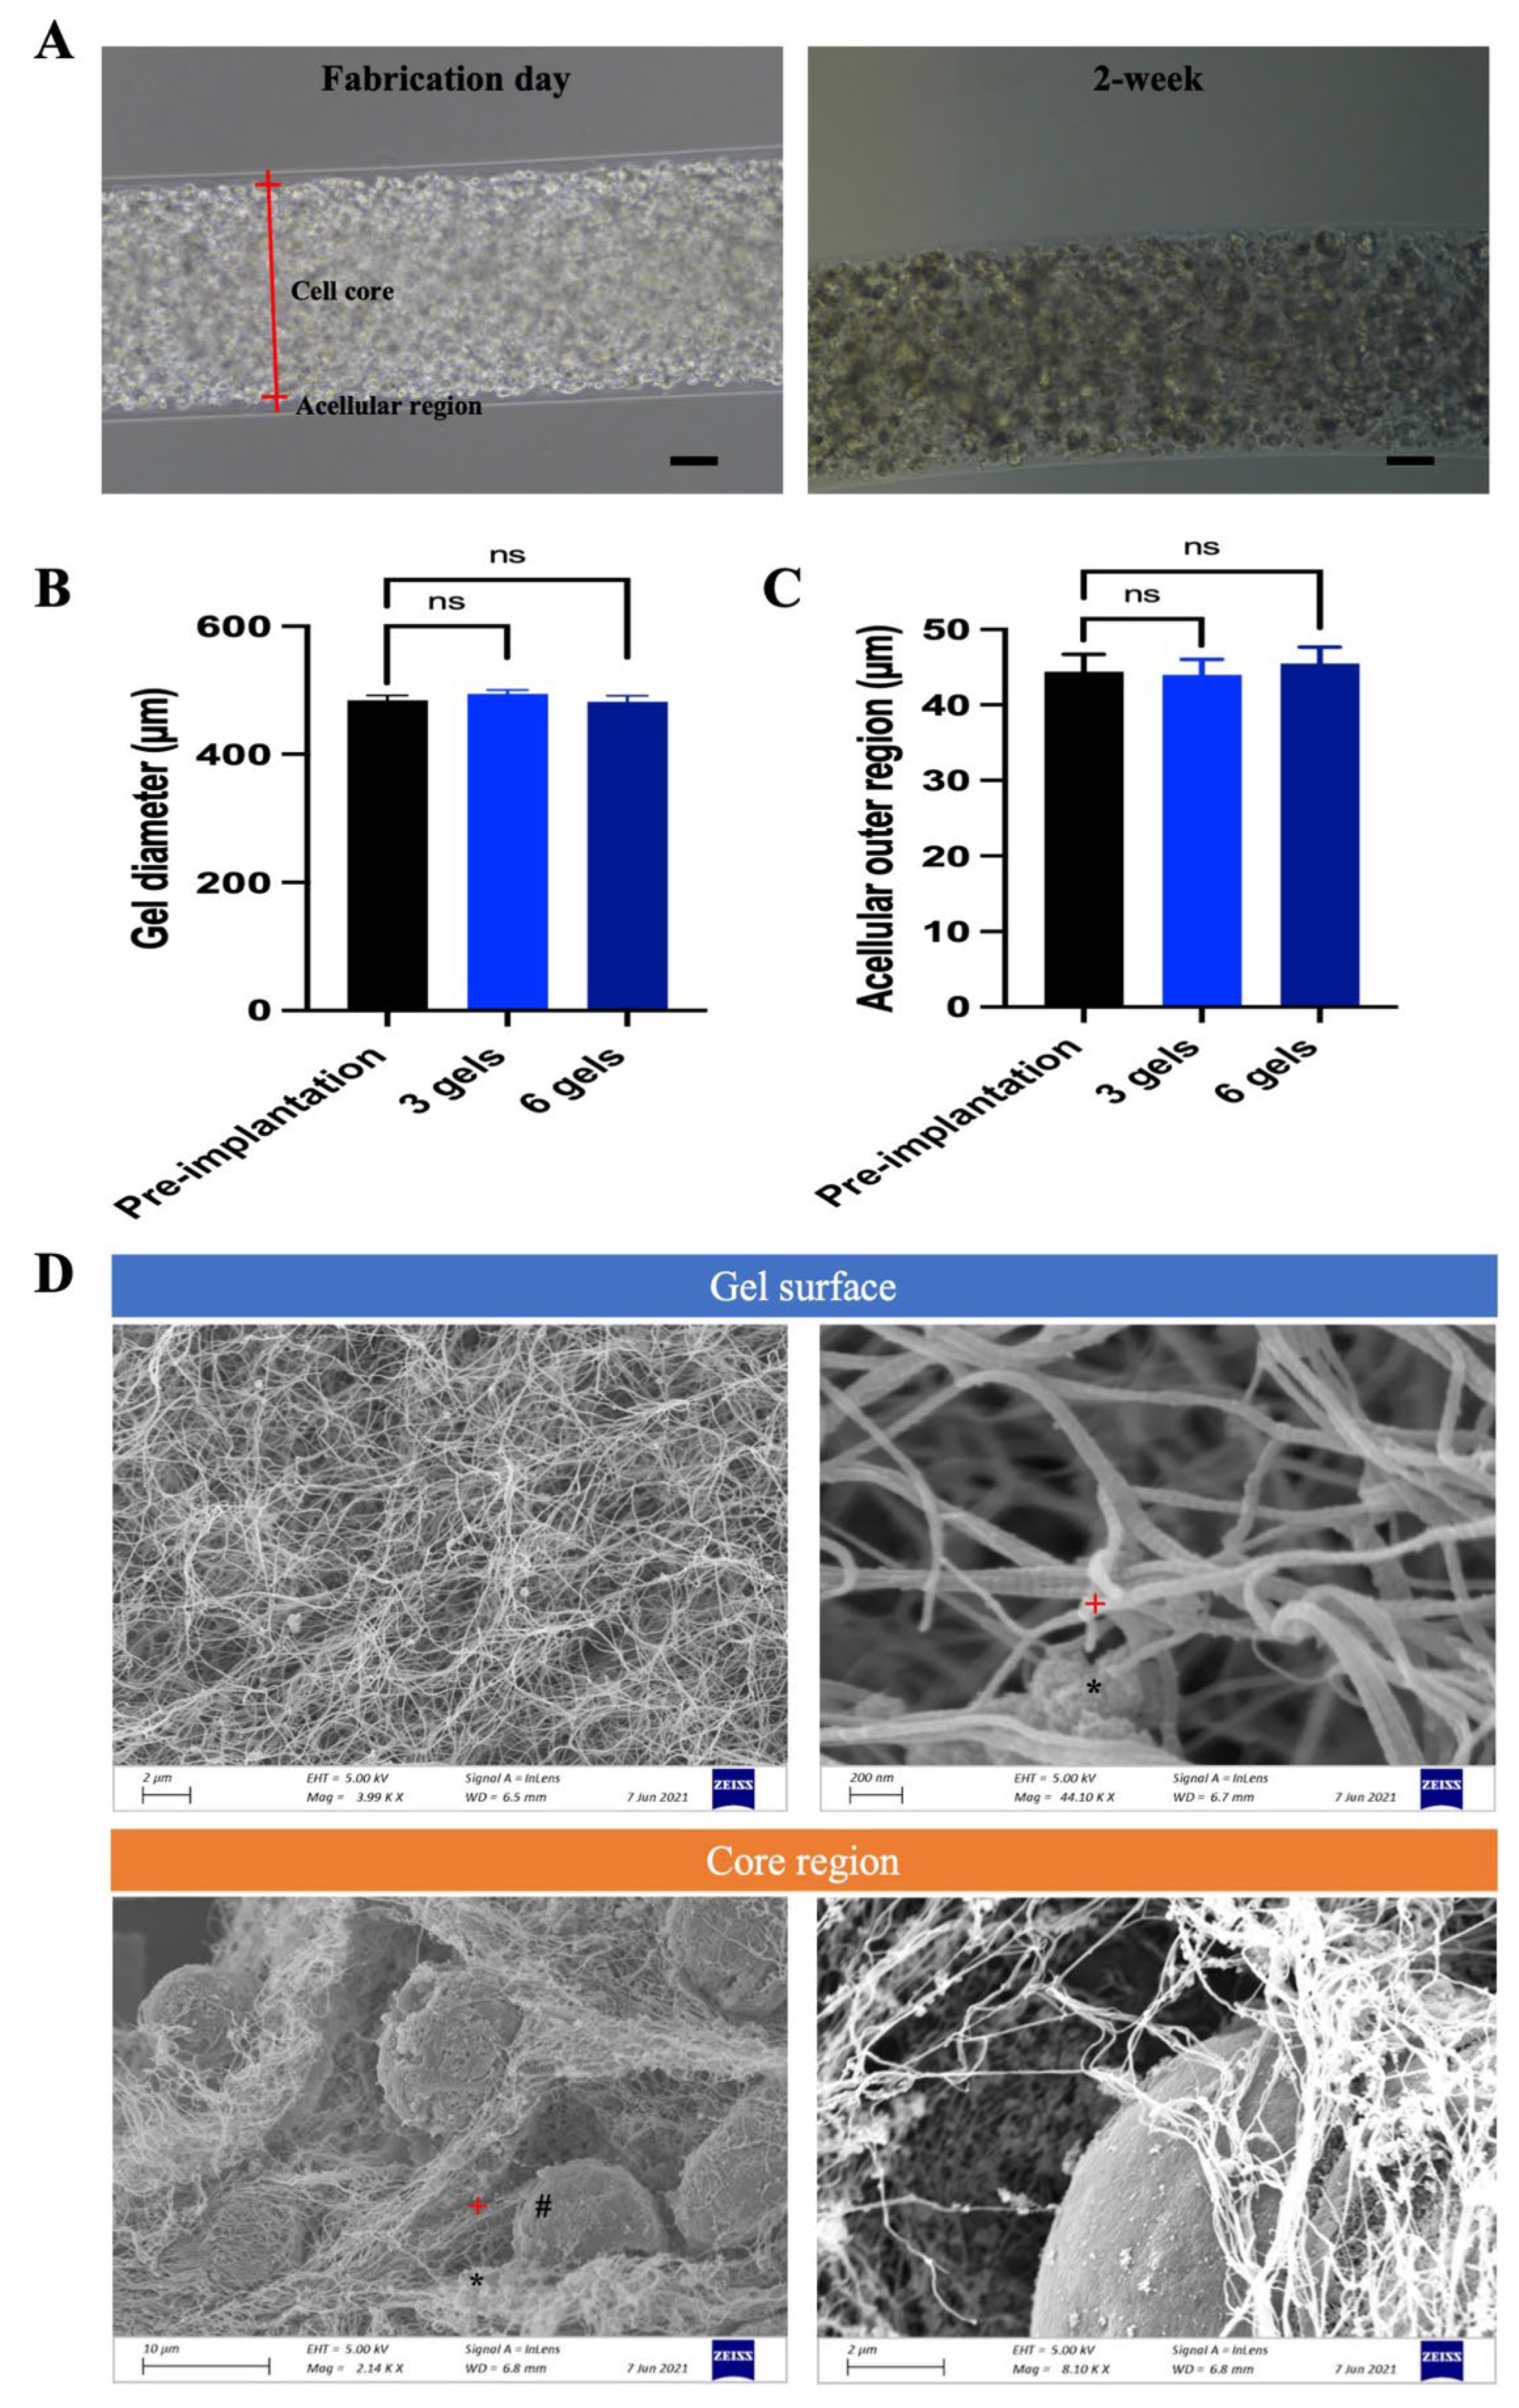
2.2.1. Gel Morphology, Encapsulation Power, Mechanical Stability, Material Degradation and Internal Structure
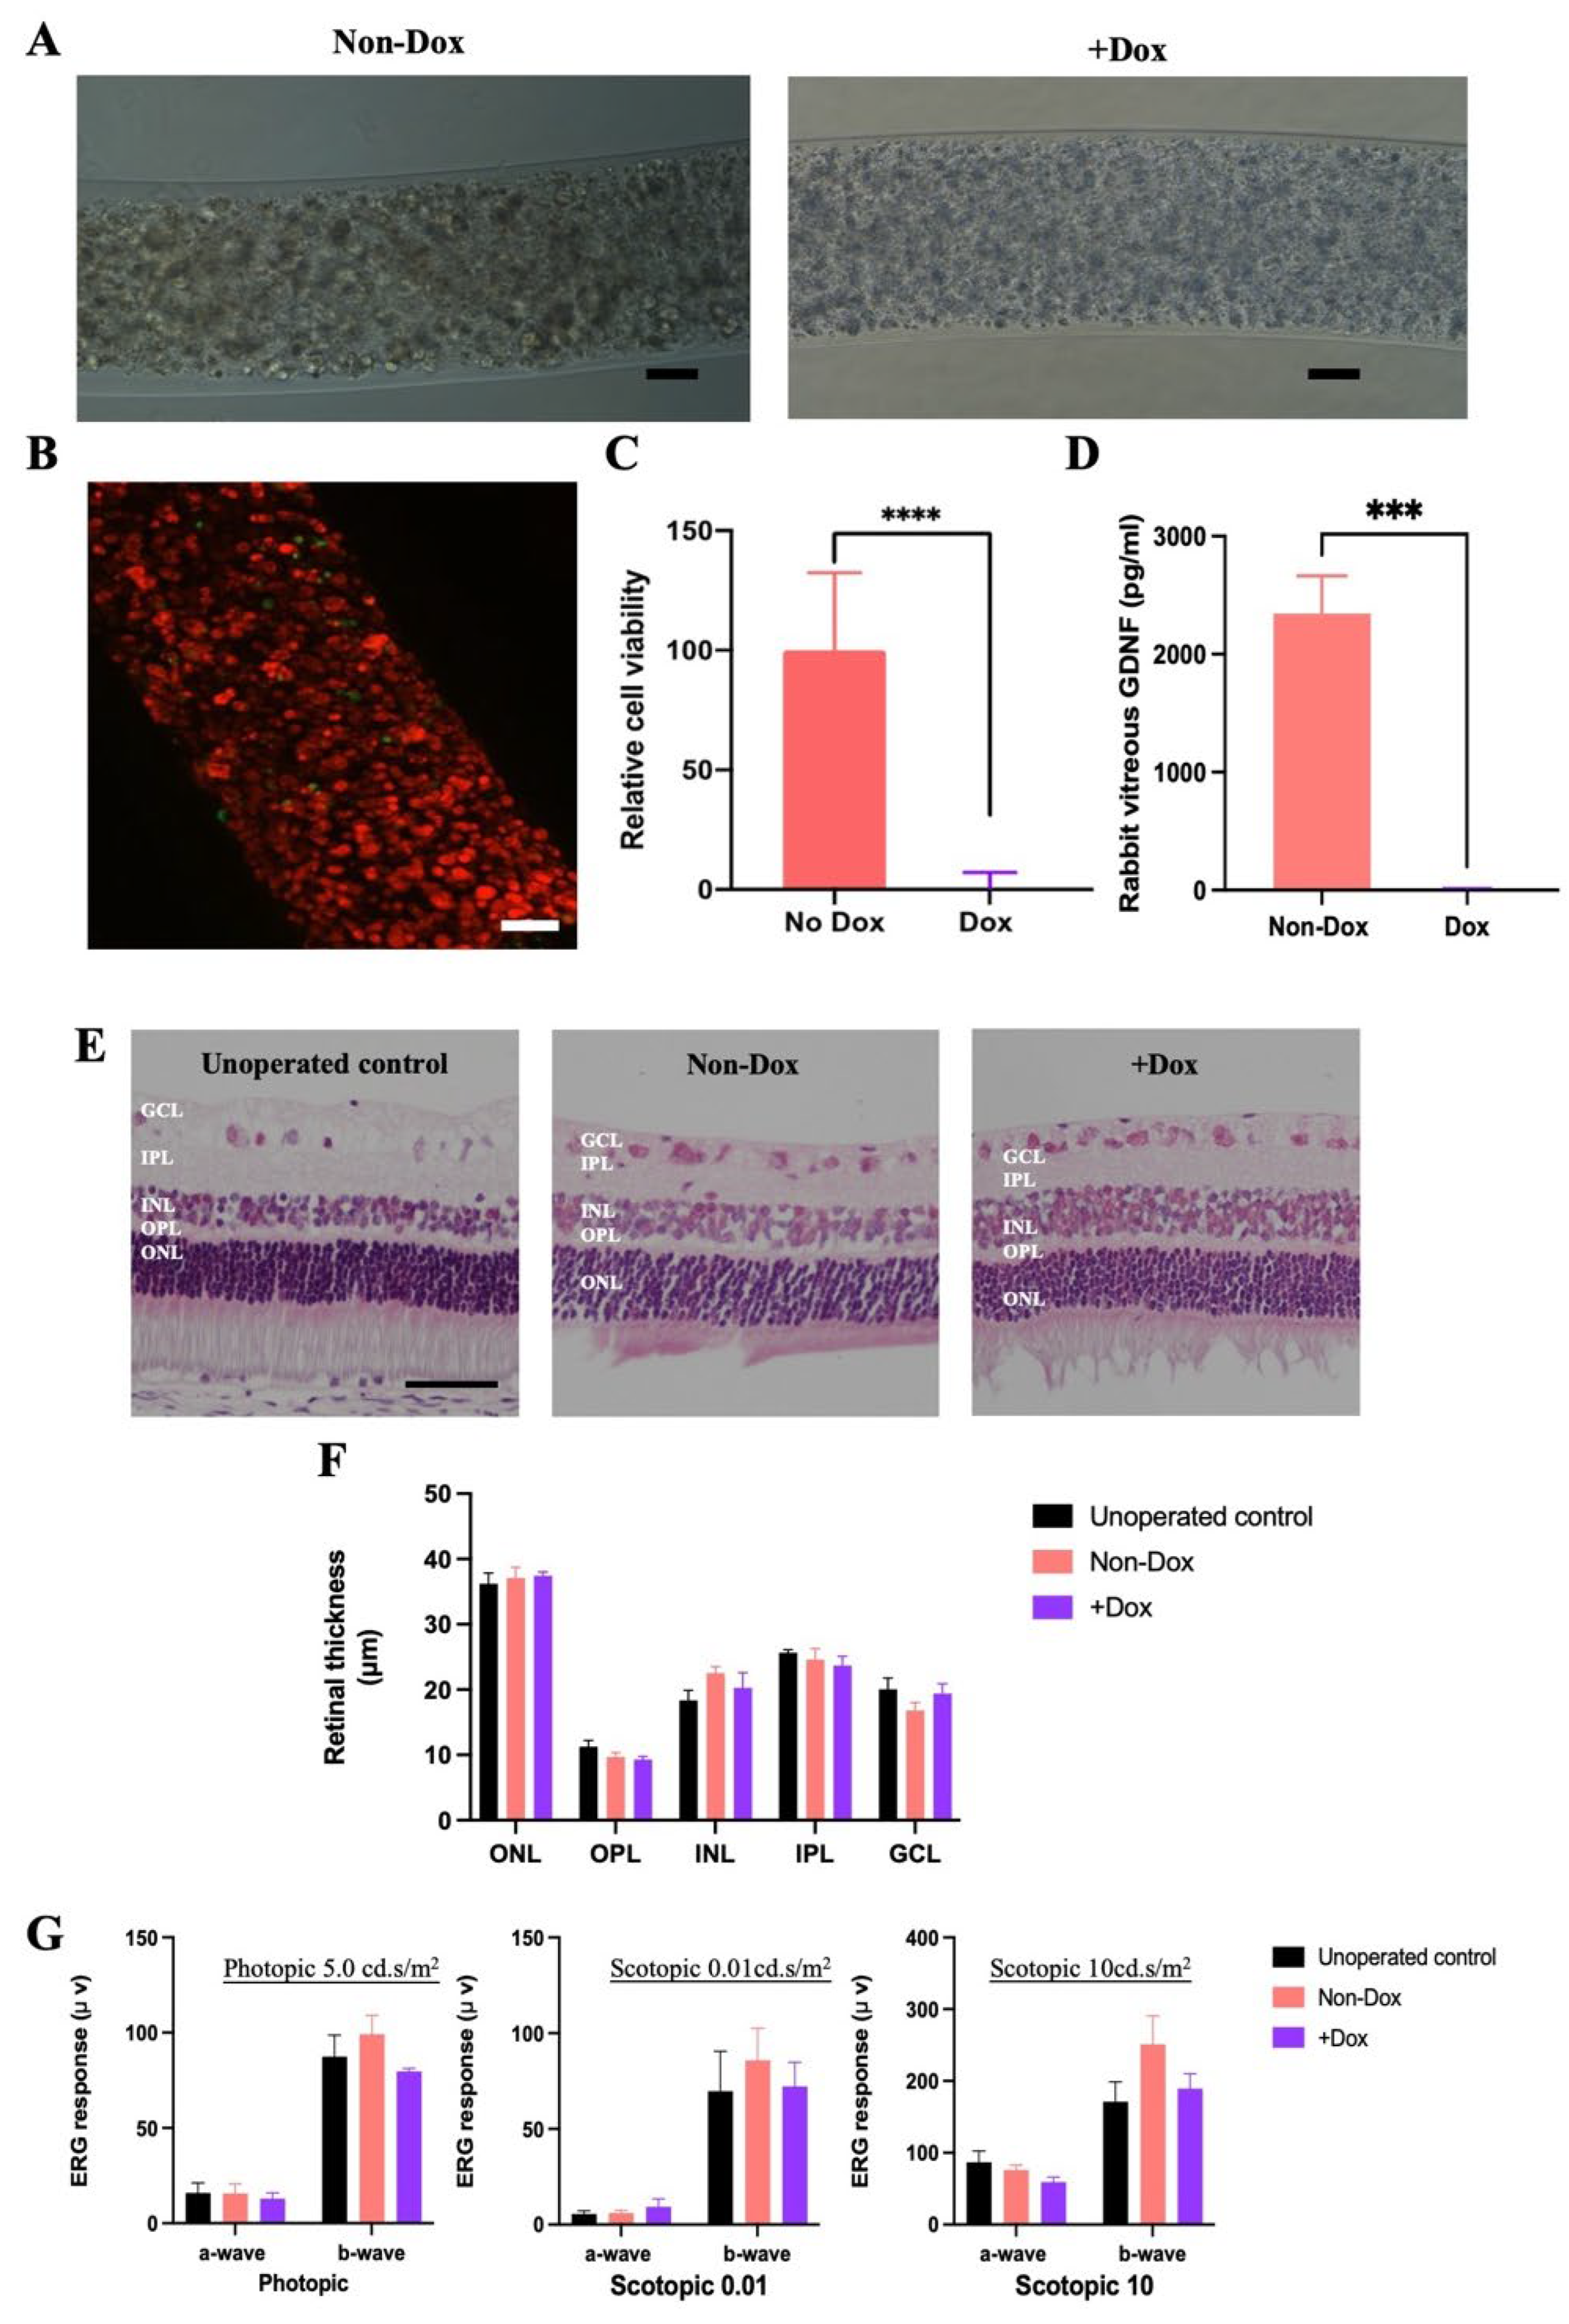
2.2.2. Encapsulated Cell Viability and GDNF Secretion
2.3. In Vivo Termination of CAC ECT Gel
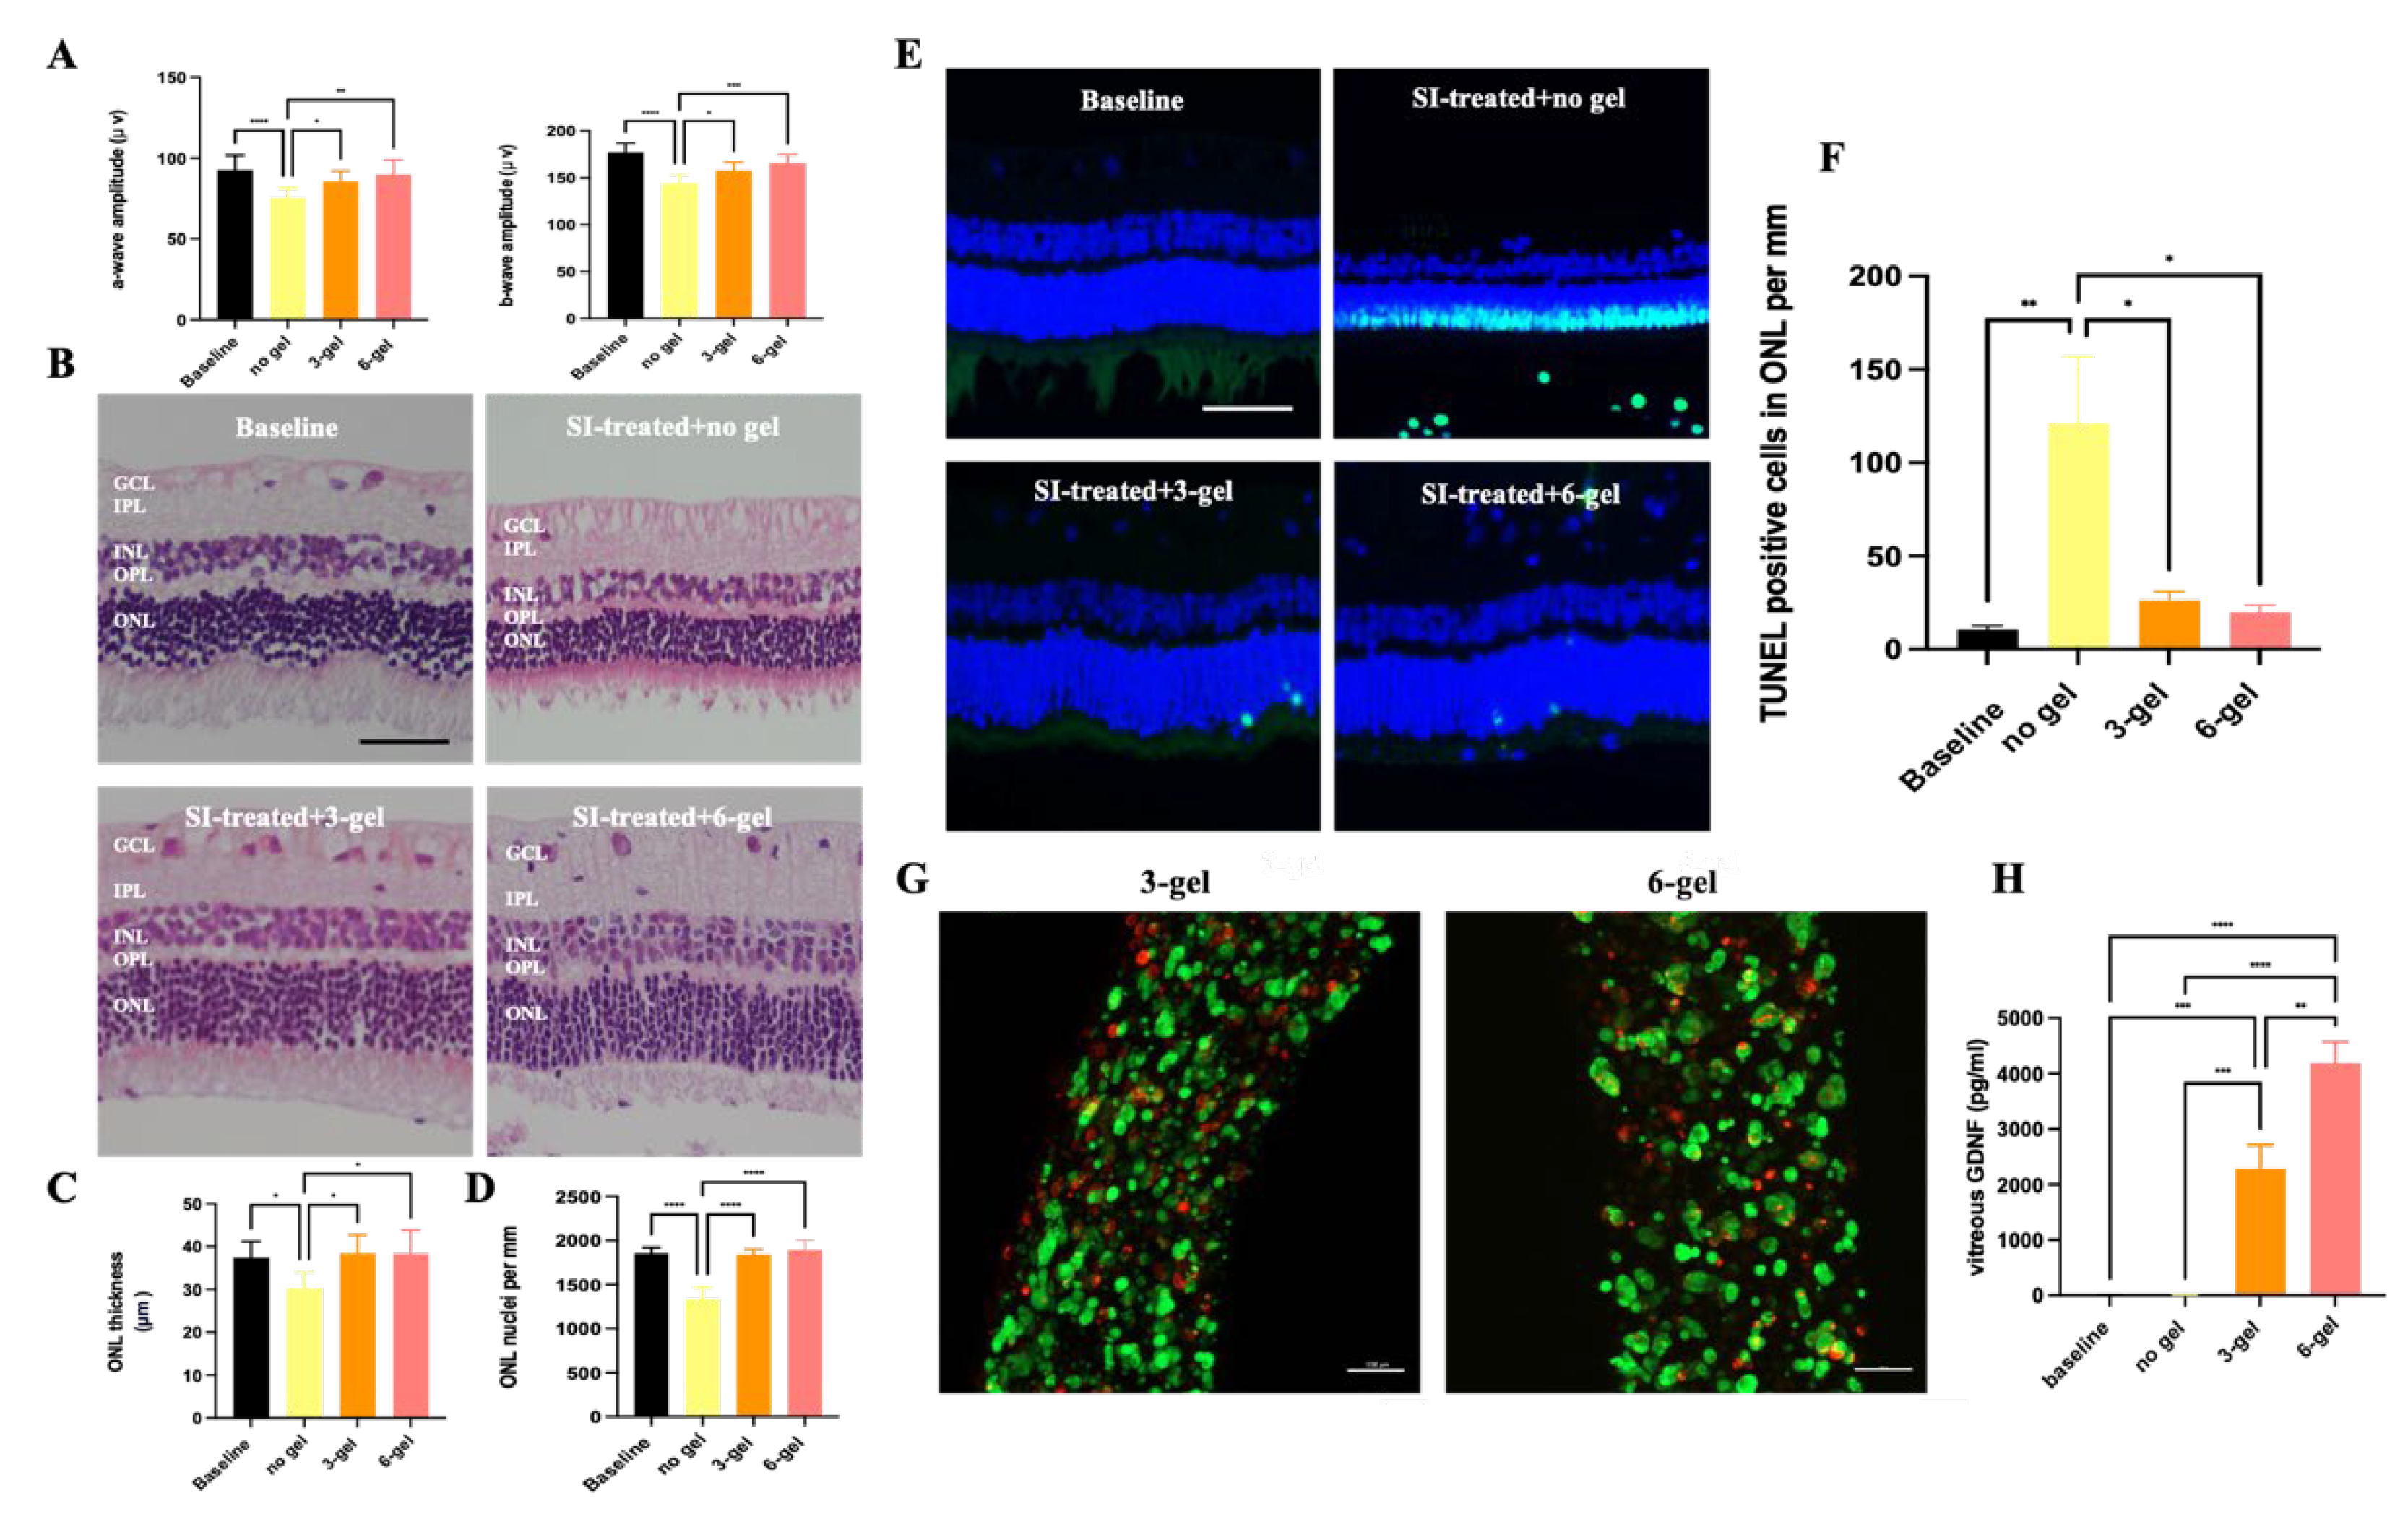
2.4. Therapeutic Efficacy of CAC ECT Gel in Rabbits with Retinal Degeneration
3. Materials and Methods
3.1. Cell Culture of HEK/293/GDNF/Tet-on Pro-Casp8
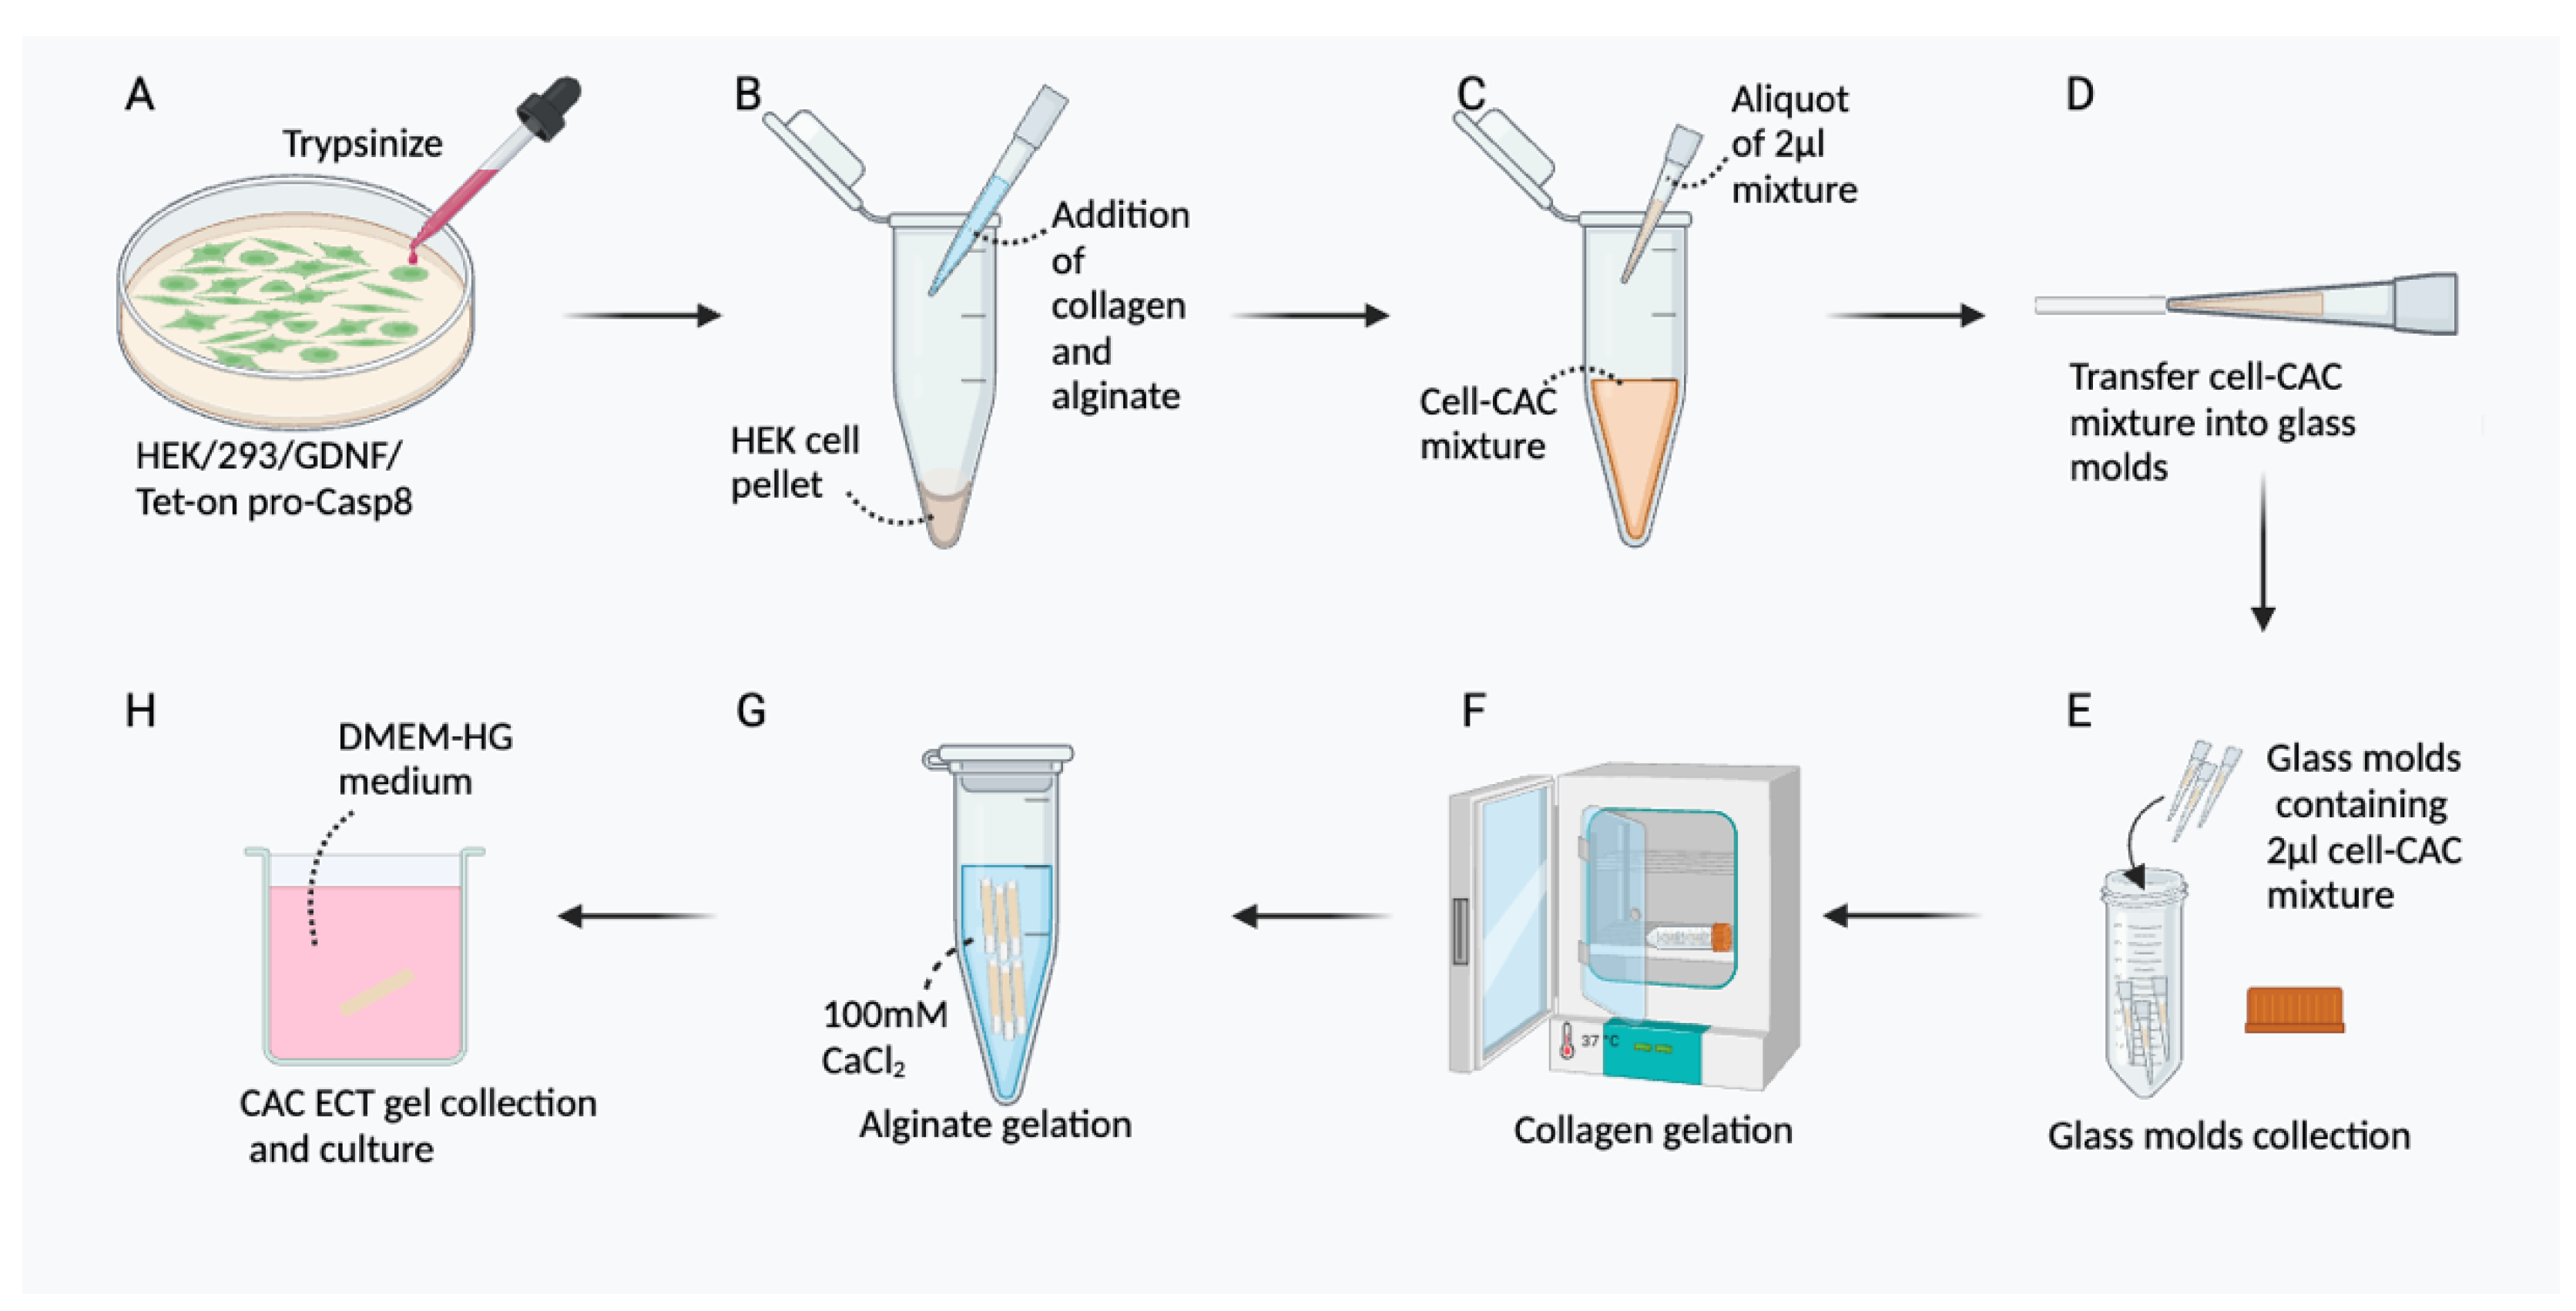
3.2. Preparation of CAC ECT Gel
3.3. Animal Care and Use
3.4. Intravitreal Gel Injection
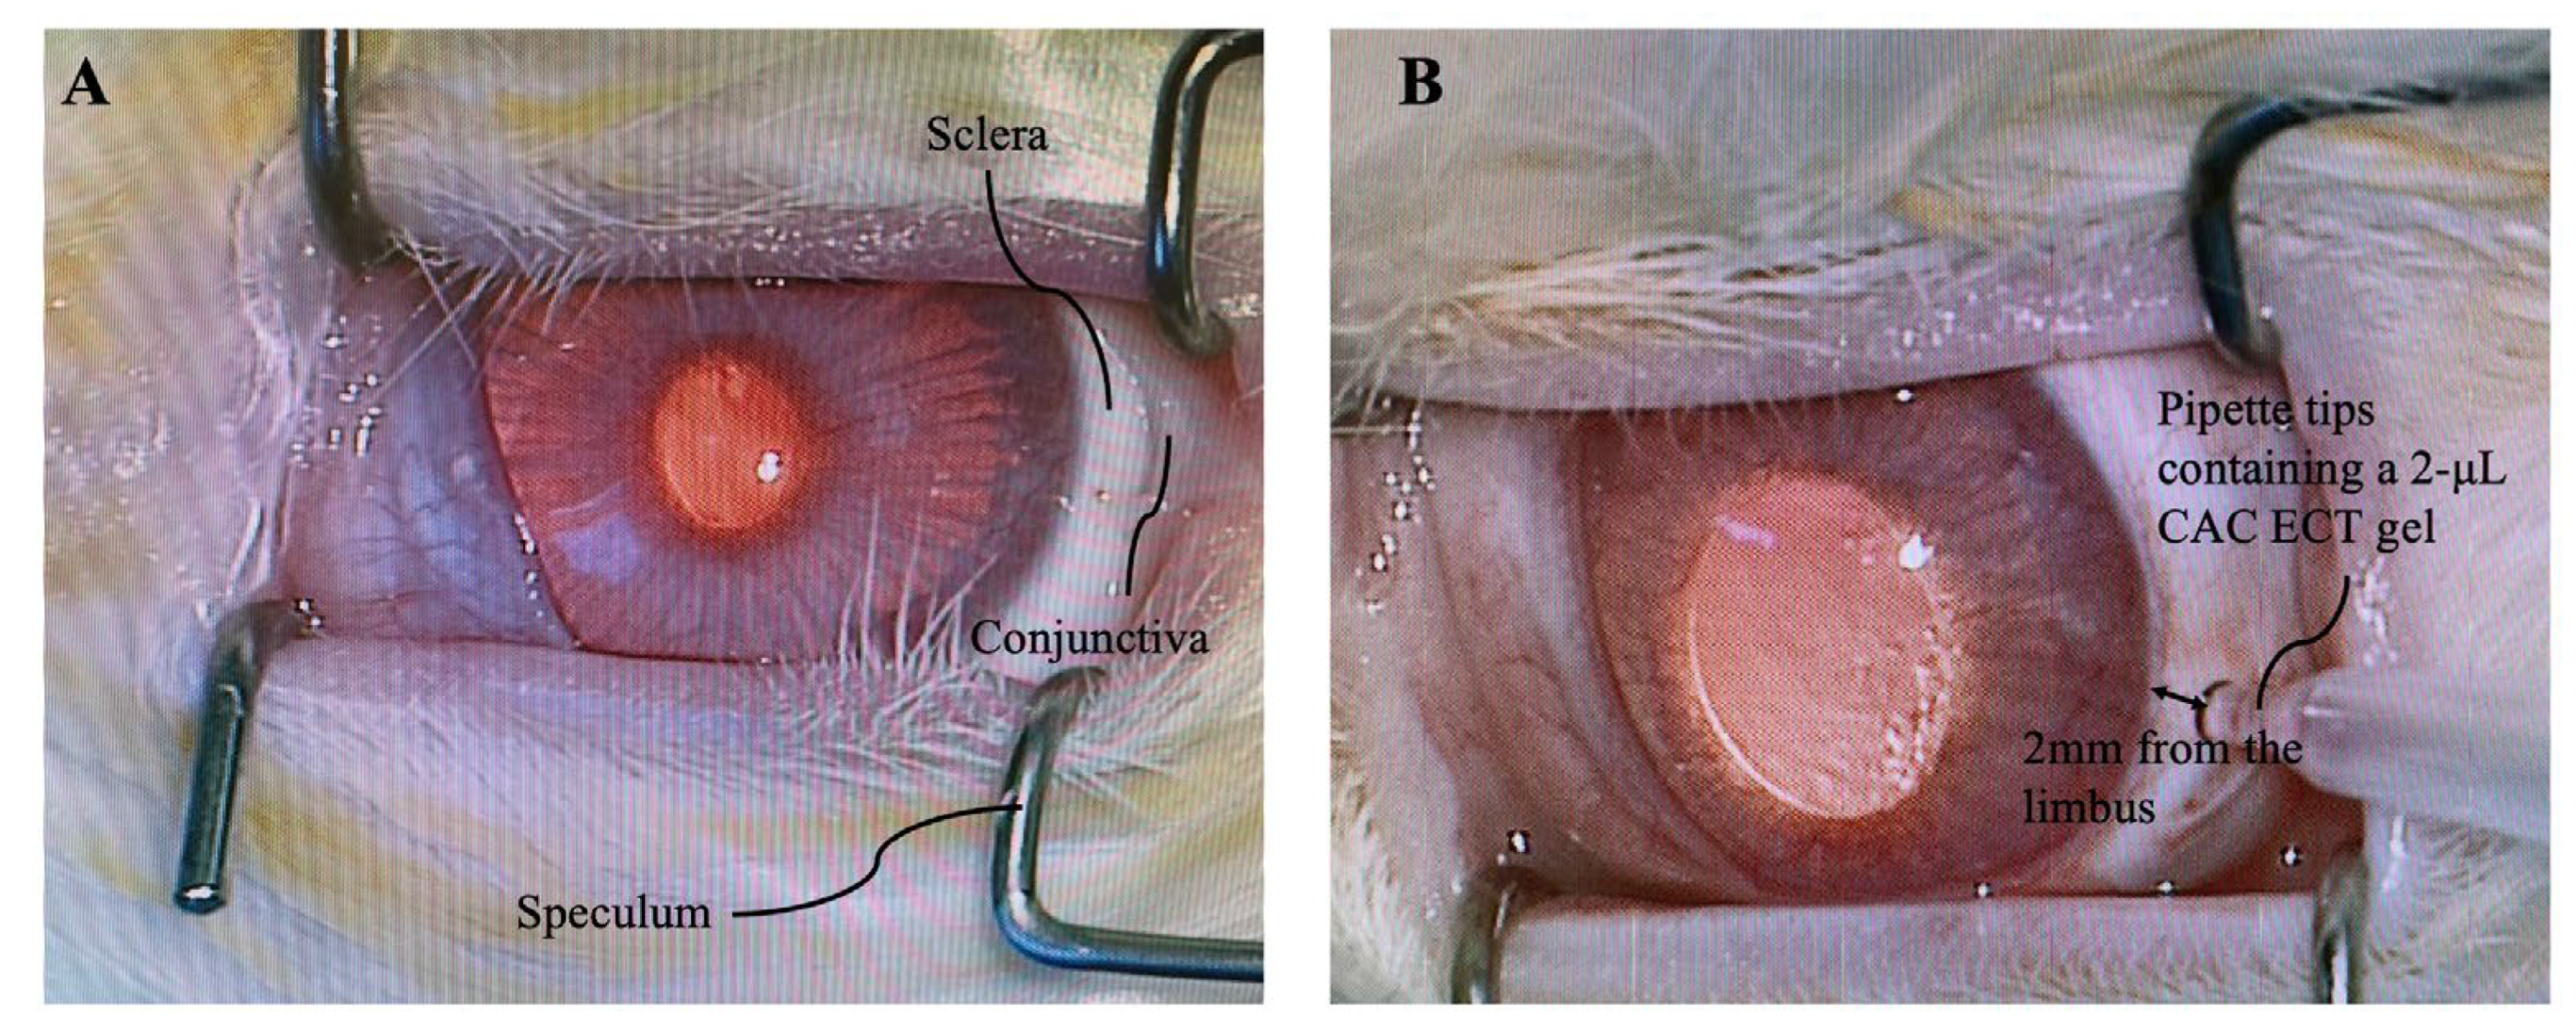
3.5. Intraocular Pressure (IOP), Binocular Ophthalmoscope (BIO) Examination and Body Weight Measurement
3.6. ERG Recording
3.7. Retinal Morphological Examination and Analysis
3.8. Immunohistostaining
3.9. In Vivo Gel Performance Study
3.10. In Vivo Gel Termination Study
3.12. Assessment of Cell Viability and Proliferation
3.13. GDNF Quantification
3.14. Scanning Electron Microscope (SEM)
3.15. Terminal Deoxynucleotidyl Transferase (TdT)-Mediated dUTP Nick end Labelling (TUNEL) Assay
3.16. Statistical Analysis
4. Conclusions
5. Limitation of this Study and Prospective Directions.
Author Contributions
Funding
Institutional Review Board Statement
Data Availability Statement
Conflicts of Interest
References
- Schwartz, S.G.; Scott, I.U.; Flynn Jr, H.W.; Stewart, M.W. Drug delivery techniques for treating age-related macular degeneration. Expert Opin. Drug Deliv. 2014, 11, 61–68. [Google Scholar] [CrossRef]
- Bourne, R.R.A.; Flaxman, S.R.; Braithwaite, T.; Cicinelli, M.V.; Das, A.; Jonas, J.B.; Keeffe, J.; Kempen, J.H.; Leasher, J.; Limburg, H.; et al. Magnitude, temporal trends, and projections of the global prevalence of blindness and distance and near vision impairment: A systematic review and meta-analysis. Lancet Glob Health 2017, 5, e888–e897. [Google Scholar] [CrossRef]
- Yellepeddi, V.K.; Palakurthi, S. Recent Advances in Topical Ocular Drug Delivery. J Ocul Pharmacol Ther 2016, 32, 67–82. [Google Scholar] [CrossRef]
- Reardon, G.; Kotak, S.; Schwartz, G.F. Objective assessment of compliance and persistence among patients treated for glaucoma and ocular hypertension: A systematic review. Patient Prefer Adherence 2011, 5, 441–463. [Google Scholar] [CrossRef]
- Kim, Y.C.; Chiang, B.; Wu, X.; Prausnitz, M.R. Ocular delivery of macromolecules. J Control Release 2014, 190, 172–181. [Google Scholar] [CrossRef]
- Sampat, K.M.; Garg, S.J. Complications of intravitreal injections. Curr Opin Ophthalmol 2010, 21, 178–183. [Google Scholar] [CrossRef] [PubMed]
- Yasukawa, T.; Tabata, Y.; Kimura, H.; Ogura, Y. Recent advances in intraocular drug delivery systems. Recent Pat Drug Deliv Formul 2011, 5, 1–10. [Google Scholar] [CrossRef] [PubMed]
- Orive, G.; Hernández, R.M.; Gascón, A.R.; Calafiore, R.; Chang, T.M.; De Vos, P.; Hortelano, G.; Hunkeler, D.; Lacík, I.; Shapiro, A.M.; et al. Cell encapsulation: Promise and progress. Nat Med 2003, 9, 104–107. [Google Scholar] [CrossRef] [PubMed]
- Kuramoto, S.; Yasuhara, T.; Agari, T.; Kondo, A.; Jing, M.; Kikuchi, Y.; Shinko, A.; Wakamori, T.; Kameda, M.; Wang, F. BDNF-secreting capsule exerts neuroprotective effects on epilepsy model of rats. Brain Res. 2011, 1368, 281–289. [Google Scholar] [CrossRef]
- Aebischer, P.; Pochon, N.; Heyd, B.; Deglon, N.; Joseph, J.; Zurn, A.; Baetge, E.; Hammang, J.; Goddard, M.; Lysaght, M. Gene therapy for amyotrophic lateral sclerosis (ALS) using a polymer encapsulated xenogenic cell line engineered to secrete hCNTF. Hum. Gene Ther. 1996, 7, 851–860. [Google Scholar]
- Orive, G.; Hernández, R.M.; Gascón, A.R.; Calafiore, R.; Chang, T.M.; Vos, P.D.; Hortelano, G.; Hunkeler, D.; Lacík, I.; Shapiro, A.J. Cell encapsulation: Promise and progress. Nat. Med. 2003, 9, 104–107. [Google Scholar] [CrossRef]
- Goldberg, J.L.; Beykin, G.; Satterfield, K.R.; Nuñez, M.; Lam, B.L.; Albini, T.A. Phase I NT-501 Ciliary Neurotrophic Factor Implant Trial for Primary Open-Angle Glaucoma: Safety, Neuroprotection, and Neuroenhancement. Ophthalmol. Sci. 2023, 3. [Google Scholar] [CrossRef] [PubMed]
- Piller Puicher, E.; Tomanin, R.; Salvalaio, M.; Friso, A.; Hortelano, G.; Marin, O.; Scarpa, M. Encapsulated engineered myoblasts can cure Hurler syndrome: Preclinical experiments in the mouse model. Gene Ther. 2012, 19, 355–364. [Google Scholar] [CrossRef]
- Dubrot, J.; Portero, A.; Orive, G.; Hernández, R.M.; Palazón, A.; Rouzaut, A.; Perez-Gracia, J.L.; Hervás-Stubbs, S.; Pedraz, J.L.; Melero, I. Delivery of immunostimulatory monoclonal antibodies by encapsulated hybridoma cells. Cancer Immunol. Immunother. 2010, 59, 1621–1631. [Google Scholar] [CrossRef] [PubMed]
- Tao, W.; Wen, R.; Goddard, M.B.; Sherman, S.D.; O’Rourke, P.J.; Stabila, P.F.; Bell, W.J.; Dean, B.J.; Kauper, K.A.; Budz, V.A.; et al. Encapsulated cell-based delivery of CNTF reduces photoreceptor degeneration in animal models of retinitis pigmentosa. Invest Ophthalmol Vis Sci 2002, 43, 3292–3298. [Google Scholar] [PubMed]
- Kang-Mieler, J.J.; Rudeen, K.M.; Liu, W.; Mieler, W.F. Advances in ocular drug delivery systems. Eye 2020, 34, 1371–1379. [Google Scholar] [CrossRef] [PubMed]
- Kiss, S. Interim Results and Key Learnings from an Ongoing Phase 2 Study of Encapsulated Cell Therapy Compared to Aflibercept in Patients With Wet AMD. In Proceedings of the American Society of Retina Specialists annual meeting, San Francisco, CA, USA, 9–14 August 2016. [Google Scholar]
- Lin, J.B.; Murakami, Y.; Miller, J.W.; Vavvas, D.G. Neuroprotection for Age-Related Macular Degeneration. Ophthalmol Sci 2022, 2, 100192. [Google Scholar] [CrossRef] [PubMed]
- Frasson, M.; Picaud, S.; Léveillard, T.; Simonutti, M.; Mohand–Said, S.; Dreyfus, H.; Hicks, D.; Sahel, J. Glial Cell Line–Derived Neurotrophic Factor Induces Histologic and Functional Protection of Rod Photoreceptors in the rd/rd Mouse. Investig. Ophthalmol. Vis. Sci. 1999, 40, 2724–2734. [Google Scholar]
- Orive, G.; Santos, E.; Poncelet, D.; Hernández, R.M.; Pedraz, J.L.; Wahlberg, L.U.; De Vos, P.; Emerich, D. Cell encapsulation: Technical and clinical advances. Trends Pharmacol. Sci. 2015, 36, 537–546. [Google Scholar] [CrossRef]
- An, D.; Chiu, A.; Flanders, J.A.; Song, W.; Shou, D.; Lu, Y.-C.; Grunnet, L.G.; Winkel, L.; Ingvorsen, C.; Christophersen, N.S. Designing a retrievable and scalable cell encapsulation device for potential treatment of type 1 diabetes. Proc. Natl. Acad. Sci. USA 2018, 115, E263–E272. [Google Scholar] [CrossRef]
- Lee, K.Y.; Mooney, D.J. Alginate: Properties and biomedical applications. Prog Polym Sci 2012, 37, 106–126. [Google Scholar] [CrossRef] [PubMed]
- Ghidoni, I.; Chlapanidas, T.; Bucco, M.; Crovato, F.; Marazzi, M.; Vigo, D.; Torre, M.L.; Faustini, M. Alginate cell encapsulation: New advances in reproduction and cartilage regenerative medicine. Cytotechnology 2008, 58, 49–56. [Google Scholar] [CrossRef] [PubMed]
- Andersen, T.; Auk-Emblem, P.; Dornish, M. 3D Cell Culture in Alginate Hydrogels. Microarrays 2015, 4, 133–161. [Google Scholar] [CrossRef] [PubMed]
- Sun, J.; Xiao, W.; Tang, Y.; Li, K.; Fan, H. Biomimetic interpenetrating polymer network hydrogels based on methacrylated alginate and collagen for 3D pre-osteoblast spreading and osteogenic differentiation. Soft Matter 2012, 8, 2398–2404. [Google Scholar] [CrossRef]
- Sang, L.; Luo, D.; Xu, S.; Wang, X.; Li, X. Fabrication and evaluation of biomimetic scaffolds by using collagen–alginate fibrillar gels for potential tissue engineering applications. Mater. Sci. Eng. C 2011, 31, 262–271. [Google Scholar] [CrossRef]
- Thackaberry, E.A.; Lorget, F.; Farman, C.; Bantseev, V. The safety evaluation of long-acting ocular delivery systems. Drug Discov Today 2019, 24, 1539–1550. [Google Scholar] [CrossRef] [PubMed]
- Ahn, S.J.; Hong, H.K.; Na, Y.M.; Park, S.J.; Ahn, J.; Oh, J.; Chung, J.Y.; Park, K.H.; Woo, S.J. Use of Rabbit Eyes in Pharmacokinetic Studies of Intraocular Drugs. J Vis Exp 2016. [Google Scholar] [CrossRef]
- del Amo, E.M.; Urtti, A. Rabbit as an animal model for intravitreal pharmacokinetics: Clinical predictability and quality of the published data. Exp. Eye Res. 2015, 137, 111–124. [Google Scholar] [CrossRef]
- Okonkwo, O.N.; Tripathy, K. Ocular Hypotony. In StatPearls; Copyright © 2023, StatPearls Publishing LLC.: Treasure Island, FL, USA, 2023. [Google Scholar]
- Lee, B.R.; Hwang, J.W.; Choi, Y.Y.; Wong, S.F.; Hwang, Y.H.; Lee, D.Y.; Lee, S.-H. In situ formation and collagen-alginate composite encapsulation of pancreatic islet spheroids. Biomaterials 2012, 33, 837–845. [Google Scholar] [CrossRef]
- Wong, F.S.Y.; Tsang, K.K.; Chu, A.M.W.; Chan, B.P.; Yao, K.M.; Lo, A.C.Y. Injectable cell-encapsulating composite alginate-collagen platform with inducible termination switch for safer ocular drug delivery. Biomaterials 2019, 201, 53–67. [Google Scholar] [CrossRef]
- Anderson, J.M.; Rodriguez, A.; Chang, D.T. Foreign body reaction to biomaterials. Semin Immunol 2008, 20, 86–100. [Google Scholar] [CrossRef] [PubMed]
- Madeira, M.H.; Elvas, F.; Boia, R.; Gonçalves, F.Q.; Cunha, R.A.; Ambrósio, A.F.; Santiago, A.R. Adenosine A2AR blockade prevents neuroinflammation-induced death of retinal ganglion cells caused by elevated pressure. J Neuroinflammation 2015, 12, 115. [Google Scholar] [CrossRef] [PubMed]
- Wolf, S.A.; Boddeke, H.W.; Kettenmann, H. Microglia in Physiology and Disease. Annu Rev Physiol 2017, 79, 619–643. [Google Scholar] [CrossRef]
- Mizutani, M.; Gerhardinger, C.; Lorenzi, M. Müller cell changes in human diabetic retinopathy. Diabetes 1998, 47, 445–449. [Google Scholar] [CrossRef]
- Burkersroda, F.v.; Schedl, L.; Göpferich, A. Why degradable polymers undergo surface erosion or bulk erosion. Biomaterials 2002, 23, 4221–4231. [Google Scholar] [CrossRef]
- Lewis, G.P.; Fisher, S.K. Up-regulation of glial fibrillary acidic protein in response to retinal injury: Its potential role in glial remodeling and a comparison to vimentin expression. Int Rev Cytol 2003, 230, 263–290. [Google Scholar] [CrossRef] [PubMed]
- Kimble, T.D.; Fitzgerald, M.E.; Reiner, A. Sustained upregulation of glial fibrillary acidic protein in Müller cells in pigeon retina following disruption of the parasympathetic control of choroidal blood flow. Exp Eye Res 2006, 83, 1017–1030. [Google Scholar] [CrossRef]
- Giordano, G.G.; Chevez-Barrios, P.; Refojo, M.F.; Garcia, C.A. Biodegradation and tissue reaction to intravitreous biodegradable poly(D,L-lactic-co-glycolic)acid microspheres. Curr Eye Res 1995, 14, 761–768. [Google Scholar] [CrossRef]
- Boia, R.; Dias, P.A.N.; Martins, J.M.; Galindo-Romero, C.; Aires, I.D.; Vidal-Sanz, M.; Agudo-Barriuso, M.; de Sousa, H.C.; Ambrósio, A.F.; Braga, M.E.M.; et al. Porous poly(ε-caprolactone) implants: A novel strategy for efficient intraocular drug delivery. J Control Release 2019, 316, 331–348. [Google Scholar] [CrossRef]
- Bringmann, A.; Pannicke, T.; Grosche, J.; Francke, M.; Wiedemann, P.; Skatchkov, S.N.; Osborne, N.N.; Reichenbach, A. Müller cells in the healthy and diseased retina. Prog Retin Eye Res 2006, 25, 397–424. [Google Scholar] [CrossRef]
- Orive, G.; Santos, E.; Poncelet, D.; Hernández, R.M.; Pedraz, J.L.; Wahlberg, L.U.; De Vos, P.; Emerich, D. Cell encapsulation: Technical and clinical advances. Trends Pharmacol Sci 2015, 36, 537–546. [Google Scholar] [CrossRef] [PubMed]
- Smidsrød, O.; Skjåk-Braek, G. Alginate as immobilization matrix for cells. Trends Biotechnol 1990, 8, 71–78. [Google Scholar] [CrossRef] [PubMed]
- Ashimova, A.; Yegorov, S.; Negmetzhanov, B.; Hortelano, G. Cell Encapsulation Within Alginate Microcapsules: Immunological Challenges and Outlook. Front. Bioeng. Biotechnol. 2019, 7. [Google Scholar] [CrossRef] [PubMed]
- Arifin, D.R.; Kulkarni, M.; Kadayakkara, D.; Bulte, J.W.M. Fluorocapsules allow in vivo monitoring of the mechanical stability of encapsulated islet cell transplants. Biomaterials 2019, 221, 119410. [Google Scholar] [CrossRef] [PubMed]
- Yang, X.; Lu, Z.; Wu, H.; Li, W.; Zheng, L.; Zhao, J. Collagen-alginate as bioink for three-dimensional (3D) cell printing based cartilage tissue engineering. Mater. Sci. Eng. C 2018, 83, 195–201. [Google Scholar] [CrossRef] [PubMed]
- Birkedal-Hansen, H.; Moore, W.G.; Bodden, M.K.; Windsor, L.J.; Birkedal-Hansen, B.; DeCarlo, A.; Engler, J.A. Matrix metalloproteinases: A review. Crit Rev Oral Biol Med 1993, 4, 197–250. [Google Scholar] [CrossRef] [PubMed]
- Aimes, R.T.; Quigley, J.P. Matrix Metalloproteinase-2 Is an Interstitial Collagenase: INHIBITOR-FREE ENZYME CATALYZES THE CLEAVAGE OF COLLAGEN FIBRILS AND SOLUBLE NATIVE TYPE I COLLAGEN GENERATING THE SPECIFIC ¾- AND ¼-LENGTH FRAGMENTS (∗). J. Biol. Chem. 1995, 270, 5872–5876. [Google Scholar] [CrossRef] [PubMed]
- Jin, M.; Kashiwagi, K.; Iizuka, Y.; Tanaka, Y.; Imai, M.; Tsukahara, S. Matrix metalloproteinases in human diabetic and nondiabetic vitreous. Retina 2001, 21, 28–33. [Google Scholar] [CrossRef] [PubMed]
- Kokavec, J.; Min, S.H.; Tan, M.H.; Gilhotra, J.S.; Newland, H.S.; Durkin, S.R.; Grigg, J.; Casson, R.J. Biochemical analysis of the living human vitreous. Clin. Exp. Ophthalmol. 2016, 44, 597–609. [Google Scholar] [CrossRef]
- Farmer, J.G.; Benomran, F.; Watson, A.A.; Harland, W.A. Magnesium, potassium, sodium and calcium in post-mortem vitreous humour from humans. Forensic Sci Int 1985, 27, 1–13. [Google Scholar] [CrossRef]
- Brown, D.J.; Bishop, P.; Hamdi, H.; Kenney, M.C. Cleavage of structural components of mammalian vitreous by endogenous matrix metalloproteinase-2. Curr Eye Res 1996, 15, 439–445. [Google Scholar] [CrossRef] [PubMed]
- Bochenek, M.A.; Veiseh, O.; Vegas, A.J.; McGarrigle, J.J.; Qi, M.; Marchese, E.; Omami, M.; Doloff, J.C.; Mendoza-Elias, J.; Nourmohammadzadeh, M.; et al. Alginate encapsulation as long-term immune protection of allogeneic pancreatic islet cells transplanted into the omental bursa of macaques. Nat Biomed Eng 2018, 2, 810–821. [Google Scholar] [CrossRef] [PubMed]
- Strand, B.L.; Coron, A.E.; Skjak-Braek, G. Current and future perspectives on alginate encapsulated pancreatic islet. Stem Cells Transl. Med. 2017, 6, 1053–1058. [Google Scholar] [CrossRef] [PubMed]
- Wang, F.; He, S.; Chen, B. Retinoic acid-loaded alginate microspheres as a slow release drug delivery carrier for intravitreal treatment. Biomed. Pharmacother. 2018, 97, 722–728. [Google Scholar] [CrossRef] [PubMed]
- Medawar, P. Immunity to homologous grafted skin. III. The fate of skin homographs transplanted to the brain, to subcutaneous tissue, and to the anterior chamber of the eye. Br. J. Exp. Pathol. 1948, 29, 58. [Google Scholar] [PubMed]
- Ahn, Y.H.; Bensadoun, J.C.; Aebischer, P.; Zurn, A.D.; Seiger, A.; Björklund, A.; Lindvall, O.; Wahlberg, L.; Brundin, P.; Kaminski Schierle, G.S. Increased fiber outgrowth from xeno-transplanted human embryonic dopaminergic neurons with co-implants of polymer-encapsulated genetically modified cells releasing glial cell line-derived neurotrophic factor. Brain Res Bull 2005, 66, 135–142. [Google Scholar] [CrossRef] [PubMed]
- Aydin, E.; Kazi, A.A.; Peyman, G.A.; Esfahani, M.R.; Muñoz-Morales, A.; Kivilcim, M.; Caro-Magdaleno, M. [Retinal toxicity of intravitreal doxycycline. A pilot study]. Arch Soc Esp Oftalmol 2007, 82, 223–228. [Google Scholar] [CrossRef]
- Mileva, R.; Rusenov, A.; Milanova, A. Population Pharmacokinetic Modelling of Orally Administered Doxycycline to Rabbits at Different Ages. Antibiotics 2021, 10. [Google Scholar] [CrossRef] [PubMed]
- Al-Maweri, S.A.; Halboub, E.; Ashraf, S.; Alqutaibi, A.Y.; Qaid, N.M.; Yahya, K.; Alhajj, M.N. Single application of topical doxycycline in management of recurrent aphthous stomatitis: A systematic review and meta-analysis of the available evidence. BMC Oral Health 2020, 20, 231. [Google Scholar] [CrossRef]
- RIOND, J.-L.; RIVIERE, J.E.; DUCKETT, W.M.; ATKINS, C.E.; JERNIGAN, A.D.; RIKIHISA, Y.; SPURLOCK, S.L. Cardiovascular effects and fatalities associated with intravenous administration of doxycycline to horses and ponies. Equine Vet. J. 1992, 24, 41–45. [Google Scholar] [CrossRef]
- Dogbevia, G.K.; Marticorena-Alvarez, R.; Bausen, M.; Sprengel, R.; Hasan, M.T. Inducible and combinatorial gene manipulation in mouse brain. Front Cell Neurosci 2015, 9, 142. [Google Scholar] [CrossRef] [PubMed]
- McGee Sanftner, L.H.; Rendahl, K.G.; Quiroz, D.; Coyne, M.; Ladner, M.; Manning, W.C.; Flannery, J.G. Recombinant AAV-Mediated Delivery of a Tet-Inducible Reporter Gene to the Rat Retina. Mol. Ther. 2001, 3, 688–696. [Google Scholar] [CrossRef] [PubMed]
- Chen, C.J.; Gillett, A.; Booth, R.; Kimble, B.; Govendir, M. Pharmacokinetic Profile of Doxycycline in Koala Plasma after Weekly Subcutaneous Injections for the Treatment of Chlamydiosis. Animals 2022, 12. [Google Scholar] [CrossRef]
- Ejstrup, R.; Kiilgaard, J.F.; Tucker, B.A.; Klassen, H.J.; Young, M.J.; La Cour, M. Pharmacokinetics of intravitreal glial cell line-derived neurotrophic factor: Experimental studies in pigs. Exp Eye Res 2010, 91, 890–895. [Google Scholar] [CrossRef]
- Santa-Cecília, F.V.; Leite, C.A.; Del-Bel, E.; Raisman-Vozari, R. The Neuroprotective Effect of Doxycycline on Neurodegenerative Diseases. Neurotox. Res. 2019, 35, 981–986. [Google Scholar] [CrossRef] [PubMed]
- Scott, I.U.; Jackson, G.R.; Quillen, D.A.; Larsen, M.; Klein, R.; Liao, J.; Holfort, S.; Munch, I.C.; Gardner, T.W. Effect of doxycycline vs placebo on retinal function and diabetic retinopathy progression in patients with severe nonproliferative or non-high-risk proliferative diabetic retinopathy: A randomized clinical trial. JAMA Ophthalmol 2014, 132, 535–543. [Google Scholar] [CrossRef]
- Kiuchi, K.; Yoshizawa, K.; Shikata, N.; Moriguchi, K.; Tsubura, A. Morphologic characteristics of retinal degeneration induced by sodium iodate in mice. Curr Eye Res 2002, 25, 373–379. [Google Scholar] [CrossRef]
- Potic, J.; Bergin, C.; Giacuzzo, C.; Daruich, A.; Pournaras, J.-A.; Kowalczuk, L.; Behar-Cohen, F.; Konstantinidis, L.; Wolfensberger, T.J. Changes in visual acuity and photoreceptor density using adaptive optics after retinal detachment repair. Retina 2020, 40, 376–386. [Google Scholar] [CrossRef]
- Park, D.H.; Choi, K.S.; Sun, H.J.; Lee, S.J. Factors associated with visual outcome after macula-off rhegmatogenous retinal detachment surgery. Retina 2018, 38, 137–147. [Google Scholar] [CrossRef]
- Chowers, G.; Cohen, M.; Marks-Ohana, D.; Stika, S.; Eijzenberg, A.; Banin, E.; Obolensky, A. Course of Sodium Iodate–Induced Retinal Degeneration in Albino and Pigmented Mice. Investig. Ophthalmol. Vis. Sci. 2017, 58, 2239–2249. [Google Scholar] [CrossRef]
- Paolone, G.; Falcicchia, C.; Lovisari, F.; Kokaia, M.; Bell, W.J.; Fradet, T.; Barbieri, M.; Wahlberg, L.U.; Emerich, D.F.; Simonato, M. Long-Term, Targeted Delivery of GDNF from Encapsulated Cells Is Neuroprotective and Reduces Seizures in the Pilocarpine Model of Epilepsy. J Neurosci 2019, 39, 2144–2156. [Google Scholar] [CrossRef] [PubMed]
- Lindvall, O.; Wahlberg, L.U. Encapsulated cell biodelivery of GDNF: A novel clinical strategy for neuroprotection and neuroregeneration in Parkinson’s disease? Exp Neurol 2008, 209, 82–88. [Google Scholar] [CrossRef] [PubMed]
- Balmer, J.; Zulliger, R.; Roberti, S.; Enzmann, V. Retinal Cell Death Caused by Sodium Iodate Involves Multiple Caspase-Dependent and Caspase-Independent Cell-Death Pathways. Int J Mol Sci 2015, 16, 15086–15103. [Google Scholar] [CrossRef] [PubMed]
- Dunaief, J.L.; Dentchev, T.; Ying, G.-S.; Milam, A.H. The Role of Apoptosis in Age-Related Macular Degeneration. Arch. Ophthalmol. 2002, 120, 1435–1442. [Google Scholar] [CrossRef] [PubMed]
- Enzbrenner, A.; Zulliger, R.; Biber, J.; Pousa, A.M.Q.; Schäfer, N.; Stucki, C.; Giroud, N.; Berrera, M.; Kortvely, E.; Schmucki, R.; et al. Sodium Iodate-Induced Degeneration Results in Local Complement Changes and Inflammatory Processes in Murine Retina. Int J Mol Sci 2021, 22. [Google Scholar] [CrossRef] [PubMed]
- Ahn, S.M.; Ahn, J.; Cha, S.; Yun, C.; Park, T.K.; Kim, Y.-J.; Goo, Y.S.; Kim, S.-W. The effects of intravitreal sodium iodate injection on retinal degeneration following vitrectomy in rabbits. Sci. Rep. 2019, 9, 1–10. [Google Scholar] [CrossRef] [PubMed]
- Ma, D.; Chen, C.-B.; Liang, J.; Lu, Z.; Chen, H.; Zhang, M. Repeatability, reproducibility and agreement of intraocular pressure measurement in rabbits by the TonoVet and Tono-Pen. Sci. Rep. 2016, 6, 35187. [Google Scholar] [CrossRef] [PubMed]
- Jiao, H.; Provis, J.M.; Natoli, R.; Rutar, M. Ablation of C3 modulates macrophage reactivity in the outer retina during photo-oxidative damage. Mol Vis 2020, 26, 679–690. [Google Scholar] [PubMed]
- Zhou, R.; Li, Y.; Qian, H.; Maminishkis, A.; Jha, B.; Campos, M.M.; Amaral, J.; Stanzel, B.; Bharti, K. Sodium iodate-induced retina and choroid damage model in rabbits to test efficacy of RPE auto-transplants. Investig. Ophthalmol. Vis. Sci. 2016, 57, 2253–2253. [Google Scholar]
- Zhang, X.; Cheng, M.; Chintala, S.K. Kainic acid-mediated upregulation of matrix metalloproteinase-9 promotes retinal degeneration. Investig. Ophthalmol. Vis. Sci. 2004, 45, 2374–2383. [Google Scholar] [CrossRef]
- Kondo, M.; Sakai, T.; Komeima, K.; Kurimoto, Y.; Ueno, S.; Nishizawa, Y.; Usukura, J.; Fujikado, T.; Tano, Y.; Terasaki, H. Generation of a Transgenic Rabbit Model of Retinal Degeneration. Investig. Ophthalmol. Vis. Sci. 2009, 50, 1371–1377. [Google Scholar] [CrossRef]

| Unoperated control | Operated control | 3-gel | 6-gel | |
|---|---|---|---|---|
| Body weight (kg) | 3.23±0.17 | 3.35±0.12 | 3.27±0.22 | 3.33±0.19 |
| IOP (mmHg) | 18.75±0.77 | 17.13±0.74 | 14.27±0.74 | 13.5±0.70 |
Disclaimer/Publisher’s Note: The statements, opinions and data contained in all publications are solely those of the individual author(s) and contributor(s) and not of MDPI and/or the editor(s). MDPI and/or the editor(s) disclaim responsibility for any injury to people or property resulting from any ideas, methods, instructions or products referred to in the content. |
© 2024 by the authors. Licensee MDPI, Basel, Switzerland. This article is an open access article distributed under the terms and conditions of the Creative Commons Attribution (CC BY) license (http://creativecommons.org/licenses/by/4.0/).


