3.3. Chronoamperometry
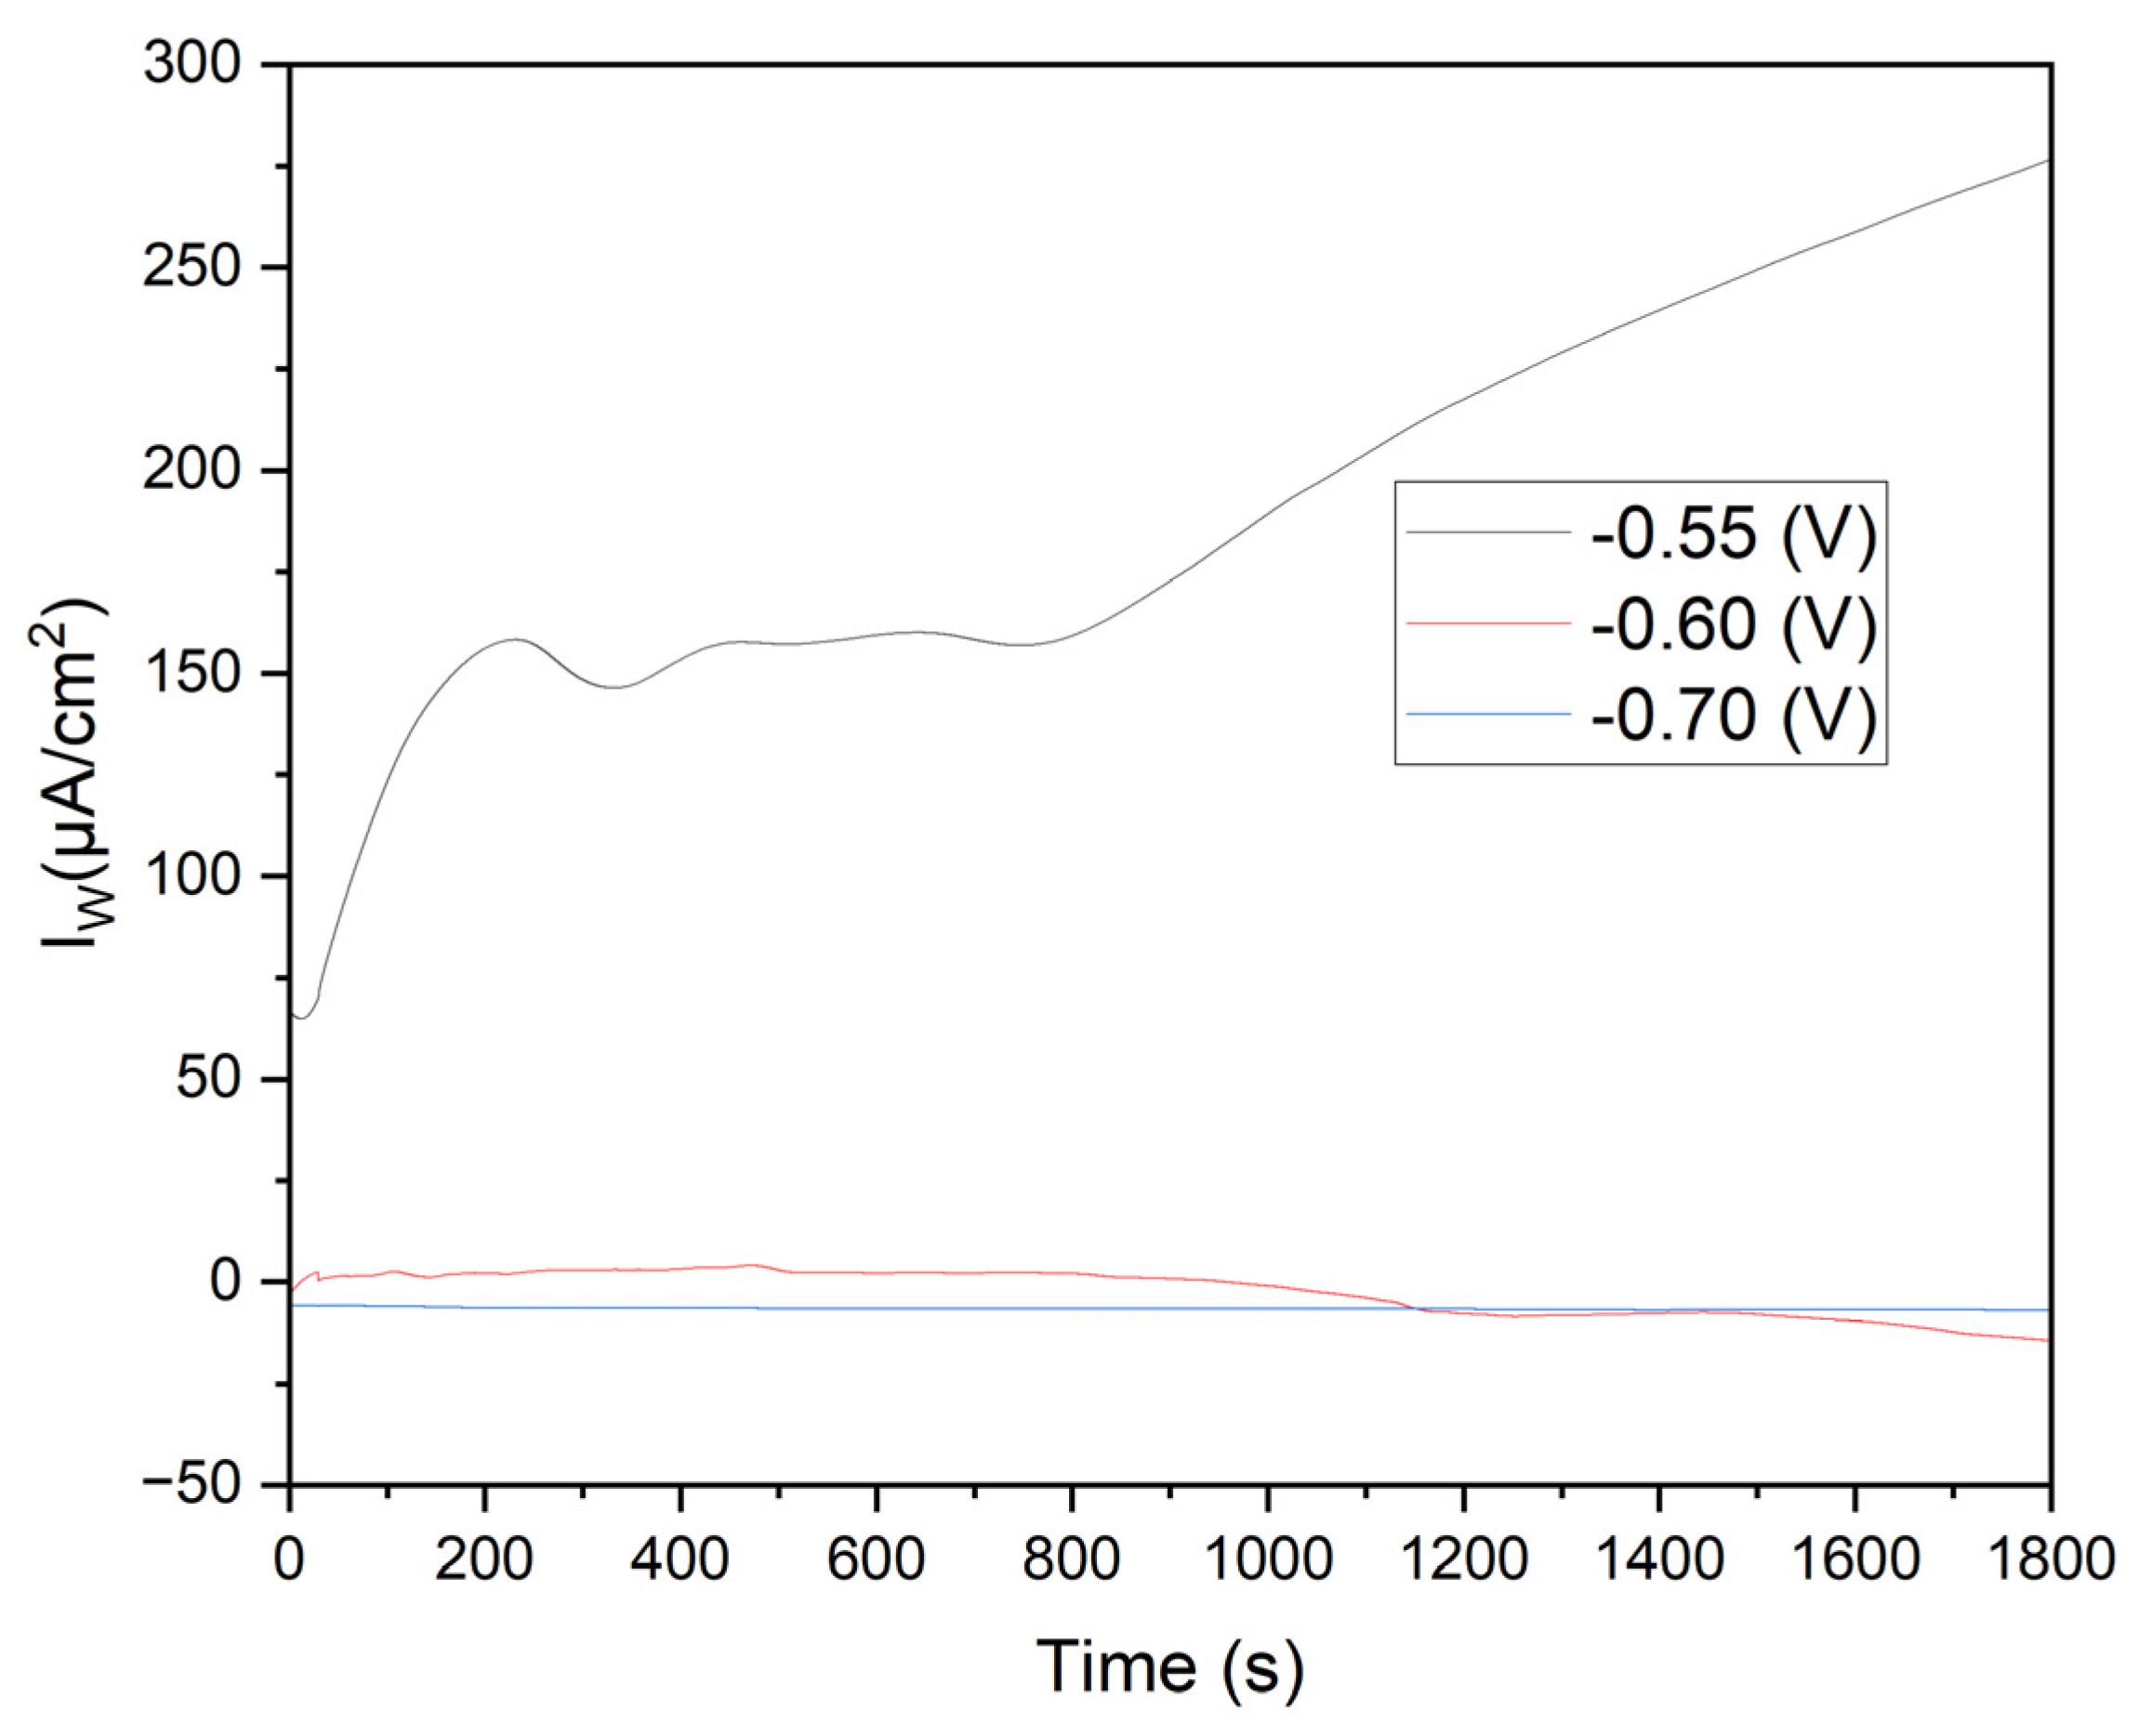
The potential of -0.70 V was chosen due to its proximity to the cathodic peak observed in cyclic voltammetry, where the reduction of Mn²⁺ to Mn is most pronounced. This potential ensures effective and consistent Mn²⁺ reduction, providing excellent manganese coverage on the electrode, which is crucial for maximizing corrosion resistance.
The potential of -0.60 V was selected to explore a slightly less negative range, assessing the efficiency of Mn²⁺ reduction under conditions with significant cathodic current but reduced capacitive and transient effects. This allows for a precise comparative evaluation of the manganese coating's quality and characteristics formed under different electrochemical conditions.
The potential of -0.55 V was chosen to investigate the system's behavior at an even less negative potential, where Mn²⁺ reduction is less favorable. This helps to evaluate the impact of a potential closer to the OCP on manganese coating formation, determining the minimum energy required for effective reduction and allowing for critical comparison with results at -0.70 V and -0.60 V.
The
Figure 6 shows the current density (Iw) versus time for three applied potentials. At -0.55 V (black line), the initial current density is approximately 150 μA/cm², gradually increasing to over 250 μA/cm² by the experiment's end. This behavior indicates significant oxidation on the annealed steel electrode, likely described by the reaction:
The KCl in the solution enhances ionic conductivity, facilitating ion transport and improving the kinetics of electrochemical reactions. Cl⁻ ions can penetrate oxide layers on metals, promoting the formation of soluble corrosion products and continuous iron oxidation.
Effect of Manganese Sulfate (MnSO₄·H₂O): Mn²⁺ in the solution can influence passive layer formation on steel. While Mn²⁺ ions do not directly participate in iron oxidation, their presence can alter the properties of the oxide film, potentially making it more porous and allowing sustained oxidation.
The
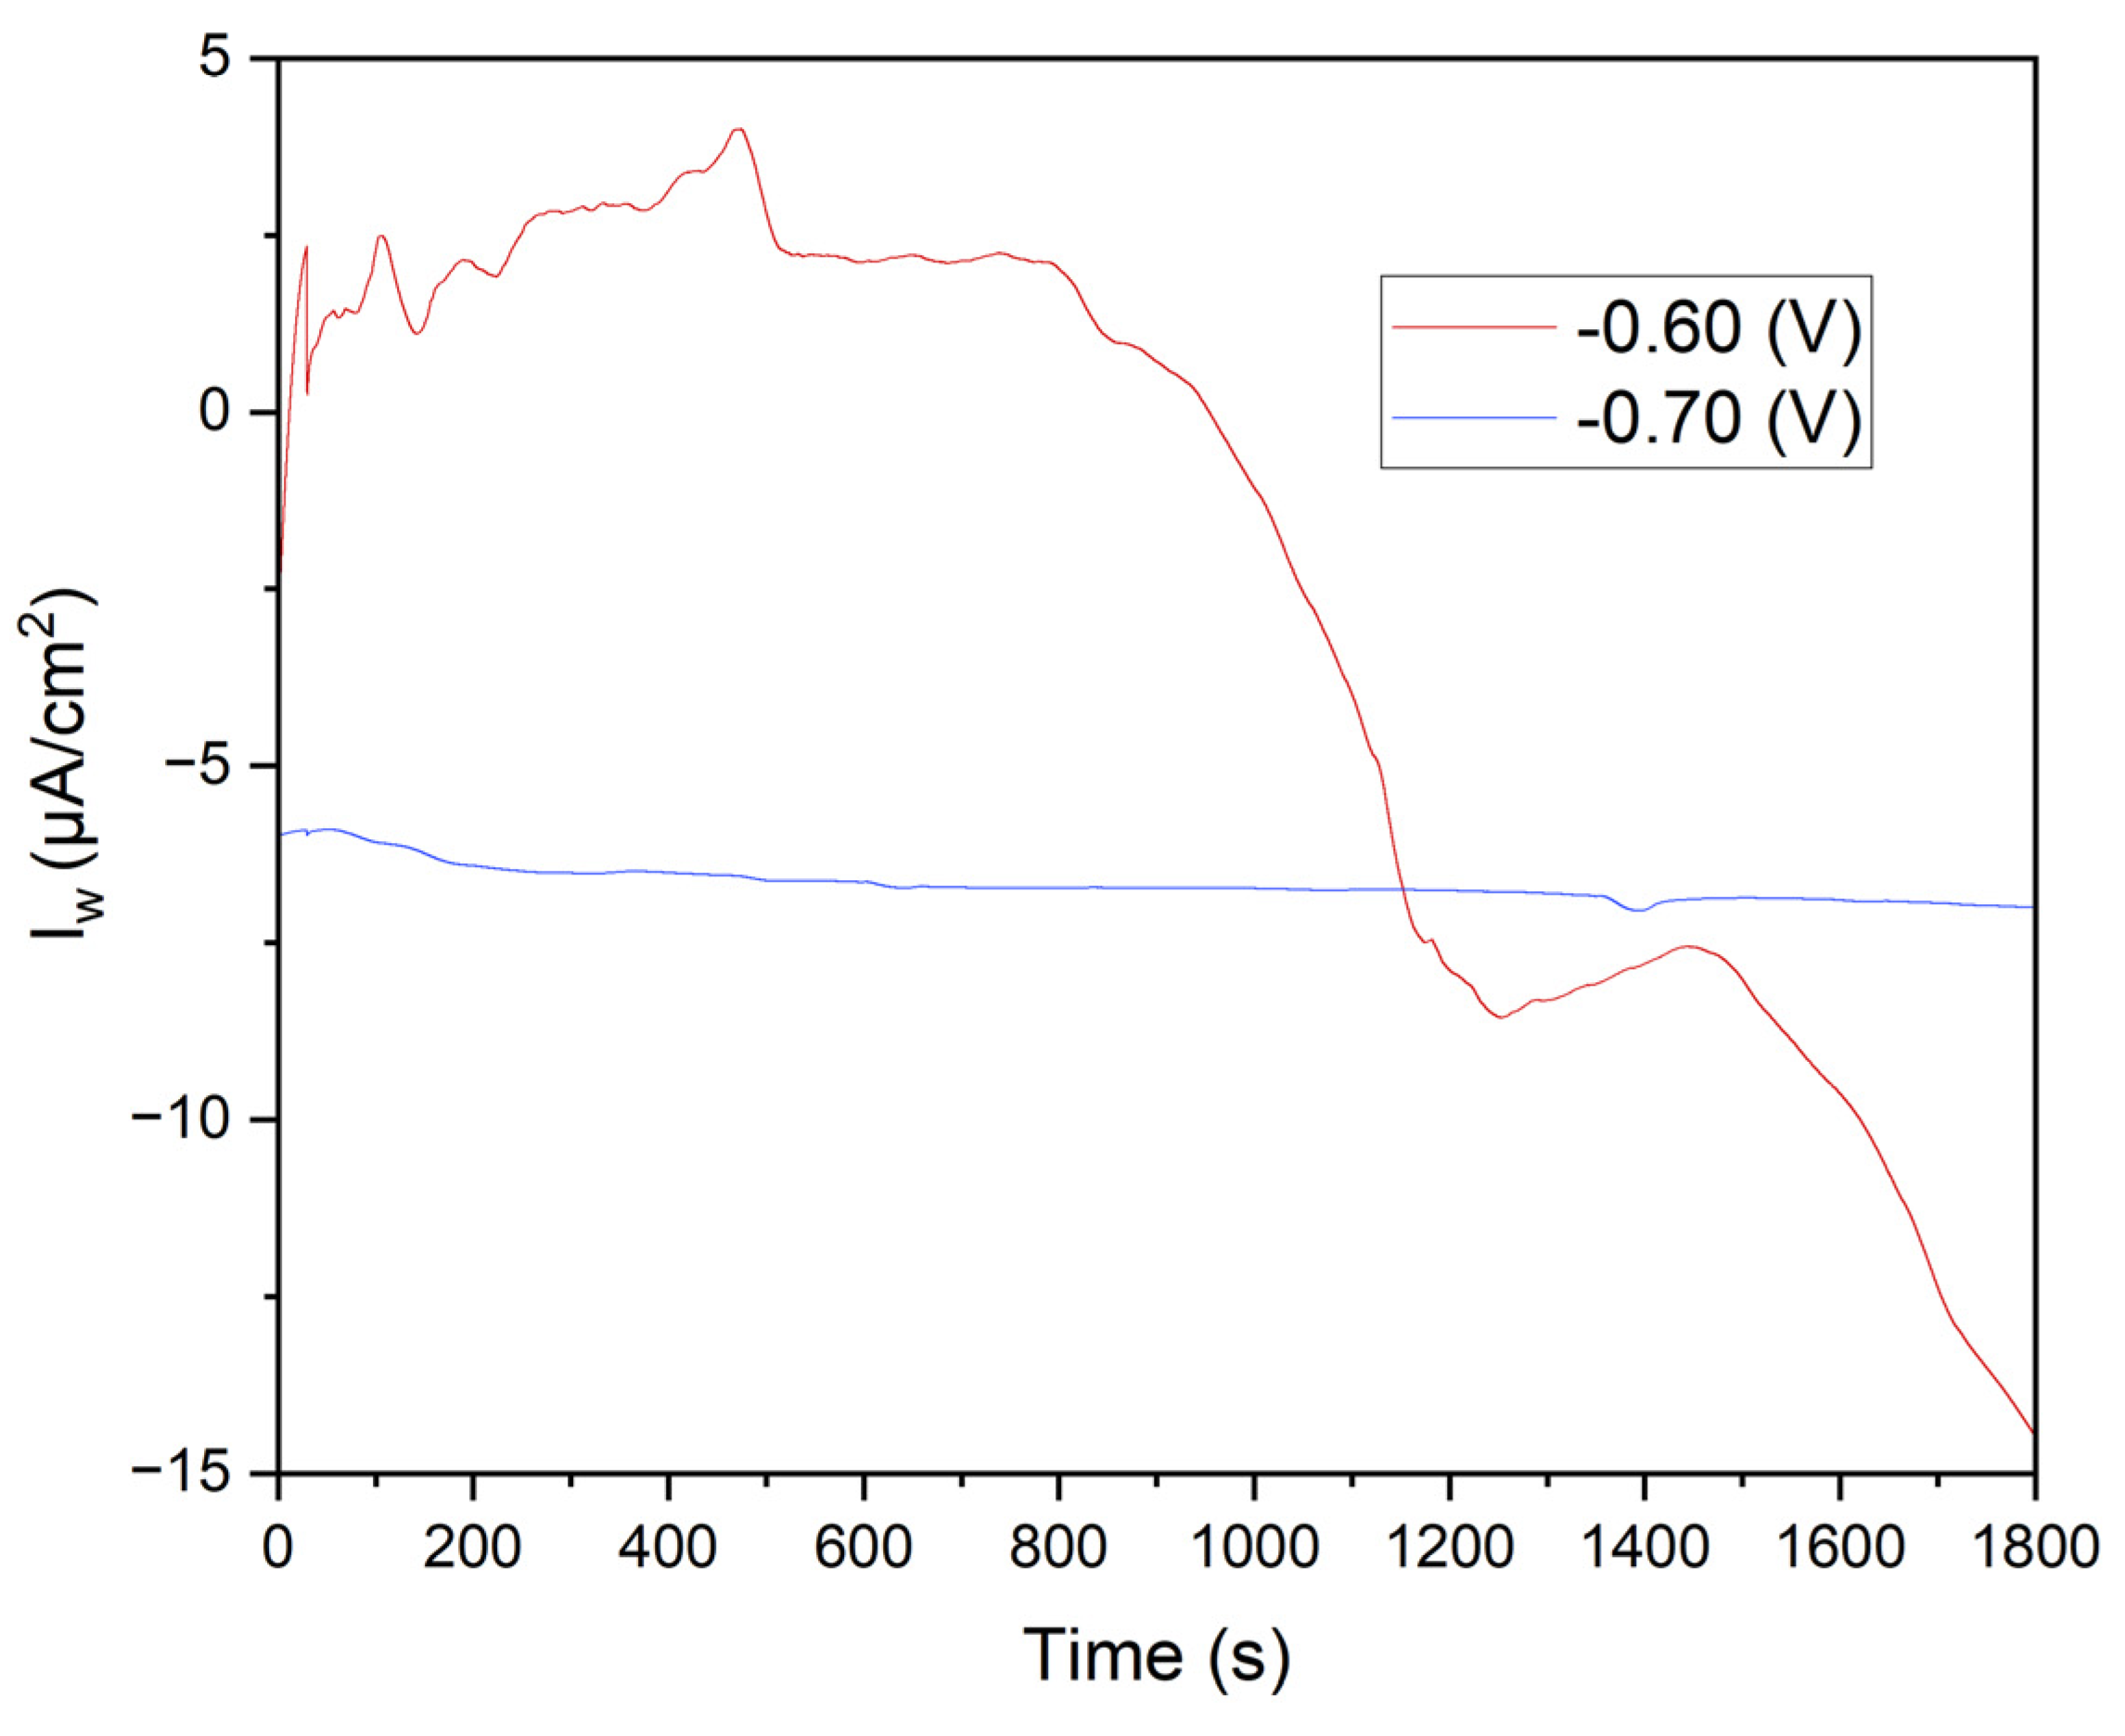
Figure 7 displays the chronoamperometry curves obtained at potentials of -0.60 V and -0.70 V over 1800 seconds. The variations in current density highlight critical differences in electrochemical behavior and the effectiveness of Mn²⁺ reduction under different potential conditions.
This study confirms that chronoamperometry at varying potentials accurately evaluates manganese electrodeposition efficiency and its impact on the corrosion resistance of annealed steel. Results show that -0.70 V provides uniform and highly effective manganese coverage, significantly reducing corrosion current density. MnSO₄·H₂O and KCl solutions play crucial roles in coating formation and stability, enhancing the protective properties of the steel electrode.
These findings provide a robust basis for optimizing manganese electrodeposition conditions, improving the durability and corrosion resistance of metallic coatings in industrial and research applications. A detailed understanding and control of these electrochemical processes are essential for advancing corrosion protection, significantly extending the lifespan of critical metal structures.
3.4. Linear Voltammetry
The
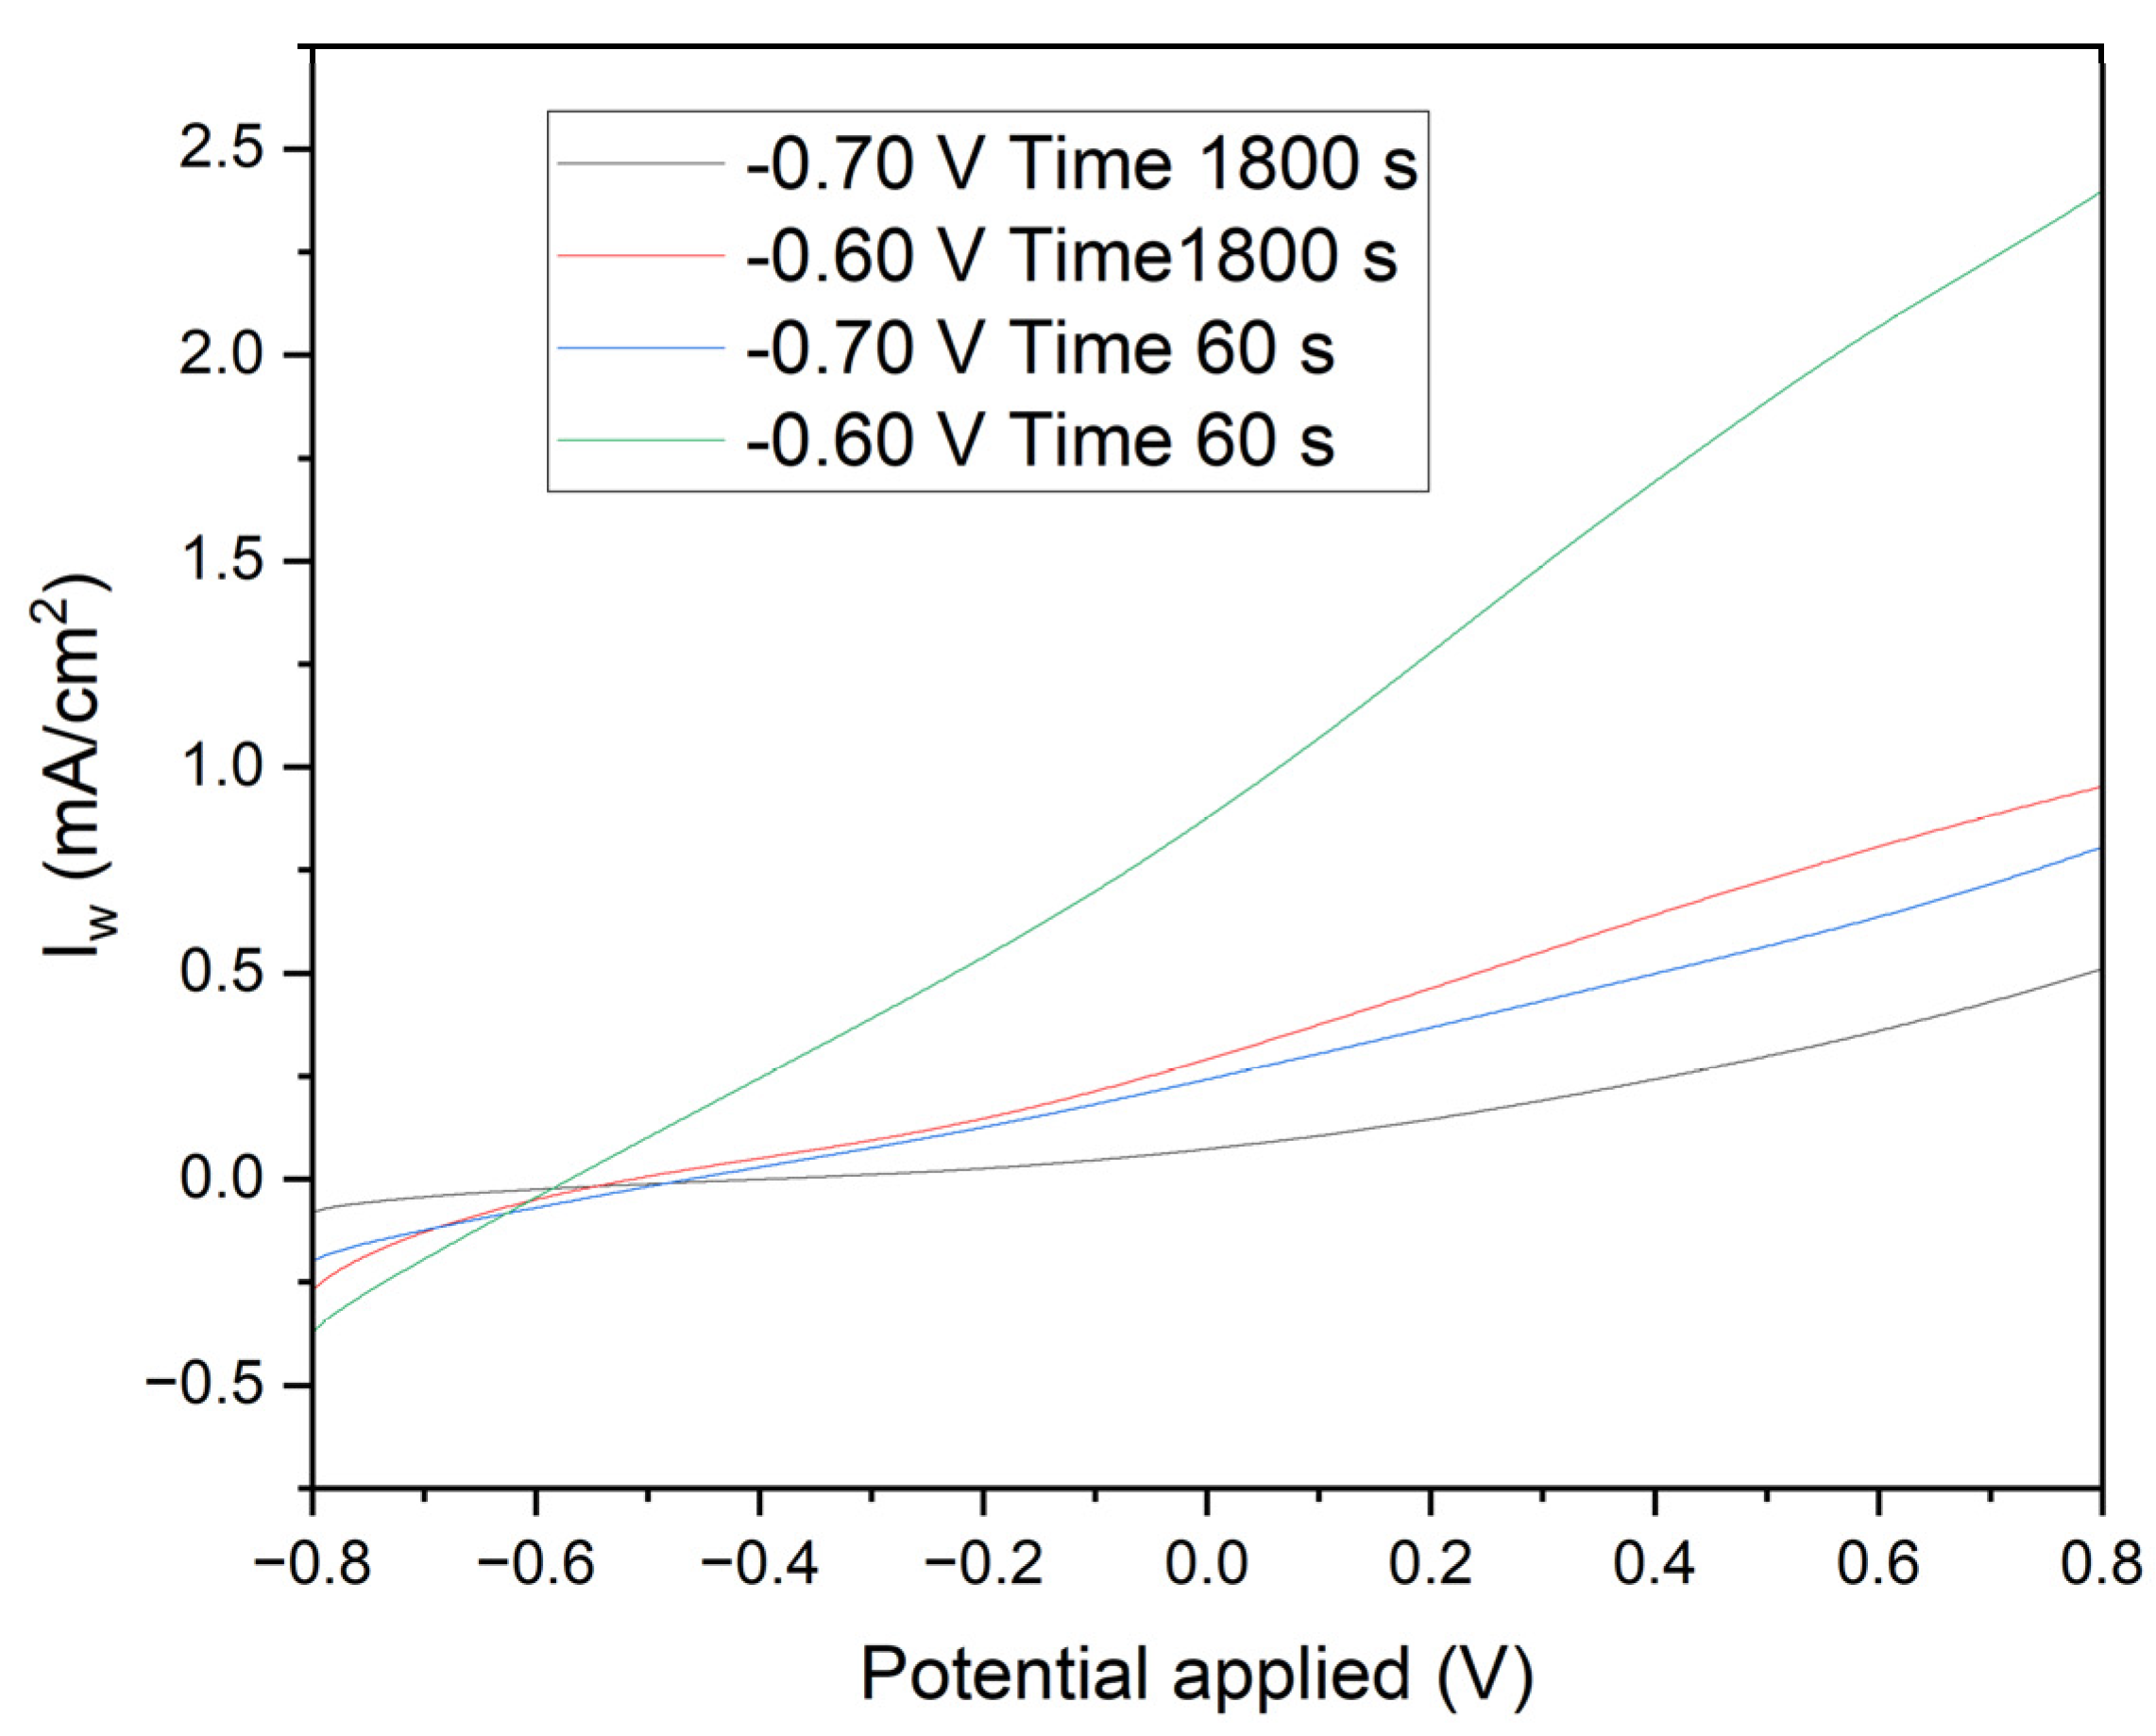
Figure 8 presents linear voltammetry curves for electrodes subjected to different chronoamperometric treatments, providing critical insights into the electrochemical behavior and surface characteristics of the deposited manganese layers. The initial negative currents observed in the curves are attributed to the reduction of oxidized species present on the surface of the deposited manganese or impurities in the medium. The likelihood of water reduction at these potentials with the electrodes used is negligible. As the potential becomes less negative and transitions to positive, the reversal of the current clearly indicates the oxidation of the deposited manganese or the underlying iron. The specific reactions involved are:
Electrodes polarized at -0.70 V for 1800 seconds (Black Line): These electrodes exhibit a controlled and gradual transition, reflecting a more stable protective manganese layer. The steady increase in current towards positive values, without significant parasitic reactions, confirms the excellent corrosion resistance provided by the uniform and well-adhered manganese coating.
Electrodes polarized at -0.60 V for 1800 seconds (Red Line): A similar pattern is observed with these electrodes, albeit with a smaller initial negative current, indicating a less oxidized initial layer. This results in slightly reduced corrosion resistance compared to the electrodes treated at -0.70 V. The manganese layer formed under these conditions, while still protective, shows marginally less effectiveness in corrosion prevention.
Electrodes polarized at -0.70 V for 60 seconds (Blue Line): The pronounced initial negative current, followed by a rapid increase to positive values, highlights a quick reduction of surface species and subsequent oxidation. This behavior indicates a less uniform deposition process, resulting in a thinner and less consistent manganese layer, which compromises the corrosion protection.
Electrodes polarized at -0.60 V for 60 seconds (Green Line): These electrodes demonstrate a rapid rise in current density from slightly negative to positive values. This indicates minimal initial reduction and a swift oxidation process, revealing significant transient and capacitive effects. The manganese layer produced is discontinuous and less protective, offering inadequate corrosion resistance.
The initial negative currents are unequivocally linked to the reduction of oxidized surface species or impurities, while water reduction is not a significant factor at these potentials. As the potential becomes less negative and turns positive, the observed current inversion signifies the oxidation of the deposited manganese or iron substrate. The clearly defined electrochemical reactions highlight the critical role of chronoamperometric parameters in determining the integrity and protective quality of the deposited manganese layer. Electrodes subjected to -0.70 V for longer durations (1800 seconds) form a more stable and protective manganese layer, whereas shorter times and less negative voltages lead to inferior layers with rapid oxidation transitions, indicating a lower protective quality.
This analysis underscores the necessity of optimizing chronoamperometric conditions to enhance the corrosion resistance of manganese coatings, essential for practical applications.
The
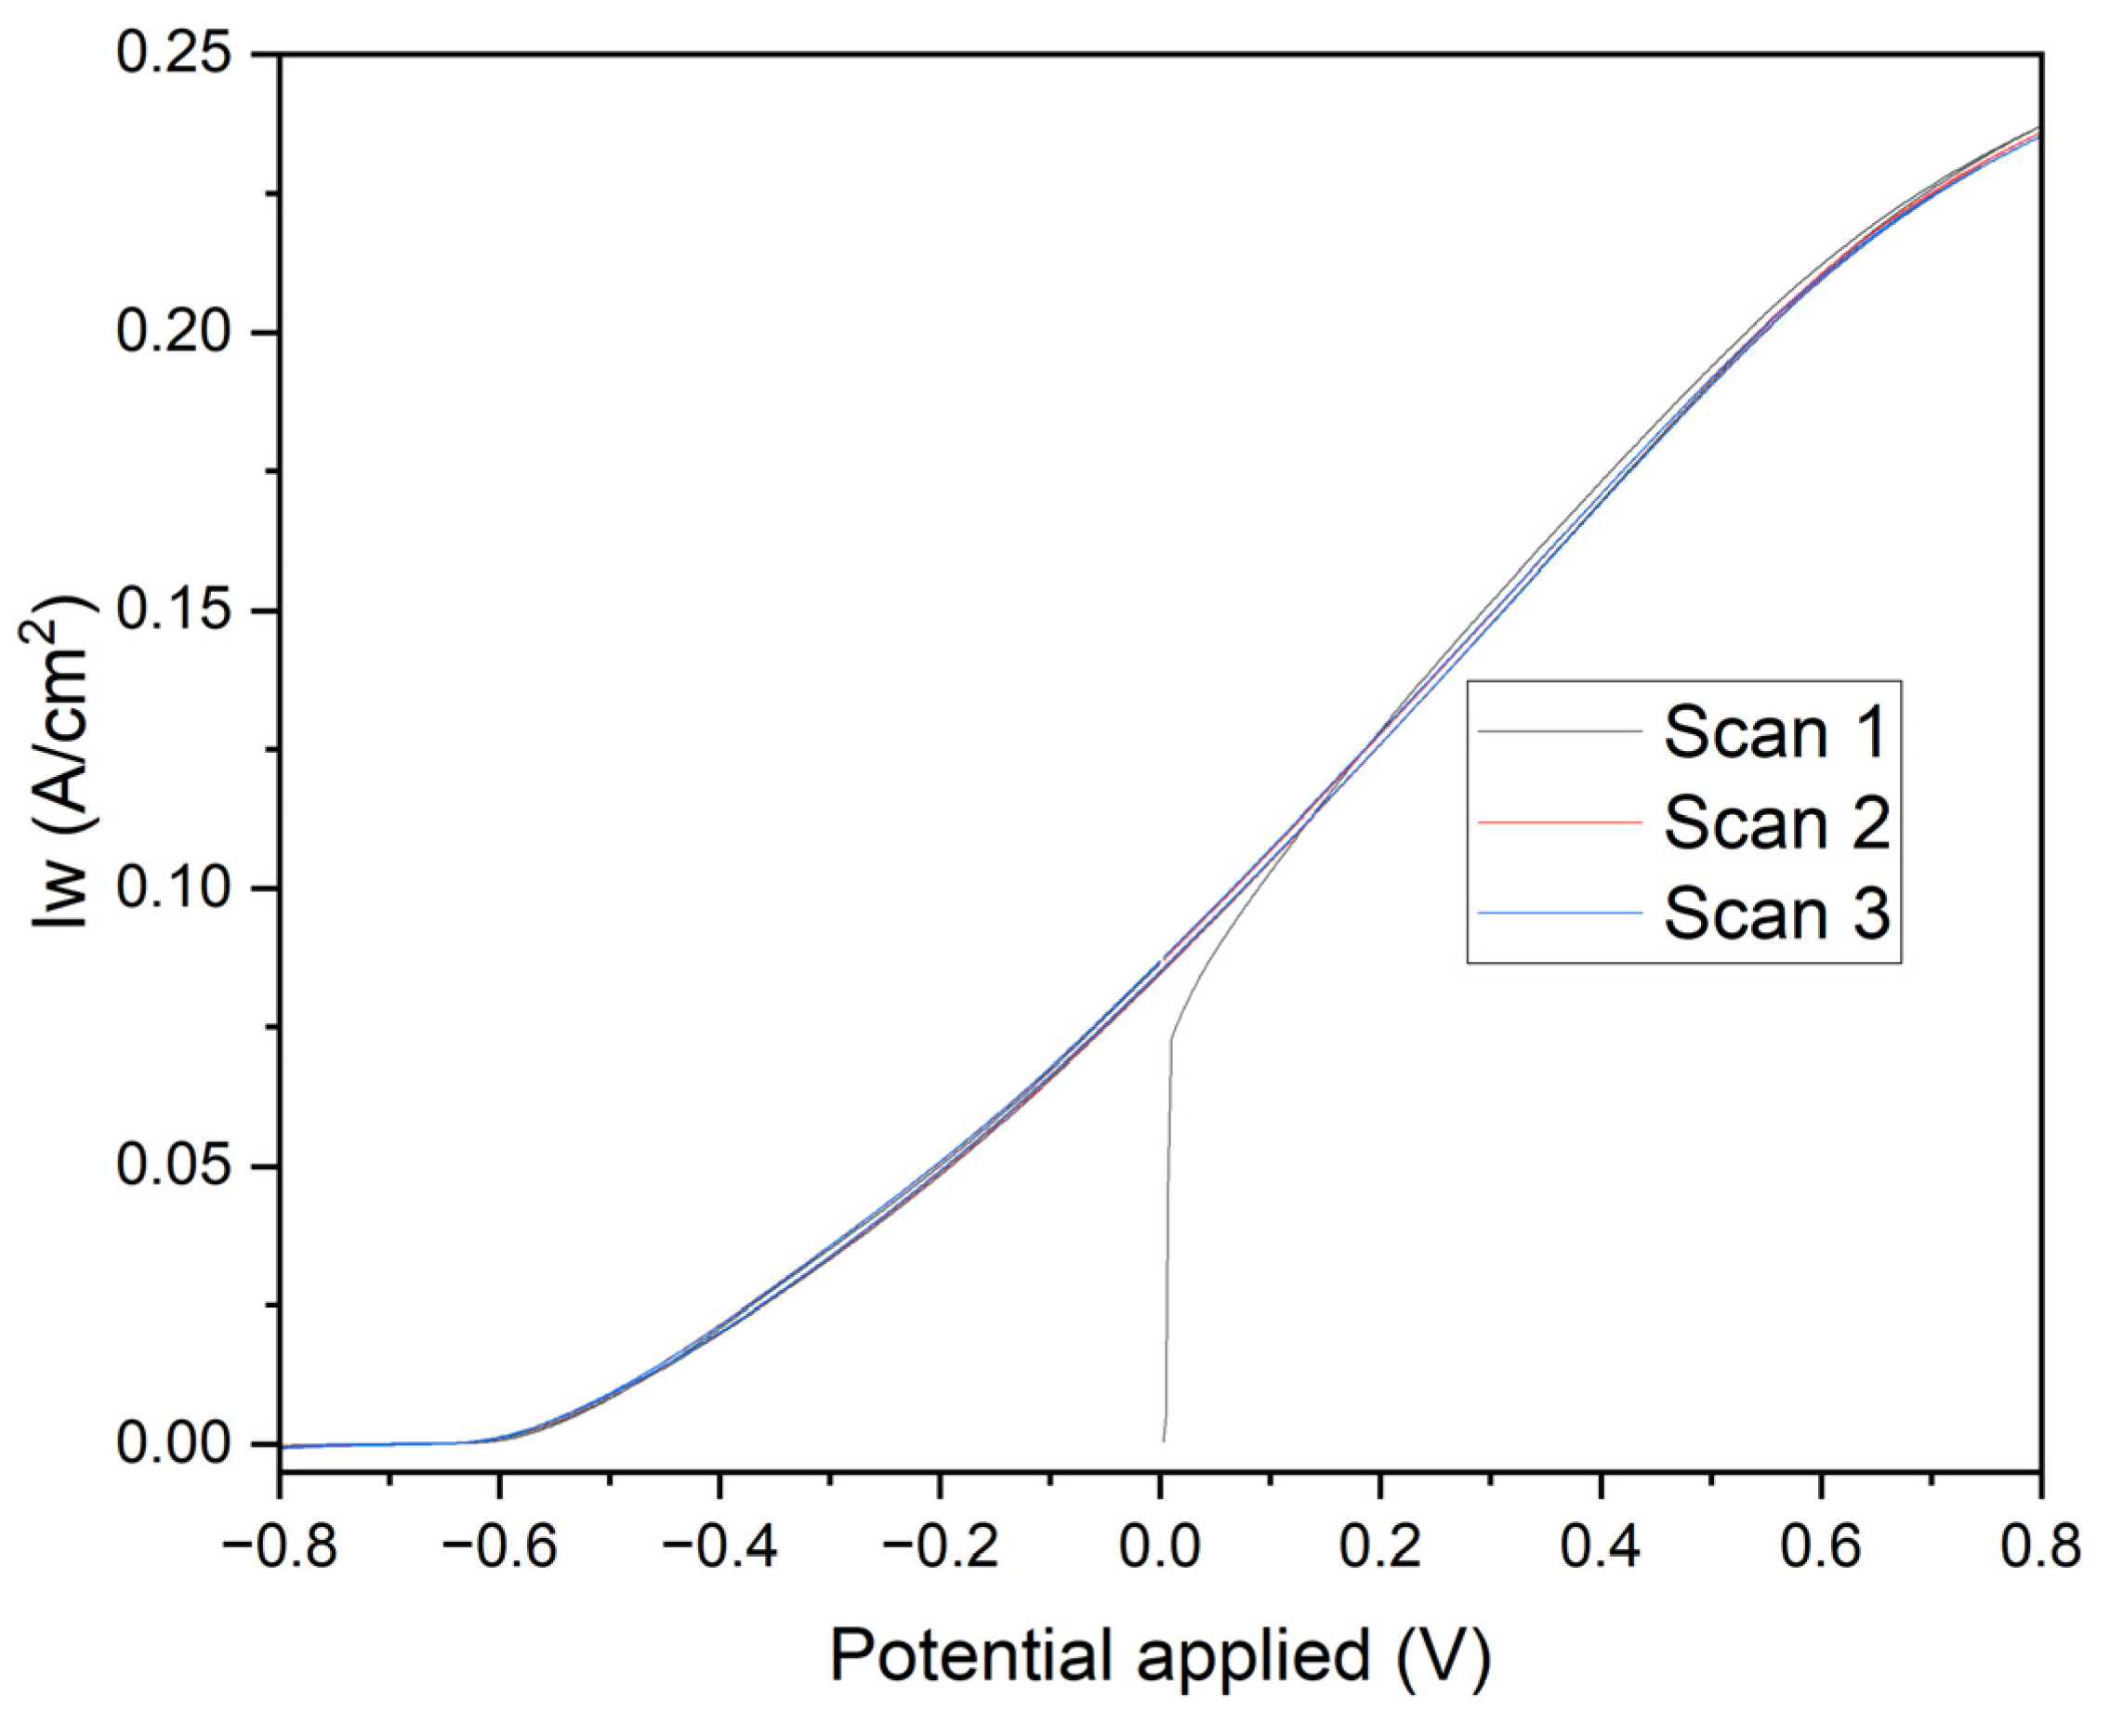
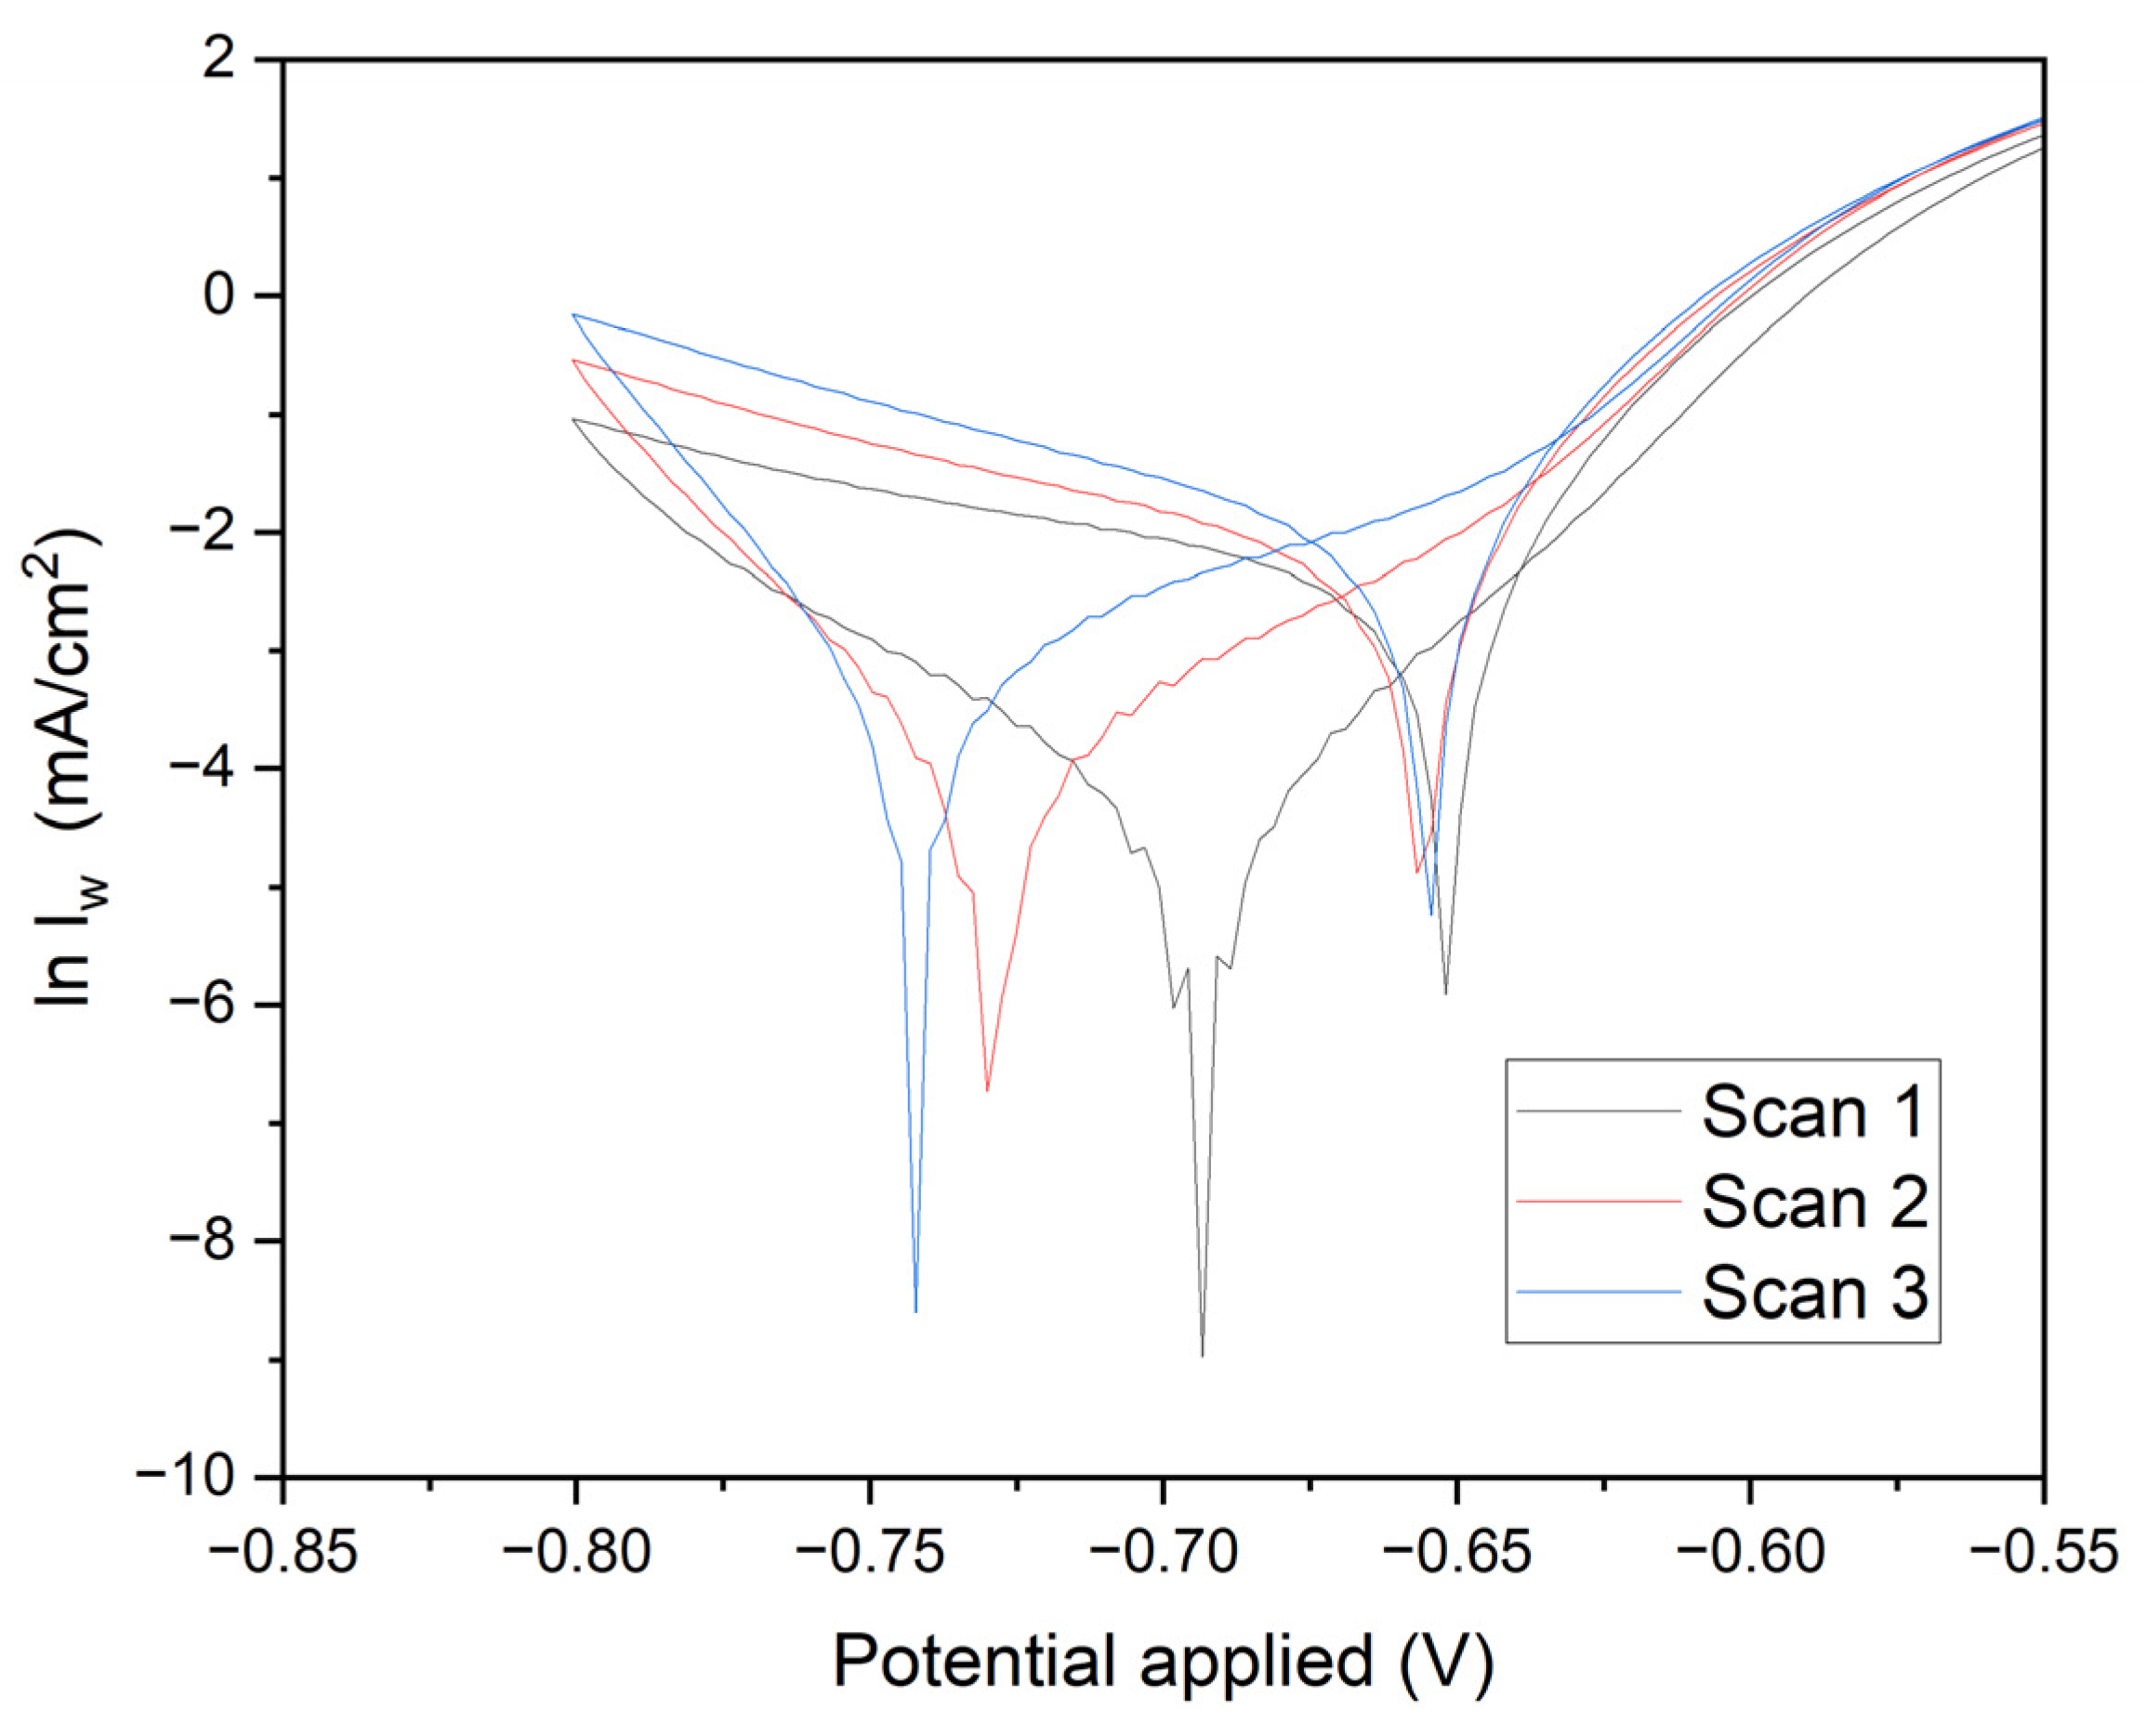
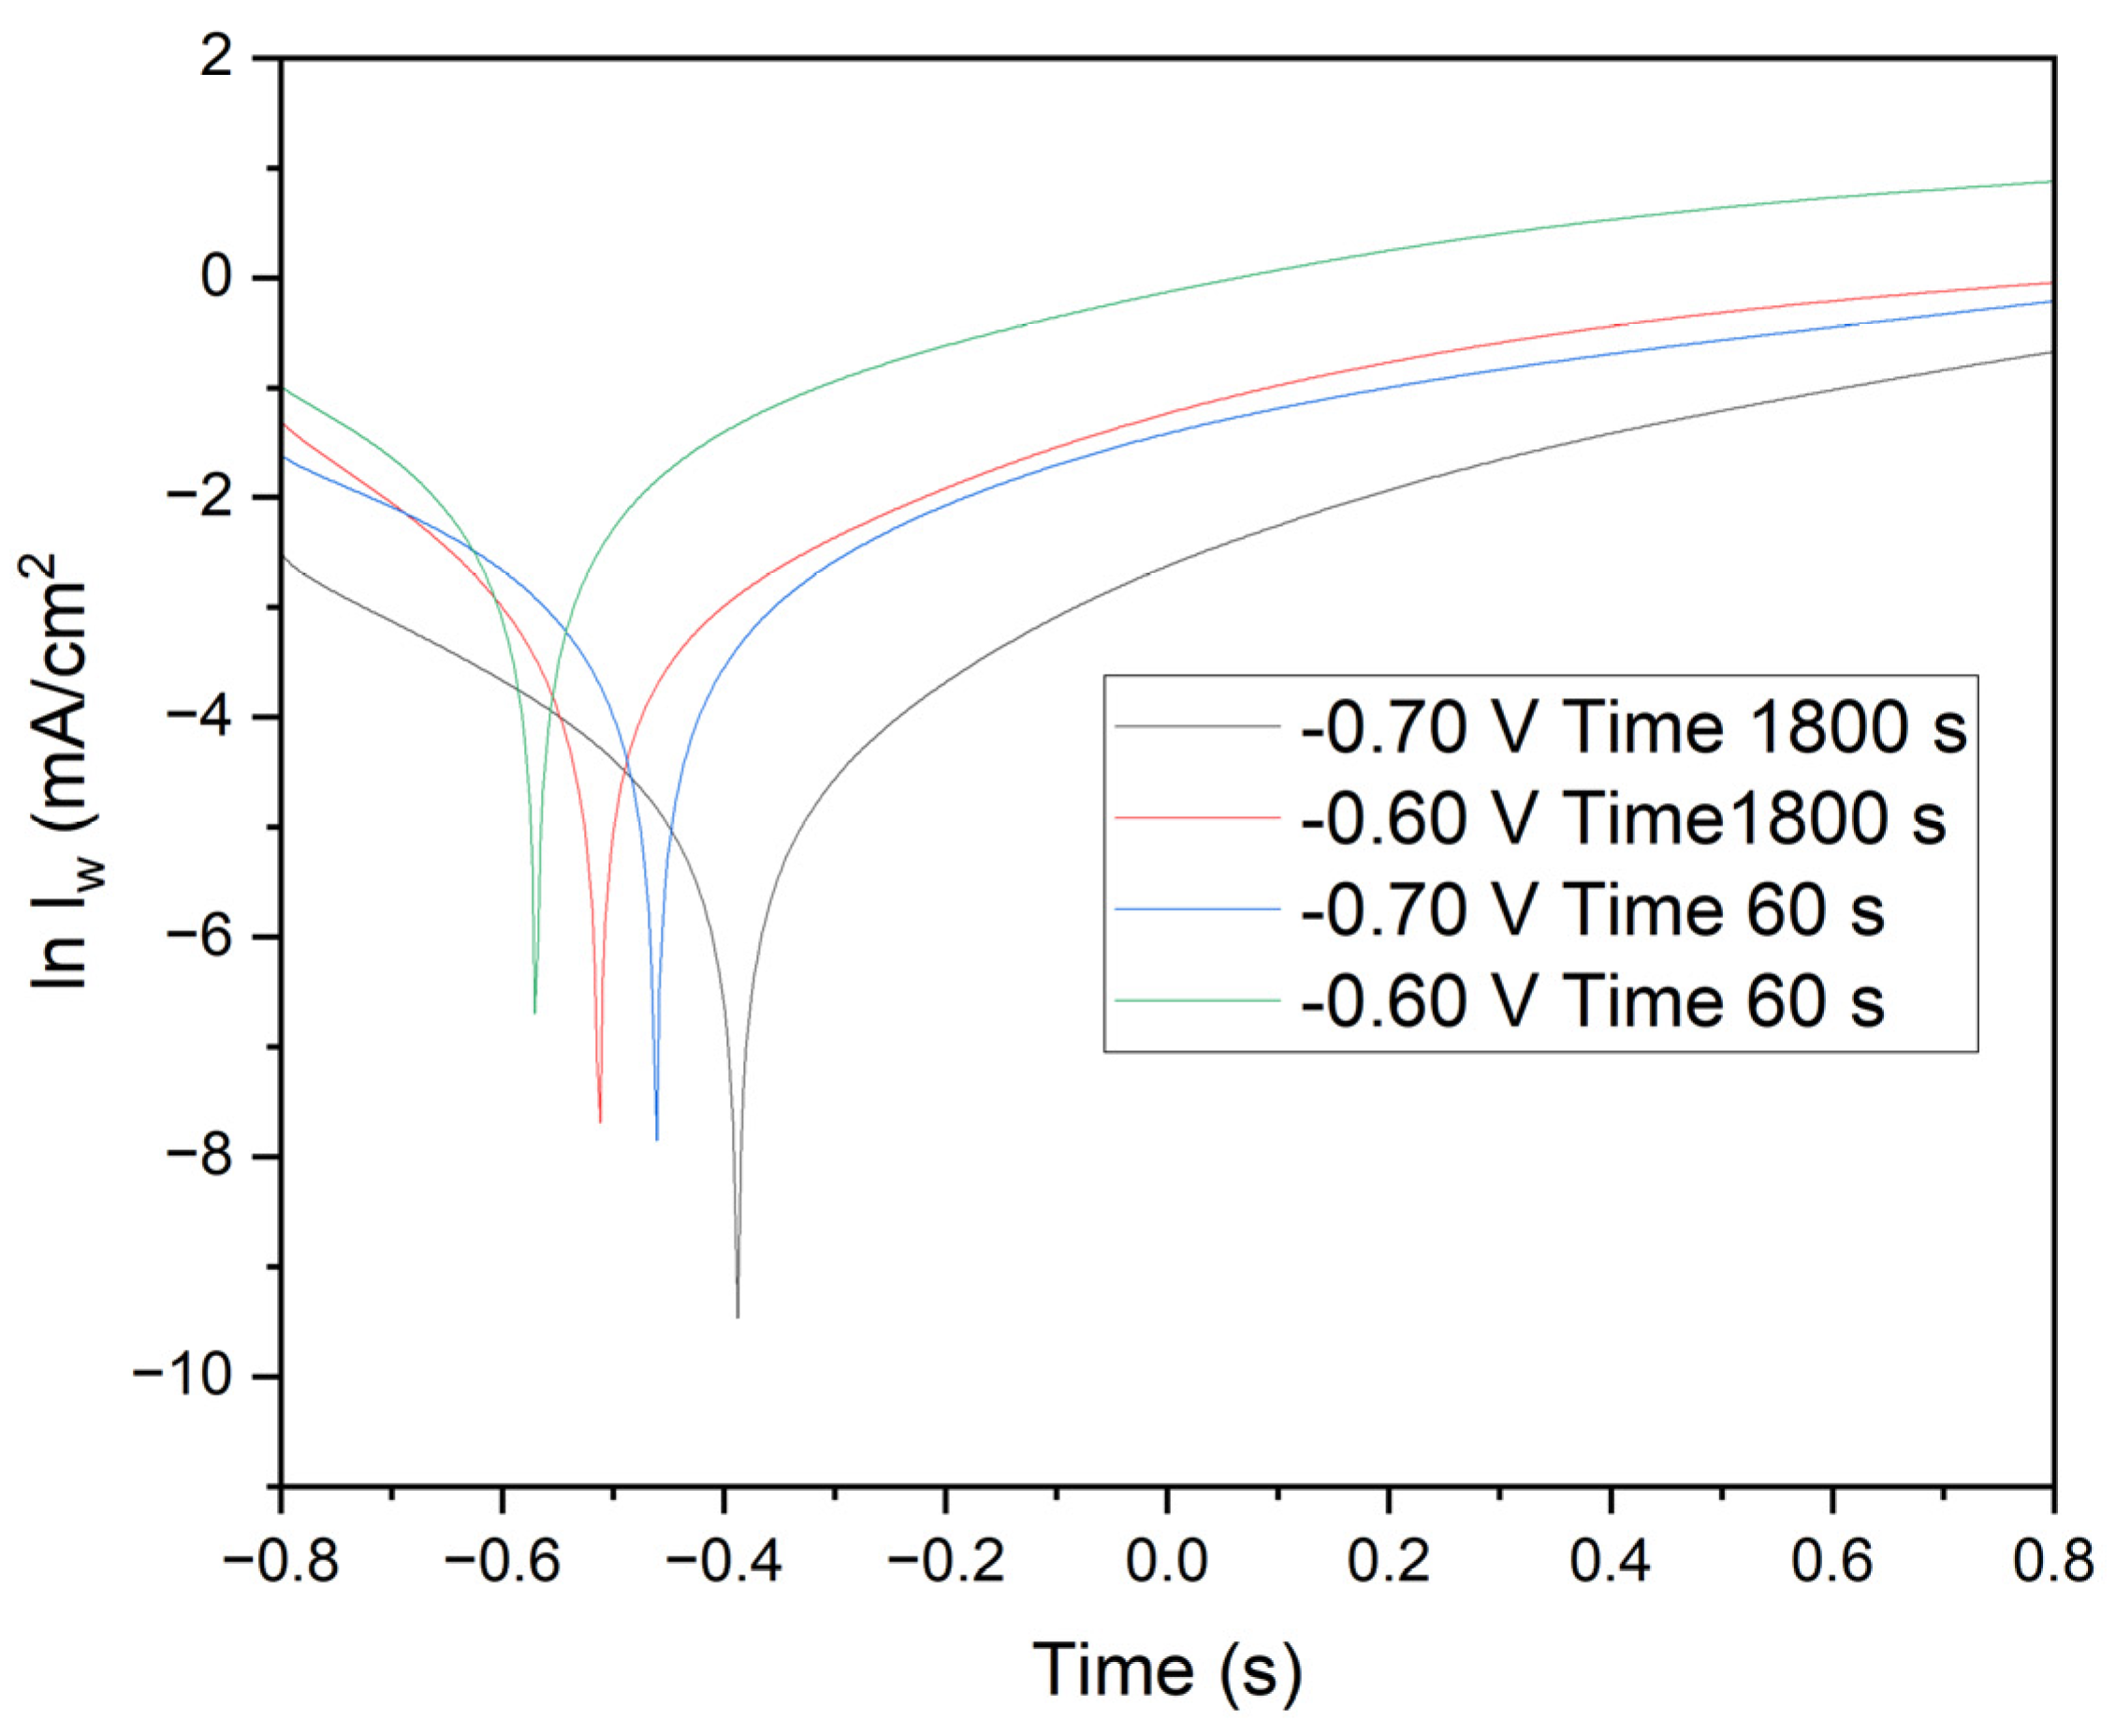
Figure 9 presents crucial data on current density versus time, elucidating the quality of manganese electrodeposition and its impact on the corrosion resistance of annealed steel electrodes. The results clearly demonstrate that optimal conditions for effective electrodeposition and enhanced corrosion resistance are achieved with a duration of 1800 seconds at -0.70 V. In this study, the corrosion properties of annealed steel wire electrodes, subjected to various chronoamperometric conditions, were thoroughly evaluated. Following the treatment, the electrodes were immersed in demineralized water, and linear voltammetry tests were conducted from -0.8 V to 0.8 V. The resulting graph, depicted on a logarithmic scale of current density, allows for the analysis of Tafel characteristics and corrosion kinetics.
Electrodes subjected to -0.70 V for 1800 seconds (black line): These electrodes exhibit a deep minimum followed by a gradual recovery. The linear section of the curve in the cathodic region provides detailed insights into the corrosion rate and kinetic parameters of reduction.
Electrodes subjected to -0.60 V for 1800 seconds (red line): Similar behavior is observed, with a less pronounced minimum and a smaller slope in the cathodic region, indicating lower reductive activity.
Electrodes subjected to -0.70 V for 60 seconds (blue line): These display a significant minimum followed by a rapid recovery, suggesting a fast initial reduction and less controlled subsequent oxidation.
Electrodes subjected to -0.60 V for 60 seconds (green line): The current density rapidly increases from a minimum to positive values, indicating lower corrosion resistance and less effective reduction kinetics.
Cathodic and Anodic Peaks: The minima in the curves represent cathodic peaks where the reduction of oxidized species on the deposited manganese occurs. The subsequent recovery indicates the onset of oxidation processes. The position and depth of these peaks are critical indicators of the efficiency of the reduction process and the quality of the protective manganese coating.
Linear Regions and Tafel Slopes: The linear sections on the logarithmic scale provide the Tafel slopes, essential for determining kinetic parameters such as the charge transfer coefficient (β) and the exchange current density (i₀). These parameters indicate the ease with which the redox reaction occurs. Electrodes subjected to -0.70 V for 1800 seconds exhibit steeper Tafel slopes and deeper minima, suggesting higher efficiency in reduction and superior manganese coating quality. Conversely, electrodes subjected to -0.60 V for 60 seconds show shallower slopes and quicker recovery, indicating lower reduction efficiency and increased corrosion susceptibility.
Scan Comparisons: Comparative analysis reveals that electrodes subjected to -0.70 V for 1800 seconds exhibit the highest corrosion resistance, with more favorable reduction kinetics and a more uniform manganese coating. In contrast, electrodes subjected to -0.60 V for 60 seconds demonstrate the lowest corrosion resistance, reflecting less effective reduction kinetics and a less uniform protective layer.
The application of the Butler-Volmer equation to the linear voltammetry data has enabled a detailed assessment of corrosion kinetics and manganese coating quality. Optimal conditions for effective electrodeposition and enhanced corrosion resistance are clearly achieved with 1800 seconds at -0.70 V, as demonstrated in
Table 1. These electrodes exhibit the lowest corrosion current density and corrosion rate, indicating a highly effective protective manganese layer. These findings are critical for developing efficient corrosion protection methods in industrial and research applications, providing clear parameters for optimizing the manganese electrodeposition process.
3.5. Electrochemical Impedance Spectroscopy (EIS) Results
In addition to the Tafel curve analysis, an electrochemical impedance spectroscopy (EIS) study was conducted to evaluate the charge transfer resistance of annealed steel wire in a manganese sulfate monohydrate and KCl solution at the applied voltages during manganese electrodeposition.
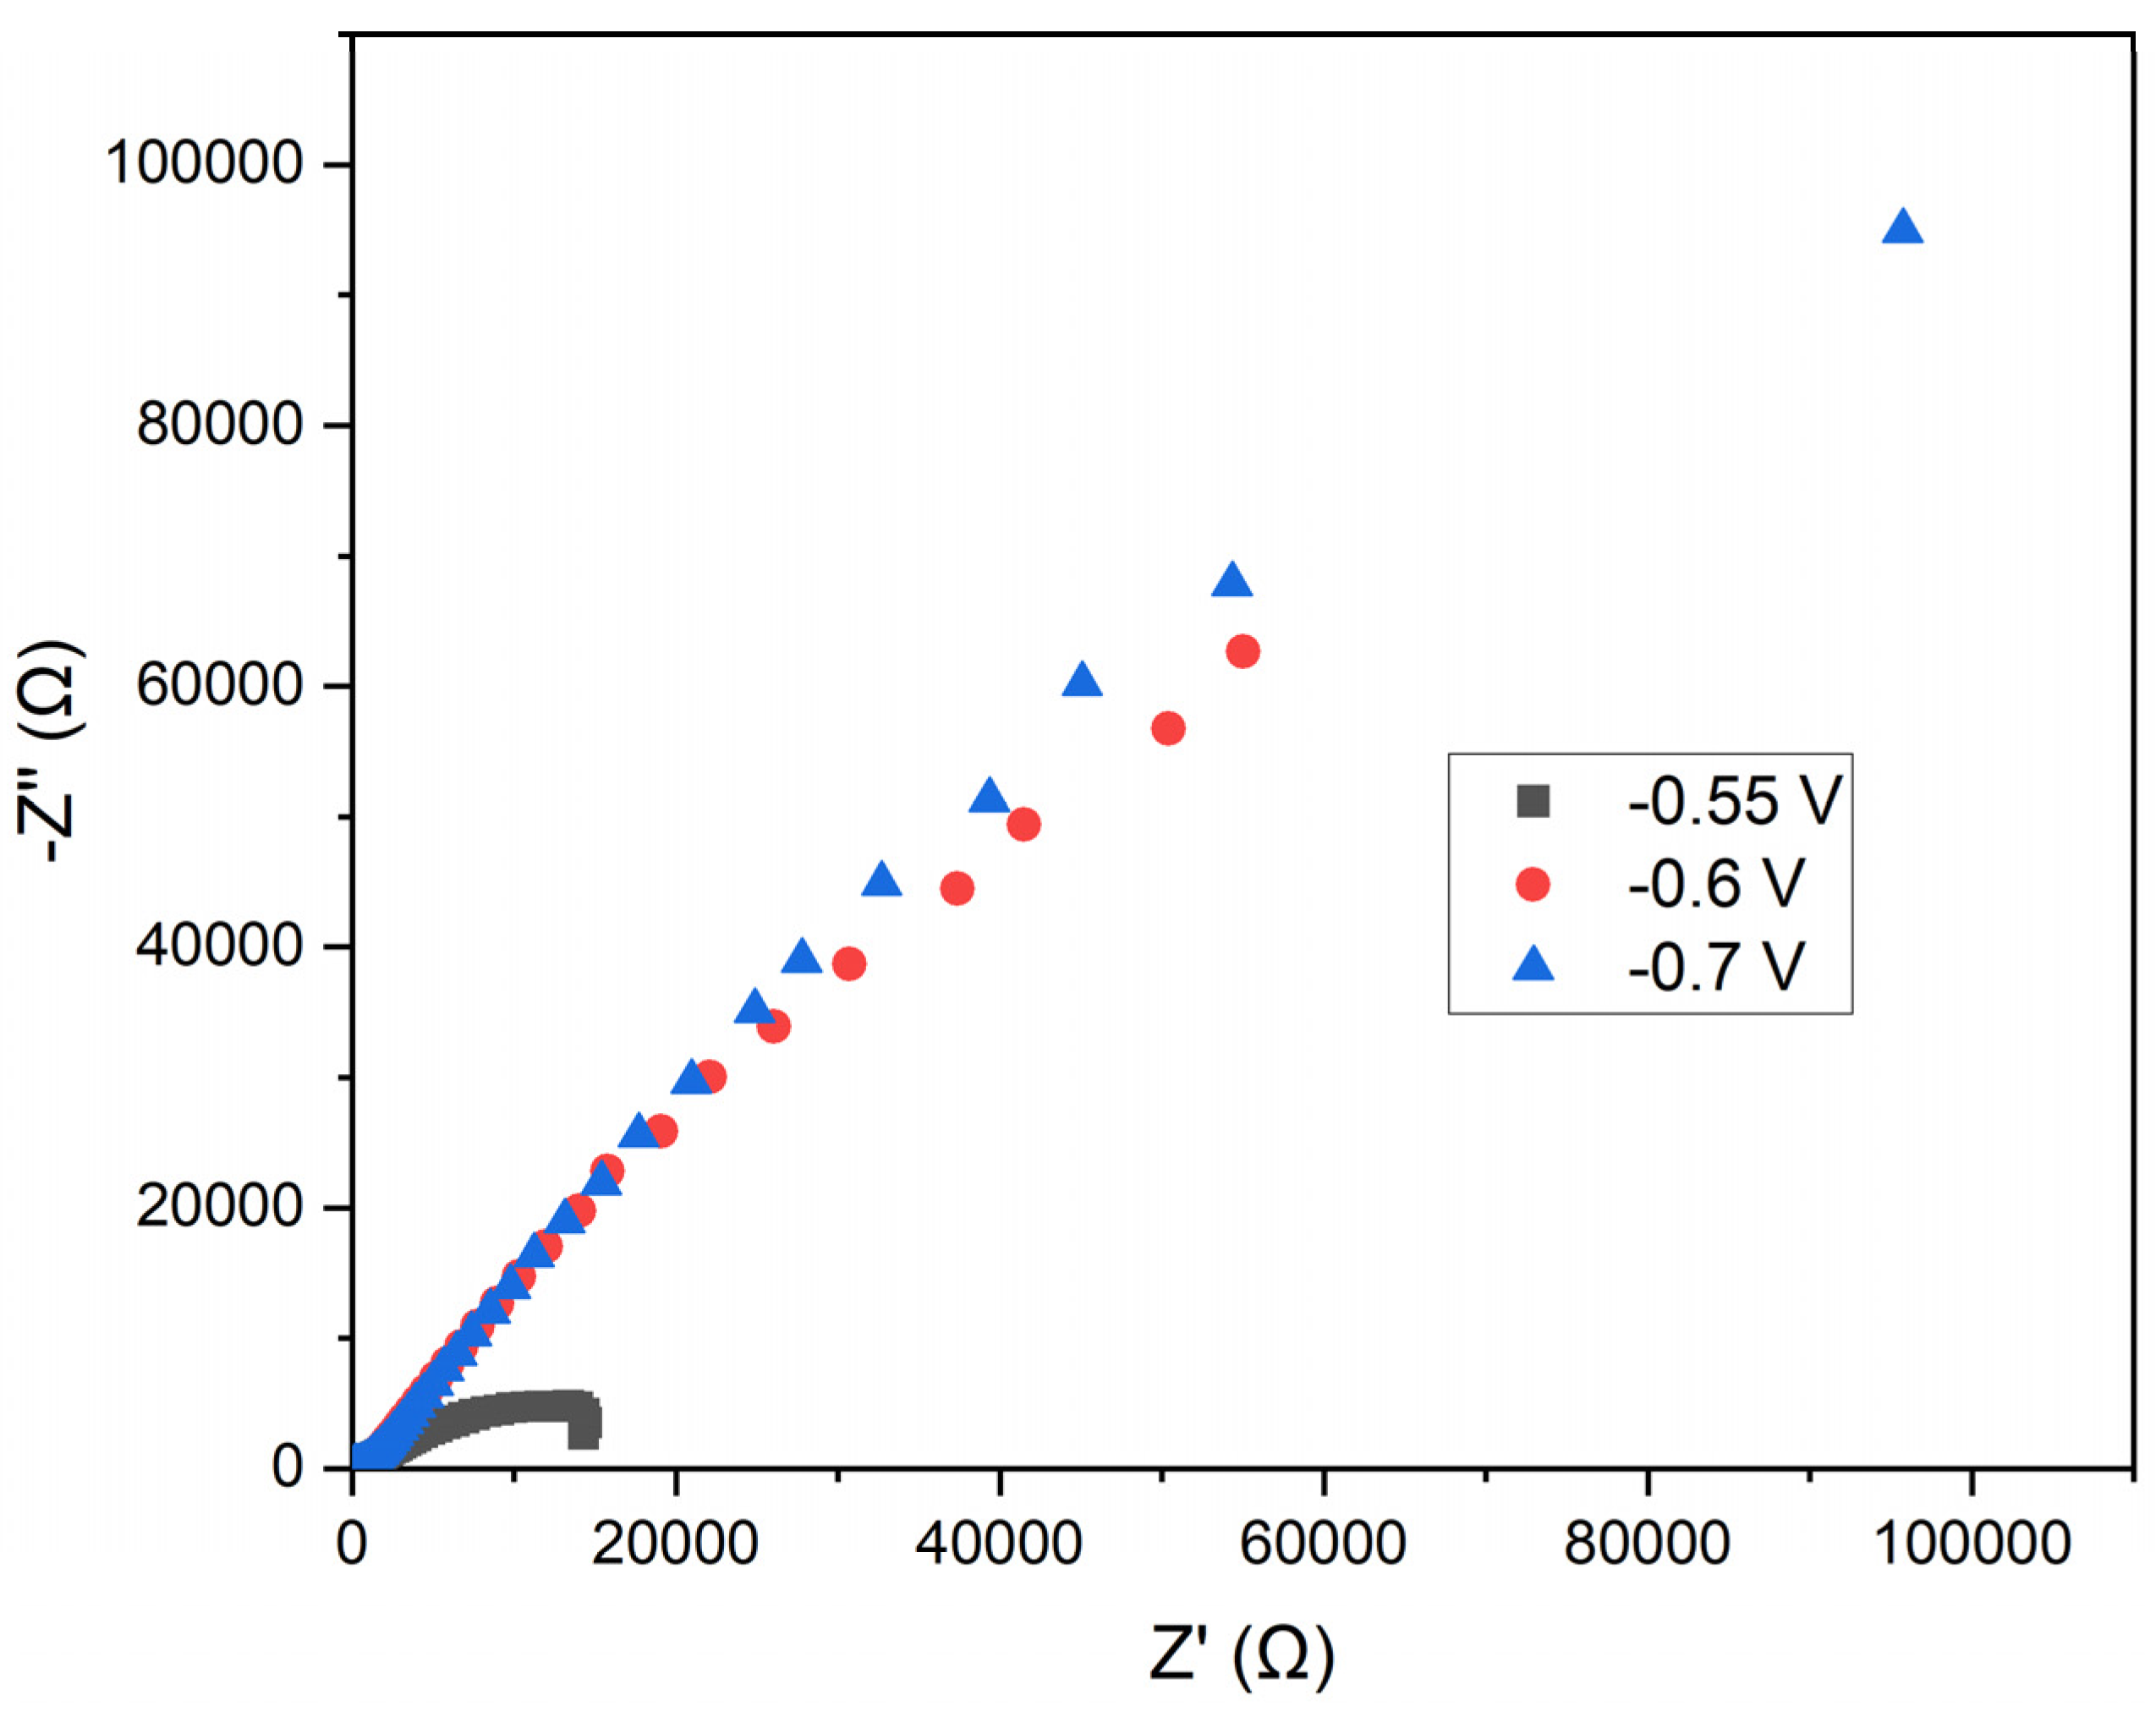
This study assessed the electrochemical properties of annealed steel wire in a solution of manganese sulfate monohydrate and KCl using EIS. The specific potentials analyzed were -0.55 V, -0.6 V, and -0.7 V, selected based on prior studies of manganese electrodeposition. The resulting Nyquist plot represents the impedance of the electrodes at the three applied potentials. In this plot, the Z' (Ω) axis corresponds to the real part of the impedance, while the −Z'' (Ω) axis represents the imaginary part (see
Figure 10).
Semicircular Shape: The curves exhibit semicircular arcs, characteristic of systems dominated by charge transfer processes. The semicircular shape indicates that charge transfer resistance (Rct) is the predominant process.
Potential Comparison: At -0.55 V (black squares), the impedance is lower compared to -0.6 V (red circles) and -0.7 V (blue triangles), particularly in the high and mid-frequency regions. The impedance at -0.7 V is greater than at -0.6 V, indicating a higher charge transfer resistance.
Charge Transfer Resistance: The lower impedance observed at -0.55 V suggests a reduced charge transfer resistance compared to the other potentials. This could imply a less efficient and uniform manganese electrodeposition at this potential.
Double Layer Capacitance: Variations in impedance may be influenced by changes in the electrochemical double layer capacitance at different potentials. At more negative potentials, the structure of the double layer may be altered, affecting ion distribution and, consequently, the impedance.
Practical Implications: Electrodeposition at -0.7 V, which exhibits the highest charge transfer resistance, suggests more favorable conditions for forming a protective manganese layer. The efficiency of electrodeposition must be balanced with coating stability and deposition rate, which may require further analysis using additional electrochemical techniques such as cyclic voltammetry.
The analysis of the Nyquist plot indicates that a potential of -0.70 V results in the highest charge transfer resistance, potentially correlating with more efficient and uniform manganese electrodeposition on annealed steel wire. In contrast, the potential of -0.55 V exhibits lower charge transfer resistance, which may lead to less effective electrodeposition.
The
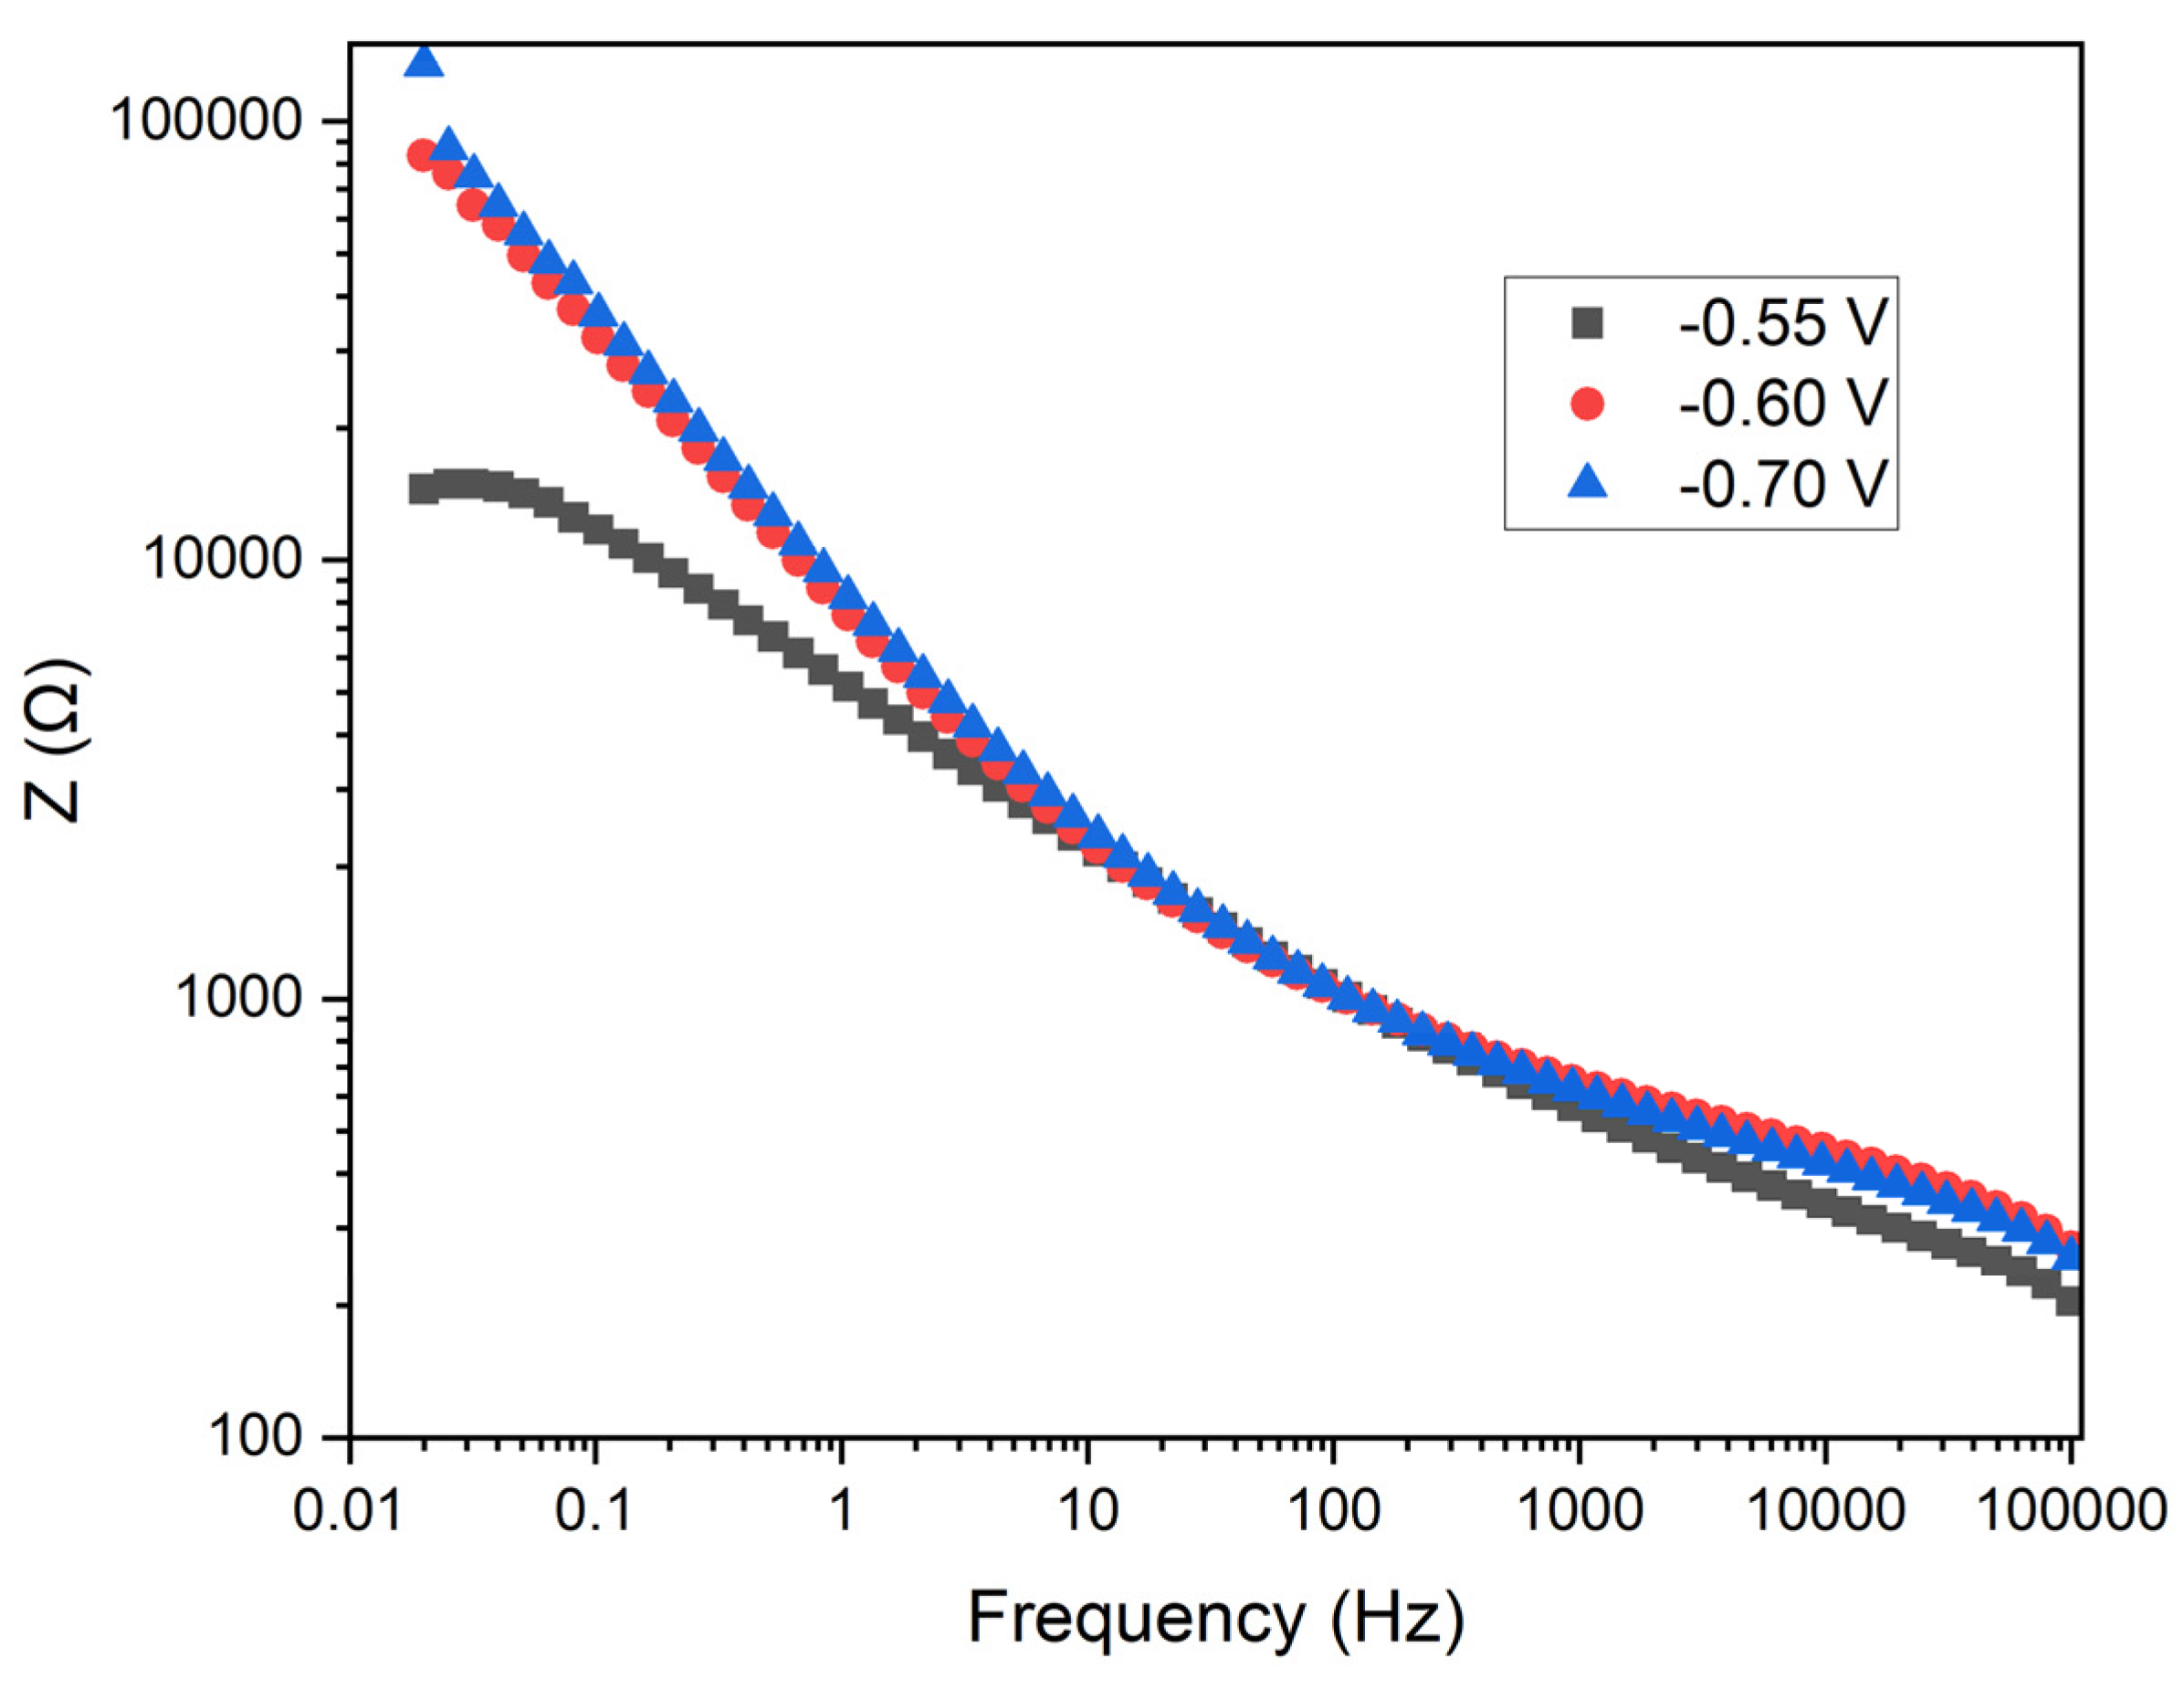
Figure 11 shows the Bode plot depicting impedance as a function of frequency for the three applied potentials. In this plot, the Z (Ω) axis represents the magnitude of the impedance, while the x-axis represents frequency (Hz) on a logarithmic scale.
Impedance Behavior: At low frequencies, the impedance is higher, which is typical in electrochemical systems due to the dominance of charge transfer resistance and double layer capacitance. At high frequencies, the impedance decreases, indicating the predominance of electrolyte resistance and inductance of the wiring.
Potential Comparison: At -0.55 V (black squares), the impedance is the lowest at low and mid frequencies compared to the other potentials. At -0.7 V (blue triangles), the impedance is the highest across the entire frequency range, indicating a higher charge transfer resistance. At -0.6 V (red circles), the impedance lies between the other two potentials.
Charge Transfer Resistance: The lowest impedance observed at -0.55 V suggests a lower charge transfer resistance compared to the other potentials, indicating a potentially higher efficiency in electrodeposition at this potential. The higher impedance at -0.7 V indicates a greater charge transfer resistance, suggesting that electrodeposition is less efficient but potentially more uniform and dense.
Double Layer Capacitance: The difference in impedance at various frequencies also reflects the double layer capacitance. Higher impedance at low frequencies indicates a higher double layer capacitance.
Practical Implications: At -0.55 V, the lower charge transfer resistance may result in a faster electrodeposition rate, though the uniformity of the coating could be inferior. At -0.7 V, the higher charge transfer resistance suggests a more controlled and uniform electrodeposition, potentially leading to better coating quality.
The analysis of the Bode plot indicates that a potential of -0.55 V results in the lowest charge transfer resistance, which may lead to faster but less uniform electrodeposition. The potential of -0.7 V shows the highest charge transfer resistance, suggesting more favorable conditions for uniform and controlled manganese electrodeposition. These results are consistent with those observed in the Nyquist plot, reinforcing the hypothesis that a potential of -0.7 V provides the optimal conditions for manganese electrodeposition in terms of coating uniformity and quality.
The
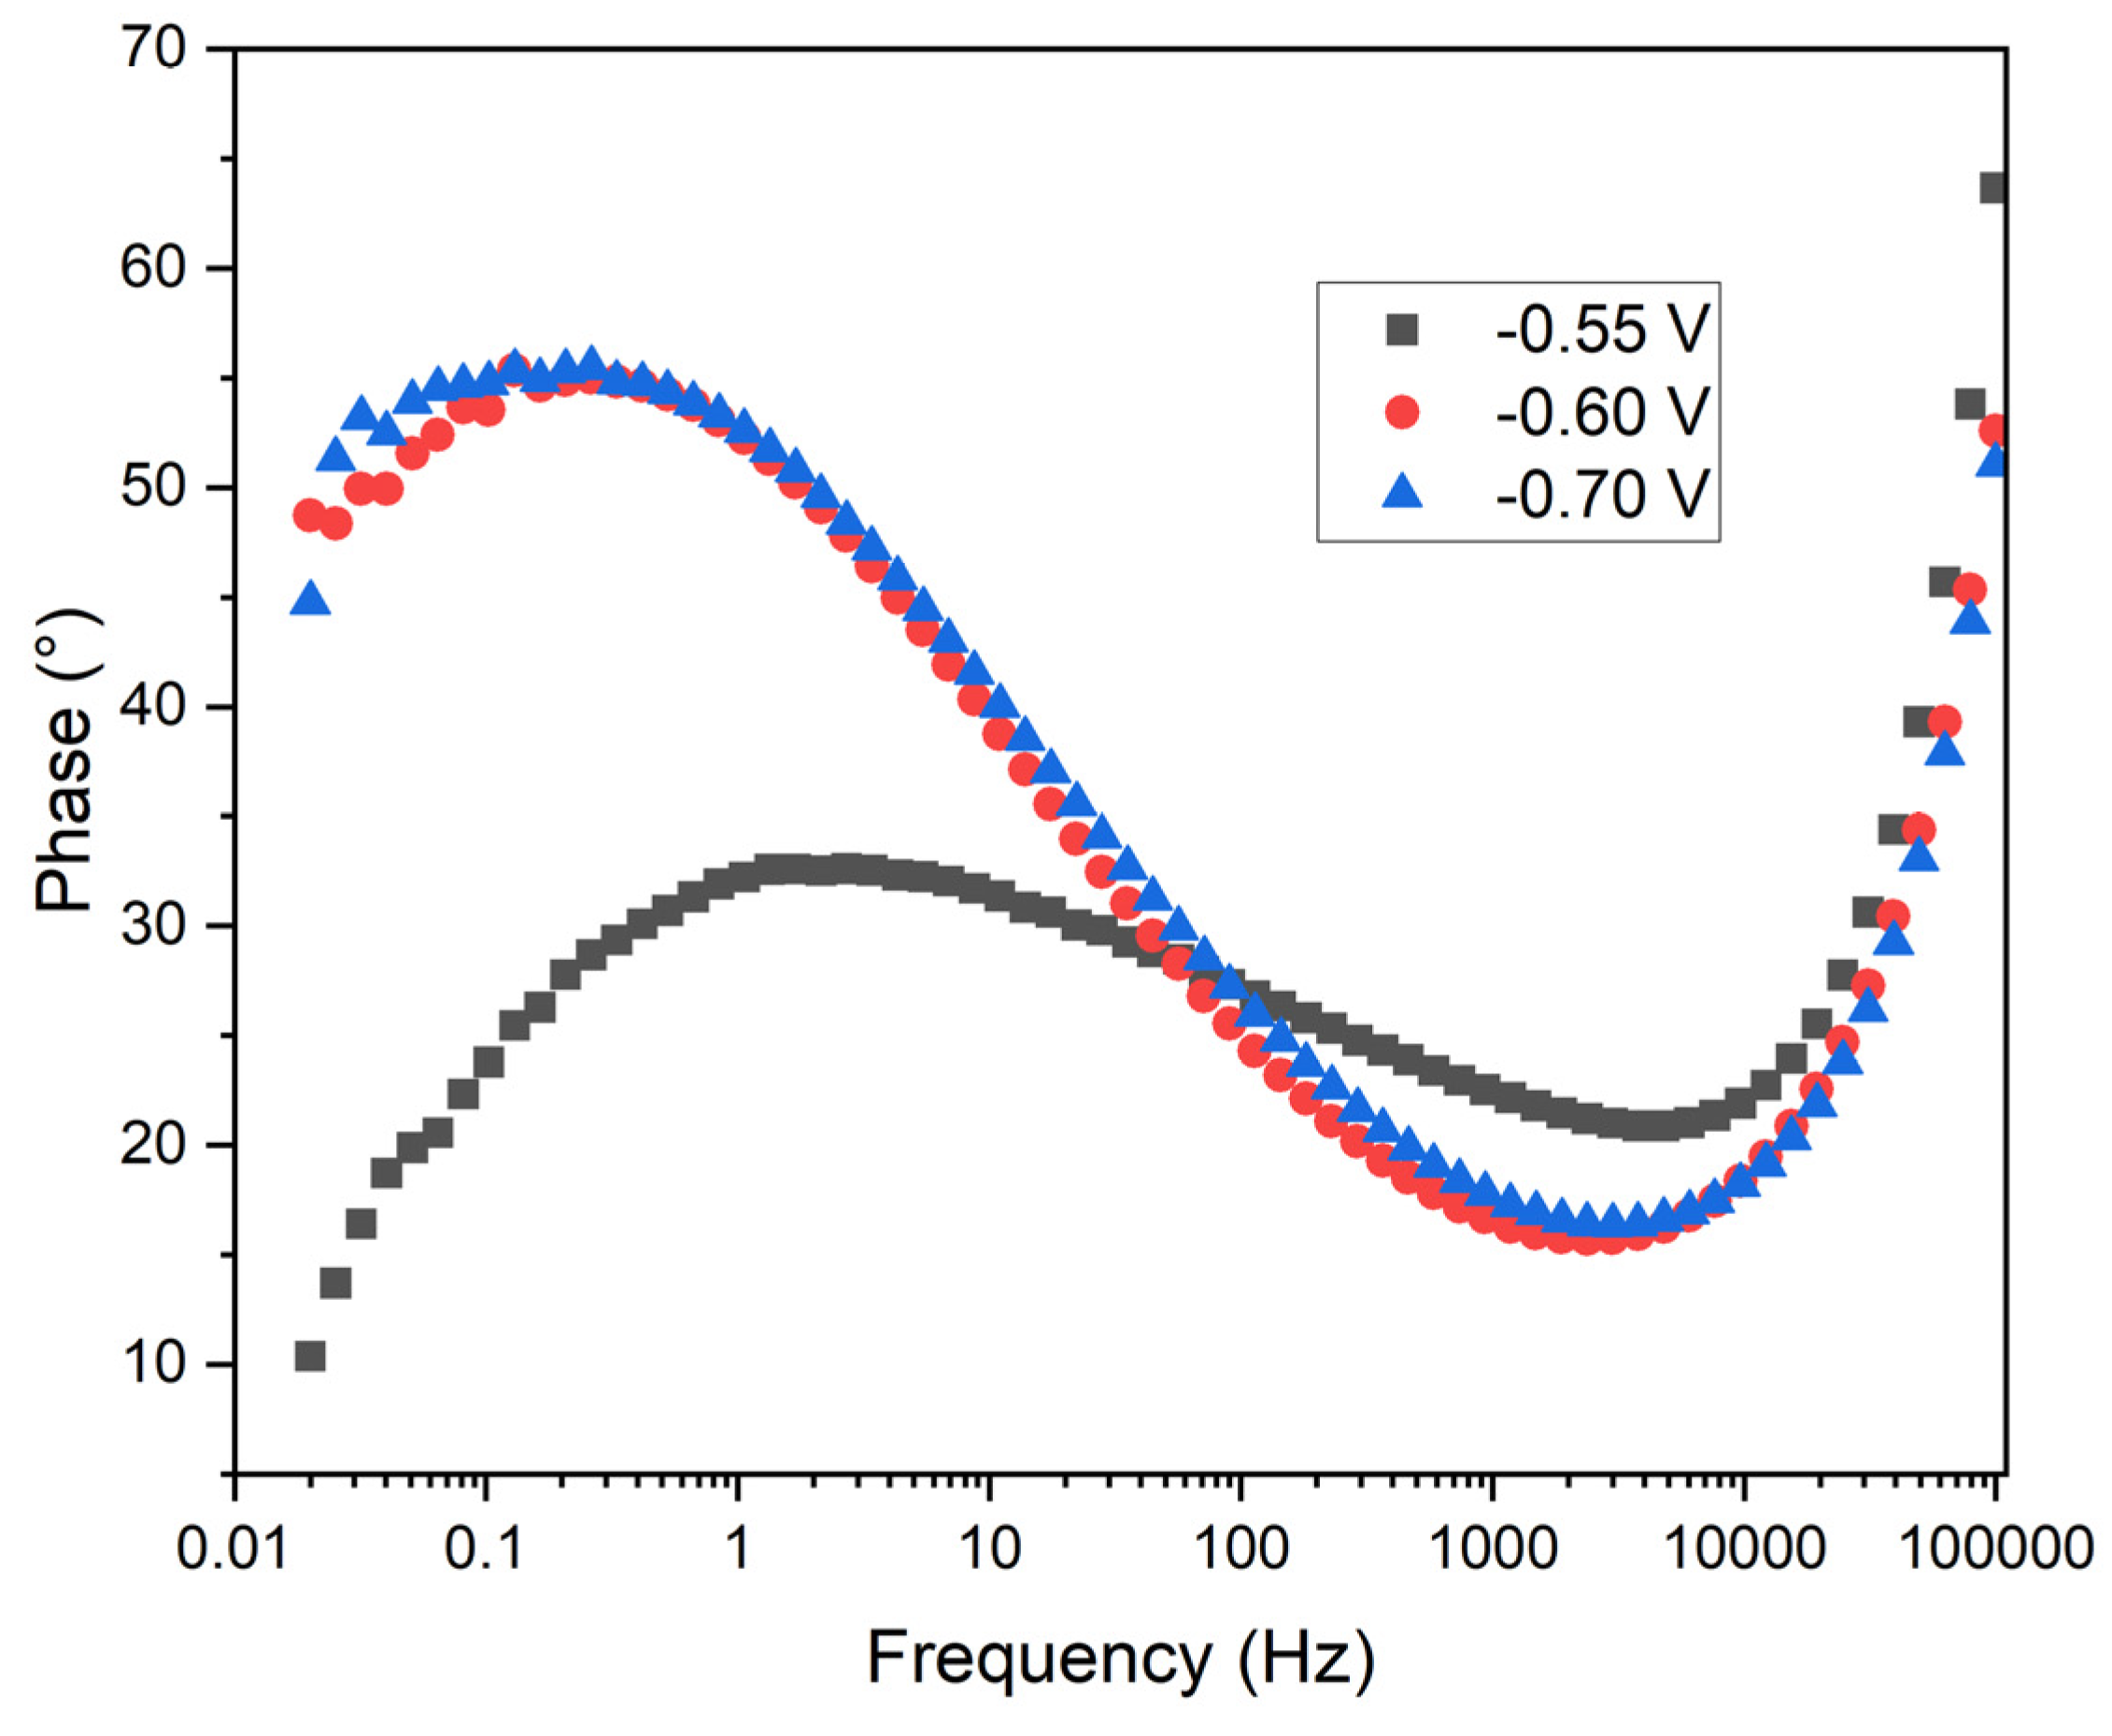
Figure 12 illustrates the phase angle of the impedance as a function of frequency at the three applied potentials. In this plot, the vertical axis represents the phase angle (degrees), while the horizontal axis denotes frequency (Hz) on a logarithmic scale.
Phase Behavior: The three curves exhibit a bell-shaped characteristic, typical of systems dominated by charge transfer and diffusive processes. At low and high frequencies, the phase angle decreases, indicating resistive behavior. In the mid-frequency range, the phase angle increases, reflecting the capacitive contribution of the double layer.
Potential Comparison: At -0.55 V (black squares), the phase angle reaches its maximum at lower frequencies compared to -0.6 V (red circles) and -0.7 V (blue triangles). The phase maximum at -0.7 V is slightly higher than at -0.6 V, suggesting a greater capacitive contribution.
Charge Transfer Resistance: The position of the phase maximum correlates with the characteristic frequency of the system, influenced by the charge transfer resistance and double layer capacitance. The lower frequency at which the phase maximum occurs at -0.55 V suggests a lower charge transfer resistance compared to the other potentials.
Double Layer Capacitance: The higher phase angle observed at -0.7 V indicates a greater double layer capacitance, potentially related to increased manganese coating coverage. The shape and position of the phase curves indicate differences in the structure and uniformity of the coating formed at different potentials.
Practical Implications: At -0.55 V, the lower charge transfer resistance may facilitate faster electrodeposition, though the coating quality may be inferior. Conversely, at -0.7 V, the higher charge transfer resistance and greater double layer capacitance suggest a more controlled and uniform electrodeposition, potentially resulting in superior coating quality.
The phase angle analysis in
Figure 12 reveals that a potential of -0.55 V results in a lower charge transfer resistance, potentially leading to faster, albeit less uniform, manganese electrodeposition. The higher phase angle and greater double layer capacitance at -0.7 V imply a more capacitive interface, consistent with a more uniform and dense manganese deposition. This suggests that electrodeposition at -0.7 V not only improves the uniformity and adherence of the manganese layer but also enhances the protective qualities of the coating by facilitating a more stable and capacitive double layer.
These findings align with the Nyquist and Bode plots, further supporting the conclusion that a potential of -0.7 V offers the optimal conditions for manganese electrodeposition. This potential provides a balanced environment that ensures efficient charge transfer while maintaining a high double layer capacitance, crucial for achieving a consistent and protective manganese layer.
