1. Introduction
Cancer is characterized by an uncontrolled growth of abnormal cells that can appear and metastasize in different tissues of the body, and cancer is currently the second leading cause of death after cardiovascular disease [
1]. Breast cancer is now the most prevalent cancer detected worldwide and ranks fifth among the leading causes of cancer related deaths, having surpassed lung cancer as the most commonly diagnosed cancer with 2.3 million new cases (11.7%). This is followed by lung cancer (11.4%), colorectal cancer responsible for 1 in 6 of all female cancer-related deaths and is the leading (10.0%), prostate cancer (7.3%), and gastric cancer (5.6%). Breast cancer is responsible cause in 110 countries worldwide [
2]. It is widely accepted that estrogen plays a crucial role in the progression and metastasis of breast cancer. Specifically, in postmenopausal woman the concentration of 17_-estradiol (E2) in breast cancer may be up to ten times higher than in plasma [
3]. This may be due to either increased plasma uptake or in situ androgen aromatization. Aromatase, an enzyme involved in the rate-limiting step of estrogen biosynthesis, catalyzes three successive hydroxylation reactions that aromatize C19 androgens to C18 estrogens. Aromatase is part of the cytochrome P450 enzyme superfamily and is a membrane-bound protein located in the endoplasmic reticulum. Human aromatase (CYP19A1) is located on chromosome 15, band q21.2 of the genome [
4]
Therefore, inhibiting estrogen synthesis by blocking aromatase is an advantageous therapeutic approach to treating hormonally sensitive breast cancer [
5]. Aromatase inhibitors (AIs) are first-line drugs for the treatment of estrogen receptor (ER)-positive breast cancer in postmenopausal women. Letrozole has been approved by the Food and Drug Administration as a first-line therapy for hormone-sensitive breast cancer in postmenopausal women, as they have been proven to be superior to tamoxifen, a representative of selective estrogen receptor modulators (SERMs) [
6].
Letrozole, a reversible third-generation aromatase inhibitor, stops the final step of the conversion of androgens to estrogens [
7], with inhibition rates of up to 80–90%. Consequently, letrozole reduces the availability of estrogen in various organs and tissues including the ovaries, breasts, adipose tissue, and musculoskeletal system [
8]. While letrozole markedly inhibits the action of estrogen in breast cancer cells, it also causes systemic effects for instance, estrogens control the metabolism of lipids and lipoproteins, and a decrease in their production may result in a dysregulation of lipid indices [
9].
The integration of nanotechnology into the field of oncology has introduced The integration of nanotechnology into the field of oncology has introduced nanoemulsions as a pivotal innovation for enhancing cancer treatment efficacy. These nano-sized emulsions are engineered for improved drug delivery, offering significant advantages in solubility, bioavailability, and targeted therapy. This advancement promises to overcome some of th most persistent challenges in cancer therapeutics, including reducing systemic toxicity and achieving precise delivery of anticancer agents [
10,
11].
Parallel to the evolution of nano-delivery systems, the repurposing of existing drugs for cancer treatment has emerged as a strategic approach to expedite the availability of novel therapies. This strategy leverages the known safety profiles of established drugs and offers a cost effective pathway to discovering new anticancer treatments. Traditionally used as an antifungal medication, Miconazole has attracted attention for its potential anticancer properties. Research suggests that Miconazole may inhibit cancer cell growth, making it a candidate for oncological repurposing [
12,
13].
Furthermore, olive oil, a natural product rich in phenolic compounds, has been recognized for its health benefits, including anticancer properties. Studies have indicated that olive oil can induce apoptosis and inhibit proliferation in certain cancer cell lines, presenting a compelling case for its inclusion in anticancer formulations [
14,
15].
In this context, our study seeks to encapsulate Miconazole in an olive oil-based nanoemulsion to enhance its delivery and efficacy against cancer. We will focus on developing this formulation, characterizing its physical attributes, and assessing its anticancer performance. This approach endeavors to advance the application of nanotechnology and drug repurposing in oncology, potentially offering a novel avenue for cancer treatment. Moreover, these effects wer validated by the molecular docking approach at a molecular level.
2. Materials and Methods
2.1. Materials
Miconazole nitrate (Sigma Aldrich, USA), Tween 80 and Span 20 (Merck SA, Darmstadt, Germany), olive oil (Saudi Green industry, Riyadh, Saudi Arabia). Cell culture materials were purchased from Gibco (Gaithersburg, MD, USA). All other chemicals and solvents used were of analytical grade.
2.2. Methods
2.2.1. Solubility Determination of Miconazole
The solubility of Miconazole nitrate in olive oils, with Tween 80 as the surfactant and Span 20 as the co-surfactant, was assessed. An excess of miconazole nitrate powder was introduced into each solvent (approximately 5ml). To ensure solubilization, all samples were agitated on a magnetic stirrer for 72 hours at room temperature. . Following this, the samples underwent centrifugation at 10,000 rpm for 10 minutes to separate any undissolved particles. The clear supernatant obtained was then diluted with methanol and its absorbance was measured using a spectrophotometer at a wavelength of 272 nm. Methanol-diluted solutions of the oils were utilized as the control blanks [
16].
2.2.2. Formulation of Miconazole-Loaded Olive Oil Nanoemulsion
For the formulation of a basic nanoemulsion, we incorporated 6 ml of oil, 2.5 ml of Tween 80, and 1.5 ml of Span 20. The oil phase, also known as the preconcentrate, was prepared by accurately measuring and blending these components for a duration ranging from a few seconds to several minutes until a uniform solution was achieved. The phase inversion technique was employed to prepare the nanoemulsion (NE). Approximately one-fourth of the water phase (22.5 ml) was initially added to and mixed with the preconcentrate. This was followed by the gradual integration and mixing of the remaining volume of the aqueous phase (67.5 ml).For the formulation of the drug-loaded nanoemulsion, the same procedure was followed, except that 3 mg of Miconazole was dissolved in the preconcentrate (oil phase) before proceeding with the subsequent steps. [
17].
2.2.3. Measurement of Particle Size, Zeta Potential, and PDI
The hydrodynamic diameter (droplet size) and polydispersity index (PDI) were determined using the dynamic light scattering (DLS) method, coupled with cumulants analysis. A Malvern® Zetasizer Nano ZS (United Kingdom) equipped with Zetasizer software (version 7.10) was employed for this purpose. Prior to each measurement, the samples were diluted approximately 25-fold in ultra-pure water. For each formulation under investigation, two separate disposable cuvettes were prepared, and the instrument automatically conducted three distinct measurements for each, with the temperature set at 25°C. These measurements were typically carried out within 30 minutes following dilution. In the Zetasizer software settings, water was specified as the dispersant (with a Refractive Index of 1.330 and viscosity of 0.8872 cP), and the material was assigned a Refractive Index of 1.450 to represent the “oil phase.” To evaluate the impact of refrigeration on the mean droplet size and PDI, the formulations were stored at 4°C overnight (for at least 12 hours). Subsequently, measurements were conducted in the same manner as described earlier, immediately after the samples were removed from the refrigerator. The zeta potential was measured using Malvern’s Dip Cell Kit on the same instrument, following the same preparation procedures. The measurements were taken at temperatures of 25°C, with water chosen as the dispersant (Dielectric Constant of 78.5) and “lipid” as the material [
18].
2.2.4. Determination of Miconazole Concentration in Olive Oil Nanoemulsion
The quantification of Miconazole in the olive oil nanoemulsion was performed by diluting 1 ml of the emulsion with 10 ml of methanol. Following dilution, the mixture was subjected to centrifugation at 5000 revolutions per minute (rpm) for 30 minutes to separate any undissolved components. The resultant clear supernatant was subsequently collected for analysis. The concentration of Miconazole present in the nanoemulsion was determined using spectrophotometry, measuring the absorbance at a wavelength of 272 nm (λmax).
2.2.5. In vitro Drug Release of Miconazole
The study examined the release behavior of miconazole solution and Miconazole loaded nanoemulsion in vitro using a dialysis membrane with a molecular weight cutoff of 12000 Dalton (
Cole-Parmer, USA). A test sample containing 10 mg of Miconazole was enclosed within the dialysis membrane, which was then securely tied at both ends using a non-reactive thread. Before starting the experiment, the membrane was pre-soaked in water for 24 hours. It was then immersed in a phosphate-buffered saline (PBS) solution with a pH of 7.4, which also contained 5.0% dimethyl sulfoxide (DMSO) to ensure a consistent release environment. Samples of 1 Ml were collected at predetermined intervals (0.5, 1, 2, 4, 8, 12, and 24 hours), with each withdrawn sample immediately replaced by an equivalent volume of fresh medium. These samples were then prepared, filtered, and the concentration of Miconazole was measured using a UV-visible spectrophotometer (U-1800, Hitachi) at a wavelength of 272 nm after appropriate dilution. [
19].
2.3. Cell Lines Preparation
Human breast adenocarcinoma (MCF-7), liver carcinoma cells (HePG2), and colon adenocarcinoma (HCT 116) cell lines obtained from ATCC were cultured in RPMI 1640 medium supplemented with 10% fetal bovine serum and 100 IU/mL penicillin/streptomycin [
17,
18,
19].
2.3.1. Cell Viability Assay
The cytotoxic potential of the formulated Miconazole-loaded olive oil nanoemulsion was evaluated using the sulforhodamine B (SRB) assay. Cells were plated in 96-well plates and treated with different concentrations of the nanoemulsion formulations. After 72 hours of incubation, cells were fixed, stained, and the optical density was measured at 540 nm using a microplate reader. The IC50 values were calculat using GraphPad software [
17,
18,
19].
2.3.2. Cell Cycle Analysis
MCF-7, HePG2, and HCT 116 cells were plated in 6-well plates, treated with the plain Miconazole, olive oil nanoemulsion, or Miconazole-olive oil nanoemulsion at their respective IC50 values, and incubated for 48 hours. Subsequently, cells were harvested, fixed, and stained with propidium iodide (PI). Flow cytometry analysis was conducted to determine cell cycle distribution using a Cytek® Northern Lights 2000 spectral flow cytometer [
17,
18,
19].
2.3.3. Apoptosis Analysis
Annexin V-FITC/propidium iodide staining was performed to assess apoptosis induction in the treated cell lines. MCF-7, HePG2, and HCT 116 cells were cultured, treated with different formulations at their IC50 values, and incubated for 48 hours. The cells were stained with Annexin V-FITC/PI, and flow cytometry analysis was conducted to evaluate cellular apoptosis/necrosis [
17,
18,
19].
2.4. Molecular Docking
Molecular docking studies were conducted using Molecular Operating Environment software (MOE, 2019.0901) and the results of molecular docking were visualized in PyMOL 2.4 software. They explained the possible binding modes and molecular interactions behind the inhibitory activities of micnazole and Letrozol. The 3D structures of micnazole and letrozole were obtained from the PubChem database (
https://pubchem.ncbi.nlm.nih.gov/), and X-ray crystal structure coordinates of aromatase protein in complex with HEM (PDB ID: 5JKW), was obtained from the Protein Data Bank (
http://www.rcsb.org/) and utilized for this Analysis.
2.5. Statistical Analysis
All experiments were performed in triplicate, and the results were reported as mean ± SD. Statistical significance was evaluated using Student’s t-test and one-way analysis of variance (ANOVA) with GraphPad Prism software. A significance level of p < 0.05 was considered statistically significant.
The outlined methodology presents a comprehensive approach to formulate, characterize, and evaluate the Miconazole-loaded olive oil nanoemulsion’s physical properties, drug release profiles, and potential anticancer activity. Furthermore, determining the antifungal minimum inhibitory concentration (MIC) adds a valuable dimension to the study, providing insights into the formulation’s dual functionality as a potential anticancer and antifungal agent [
17,
18,
19].
3. Results
3.1. Solubility Determination of Miconazole
The highest solubility of Miconazole was observed in Tween 80 (13.2 ± 1.3 mg/ml), followed by Span 80 (7.1 ± 1.8 mg/ml), and the lowest solubility was found in Olive Oil (0.53 ± 0.035 mg/ml) as shown in (
Table 1).
3.2. Particle Size, Zeta Potential, and Polydispersity Index (PDI)
The physical characterization of the nanoemulsions revealed that the plain olive oil nanoemulsion had a particle size of 113.33 ± 8.4 nm, a zeta potential of -8 ± 0.84 mV, and a polydispersity index (PDI) of 0.318. When Miconazole was incorporated into the olive oil nanoemulsion, the particle size increased to 177.76 ± 5.2 nm, the zeta potential became more negative at -24 ± 0.94 mV, and the PDI rose to 0.496. Refrigeration of the Miconazole-olive oil nanoemulsion slightly increased the particle size to 181.42 ± 3.25 nm, maintained a similar zeta potential at -23 ± 0.47 mV, and the PDI remained at 0.496 as shown in (
Table 2).
3.3. Determination of Miconazole Concentration in Olive Oil Nanoemulsion
The drug loading capacity of a nanoemulsion is a crucial factor in defining the quantity of drug conveyed to the target tumor tissue. The Miconazole-olive oil nanoemulsion exhibited a drug content of 98.3 ± 0.55%, indicating a substantial capacity for drug incorporation essential for nanoemulsion formulations.
3.4. Miconazole In Vitro Release
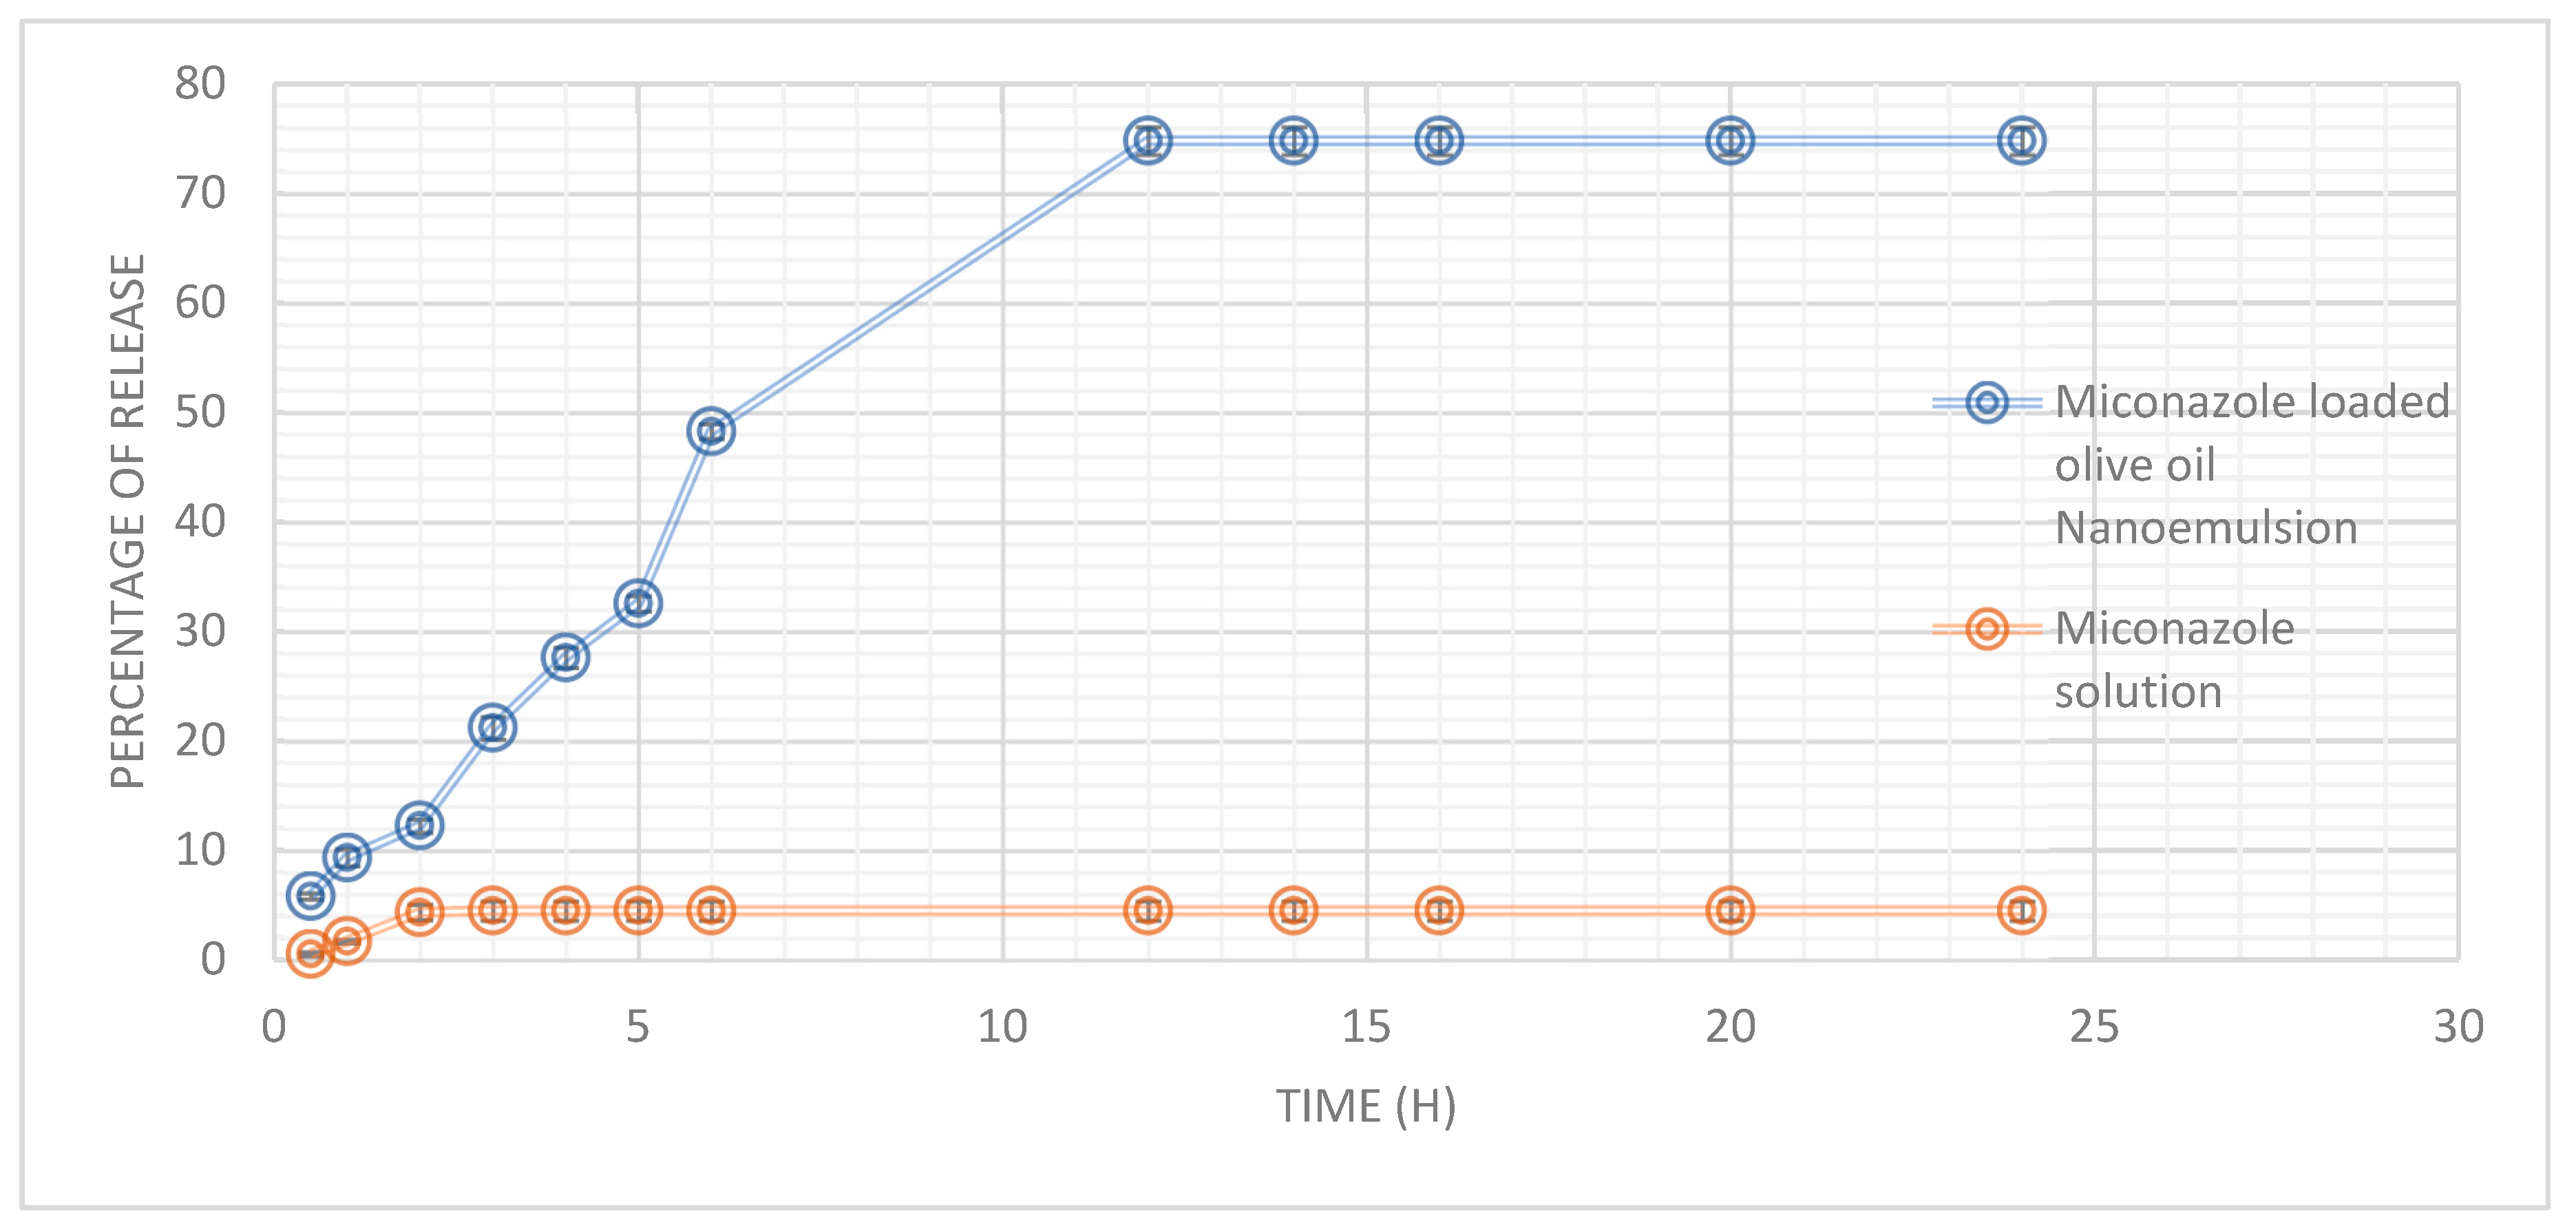
Miconazole’s in vitro release profile from an olive oil nanoemulsion and a solution was studied over a 24-hour. The olive oil nanoemulsion exhibited a gradual and sustained release of Miconazole, with 5.83% released at 0.5 hours and a significant increase to 48.3% by 6 hours. The release rate reached a plateau after 12 hours, with approximately 74.83% of Miconazole released, maintaining this level for up to 24 hours. In contrast, the miconazole solution demonstrated a markedly lower release percentage, starting at 0.55% at 0.5 hours and reaching only 4.5% at 3 hours, remaining constant throughout the 24-hour period (
Figure 1).
3.5. In Vitro Cytotoxicity Evaluation
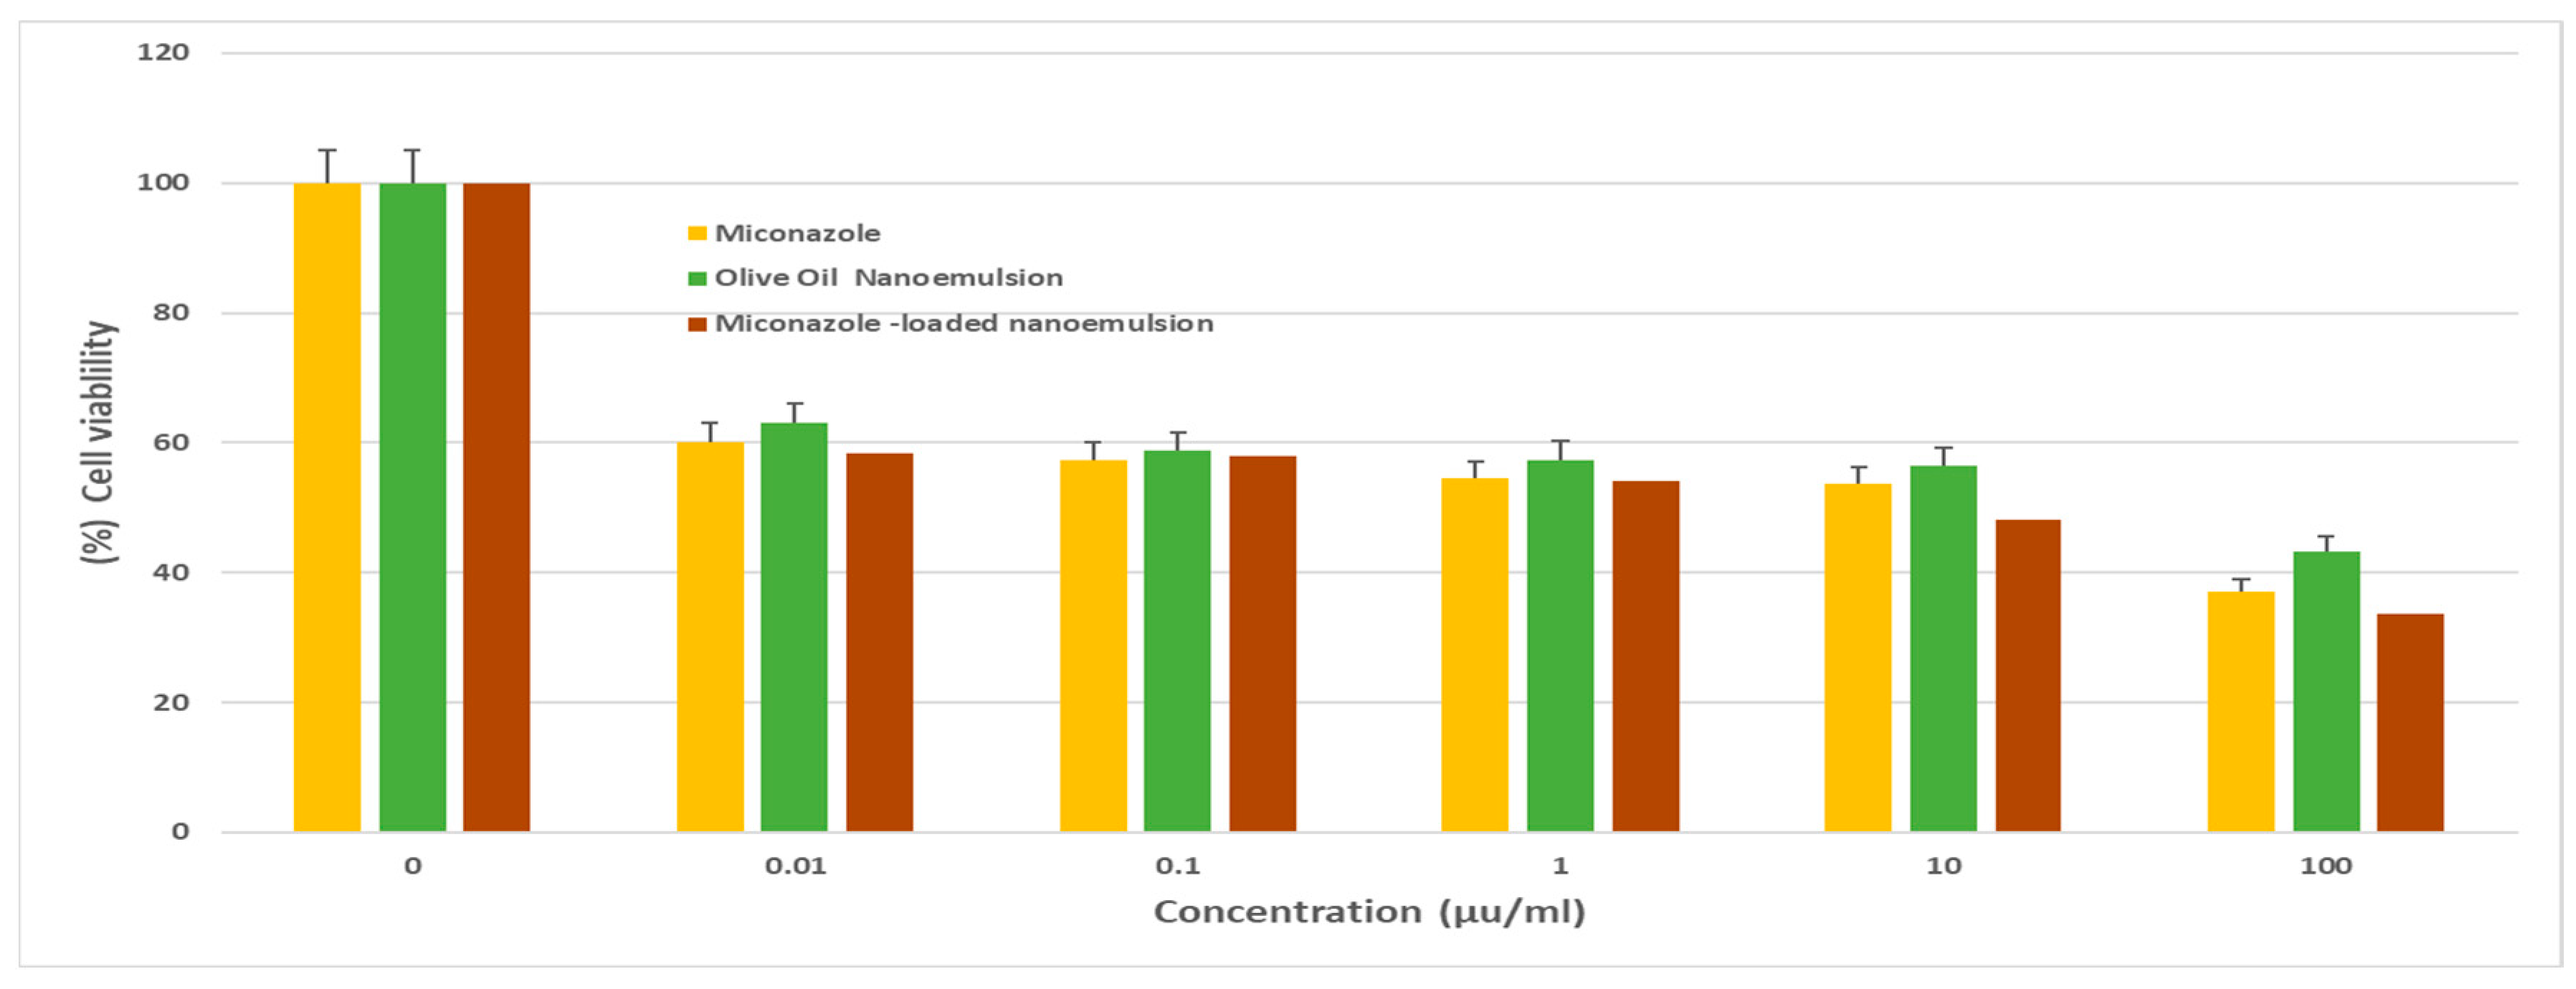
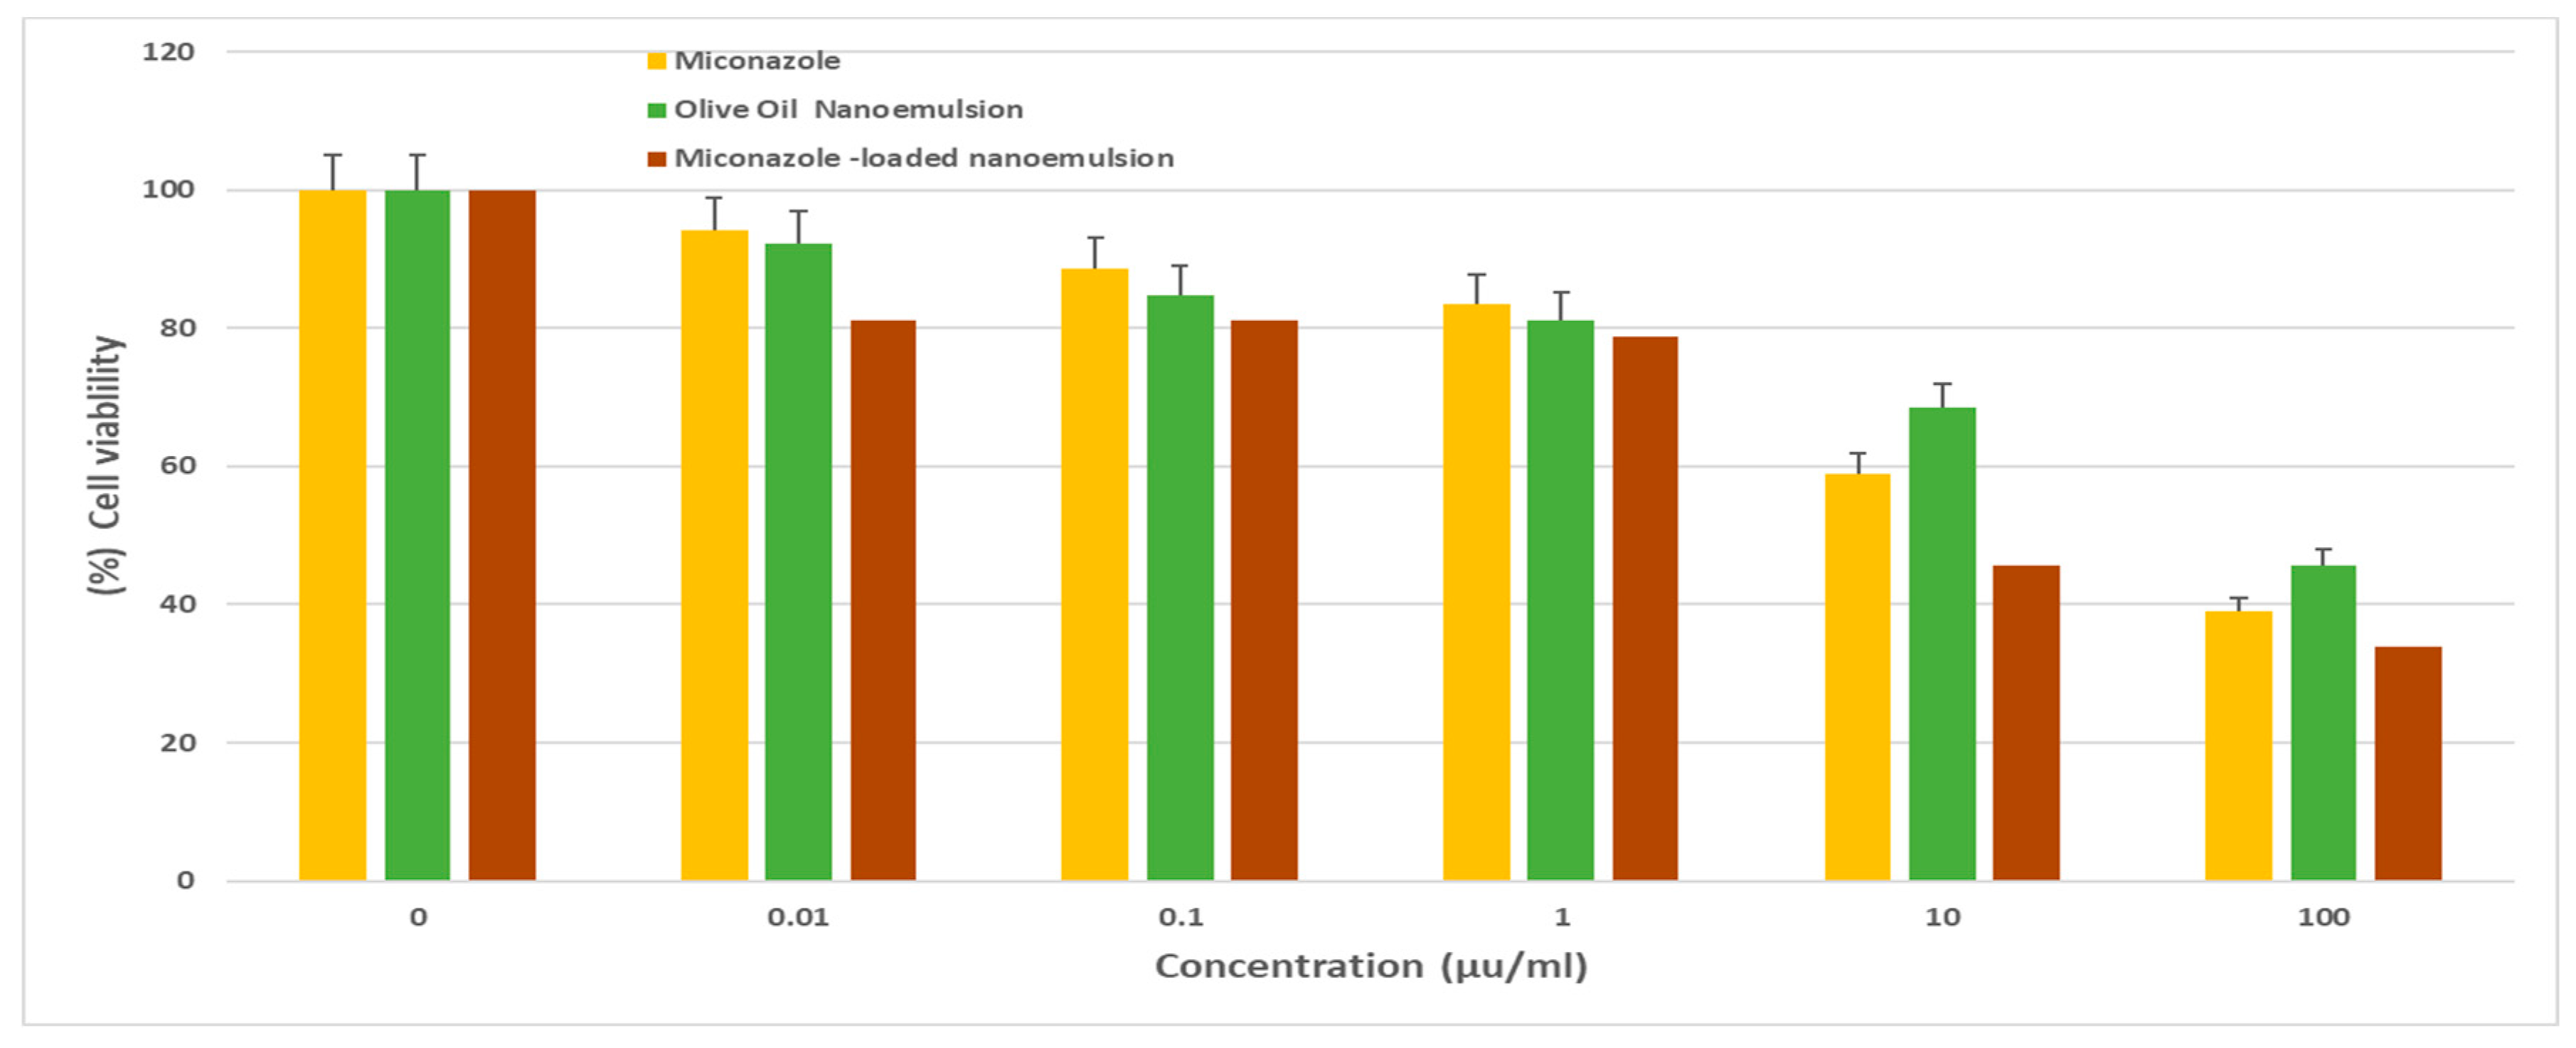
The results indicated varying degrees of cytotoxicity against the cancer cells. The Miconazole-loaded olive oil nanoemulsion exhibited remarkable cytotoxic activity against MCF-7 cells (
Figure 2), with an IC
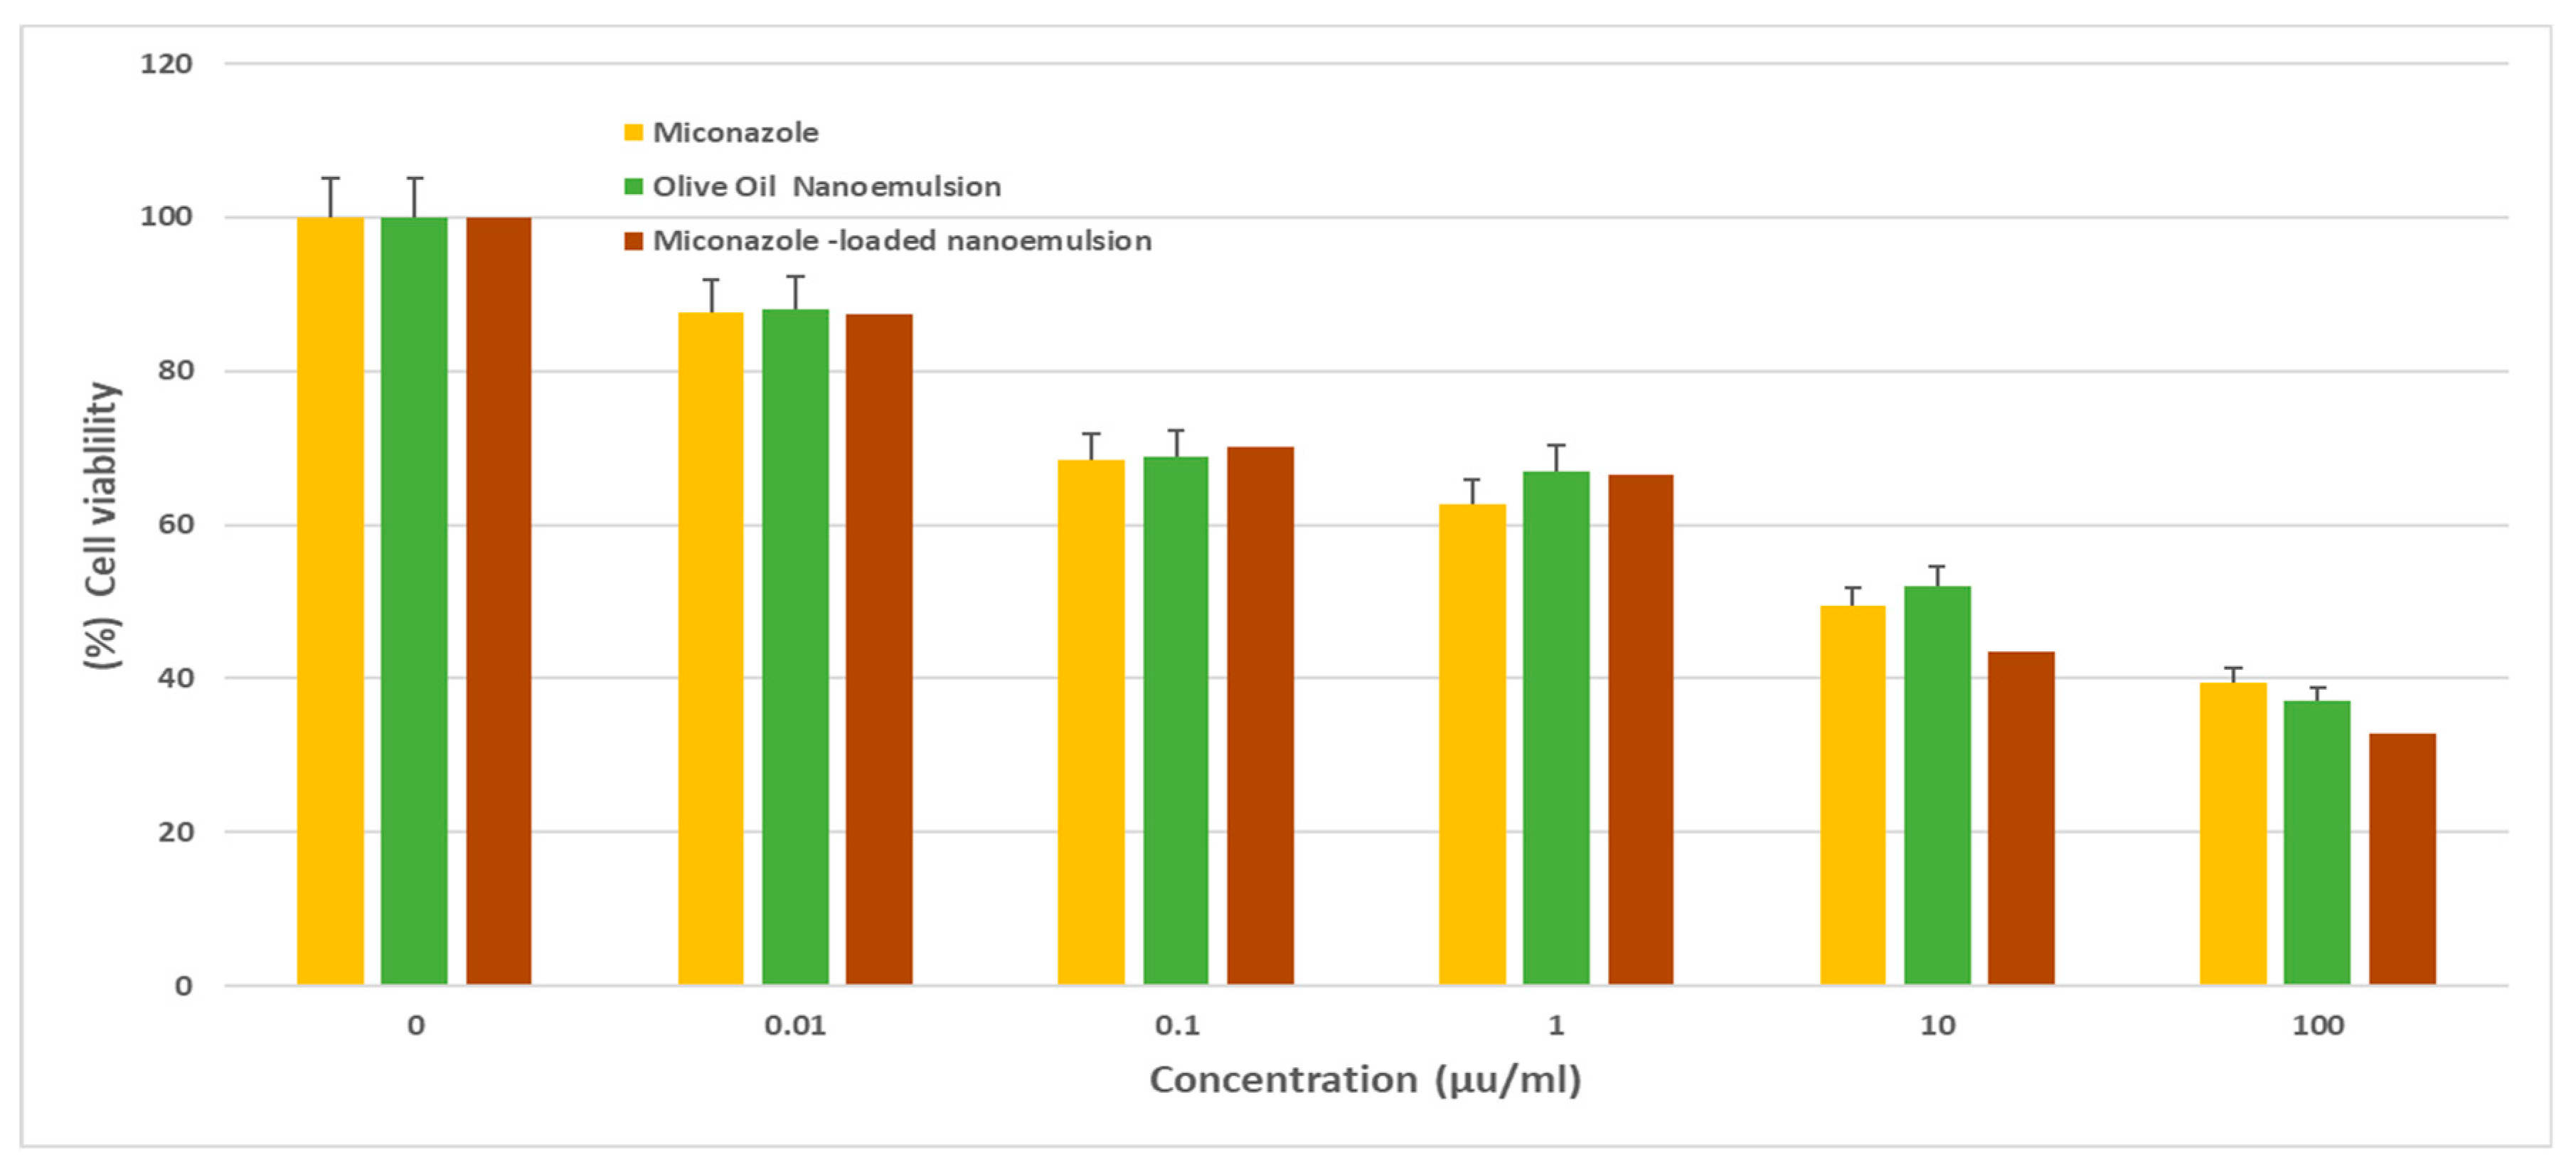
50 of 1.4 ± 0.4 µg/ml. It also demonstrated promising efficacy against HePG2 (
Figure 3) and HCT 116 cells (
Figure 4), with IC
50 values of 10.7 ± 1.2 and 5.9 ± 0.7 µg/ml, respectively. In comparison, the olive oil nanoemulsion displayed relatively lower cytotoxicity, showing IC
50 values of 20.8 ± 1.7, 34.5 ± 5.2, and 16.4 ± 2.1 µg/ml for MCF-7, HePG2, and HCT-116 cells, respectively As shown in (
Table 3). Furthermore, the non-formulated Miconazole demonstrated moderate cytotoxicity, with an IC
50 of 18.3 ± 2.6 µg/ml against HePG2 cells, while exerting stronger effects on MCF-7 and HCT 116 cells, with IC
50 values of 5.1 ± 1.7 and 10.3 ± 1.2 µg/ml, respectively. These results highlight the enhanced cytotoxic potential of the Miconazole-loaded olive oil nanoemulsion, underscoring its promise as a potential anticancer agent.
3.6. Effect on Cell Cycle Distribution
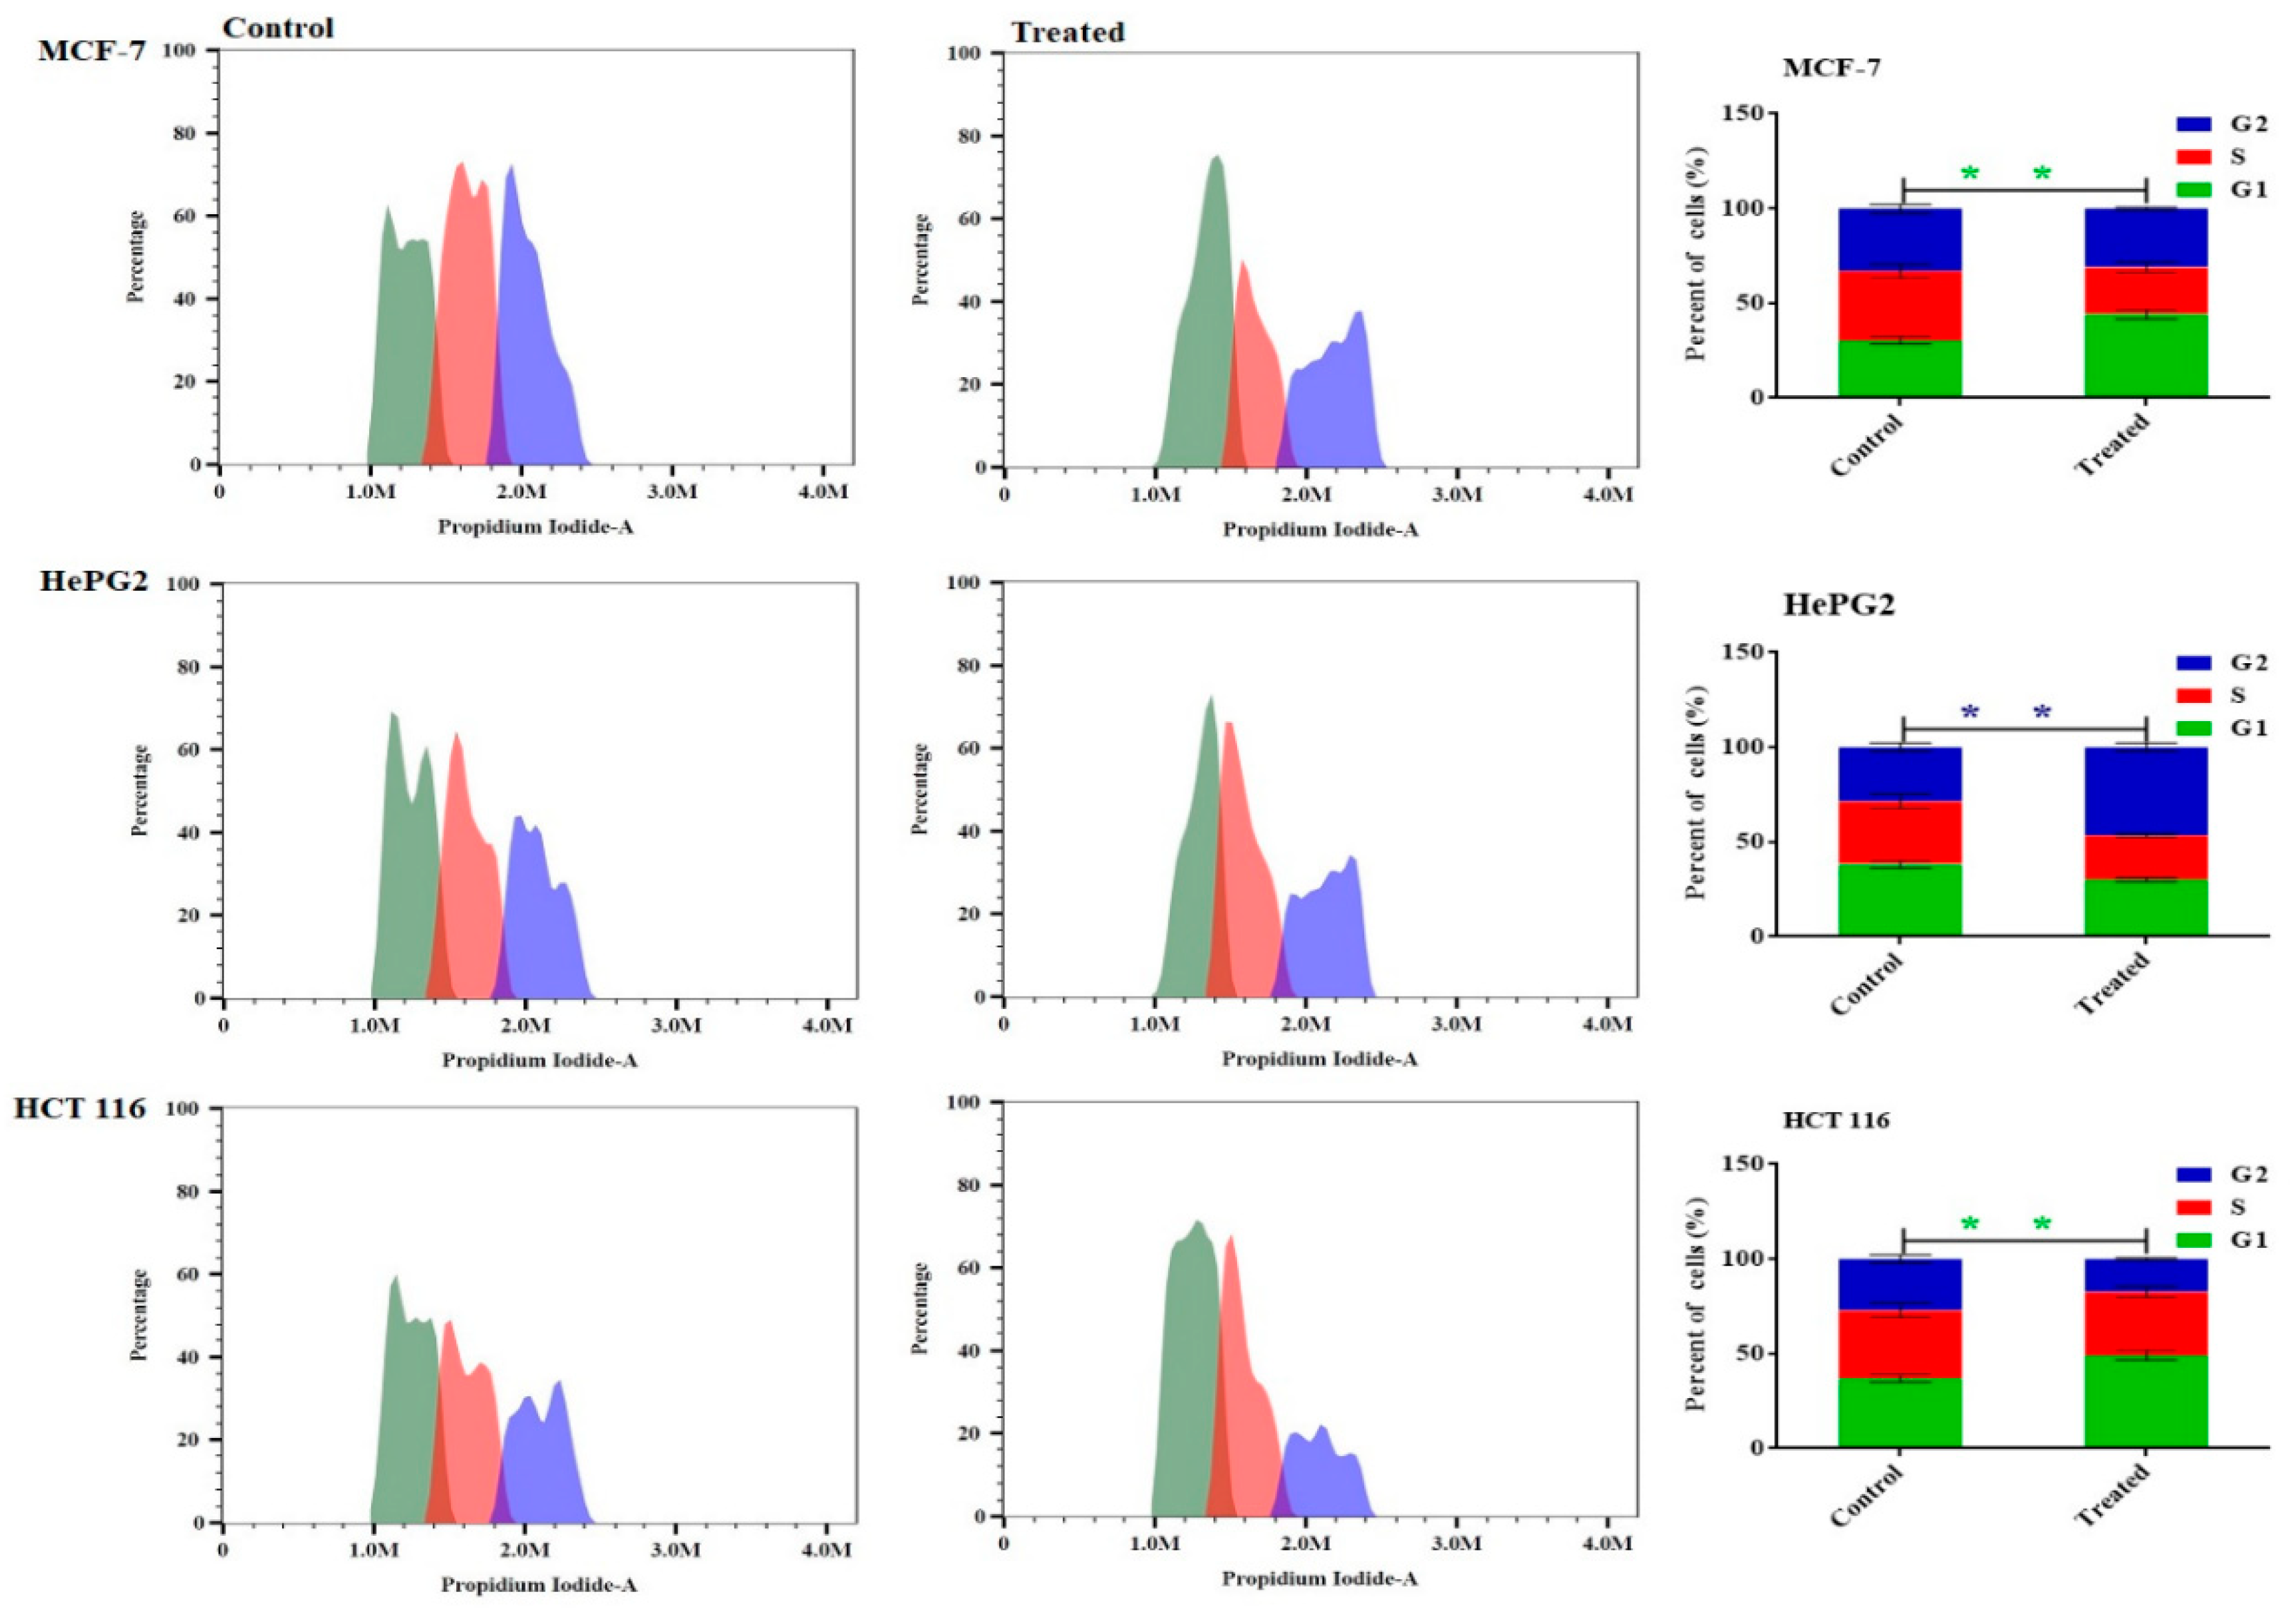
The study aimed to investigate the anticancer effects of Miconazole-loaded olive oil nanoemulsion by examining its impact on the cell cycle phases of MCF-7, HepG2, and HCT 116 cancer cells after 48 hours of treatment. Flow cytometry was used to analyze the distribution of cell cycle phases. The results showed that the Miconazole-loaded olive oil nanoemulsion formulation significantly arrested MCF-7 cells in the G1 phase, with a ratio of 48.3% ± 2.1%, and increased the number of HCT 116 cells arrested in the G1 phase by 48.05% ± 2.3%. Similarly, the formulation significantly increased the number of HepG2 cells arrested in the G2 phase, with a 47.5% ± 1.73 ratio compared to the control cells (
Figure 5).
3.7. Evaluation of Cell Apoptosis Using Annexin V-FITC
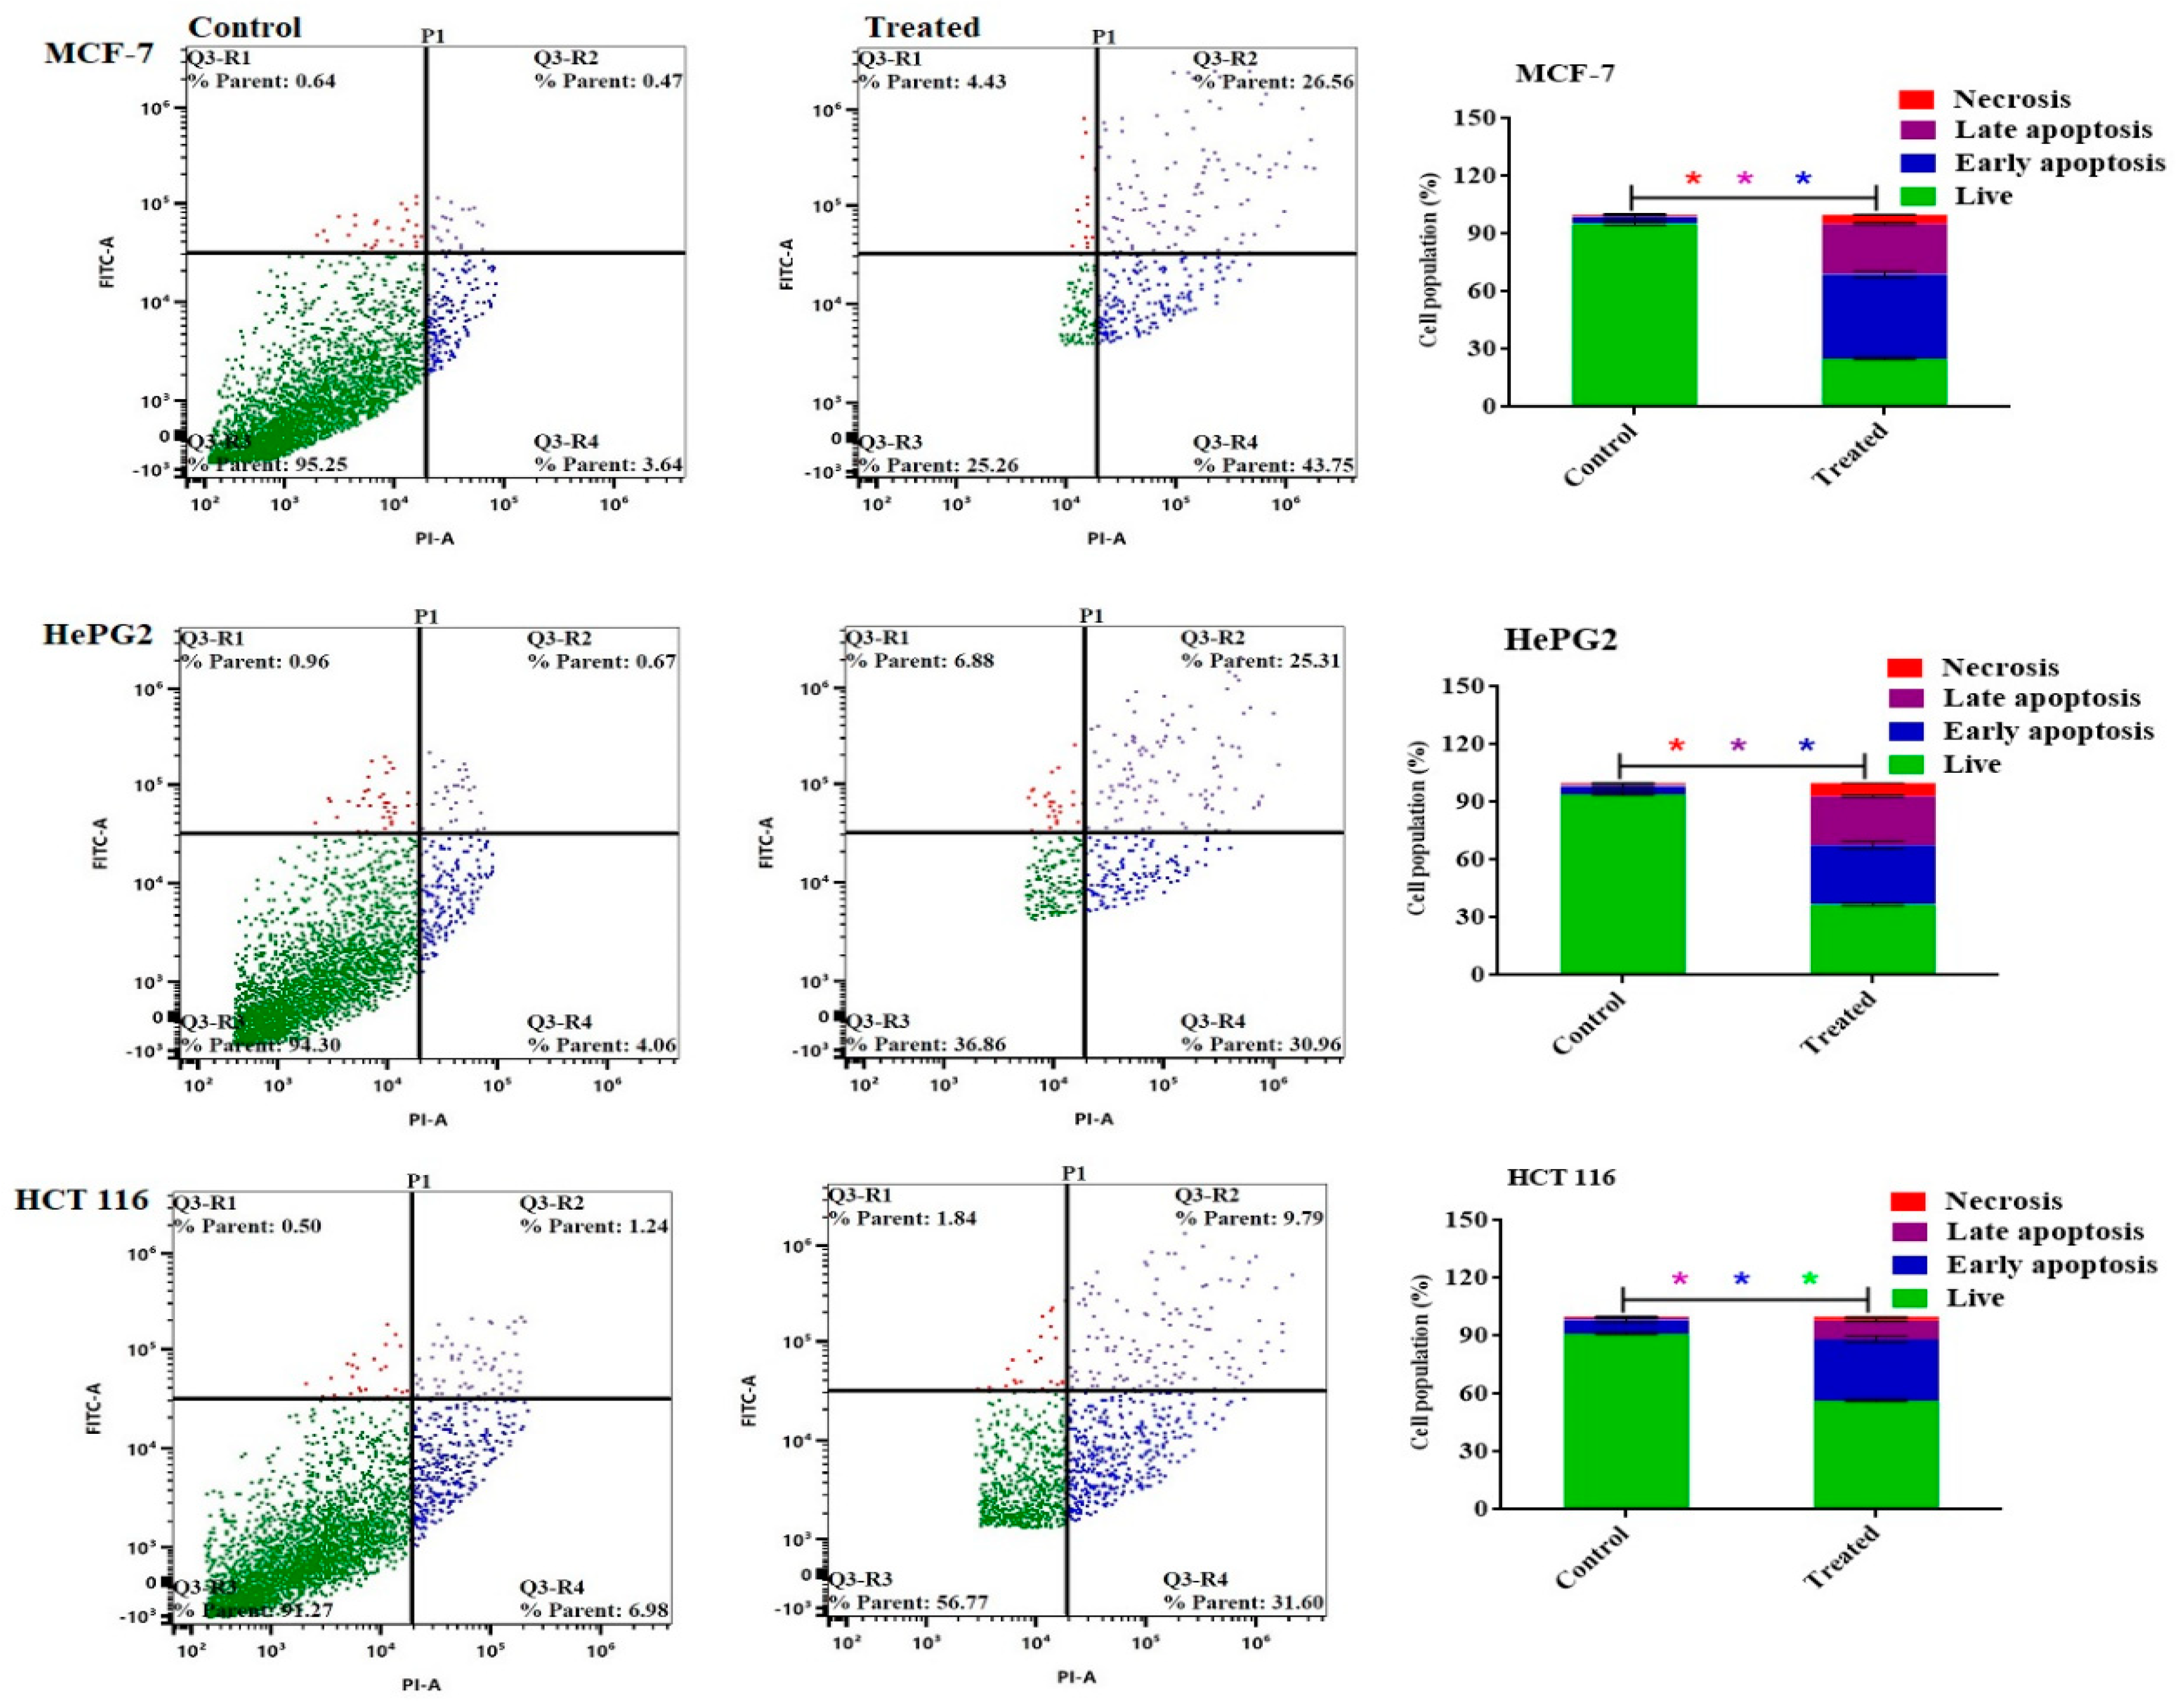
The Annexin V-FITC/PI staining method was employed to discern between apoptosis (programmed cell death) and necrosis (non-programmed cell death) in MCF-7, HePG2, and HCT 116 cells. This approach, coupled with flow cytometry, facilitated the accurate classification of cellular responses upon treatment. As depicted in
Figure 6, the results unveiled a significant enhancement in the induction of apoptosis across the different cell lines following treatment with miconazole-olive oil nanoemulsion. Even before considering the impact of the formulation on cancer cells, the data revealed a notable increase in apoptotic MCF-7 cells, exhibiting a rise of 70.31 ± 2.1 percent in the apoptotic population. In comparison, HePG2 cells showed a lower apoptotic percentage of 56.3 ± 1.6, while the apoptotic effect on HCT 116 cells (41.39 ± 1.3 percent) was comparatively less pronounced upon treatment with miconazole-olive oil nanoemulsion.
3.8. Structures Similarity between Micnazol and Letrozol
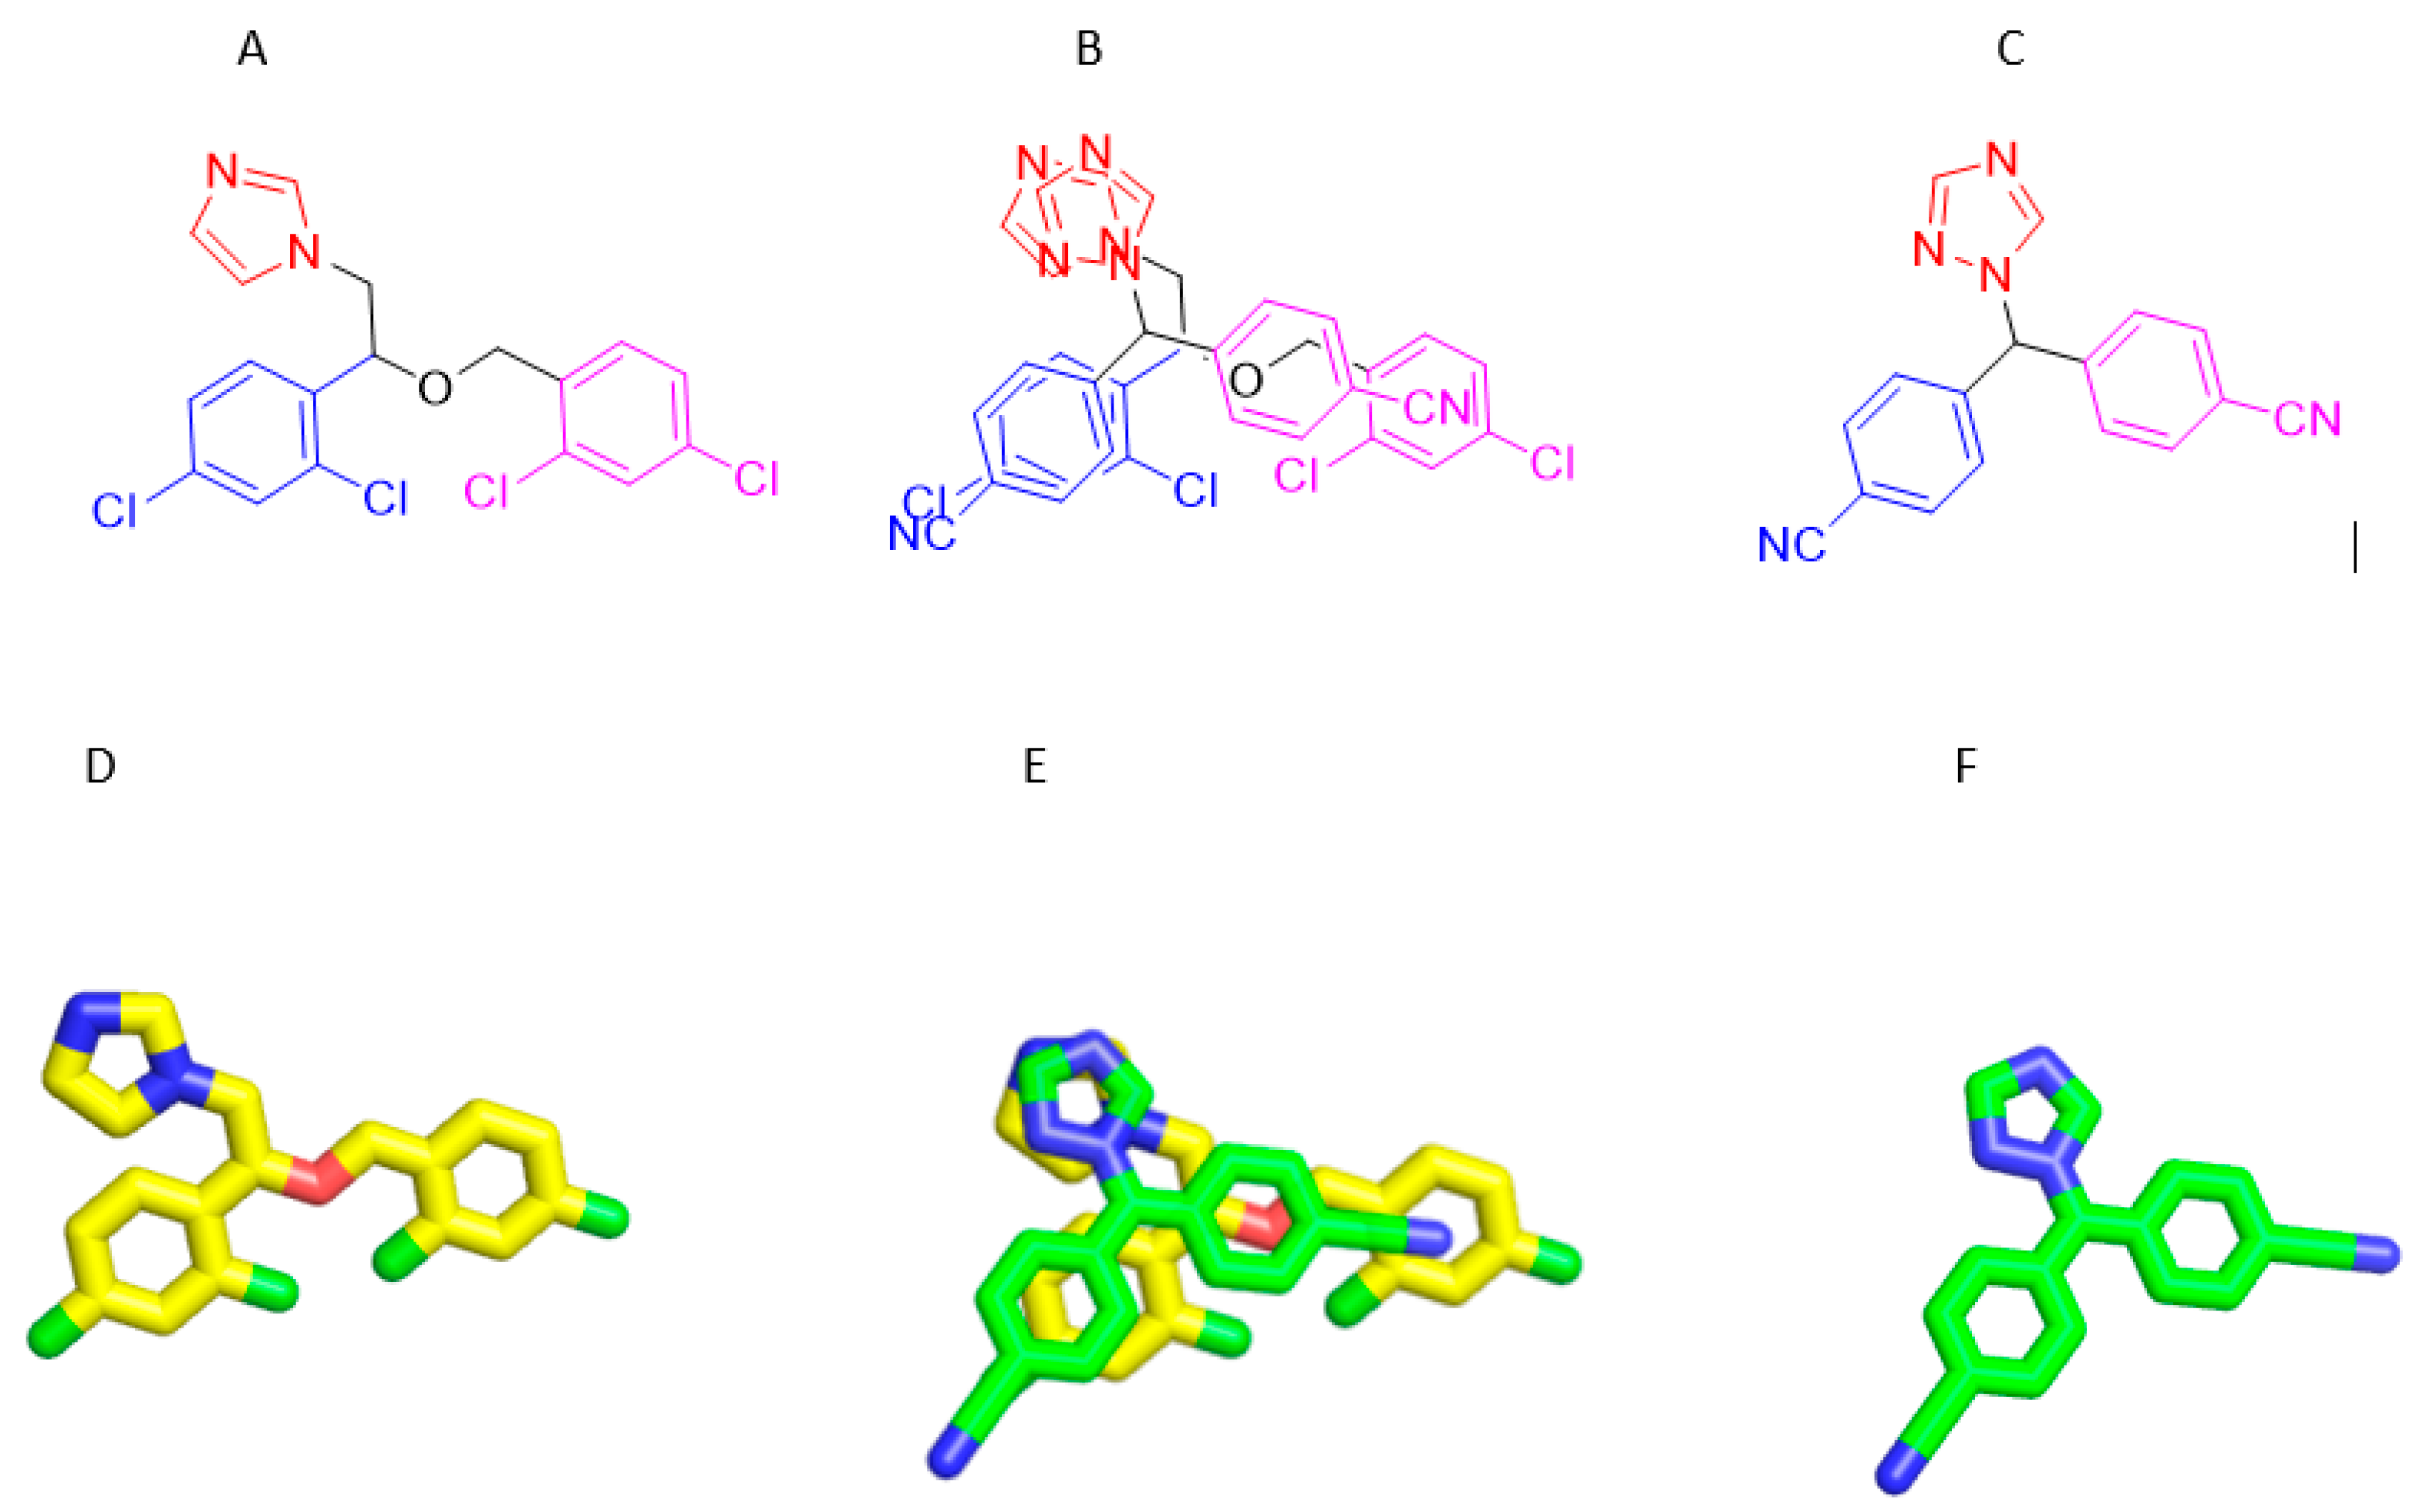
Depending on result of biological activity. The Miconazole-loaded olive oil nanoemulsion exhibited strong cytotoxic activity against breast cancer (MCF-7 cell line) (Figur 2), with an IC50 of 1.4 ± 0.4 µg/ml and beside on the facts about structural similarity between pairs of compounds dataset highly correlates with the similarity between their activities across the cancer cell lines. This result shows that structurally similar drugs can be expected to have a similar effect on cancer cell line encouraged us to performed Molecular Docking Studies on Aromatize inhibitor Letrozol which is structurally similar to Miconazole and supported our postilion about molecular docking simulation results and their interaction pattern will be harmonic with their anticancer activity.
Figure 7.
A) Structure of Micnazole, B) Alignment of Micnazole/ Letrozol, C) Structure of Letrozol D) 3D Structure of micnazole E) Alignment of Micnazole/ Letrozol F) 3D Structure of Letrozol.
Figure 7.
A) Structure of Micnazole, B) Alignment of Micnazole/ Letrozol, C) Structure of Letrozol D) 3D Structure of micnazole E) Alignment of Micnazole/ Letrozol F) 3D Structure of Letrozol.
3.9. Molecular Docking
Molecular docking determines the binding affinity of a compound toward the binding cavity of its receptor. First, the RMSD value of re-docking of the co-crystalized ligand with aromatase in complex with HEM (ID: 5jkw) was 0.724 Å, and Score 33.4 kcal/mol indicating the accuracy and efficiency of the docking methodology used in this research.
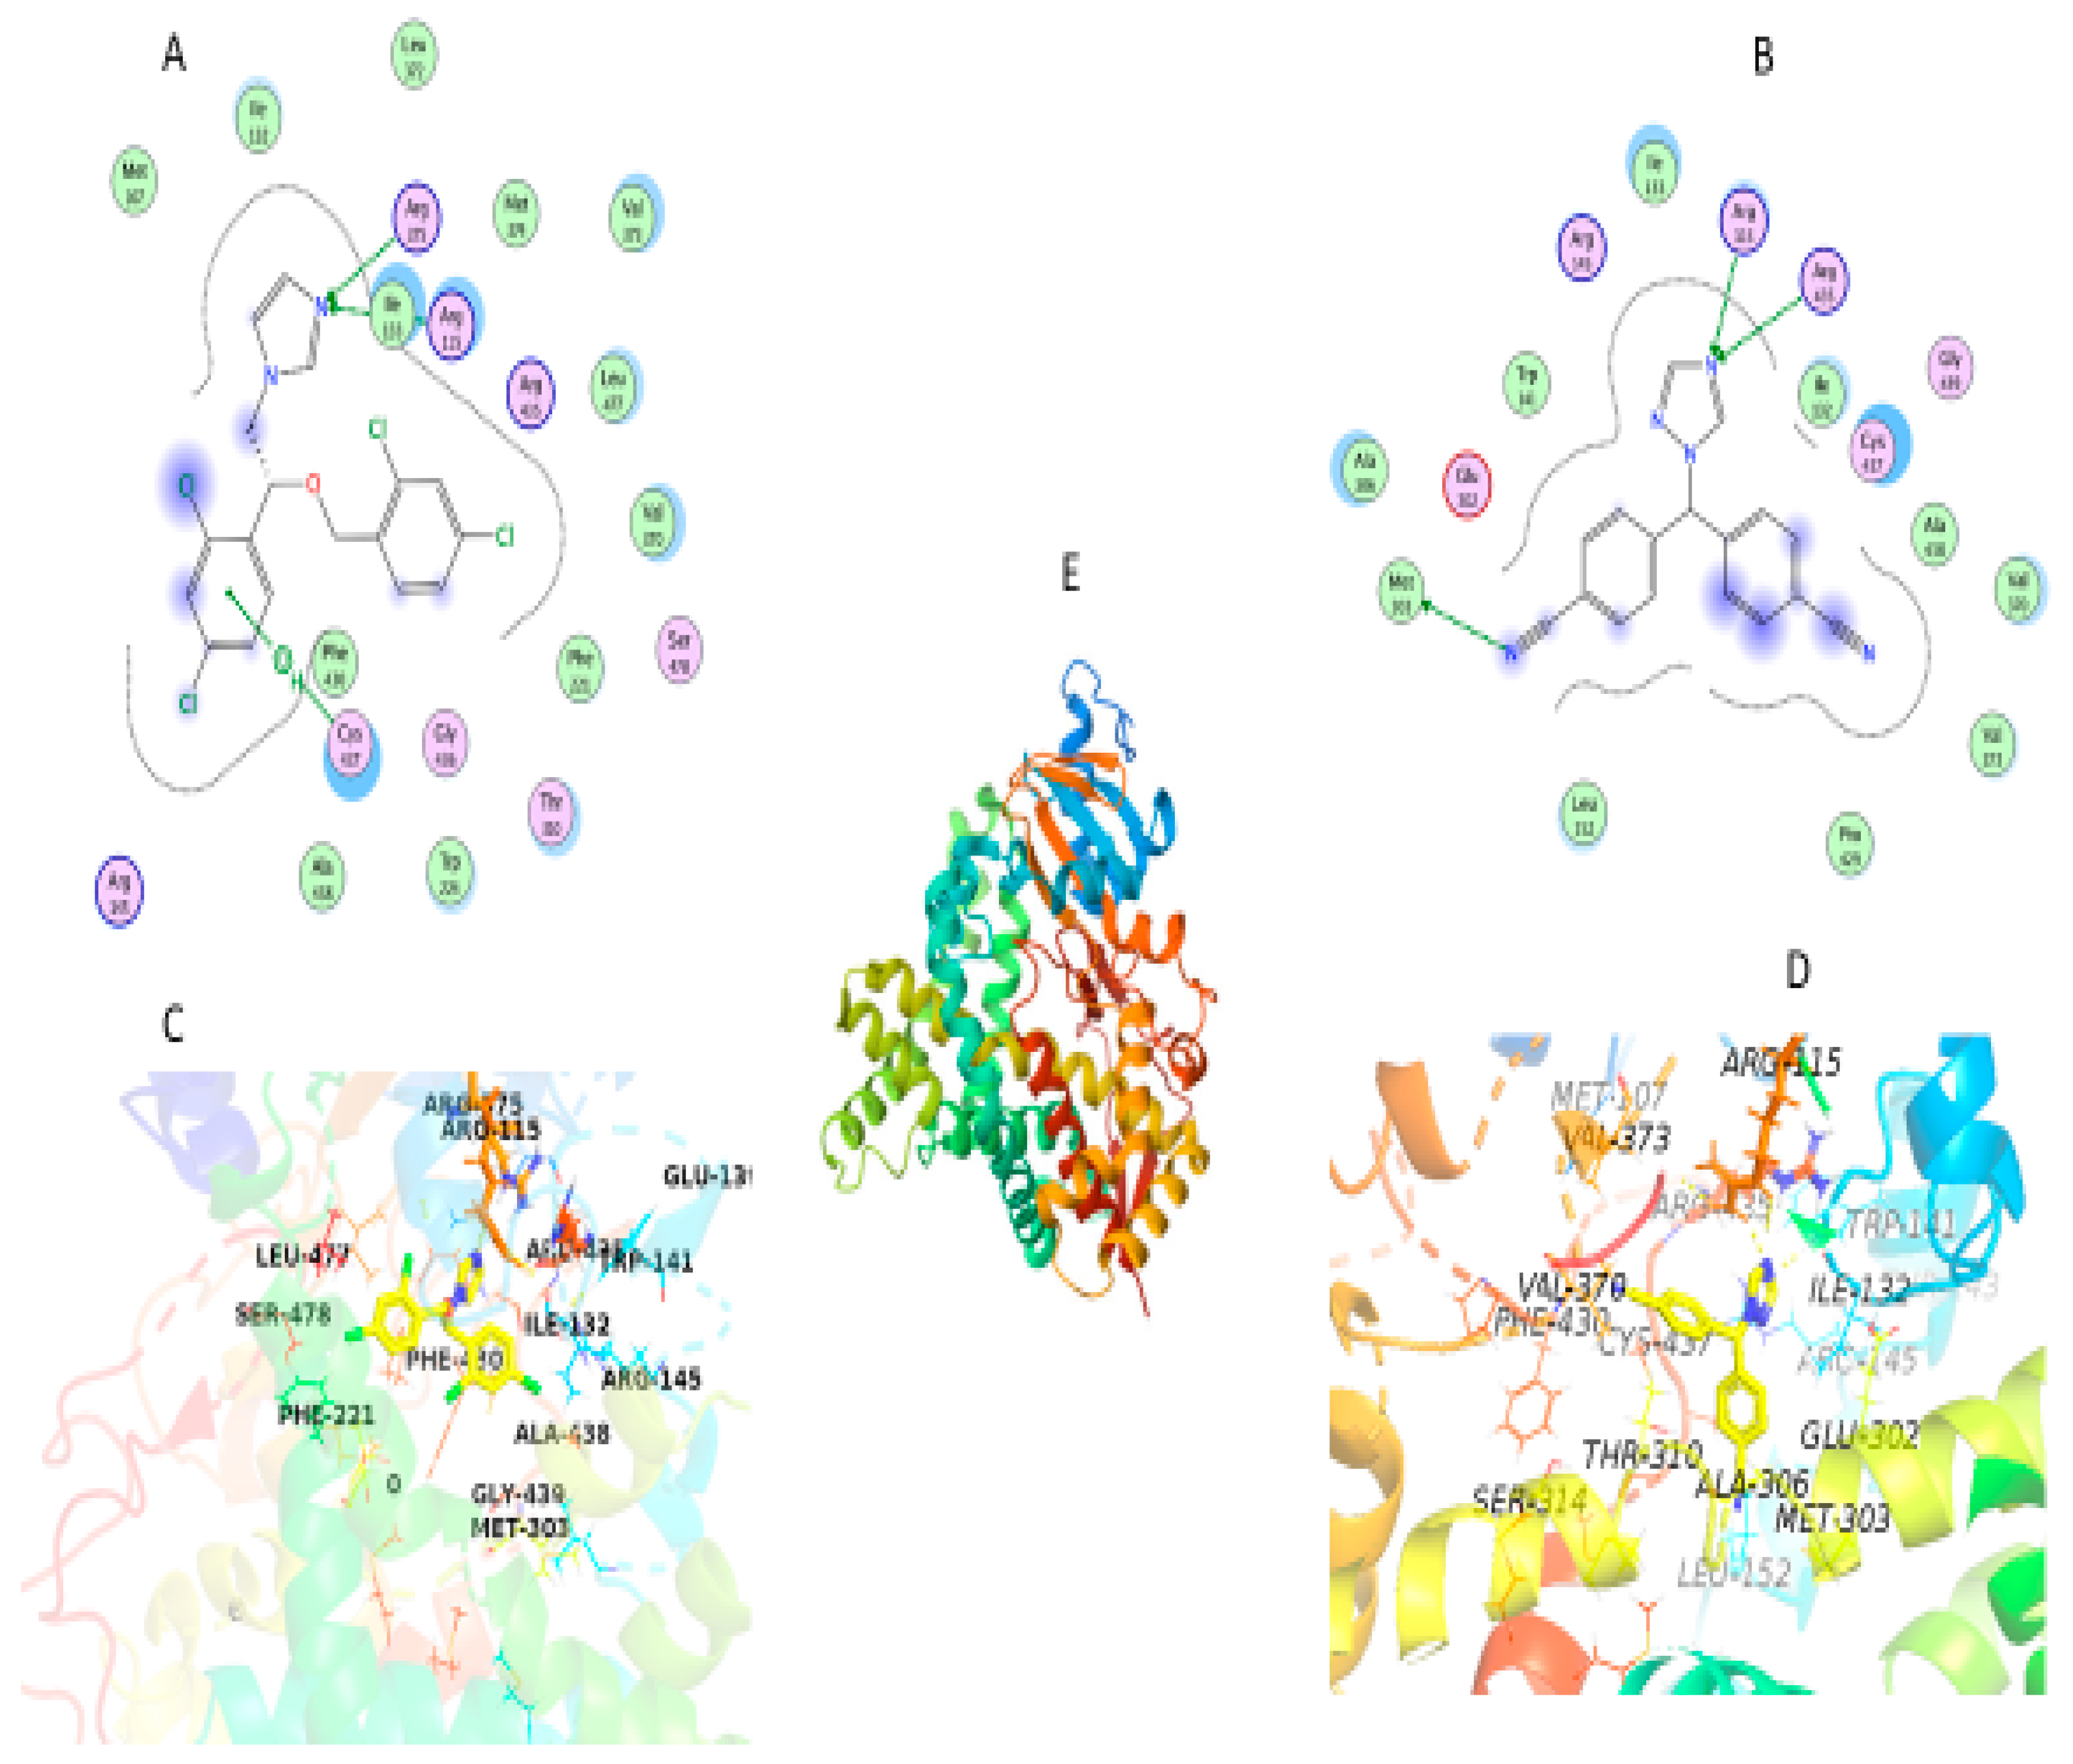
In this study, our aim was to find novel micnazole which is letrozole analogues that could serve as inhibitors of aromatase enzymes using in silico studies. Docking of micnazole and letrozole with the aromatase protein in complex with HEM (Figure) resulted in the best pose, and both occupied the binding pocket of the co-crystallized ligand with a docking score of 21.2 and 19.5 kcal/mol and RMSD 1.7 and 1.9 Å respectively.
Docking of Molecules into the Binding Site of Protein
Currently, cocrystal structure of Letrozol with aromatase have not been reported. So that we performed molecular docking of Latrazole and micnazole with the aromatase enzyme in complex with HEM by using MOE 2019.0901 and PyMOL 2.4 software. X-ray crystal coordinates of aromatase protein PDB ID: 5JKW), in complex with HEM) was obtained from the Protein Data Bank (
http://www.rcsb.org/) and utilized for this analysis.
The cocrystal structure of Letrozole and Miconazole with aromatase enzymes in complex with HEM displayed similar interactions as the native reference molecule by forming Hydrogen bond with Arg115 residue, and demonstrated hydrophobic interactions, and Pi–cation interactions. Letrozole and Miconazole keeping a crucial hydrogen bond between the Arg115 residue in the hinge region and N of trizole in letrozol and N of imadiazol in Micanazol. Moreover another hydrogen bond was observed between N of triazole in Latrazol with Arg435 residue and N of imadazol with Arg375 residue in Micanzole. Furthermore, there are hydrophobic interactions with the surrounding residues Phe430, Ala438, Gly436, Trp224, Thr310, Phe221, Val370, Leu477, Arg435, Met374, Leu372, Val373, Ile133, Ile132, Met107, Glu302, Leu477 and Arg145 in micanzole and Leu152, Pro429, Val373, Val370, Ala438, Cys437, Gly439, Ile132, Ile133, Trp141, Glu302, Ala306, Met374, Thr310, Met107, Phe430, Gly436, Leu477 and Arg145 in letrozol were observed. Additionally Pi-cation interaction was observed between Cys437 and phenyl ring in Miconazole and hydrogen bond between Met303 residue and Cyano group in Latrazol as shown in
Figure 8.
These results of docking revealed nearly similar in binding mode and hydrophobic interaction between Micanzole and Letrozol which supported our postulation in ability of Miconazole to act as anticancer agent and this harmonic with anticancer activity of micanzole against breast cancer MCF7as shown in
Table 3.
Figure 8.
Schematic diagram of molecular docking (A) 2D of Micanzol fits into aromatase active site; (B) 2D of Letrozol fits into aromatase active site, (C) 3D of Micanzol fits into aromatase active site; (D) 3D of Letrozol fits into aromatase active site, (E) 3D of aromatase enzyme complex with HEM. Micanzol and Letrozol represented as Yellow sticks, hydrogen bonds (depicted as yellow dotted lines).
4. Discussion
The solubility results for Miconazole in different solvents provide crucial insights into the formulation of nanoemulsion systems for drug delivery, indicating the potential for enhanced therapeutic efficacy with a Miconazole-loaded nanoemulsion. The absorption of Miconazole into the olive oil nanoemulsion is marked by an increase in particle size, likely due to changes in the internal phase volume or viscosity, affecting droplet size during emulsification [
20]. A slight increase in particle size under refrigeration suggests temperature influences nanoemulsion stability, possibly through viscosity changes or component crystallization. [
21].
The more negative zeta potential in the Miconazole-loaded nanoemulsion compared to the plain version suggests improved stability against aggregation, likely from interactions between Miconazole and surfactant molecules [
22]. Refrigeration does not significantly alter the zeta potential, indicating stability under cooler conditions, which is beneficial for storage. An increased PDI in Miconazole-containing formulations points to a wider particle size distribution, potentially from variations in drug solubilization. [
21].
Despite these changes, drug loading efficiency remains high, which is crucial for achieving effective therapeutic concentrations, particularly in cancer treatment. The nanoemulsion’s release profile for Miconazole surpasses that of solutions, suggesting an enhanced solubility and bioavailability with a controlled release potential that could improve patient compliance. However, the solution’s poor release underscores the challenges with the solubility of hydrophobic drugs and the necessity for advanced systems like nanoemulsions [
23].
The cytotoxicity study shows the Miconazole-loaded nanoemulsion significantly impacts various cancer cells, with a notable activity against MCF-7 cells, underlining its potential as a cancer therapy.
15 The nanoemulsion’s influence on cell cycle distribution and apoptosis, particularly in MCF-7 and HePG2 cells, highlights its promise as a targeted therapeutic option—these multifaceted mechanisms of action of the Miconazole-loaded nanoemulsion warrant further investigation for cancer treatment applications [
24]
5. Conclusions
In conclusion, this study explored the potential of Miconazole-loaded olive oil nanoemulsion as a novel approach for repurposing the antifungal agent, Miconazole, into an effective anticancer therapeutic. Through the formulation and characterization of the nanoemulsion, we demonstrated its favorable physicochemical properties, including particle size, zeta potential, and polydispersity index. The nanoemulsion exhibited promising drug loading capacity and sustained drug release profiles, which are crucial for successful nanoemulsion formulations.
The in vitro biological evaluations provided valuable insights into the cytotoxicity and anticancer efficacy of the Miconazole-loaded olive oil nanoemulsion. The nanoemulsion exhibited significant cytotoxicity against various cancer cell lines, including MCF-7, HePG2, and HCT 116, with IC50 values indicating its potent inhibitory effects. Furthermore, our findings showed that the nanoemulsion induced apoptotic cell death in a dose-dependent manner, suggesting its potential as an effective strategy for targeting cancer cells.
The observed cell cycle arrest further supports the notion that Miconazole-loaded olive oil nanoemulsion profoundly impacts cancer cells, affecting their proliferation and progression through the cell cycle. This effect varied among cancer cell lines, indicating its potential for tailored therapeutic interventions.
In summary, the results presented in this study highlight the promising potential of Miconazole-loaded olive oil nanoemulsion as a novel approach to cancer therapy. The combination of repurposing an established antifungal agent, formulating it into a nanoemulsion, and demonstrating its anticancer efficacy through various cellular assays opens new avenues for developing innovative cancer therapeutics. Further investigations, including in vivo studies and clinical trials, are warranted to validate this nanoemulsion’s translational potential in cancer treatment fully. Molecular docking validated these therapeutic mechanisms by showing the strong interactions between Miconazole and associated aromatase proteins complex with HEM as Letrozol given the promising study results of Miconazole in breast cancer MCF7 cell line.
Acknowledgments:
This work was funded by the Deanship of Scientific Research at Princess Nourah bint Abdulrahman University, through the Research Groups Program Grant no (RGP-1443-0049).
Conflicts of Interest:
The authors declare that there is no conflict of interest.
Abbreviations
HCT116: human colorectal carcinoma cell line, HepG2: hepatoblastoma cell line, MCF-7:Michigan Cancer Foundation-7.
References
- Naghavi, M.; Wang, H.; Lozano, R.; Davis, A.; Liang, X.; Zhou, M.; Vollset, S.E.; Abbasoglu Ozgoren, A.; Abdalla, S.; Abd-Allah, F.; et al. Global, regional, and national age-sex specific all-cause and cause-specific mortality for 240 causes of death, 1990-2013: A systematic analysis for the Global Burden of Disease Study 2013. Lancet 2015, 385, 117–171. [Google Scholar]
- Sung, H.; Ferlay, J.; Siegel, R.L.; Laversanne, M.; Soerjomataram, I.; Jemal, A.; Bray, F. Global Cancer Statistics 2020: Globocan Estimates of Incidence and Mortality Worldwide for 36 Cancers in 185 Countries. CA Cancer. J. Clin. 2021, 71, 209–249. [Google Scholar] [CrossRef]
- van Landeghem, A.A.J.; Poortman, J.; Nabuurs, M.; Thijssen, J.H.H. Endogenous Concentration and Subcellular Distribution of Estrogens in Normal and Malignant Human Breast Tissue. Cancer Res. 1985, 45, 2900–2906. [Google Scholar] [PubMed]
- Bulun, S.E.; Takayama, K.; Suzuki, T.; Sasano, H.; Yilmaz, B.; Sebastian, S. Organization of the Human Aromatase P450 (CYP19) Gene. Semin. Reprod. Med. 2004, 22, 5–9. [Google Scholar] [PubMed]
- Chumsri, S.; Howes, T.; Bao, T.; Sabnis, G.; Brodie, A. Aromatase, aromatase inhibitors, and breast cancer. J. Steroid Biochem. Mol. Biol. 2011, 125, 13–22. [Google Scholar] [CrossRef]
- Riemsma, R.; Forbes, C.A.; Kessels, A.; Lykopoulos, K.; Amonkar, M.M.; Rea, D.W.; Kleijnen, J. Systematic review of aromatase inhibitors in the first-line treatment for hormone sensitive advanced or metastatic breast cancer. Breas Cancer Res. Treat. 2010, 123, 9–24. [Google Scholar] [CrossRef] [PubMed]
- Haynes, B.P.; Dowsett, M.; Miller, W.R.; Dixon, J.M.; Bhatnagar, A.S. The pharmacology of letrozole. J. Steroid Biochem. Mol. Biol. 2003, 87, 35–45. [Google Scholar] [CrossRef] [PubMed]
- Buzdar, A.U.; Robertson, J.F.R.; Eiermann, W.; Nabholtz, J.M. An overview of the pharmacology and pharmacokinetics of the newer generation aromatase inhibitors anastrozole, letrozole, and exemestane. Cancer 2002, 95, 2006–2016. [Google Scholar] [CrossRef] [PubMed]
- Mumford, S.L.; Schisterman, E.F.; Siega-Riz, A.M.; Browne, R.W.; Gaskins, A.J.; Trevisan, M.; Steiner, A.Z.; Daniels, J.L.; Zhang, C.; Perkins, N.J.; et al. A longitudinal study of serum lipoproteins in relation to endogenous reproductive hormones during the menstrual cycle: Findings from the BioCycle study. J. Clin. Endocrinol. Metab. 2010, 95, E80–E85. [Google Scholar] [CrossRef]
- Chehelgerdi, M.; Chehelgerdi, M.; Allela, OQ.; Pecho, RD.; Jayasankar, N.; Rao, DP.; Thamaraikani, T.; Vasanthan, M.; Viktor, P.; Lakshmaiya, N.; Saadh, MJ. Progressing nanotechnology to improve targeted cancer treatment: overcoming hurdles in its clinical implementation. Mol. Cancer 2023, 22, 1–103. [Google Scholar]
- Malik, S.; Muhammad, K.; Waheed, Y. Emerging applications of nanotechnology in healthcare and medicine. Molecules 2023, 28, 1–30. [Google Scholar] [CrossRef] [PubMed]
- Jung, HJ.; Seo, I.; Jha, BK.; Suh, SI.; Baek, WK. Miconazole induces autophagic death in glioblastoma cells via reactive oxygen species-mediated endoplasmic reticulum stress. Oncol. Lett. 2021, 21, 1–9. [Google Scholar] [CrossRef] [PubMed]
- Chengzhu, WU.; Gao, M.; Shen, L.; Bohan, LI.; Bai, X.; Gui, J.; Hongmei, LI.; Huo, Q.; Tao, MA. Miconazole triggers various forms of cell death in human breast cancer MDA-MB-231 cells. Die Pharmazie. Int. J. Pharm. Sci. 2019, 74, 290–294. [Google Scholar]
- Gorzynik-Debicka, M.; Przychodzen, P.; Cappello, F.; Kuban-Jankowska, A.; Marino Gammazza, A.; Knap, N.; Wozniak, M.; Gorska-Ponikowska, M. Potential health benefits of olive oil and plant polyphenols. Int. J. Mol. Sci. 2018, 19, 1–13. [Google Scholar] [CrossRef]
- Spagnuolo, C.; Moccia, S.; Tedesco, I.; Crescente, G.; Volpe, MG.; Russo, M.; Russo, GL. Phenolic Extract from Extra Virgin Olive Oil Induces Different Anti-Proliferative Pathways in Human Bladder Cancer Cell Lines. Nutrients 2022, 15, 1–20. [Google Scholar] [CrossRef] [PubMed]
- Reference for solubility study.
- Alotaibi, HF.; Khafagy, ES.; Abu Lila, AS.; Alotaibe, HF.; Elbehairi, SE.; Alanazi, AS.; Alfaifi, MY.; Alamoudi, JA.; Alamrani, SS.; Mokhtar, FA. Anticancer potentials of metformin loaded coconut oil nanoemulsion on MCF-7, HepG2 and HCT-116 cell lines. Artif. Cells Nanomed. Biotechnol. 2023, 51, 419–427. [Google Scholar] [CrossRef] [PubMed]
- Alotaibi, HF.; Khafagy, ES.; Alfaifi, MY.; Alamoudi, JA.; Alshawwa, SZ.; Alqahtani, RS.; Alamrani, SS.; Abu Lila, AS. Cytotoxic Potential of Clarithromycin-Loaded Pumpkin Seed Oil-Based Nanoemulsion on Human Breast, Hepatic and Colorectal Cancer Cells. Sci. Adv. Mater. 2023, 15, 1199–1207. [Google Scholar] [CrossRef]
- Alotaibi, HF.; Khafagy, ES.; Alamoudi, JA.; Lila, AS. Enhancing Anticancer Efficacy through Nanoemulsion Formulation of Acetylsalicylic Acid and Black Seed Oil: A Comprehensive Characterization and Therapeutic Evaluation. Latin. American. J. Pharmacy. A Life Science. J. 2024, 43, 192–203. [Google Scholar]
- Artiga-Artigas, M.; Montoliu-Boneu, J.; Salvia-Trujillo, L.; Martín-Belloso, O. Factors affecting the formation of highly concentrated emulsions and nanoemulsions. Colloids Surf. A: Physicochem. Eng. Asp. 2019, 578, 1–39. [Google Scholar] [CrossRef]
- Mushtaq, A.; Wani, SM.; Malik, AR.; Gull, A.; Ramniwas, S.; Nayik, GA.; Ercisli, S.; Marc, RA.; Ullah, R.; Bari, A. Recent insights into Nanoemulsions: Their preparation, properties and applications. Food Chem. X 2023, 18, 1–15. [Google Scholar] [CrossRef]
- Farooq, U.; Rasul, A.; Zafarullah, M.; Abbas, G.; Rasool, M.; Ali, F.; Ahmed, S.; Javaid, Z.; Abid, Z.; Riaz, H.; Mahmood Arshad, RK. Nanoemulsions as novel nanocarrieres for drug delivery across the skin: In-vitro, in-vivo evaluation of miconazole nanoemulsions for treatment of Candidiasis albicans. Des. Monomers Polym. 2021, 24, 240–258. [Google Scholar] [CrossRef] [PubMed]
- Tayah, DY.; Eid, AM. Development of miconazole nitrate nanoparticles loaded in nanoemulgel to improve its antifungal activity. Saudi Pharm. J. 2023, 31, 526–534. [Google Scholar] [CrossRef] [PubMed]
- Jung, HJ.; Seo, I.; Jha, BK.; Suh, SI.; Baek, WK. Miconazole induces autophagic death in glioblastoma cells via reactive oxygen species-mediated endoplasmic reticulum stress. Oncol. Lett. 2021, 21, 1–9. [Google Scholar] [CrossRef] [PubMed]
Figure 1.
The cumulative Miconazole release Miconazole-loaded olive oil nanoemulsion and Miconazole solution permeated through the membrane for 24h. Each data point represents the mean ± SD (n = 3).
Figure 1.
The cumulative Miconazole release Miconazole-loaded olive oil nanoemulsion and Miconazole solution permeated through the membrane for 24h. Each data point represents the mean ± SD (n = 3).
Figure 2.
Cell viability of MCF-7 following treatment with various concentrations (0–100 μg/mL) of either Miconazole, olive oil nanoemulsion, or Miconazole-loaded olive oil nanoemulsion for 72 h. data represent mean ± SD.
Figure 2.
Cell viability of MCF-7 following treatment with various concentrations (0–100 μg/mL) of either Miconazole, olive oil nanoemulsion, or Miconazole-loaded olive oil nanoemulsion for 72 h. data represent mean ± SD.
Figure 3.
Cell viability of HePG-2 following treatment with various concentrations (0–100 μg/mL) of either. Miconazole, olive oil nanoemulsion, or Miconazole-loaded olive oil nanoemulsion for 72 h. data represent mean ± SD.
Figure 3.
Cell viability of HePG-2 following treatment with various concentrations (0–100 μg/mL) of either. Miconazole, olive oil nanoemulsion, or Miconazole-loaded olive oil nanoemulsion for 72 h. data represent mean ± SD.
Figure 4.
Cell viability of HCT116, following treatment with various concentrations (0–100 μg/mL) of either Miconazole, olive oil nanoemulsion, or Miconazole-loaded olive oil nanoemulsion for 72 h. data represent mean ± SD.
Figure 4.
Cell viability of HCT116, following treatment with various concentrations (0–100 μg/mL) of either Miconazole, olive oil nanoemulsion, or Miconazole-loaded olive oil nanoemulsion for 72 h. data represent mean ± SD.
Figure 5.
Effect of Miconazole-loaded nanoemulsion on cell cycle distributions of MCF-7, HepG2, and HCT analysis after exposure to treatment for 48 h. Data are presented as the mean ± SD.p<0.05 116 cells. Cell cycle distribution was determined using flow cytometry and p<0.01.
Figure 5.
Effect of Miconazole-loaded nanoemulsion on cell cycle distributions of MCF-7, HepG2, and HCT analysis after exposure to treatment for 48 h. Data are presented as the mean ± SD.p<0.05 116 cells. Cell cycle distribution was determined using flow cytometry and p<0.01.
Figure 6.
illustrates the apoptosis in MCF-7, HePG2, and HCT 116 cells after 48 hours of treatment with a Miconazole- loaded nanoemulsion. The dot plots show the distribution of apoptotic cells as determined by annexin V-FITC/PI staining. The column charts provide a quantitative analysis of the percentage of apoptotic cells following treatment with a nanoemulsion containing Miconazole.
Table 1.
The solubility of Miconazole in Tween 80, Span 20, and olive oil.
Table 1.
The solubility of Miconazole in Tween 80, Span 20, and olive oil.
| Solvent |
|
|
Solubility (mg/ml) |
| Tween 80 |
|
|
13.2 -+ 1.3 |
| Span 20 |
|
|
7.1 + - 1.8 |
| Olive Oil |
|
|
0.53 +-0.035 |
Table 2.
Physical Characterization of plain olive oil Nanoemulsions, Miconazole- olive oil Nanoemulsion , and refrigerated Miconazole- olive oil nanoemulsion.
Table 2.
Physical Characterization of plain olive oil Nanoemulsions, Miconazole- olive oil Nanoemulsion , and refrigerated Miconazole- olive oil nanoemulsion.
| Formulation |
Particle Size (nm) |
Zeta Potential (mV) |
PDI |
| Plain Olive Oil |
113.33 ± 8.4 |
0.318 |
-8 ± 0.84 |
| Nanoemulsion |
|
|
|
| Miconazole-Olive Oil |
177.76 ± 5.2 |
0.496 |
-24 ± 0.94 |
| Nanoemulsion |
|
|
|
| Refrigerated Miconazole- |
181.42 ± 3.25 |
0.496 |
-23 ± 0.47 |
| olive oil Nanoemulsion |
|
|
|
Table 3.
IC50 Values of Tested Compounds and Formulations:.
Table 3.
IC50 Values of Tested Compounds and Formulations:.
| Compound/ Formulation |
MCF-7 (µg |
HePG2 (µg/ml) |
HCT 116 (µg/ml) |
| Miconazole-loaded |
1.4 ± 0.4 |
10.7 ± 1.2 |
5.9 ± 0.7 |
| Nanoemulsion |
|
|
|
| |Olive Oil |
20.8 ± 1.7 |
34.5 ± 5.2 |
16.4 ± 2.1 |
| Nanoemulsion |
|
|
|
| Non-formulated |
5.1 ± 1.7 |
18.3 ± 2.6 |
10.3 ± 1.2 |
| Miconazole |
|
|
|
|
Disclaimer/Publisher’s Note: The statements, opinions and data contained in all publications are solely those of the individual author(s) and contributor(s) and not of MDPI and/or the editor(s). MDPI and/or the editor(s) disclaim responsibility for any injury to people or property resulting from any ideas, methods, instructions or products referred to in the content. |
© 2024 by the authors. Licensee MDPI, Basel, Switzerland. This article is an open access article distributed under the terms and conditions of the Creative Commons Attribution (CC BY) license (http://creativecommons.org/licenses/by/4.0/).

