Preprint
Article

Main Ships Propulsion Boiler Control and Hardware-in-Loop Model Implementation

Altmetrics

Downloads

78

Views

14

Comments

0

A peer-reviewed article of this preprint also exists.

Submitted:

05 August 2024

Posted:

07 August 2024

You are already at the latest version

Alerts
Abstract
The article presents the issues related to the operation and modelling of the ship main propulsion steam boiler. Such objects are used widely in seagoing ships especially the very large crude oil carriers as a main propulsion turbine feed. The advantages of such along with simple construction thus great reliability make oil feed boilers an excellent source of power for chosen type of the large ships. It must be pointed out that a lot of research work was done in the previous years regarding automatic control of boiler automation but since then this technology was not in the focus of the researchers. In the future the fossil fuels will become less important than they are now, but the control techniques of boilers would eventually change due to different fuel parameters therefore, development of such is necessary. The article presents the results of research collected in real ship boilers during their operation and then, based on the results, a digital model of such an object was created. This model was implemented into Hardware-In-Loop which is the initial step for preparing the full model (including sensors etc.) of a steam heated boiler. Theoretical background along with chosen simulation and experimental results of control implemented into HIL were presented to validate assumptions...
Keywords: 
Subject: Engineering  -   Marine Engineering

1. Introduction and Scope of the Work

The aim of the work was to develop and verify a model of the dynamics of the fuel to air and to the steam pressure path for main propulsion boilers of the large tanker ships. The work is part of the work carried out at the Maritime University of Szczecin, aimed at developing models of the dynamics of the main propulsion steam boilers. Mathematical models of boiler dynamics were used to optimize boiler control [1,2], which was also carried out in this work based on the obtained identification results. Presented work incorporates the research material collected on the board of steam boiler powered turbine ship. Presented model was initially implemented into the hardware-in-loop unit which simulates operation of the propulsion boiler and allows to safely manipulate with controls without real boiler damage risk. In any steam generating process, the control system must meet the load demand such as a steam pressure or flow for a boiler or liquid temperature for a fired heater [9,10]. This is a critical task because continuous control of manifold pressure is closely tied to the overall stability of plant operation. Depending on the process, this load can fluctuate both predictably and unpredictably. A well-designed boiler control system can ensure that the power plant responds effectively to these demands [11,12,13] while minimizing emissions and overall costs, especially when mixed or simultaneous multiple fuel firing is considered [1]. These industrial systems are quite complex and after research it turned out that there is no dedicated simulation software covering specific issues dealing with ships boiler control. Having data obtained from actual operating ship boilers, the authors decided to create an example digital model that can be implemented in a hardware-in-the-loop (HIL) system and serve as a virtual control object.
Hardware-supported simulation experiments, i.e., those using HIL systems, are eagerly used to create and check complex real-time systems and were used initially to simulate flight conditions [2]. Such an approach is widely used for over 50 years [3] to verify the designed model or object control and display the status of the program verifying the operation of the system caused by the changes introduced in the system design. HIL systems enable simulation and programming of the entire process, including hardware support, in a dedicated software package. This allows for changes to be made during design and ensures that the physically configured and controlled facility controller will work properly.
The use of HIL-type simulation platforms at the design stage allows, among others:
  • Testing of the control system in conditions similar to real ones and a detailed and supervised analysis of the operation of the entire system.
  • Searching for errors related to the variety of cooperating subassemblies and components, e.g., sensors or communication systems.
  • Shortening the project implementation time and, consequently, minimizing costs.
Boilers control model includes an equations derived from the physical model, a controller and feedback loop elements that depend on the surrounding environment. Because the physical model operates close to the operating point, proposed one does not specify correct operation for all possible operating conditions, and operation is affected mainly by the system complexity, uncertainty due to measurement errors, and uncertainty that is difficult to determine due to external environmental influences. Therefore, the ideal linear model differs from the theoretical model described in the continuous domain, which introduces additional uncertainties. A common problem when checking real objects is that it is not possible to reproduce all the operating conditions of the model. These control mechanisms occur when the physical device or a system is operating, and the resulting instabilities in the linearity of the model can lead to unpredictable behaviour. Therefore, it is important to carefully design the control system and algorithms taking into account the specific model most suitable for handling operation and failure states. The result is the prediction of stimulus-response pairs, which includes a description of their stability under specific conditions, response to initial conditions, step changes and other properties related to control theory [4].
Because of aforementioned authors find the Matlab/Simulink supported HIL [5,6] especially predestined to design and simulate of the ships boilers control but it must be pointed out that presented one does not fully represent all properties of the real steam boiler of certain type so in order to obtain results of different control goals it must be enriched of specific features based on data collected from real object.

2. The Description of the Combustion Process in the Ship’s Propulsion Boiler

In order to provide a working model of a ship’s propulsion boiler the physical processes first should be recognized and what is obvious the combustion process in the closed chamber of the boiler has a significant impact on the value of steam pressure [14,15]. It depends on the method of compensating disturbing forces by the air and fuel flow rate regulation system. Conducting an analysis of performance control requires both knowledge of the dynamics of the control object and a description of the forcing properties. In this type of analysis, the assessment of control quality is most often carried out based on equivalent forces determined for a given control system, i.e., forces reduced to the output of the object. This additionally requires determining the dynamics of the paths through which the interfering signals are transmitted. This chapter discusses issues related to the dynamics of the control object. Since determining the model of the object’s dynamics analytically is extremely difficult in the case of a boiler and practically unrealistic for our conditions, identification tests were used. In accordance with the above-mentioned publication, a linear, stationary model of the facility with lumped parameters was assumed. The analysis of the boiler efficiency system concerned its operation under the conditions of random disturbing excitations. For the signals considered, they are characterized by small amplitude values. Therefore, the assumption of a simplified linear model, valid for small deviations from nominal values, is correct in these cases. Due to the identical construction and identical technical parameters of most of the boilers operating in parallel in the ship’s boiler room, it was assumed that the dynamic properties of one of them would be identified.
The general structural diagram of the model consists of control inputs, measurement outputs and operators characterizing the relationships between them. According to simplifying assumptions, these operators are stationary and linear, so they can be represented by the operator transfer function G(s). The adoption of the operator transfer function as a model of a stationary dynamic system was beneficial due to:
  • possibility of frequency analysis,
  • ease of creating models with complex structures.
In the case of the boiler capacity control system, the following signals are distinguished in the input:
  • fuel pressure fed to the burners,
  • air pressure in the air duct,
  • angular speed of the blower,
and in the output, there is a superheated steam pressure.
Figure 1 Shows the block diagram of boiler, being subject of identification.
Where: k denotes fuel pressure fed to the burners,
n denotes air pressure in the air duct,
z denotes angular speed of the blower
Since it was impossible to determine the dynamic properties of the actuating devices (blower, air damper) for air flow control systems under ship conditions, the boiler model version shown in the Figure 2 was assumed.
It considered only one input signal (fuel and air) represented by the opening position of the fuel valves (fuel pressure) and one output signal steam pressure. The optimal amount of air was adjusted automatically and depended on the position of the fuel valves [16].
Determining the class of models for the control object came down to specifying the types of transfer functions with precision to the parameters. This task was relatively simple in the case of the analysed control system. Steam pressure as an output signal for the two described facility models will be kept constant only if the boiler output is balanced with the load demand. Changes in any of the parameters of the input control signals with constant steam demand will cause an energy imbalance, which will consequently lead to a decrease or increase in steam pressure. This line of reasoning allowed for the assumption that the object of regulation would have an integrating character. This validity was confirmed in [17] discussing the dynamics of inland boilers operating in power plants.

2.1. Determining the Identification Algorithm

When choosing the identification method, the following were considered:
  • statistical or probabilistic methods
  • classical methods based on frequency and step response.
The choice of one of them was mainly influenced by the limitations resulting from the specificity of the ship’s power plant.
Statistical methods that allow obtaining the necessary information based on the so-called passive experiment (observation of inputs and outputs of the object during normal operation) seemed to be the most advantageous from the point of view of their use on the ship. However, as preliminary analysis has shown, stochastic processes at the object’s input are narrowband random noise. The spectrum distribution is therefore inappropriate for assessing transmittance, as it practically allows finding only one point of the amplitude-phase characteristic.
The use of frequency identification methods could ensure satisfactory model accuracy. However, they had to be drop due to the need for long-term manual control of the boilers and the use of sinusoidal forcing signals (at the input of the actuating devices). Parallel operation of boilers requires stabilization of capacity distribution. During long-term operation with the control system disconnected, the boilers tend to take on each other’s loads. As a result, their operation is desynchronized, permissible load parameters are exceeded and burner interlocks are triggered. The introduction of sinusoidal excitations additionally accelerates this process. For ship safety reasons, this type of boiler operation is unacceptable and that is why the step method remained in the focus. This kind of test required disconnecting the boiler load control system. However, in this case, the operating time of the boilers in manual control was short. Taking into account the transmittance class of the facility model and the nature of the introduced forcing, it was possible to predict that the experiment would be successful, provided that the necessary precautions were taken (increased supervision and strict control of the power plant parameters). Before starting the research, it was determined, based on computer tests and the prepared piece of dedicated software, how long the measurement time should be so that the results obtained would not be burdened with too large error. Prepared software gave the ideal course of step response for the assumed model depending on the given parameters which are as follows:
  • T - inertia time constant
  • K1 - inertial element gain factor
  • K - integration gain factor
  • ti - step on the timeline
  • dl - measurement length in inertial time constants.
However, for a given time constant, the variable parameter was the measurement length. Then, using the identification procedure, i.e., from the generated points, the values were calculated:
  • Tcal - calculated time constant
  • K1cal - calculated proportional gain factor
  • Kcal - calculated integral gain factor
This method was repeated for three different T values. The obtained results, presented in the form of tables, show that the best results are obtained with a measurement duration of 16 time constants. The next step was to check the impact of a step on the time axis, i.e., the sampling interval or the number of measurement points within the time constant, on the measurement accuracy. In this case, the best results were obtained when the ratio of the time constant to the sampling step was approximately 5 (i.e., T/ti = 5). Moreover, it turned out that changing the value of this ratio does not cause significant changes in the obtained results. These results were obtained for the remaining data equal to 1.
Referring these theoretical studies to the real system, it follows that the measurement time should be approximately 20 inertia time constants. We can assume that the time constant of the tested object will be about 20 s. This means a measurement lasting about 400s, i.e., about 7 minutes. Tests carried out on a real object. The boiler was installed on the certain vessel, whose power plant was in operation, turned out that such a measurement cannot take more than 2 minutes due to the above-mentioned ship safety conditions. After this time, changes in steam parameters were so large that they triggered the protection system action. Such measurement conditions made it necessary to correct the obtained results. The used software showed that sufficient accuracy is achieved with a measurement time of approximately 6 time constants. This led to the possibility of accepting the thesis that the obtained results would be subject to a small error because the measurement charts taken with the help of the recorder were approximately 120 s long, i.e., with an expected time constant of 20 to 30 s, it gave a measurement length of 4 to 6 time constants. The length of the graph for analysis could be longer if the tests carried out on the ship were preceded by a computer analysis of the method and the length of the measurement was specified. In addition, the research carried out on the vessel was prepared for more complex analysis using other methods.

2.2. Conditions and Method of Identification

The identification was carried out under normal operating conditions of the tanker ship. In such a case, the boilers work in parallel on a common collector and it is not possible to separate them due to the total load of the power plant [18]. In order to determine the dynamic properties of one of them, identification measurements were performed as follows:
  • automatic control systems for PORT and STBD boilers have been disconnected,
  • in the ECR (Engine Control Room), step signals were manually entered from the control panels forcing the position of the fuel valves (at the input of one boiler)
  • during identification, the efficiency of the PORT and STBD boilers and the output signal of the steam pressure were recorded
  • additional parameters were recorded and observed, stabilized by separate control systems and which may also affect the transmittance parameters (fuel viscosity, superheated steam temperature).
After completing the measurement, the boiler load distribution was manually adjusted and then switched to automatic control, and after the power plant parameters had stabilized, the measurement was repeated.
To ensure comparable operating conditions of the power plant for individual measurement series, the ocean crossing or long awaiting for port entrance periods were selected for the tests.
To better illustrate the properties of dynamic tests were made for various loading conditions and weather conditions. Individual parameters were recorded in engine control room using the data recorder. When measuring steam pressure, the recorder’s measurement range was from zero to maximum pressure, so readings on a 150 mm wide tape would not be very accurate. Therefore, the constant component was cut by applying a “negative” voltage signal corresponding to a pressure value of 58.3 kg/cm2 to the input of the recorder. This allowed us to increase the accuracy of the reading in the pressure range we were interested in.

2.3. Parameter’s Identification

The identification model diagram is shown in Figure 3, and Table 1 provides information on the operating conditions of the boilers during the measurements.
The input signal in the form of a step change in the opening or closing of the fuel valves of the STBD boiler was controlled manually from the Engine Control Room (ECR). The amplitude of the input step signal was determined by the difference in fuel pressure before and after forcing. The air pressure control systems in the air duct operating in the follow-up system mode generated the appropriate value of this pressure, ensuring a constant value of the excess air coefficient during measurements. Obtaining the step characteristics consisted in recording changes in pressure values. Figures 19 to 31 show the responses of the control object to step excitation for the fuel and air to the steam pressure path.
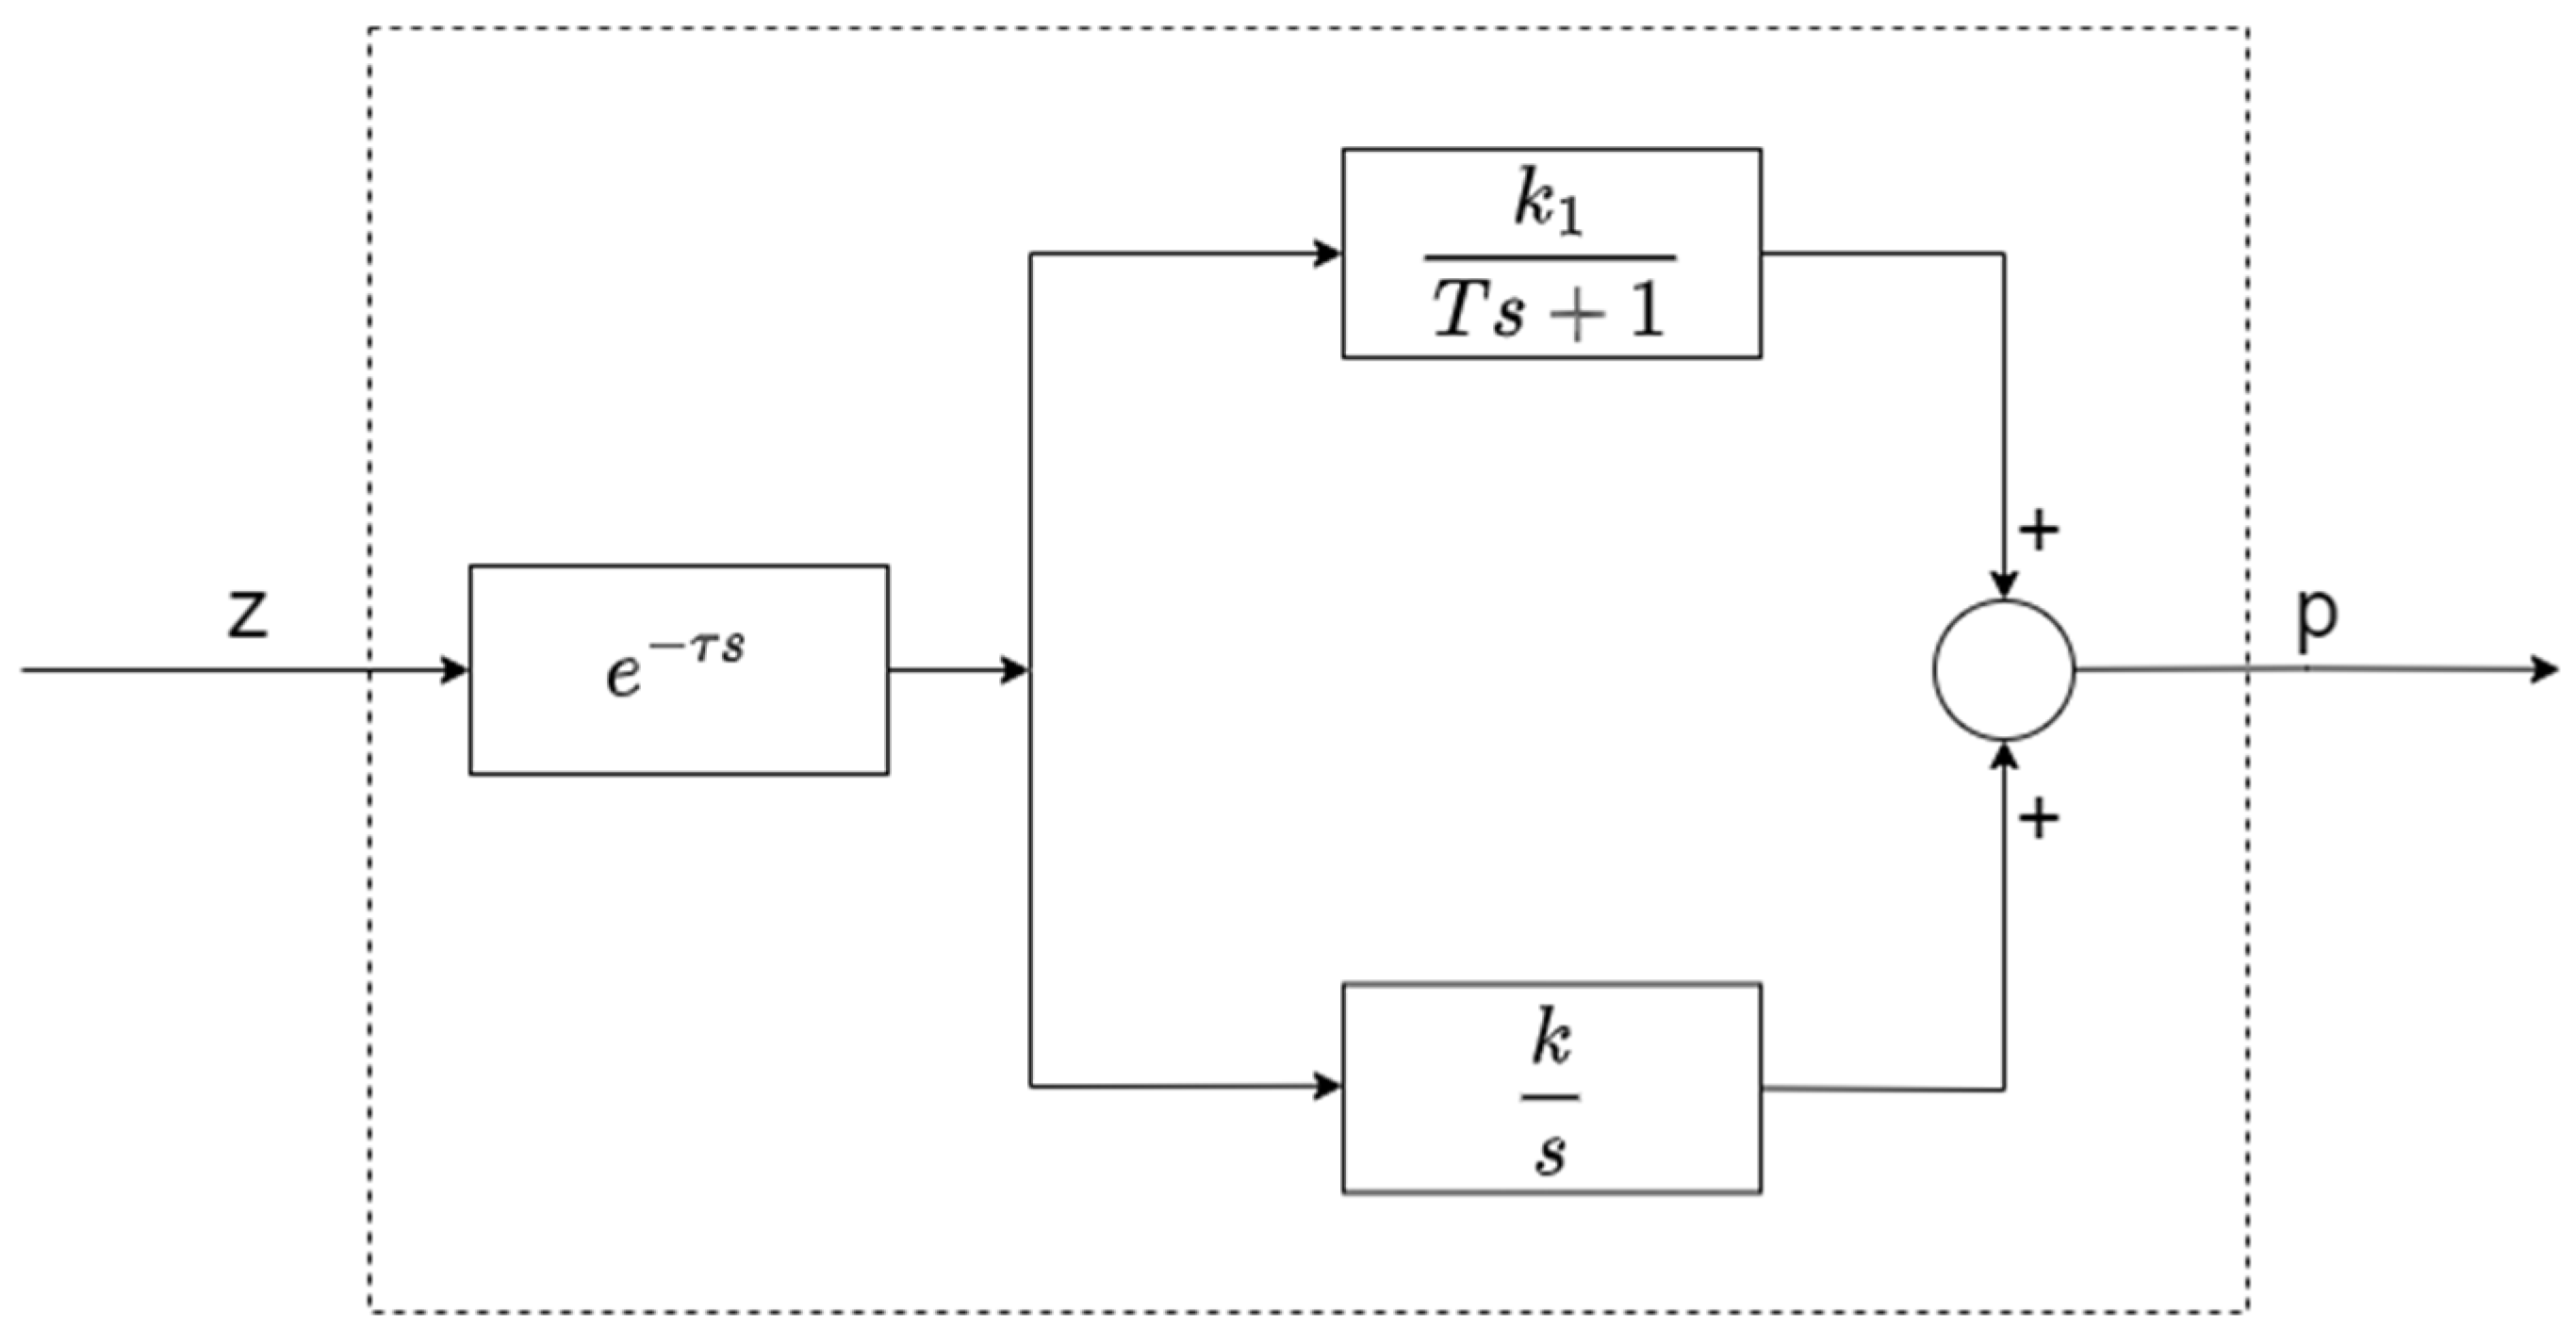
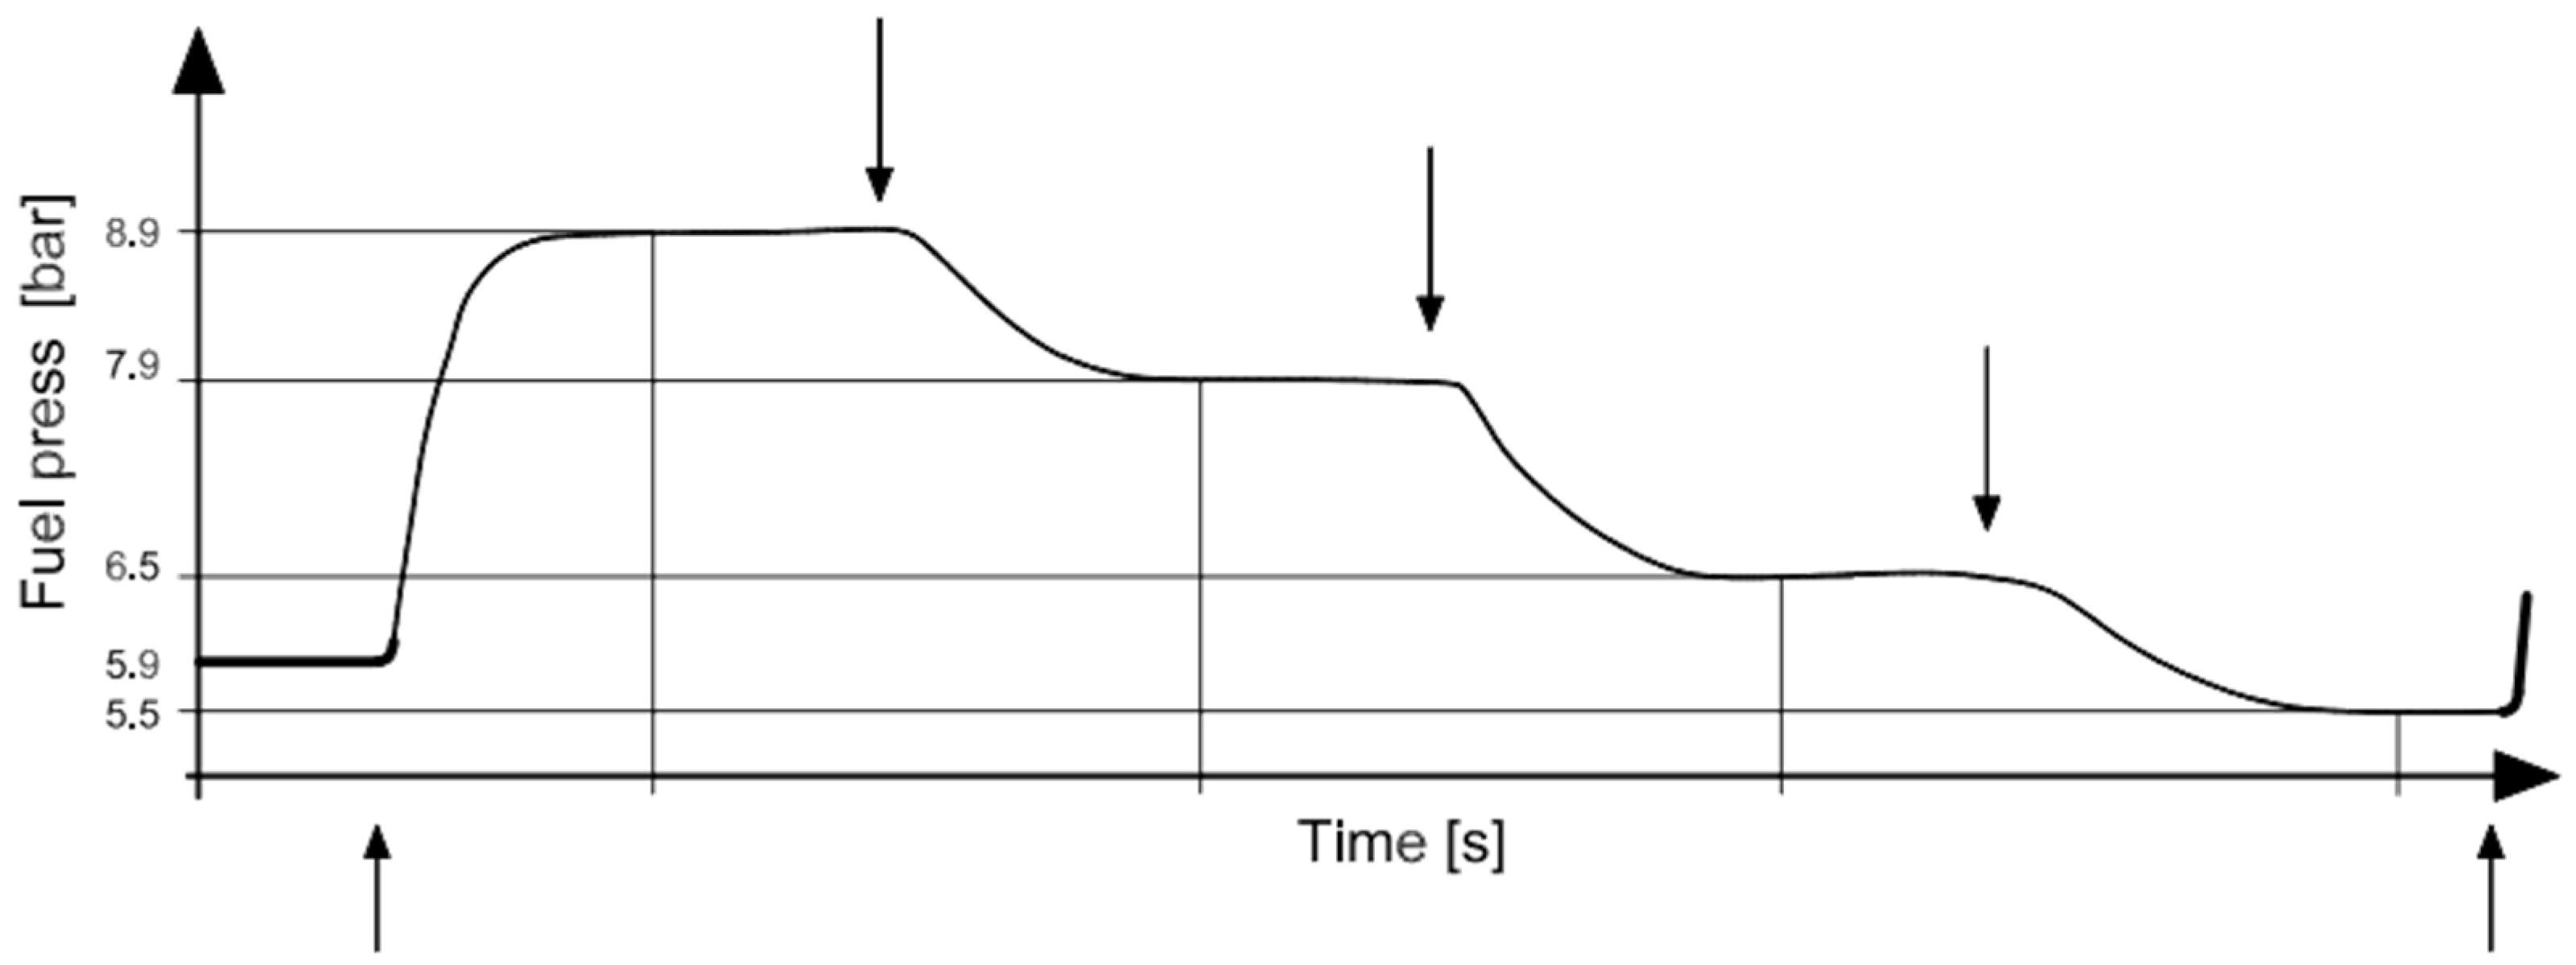
The analysis of the step characteristics obtained because of identification confirmed the initial assumptions about the inertial-integral nature of the transmittance of the object adopted in section 2., but with a series connection to the delay element as the first (Figure 3). This delay results from the operation of the fuel valve setting system. The course of fuel pressure changes behind the fuel valve is shown in Figure 4.
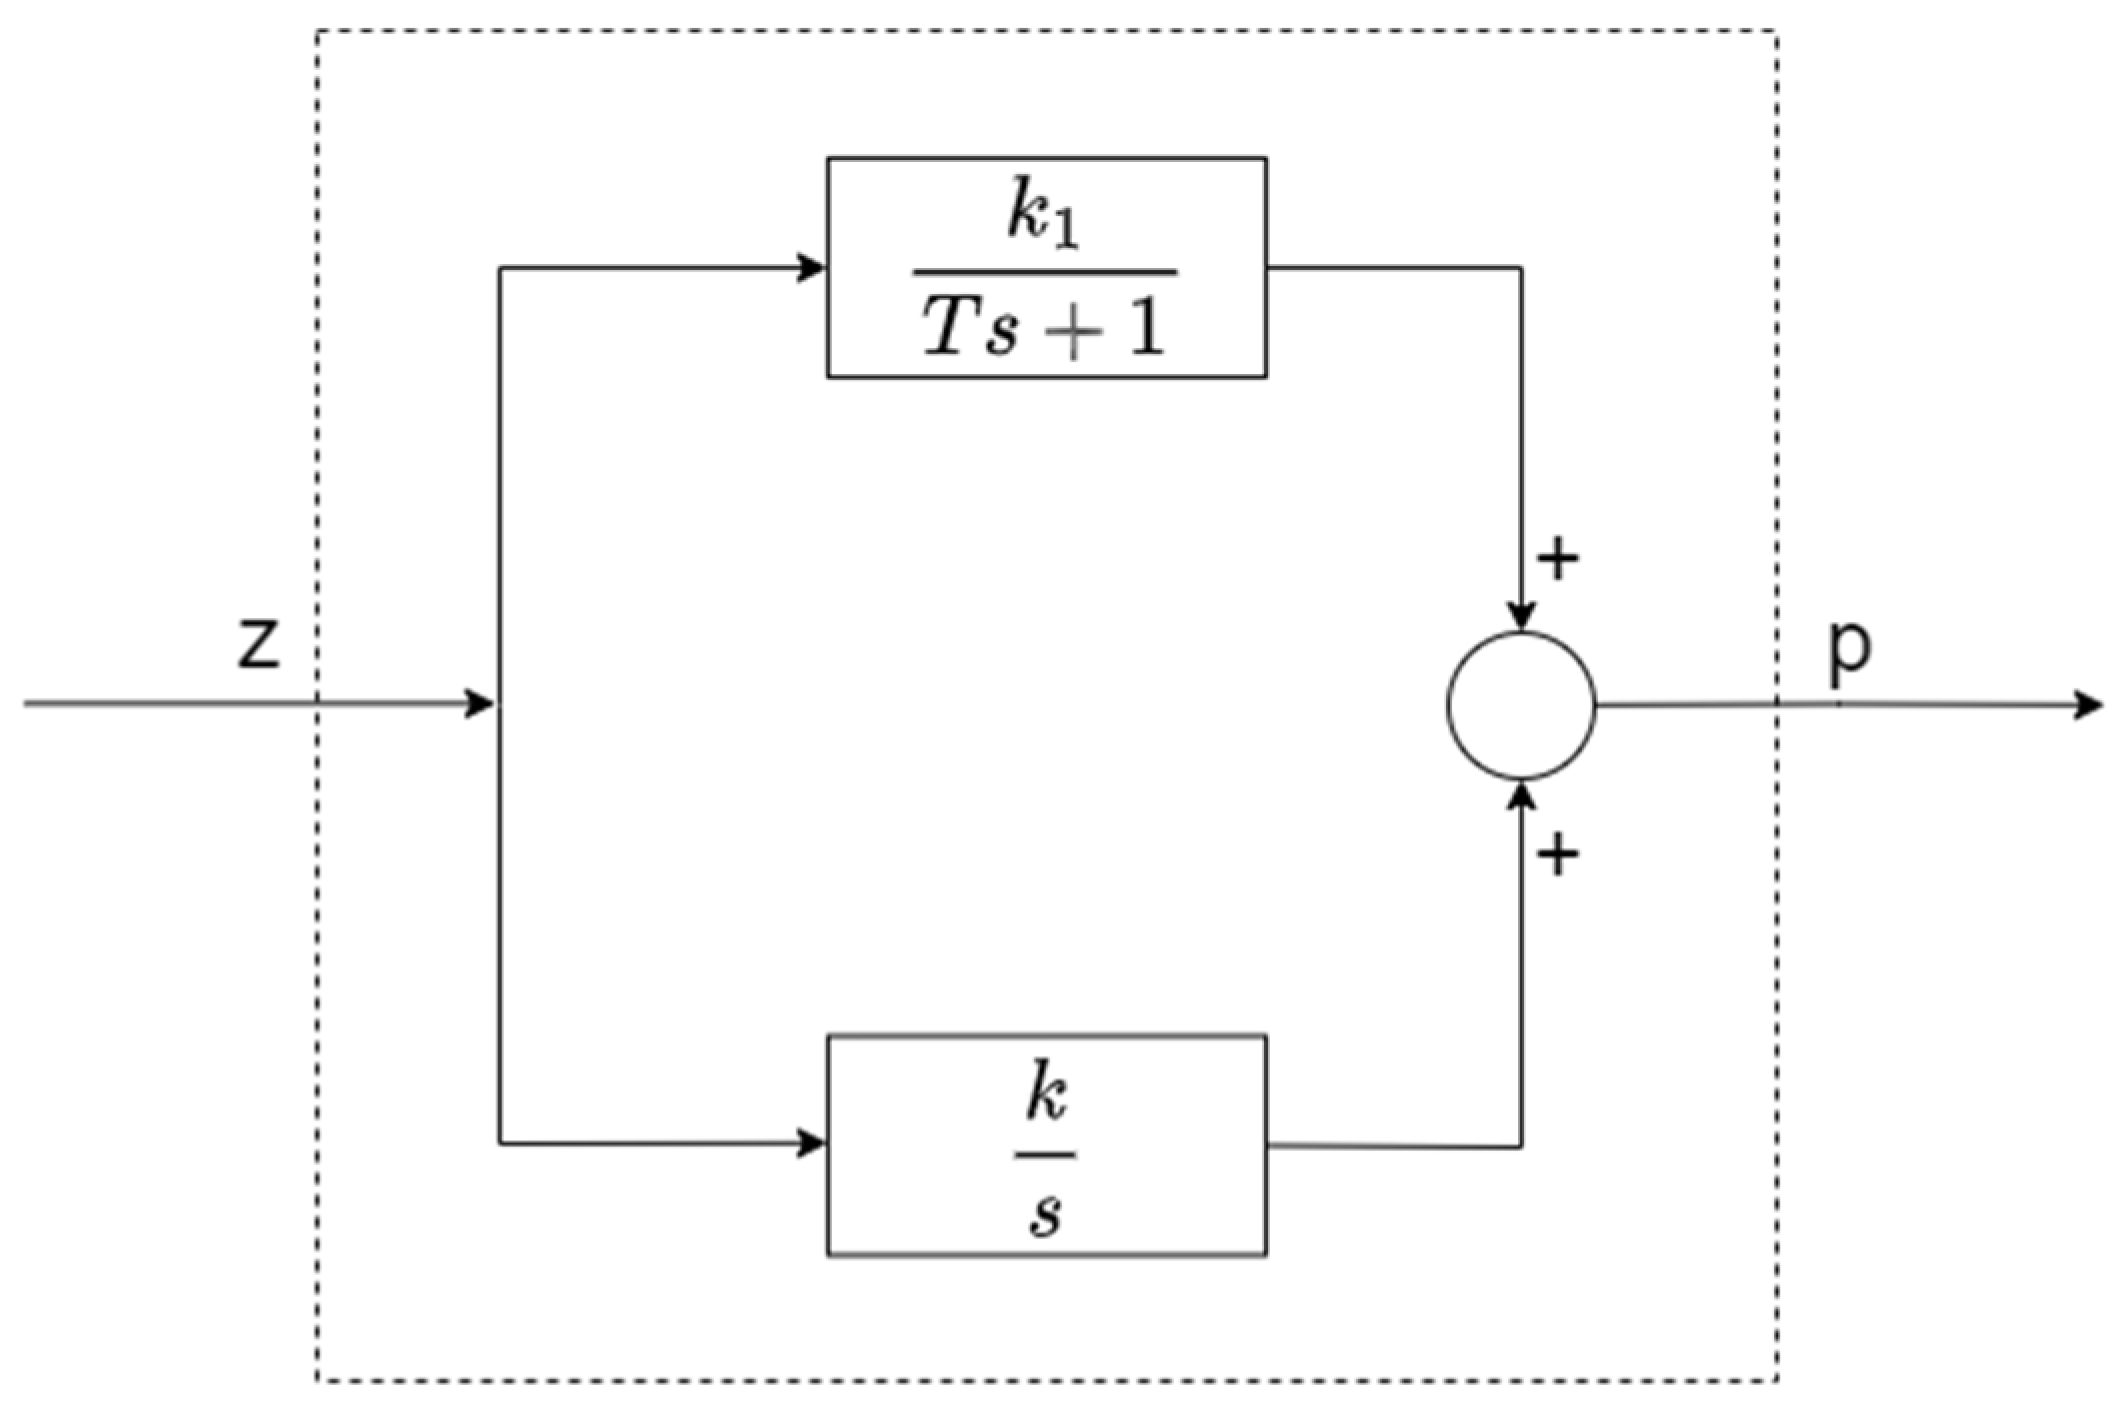
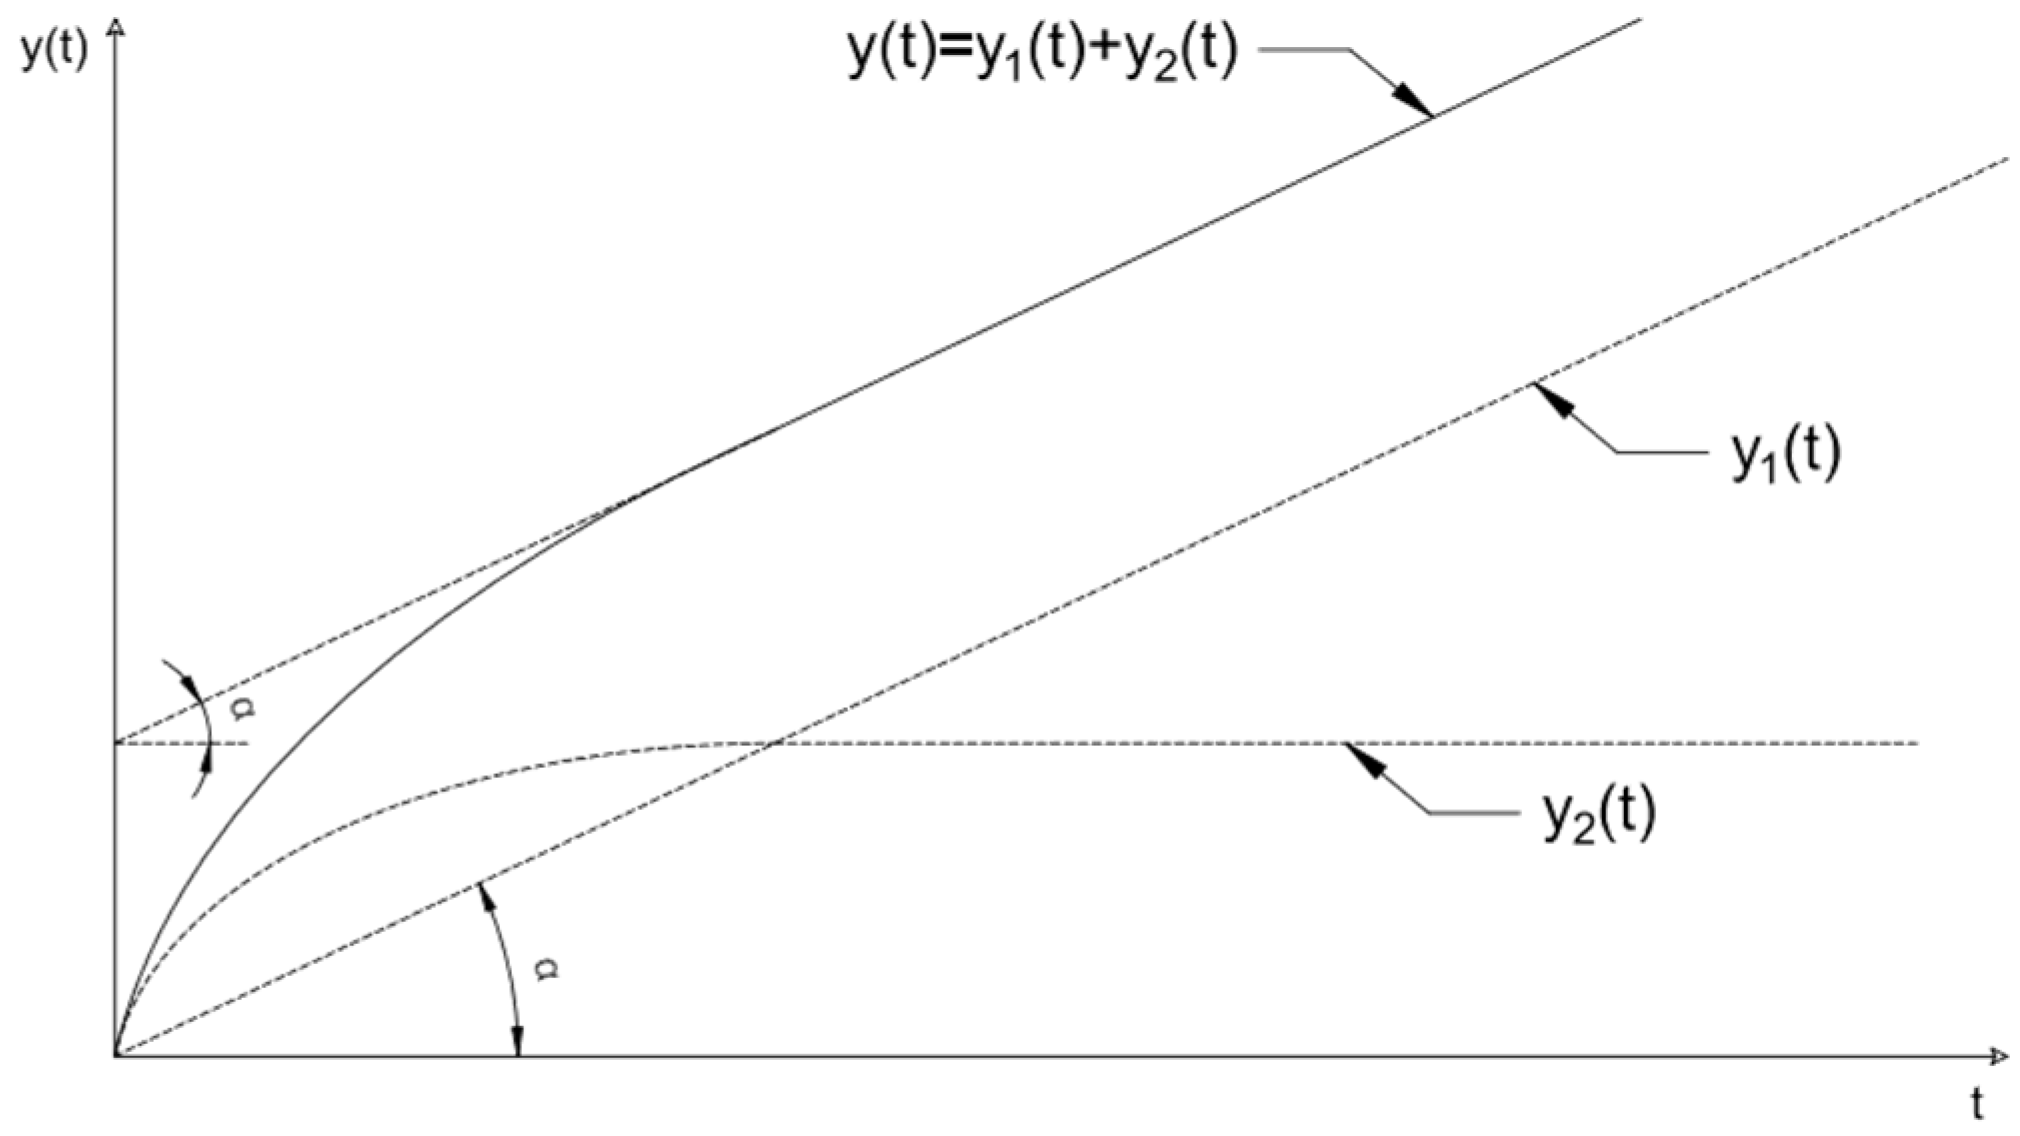
which clearly shows the inertial nature of the fuel pressure change course. This inertia caused a delay in the fuel + air -» steam pressure path of 6 s. This delay was taken into account in the analysis by cutting the delay time constant by analysing the graphs, taking the actual measurement time of 6 s as zero time. Therefore, the characteristics obtained in this way can be approximated by models containing a parallel connection of first-order inertial and integrating terms (Figure 5).
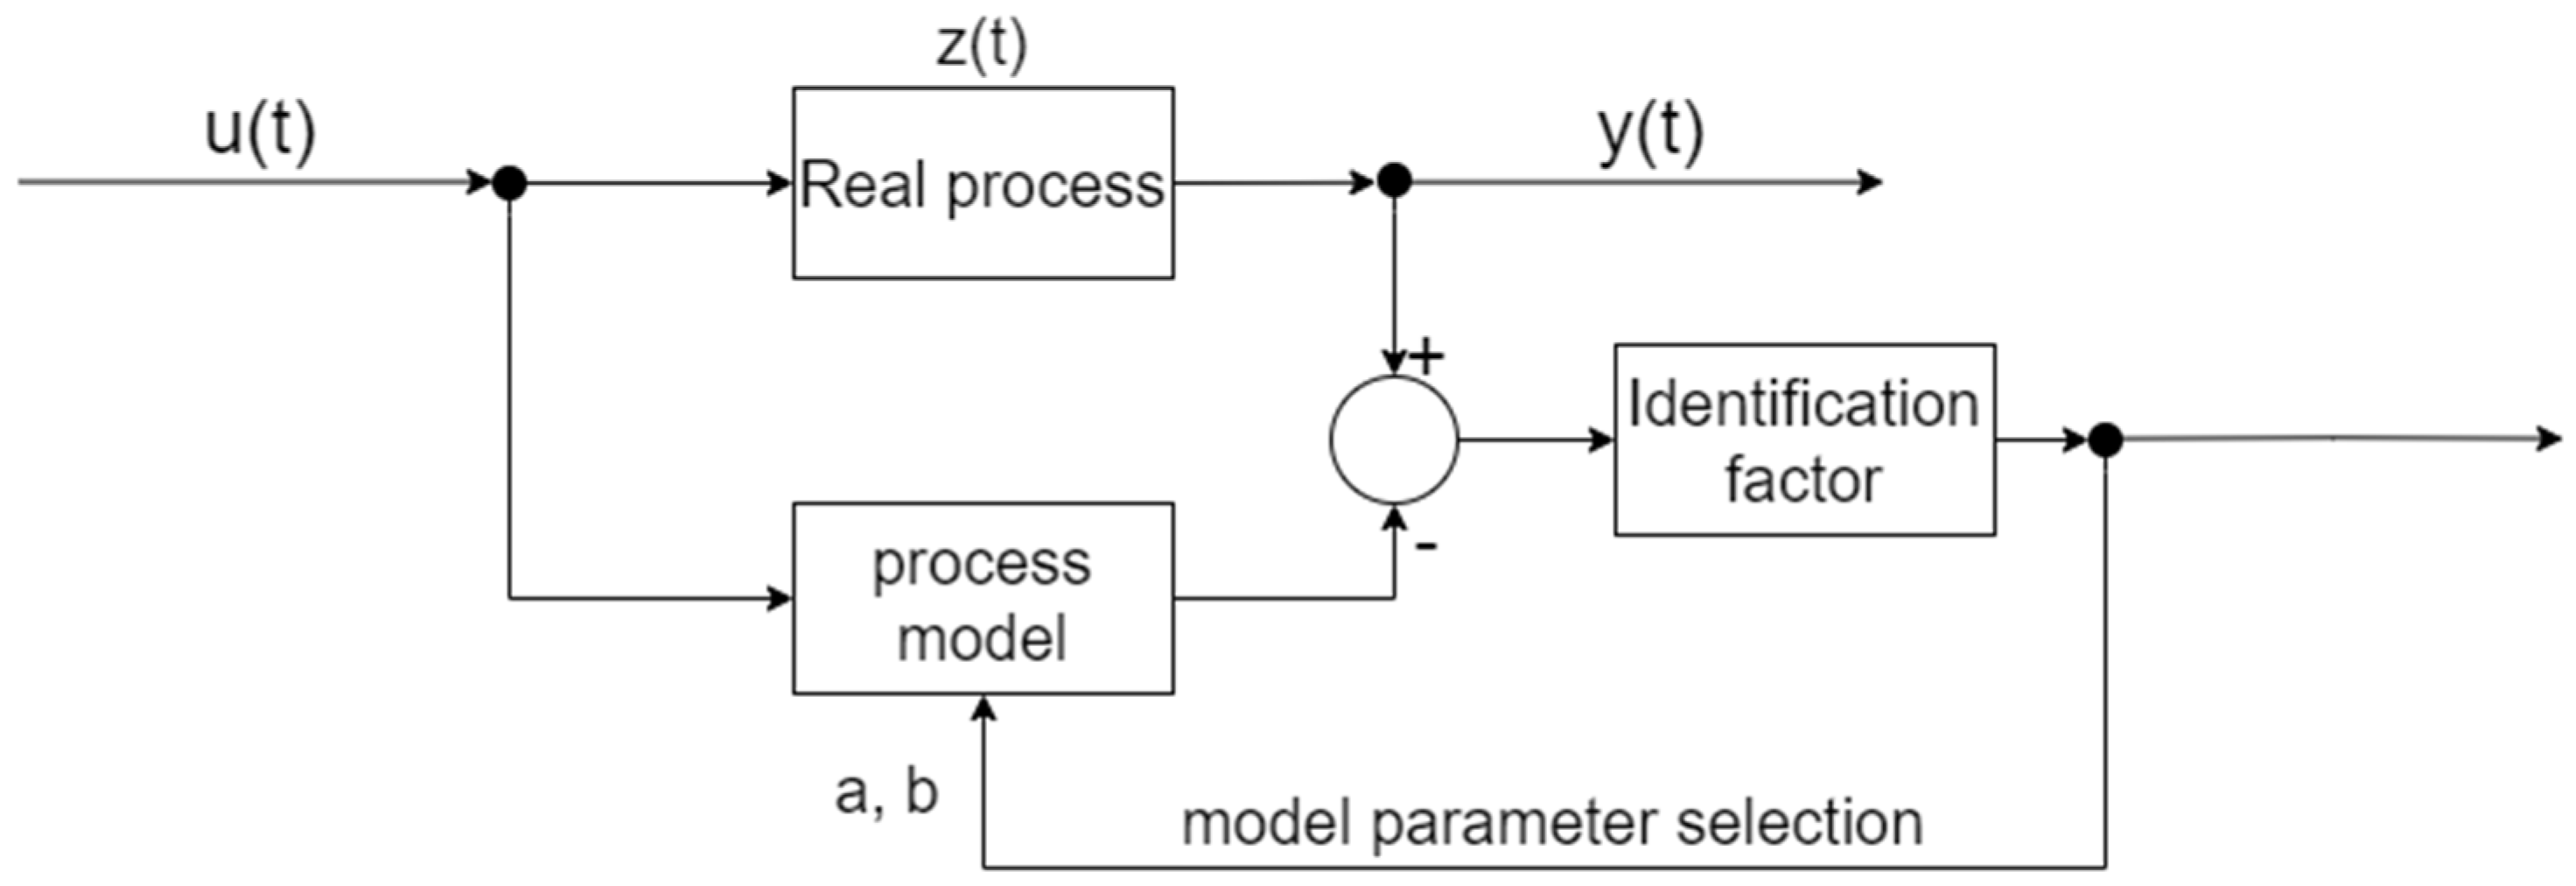
The parameters of the adopted model were determined in accordance with the identification scheme presented in Figure 6.
The model output signals were compared with the process signals obtained through measurements. A selected functional called the quality index was used in comparison. The model parameters were selected to obtain the extreme of the quality factor (minimum), i.e., the best approximation in terms of this index.
In this work, the approximation was performed digitally using the regression function method. In general, the regression function is one of the basic characteristics of the dependence of the stochastic output variable y on the random variable u (input). The theoretical regression function, also called the first type regression function, is defined as the expected value of the output variable:
y ( u ) = E y | u = α y p ( y , u ) d y α p ( y , u ) d x
where:
E is an expected value,
α denotes range of variable y,
py(y|u) - conditional probability distribution y.
The function has the property of minimal value because in the case of variance minimization it is the best approximation of the random variable y. Usually the relationship y(u), is unknown and having the measurement data, it is possible to approximate it in a certain functional basis. It is additionally assumed that y(u) is in a continuous domain thus it can be approximated in a polynomial basis. The estimator y(u) with the values of optimally selected parameters is called a regression function of the second order, due to the analogies to the function of the first order, which it approximates [19,20,21].
The method used in the article is an empirical regression function (of the second order) in digital approximation analysis. Based on the arrangement of the quantized points of the identification charts, it was hypothesized that the regression functions belonged to specific classes of functions y=y(u,b0,b1,...,bk) linear with respect to the parameters b0,b1,...,bk, and then the best ones were searched for. estimators of these parameters.
In the case of the fuel + air -» steam pressure path, the values of the following parameters were determined:
  • for the integrating term - integration gain k
  • for the inertial term - time constant T of inertia and k1 gain.
For both types of transfer functions, functional minimization was performed based on the least sum of squares principle. For transfer functions of the integrating type, a straight line with the equation was assumed as the class of regression function:
y = a x + b 0
Due to measurement errors, the actual pressure course differed from the assumed one which yields:
y = y + e n = a x + b 0 + e n
Where en denotes error.
Minimizing function (with an assumed quality factor) we get:
Q = n = 1 N e n 2 = n = 1 N y n b 0 a x n 2 = m i n
relative to the parameters a and b, the optimal coefficients of the linear regression function were obtained:
a = n = 1 N x n y n 1 N n = 1 N x n n = 1 N y n n = 1 N x n 2 1 N n = 1 N x n 2
b = n = 1 N y n a 1 N n = 1 N x n
In the case of the path fuel and air pressure for the integrating term (due to the differential input and output signals), the following form of transmittance was adopted:
G s = k s
Where k - the integration gain factor.
By approximating the real course with a linear regression function, the integration constant was determined from the following relationship:
k = a w
Where w - the forcing, a - the directional coefficient of the regression function.
In the case of the inertial element, in order to simplify calculations, the following class of regression functions was adopted:
y = a 1 x
The adoption of such a class of functions resulted from the transformation of the inertia (step response) time equation:
y t = k 1 ( 1 t T )
to the form:
1 y t k = a 1 t
Performing minimization of the Q function (in the sense of minimum variance):
Q = n = 1 N e n 2 = n = 1 N y n e a 1 t 2 = m i n
a 1 parameter was determined:
a 1 = N n = 1 N t n ln y n N n = 1 N t n n = 1 N l n y n n = 1 N t n 2 1 N n = 1 N t n 2
The time constant and gain of the inertial term were determined from the following relationships:
T = 1 a 1 k 1 = b w
whereby the values of a and b were calculated for the integral element.
Figure 7 shows the pressure approximation diagram with the assumed model, built from a parallel combination of an integral and a first-order inertial component.
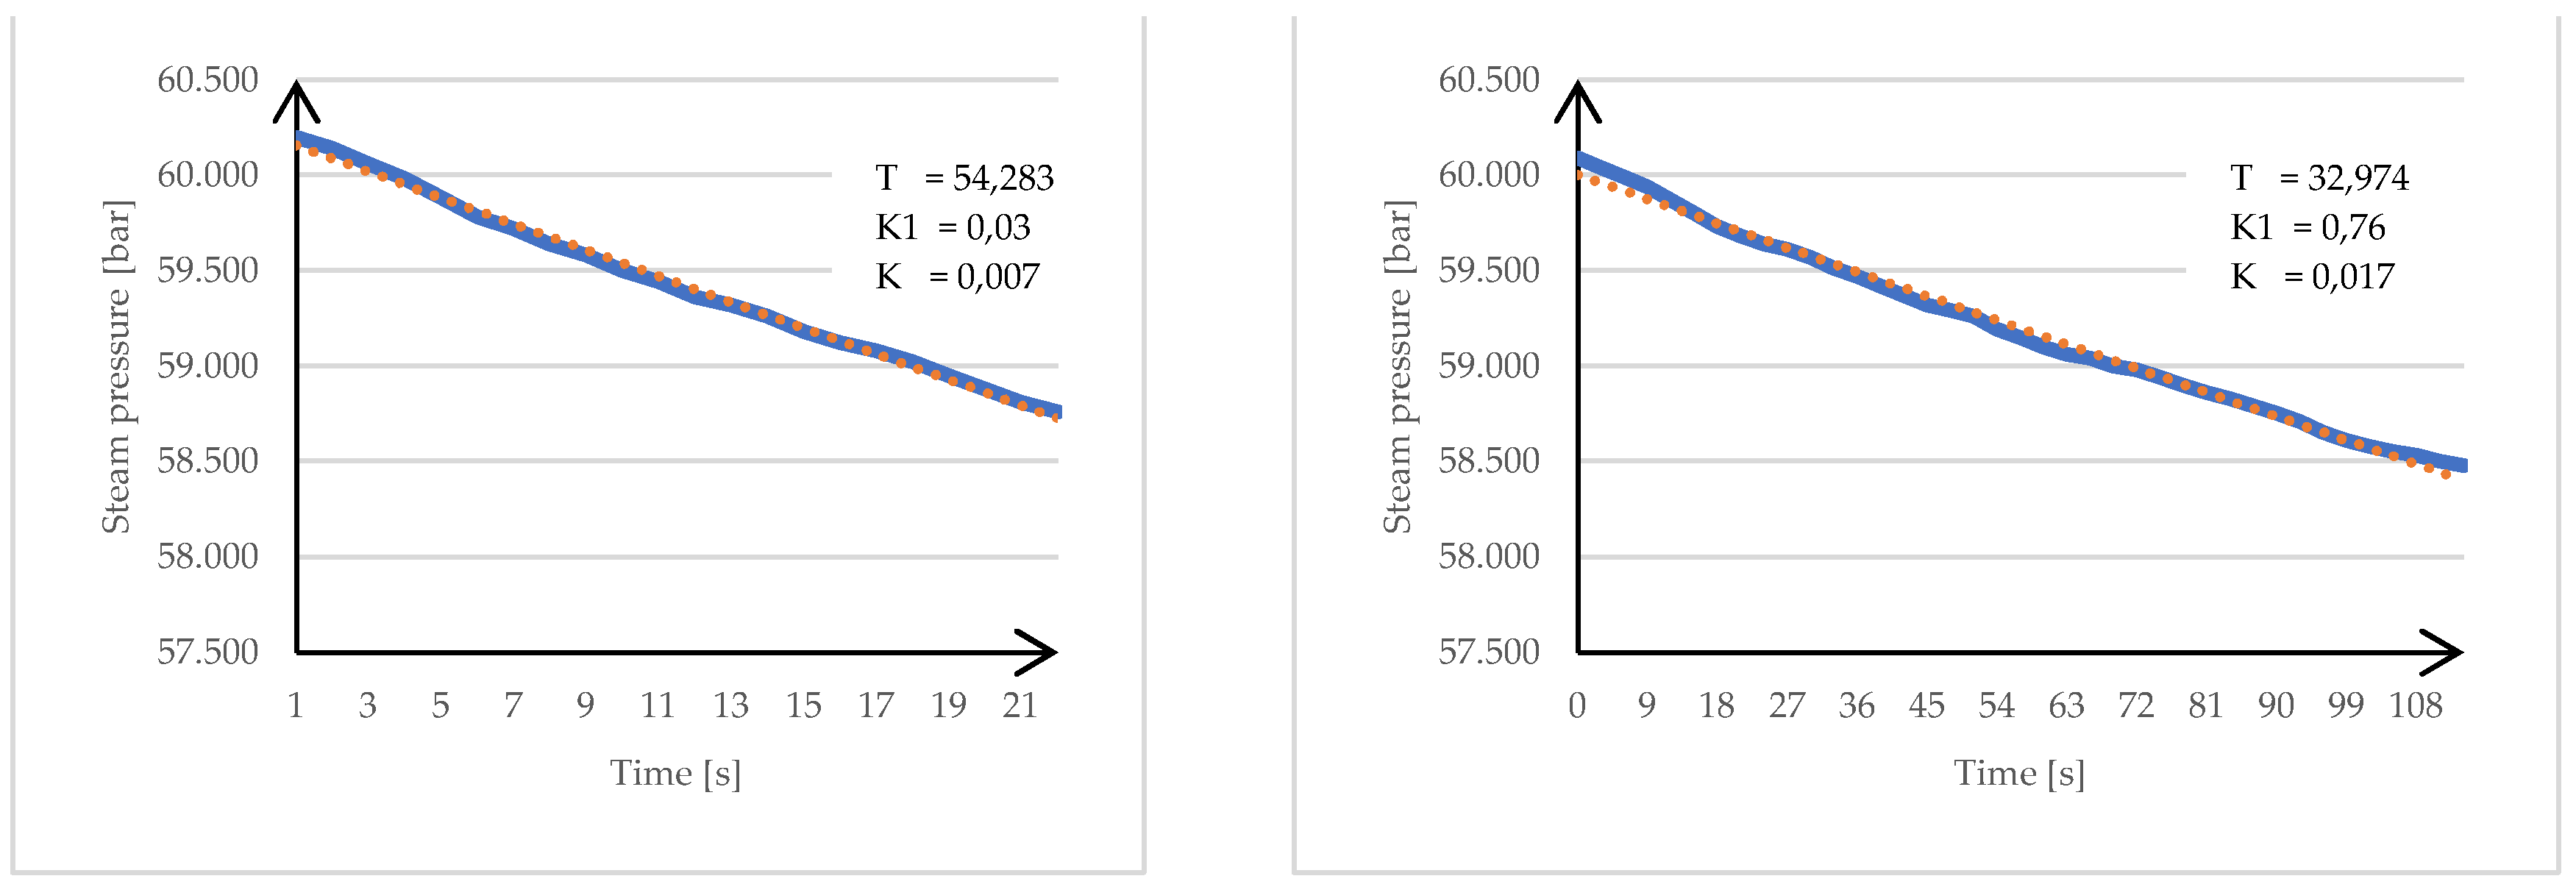
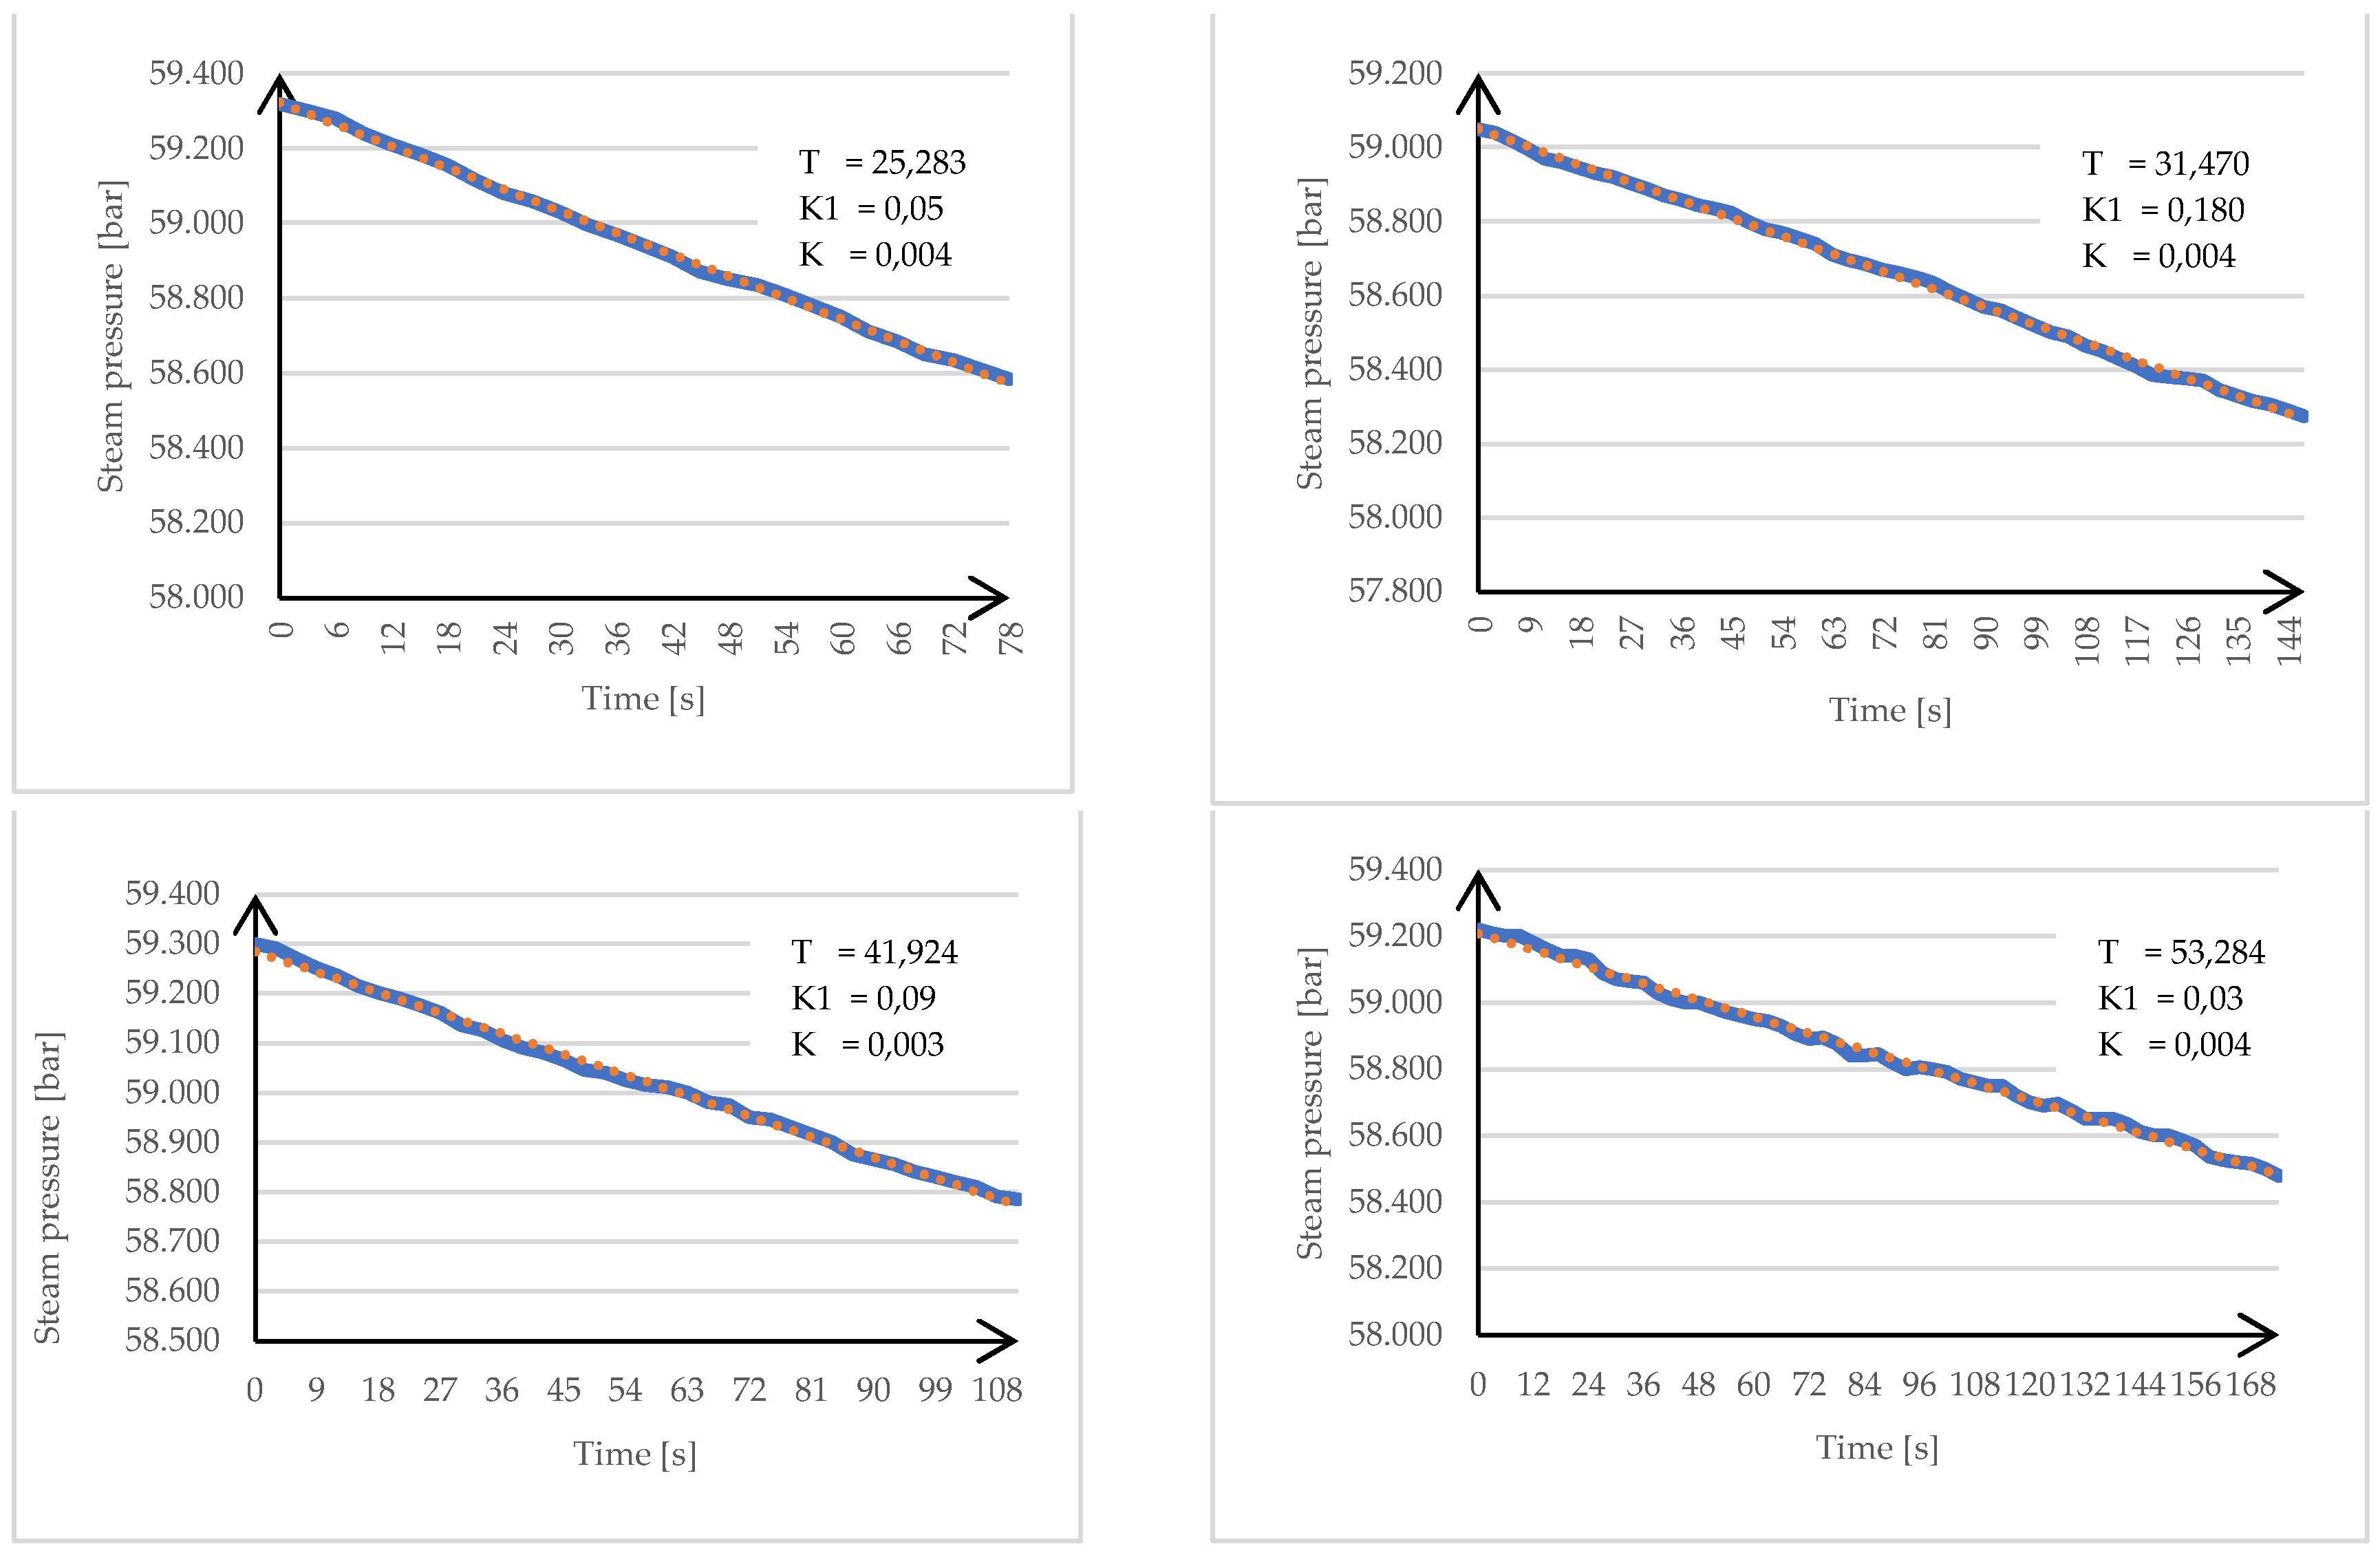
Determination of the transmittance parameters was carried out using the digital method by executing the prepared software. The program first determined the coefficients a and b of the linear regression function, approximating the integral waveform. Then the levelling the influence operation of the integrating term and calculating the transmittance parameters of the inertial term was carried out. Table 2 summarizes the results of computer calculations of transmittance parameters for each waveform. In addition, to get a better illustration of the actual and model waveforms a graphical representation of both the real plant and its model pressure waveforms was obtained. Graphical representation is shown in Figure 8 where the continuous line (blue) depicts the real waveform, and the dotted line (orange) indicates the model pressure waveform. As can be deduced from the obtained results, the assumptions confirm that the model is an accurate representation of the real system.
Identification of the fuel and air mixture to the steam path was carried out in three measurement series conducted at different sailing periods, for three states of the sea condition and shops load. The individual measurement series were conducted for the following operating conditions:
A series - propeller speed = 0 [rpm],load - average fuel pressure = 5.0 - 7.0 [at], on anchor.
B series - propeller speed = 40-55 [rpm],average fuel pressure = 11-12 [at],good sailing conditions.
C series - propeller speed = 65 [rpm],average fuel pressure = 13.4 [at].bad sailing conditions.
The values of the obtained results for each series do not differ much from each other. Some differences from the others are indicated by the C series, but from such a small number of charts accepted for analysis, this result cannot be taken for granted. It should also be pointed out that the tested system was a working application operating in the real ships power plant conditions. This induced some measurement errors caused by a bad sailing condition (bad weather and high sea), difficulties in establishing the value of steam pressure, the impossibility of maintaining a constant, unchanging load on the steam system, and therefore stable, continuous operation of boilers under manual control. As a result, some of the waveforms deviated significantly from the assumed ones and the rest of the actual graphs. This was especially the case when sailing in heavy weather conditions.

2.4. Summary

Preceding chapter discusses the problems of identifying the dynamic properties of the boiler as a superheated steam performance control object, in particular, the fuel and air steam pressure track, adopts and verifies the classes of models, discusses the factors affecting the choice of the test method, provides methods and digital data analysis, and presents the results of tests carried out on the ship.
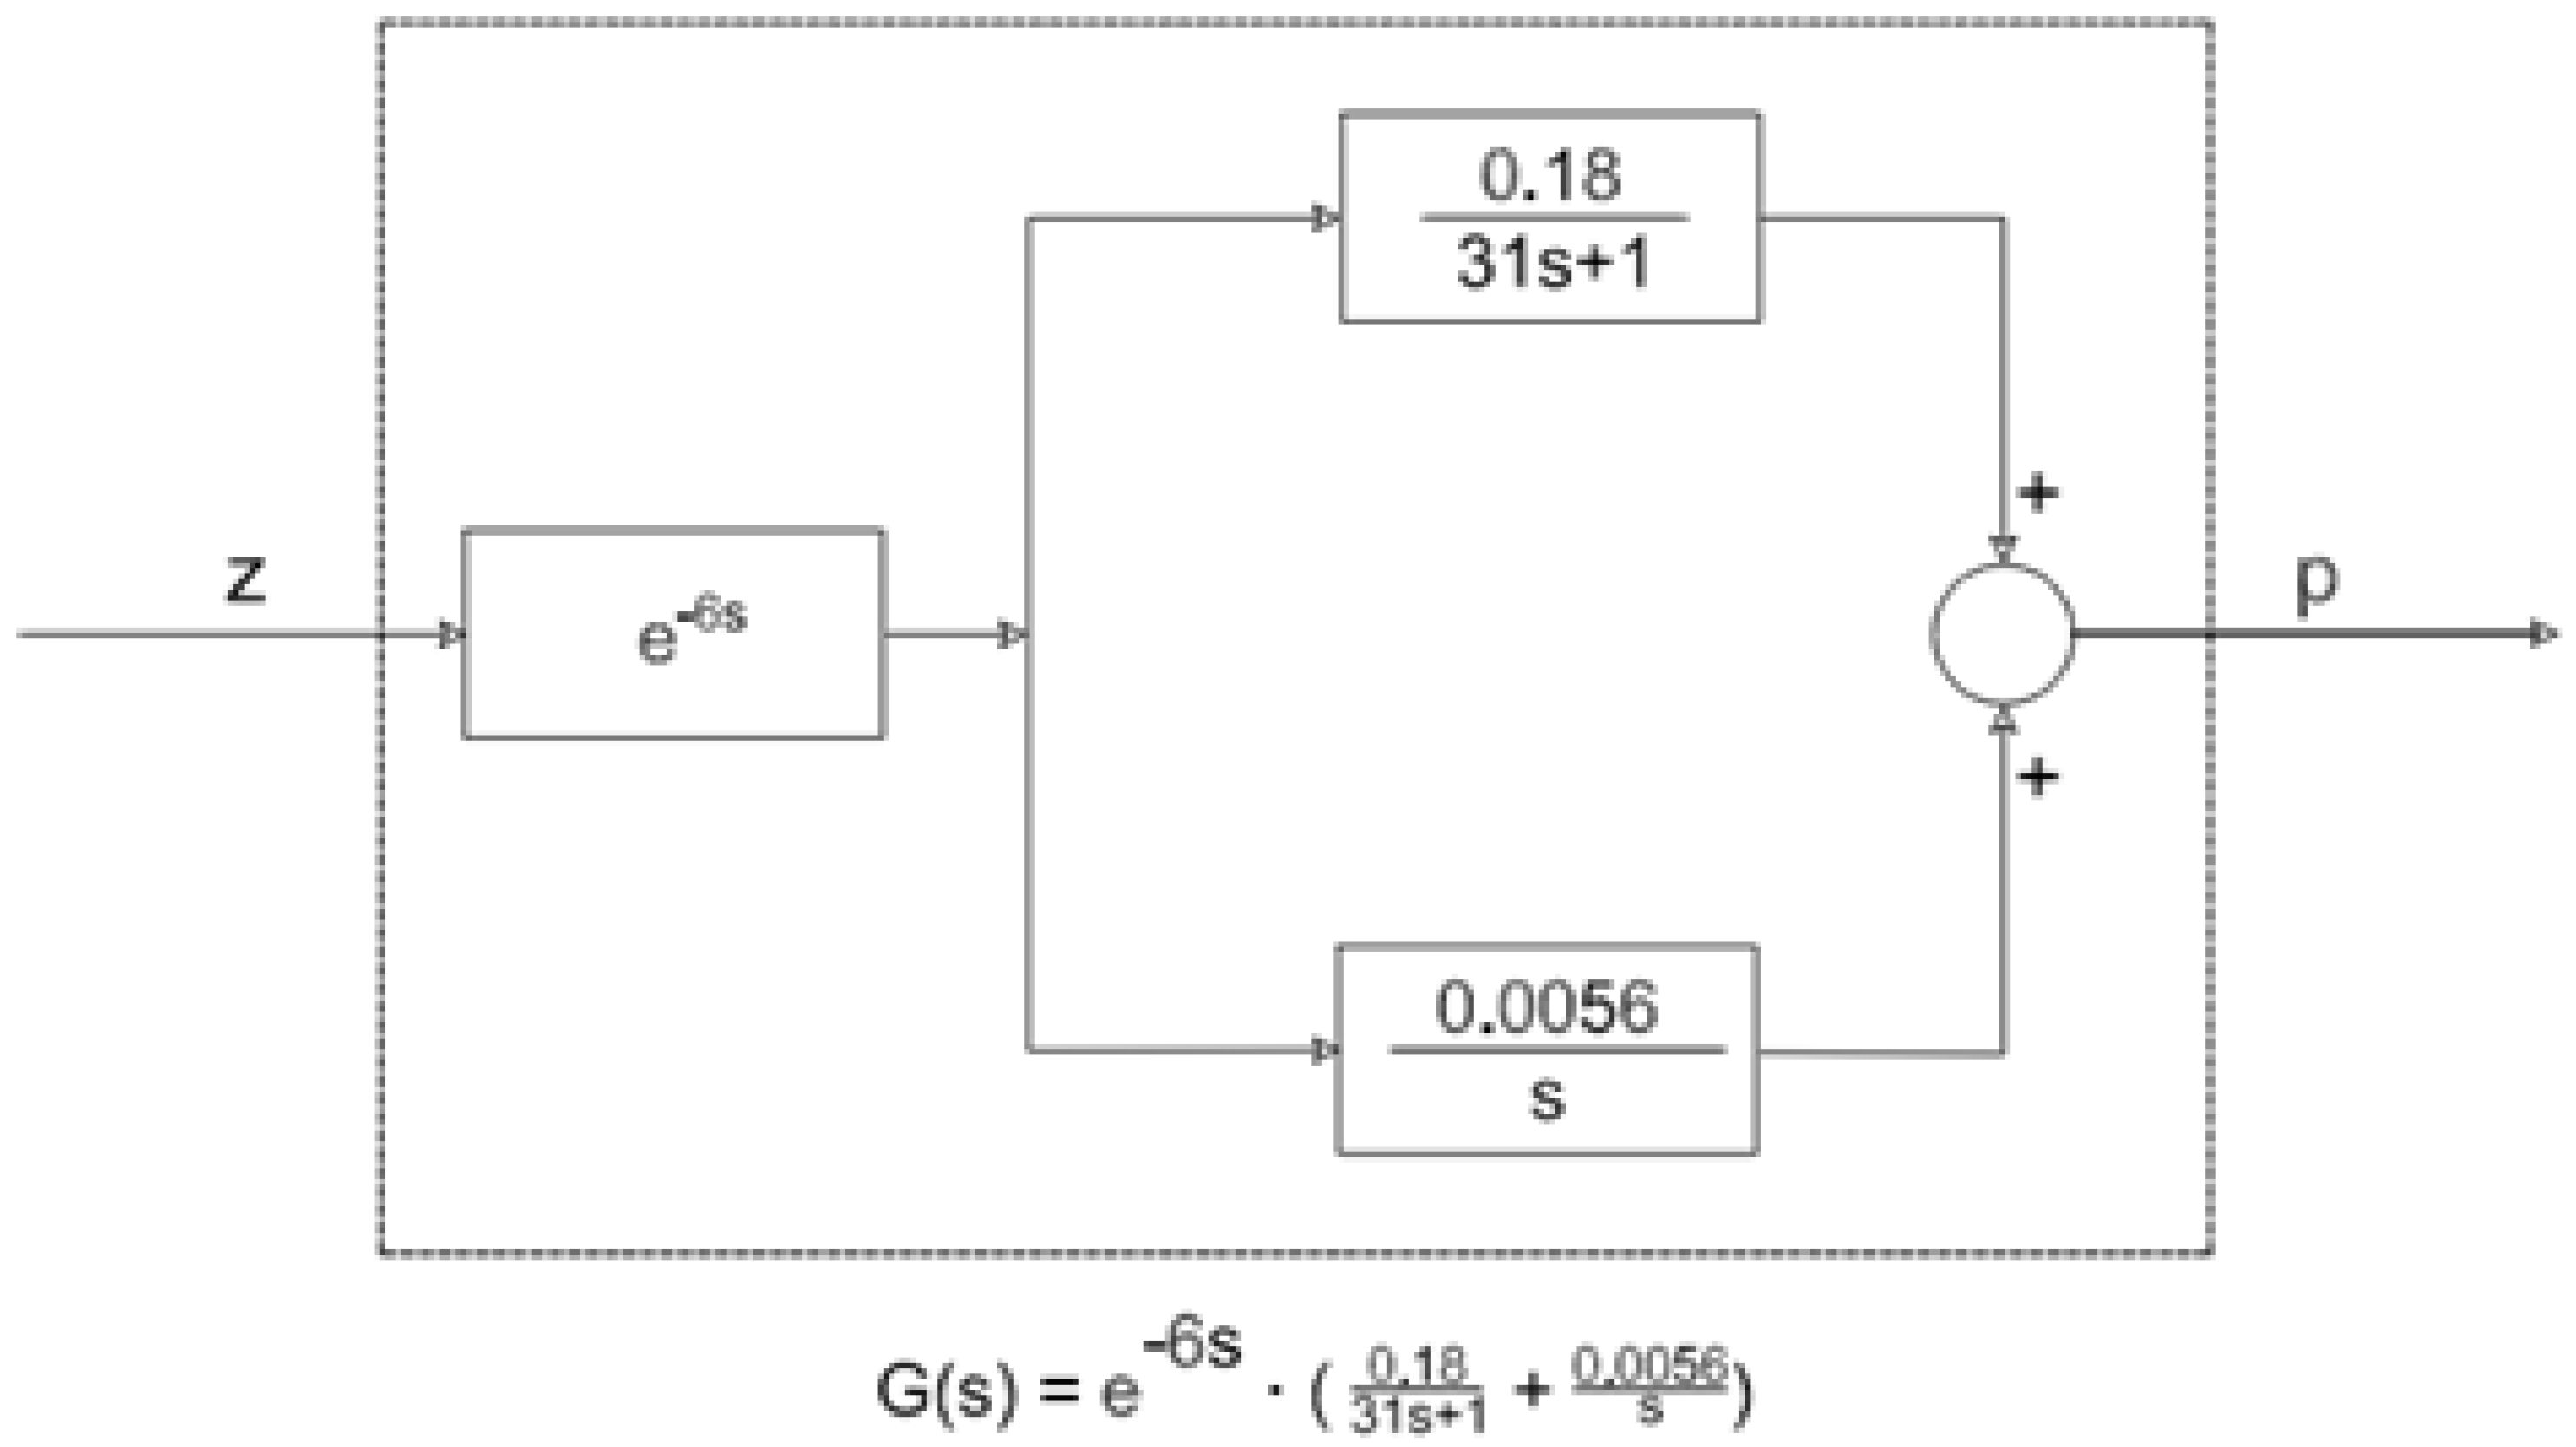
As the result of the object parameters identification the mathematical model characterizing the dynamics of the controlled object, with the given transmittance parameters for the fuel and air to a steam pressure track was established. For possible further analysis, the object model shown in Figure 9 can be used, with the given transmittance parameters along with their average values obtained in the digital analysis.
Due to the real operating conditions of the ship, the measurements could only be obtained in the mentioned three measurement series, and it was not possible to use all the waveforms for analysis. But by comparing the actual waveforms with the model estimates, the validity of the assumed model and the veracity of the obtained results can be compared.
The model and results are comparable to those which were obtained during the research works [17] conducted in the propulsion plant of the another operating vessel. It was necessary to take into account the design differences of the boilers installed on the two ships, as well as the time of operation of these ships up to the time of conducting the above research. Thus, the nature of the actual object and its model is virtually identical. The slight differences in the transmittance values may be precisely due to the design differences of the systems being compared (the boilers of the investigated ship are larger and have greater capacity), and to the time of the operation (by the time of the tests, the subjected ship was already 20 years old, while the comparable was only a few years old). The fact that the results of the studies conducted for two different vessels are similar confirms the validity of the models assumed in both cases.

3. Computer Simulation of the Identified Object and Optimization of the Control Structure of the Boiler Efficiency Control System

The block built within Simulink software is an exact representation of the identified path: fuel and air creating steam pressure. As it was presented it consists of three elements: a delay block, an integral term and an inertial term.
Described object in the simulation software is shown in Figure 10.
A step block was introduced to the input of the system, reflecting the change in the input signal (fuel pressure) which in fact was the case during the tests of the real system in the boiler room.
On the other hand, the output includes a block that is common for this software and allows visualization of trends in a steam pressure.
The control loop is not closed so the structure of the simulation allows to change the parameters of any block on an ongoing basis, as well as it allows to add blocks to an already given system. This can result in a comprehensive program that simulates the operation of the main propulsion boiler in a real time.

3.1. Optimization of the Structure of the Boiler Control System

In the following chapter, using the results of the identification study discussed previously and the results of the original research presented in [17], the optimal structures of the boiler performance control system for the quadratic control quality index are determined. The optimal structure for the adopted object model containing a phase-delay correction factor (integral correction) and the proposed suboptimal solution involving the use of a PI controller are given.
For both structures, model tests were carried out using the Matlab software. For the suboptimal structure, using Rosenbrock’s optimal method [22], the PI controller settings were selected according to the static criterion.

3.2. Determination of the Optimal Control of the Boiler Capacity Control System

Analysis of the operation of the boiler performance control system under stationary random forcing conditions showed a significant effect of sway on the nature of the control system’s operation thus on the quality of the control process. Observation of the time courses for the analysed fuel-air path, during operation of the boiler plant under conditions of strong vessel rolling, revealed a significant distortion of the signals. The appearance of additional harmonics with higher frequencies, which are significant for the control system, is an undesirable phenomenon in both technical and economic terms.
The following study attempts to determine the best control strategy for a given system, with an assumed control quality index. To determine the optimal control of the boiler efficiency control system, the mathematical model of the object specified in Chapter 2 was used. Such model considers the dynamic properties of the actuators of the air flow rate control system (carried out by a blower), and the operation of the systems that stabilize the excess air ratio. For the necessary simplification of the object after the application of Smith’s predictor [23], a linear object with the following operator transmittance was adopted:
G s = k s + k 1 T s + 1 = b s + c s s + a
whereby:
k = 0.0056 [at/s*at].
k1 = 0.18 [at/at].
T = 31 [s]
hence:
a = 0.32258[1/s]
b = 0.0114 [at/s*at]
c =0.00018 [at/s2*at].
The selection of the object’s state variables was made using the direct method [20].
For the general form of the transmittance:
G s = E s U s = b n 1 s n 1 + + b 1 s + b 0 s n + a n 1 s n 1 + + a 1 s + a 0
E(s) can be determined by the following relation:
E s = s 1 b n 1 U s a n 1 E s + + s 1 [ b 1 U s a 1 E s + s 1 b 0 U s a 0 E s ] }
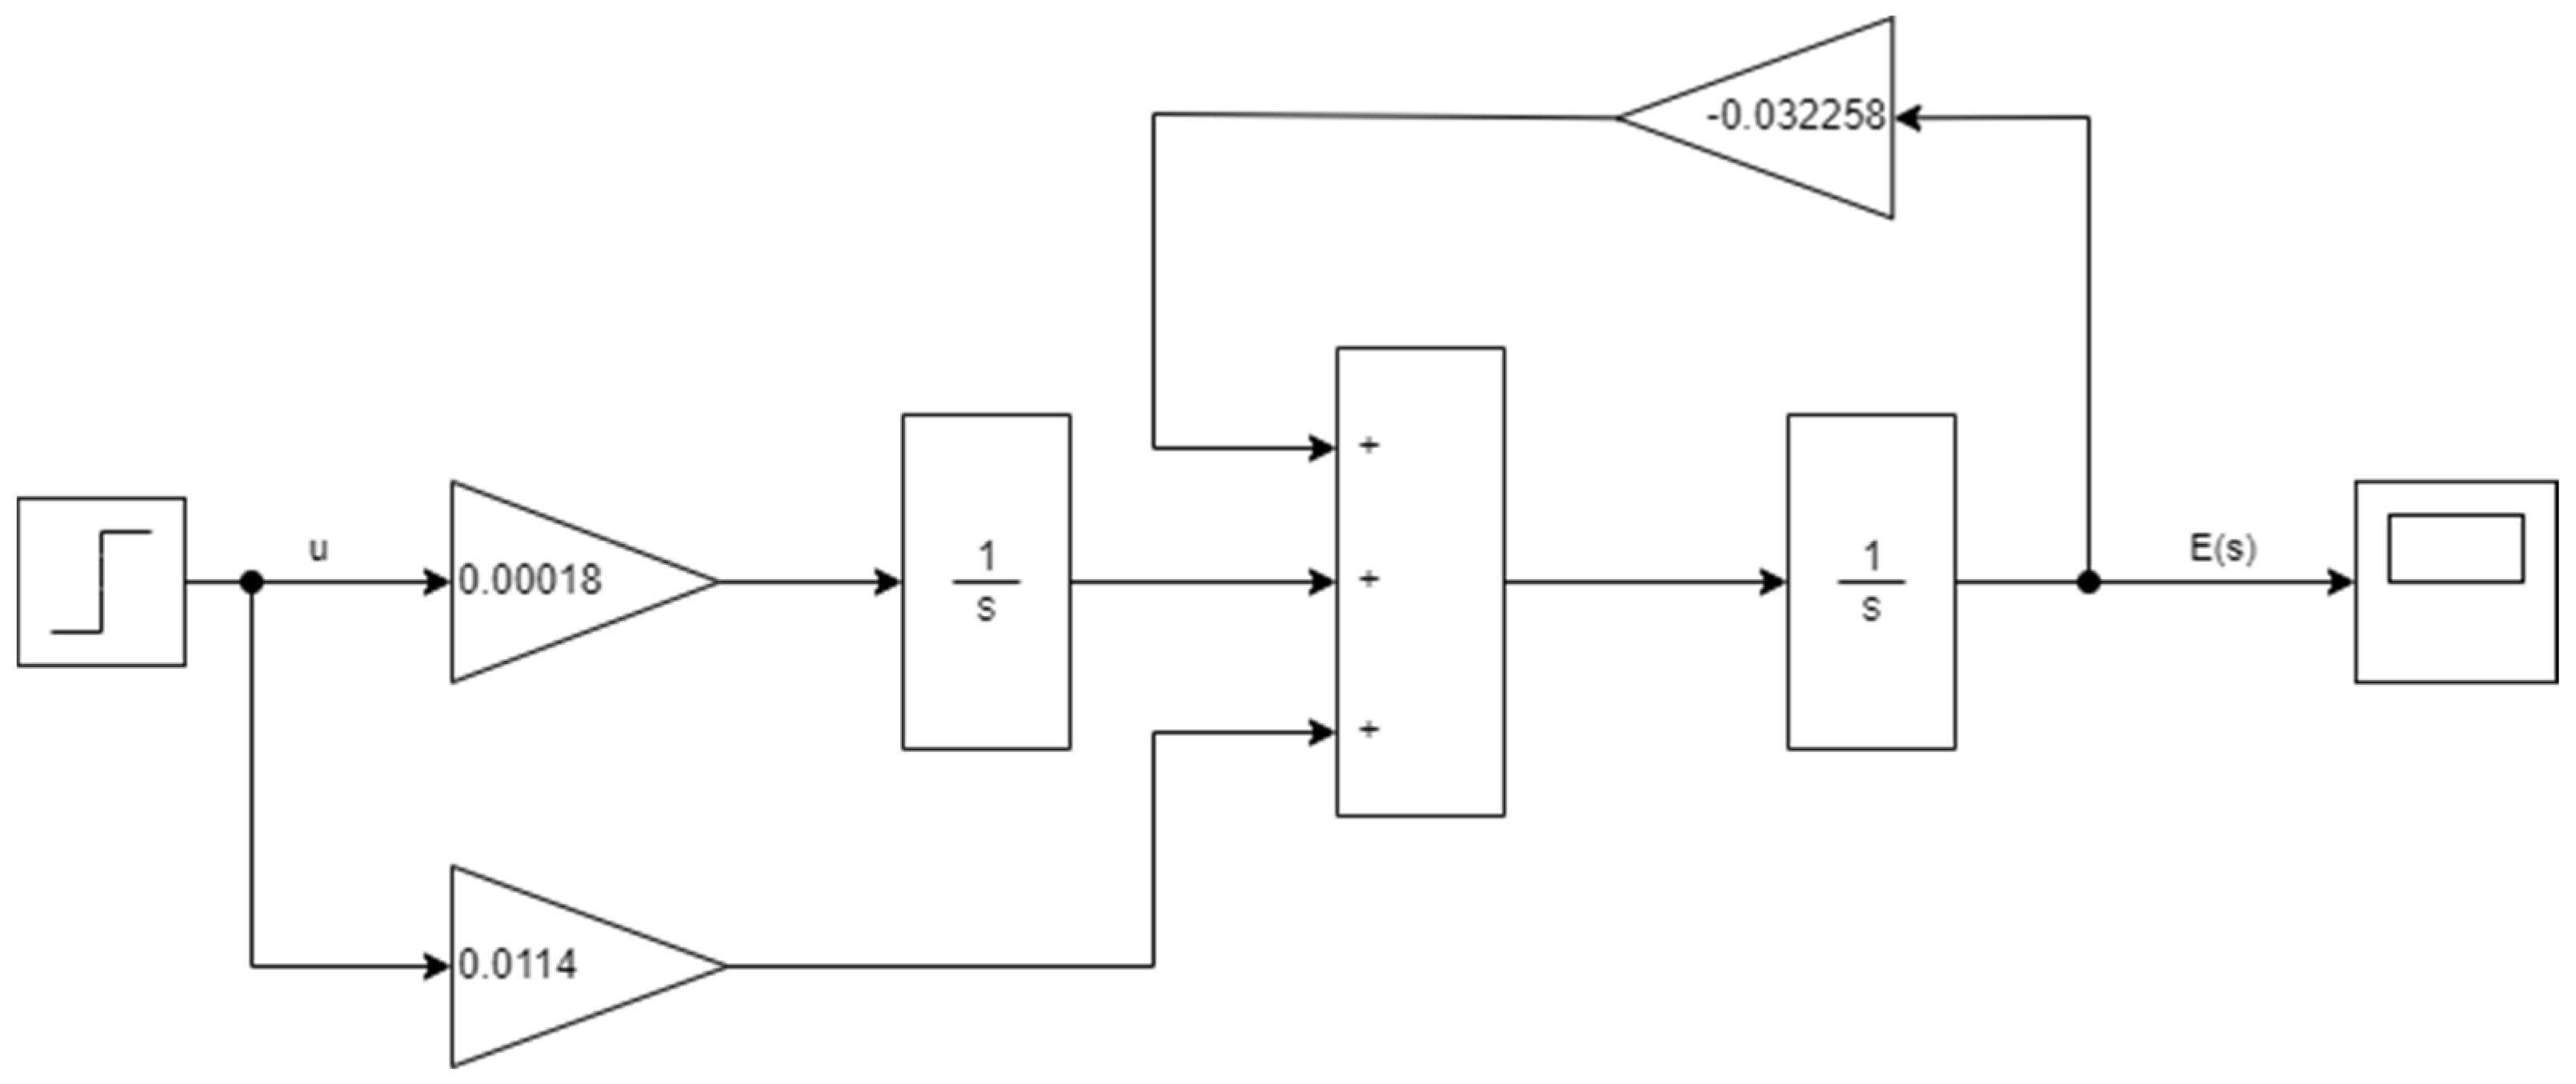
This results in a diagram of the object’s state variables, which for the model under consideration is shown in Figure 11.
Assuming as state variables x1, x2 (the outputs of the integrator) the object can be described by an equation of state in the following the form:
x _ t = A _   x ˙ _ t + B _   u ˙ _ t
whereby: x ˙ _ (t) - state vector with components x1(t), x2(t)
u ˙ _ (t) - control
A - object matrix of dimensions 2 x 2
B - control matrix of dimensions 2 x 1.
In this case, the matrices A and B are equal:
A _ = 0 0 1 a   ,   B _ = c b
For the optimization procedure, the quadratic quality index was chosen, the general form of which is shown in the formula:
Q = 1 2 0 t r x _ T t   P _   x _ t + u _ T t   R _   u _ t   d t
whereby: x _ t - n-dimensional state vector,
u _ t - m-dimensional control vector,
P - non-negatively specified matrix of dimensions n x m
R - positively specified matrix with dimensions m x m
In boiler optimization problems, the minimum variance of the output signal is taken as a quality factor [17]. Thus, the following form of Q was chosen:
Q = 0 e 2 t + m u 2 t d t
where m is a given positive number fulfilling the role of the weighting factor (control energy limitation). When the optimization problem is posed in this way, additional constraints are dictated by technical considerations of the system. This is because it is impossible in the process of steam pressure stabilization to get to a situation of exceeding the permissible values of overshoot amplitudes. A comparison of the quality indicators (20) and (21) shows that in this case:
P = 0 0 0 1 R = m
The task was to determine the control u ˙ _ t   that satisfies Equation (18), which minimizes the quality index Q (Equation (21)).
u ˙ _ t   : m i n Q u ( t )
As it was presented in [23,24] the optimal control u ˙ _ t   for control time tr = ∞ is given by the formula:
u ˙ _ t = R _ 1   B _ T   K _   x _
whereby a symmetric matrix K of dimensions 2 x 2 and time-independent elements is a solution of the Riccati matrix algebraic equation of the form:
K _   A _   +   A _ T   K _   +   K _   B _   R _ 1   B _ K     P _   =   O
For this case, the determination of the K _ matrix leads to a system of nonlinear algebraic equations, the solution of which requires numerical methods. Totally, further analysis was based on the introduction of serial correction.
This procedure is equivalent to modifying the structure of the control object. It allows you to determine the equations of the optimal controller in general form with much less computation.
The following equalizer form was adopted:
G k s = 1 s + c b
The introduction of the serial connection of the control object into the structure analysis with the equalizer resulted in an equivalent transmittance of the individual blocks.
G K O s = G K s G O s = 1 s + c b   b s + c s   ( s + a )
Since the relation (27) indicates the existence of the possibility of certain simplifications of the in the GK0(s) transmittance, it was necessary to check the resulting structure for controllability and observability. As a result of the decomposition, we obtain:
b s + c ( s + c b ) s   ( s + a ) L 1 s + c b + L 2 s + L 3 s + a
With L1 = 0, L2 = b a , L3 = b c a c b a
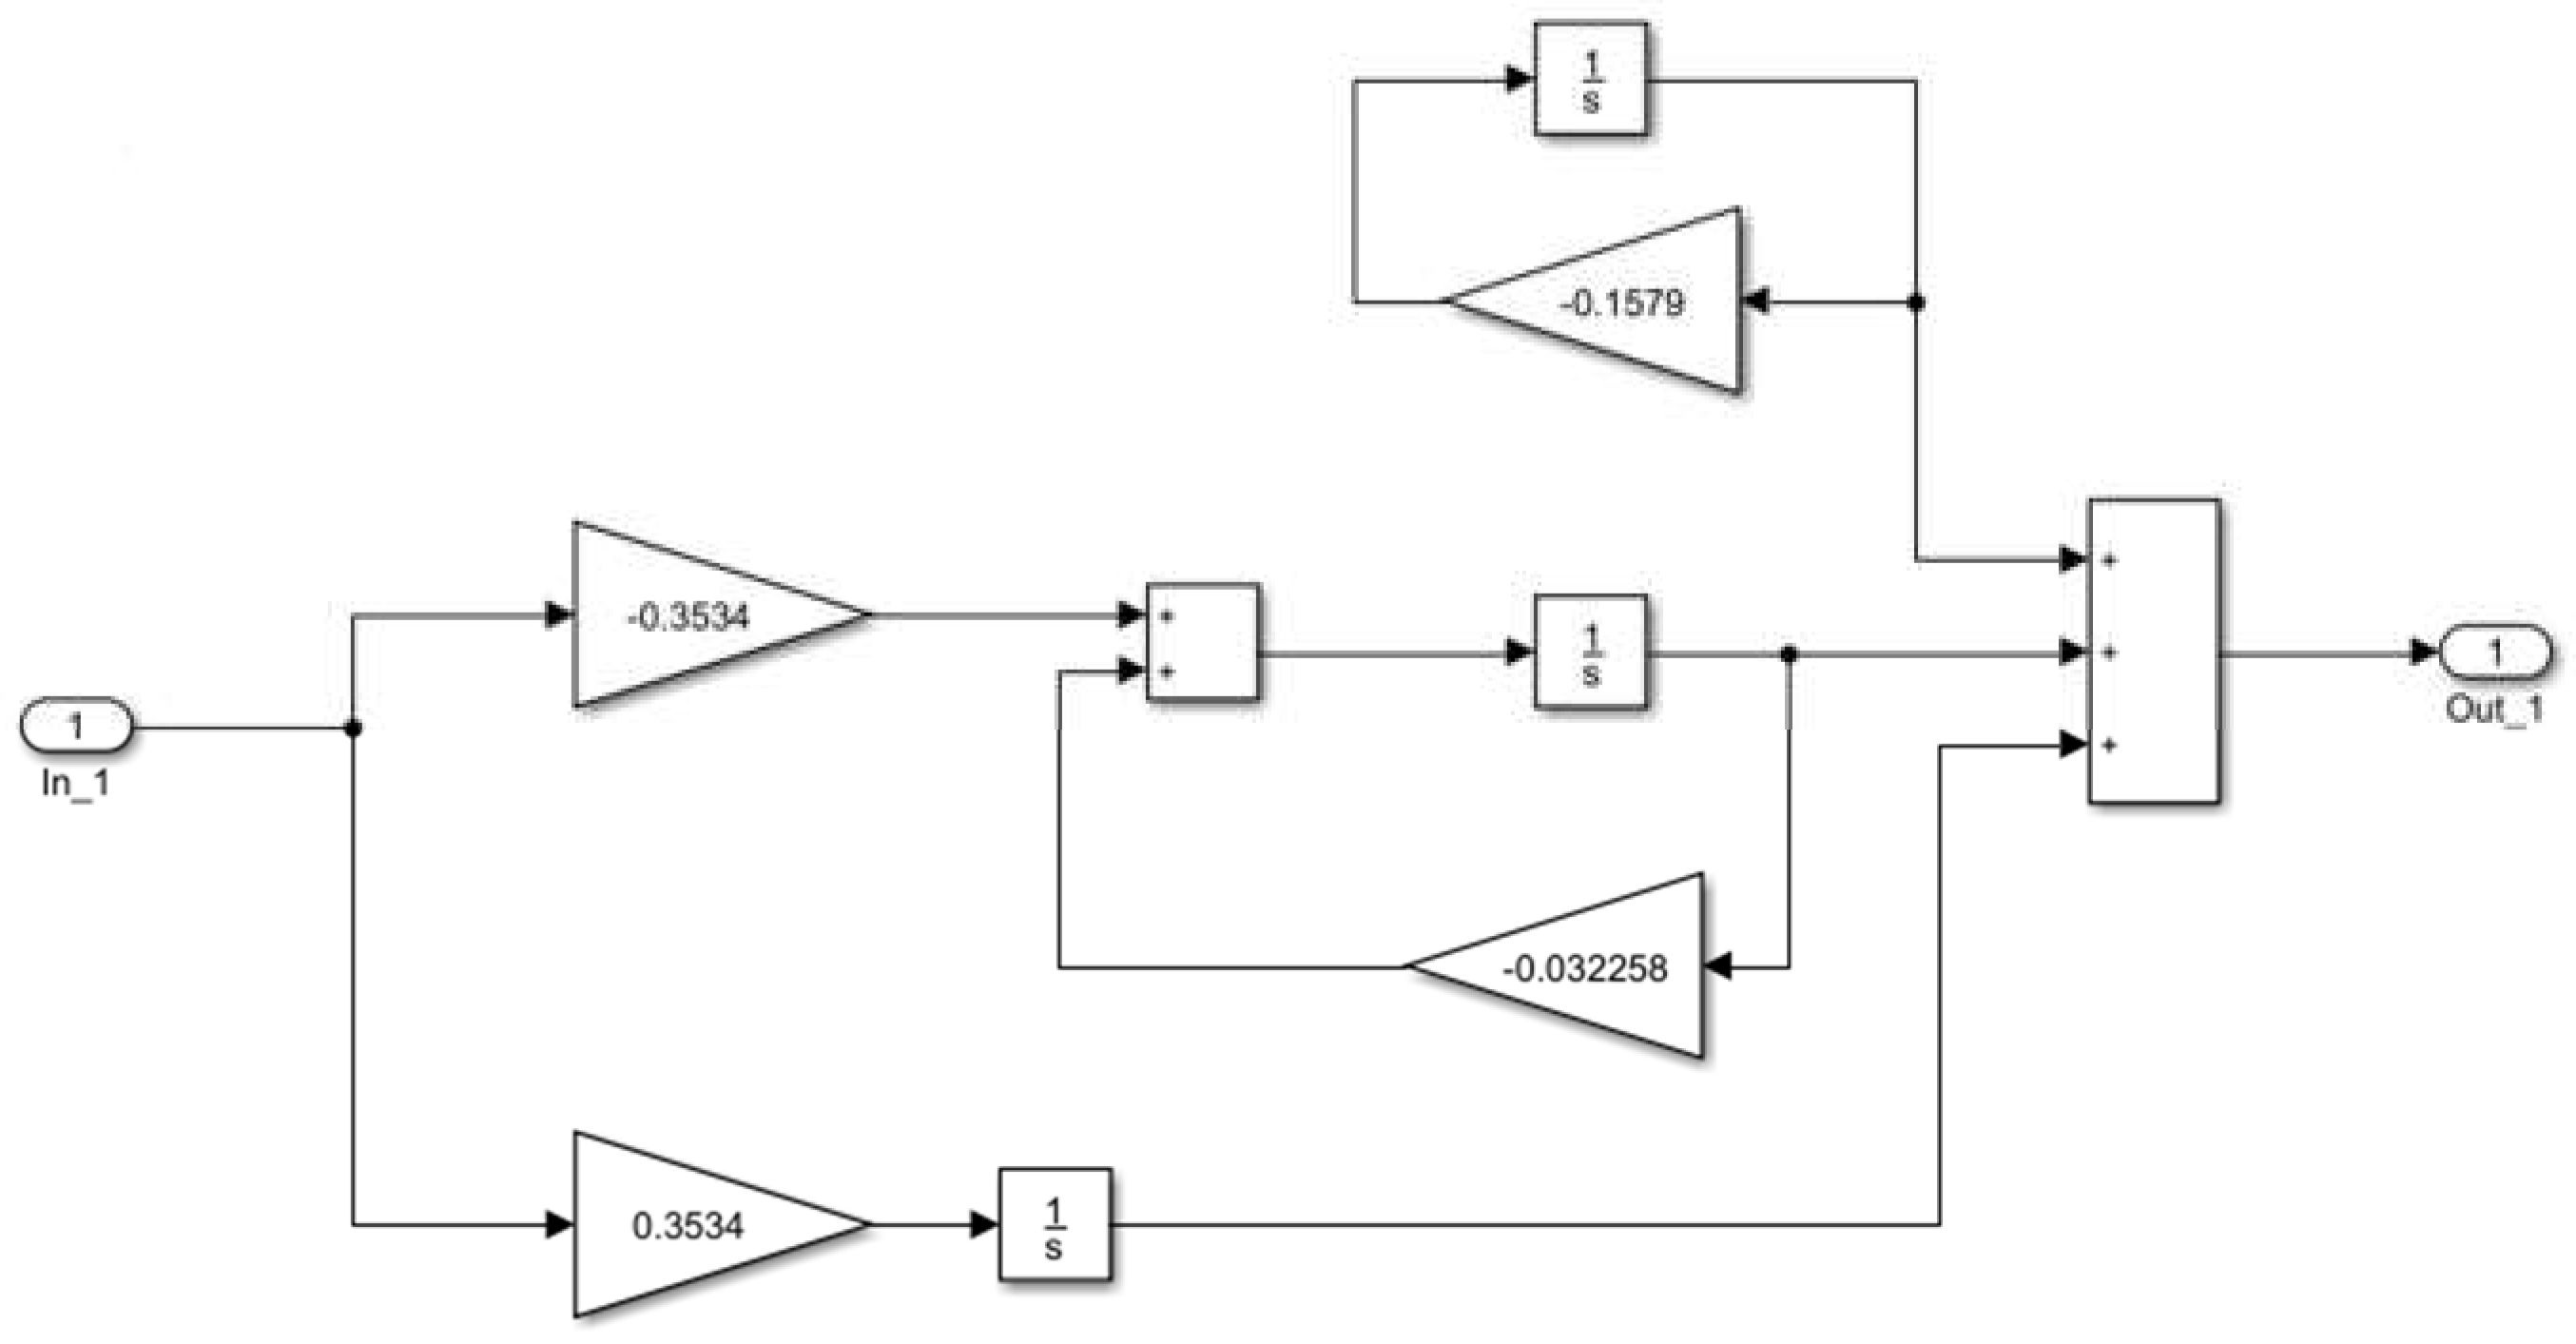
The zero value of the L1 coefficient indicates the partial uncontrollability of the adopted structure resulting from the simplification of zero with the pole of the corrected system [22]. This is illustrated in Figure 12.
Despite the fact that the test structure is partially out of control, it was recommended to use a corrector due to the fact that it is a minimal-phase system [23].
According to (27), the operator transmittance of the corrected system is of the form:
G K O = b s   ( s + a )
A diagram of the state variables of the system with the transmittance described by the formula (29) is shown in Figure 13.
Taking as state variables x1, x2 the output quantities of ideal integral terms, for this scheme of state variables the object can be described by an equation of the form:
x _ ˙   t = A _ 1   x _   t + B _ 1 v ( t )
whereby for this case A1, B1 are equal:
A _ 1 = 0 1 0 a , B _ 1 = 0 b
Note that the matrix P and the constant m in the relation (24) uniquely determine the elements of the characteristic equation of the closed system. With the wrong choice of these elements, the closed system may not have the required stability reserve. To prevent this by using the state space method [22,25], the feedback matrix W was selected in such way that the coefficients of the characteristic equation are as given in the following:
  M ( s )   =   d e t   [   s   I _     A 1   +   B _ 1   W _   ]   =   0    
and had predetermined values which provide an adequate margin of stability. Such formulation of the problem dictated direction of further investigation. For the object described by the Equation (30) and the assumed quality index presented in the following:
J = 0   x _ T t   P 1 x _ t + v 2 ( t )     d t
and it was necessary to select the elements of the matrix P1 and the matrix W = w1, w2 so as to obtain the assumed values of the elements of the characteristic equation of the closed system and the minimum value of the quality index (for the determined matrix P1).
The operator transmittance of the analysed object can be described by the following relation:
G K O =   s   I _ A _ 1 1 B _ 1 = L 0 ( s ) M 0 ( s )
Whereby:
L 0 s = s I _ A _ 1
M 0 s = d e t   s   I _ A _ 1
As it was presented in [22] aforementioned control method becomes
v ˙   t = W _   x _   ( t )
And for the following condition
W _ = B 1 T   P _ 1
is optimal if the characteristic polynomial M(s) of the closed system and the characteristic polynomial Mo(s) of the open system satisfy the condition:
M ( s )   M ( s )   =   M 0 ( s )   M 0 ( s )   + L _ 0 T ( s )   P _   L _ 0 ( s )
If s1, s2 denote the elements of the characteristic equation of an open system (object) then:
M ( s )   =   ( s s 1 )   ( s s 2 ) ,
M 0 ( s ) = ( s s 1 0 )   ( s s 2 0 ) .
In the [22,26], the following form of the search matrix P is recommended as the most convenient:
P _   =   p _   p _ T
whereby the vector p = [p1, p2]T,
By substituting the relations (35), (40), (41), (42) into (39) and comparing the coefficients at the same powers of the variable s, the components of the vector p can be determined.
Assuming a 5% error margin, the settling time was determined from the following relationship:
t r 3 s 1
Assuming s1 = s2 = -2, an settling time of tr ~ 1.5 s was obtained, which provides good signal attenuation. As a result of the assumption made one get:
M 0 ( s )   =   d e t   [ s   I _     A _ 1 ]   =   s   ( s   +   a )
M ( s ) = ( s + 2 ) 2 = s 2 + 4   s + 4
and
L 0 ( s ) = [ s   I A 1 ] a d   B 1 = b   [ 1 , s ] T .
The task was to find a P1 matrix in the form defined by the formula (42) so after some manipulations it looks like in following formula:
P 1 _   =   P 1 P 2 P 1 , P 2 =   P 2     P 1 P 2 P 1 P 2         P 2
By inserting the relations (44), (45), (46), (47) into (39) we got:
s 2 4 s + 4 s 2 + 4 s + 4 = = s 2 ( s 2 a 2 ) + b 2 [ 1 , s ] P 1 P 2 P 1 , P 2   1 a
Comparing the coefficients at the same powers of the variable s, we got:
P 1 = 4 b   ,           P 2 = 8 a 2 b
Denoting K1 matrix as:
K _ 1 = k 11 k 12 k 12 k 22
Such a symmetric matrix that is a solution of the Riccati equation
K _ 1   A _ 1 + A _ 1 T   K _ 1 K _ 1   B _ 1   B _ 1 T   K _ 1 + P _ 1 = 0
From the equality of the corresponding elements of the matrix it is derived:
  k 12 2   b 2     P 1 2   =   0 k 11     a   k 12     k 12   k 22   b 2   +   P 1   P 2   =   0 b 2   k 22 2   +   2   a   k 22     2   k 12     P 22   =   0  
Among the solutions to the system of Equation (52), one has been selected that ensures the stability of the closed system.
k 12 = P 1 b = 4 b 2 k 22 = 2 a + 4 a 2 + 4 b 2 ( 2 k 12 + P 2 2 ) 2 b 2 = 4 a b 2
The desired matrix was determined from the relationship:
W = 0 , b k 11 k 12 k 12 k 22 = 4 b [ 1 , 4 a b 2 ]
The above equation shows that for an object with an operator transmittance of (29) and a quality index of (33), a PD-type (ideal) controller with an operator transmittance should be selected:
G P D ( s )   =   k r   ( 1   +   T d   s )
and after inserting it into the negative feedback loop, whereby:
regulator gain is k r = 4 b = 350.9   a n d differentiation constant T d = 4 a 4 = 0.99 .
Inserting the obtained expression (54) into the relation (32), we obtain:
M s = det s   I _ A _ 1 + B _ 1 K _ 1 = s 1 4 s + 4 = s 2 + 4   s + 4
The result of the relation (56) confirms that for the determined matrix W (54) the characteristic equation of the closed system has the assumed values of the elements.
The analysis in following subsection concerned the determination of the optimal control for a structure that is a series combination of a control object and a corrector (26).
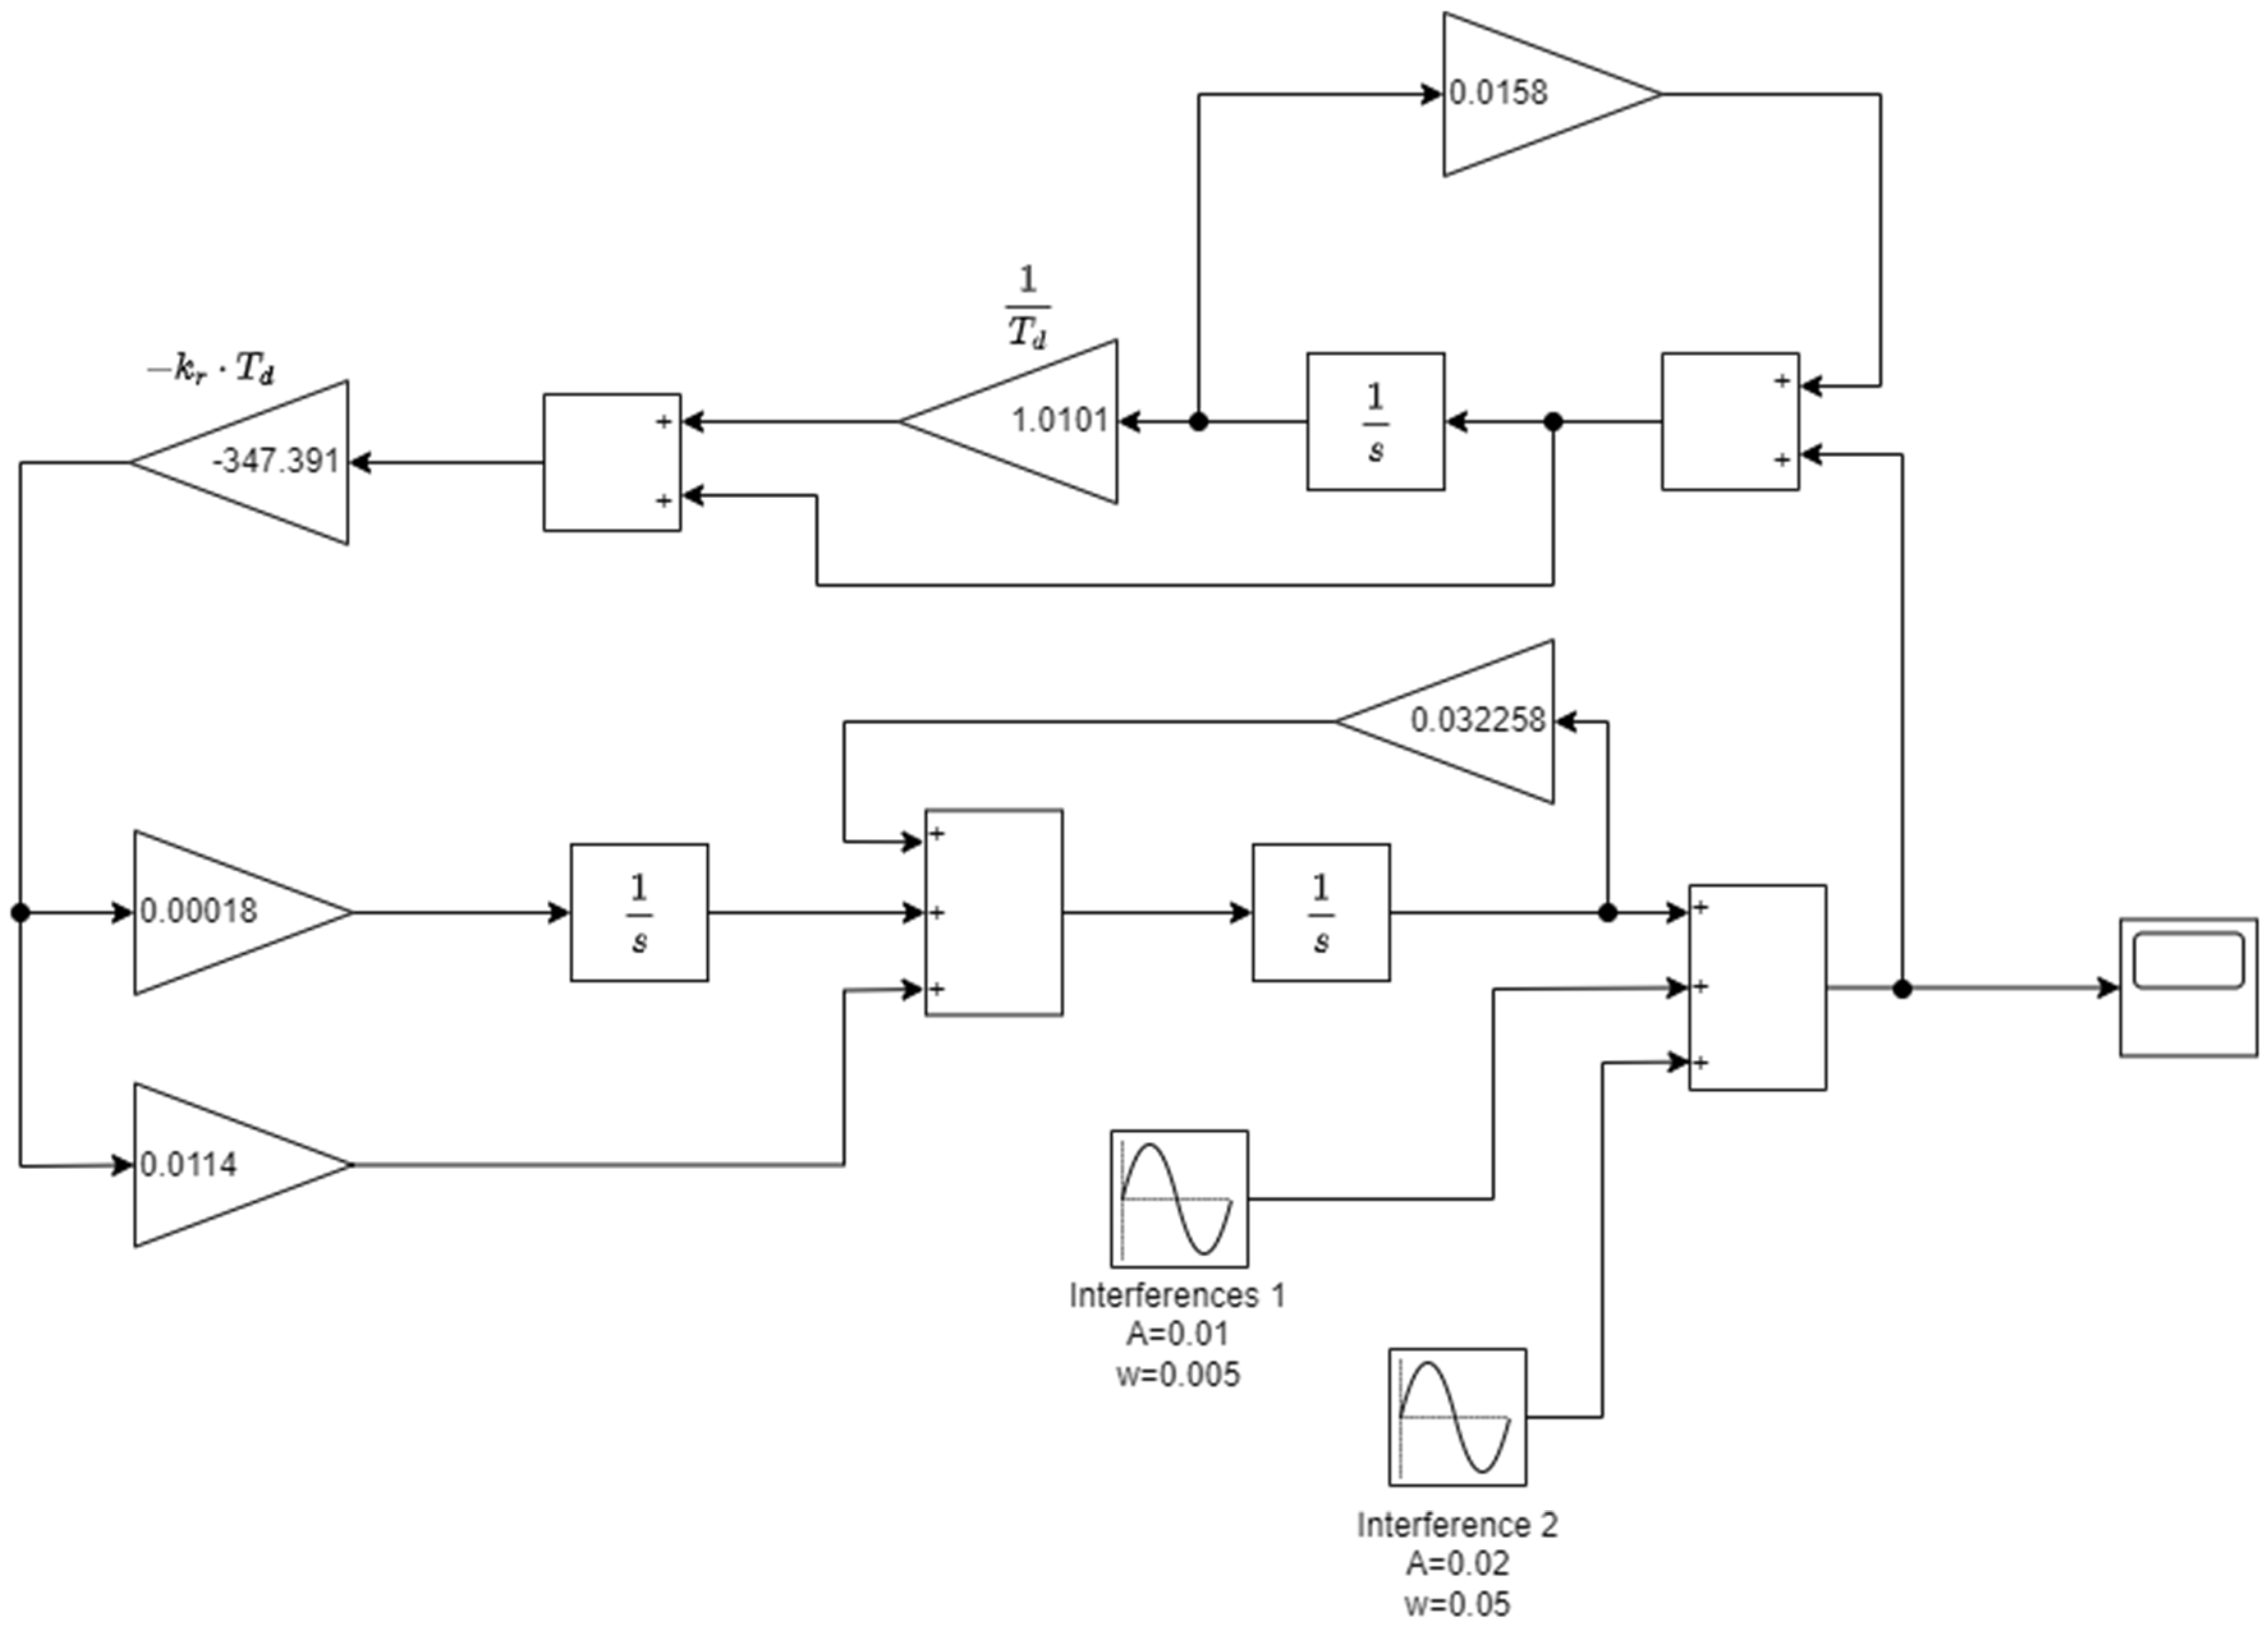
As indicated for such a structure, the optimal solution would be to use a PD (ideal) controller in the negative feedback loop with a setting of (55). By combining the object-modifying corrector with the optimal PD controller, an integrated structure of the correction factor with the operator transmittance described by the relation (57) was calculated, which, included in the negative feedback loop, realises for the object with transmittance (15) the optimal control u(t) at the selected quadratic quality index. The form of the transmittance (57) proves the necessity of a phase-delaying corrector use.
G k s = k r   ( 1 + T d s ) s + c b = k r T d a + 1 T d s + c b
A diagram of the state variables of the optimum system (with a phase-delay correction) is shown in Figure 14 where Interferences 1 block denotes rough sea waveforms which represent variable load change due to sea waves movement towards the hull. The block Interferences 2 represents calm sea waveforms of sea waves’ low amplitude and low frequency.
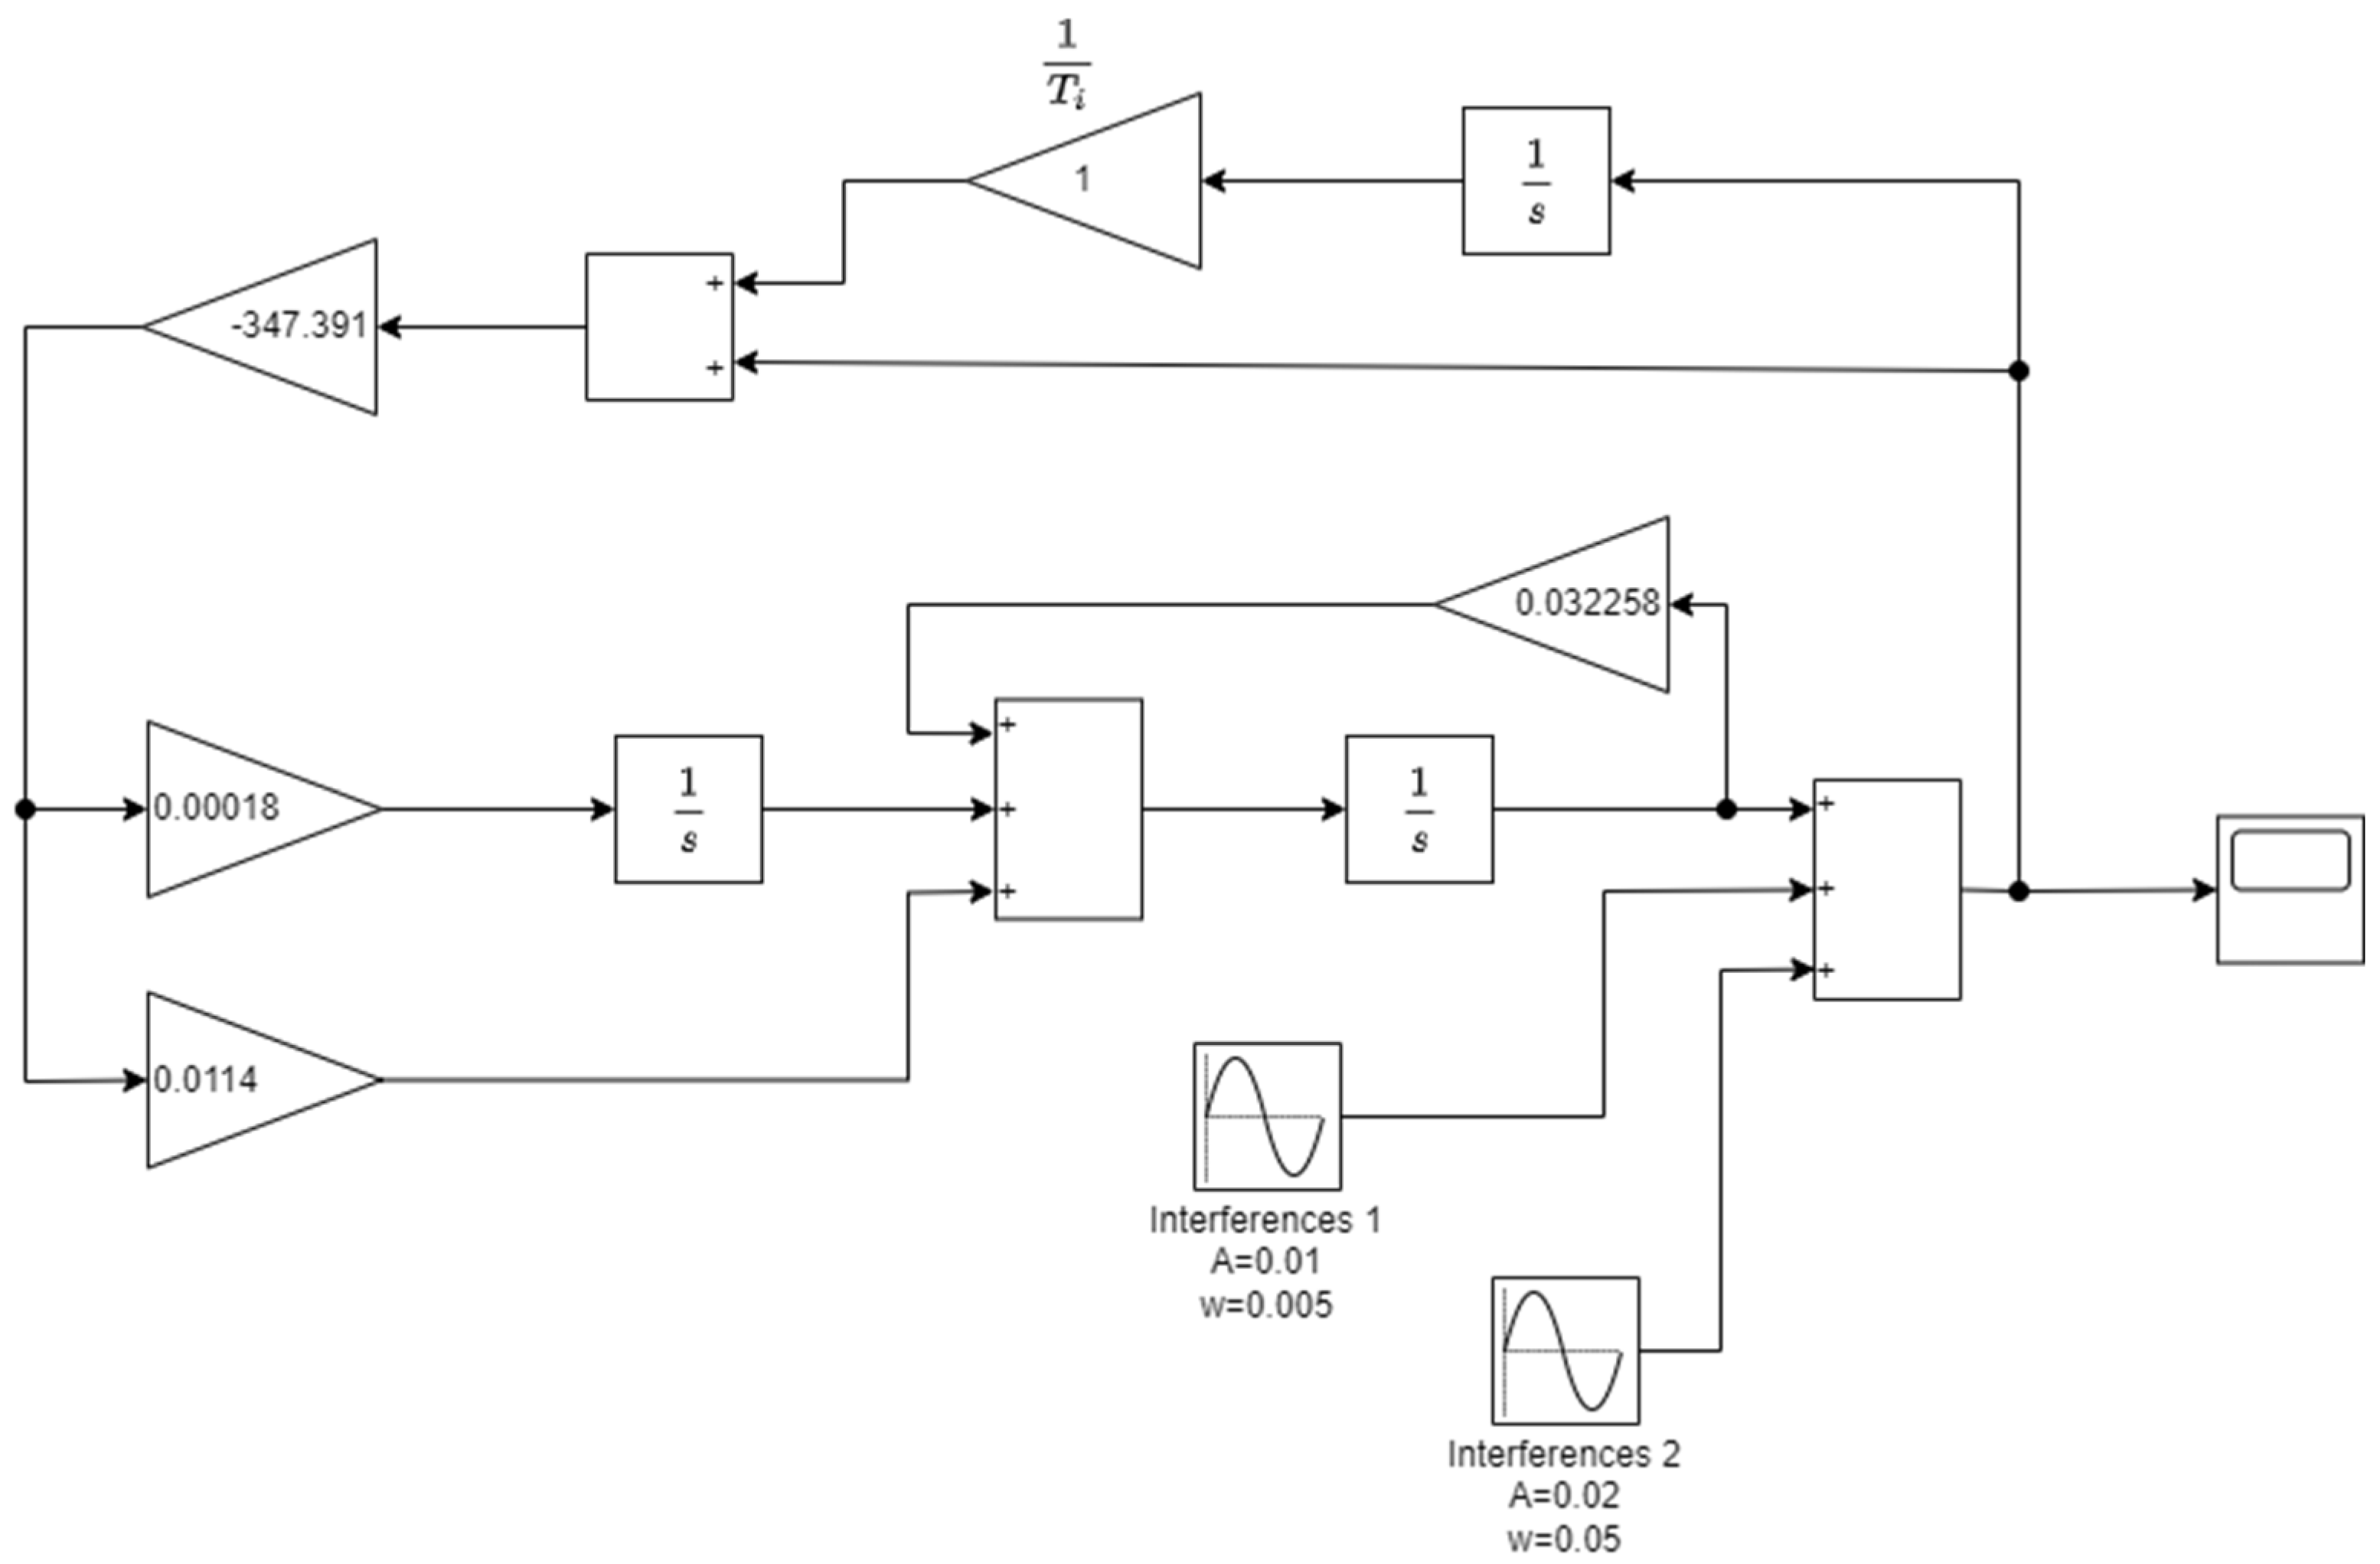
In the search for the optimal control of the tested object the PI controller with the integral correction term of a given transmittance fits the best to a practical systems:
G P I = k P I 1 + 1 T i s
which would work out suboptimal control. This is due to the fact that:
c b = 0.0158     1 T d = 1.01
A diagram of the state variables of the control system with PI controller is shown in Figure 15.

4. Test of the Optimal Model Structures

The two optimal and sub-optimal control structures of the boiler capacity control system determined in the previous sections were subjected to model test and the aim of which was:
  • determination the extortion compensation (at the optimum settings Td and kr) for a system with a phase-delay controller,
  • check of a slip compensation at settings Ti= 1s and kPI= krTd = 347.391, resulting from relations (59) and comparison of (57) and (58) for the system with PI controller.
The output of the object was given which were in both cases waveforms corresponding to the equivalent forcing (characteristic of calm sea and rough sea).
The process modelling was carried out on a PC and using Matlab software.
As it turned out the obtained digital process simulation results fully confirmed the optimality of the control structures adopted.
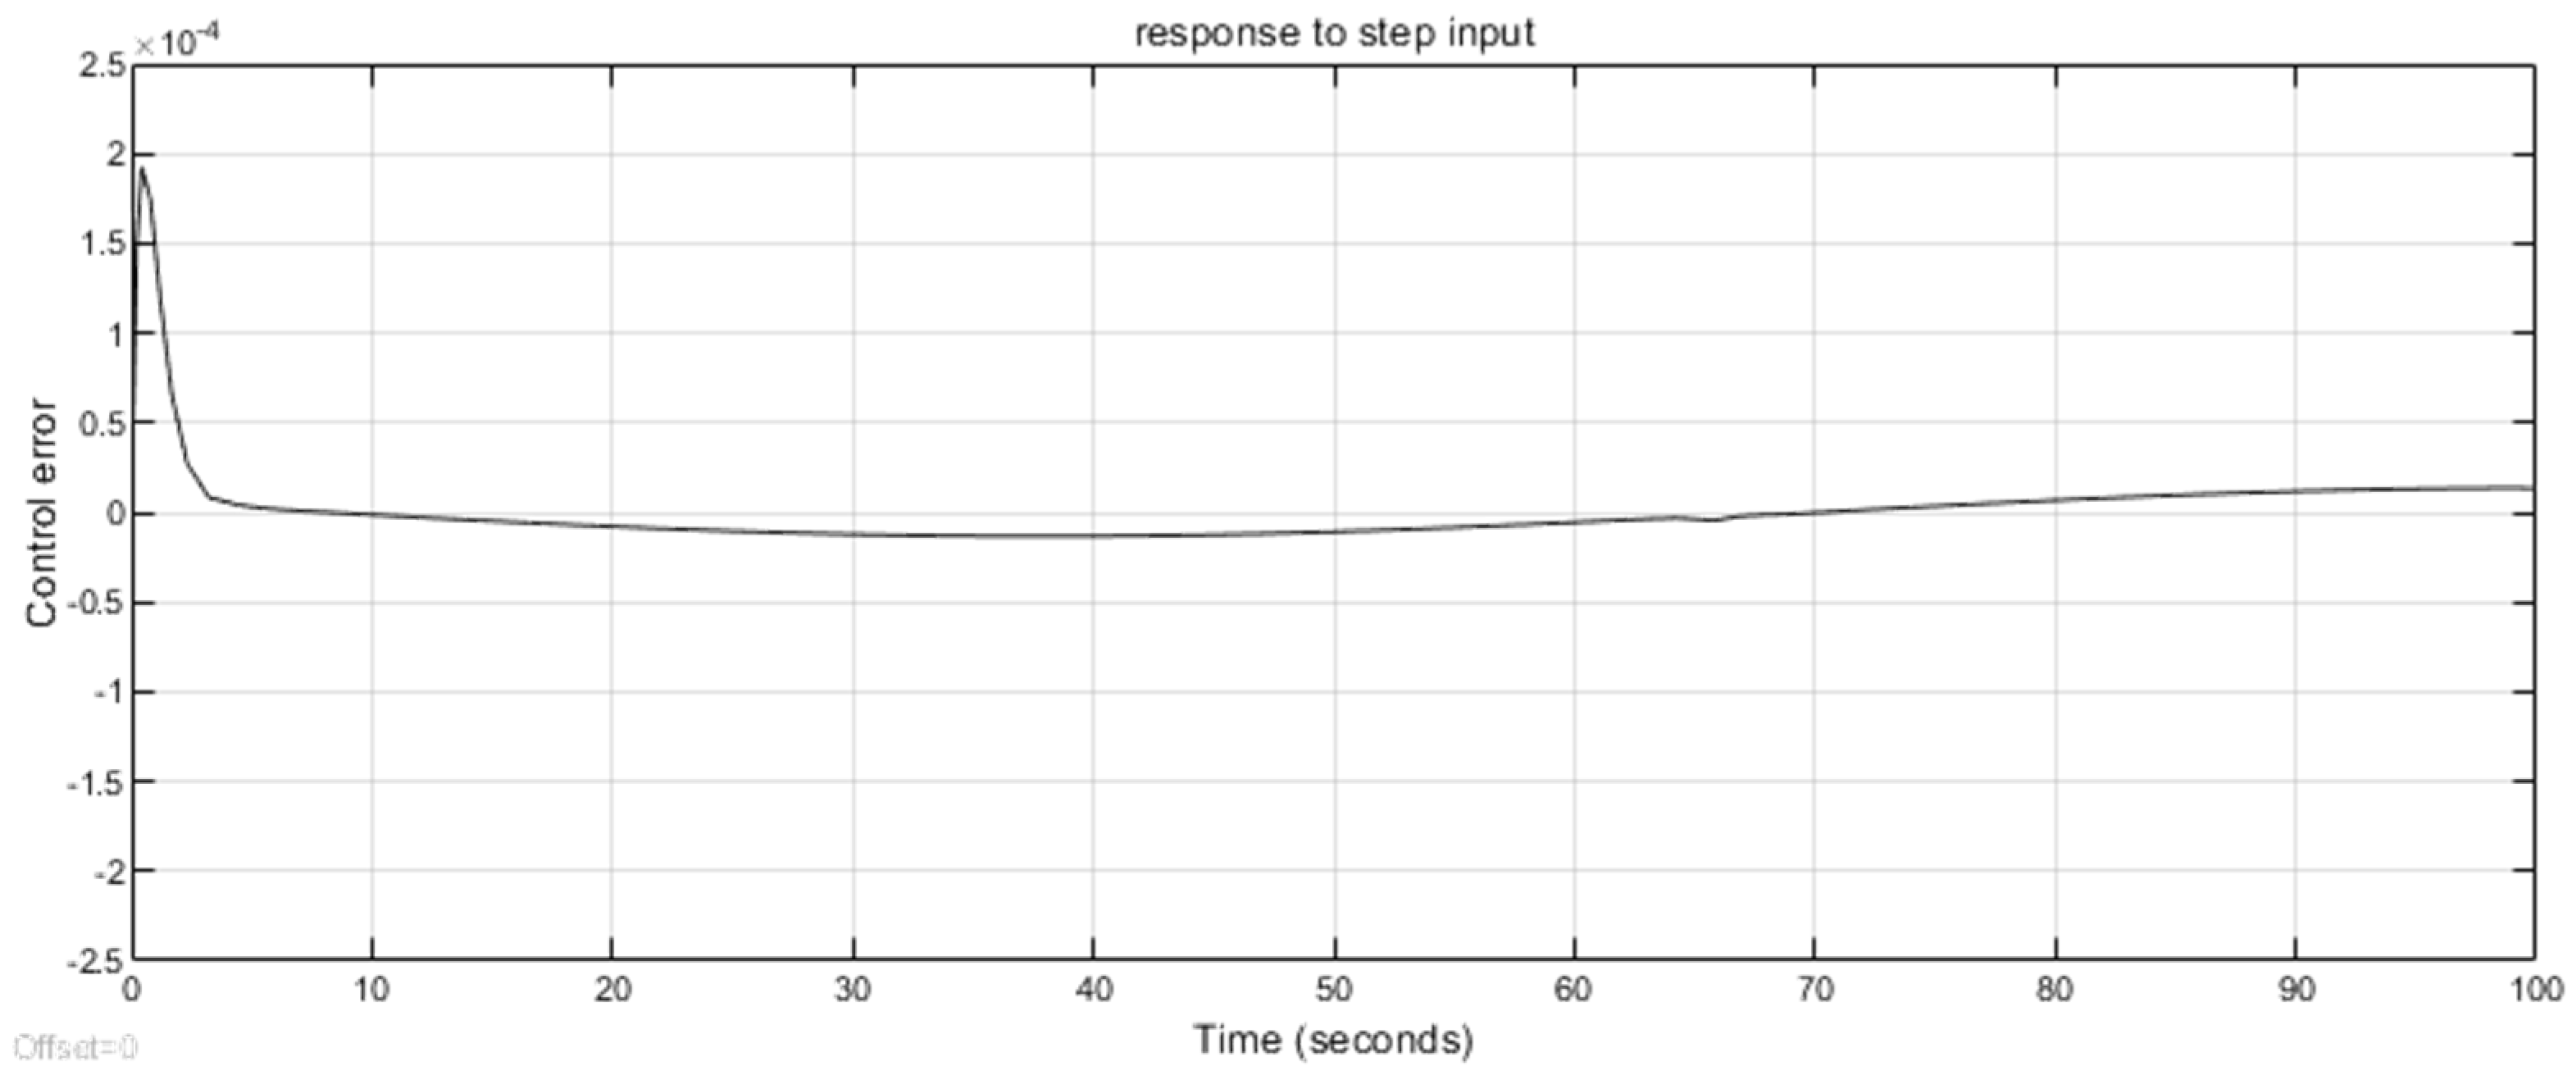
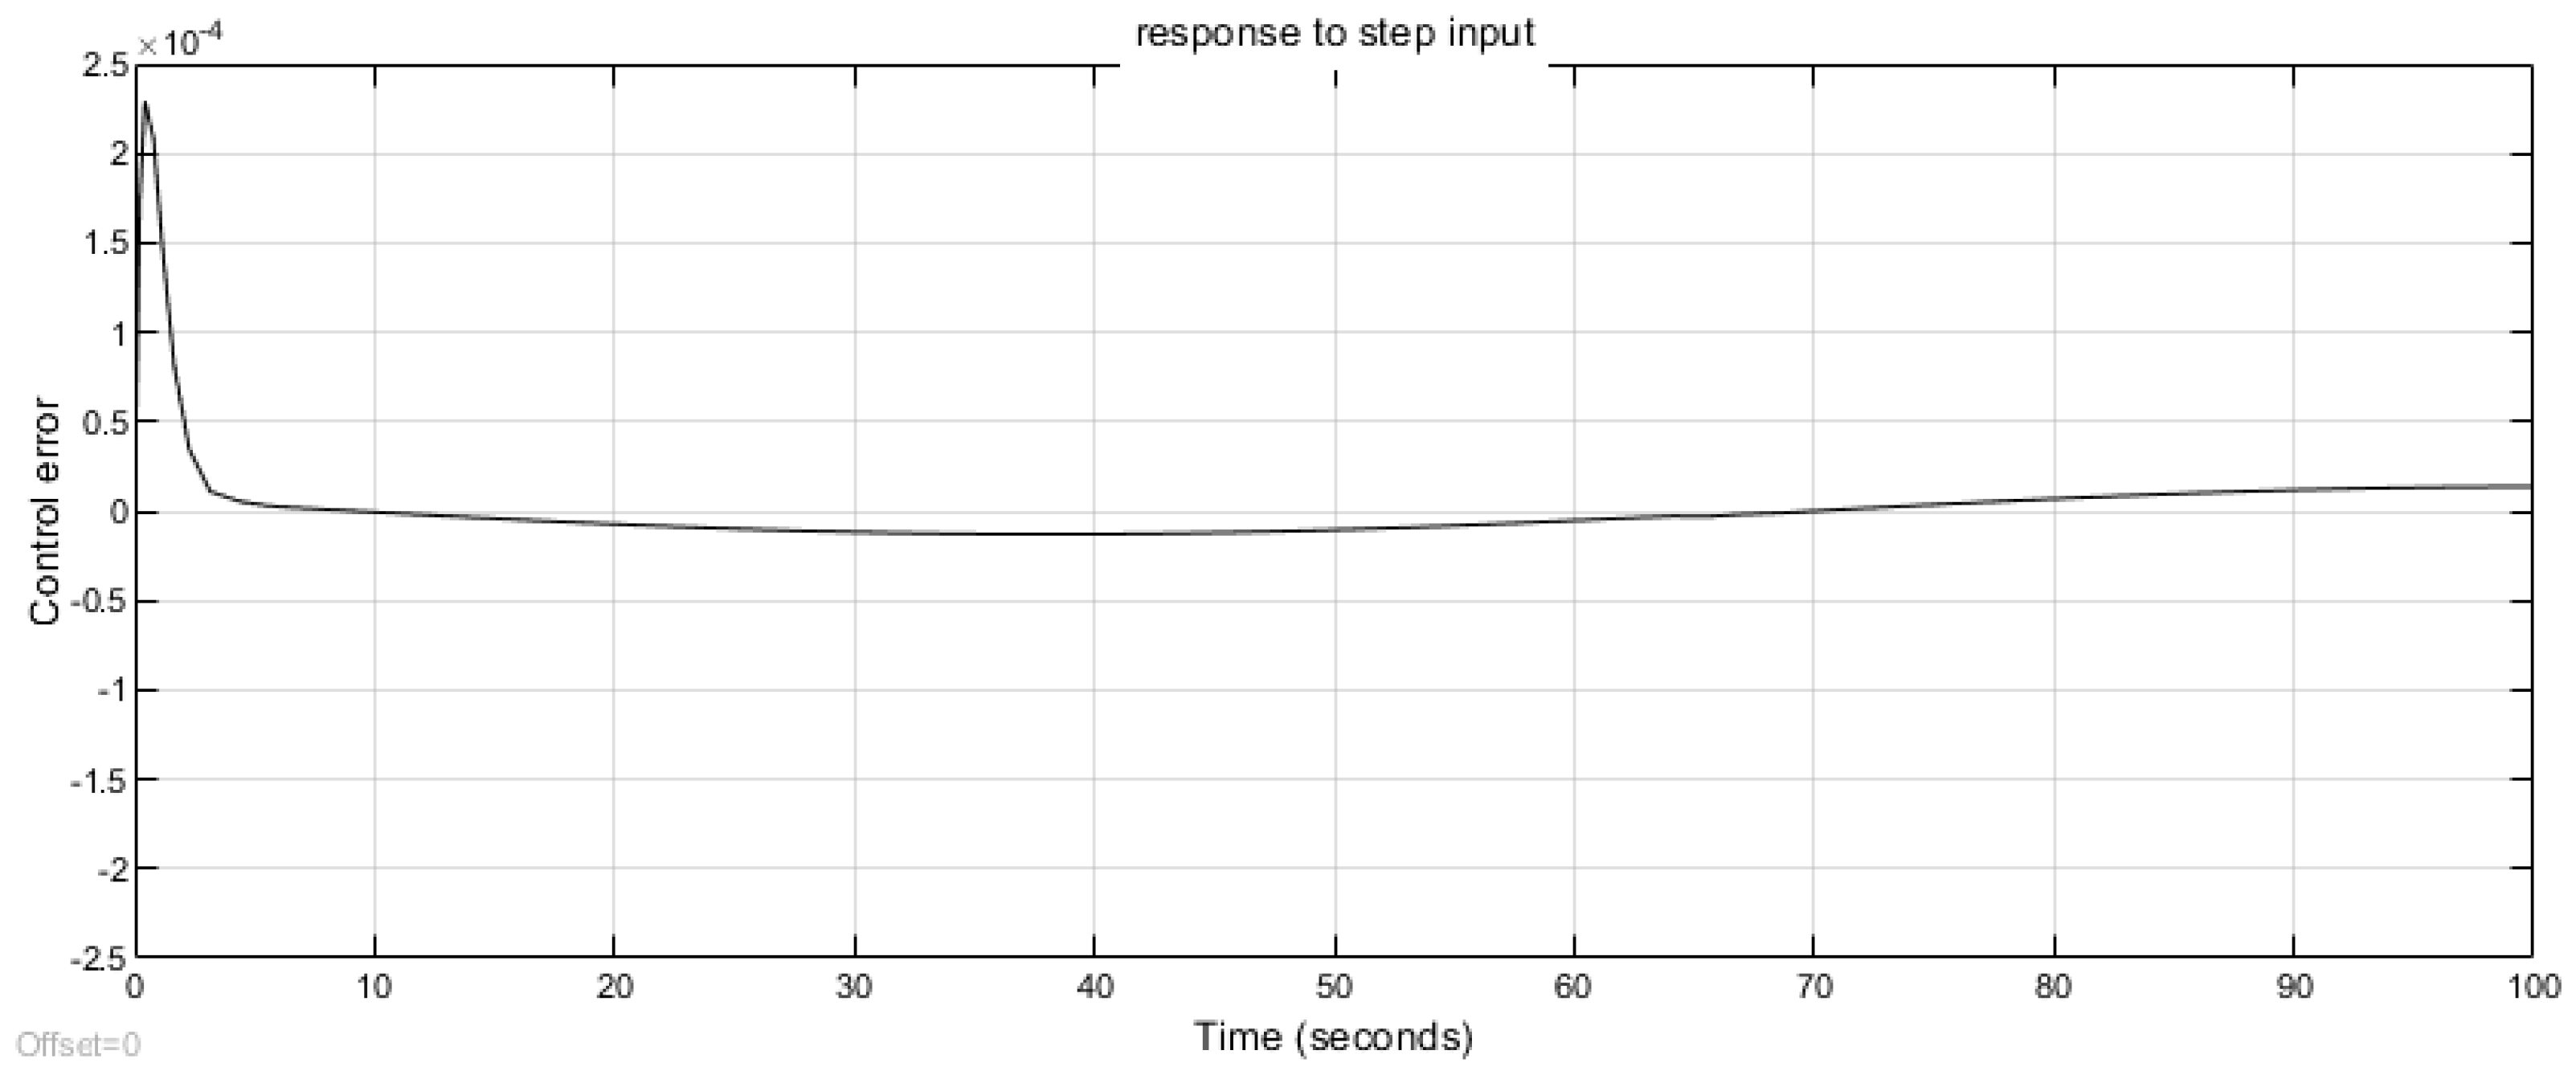
A structure incorporating a phase-delay equalizer in the feedback loop compensates very well for calm sea conditions characteristic well as for the heavy rolling. This is illustrated by the waveforms shown in Figure 16 and Figure 17.
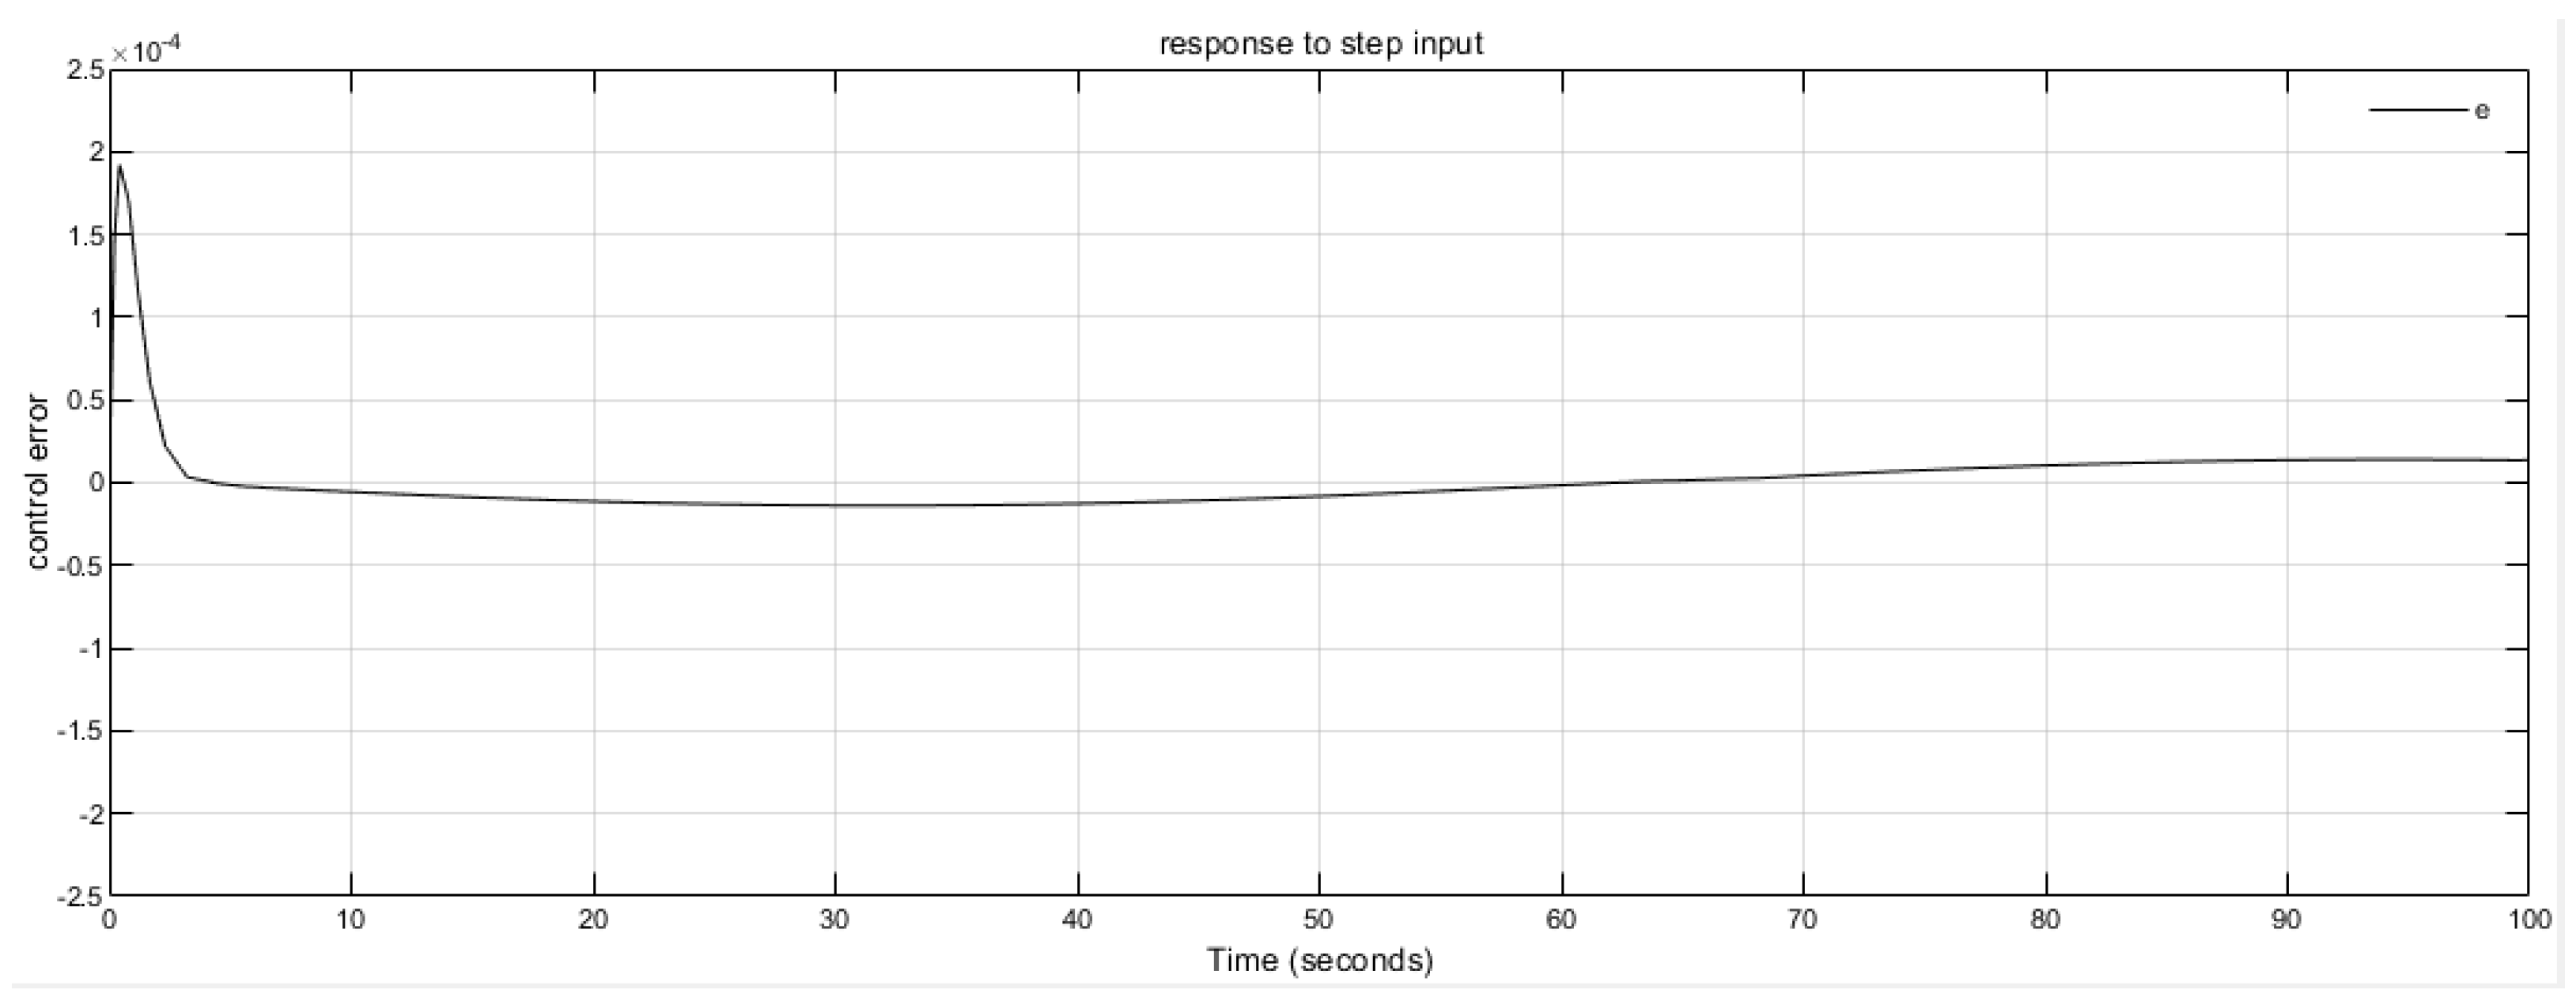
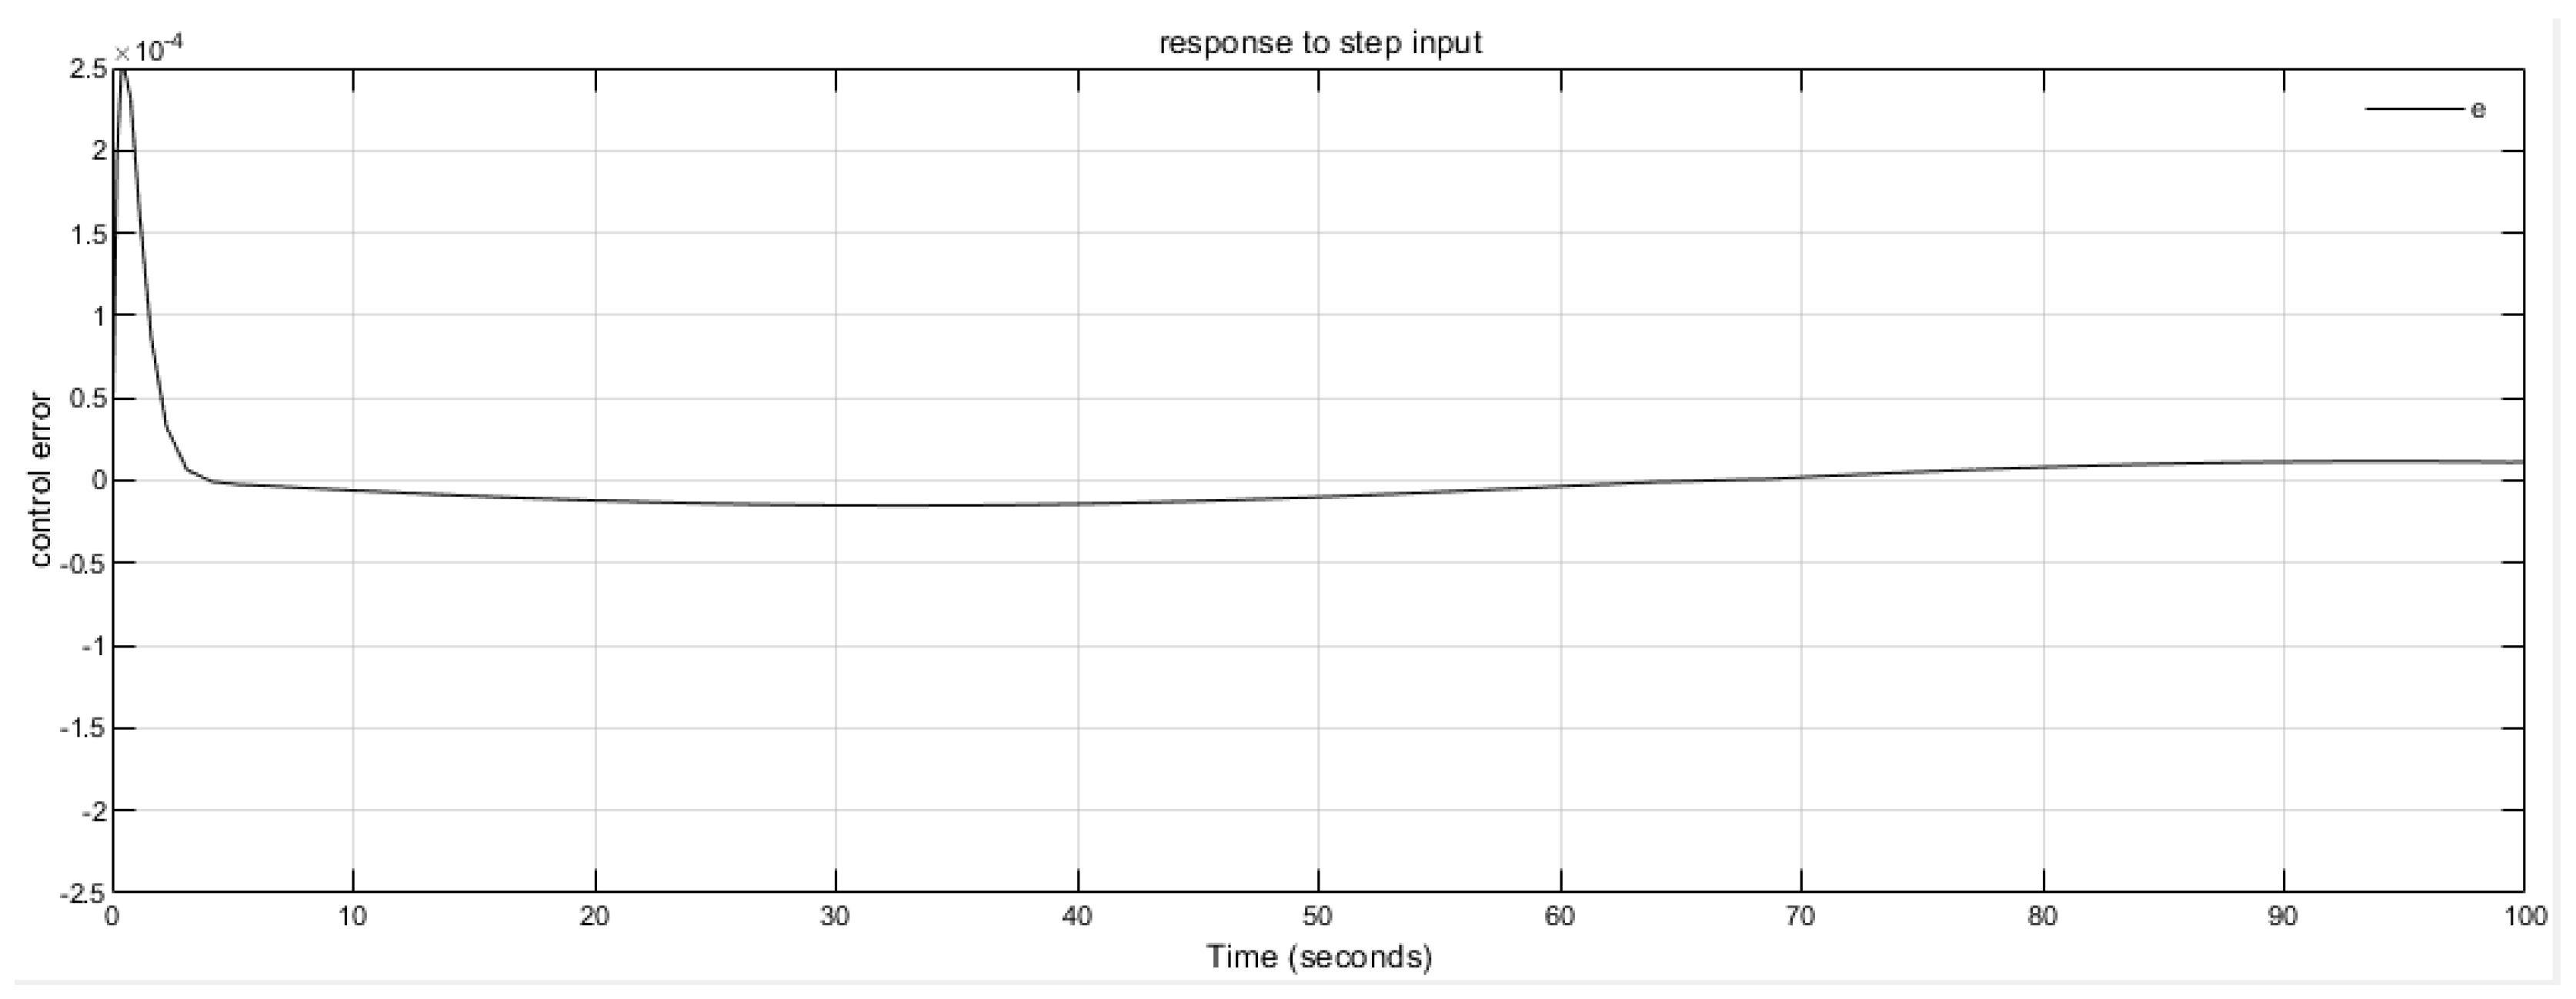
During the adjustment process, the error signal was kept close to zero. When two types of excitations are given in the form of equivalent signals (for calm sea and for heavy sea conditions), the waveforms obtained (Figure 18 and Figure 19) do not differ from those acquired previously for the optimum control structure. Thus, it is possible to use a standard structure of the PI controller, which is important for possible design solutions.
Due to an high capacitance energy storage which in fact is a steam boiler it may be concluded that propulsion steam turbine acts as kind of filter for varying conditions and sudden load changes what makes the proposed control structure robust and reliable. This property is considered as an advantage over ships combustion engines which have to watch out for such conditions are in a need of additional protections (e.g., overspeed and torque overload).

4.1. Hardware in Loop Implementation

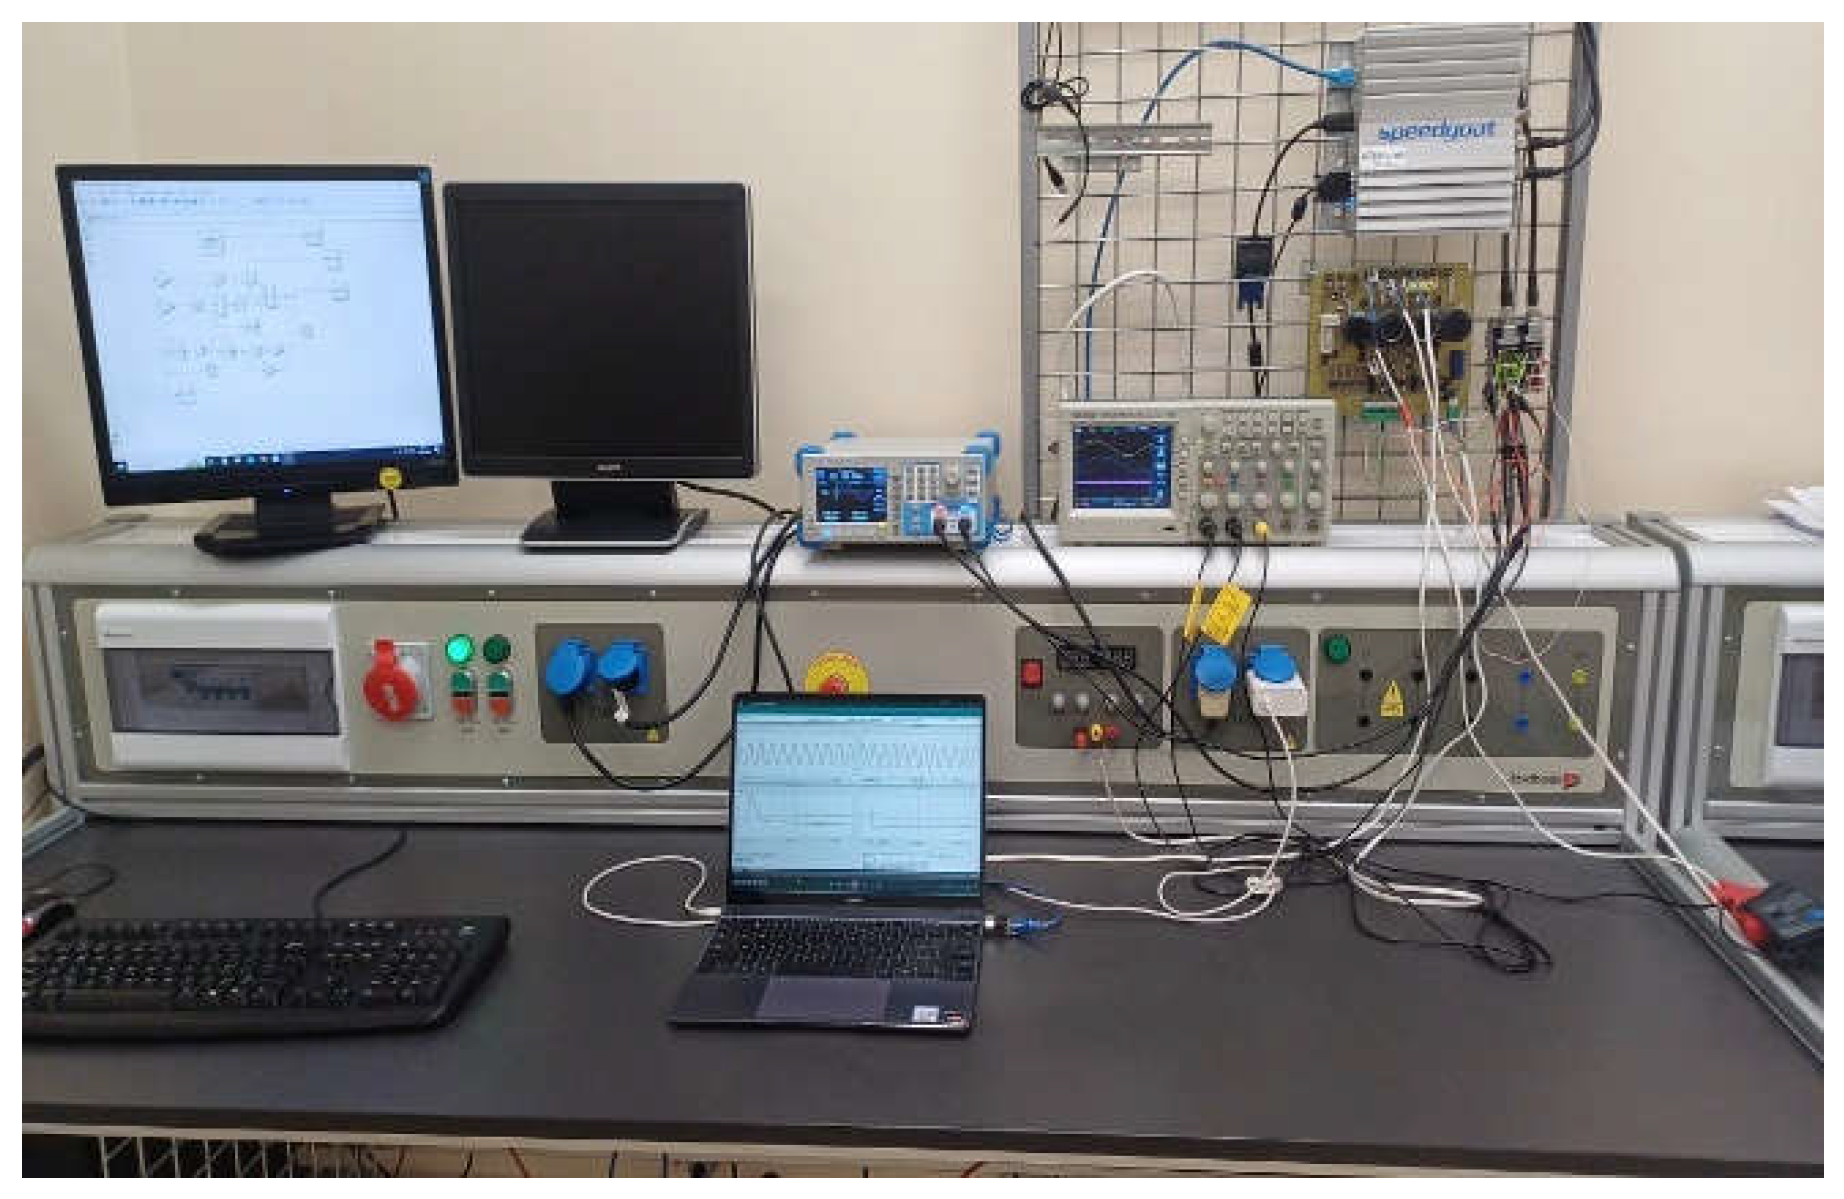
The one aim of the work was to prepare a system simulating the operation of a ship’s propulsion boiler that can be implemented in a HIL system. For this purpose, a research station was created (see Figure 20) containing a HIL system operating under the control of Matlab software, a host programming computer, an alternating signal generator, and auxiliary equipment such as an oscilloscope, power supplies, and a laptop computer for acquiring data from the HIL system.
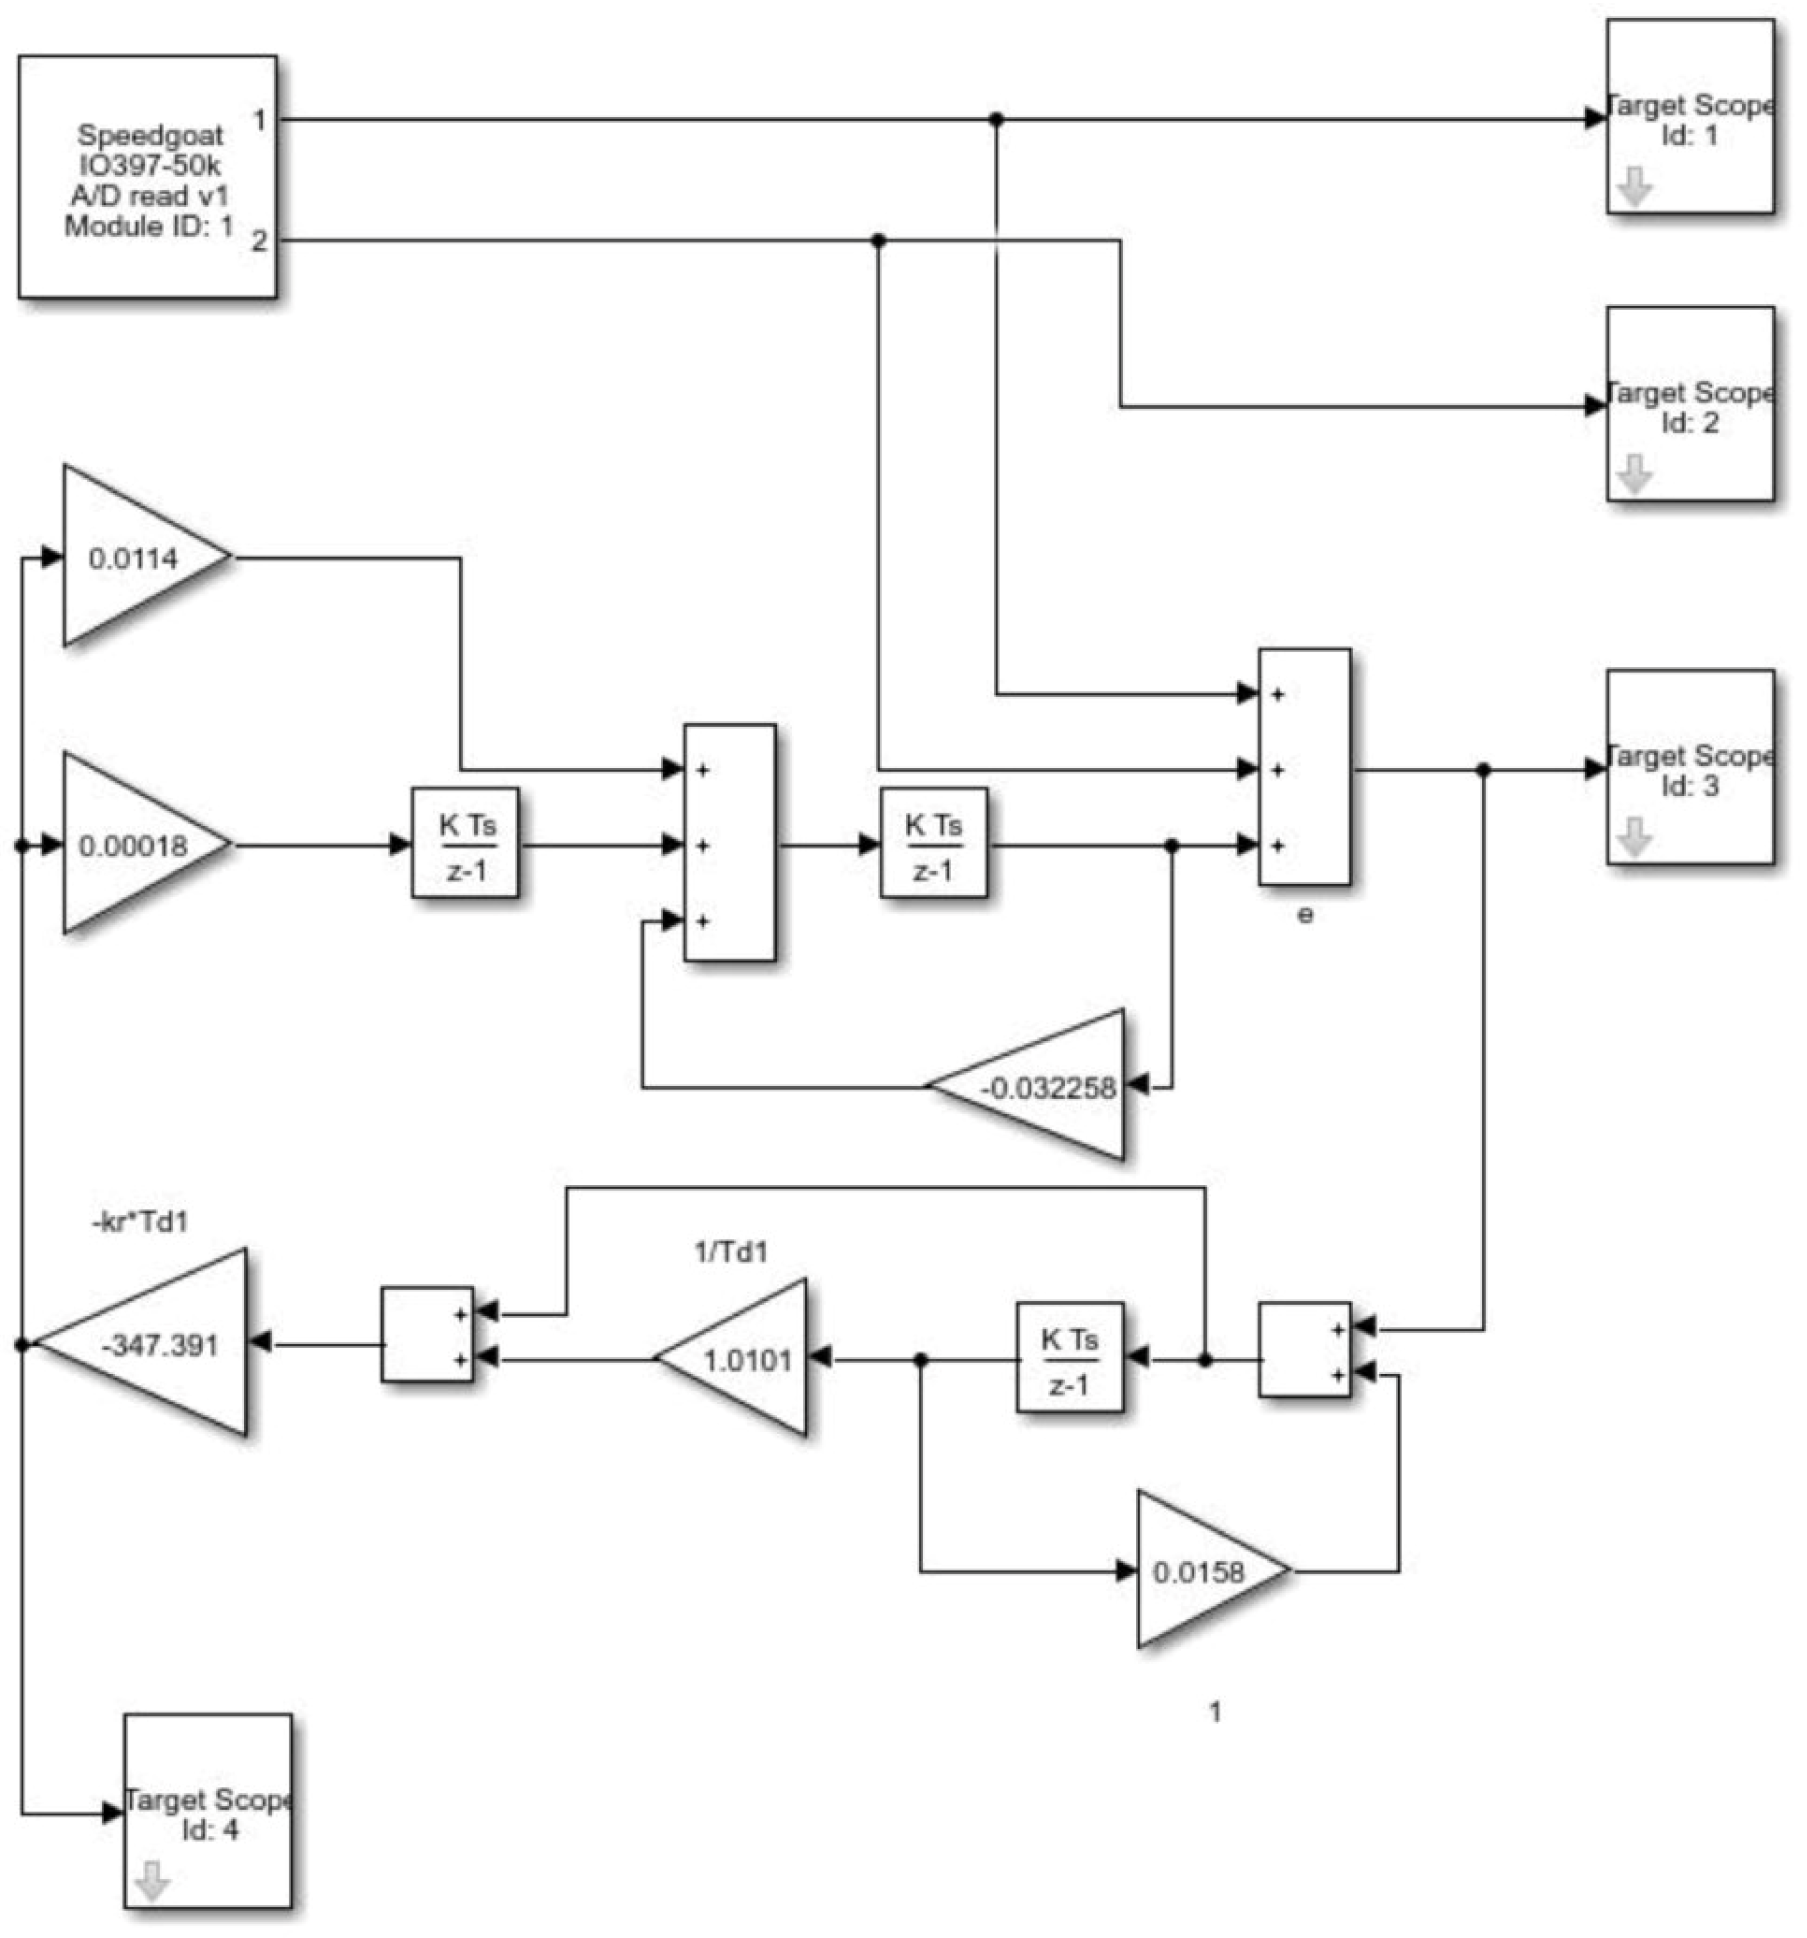
The simulation software containing the boiler control model that had been created and tested earlier was transferred to the HIL system. The transfer consisted of changes in the program settings that enabled correct operation in the real-time system. The most important change was the establishment of a calculation step with a constant processing period (Ts=1e-04) in contrary to the digital simulation system where the calculation step was variable. Transferred HIL model is presented in the Figure 21. There are some changes to the original system presented in the Figure 15 due to digital implementation and dependency on the constant processing period.
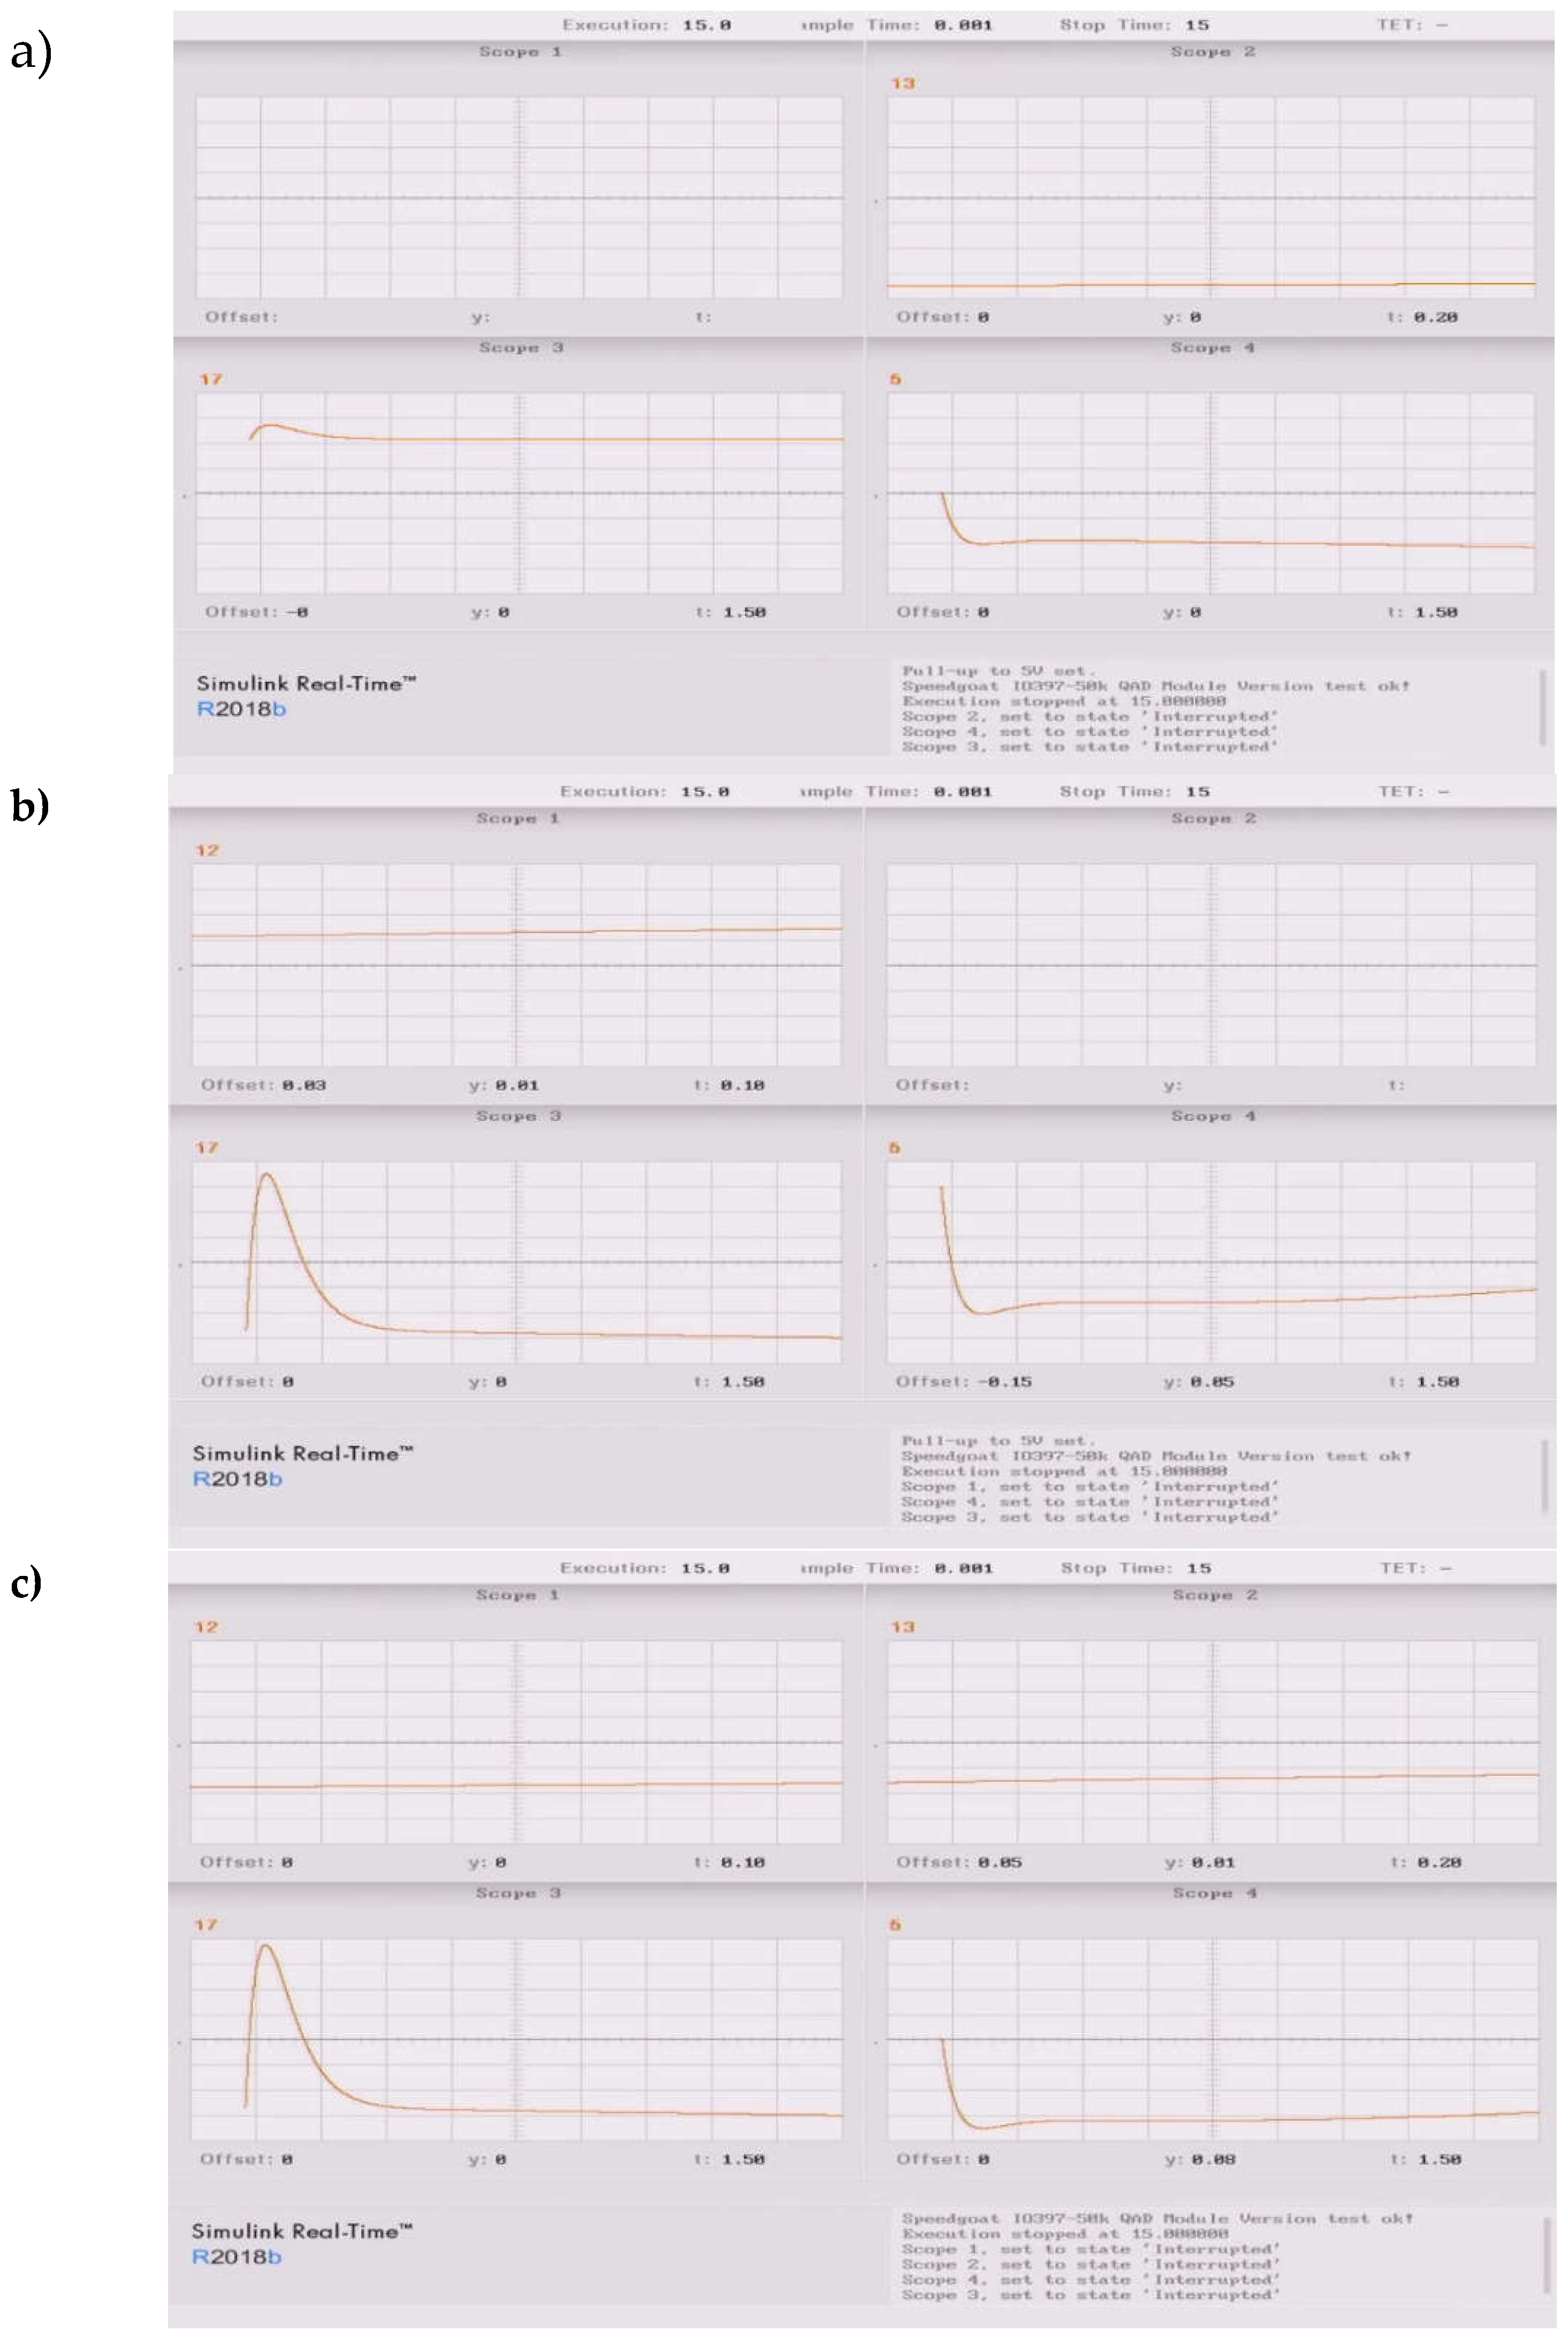
The investigations of digital model implemented in the HIL hardware covered changes of sea conditions such as wave amplitudes and frequencies [27] and acquiring control system responses in the real-time. As it turned out, due to a capacitance of the system the obtained results were identical to those which were acquired in the numerical simulations. Varying sea conditions gave the step responses of the controls as presented in the Figure 22.
In the Figure 22a there are waveforms obtained for calm sea conditions where sea waves amplitude was set to 1 m and the frequency was 0.005 rad/s. In the Figure 22b the parameters were set accordingly to 5 meters and 0.01 rad/s. The results presented in the Figure 22c are obtained for the two overlapping waves of 5 meters and two frequencies namely 0.01 and 0.005 rad/s. The responses of the control system are in the figures denoted as c and it can be seen that settling time equals to 2.8 seconds which is identical to numerical simulations results discussed in the section 4. Interesting fact is that control system is stable for wide range of waves amplitudes and periods. After deeper investigation it may be noted that for lasting longer measurements there are some oscillations of low frequency present in the error signal which can be minimalized with change of controller parameters but due to a nonlinearity of the system some controller variable settings should be used in order to maintain steady-state error close to zero.

4.2. Discussion on the Test Results

The search for possibilities to improve the quality of control of the boiler efficiency control process led to a positive result which was preparation of two different control models. As a result of theoretical analyses and digital model tests, two structures were proposed - optimal and sub-optimal with a PI controller - which make it possible to obtain satisfactory control results in terms of the adopted quality criteria. The fact that it is possible to use sub-optimal control in which a sufficient approximation of the integral correction (optimal structure) is obtained by using the PI controller in the negative feedback loop seems beneficial in this case.
In general, it should be said that the analysis carried out of the dynamics of the boiler performance control system showed the advisability of attempting to modify the control structure to achieve better economic indicators of the ship’s power plant. Such possibilities exist in the system, and the improvement of control quality promises fuel savings. In the case of tankers similar to the subject ship, achieving fuel savings even in the order of fractions of a per cent is a cost-effective undertaking, especially as the possible modification of control structures does not pose a major technical or investment problem. Improving the quality of the control may also prove expedient in terms of changing the nature of the actuators, which may contribute to improving their failure-free operation.
The carried out control models were implemented into the Hardware in Loop system and after experimental tests and again results obtained in an investigations were identical to solely software based which indicates readiness of HIL system to further implementation of real world application which may be used to a boiler control system hardware simulator.
The research carried out and the analysis of control quality problems presented were exploratory and based on certain simplifications and limitations. It therefore seems necessary to draw attention to the need for further research.
Summary of tables
Table 3. Average values for each measurement series.
Serie T K1 K
[s] [at/at] [at/s*at]
A 37.71 0.2 0.0058
B 36.25 0.06 0.0036
C 21.47 0.28 0.0075
A, B, C 31.81 0.18 0.0056

References

  1. Mihalič, F.; Truntič, M.; Hren, A. Hardware-in-the-Loop Simulations: A Historical Overview of Engineering Challenges. Electronics 2022, 11, 2462. [CrossRef]
  2. Ai, F.C.; Sun, J.B. Simulation training system of marine auxiliary boiler and its application. Chinese Control And Decision Conference (CCDC), Shenyang, China, 2018, pp. 4236–4240. [CrossRef]
  3. Andersen, S.; Jørgensen, L. Scheme for auto tuning control of marine boilers. Master’s Thesis, Aalborg University, 2007.
  4. Solberg, B.; Andersen, P.; Stoustrup, J. Advanced water level control in a onepass smoke tube marine boiler. Technical report, Department of Electronic Systems, Aalborg University, Aalborg, Denmark, 2007.
  5. Jose, J.; Nafeesa K.; Ismail Yasar Arafath K.M. Fuzzy logic based control of marine boiler system. International Conference on Power, Instrumentation, Control and Computing (PICC), Thrissur, India, 2015, pp. 1-5. [CrossRef]
  6. Solberg B.; Andersen P.; Stoustrup J. The One-pass Smoke Tube Marine Boiler-Limits of Performance, Engineering, Environmental Science, 2008.
  7. Hultgren M.; Ikonen E.; Kovács J. Integrated control and process design for improved load changes in fluidized bed boiler steam path. Chemical Engineering Science. 2019, 199, 164–178; ISSN 0009-2509. [CrossRef]
  8. Milton; D.C.; Leach; R.M. Marine Steam Boiler. Elsevier Science & Technology. London, 1980.
  9. Perepeczko, A., Okrętowe kotły parowe, Wydawnictwo Uczelniane Politechniki Gdańskiej, Gdańsk 1979. (In Polish).
  10. Rakowski; J.J. Automatyka cieplnych urządzeń siłowni, Wydawnictwa Naukowo-Techniczne WNT Warszawa 1983.
  11. Matyszczak; M. Sterowanie wydajnością okrętowych kotłów napędu głównego z uwzględnieniem wymuszeń losowych. PhD dissertation, Wrocław 1980.
  12. Greblicki, W. Podstawy automatyki, Oficyna Wydawnicza Politechniki Wrocławskiej, 2006.
  13. Bendat, J.S.; Piersol, A.G. Metoda Analizy i pomiaru sygnałów losowych, PWN Warszawa 1976.
  14. Kaczorek, T. Teoria sterowania, PWN Warszawa 1997.
  15. Kaczorek, T. Synteza liniowych układów stacjonarnych metodą przestrzeni stanów, PWN Warszawa 1975.
  16. Kaczorek, T. Teoria Układów Regulacji Automatycznej; WNT; Warszawa, Poland, 1977.
  17. Niederliński, A. Systemy cyfrowe automatyki przemysłowej, Wydawnictwa Naukowo-Techniczne WNT Warszawa 1974.
  18. Mańczak, K. Metody identyfikacji wielowymiarowych obiektów sterowania, Wydawnictwa Naukowo-Techniczne WNT Warszawa 1979.
  19. The boiler system control of T.T “Dorian”. Users manual.
  20. Moreta, M.J. Rosenbrock Type Methods for Solving Non-Linear Second-Order in Time Problems, Mathematics 2021, 9, 2225. [CrossRef]
  21. Combustion Process Control, Technical Review, Emerson Process Management, Industrial Systems and Control Limited, 2013. https://www.emerson.com/documents/automation/white-paper-combustion-process-control-technical-review-isc-ltd-en-41958.pdf.
  22. Brayanov, N.; Stoynova, A. Review of hardware-in-the-loop - a hundred years progress in the pseudo-real testing. Electrotechnica & Electronica (E+E) 2019, 54, 70.
  23. Bailey M.; Doerr J. Contributions of hardware-in-the-loop simulations to Navy test and evaluation. Proceedings of the Society of Photo-optical Instrumentation Engineers 1996, 2741, 33–43. [CrossRef]
  24. Solberg B. Optimization of Marine Boilers using Model-based Multivariable Control. Industrial Ph.D. Thesis, 2008.
  25. Whalley, R. The Control of Marine Propulsion Plant.   The University of Manchester (United Kingdom) ProQuest Dissertations Publishing, 1976. 13891317.
  26. Åström, K. J.; Bell, R.D. Drum boiler dynamics. Automatica 2000, 36, 363–378. [CrossRef]
  27. Jacobson, P; Hagerman, G; Scott, G. Mapping and Assessment of the United States Ocean Wave Energy Resource. EPRI 2011. [CrossRef]
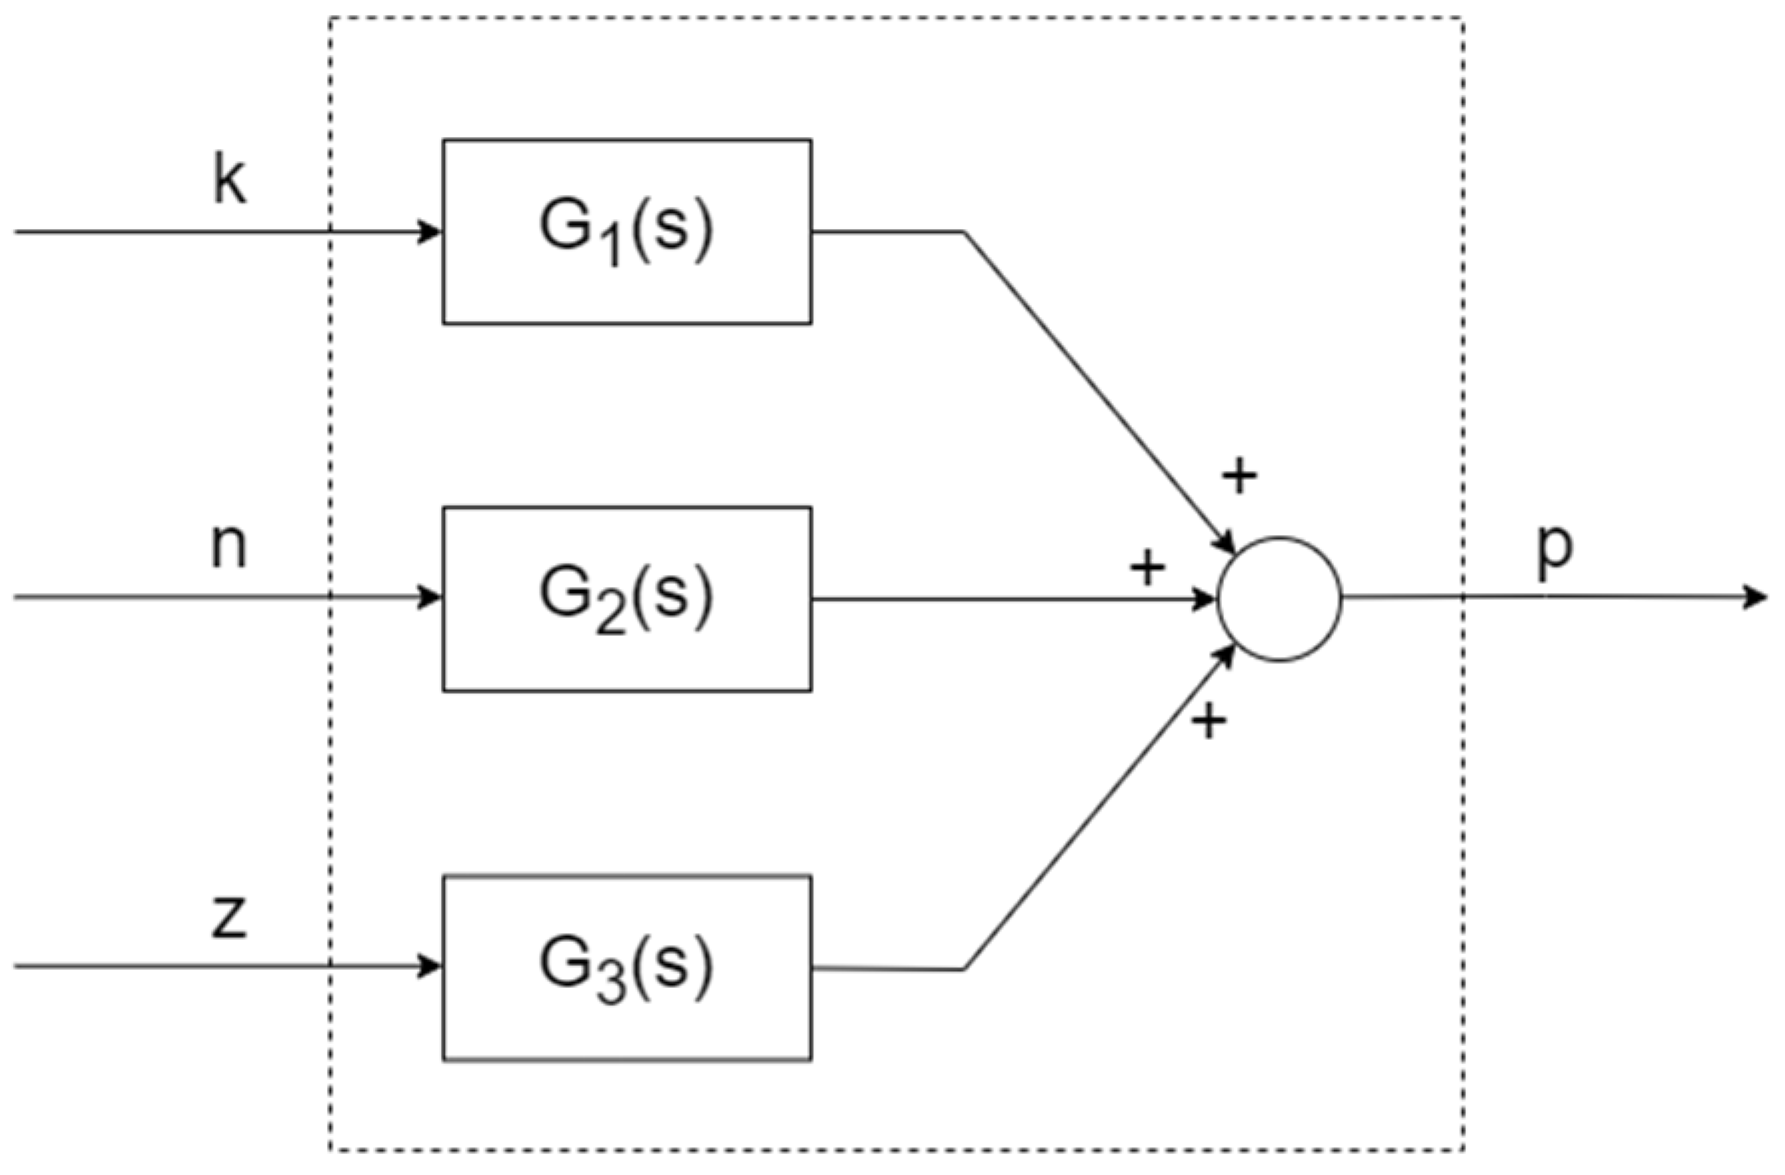
Figure 1. Block diagram of steam boiler’s model.
Preprints 114410 g001
Figure 2. Boiler’s model assumed for further identification.
Preprints 114410 g002
Figure 3. Extended block diagram of boiler’s model.
Preprints 114410 g003
Figure 4. Dynamic of boiler’s fuel path.
Preprints 114410 g004
Figure 5. Model block diagram adopted for computer analysis (after deduction of the delay component).
Preprints 114410 g005
Figure 6. Method of determination of model parameters.
Preprints 114410 g006
Figure 7. Approximation diagram of the steam pressure waveform with the assumed transmittance model.
Preprints 114410 g007
Figure 8. Approximation diagram of the steam pressure waveform with the assumed transmittance model.
Preprints 114410 g008aPreprints 114410 g008b
Figure 9. Final model of the discussed object.
Preprints 114410 g009
Figure 10. Control object model in SIMULINK software.
Preprints 114410 g010
Figure 11. Diagram of the object’s state variables.
Preprints 114410 g011
Figure 12. Diagram of the state variables for the corrected system, indicating the uncontrollability of parts of the system.
Preprints 114410 g012
Figure 13. Diagram of the state variables of the optimal system with a phase-delay corrector.
Preprints 114410 g013
Figure 14. Diagram of the state variables of the optimum system with a phase-delay corrector.
Preprints 114410 g014
Figure 15. Diagram of the state variables of a suboptimal system with PI controller.
Preprints 114410 g015
Figure 16. Time course for the optimum system in a calm sea condition acquired in simulation.
Preprints 114410 g016
Figure 17. Step input response for the optimum system in rough sea condition acquired in simulation.
Preprints 114410 g017
Figure 18. Step input response for a suboptimal system in calm sea condition acquired in simulation.
Preprints 114410 g018
Figure 19. Timeline for a suboptimal system in rough sea condition acquired in simulation.
Preprints 114410 g019
Figure 20. Overview of the laboratory setup with HIL.
Preprints 114410 g020
Figure 21. Model of investigated suboptimal system implemented in the HIL host computer.
Preprints 114410 g021
Figure 22. Results of HIL based experiment. Scope 1 – rough sea waves amplitude, Scope 2 – calm sea conditions amplitude, Scope 3 – control feedback signal, Scope 4 – step response. Time base for all oscillograms - 1.5 s.
Preprints 114410 g022
Table 1. Boiler operating conditions.
Control system Control Controlled parameter Parameter value during identification process
PORT Boiler STBD Boiler PORT Boiler STBD Boiler
Air flow auto auto Flaps’ position Const. Var.
Fuel dose man. man. Fuel valve position Const. Var.
Table 2. Results of individual measurement series.
Graph No. T K1 K Extorsion Fuel av. press Propeller rev.
[s] [at/at] [at/s*at] [at] [at] [rpm]
11p 32.97 0.7600 0.0170 0.6 4.9 0
12p 25.28 0.0500 0.0040 2.0 6.5 0
15p 31.47 0.1800 0.0040 1.0 6.5 0
16p 41.92 0.0900 0.0030 1.2 6.5 0
19p 53.28 0.0300 0.0040 1.0 6.0 0
20p 41.38 0.0900 0.0030 1.5 6.3 0
10p 54.28 0.0300 0.0070 1.6 7.5 50
28p 26.08 0.0700 0.0030 1.8 10.2 55
30p 40.30 0.1000 0.0030 1.4 11.0 53
31p 36.00 0.0500 0.0020 2.4 11.8 45
32p 12.33 0.0300 0.0030 3.0 12.0 45
33p 24.60 0.0500 0.0030 2.0 11.0 40
22p 22.33 0.1000 0.0050 1.8 13.4 65
23p 20.61 0.4400 0.0110 0.6 13.4 65
Disclaimer/Publisher’s Note: The statements, opinions and data contained in all publications are solely those of the individual author(s) and contributor(s) and not of MDPI and/or the editor(s). MDPI and/or the editor(s) disclaim responsibility for any injury to people or property resulting from any ideas, methods, instructions or products referred to in the content.
Copyright: This open access article is published under a Creative Commons CC BY 4.0 license, which permit the free download, distribution, and reuse, provided that the author and preprint are cited in any reuse.
Prerpints.org logo

Preprints.org is a free preprint server supported by MDPI in Basel, Switzerland.

Subscribe

© 2024 MDPI (Basel, Switzerland) unless otherwise stated