1. Introduction
Frequency photoacoustics (PA) is the first and most widespread photothermal (PT) method used to determine numerous physical properties of various materials [
1,
2,
3,
4,
5,
6,
7,
8,
9], from metals and semiconductors, through modern multifunctional and low-dimensional materials and biological tissues to complex nanoelectronic devices and sensors [
10,
11,
12,
13,
14,
15,
16,
17,
18,
19,
20,
21,
22,
23]. In this method, the sample is excited by a sinusoidally modulated light beam, and the amplitudes and phase shifts of the pressure fluctuations in the gaseous environment of the sample are recorded at each modulation frequency
The size of the amplitude and the phase shift in semiconductors depend on the optical, thermal, elastic and electronic properties of the tested sample because these properties control the processes excited by the laser-material interaction and the heating of the sample (PT effect) produced by this interaction [
24,
25,
26]. However, the influence of some properties is expressed at low excitation frequencies (thermal and optical) and others at high modulation frequencies (elastic and electronic) [
24,
25,
26]. In addition, some properties, such as elasticity, have an effect on the phase in the lower frequency range than on the amplitude. In any case, the inverse PA problem, that is, determining the properties of the sample from the measured signals, represents a multi-parameter, nonlinear and ill-posed problem of mathematical physics, which is very complex to solve.
In the literature, one can find several approaches to solving this problem, but there is no unique algorithm for solving it [
14,
16,
17,
26]. Each of the approaches is adapted to the characteristics of measured PA amplitudes and/or phases for a given material and to the frequency range that can be achieved with a given experimental setup. Most often, the measured PA amplitude is used, and the inverse problem is reduced to a one-parameter one due to the availability of only low-frequency measured amplitudes [
27,
28,
29,
30,
31], and only the thermal diffusivity of the sample is determined [
1,
2].
However, an approach has recently been developed in which neural networks (NNs) are used for multiparameter solving of the inverse PA problem [
14,
16,
24,
26,
32,
33] or for removing of influences of detector transfer characteristic [
34]. NNs have proven to be a powerful tool in solving many multi-parameter problems [
34,
35,
36]. It has been shown that this approach measures the thermo-elastic properties of materials with great accuracy and precision if both amplitude and phase measurements are used simultaneously, and the accuracy remains very high even when only amplitude measurements are used [
37]. Since the measured amplitudes of PA signals are in the range of several orders of magnitude, the sensitivity of amplitude measurements is low, and the data itself must be scaled during network processing.
It is known that phase measurements are more sensitive, and the measured phases move in the range of 2π, so it can be expected that using only phase measurements could lead to more accurate values of the sample parameters, without additional scaling of the input data [
38,
39,
40]. Indeed, it is true that both amplitude and phase are recorded by detecting the photoacoustic response. The shift of the photoacoustic signal is recorded as phase, which is more stable in the experimental measurement, which practically reduces the measurement uncertainty. In practical work, to determine the amplitude value, it is necessary to know the exact power absorbed in the sample. Determining the power absorbed in the sample requires precise determination of the power of light falling on the surface of the sample, then precise determination of the reflection and absorption of the surface layer of the sample, which is a demanding process.
In this paper, phase neural networks were developed for the prediction of three properties of a semiconductor sample: thermal diffusivity, linear expansion coefficient and sample thickness. The training of the network was performed on numerical experiments in the frequency range from 20Hz to 20kHz, and a Gaussian noise was added to the input data in order to take into account the measurement errors that occur during a real experiment. It was shown that in this way the thermoelastic properties of semiconductors can be determined with an expected error of less than 2%.
2. Phase of Photoacoustic Response of Semiconductors- Direct PA Problem
The theoretical mathematical consideration is reflected in the consideration of the physical processes of the circular sample, a plate that is directly placed on the photocell in the configuration supported by the sample, when the sample is illuminated with modulated light of the form
, where
is the amplitude of the incident light,
and
is the modulation frequency. The result is absorption and, due to the deexcitation relaxation process of photogenerated electron-hole pairs,
,
Appendix A,heating through the sample, which leads to a temperature distribution
Appendix B, that causes various effects explained by the composite piston theory [
1,
2,
3,
10]. These changes in frequency domein are recorded as a photoacoustic response in the form of a pressure change in the photoacoustic cell
, where
is amplitude and
phase of total photoacoustic signal. The total photoacoustic signal in the frequency domain 20Hz to 20kHz is considered.
During the interaction of laser radiation with a semiconductor, there is thermalization of the lattice (excitation of phonons) but also photogeneration of electron cavity pairs when the energy gap of the semiconductor is lower than the energy of the excitation photons [
3,
10]. Because of the electron-phonon interaction, the properties of the subsystem of quasi-free charge carriers, electrons and cavities, change, but there is also a feedback effect of excited electrons on the phonon subsystem. This effect has been studied in the literature using the non-adiabatic small polaron model, and it has been shown that it can significantly affect the thermal properties of a sample exposed to excitation electromagnetic radiation [
41,
42,
43,
44,
45]. However, due to the strong covalent bonds between the structural elements in silicon, the importance of this effect is very small, so it is neglected in the consideration of the photoacoustic effect in semiconductors.
In further consideration, the conduction of optically generated heat through a semiconductor sample was observed based on the classic Fourier theory of heat conduction, and the influence of photogenerated carriers was taken into account through additional heat sources proportional to the concentration of photogenerated excess charge [
3,
10]. Temperature variations on the surface of the sample, due to the small depth of penetration into the air that fills the PA cell, lead to expansion and contraction of a thin layer of gas and form a so-called thermal piston that causes pressure fluctuations in the cell. The detection of the thermal component piston model is directly due to the process of diffusion through the sample
[
1,
2]. Temperature variations along the sample produce elastic waves within the sample, and these waves cause displacement of the sample surface that forms a mechanical piston in the PA cell. This is the cause of the thermoelastic component of the PA signal
[
3,
10]. And finally, the photogenerated carriers propagate through the sample, causing additional displacement of the sample surface, so that apart from heat sources, they affect the appearance of an additional plasmaelastic component
of the mechanical piston [
10]:
where
,
, and
- pressure, temperature and volume of photoacoustic cell cavity,
is depth of cell,
and
- sample radius and thickness like tiles,
- thermal diffusion length,
- coefficient of linear expansion,
- adiabatic ratio,
- coefficient of electronic deformation,
- distribution of the temperature of the rear side of sample - non-illuminated side,
- distribution of temperature in the sample,
- distribution of excess carrier (holes) in the semiconductor.
Therefore, the total photoacoustic signal of a semiconductor is the sum of three components with different dominant effects:
The development of a complex direct theoretical mathematical model that includes all dominant effects enables obtaining functional multi-parameter dependence, i.e., determining the total photoacoustic signal as a functional dependence of various properties of matter, from optical, mechanical, thermal, elastic, electronic, and all other properties that are related to them. The direct model set up in this way enables the inverse solution of the photoacoustic problem, that is, the determination of the properties of matter and the environment that are directly included in the consideration. The advantage of the photoacoustic method is that a signal that is multi-parameter dependent can be obtained with one measurement, and the disadvantage is that inverse solving is an ill-posed problem of mathematical physics, because it can have several equal solutions, only one of which can correspond to the physics of the problem.
Therefore, the nonlinear dependence of the total photoacoustic signal on the parameters of thermal diffusivity
, linear expansion
, conductivity
, coefficient of electronic deformation
, carrier lifetime
, surface recombination rate
and
, absorption
, gap energy
, photon energy
, adiabatic ratio
, as well as many others can be analyzed and solved inversely. The advantage of artificial intelligence in inverse photoacoustic solving enables a different approach compared to numerical and analytical solutions, and properties can be determined very precisely and in real time, Eq1-4,
Appendix A and
Appendix B.
The inverse resolution of the photoacoustic signal of semiconductor, n-type silicon showed that the parameters can be determined very precisely from the amplitude-phase characteristic. Here we will show that only from the phase characteristic can the properties of thermal diffusion , linear expansion and thickness be determined by developed neural networks. Usually, we include one control parameter, which in this case is the thickness of the sample .
3. Silicon n-Type Phase Neural Network
Machine learning, as a field of artificial intelligence, is a discipline that plays an important role in the development of learning mechanisms in solving practical problems. The basic requirement of this development of neural networks is usability and application potential. The used method in machine learning, which was developed based on the logic of PA, is suitable because it is based on physical considerations and logic that are precisely mathematically defined [
1,
2,
3,
10] and leads to the formation of unique conclusions. The direct photoacoustic problem is solved by developing a theoretical mathematical model Eq1-4, as a non-linear problem in the multi-parameter space of the model parameters
,
,and
l, where the inverse solution using the standard procedure is possible with approximations that increase the errors solutions.
Although we have shown that neural networks are very precise on amplitude-phase characteristics, the phases of photoacoustic signals are also suitable for analysis by neural networks, because the phases have a high sensitivity. The phase neural network is trained on phase
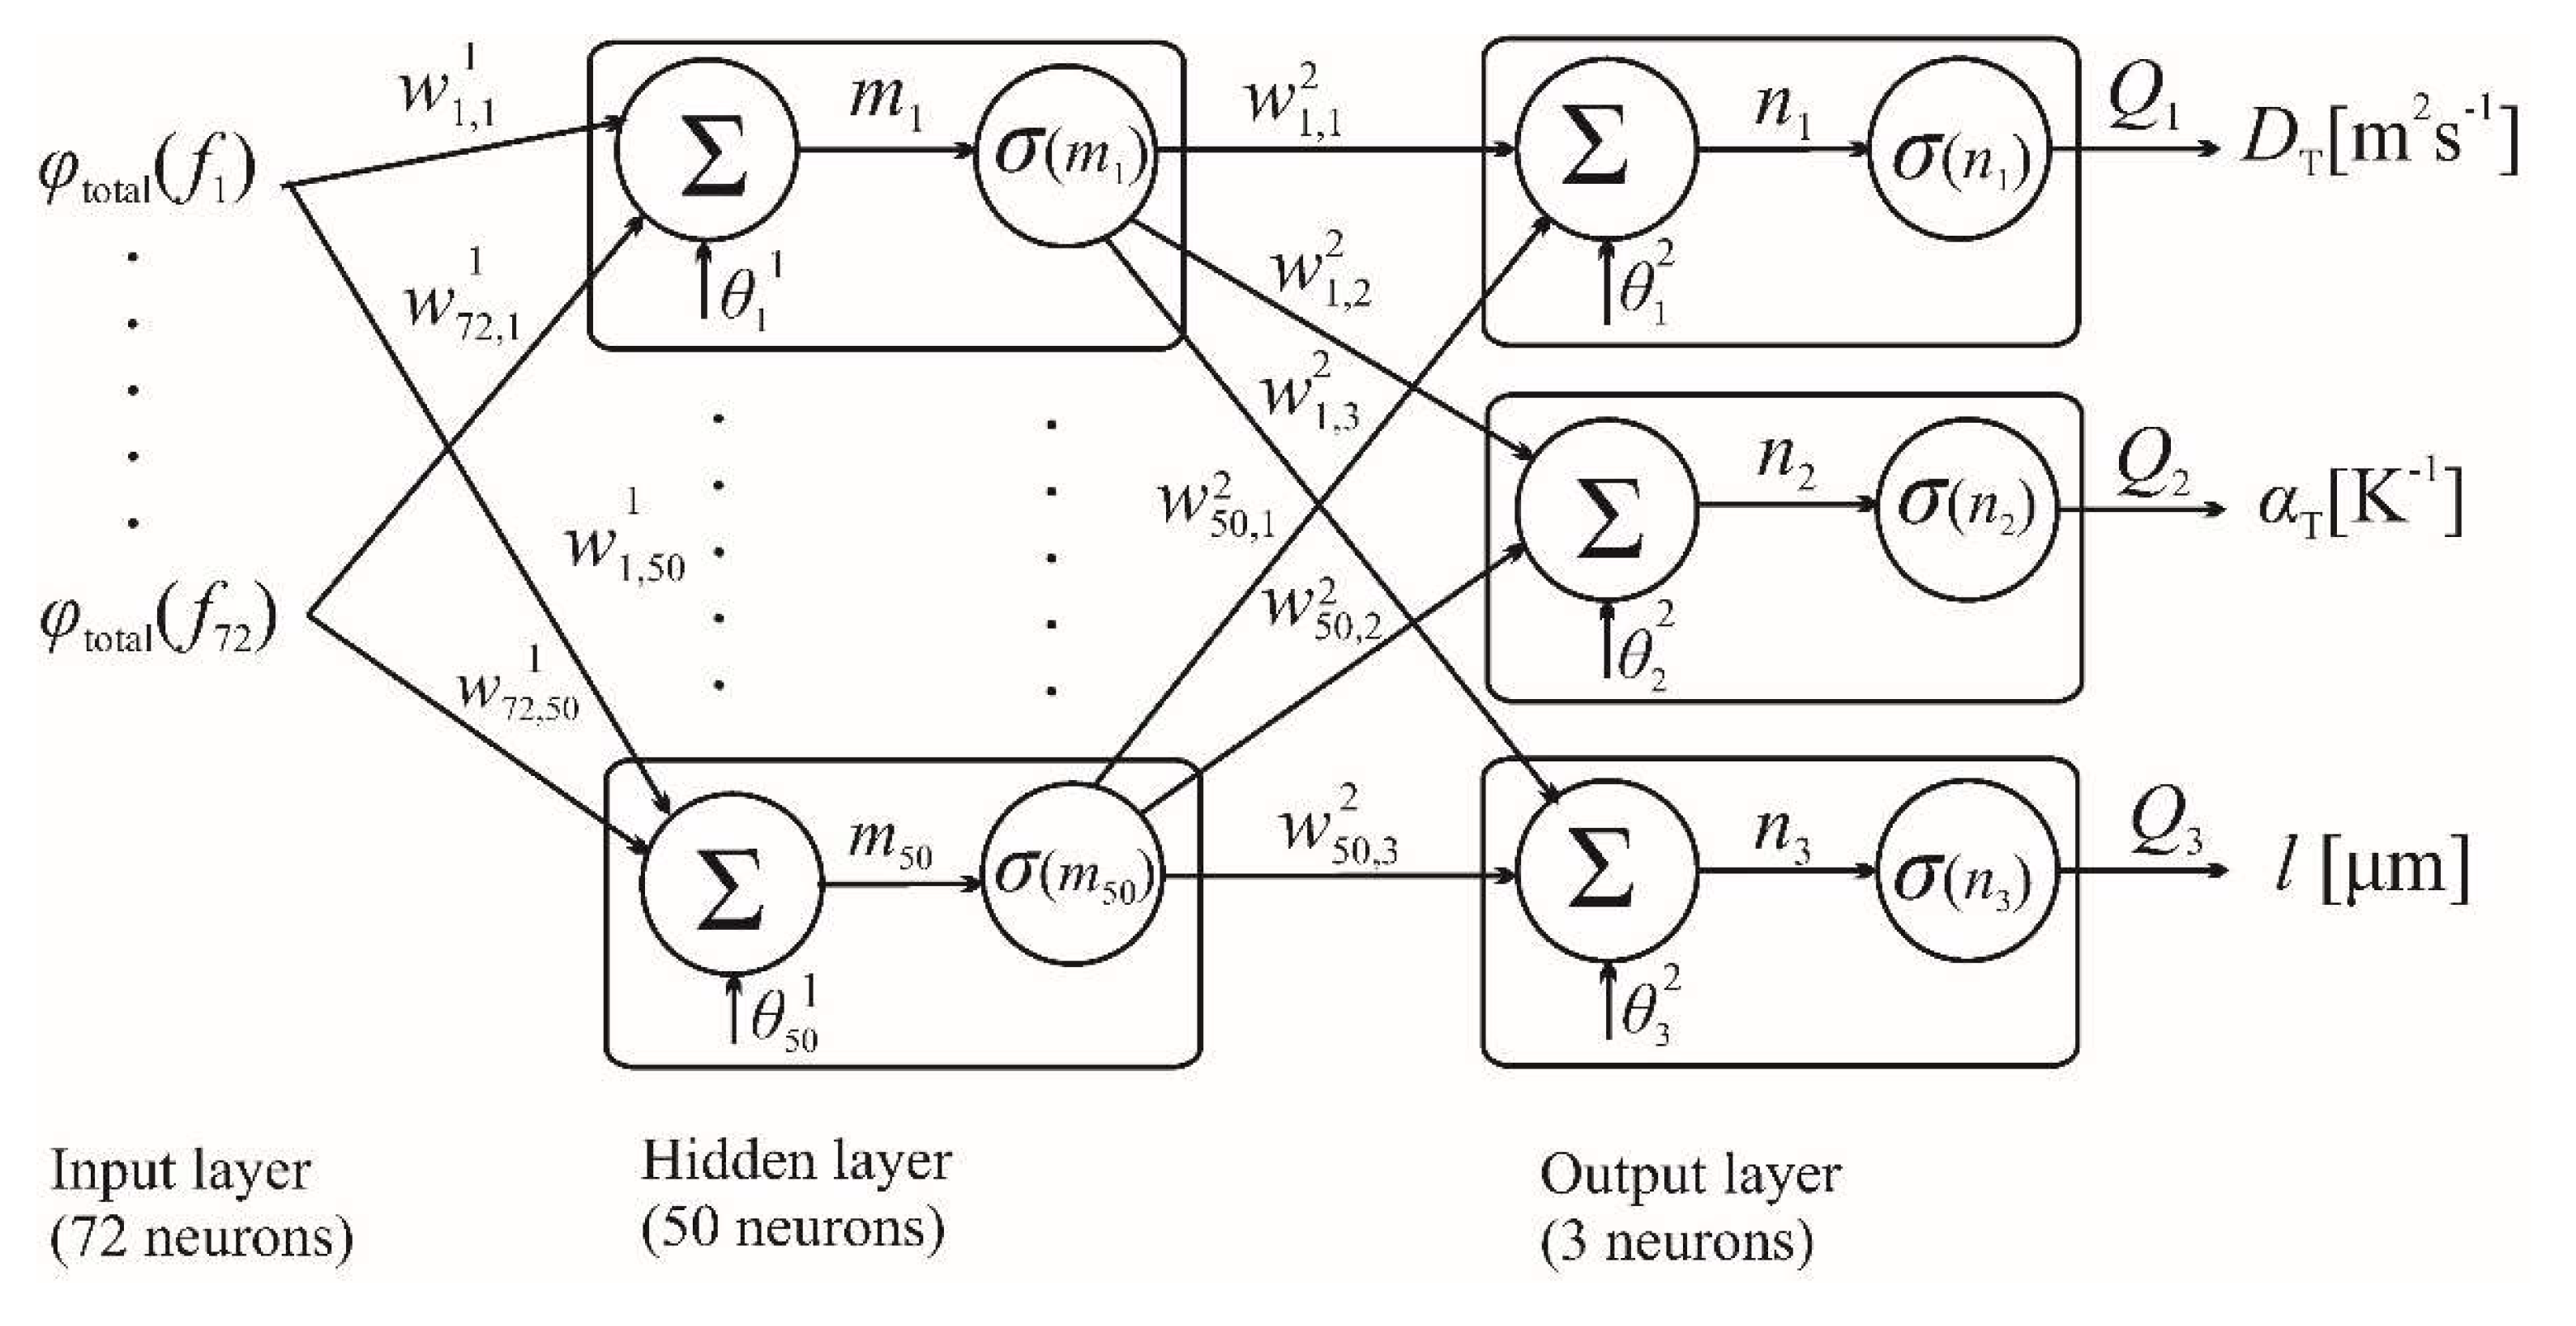
simulations in the auditory frequency domain 20Hz-20kHz, with a vector determined by 72 values at the input
, which represents the number of neurons of the input layer
Figure 1. The hidden layer
is one, where
, and the output layer is determined by three neurons
with corresponding sample parameters
,
and
. Architecture of phase neural network is shown in
Figure 1, and was used the Levenberg–Marquardt algorithm.
By simulating a theoretical mathematical model Eq.1-4, a base of 5491 lines was obtained, with variations in diffusivity and expansion around the values of pure silicon 9 x10⁻⁵m2s-1and 2.6x10⁻⁶K-1 in the range of 10% where we expect the characteristics of silicon properties. And thickness in the range of 100 to 1000 microns. For the I test, we separated every 50th lines, and formed a network on the rest of the base.
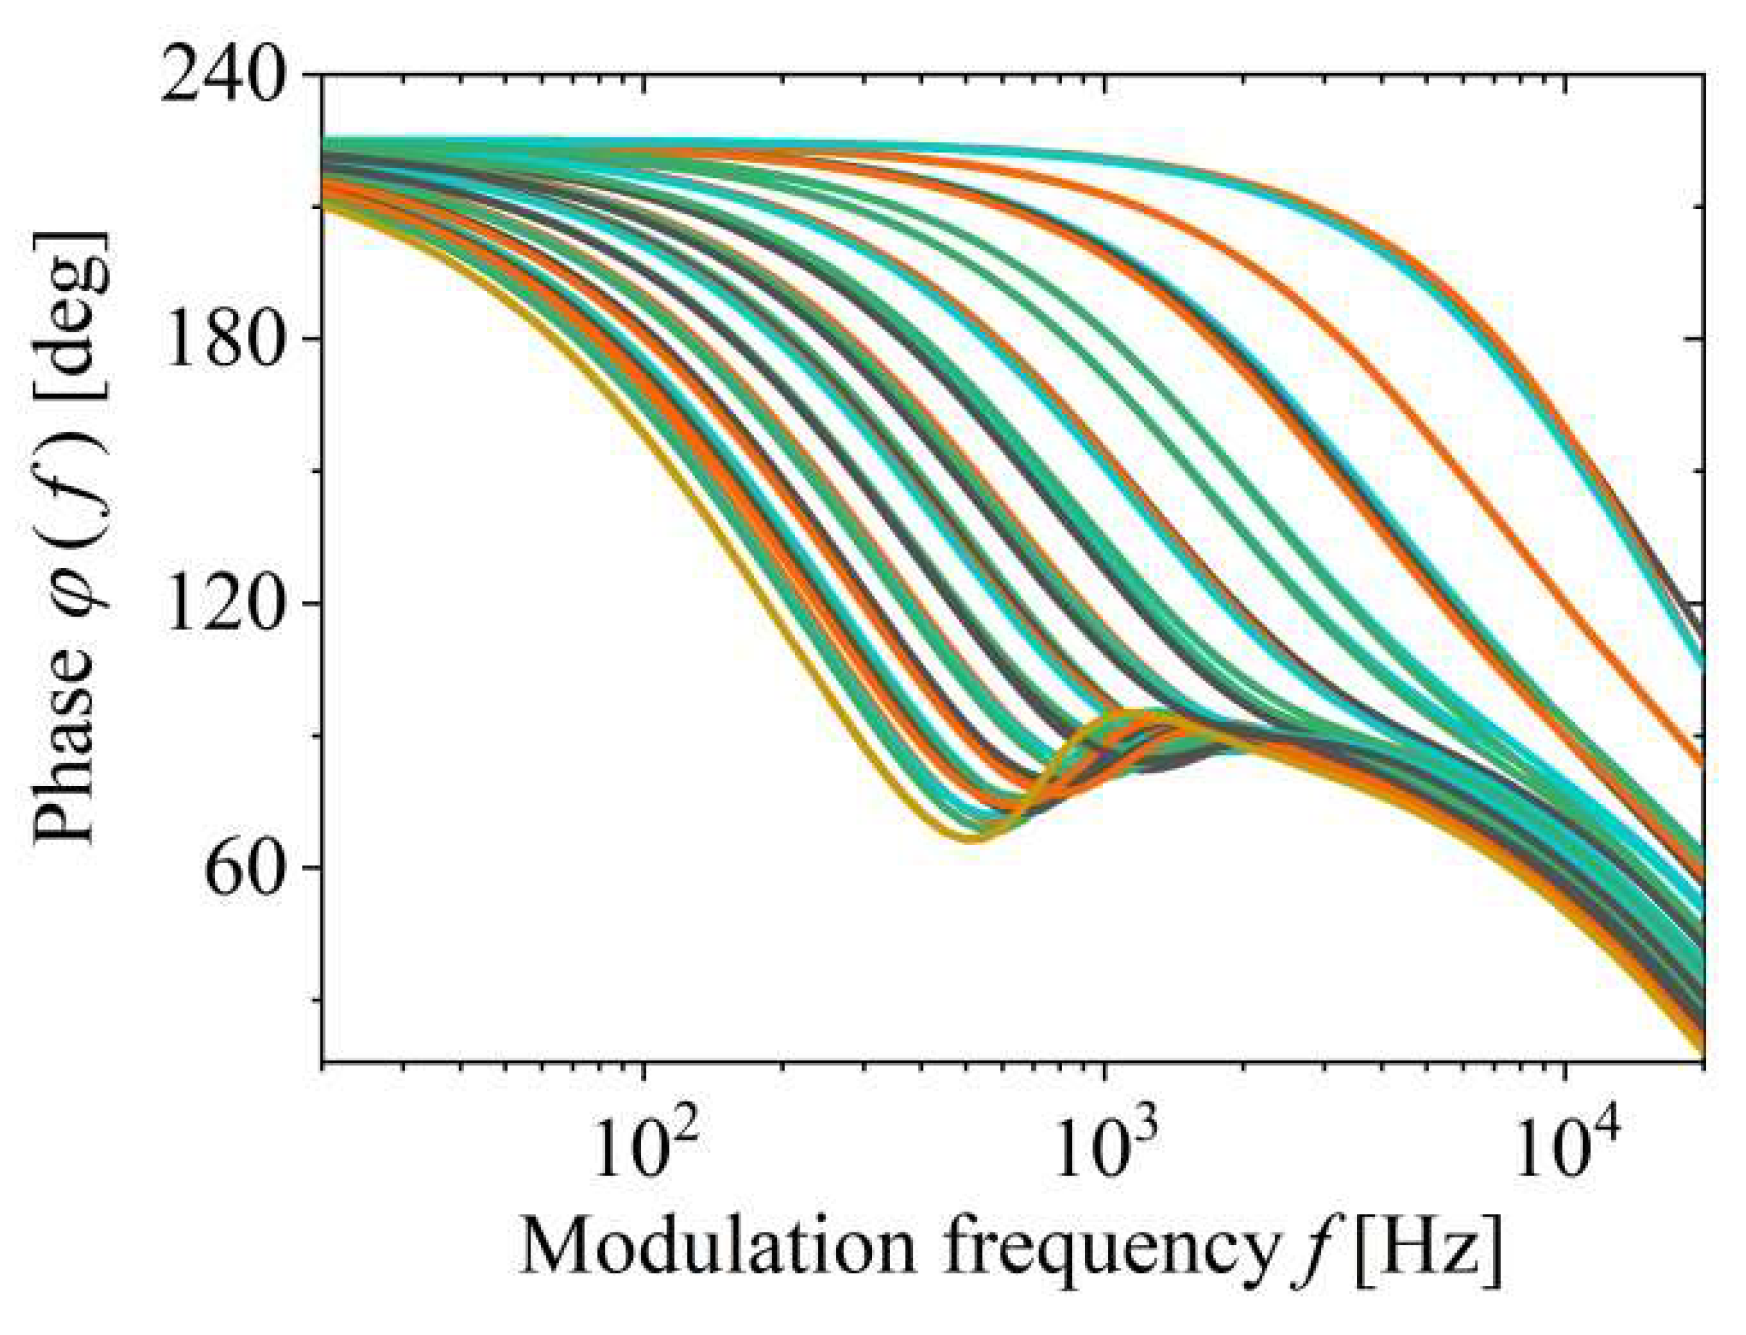
In
Figure 2. the phase base of photoacoustic signals is shown, which is used for PNN training. One of the possibilities that can happen during the training of the neural network based on the photoacoustic signals of the theoretical mathematical model is overfitting. When NNs are overfitting, they show overtraining or are too obsessed with the data, show high training performance, and high precision in prediction on known signals, but high errors in prediction on unknown signals appear. For this reason, we trained on the same stage base with different levels of % noise.
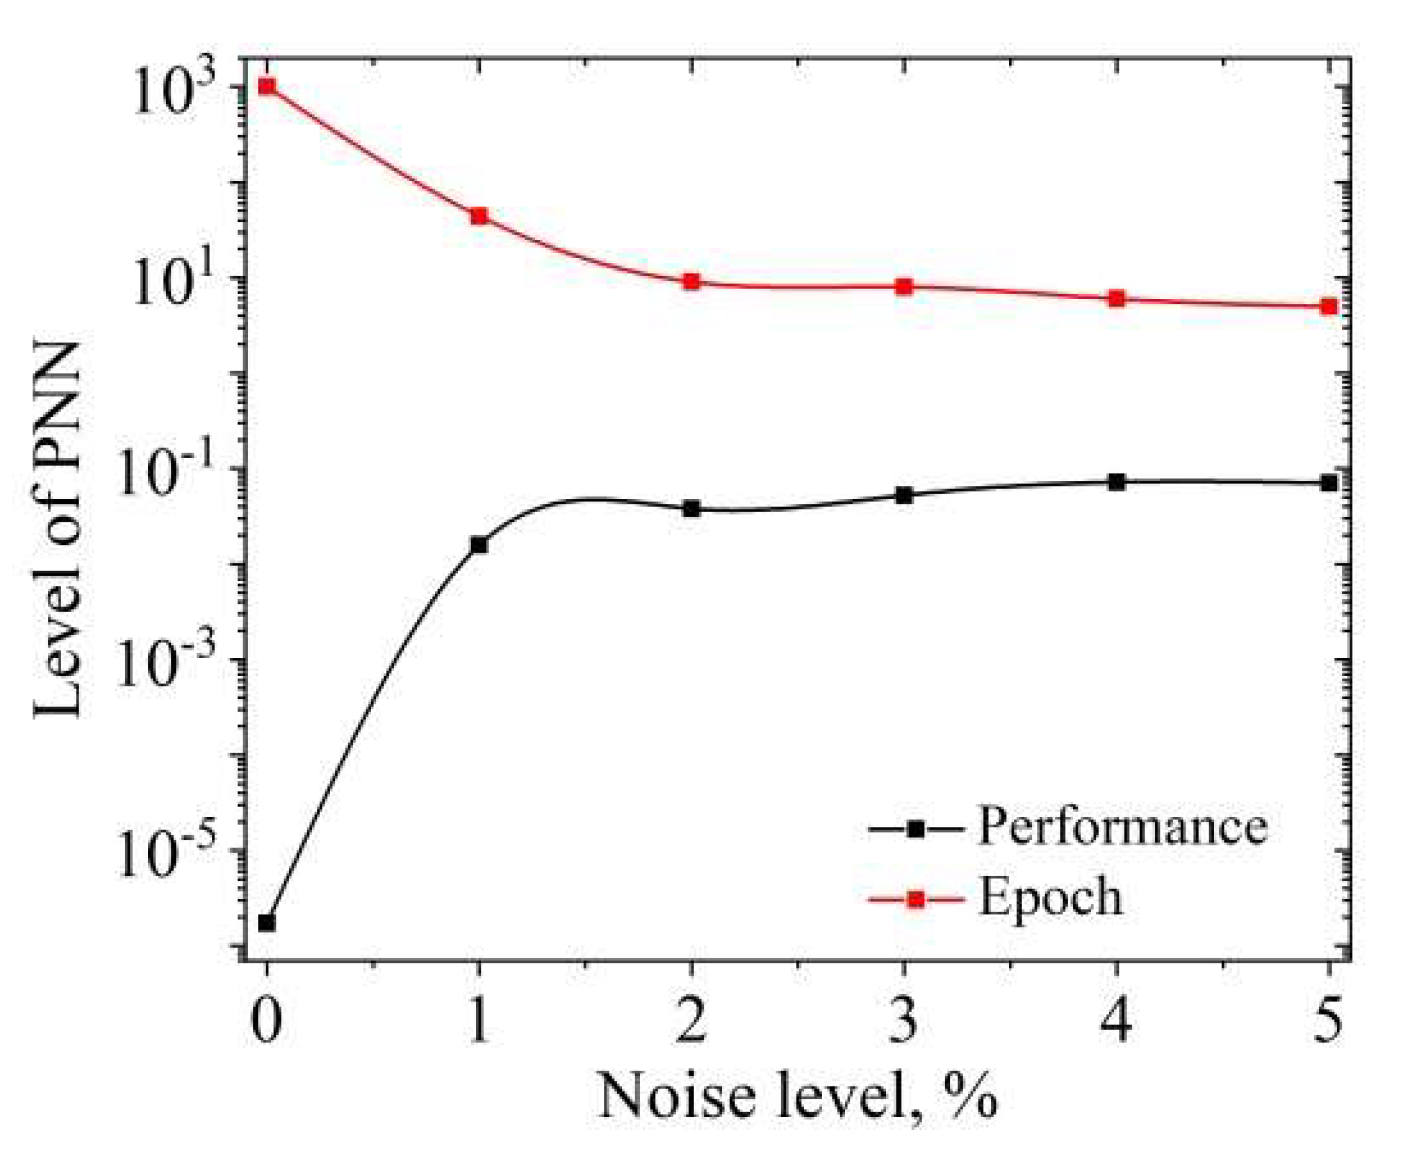
The change in training performance of a phase neural network,
Figure 3, of the same architecture and with the same input and output base data can be seen by adding a different % noise at the input, which we chose to be a random Gaussian noise, of 1 to 5%. By adding different % of noise level, leads to the effect of increasing the robustness of the data, which can be the key to achieving such an improvement of the NN, since the NN better recognize data of phase photoacoustic signal, on which the network has not been trained. This resulted in a network trained on the basis of phases NN0 and networks trained on the same basis NN1 to NN5 with 1 to 5% noise added.
Table 1 shows that if the level % of noise that is added to the input data of the base before training is increased, it leads to a decrease in the performance of neural networks NN1-NN5 compared to the original neural network NN0. On the other hand, the increase in the level % of the added nois led to a shortening of the training time, which reduced the number of epochs from 1000 (which was the termination criterion for NN training) to 5 epochs. With this, the total training time of NN was significantly shortened. It seems that increasing the level of % added noise reduced the good characteristics of the obtained networks,
Table 1,
Figure 3, but the justification of the added noise was confirmed only on the predictions of the numerical phases of the experiment.
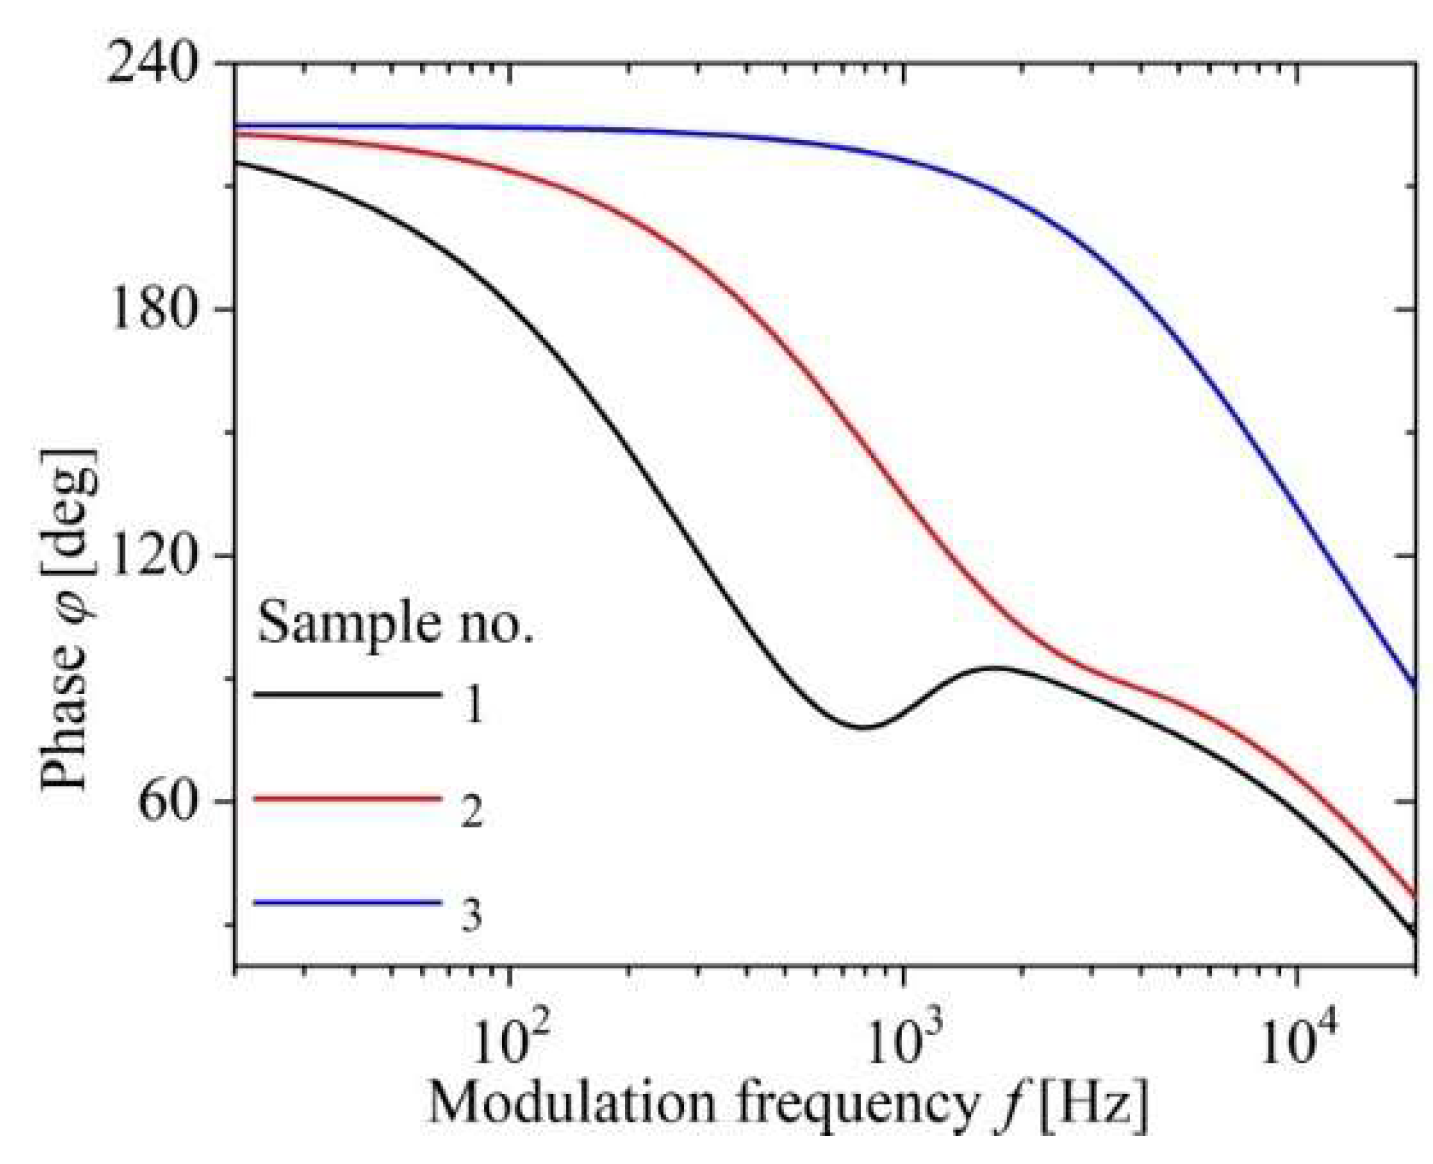
To determine which network is most reliable in predicting the data, we performed three tests. I Test on phase data of photoacoustic signals, on which the network was not trained, and were extracted from the database before training. II Test on numerically simulated data showing photoacoustic phases in the operating range of the phase neural network. III Test, is a prediction on phases of numerical experiments of three samples, no. 1,2 and 3.
4. Inverse Solution of the Photoacoustic Problem
The accuracy of PNN operation with different % noise level can be analyzed in three different tests, on bases formed in different ways. The base for the I Test was formed by extracting the signal from the base obtained by the numerical simulation of the model in the range of parameter changes of 10% from the reference values of pure Si. Every 50th signals were extracted from the base, a total of 110 signals. The basis for the II Test was formed by numerically random selection of parameters, and in the range of PNN operation. The basis for the III set is a numerical experiment for three signals of samples of the same composition of matter, but of different thicknesses.
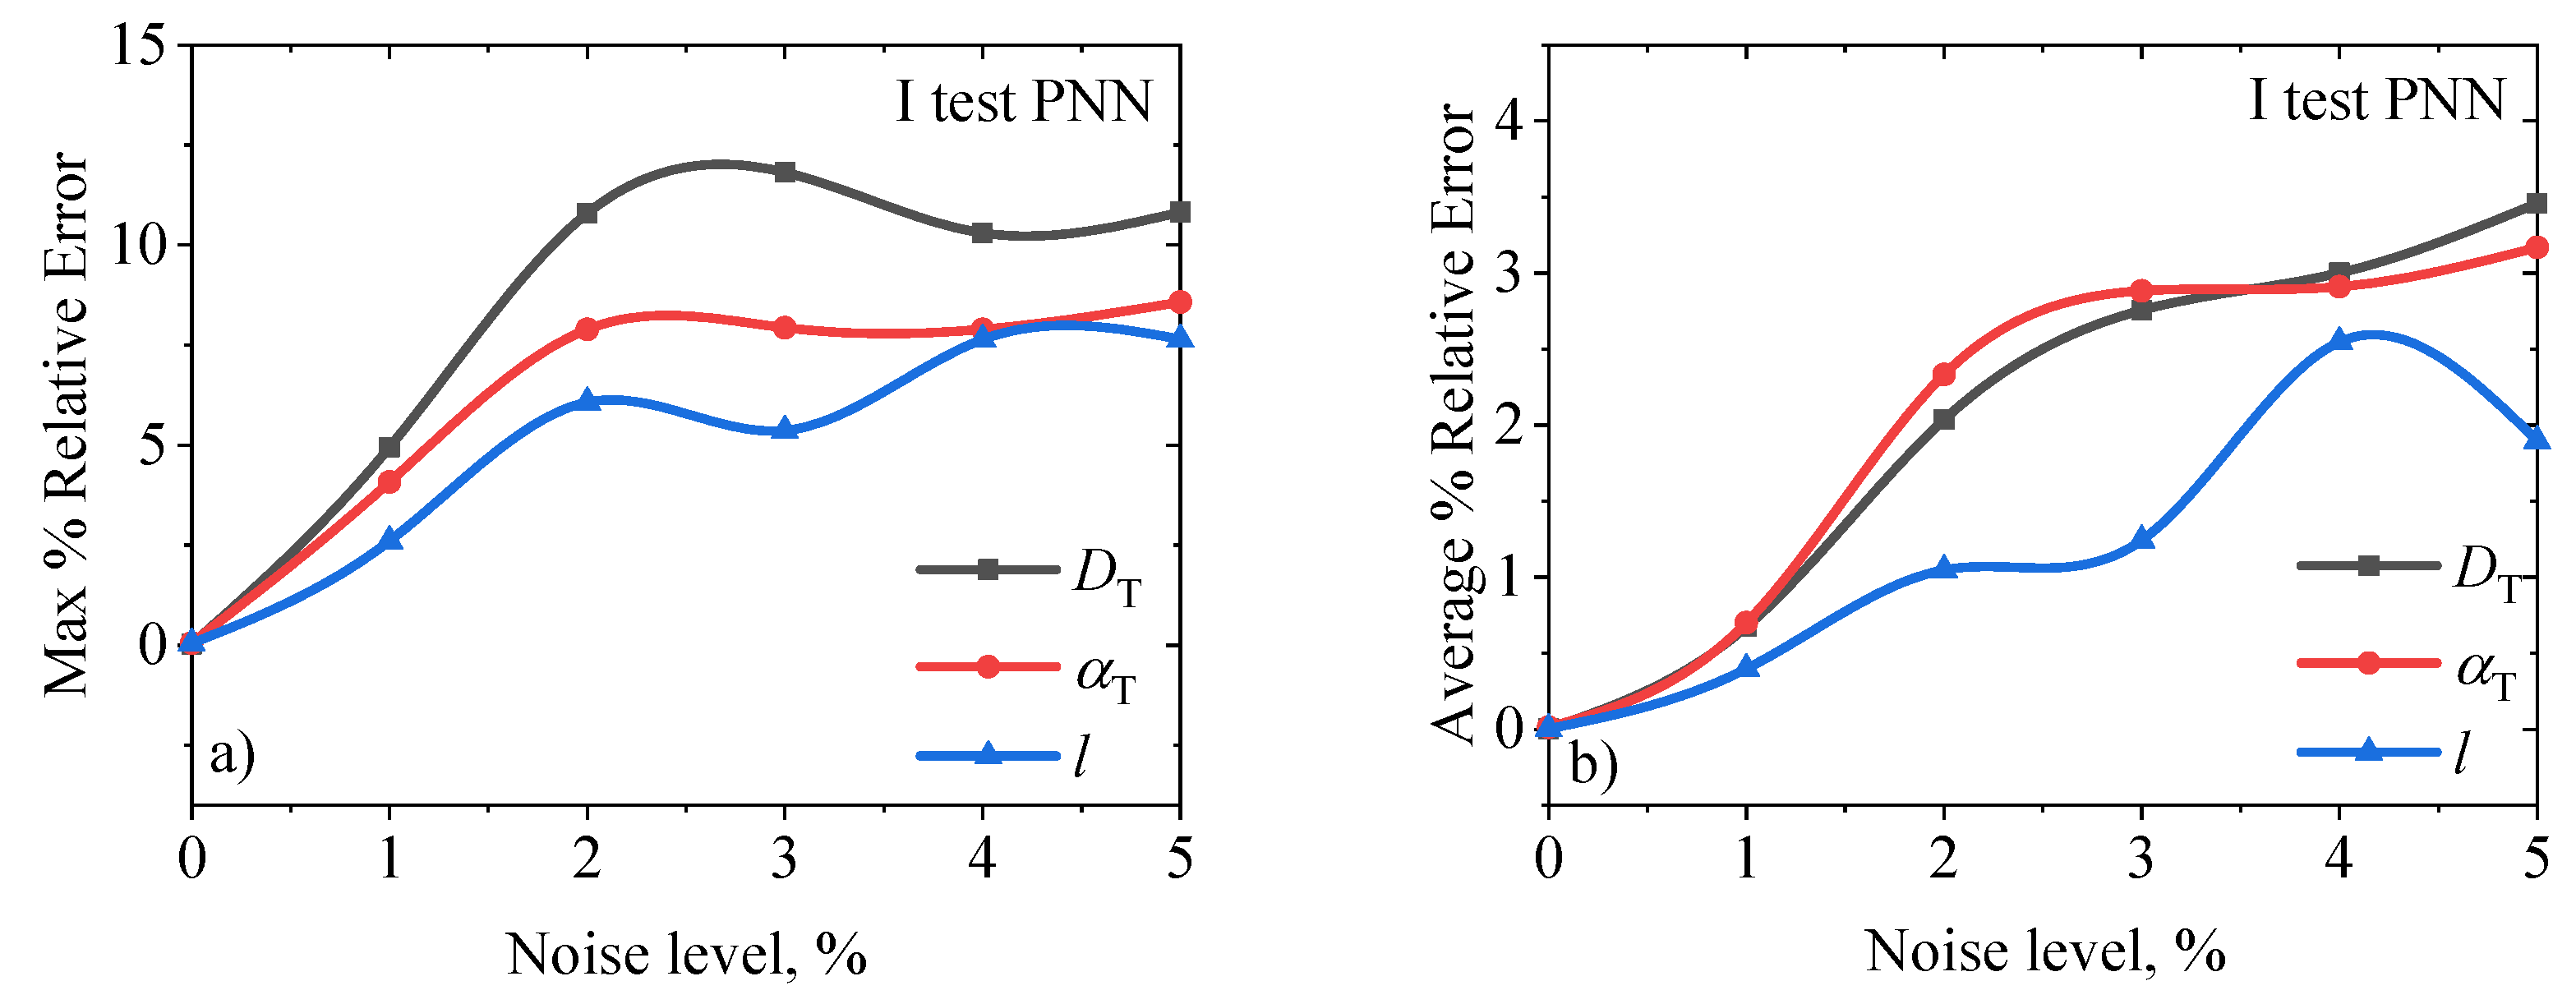
I test on the phases of 110 photoacoustic signals, show that the network with the lowest noise level NN0, has the lowest error and error of the maximum % and average % tends to increase in the prediction of diffusivity
, expansion
and thickness
, with an increase in the level of % added noise,
Figure 4, and
Table 2.
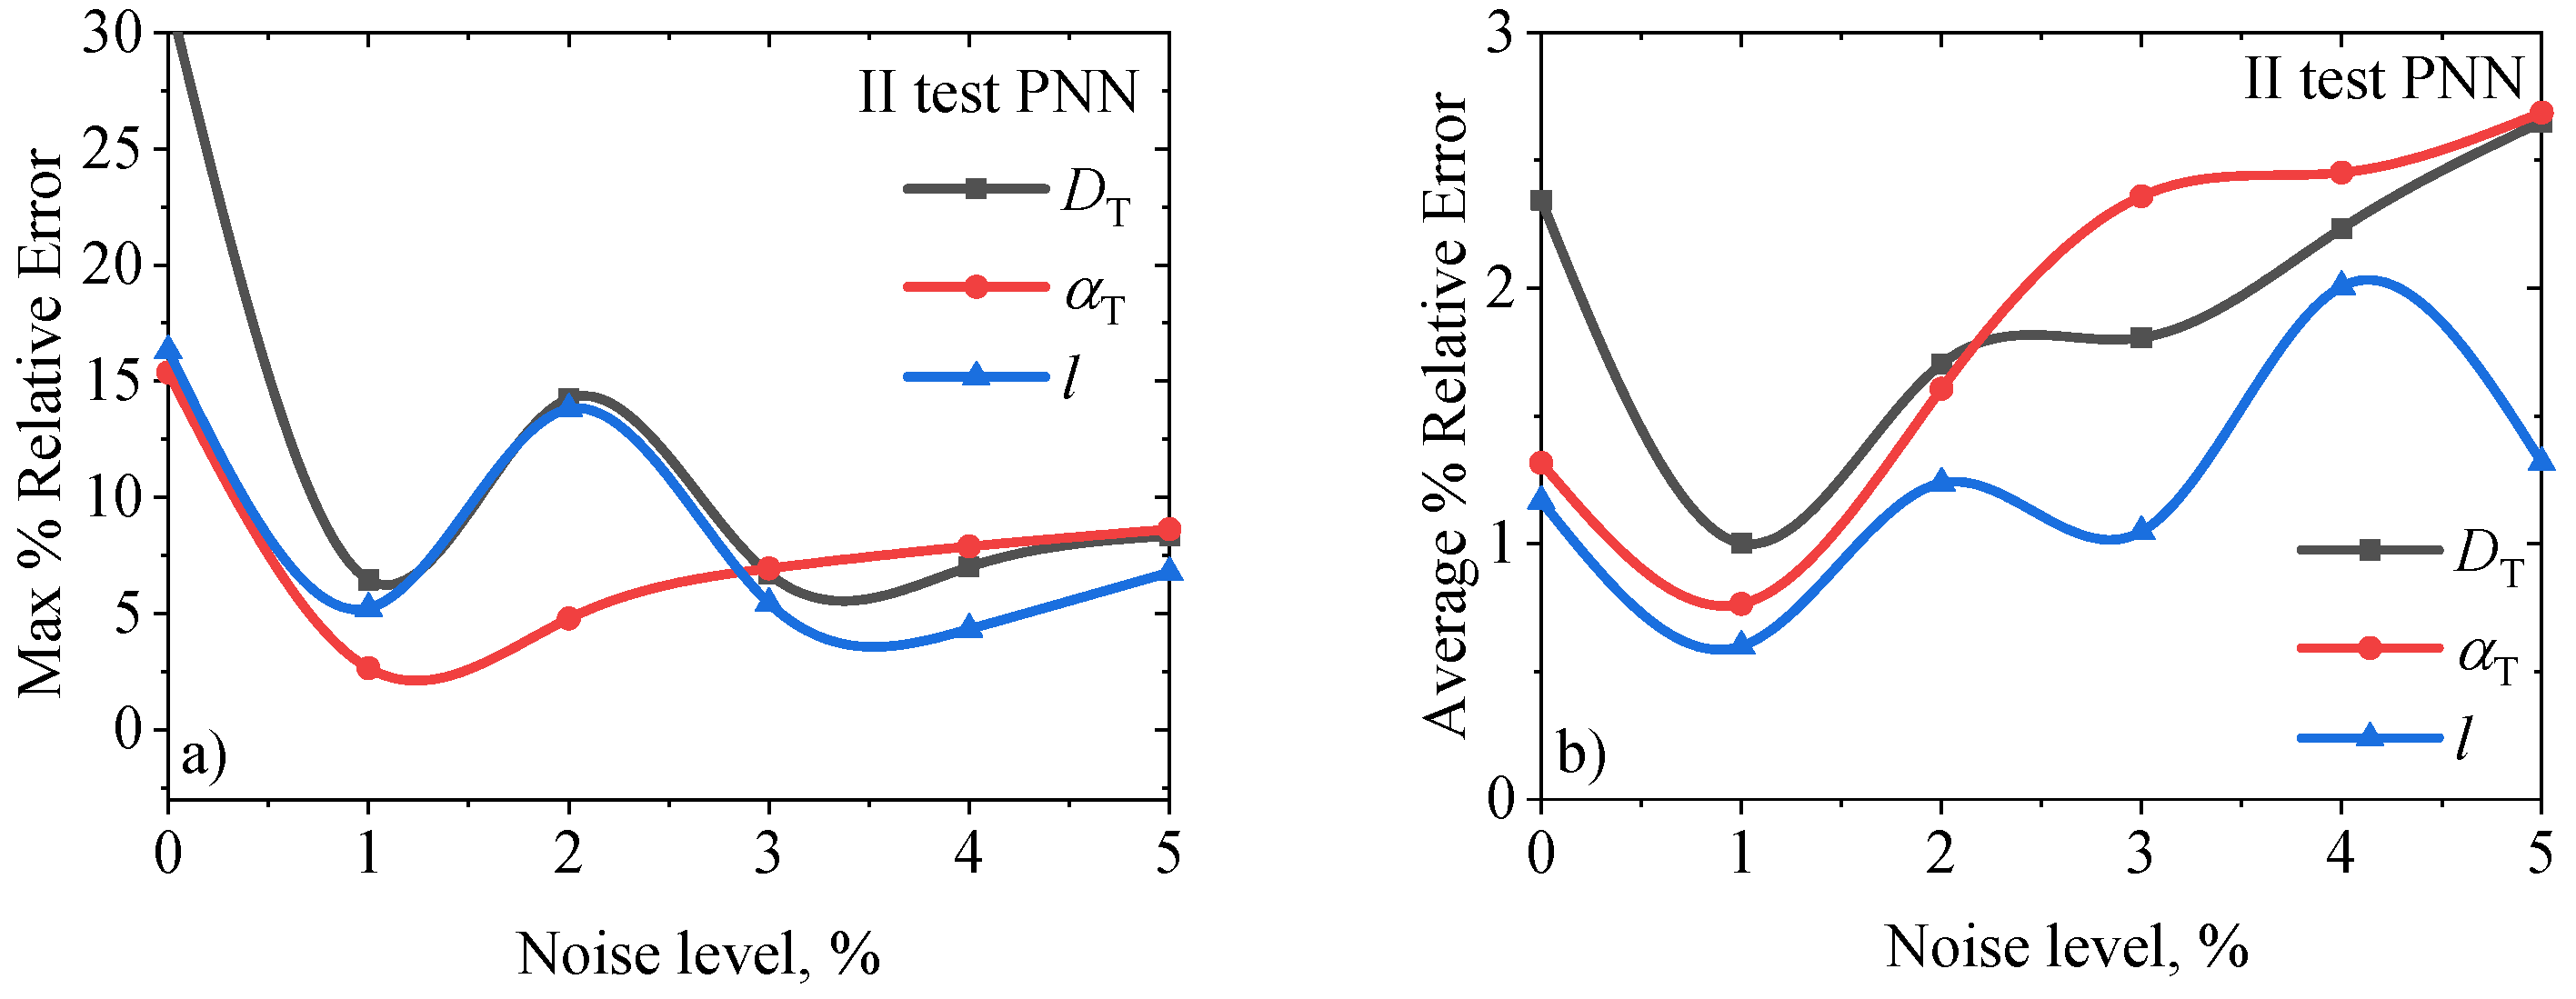
II test is a test on phases randomly selected from the range of the parameter. The network without added noise has the largest error on the phases of samples of small thicknesses. By adding noise (1%) thin sample errors are reduced to the optimal level for this test and then (>1%) tend to increase.
Justification of adding noise in different % level, led to an increase in the robustness of the data (signal), i.e.
, it prevented overfitting during the training of the NN1-5 network, which can be seen on the parameter predictions of the NN0-NN5 networks on the signal phases of the numerical experiments, sample no.1-3. The prediction values of the diffusion, linear expansion and thickness, parameters are given in
Table 4, in the blue columns, while the values of the relative % prediction errors are given in the white columns.
Table 4 establishes that the parameter prediction by the NN0 network has satisfactory precision (small relative % error) on samples no. 1 and 2, while the lowest precision in the recognition of the parameter from the phase of sample no. 3 is from 15 to 31% relative error. Parameter predictions by networks NN1-5 are such that the precision in guessing parameters from sample phases no.1 and 2 is satisfactory (small variations compared to prediction by network NN0 which are <1%), while the precision of parameter prediction from sample phase no. 3 has a tendency to increase, which can be seen in
Figure 6.
Figure 7 shows the results of relative % errors of predictions of three parameters a) diffusion, b) expansion and c) thickness of three samples no.1 with black line, no. 2 with the red line and no. 3 with the blue line,
Table 4, from the phases of the photoacoustic signals. Where actually at a higher % noise level, from 3 to 3.5%, the optimal NN can be determined, which simultaneously determines precisely in the prediction of all three parameters of diffusion, expansion and thickness, with a relative % error <2.5%.
4. Disscusion and Conclusions
One of the conclusions is that data with a very small or non-existent % of noise can lead to the formation of a NN that is in overfitting, i.e., due to its excessive adaptation to the data in training, it has high precision on known data, I Test, and low precision on unknown data, III Test.
In fact, the procedure of adding different levels of % noise to the input data, led to an increase in the robustness of the input data, photoacoustic signals, which leads to such an adjustment of weights and gradients during training so that it does not lead to an increase in the performance of the formed networks. The formed NNs were trained in a shorter time, and they increased better prediction of data that have a variation compared to basic database data. In some way, by adding noise to the input data of the database, there was an easier prediction of the input data, or a reduction of errors in the variation of the input data.
The application of this methodology of adding noise in the preparation of networks that are formed on the data of a mathematical-theoretical model leads to an easier application of NN in predictions on real data, photoacoustic signals. The analysis determines a more general network, or rather the range of added noise in which the data, photoacoustic signals are recognized with better precision. The range of added noise in % is from 3 to 3.5, for phase NN on photoacoustic signals. In this way, we have determined the range of % of noise in which the phase is NN has better optimization compared to NN0.
The phase network without added noise shows a large error (15-30)% of the parameter prediction. By adding noise, the prediction error drops to optimal (<2.5%) for networks (3.4)% noise.
Finally, our results are shown that an neural network trained on large data set of theoretically simulated n-type silicon photoacoustic phases with added Gaussian noise can be a powerful tool for simultaneous, reliable and precise determination of thermal diffusivity, thermal expansion, and thickness of a semiconductor sample in real time.
Author Contributions
For research articles with several authors, a short paragraph specifying their individual contributions must be provided. The following statements should be used “Conceptualization, M.D., S.G. and K.D.; methodology, M.D. and K.D.; software, K.D.; validation, M.D., S.G., D.M., E.S., and K.D.; formal analysis, M.D., S.G., D.M., E.S., and K.D.; investigation, M.D., S.G., D.M., E.S., and K.D.; resources, E.S. and S.G.; writing—original draft preparation, M.D., S.G. and K.D.; writing—review and editing, M.D., S.G. and K.D.; visualization, M.D. and K.D.; supervision, D.M. and E.S.; project administration, E.S.; funding acquisition, E.S. and S.G.;
Funding
This research received no external funding.
Data Availability Statement
The data that support the findings of this study are available from the corresponding author upon reasonable request.
Acknowledgments
The authors are grateful to the Ministry of Science, Technological Development and Innovations of the Republic of Serbia (Contract No. 451-03-47/2024-01/200017) for the financial support.
Conflicts of Interest
The authors declare no conflicts of interest.
References
- Rosencwaig, A.; Gerscho, A. Photoacoustic Effect with Solids: A Theoretical Treatment. Science 1975, 4214, 556–557. [Google Scholar] [CrossRef]
- Rosencwaig, A.; Gersho, A. Theory of the photoacoustic effect with solids. J. Appl. Phys. 1976, 47, 64–69. [Google Scholar] [CrossRef]
- Todorovic, D.; Nikolic, P. Investigation of carrier transport processes in semiconductors by the photoacoustic frequency transmission method. Opt. Eng. 1997, 36, 432–445. [Google Scholar] [CrossRef]
- Tam, A.C. Applications of photoacoustic sensing techniques. Rev. Mod. Phys. 1986, 58, 381–431. [Google Scholar] [CrossRef]
- Sarode, A.P; Mahajan, O.H. Theoretical Aspects of Photoacoustic Effect with Solids: A Review. IJSART 2018, 4, 1237–1242. [Google Scholar] [CrossRef]
- Park, H.K.; Grigoropoulos, C.P.; Tam, A.C. Optical measurements of thermal diffusivity of a material. Int. J. Thermophys. 1995, 16, 973–995. [Google Scholar] [CrossRef]
- Vargas, H.; Miranda, L.C.M. Photoacoustic and related photothermal techniques. Phys. Rep. 1988, 161, 43–101. [Google Scholar] [CrossRef]
- Bialkowski, S. Photothermal Spectroscopy Methods for Chemical Analysis; John Wiley: New York, NY, USA, 1996; ISBN 978-1-119-27907-5. [Google Scholar]
- Isaiev, M.; Mussabek, G.; Lishchuk, P.; Dubyk, K.; Zhylkybayeva, N.; Yar-Mukhamedova, G.; Lacroix, D.; Lysenko, V. Application of the Photoacoustic Approach in the Characterization of Nanostructured Materials. Nanomater. 2022, 12, 4. [Google Scholar] [CrossRef] [PubMed]
- Mandelis, A. P. Hess, Semiconductors and Electronic Materials, in, SPIE Opt.Eng.Press, Belingham, Washington, 2000.
- Pichardo-Molina, J.L.; Gutiérrez-Juárez, G.; Huerta-Franco, R.; Vargas-Luna, M.; Cholico, P.; Alvarado-Gil, J.J. Open Photoacoustic Cell Technique as a Tool for Thermal and Thermo-Mechanical Characterization of Teeth and Their Restorative Materials, Int. J. Thermophys. 2005, 26, 243–253. [Google Scholar] [CrossRef]
- Dubyk, K.; Borisova, T.; Paliienko, K.; Krisanova, N.; Isaiev, M.; Alekseev, S.; Skryshevsky, V.; Lysenko, V.; Geloen, A. Bio-distribution of Carbon Nanoparticles Studied by Photoacoustic Measurements. Nanoscale ResLett. 2022, 17, 127. [Google Scholar] [CrossRef] [PubMed]
- Markushev, D.D.; Ordonez-Miranda, J.; Rabasovic, M.D.; Chirtoc, M.; Todorović, D.M.; Bialkowski, S.E.; Korte, D.; Franko, M. Thermal and elastic characterization of glassy carbon thin films by photoacoustic measurements. Eur. Phys. J. Plus 2017, 132, 33. [Google Scholar] [CrossRef]
- Djordjević, K.Lj.; Galović, S.P.; Popović, M.N.; Nešić, M.V.; Stanimirović, I.P.; Stanimirović, Z.I.; Markushev, D.D. Use neural network in photoacoustic measurement of thermoelastic properties of aluminum foil. Meas. 2022, 199, 111537. [Google Scholar] [CrossRef]
- Lishchuk, P.; Andrusenko, D.; Isaiev, M.; Lysenko, V.; Burbelo, R. J. Photoacoustic characterization of nanowire arrays formed by metal-assisted chemical etching of crystalline silicon substrates with different doping level. Thermophys 2015, 36, 2428–2428. [Google Scholar] [CrossRef]
- Djordjević, K.Lj.; Stoisavljević, Z.Z.; Dragaš, M.A.; Stanimirović, I.; Stanimirović, Z.; Suljovrujic, E.; Galović, S.P. Application of neural network to study of frequency range effect to photoacoustic measurement of thermoelastic properties of thin aluminum samples. Meas. 2024, 236, 115043. [Google Scholar] [CrossRef]
- Florian, R.; Pelzl, J.; Rosenberg, M.; Vargas, H.; Wernhardt, R. Photoacoustic Detection of Phase Transitions. Phys. Status Solidi. A, Applied Research 1978, 48, K35–K38. [Google Scholar] [CrossRef]
- Olenka, L.; Nogueiran, E.S.; Medina, A.N; Baesso, M.L.; Bento, A.C.; Muniz, E.C.; Rubira, A.F. Photoacoustic study of PET films and fibers dyed in supercritical CO2 reactor, Rev. Sci. Instrum. 2003, 74, 328–330. [Google Scholar] [CrossRef]
- Astrath, N.G.C.; Astrath, F.B.G.; Shen, J.; Lei, C.; Zhou, J.; Sheng Liu, Z.; Navessin, T.; Baesso, M.L.; Bento, A.C. ; An open-photoacoustic-cell method for thermal characterization of a two-layer system, J. Appl. Phys. 2010, 107. [Google Scholar] [CrossRef]
- Mandelis, A.; Royce, B.S.H. Relaxation time measurements in frequency and time-domain photoacoustic spectroscopy of condensed phases, J. Opt. Soc. Am. 1980, 70, 474–480. [Google Scholar] [CrossRef]
- Lishchuk, P.; Isaiev, M.; Osminkina, L.; Burbelo, R.; Nychyporuk, T.; Timoshenko, V. Photoacoustic characterization of nanowire arrays formed by metal-assisted chemical etching of crystalline silicon substrates with different doping level, Physica E: Low-Dimens. Syst. Nanostructures 2019, 107, 131–136. [Google Scholar] [CrossRef]
- Djordjevic K., Lj.; Milicevic, D.; Galovic S., P.; Suljovrujic, E.; Jacimovski S., K.; Furundzic, D.; Popovic, M. Photothermal Response of Polymeric Materials Including Complex Heat Capacity. Int. J. Thermophys 2022, 43, 131–136. [Google Scholar] [CrossRef]
- Dubyk, K.; Nychyporuk, T; Lysenko, V.; Termentzidis, K.; Castanet, G.; Lemoine, F.; Lacroix, D.; Isaiev, M. hermal properties study of silicon nanostructures by photoacoustic techniques. J. Appl. Phys. 2020, 127. [Google Scholar] [CrossRef]
- Djordjević, К.Lj.; Galović, S.P.; Ćojbašić, Ž.M.; et al. Electronic characterization of plasma-thick n-type silicon using neural networks and photoacoustic response. Opt Quant Electron 2022, 54, 485. [Google Scholar] [CrossRef]
- Nesic M., V.; Popovic M., N.; Galovic S., P.; Djordjevic K., Lj.; Jordovic-Pavlovic M., I.; Miletic V., V.; Markushev D., D. Estimation of linear expansion coefficient and thermal diffusivity by photoacoustic numerical self-consistent procedure. J. Appl. Phys. 2022, 131, 105104. [Google Scholar] [CrossRef]
- Nesic, M.; Popovic, M.; Djordjevic, K.; et al. Development and comparison of the techniques for solving the inverse problem in photoacoustic characterization of semiconductors. Opt Quant Electron 2021, 53, 381. [Google Scholar] [CrossRef]
- Šoškić, Z.; Ćirić-Kostić, S.; Galović, S. , An extension to the methodology for characterization of thermal properties of thin solid samples by photoacoustic techniques, Int. J. Therm. Sci. 2016, 109, 217–230. [Google Scholar] [CrossRef]
- Herrmann, K.; Pech N., W.; Retsch, M. Photoacoustic thermal characterization of low thermal diffusivity thin films. Photoacoustics 2021, 22, 100246. [Google Scholar] [CrossRef] [PubMed]
- Bonno, B.; Zeninari, V.; Joly, L.; Parvitte, B. Study of a Thermophysical System with Two Time Constants Using an Open Photoacoustic Cell. Int J Thermophys. 2011, 32, 630–640. [Google Scholar] [CrossRef]
- Lashkari, B.; Mandelis, A. Comparison between pulsed laser and frequency-domain photoacoustic modalities: Signal-to-noise ratio, contrast, resolution, and maximum depth detectivity. Rev Sci Instrum. 2011, 82, 9. [Google Scholar] [CrossRef] [PubMed]
- Nikolić, P. M.; Ðurić, S.; Todorović, D. M.; Vasiljević-Radović, D.; Blagojević, V.; Mihajlović, P.; Urošević, D. Application of the photoacoustic method for characterization of natural galena (PbS). Phys. Chem. Miner. 2001, 28, 44–51. [Google Scholar] [CrossRef]
- Djordjevic, K.L.; Markushev, D. D.; Ćojbašić, Ž. M.; Galović, S. P. Photoacoustic measurements of the thermal and elastic properties of n-type silicon using neural networks, Silicon. Springer 2019, 12, 1289–1300. [Google Scholar] [CrossRef]
- Djordjevic, K.L.; Markushev, D. D.; Ćojbašić, Ž. M.; Galović, S. P. Inverse problem solving in semiconductor photoacoustics by neural networks. Inverse Probl. Sci. En. 2020, 2, 248–262. [Google Scholar] [CrossRef]
- Jordovic-Pavlovic, *!!! REPLACE !!!*; M., I.; Kupusinac, A. D.; Djordjevic, K. L.; Galovic, S. P.; Markushev, D. D.; Nesic, M. V.; Popovic, M. N. Computationally intelligent description of a photoacoustic detector. Opt. Quantum Electron. 2020, 52, 5. [Google Scholar] [CrossRef]
- Radiša, R.; Dučić, N.; Manasijević, S.; Marković, N.; Ćojbašić, Ž. , Casting improvement based on metaheuristic optimization and numerical simulation. FU Mech. Eng. 2017, 15, 397–411. [Google Scholar] [CrossRef]
- Ćojbašić, Ž.M.; Nikolić, V.D.; Ćirić, I.T.; Ćojbašić, L.R. Computationally intelligent modeling and control of fluidized bed combustion process. Thermal science 2011, 15, 321–338. [Google Scholar] [CrossRef]
- Djordjević, К.L.; Jordović-Pavlović, M.I.; Ćojbašić, Ž.M.; Galović, S. P.; Popović, M. N.; Nešić, M. V.; Markushev, D. D. Influence of data scaling and normalization on overall neural network performances in photoacoustics. Opt Quant Electron 2022, 54, 501. [Google Scholar] [CrossRef]
- Bento, A.C.; Mansanares, A.M.; Vargas, H.; Miranda, L.C.M. Photoacoustic Measurements of the Thermal Diffusivity of Anisotropic Samples Using the Phase Lag Method. Phys. Chem. Glasses 1989, 30, 160–162. [Google Scholar]
- Pessoa JR, O. F.; Cesar, C. L.; Patel, N. A.; Vargas, H.; Guizoni, C. C.; Miranda, L. C. M. Two-beam Photoacoustic Phase Measurement of the Thermal Diffusivity of Solids. J. Appl. Phys. 1986, 59, 1316–1318. [Google Scholar] [CrossRef]
- Cesar, C. L.; Vargas, H.; Miranda, L. C. M. Photoacoustic Microscopy of Layred Samples: Phase Detection Technique. J. Phys. D: Appl. Phys. 1985, 18, 599–608. [Google Scholar] [CrossRef]
- Ivić, Z., Zeković. Phonon hardening due to the small-polaron effect. Physica B Condens. Matter 2005, 1-4, 417–426. [Google Scholar] [CrossRef]
- Ivić, Z.; Zeković, S.; Čevizović, D.; Kostić, D.; Vujičić, G. Small-polaron resistivity of the narrow band molecular chain: The influence of phonon hardening. Physica B Condens. Matter 2005, 362, 187–192. [Google Scholar] [CrossRef]
- Čevizović, D.; Ivić, Z.; Galović, S.; Reshetnyak, A.; Chizhov, A. On the vibron nature in the system of two parallel macromolecular chains: The influence of interchain coupling. Physica B Condens. Matter 2016, 490, 9–15. [Google Scholar] [CrossRef]
- Čevizović, D.; Galović, S.; Zeković, S.; Ivić, Z. Boundary between coherent and noncoherent small polaron motion: Influence of the phonon hardening. Physica B Condens. Matter 2009, 404, 270–274. [Google Scholar] [CrossRef]
- Chevizovich, D.; Zdravkovic, S. Nonlinear Dynamics of Nanobiophysics, 1st ed.; Springer: New York, NY, USA, 2022; ISBN 978-981-19-5322-4. [Google Scholar]
Figure 1.
Representation of the perceptron network with layers.
Figure 1.
Representation of the perceptron network with layers.
Figure 2.
Frequency dependence of the phases of the theoretical mathematical model for the training of the phase neural network.
Figure 2.
Frequency dependence of the phases of the theoretical mathematical model for the training of the phase neural network.
Figure 3.
Performance of phase neural networks on the same phase basis with different level % of added noise. Tendency to decrease epoch, and increase Performance of trained PNN with different level of % noise.
Figure 3.
Performance of phase neural networks on the same phase basis with different level % of added noise. Tendency to decrease epoch, and increase Performance of trained PNN with different level of % noise.
Figure 4.
Maximum and average % error of PNNs in predicting parameters of thermal diffusivity, expansion and thickness, with different % noise levels, I test.
Figure 4.
Maximum and average % error of PNNs in predicting parameters of thermal diffusivity, expansion and thickness, with different % noise levels, I test.
Figure 5.
Max and average % parameter prediction error for thermal diffusivity, expansion and thickness from 24 random phases of photoacoustic signals, II test.
Figure 5.
Max and average % parameter prediction error for thermal diffusivity, expansion and thickness from 24 random phases of photoacoustic signals, II test.
Figure 6.
Photoacoustic phase characteristic for three different samples no. 1,2 and 3.
Figure 6.
Photoacoustic phase characteristic for three different samples no. 1,2 and 3.
Figure 7.
Relative errors %, predictions of three parameters: a) thermal diffusivity , b) linear expansion and c) sample thickness , for three different samples, III test.
Figure 7.
Relative errors %, predictions of three parameters: a) thermal diffusivity , b) linear expansion and c) sample thickness , for three different samples, III test.
Table 1.
Performance and number of epochs of networks on signals with a certain % noise level.
Table 1.
Performance and number of epochs of networks on signals with a certain % noise level.
| NN |
Noise |
performance |
epoch |
| NN0 |
0 |
0.0000017246 |
1000 |
| NN1 |
1% |
0.0158 |
44 |
| NN2 |
2% |
0.037952 |
9 |
| NN3 |
3% |
0.052391 |
8 |
| NN4 |
4% |
0.072174 |
6 |
| NN5 |
5% |
0.070721 |
5 |
Table 2.
I test: The % relative errors, max and averaged parameter prediction , and for PNN with specified % noise level.
Table 2.
I test: The % relative errors, max and averaged parameter prediction , and for PNN with specified % noise level.
| I test |
mах % error |
average % error |
|
|
|
|
|
|
| 0 |
0.0273 |
0.0542 |
0.0488 |
0.0040 |
0.0137 |
0.0041 |
| 1% |
4.9486 |
4.0797 |
2.6102 |
0.6748 |
0.7016 |
0.3984 |
| 2% |
10.7968 |
7.8927 |
6.0712 |
2.0360 |
2.3332 |
1.0478 |
| 3% |
11.8123 |
7.9326 |
5.3684 |
2.7558 |
2.8824 |
1.2435 |
| 4% |
10.3026 |
7.8952 |
7.6432 |
3.0014 |
2.9103 |
2.5467 |
| 5% |
10.8236 |
8.5714 |
7.6446 |
3.4590 |
3.1694 |
1.8964 |
| |
|
|
|
|
|
|
Table 3.
II test: The % relative errors, max and averaged parameter prediction for phasic neural networks with specified % noise level.
Table 3.
II test: The % relative errors, max and averaged parameter prediction for phasic neural networks with specified % noise level.
| II test |
mах % error |
average % error |
|
|
|
|
|
|
| 0 |
31.6433 |
15.3729 |
16.3180 |
2.3443 |
1.3165 |
1.1680 |
| 1% |
6.4489 |
2.6458 |
5.2358 |
1.0022 |
0.7648 |
0.5999 |
| 2% |
14.2476 |
4.7840 |
13.8016 |
1.7041 |
1.6064 |
1.2381 |
| 3% |
6.7114 |
6.9429 |
5.4485 |
1.8062 |
2.3598 |
1.0484 |
| 4% |
7.0108 |
7.8894 |
4.3250 |
2.2337 |
2.4526 |
2.0073 |
| 5% |
8.3557 |
8.6263 |
6.7657 |
2.6509 |
2.6872 |
1.3180 |
Table 4.
III test: Prediction of three parameters by phase neural networks (with certain % noise level) and relative % prediction error of three samples.
Table 4.
III test: Prediction of three parameters by phase neural networks (with certain % noise level) and relative % prediction error of three samples.
| PNN |
Sample no.1 |
Sample no.2 |
Sample no.3 |
| parameters |
|
|
|
|
|
|
|
|
|
| unit |
|
|
|
.. |
|
|
|
|
|
| 0% |
9.0011 |
2.6003 |
8.2997 |
8.9958 |
2.6020 |
4.1689 |
11.7889 |
2.2092 |
1.4795 |
| Rel % error |
0.0127 |
0.0135 |
0.0030 |
0.0464 |
0.0785 |
0.0265 |
30.9883 |
15.0313 |
15.5833 |
| 1% |
9.0131 |
2.5980 |
8.3060 |
9.0610 |
2.5849 |
4.1845 |
9.8674 |
2.5442 |
1.3610 |
| Rel % error |
0.1457 |
0.0777 |
0.0761 |
0.6780 |
0.5819 |
0.3777 |
9.6194 |
2.1460 |
6.3307 |
| 2% |
9.0009 |
2.5875 |
8.2861 |
9.0930 |
2.6061 |
4.1931 |
10.2581 |
2.5214 |
1.4117 |
| Rel % error |
0.0099 |
0.4800 |
0.1666 |
1.0341 |
0.2357 |
0.5538 |
13.9786 |
3.0199 |
10.2928 |
| 3%RGN |
9.0196 |
2.5876 |
8.3133 |
9.0642 |
2.6045 |
4.1918 |
9.0941 |
2.6609 |
1.3422 |
| Rel % error |
0.2183 |
0.4766 |
0.0394 |
0.7130 |
0.1749 |
0.5226 |
1.0450 |
2.3427 |
4.8579 |
| 4% |
8.9949 |
2.58092 |
8.1578 |
8.9099 |
2.6194 |
3.9900 |
8.8366 |
2.6089 |
1.2998 |
| Rel % error |
0.0569 |
0.7338 |
1.7136 |
1.0010 |
0.7477 |
4.3163 |
1.8158 |
0.3425 |
1.5488 |
| 5% |
9.0141 |
2.5802 |
8.3038 |
8.9779 |
2.5904 |
4.1616 |
8.8399 |
2.6157 |
1.2026 |
| Rel % error |
0.1566 |
0.7605 |
0.0460 |
0.2459 |
0.3692 |
0.2023 |
1.7782 |
0.6030 |
6.0439 |
|
Disclaimer/Publisher’s Note: The statements, opinions and data contained in all publications are solely those of the individual author(s) and contributor(s) and not of MDPI and/or the editor(s). MDPI and/or the editor(s) disclaim responsibility for any injury to people or property resulting from any ideas, methods, instructions or products referred to in the content. |
© 2024 by the authors. Licensee MDPI, Basel, Switzerland. This article is an open access article distributed under the terms and conditions of the Creative Commons Attribution (CC BY) license (http://creativecommons.org/licenses/by/4.0/).
