In this section, we investigate the outputs derived from the pre-training phase of the EfficientNetV2-S model. We compare the performances of various fusion models against the individual results obtained from processing SA, AiF, and depth map images separately.
5.1. Pre-Training Model
In the initial phase of our study, as detailed in
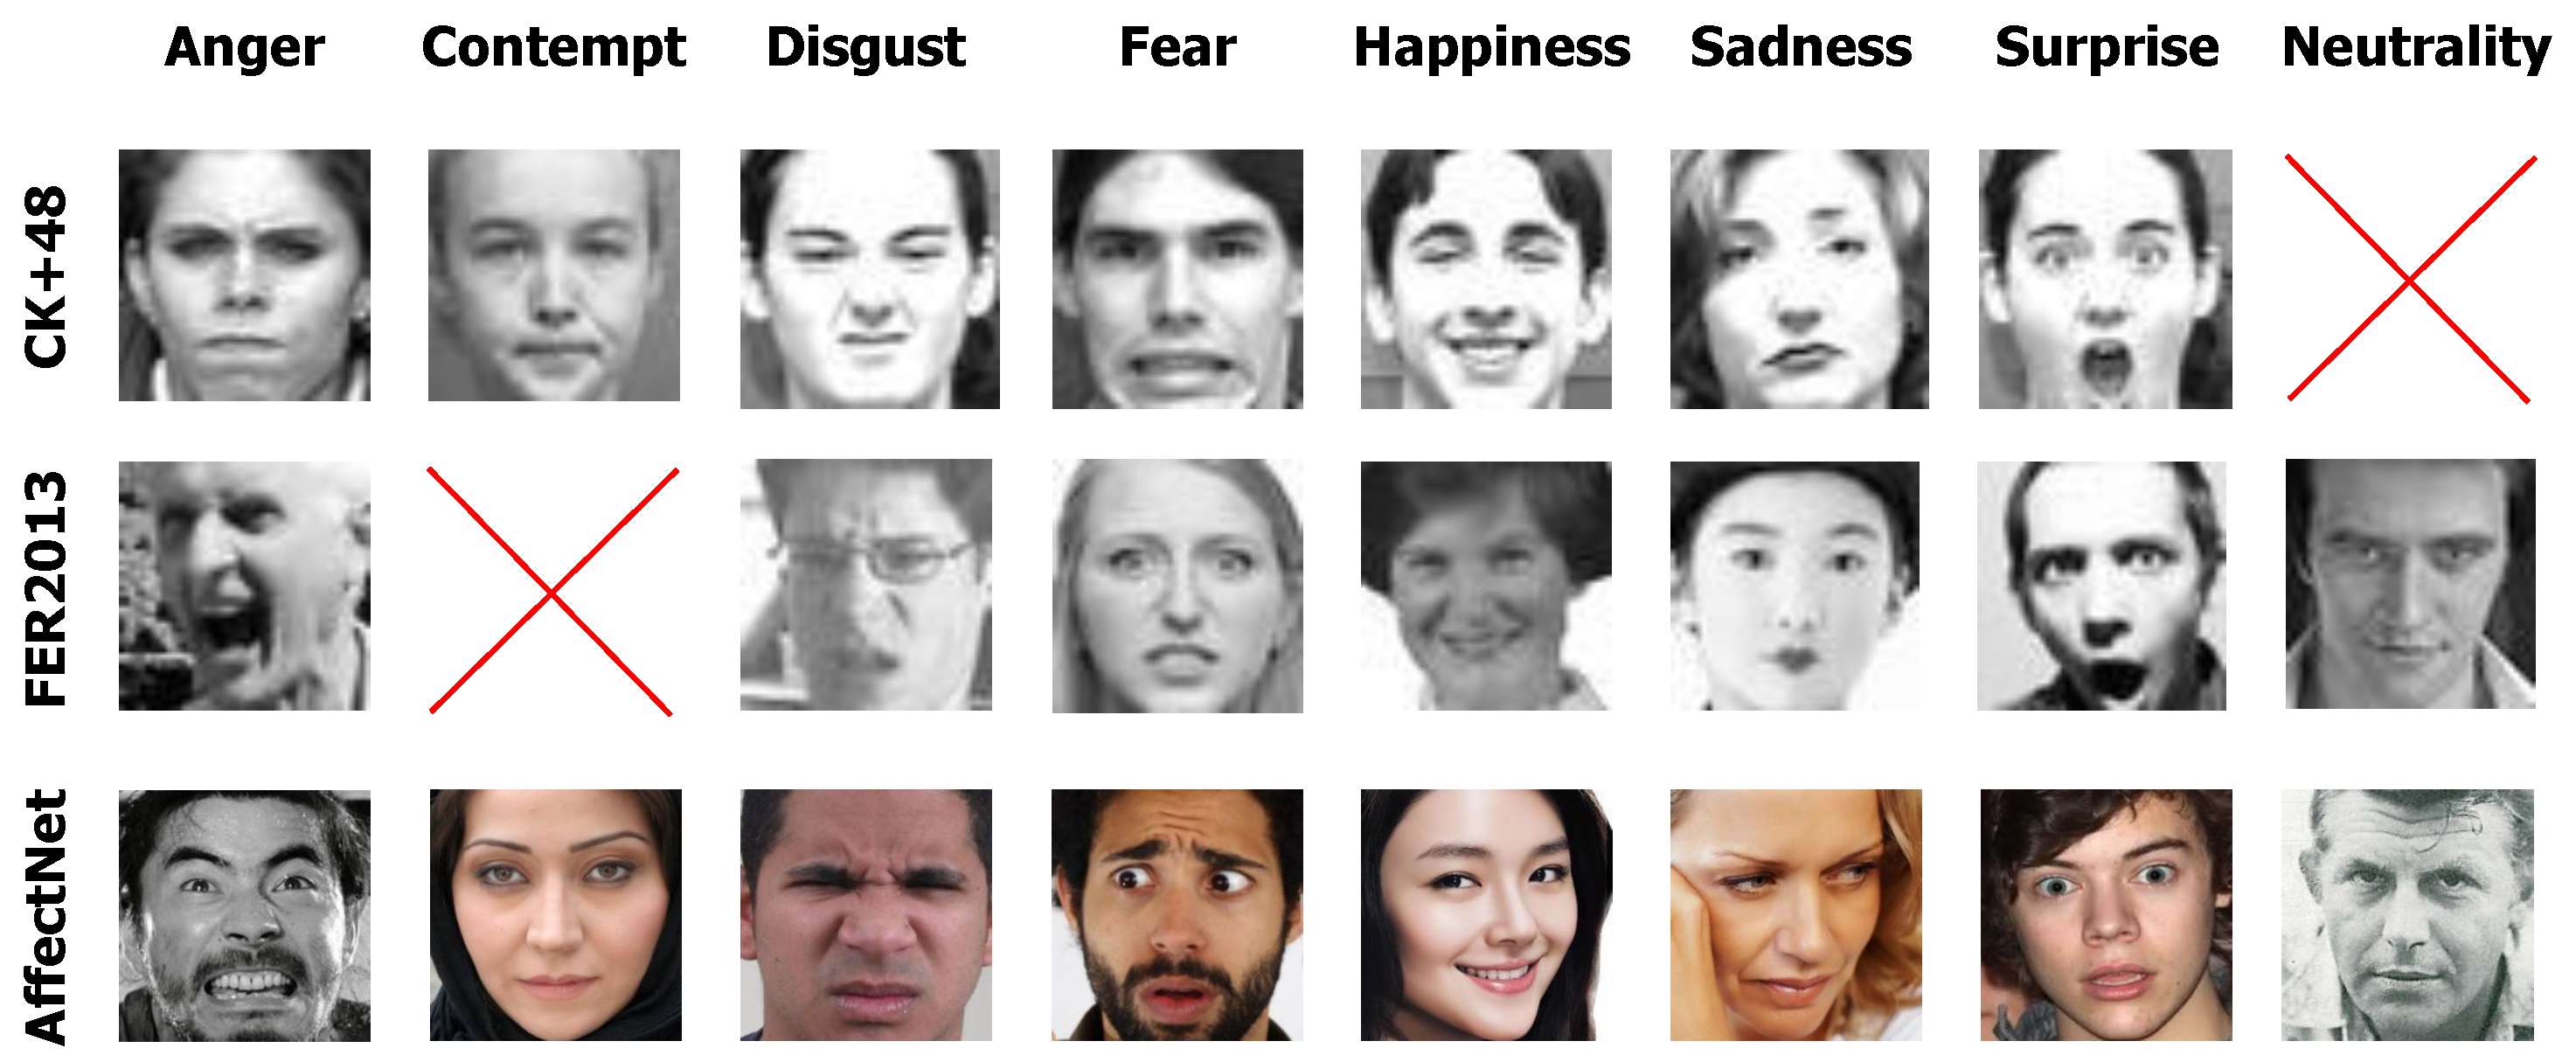
Section 3.1, the EfficientNetV2-S exhibited varying levels of accuracy across the CK+48, FER2013, and AffectNet databases, with respective accuracies of 94.87%, 66.51%, and 76.46%. These variations reflect the inherent complexities and diversities within each database, while also highlighting the adaptability and sensitivity of our model to different data characteristics.
Upon implementing Model_1, which processes AiF images, as delineated in
Section 4.1, and pre-training on these three databases for emotion recognition under SSE, we noted a marked uniform enhancement in performance metrics. Notably, AffectNet demonstrated the most significant improvement, achieving an average accuracy of 88.38% with a standard deviation (STD) of 8.18%, as illustrated in
Table 1.
The model’s high accuracy and reduced STD, when pre-trained on AffectNet, highlight its robustness, consistency and reliability in emotional recognition tasks across diverse emotional states. AffectNet, with its significantly larger volume and more extensive variety of emotional expressions compared to CK+48 and FER2013, has been instrumental in achieving these results. The ability to handle and learn from such a large, diverse dataset underscores the model’s adaptability and the distinct advantages offered by AffectNet’s comprehensive data in enhancing precision, improving performance and generalization capabilities.
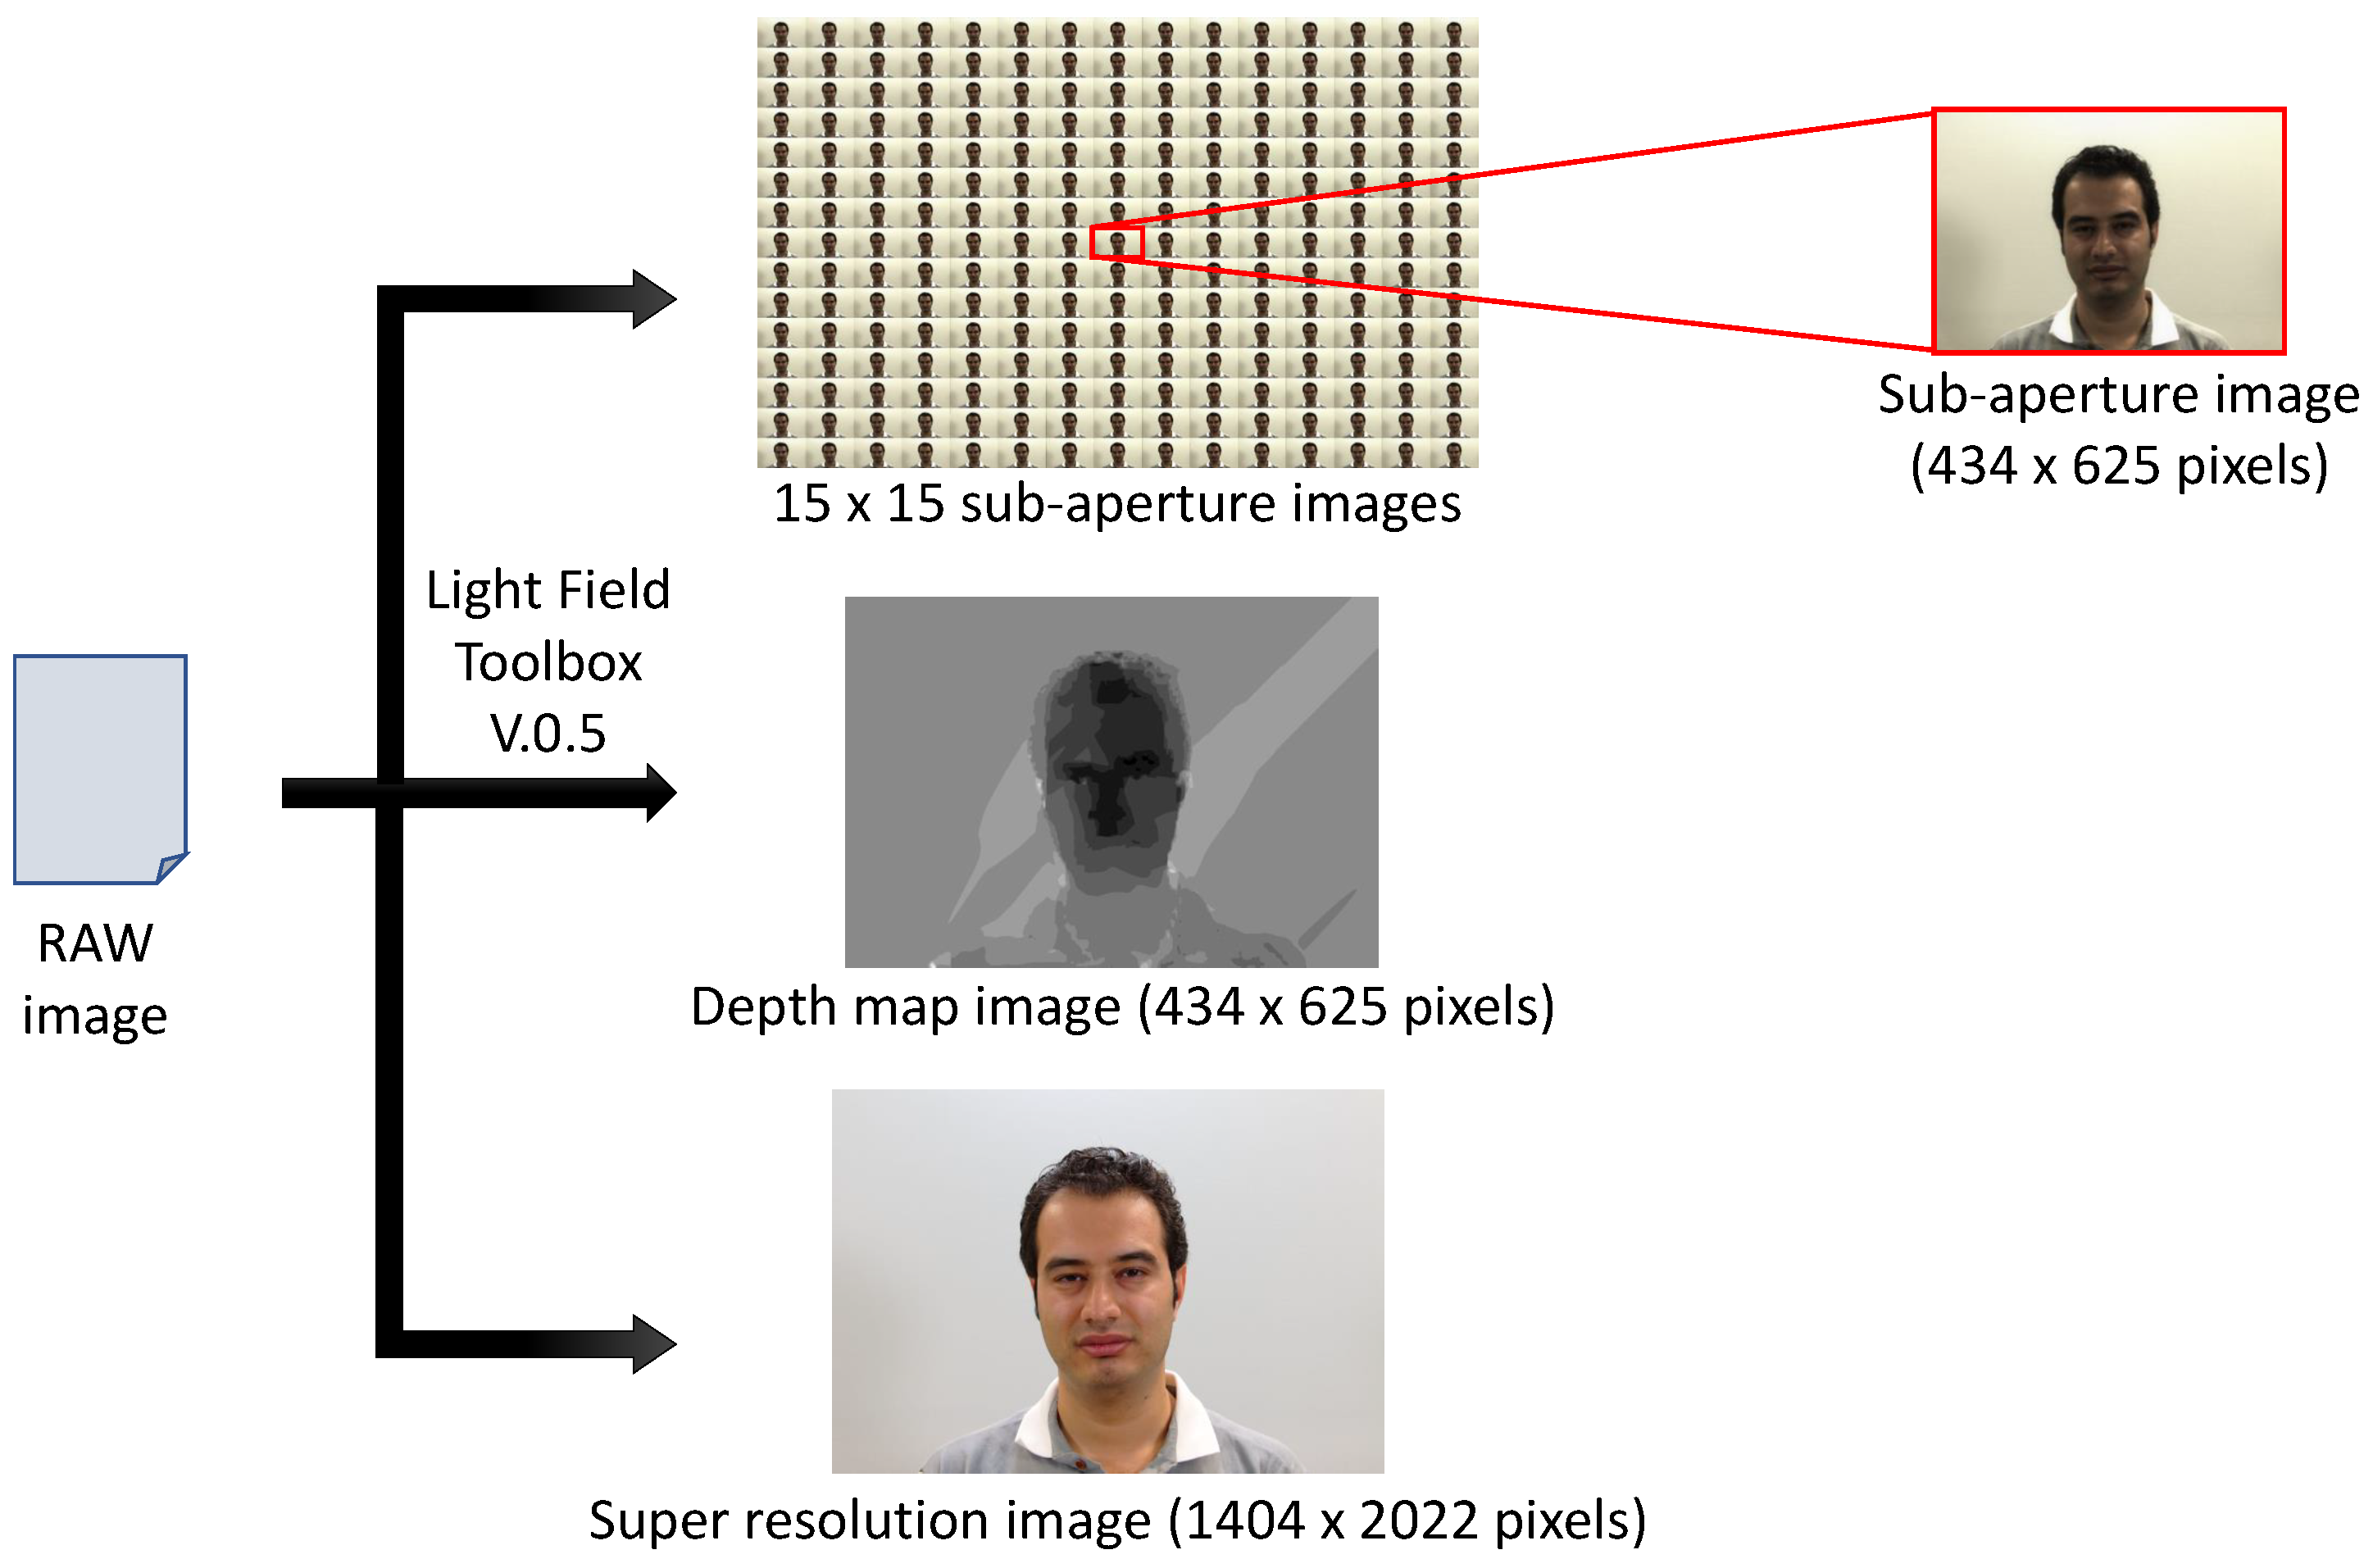
To extend our results, we generated depth maps from the RGB images of AffectNet using the Depth Anything model. The model achieved a score of 81.74%.
The contribution of the synthesized depth images to FER is significant. Compared to the score of 76.46% obtained using only RGB images, the use of depth maps has considerably improved performance. Depth maps provide additional information about the three-dimensional structure of faces, which is crucial for accurately identifying facial expressions, especially under varying pose and lighting conditions.
By pre-training the CNN on both RGB and depth images, we were able to create a more robust and generalizable model. This approach enables a better understanding of the nuances of emotional expressions by incorporating three-dimensional information, which is not always evident in two-dimensional images. The combination of RGB data and depth maps enriches the model, allowing it to discern subtle details of facial expressions, thus improving the accuracy and reliability of emotion recognition.
5.2. Results of Unimodal Architectures
We tested the unimodal models using SSE and SIE protocols on the LFFD dataset.
Table 2 represents the performance of the models under SSE protocol.
The model by Sepas-Moghaddam et al., which uses SA images, achieved an average accuracy of 87.62% with an STD of 5.41%. In comparison, our Model_3, also using SA images, achieved a slightly higher average accuracy of 88.13% with a higher STD of 7.42%. This demonstrates that our model not only matches but slightly surpasses the performance of the Sepas-Moghaddam et al. model in terms of accuracy, while still maintaining a robust performance across various emotional states
Our Model_1 with AiF images achieved the highest average accuracy among our models, with an accuracy of 88.38% and an STD of 8.18%. This model excelled particularly in recognizing the "Happy" (96.50%), "Neutral" (90%), and Surprise (90%) emotions, outperforming all other models in these categories.
Model_2, which uses depth images, performed the poorest among all the models, with an average accuracy of 42.13% and an STD of 8.17%. This model struggled significantly with recognizing all the emotions. This suboptimal performance can be attributed to the inadequate calibration of the LFFD dataset, where the depth range was not properly adjusted. Additionally, our model was pre-trained on synthesized depth images, which, although it improved the score to some extent, was insufficient to extract the detailed information stored in the LF depth maps necessary for effective emotion recognition.
Model_3, which uses SA images, demonstrated strong performance, achieving an average accuracy of 88.13% and an STD of 7.42%. This model showed strong performance across all emotions, particularly in recognizing the Angry (80.50%), Happy (94.50%), and Surprise (91%) emotions, making it comparable to the AiF images model.
Overall, Model_1 usinf AiF images demonstrated the highest overall performance in terms of average accuracy and emotional recognition, particularly excelling in the recognition of Happy, Neutral, and Surprise emotions. Model_3 with SA images also showed strong performance, surpassing the state-of-the-art model by Sepas-Moghaddam et al. in terms of average accuracy, although with slightly higher variability. Model_2 with depth images showed that depth information alone is insufficient for robust FER.
As seen in
Table 3, our Model_1 with AiF images achieved the highest performance, with an average accuracy of 94.11% and an STD of 4.08%. This model excelled in recognizing the Angry (88.57%), Happy (97.14%), Neutral (92.86%) and Surprise (97.87%) emotions, outperforming all other models in these categories.
On the other hand, Model_2, which employed depth images, recorded an average accuracy of 59.46% with an STD of 7.17%. This model faced considerable difficulties in recognizing all emotions, underscoring the insufficiency of depth information alone for effective emotion recognition.
Model_3, using SA images, also demonstrated strong performance, achieving an average accuracy of 91.88% and an STD of 3.25%. This model was particularly effective in recognizing the Happy (95%), Neutral (94.17%), and Surprise (91.67%) emotions, highlighting its robustness and reliability. The model developed by Sepas-Moghaddam et al. achieved an average accuracy of 80.37% with an STD of 9.03%. Despite performing reasonably well, it was outperformed by Model_3.
Overall, Model_1 with AiF images demonstrated the best performance across both protocols, highlighting the effectiveness of all-in-focus images for unimodal emotion recognition tasks. Model_3 with SA images also showed strong performance, further emphasizing the potential of SA images. Conversely, Model_2 with depth images indicated the limitations of relying solely on depth information for such tasks.
5.3. Results for Fusion Strategies
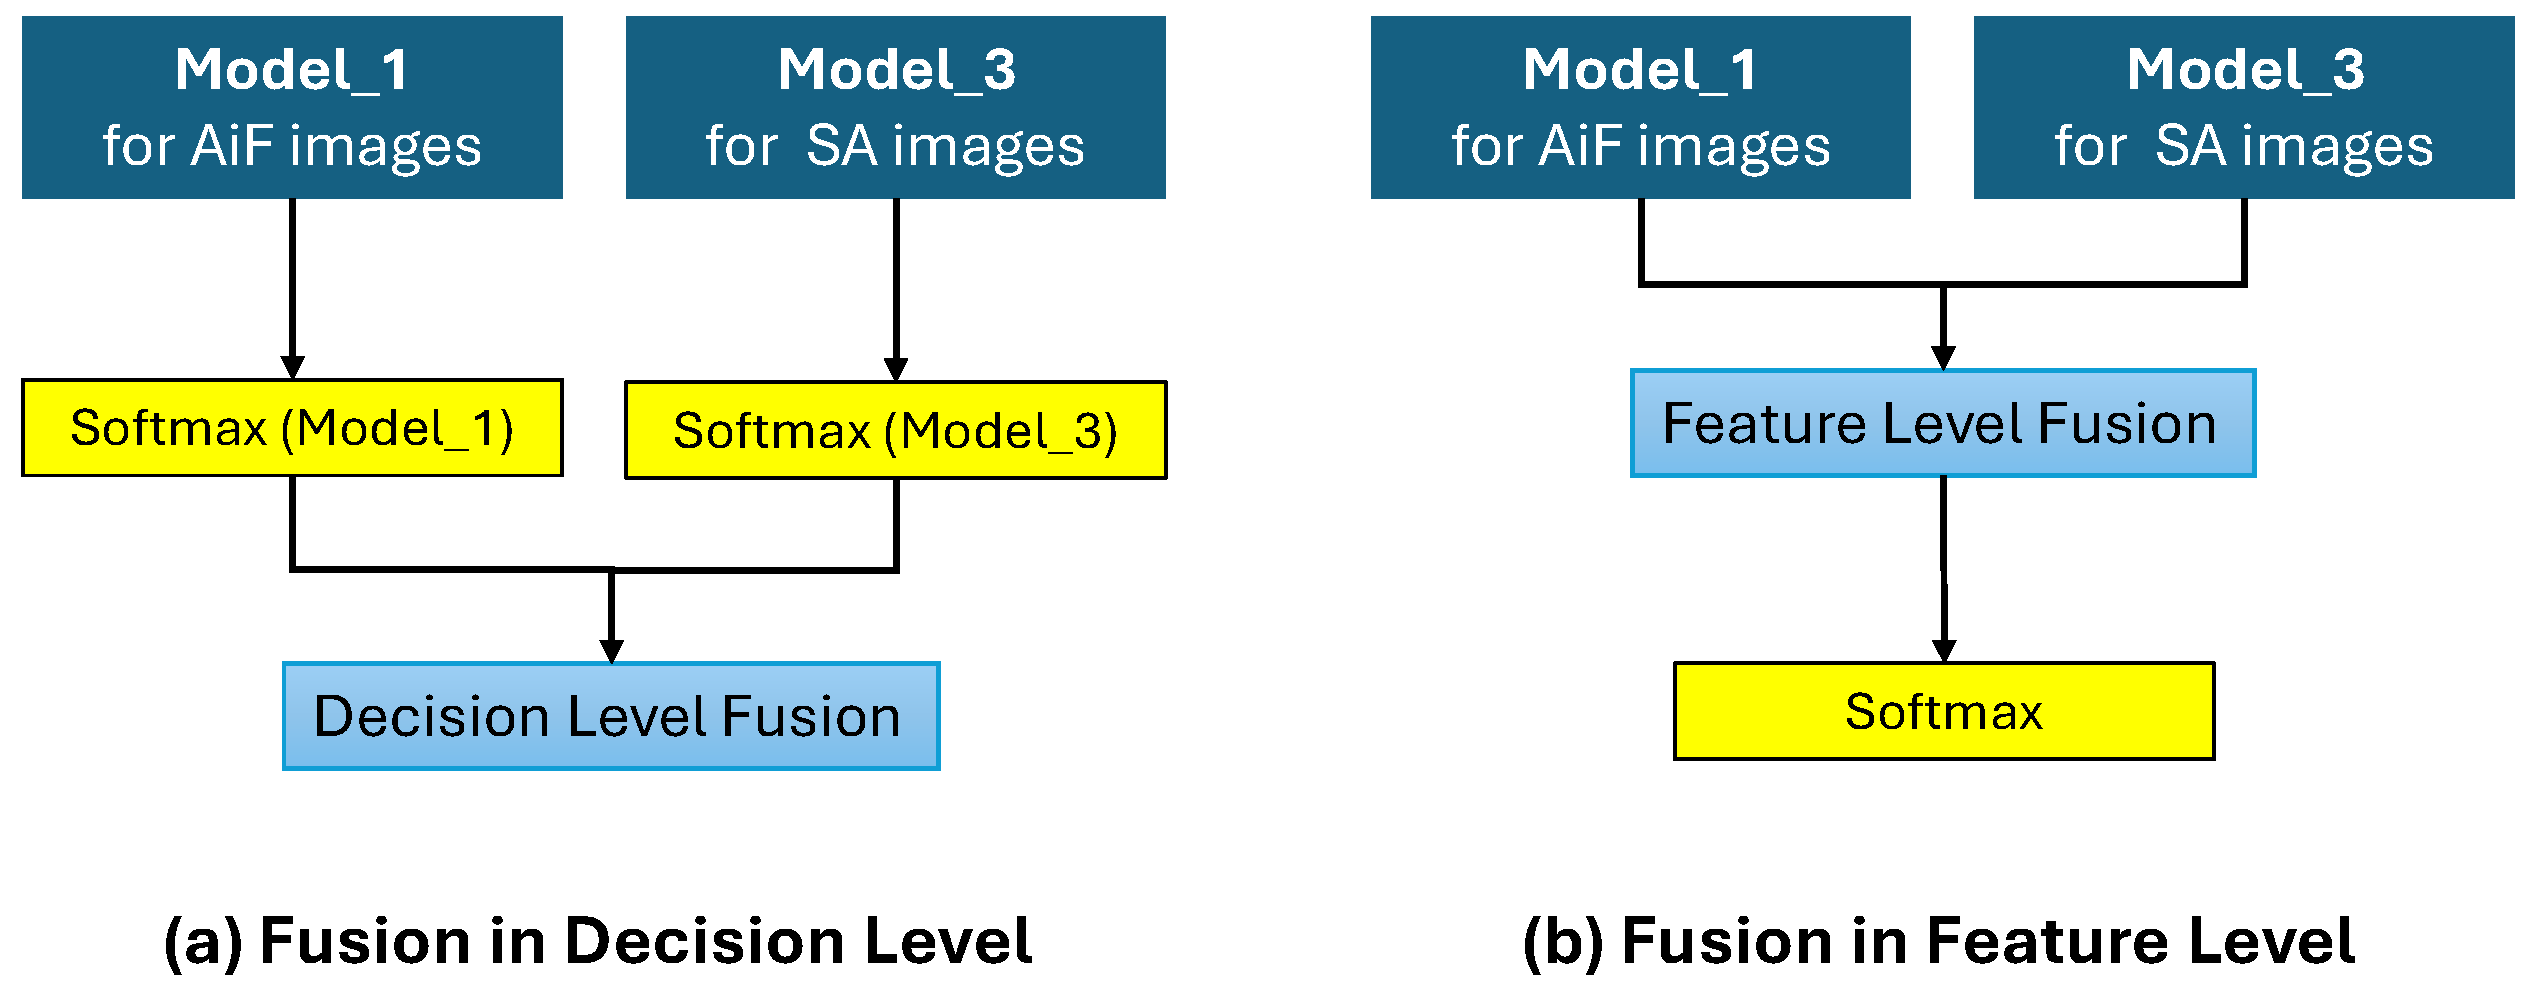
In this section, we compare decision-level versus feature-level fusion methods, elaborated in
Section 4.2.
Table 4 summarizes the fusion approaches using an EfficientNetV2-S model pre-trained on AffectNet, following SSE protocol. Our objective is to enhance the FER process by leveraging detailed data from LF camera technology, such as AiF and SA images, aiming to deepen our understanding of how different fusion strategies affect computational emotion analysis.
We employed various fusion strategies, including sum, maximum, multiply, average and concatenation, each with unique advantages for enhancing the FER process.
Decision-level fusion methods showed promising outcomes. The sum fusion approach, which integrates complementary data to enhance robustness, achieved an average accuracy of 87.00% with an STD of 2.74%. This method’s ability to consolidate diverse information sources likely contributed to its consistent performance. Similarly, the maximum fusion method, which prioritizes the most salient features, resulted in an average accuracy of 86.38% with an STD of 4.77%. The multiply fusion method, emphasizing commonalities across inputs, achieved an accuracy of 86.25% but exhibited higher variability with an STD of 6.41%.
Among the decision-level fusion strategies, the simple average method, which balances the inputs to ensure data consistency, stood out with an average accuracy of 87.88% and an STD of 7.33%. This approach’s balanced handling of input data may account for its superior performance across a range of facial expressions.
Feature-level fusion methods exhibited varied performances. The sum fusion method at the feature level achieved an average accuracy of 86.88% with an STD of 2.02%, indicating its consistent performance. The maximum approach yielded an average accuracy of 86.13%, but with a higher STD of 5.59%, suggesting greater variability. The multiply method resulted in an average accuracy of 85.7% with an STD of 5.17%, while the concatenation method showed an average accuracy of 85.50% with an STD of 6.28%. The simple average approach achieved an accuracy of 86.38% with an STD of 7.33%, indicating a balanced yet variable performance.
The use of LF camera technology, which captures both AiF and SA images, significantly enriched the data available for FER. This technology proved particularly beneficial for decision-level fusion strategies. The average approach, which achieved an average FER score of 87.88%, exemplifies how leveraging detailed LF data can enhance the accuracy and robustness of emotion recognition models. The superior performance of the decision-level fusion methods underscores the importance of integrating diverse data sources to capture the nuances of facial expressions effectively.
Overall, the results indicate that while all fusion strategies can effectively leverage varied data, decision-level fusion, particularly using the simple average method, offers a balanced performance across different emotional states. The inclusion of LF camera data further enhances the capability of these models, demonstrating significant improvements in accuracy and reliability. These findings highlight the potential of advanced fusion techniques and sophisticated imaging technologies in advancing computational emotion analysis.
5.4. Benefits of Multimodal Information
Using SSE protocol on the LFFD dataset, we evaluated the performance of the multimodal models.
Table 5 summarizes the results.
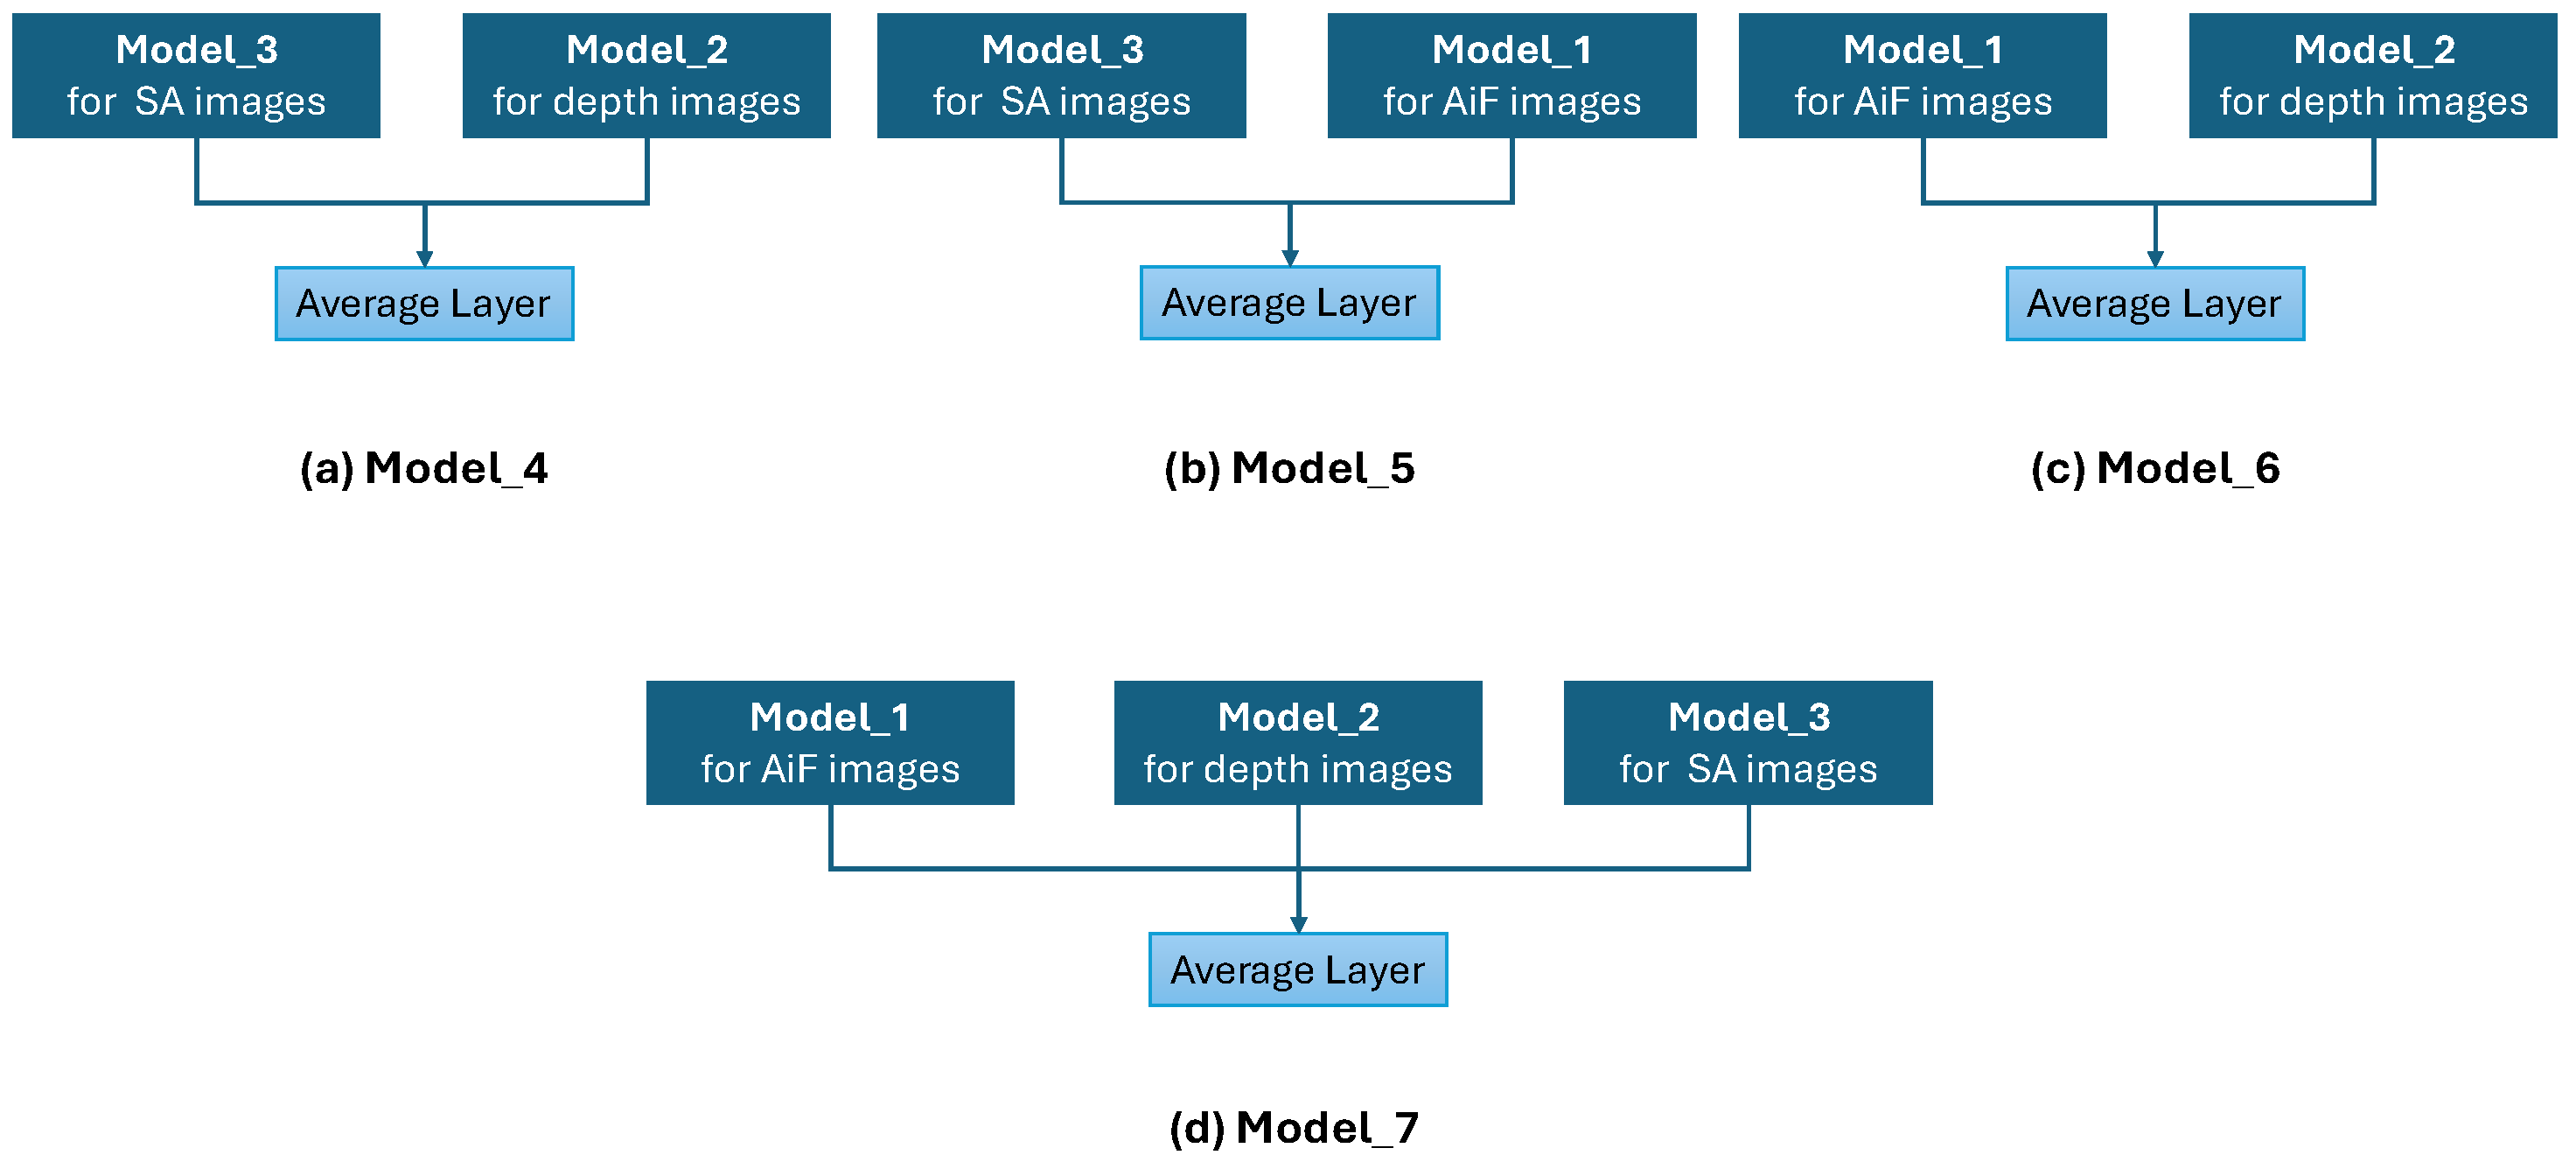
Model_4, which integrates SA and depth images, achieved an average accuracy of 86.00% with an STD of 8.00%. This model demonstrated strong performance in recognizing the Angry (75.00%), Happy (88.00%), Neutral (87.00%), and Surprise (94.00%) emotions. Despite its robust performance, Model_4 exhibited slightly less consistency compared to other multimodal combinations.
Model_5, which combines SA and AiF images, demonstrated an average accuracy of 87.50% with an STD of 7.33%. This model excelled in recognizing the Angry (77.00%), Happy (93.00%), Neutral (91.00%), and Surprise (90.50%) emotions. This combination showed a balanced performance across different emotional states.
Model_6, combining AiF and depth images, achieved an average accuracy of 85.88% with an STD of 9.50%. This model performed well in recognizing the Angry (72.00%), Happy (92.50%), Neutral (87.50%), and Surprise (91.50%) emotions. Despite the good performance, the higher standard deviation indicates more variability in its results.
Model_7, which integrates all modalities (SA, AiF, and depth images), demonstrated the best performance, achieving an average accuracy of 90.13% with an STD of 4.95%. This model showed excellent performance across all emotions, particularly in recognizing the Angry (86.50%), Happy (95.00%), Neutral (85.50%), and Surprise (93.50%) emotions. The integration of all modalities provided a comprehensive understanding of facial expressions, leading to the highest accuracy and the lowest variability.
It is important to note that the depth images in the LFFD dataset were not optimally calibrated during capture, leading to a lack of detailed facial structure information. Additionally, the model was pre-trained on synthesized depth images, which did not effectively extract the nuanced information present in the Light Field depth images. These factors contributed to the lower performance scores observed when using depth images alone. However, the fusion strategy employed in Model_7 effectively leveraged the complementary strengths of SA and AiF images to extract the most pertinent information from the depth modality. By relying on the strengths of the other modalities, Model_7 was able to mitigate the limitations of the depth images, thereby achieving superior overall performance.
Compared to the unimodal models, the multimodal fusion models demonstrated significant improvements in performance. Model_1, which used AiF images alone, achieved the highest accuracy among unimodal models with an average of 88.38%. However, the multimodal Model_7 surpassed this, achieving an accuracy of 90.13%. This demonstrates the substantial benefit of combining multiple modalities, as it allows the model to draw on a richer set of features and improve its recognition capabilities.
Otherwise, We evaluated the multimodal models using SIE protocol on the LFFD dataset.
Table 6 represents the performance of these models.
Model_4 achieved an average accuracy of 90.18% with an STD of 6.26%. This model demonstrated robust performance, particularly in recognizing Angry (85.71%), Happy (95.71%), Neutral (78.57%), and Surprise (89.29%) emotions. However, the higher variability indicates that the combination of SA and depth images is less consistent compared to other multimodal configurations.
Model_5 demonstrated an average accuracy of 95.18% with a standard deviation (STD) of 5.06%. This model excelled in recognizing Angry (87.14%), Happy (99.29%), Neutral (95.71%), and Surprise (98.57%) emotions. The fusion of SA and AiF images provided a well-balanced and robust performance across various emotional states.
Model_6, which combines AiF and depth images, achieved an average accuracy of 86.04% with an STD of 4.02%. This model performed well in recognizing Angry (80.00%), Happy (90.83%), Neutral (88.33%), and Surprise (85.83%) emotions. However, the relatively higher standard deviation suggests more variability in its results, indicating that the combination of AiF and depth images is less consistent compared to other multimodal approaches.
Model_7, which integrates all modalities demonstrated the best performance, achieving an average accuracy of 93.33% with an STD of 4.92%. This model showed excellent performance across all emotions, particularly in recognizing Angry (86.67%), Happy (100%), Neutral (91.67%), and Surprise (95%) emotions. The integration of all modalities provided a comprehensive understanding of facial expressions, resulting in high accuracy and low variability.
Compared to the unimodal models, the multimodal fusion models demonstrated significant improvements in performance. Model_1, which used AiF images alone, achieved the highest accuracy among unimodal models with an average of 94.11% under SIE protocol. However, the multimodal Model_5 surpassed this, achieving an accuracy of 95.18%. This demonstrates the substantial benefit of combining multiple modalities, as it allows the model to draw on a richer set of features and improve its recognition capabilities.
In conclusion, Model_5 demonstrated the highest performance and robust emotion recognition across various states, indicating the effectiveness of combining SA and AiF images. Model_7, which integrated all modalities, also performed exceptionally well with low variability, highlighting the benefits of a comprehensive multimodal approach. While Model_4 and Model_6 showed strong performance, their higher variability suggests that certain combinations, such as SA and depth images, may be less consistent. Overall, these findings underscore the substantial benefits of multimodal fusion in enhancing the accuracy and robustness of facial emotion recognition.
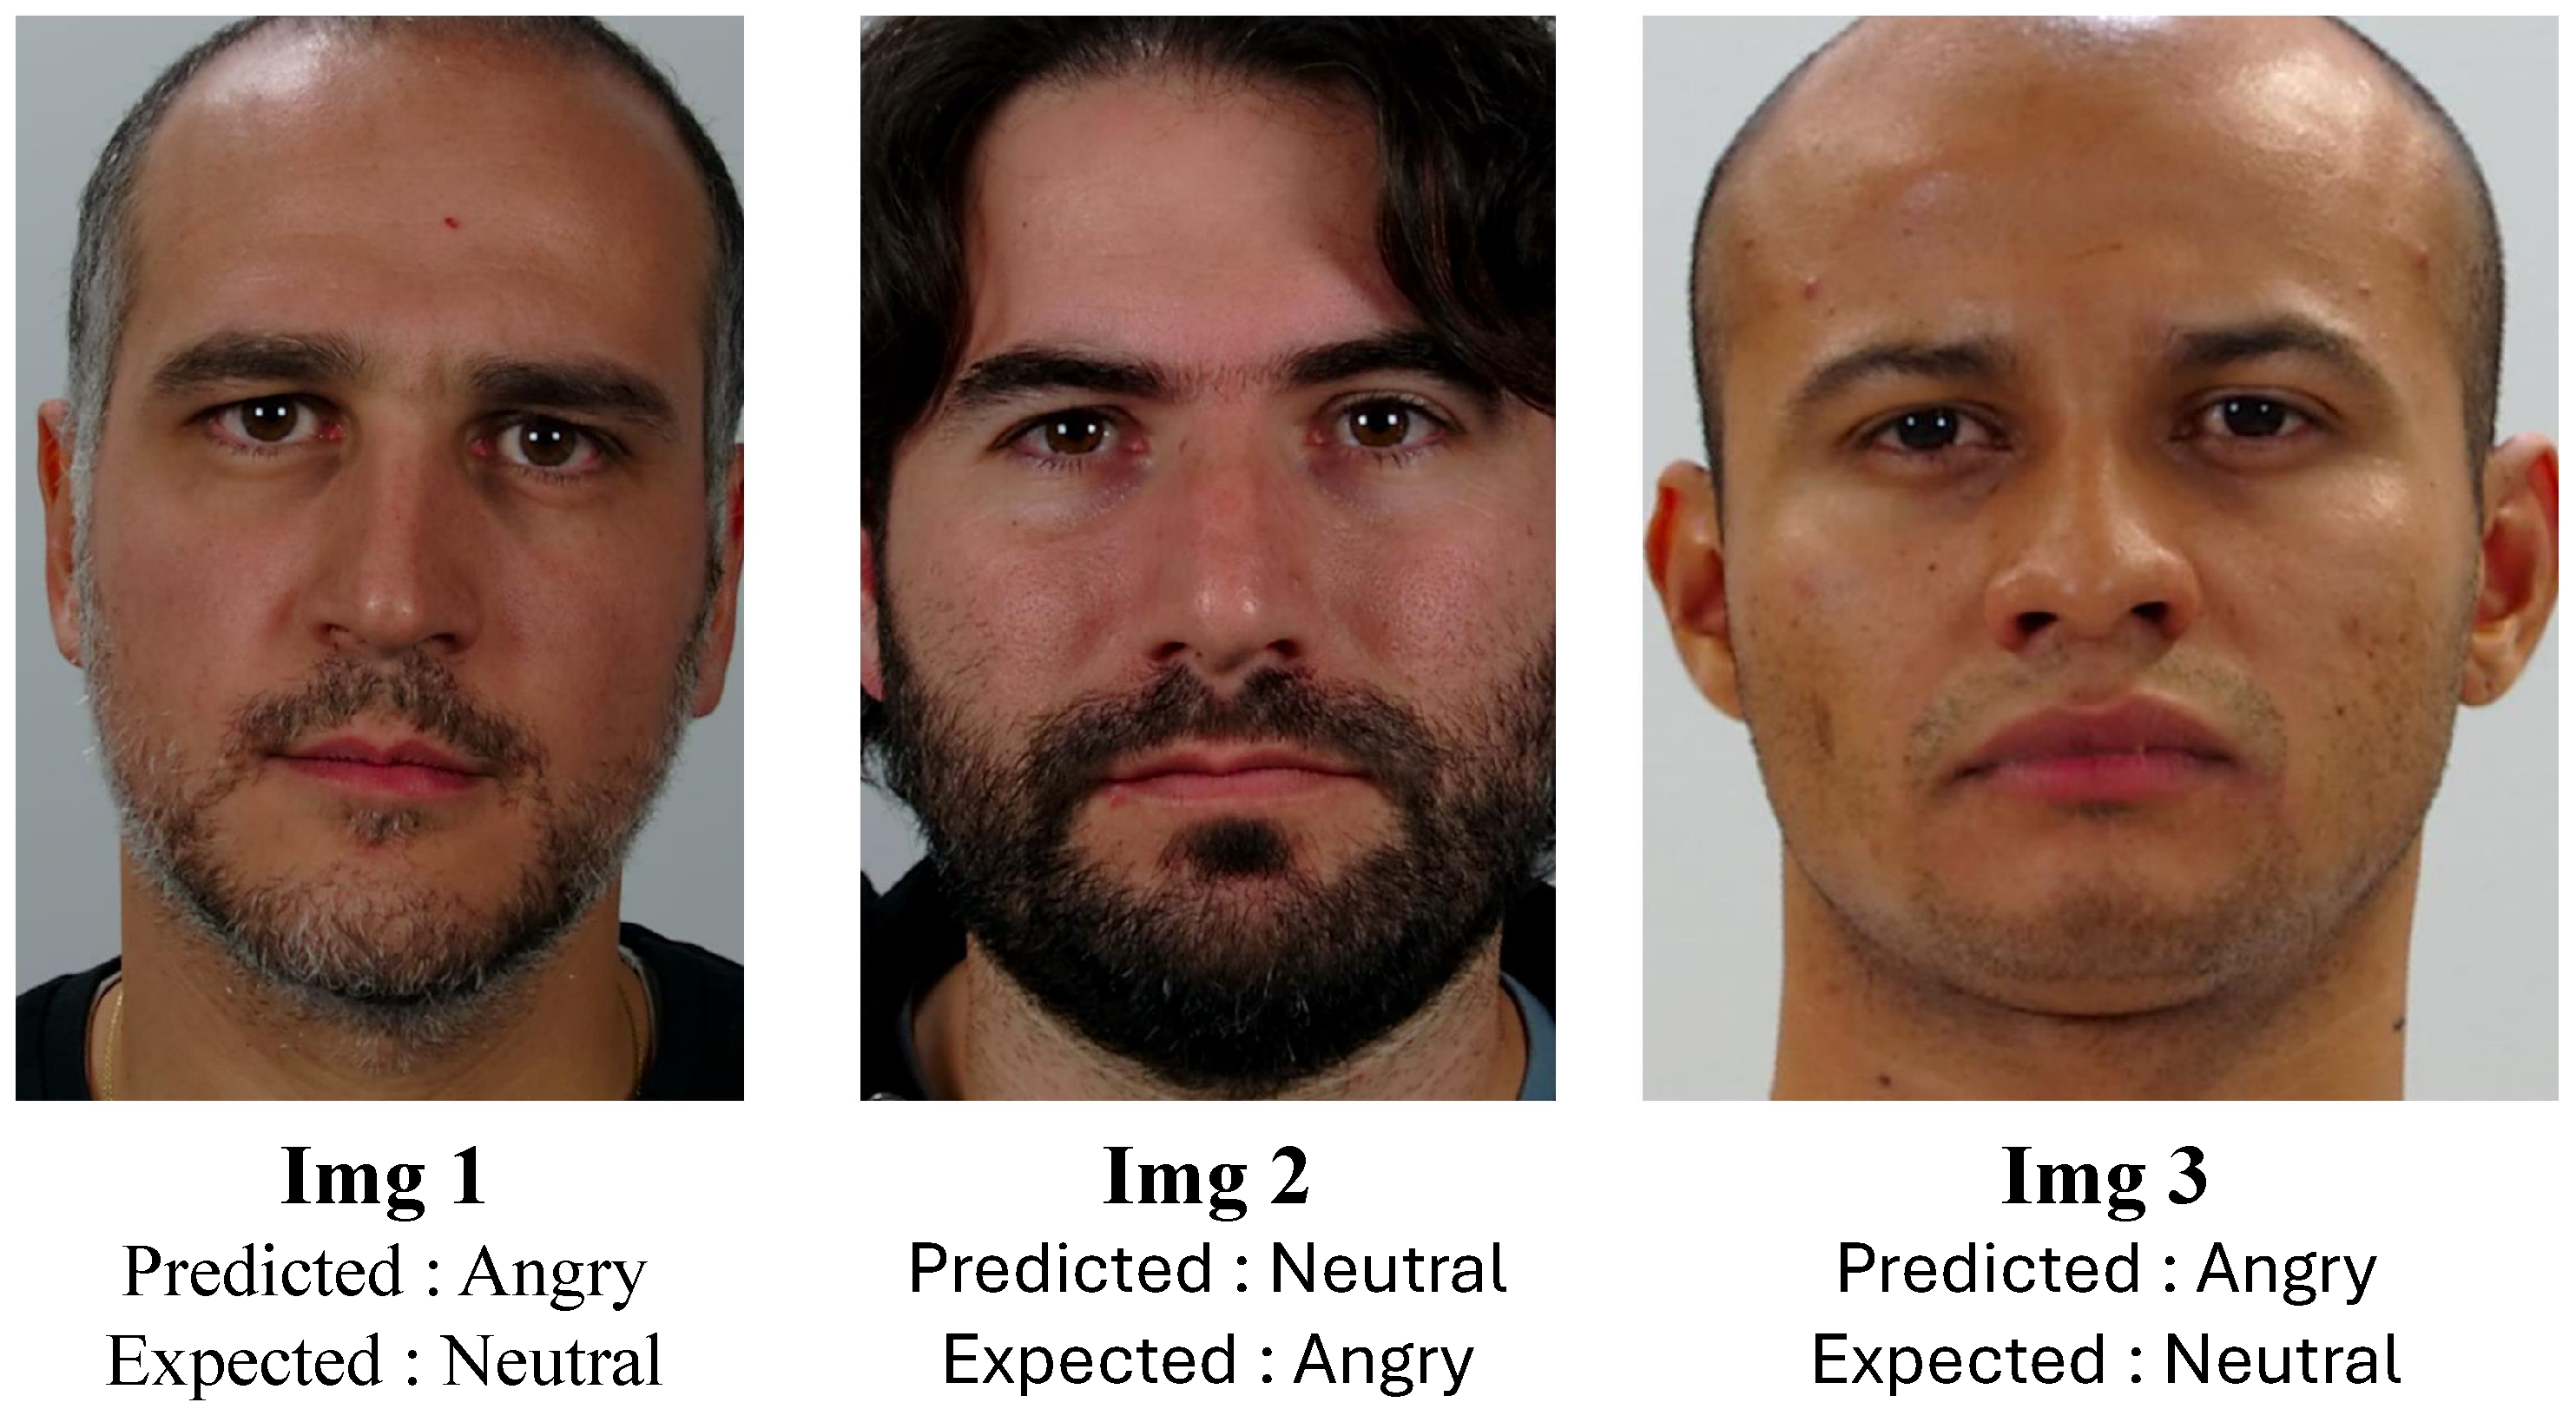
Diving deeper into the evaluation under SSE prtocol, we aim to provide a more granular understanding of our model’s performance. In one of the test instances, our approach yielded accuracy scores of 90% for ’Angry’, 100% for ’Happiness’, 95% for ’Neutral’, and 100% for ’Surprise’, reaching an impressive average accuracy of 96.25%. While these scores are promising, we seek to further dissect the results. To gain insights into the model’s behavior, we showcase images that were incorrectly classified by our model, shedding light on areas where improvement is possible (see
Figure 10).
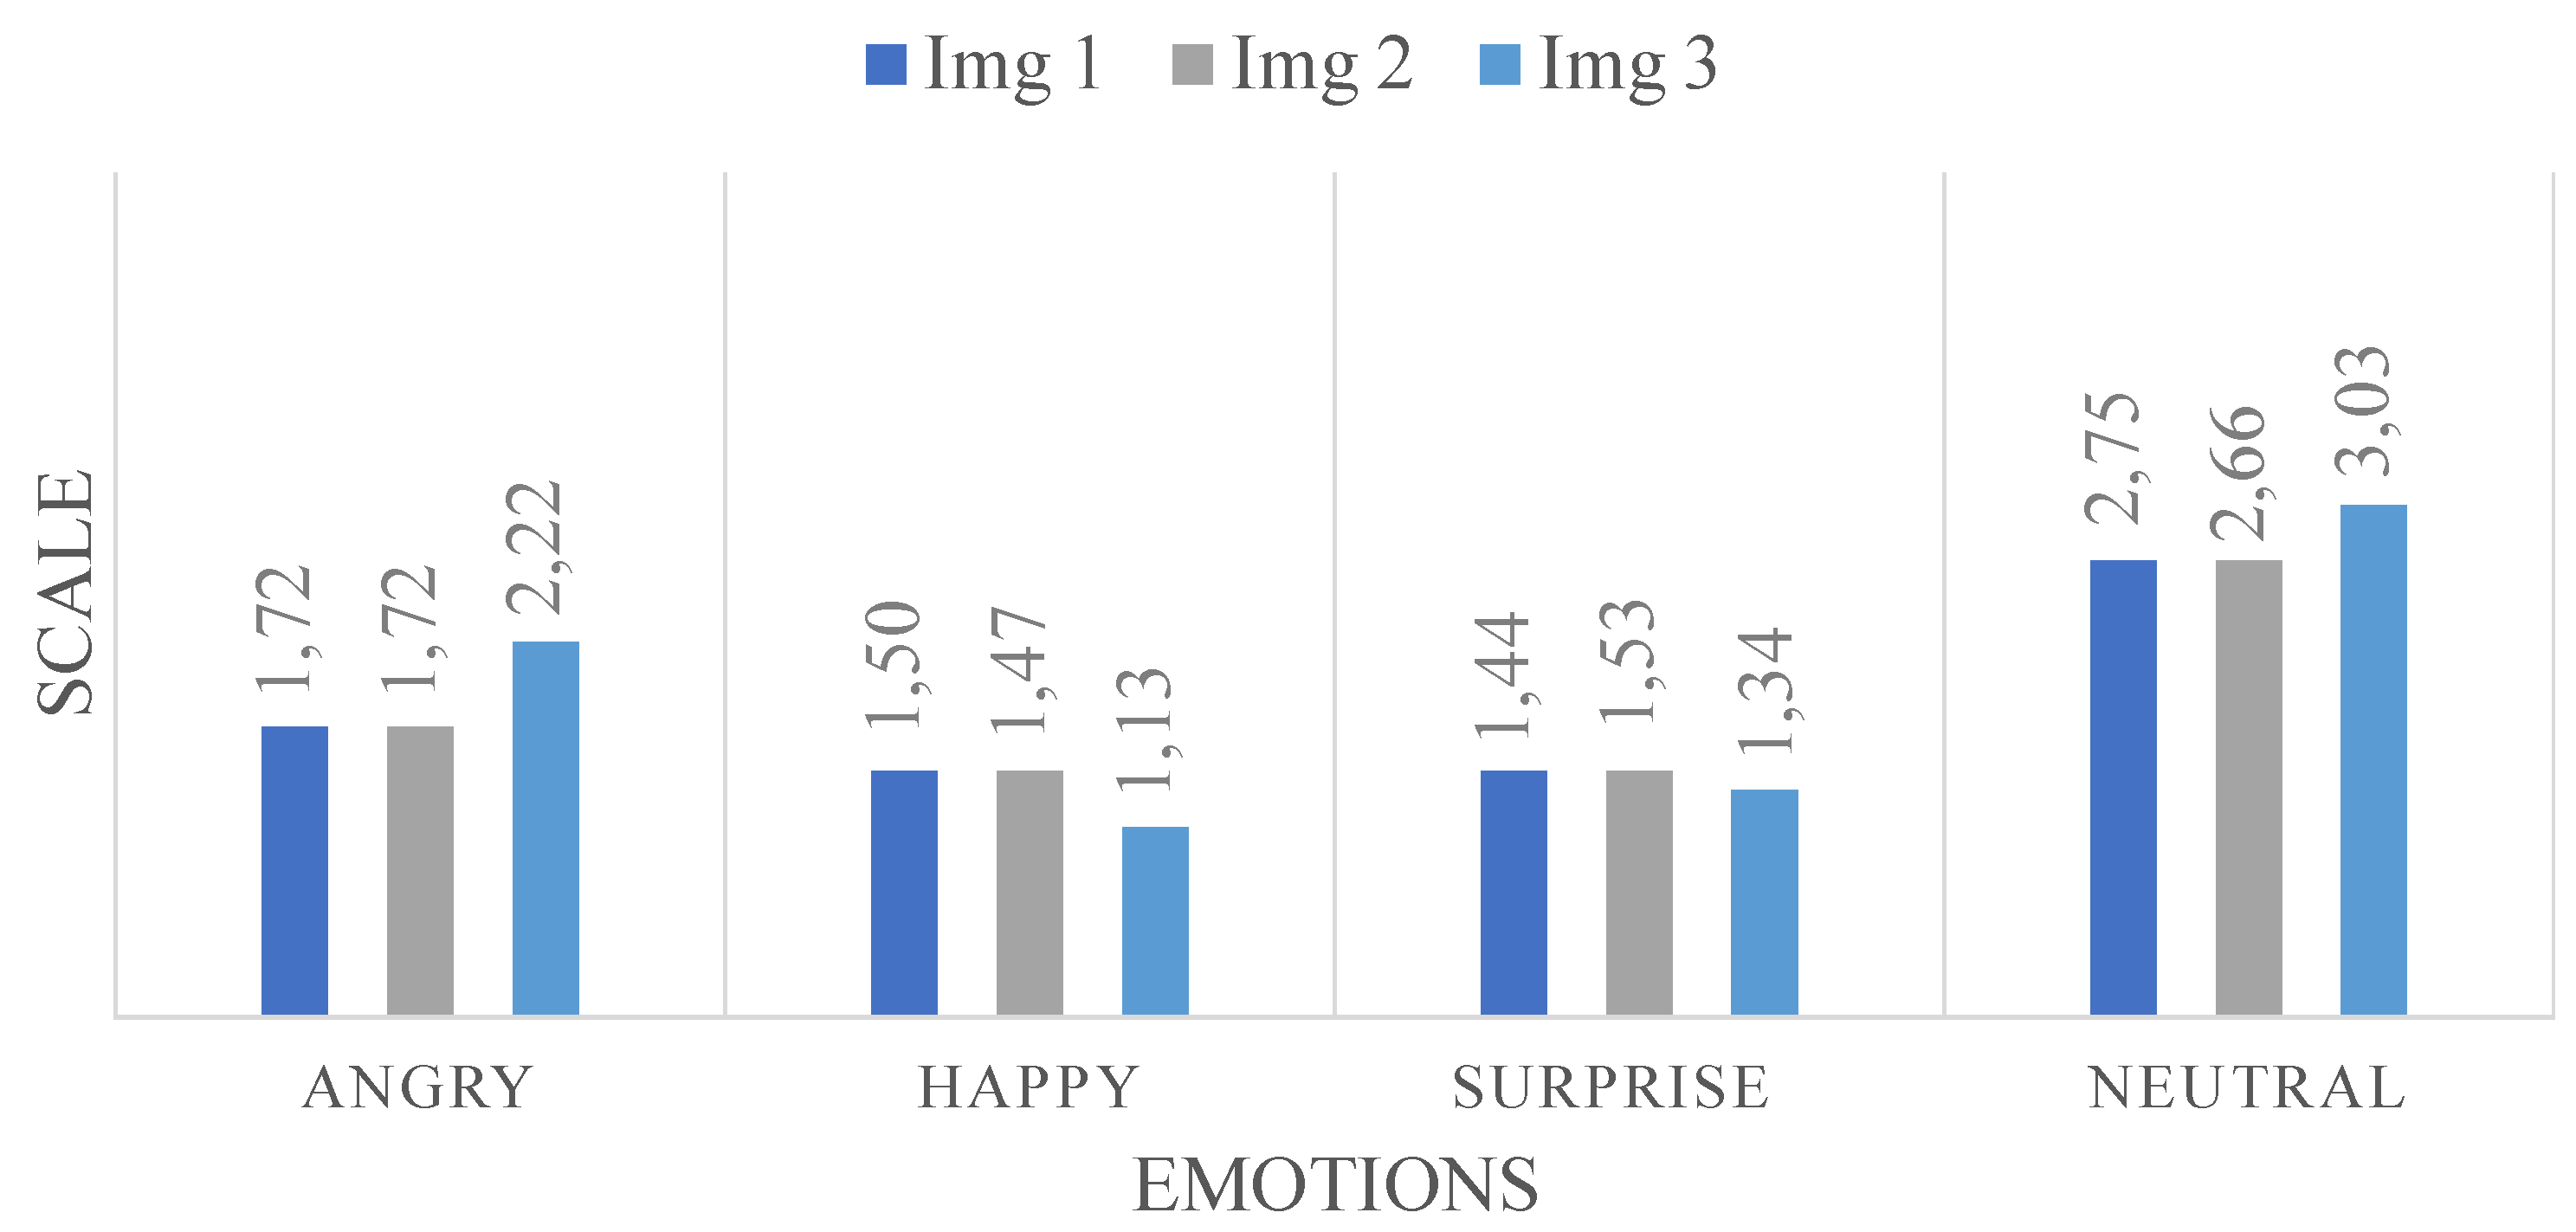
To further our analysis, we engaged 32 individuals to answer a questionnaire to rate on a scale from 1 to 5 for the four facial expression (’Angry’, ’Happiness’, ’Surprise’ and ’Neutral’), specifically for those three misannotated images. Figure ?? gives the scores for each emotion across the three images, providing a nuanced view of human perception in relation to the model’s misclassifications. This approach allows for a more detailed understanding of the subtleties involved in FER and highlights potential areas for enhancing the model’s accuracy.
Regarding the data illustrated in
Figure 11 concerning the three misannotated images, we analyze the feedback provided by the participants based on the graph.
Firstly, the graph likely presents the distribution of scores for each emotion for the three images. This is essential to observe the trends and patterns that emerge from the participants’ ratings.
For Image 1 with the predicted ’Angry’ and expected ’Neutral’, we might observe a higher concentration of ratings around the median for ’Neutral’, as indicated by the average score of 2.75. This central tendency could suggest a general agreement among participants towards a neutral expression, despite the model’s prediction of ’Angry’. The lower scores for ’Angry’, ’Happiness’, and ’Surprise’ might be spread out or clustered towards the lower end of the scale, indicating less agreement or confidence in these facial expressions for Image 1.
Moving to Image 2, predicted ’Neutral’ but expected ’Angry’, the graph might show a more even distribution of scores for ’Angry’ and ’Neutral’, reflecting the closer average scores (1.72 for ’Angry’ and 2.66 for ’Neutral’). This could suggest a divided perception among participants, with some leaning towards a neutral expression and others perceiving anger. The distribution of ’Happy’ and ’Surprise’ scores might again show lesser variance and lower averages, reinforcing the idea that these were not the dominant perceived emotions for this image.
Finally, for Image 3, with a prediction of ’Angry’ but an expectation of ’Neutral’, the graph might show a pronounced peak or a higher average for ’Neutral’ at 3.03, indicating a strong consensus towards a neutral expression among participants. The ’Angry’ score, while lower, might show a broader spread or a secondary peak, reflecting a significant minority of participants who align with the model’s prediction. The scores for ’Happy’ and ’Surprise’ might remain consistently low, as with the other images.
In summary, the graph in
Figure 11 we provide a visual representation of these distributions and tendencies, offering a clearer picture of the collective human judgment versus the model’s predictions. By dissecting these patterns, we can better understand where the model aligns or diverges from human perception and how emotion recognition might be fine-tuned for improved accuracy and understanding.
