1. Introduction
Mine tailings (MTs) are byproducts of mineral extraction that contain potentially toxic heavy metals (PTHMs) such as arsenic (As), cadmium (Cd), mercury (Hg), lead (Pb), zinc (Zn) [
1] and other residual chemical compounds [
2], making them a source of contamination and a serious environmental threat that requires proper management.
MTs occupy vast expanses of land for storage (tailings dams), emitting particulate matter in the surrounding urban and agricultural areas and accumulating in the long term as Mining Environmental Liabilities (PAM). Additionally, tailings with high concentrations of heavy metals can generate acid waters due to climatic conditions.
To reduce potential environmental impacts, there are three technological processes: (1) isolation of MT, (2) chemical stabilization of MT, and (3) a combination of both [
3]. Among these methods, geopolymerization offers an environmentally safe technology to stabilize and encapsulate the PTHMs present in MT, forming geopolymers [
4,
5].
Geopolymers are compounds derived from the combination of silica and alumina-rich materials, known as amorphous aluminosilicates, which are activated by reaction with a highly alkaline solution, resulting in a three-dimensional structure similar to organic polymers [
6,
7]. The most commonly used activators are sodium or potassium hydroxide, silicates, and carbonates [
8].
MTs are used to prepare geopolymers due to their high silica content, which increases the SiO
2/Al
2O
3, molar ratio, negatively affecting the geopolymerization process. To solve this problem, metakaolin (MK) is used as an additional source of aluminum (Al) due to its high reactivity, homogeneity, and purity [
9].
Additionally, using MTs as the sole precursor generally leads to lower compressive strength, so it is considered feasible to improve it by incorporating supplementary material [
10].
Geopolymers were developed using gold MTs, ground granulated blast furnace slag (GBFS), and MK as binders in proportions of 40-50%, 20-30%, and 30%, respectively. The effectiveness of immobilization was evaluated through leaching tests after 7 and 28 days and after 18 months. Specimens were immersed in water for one day, and the metallic leachates in solution were determined by ICP-OES. Several elements such as Cr, Cu, Ni, Zn, and Mn were almost completely immobilized, and the immobilization improved with a longer curing time [
11].
In a study on the effectiveness of solidification/stabilization of zinc mine tailings through geopolymerization, geopolymers were made from MK and MTs. Specimens synthesized without MK had a strength of 1.1 MPa, but when the MK content was increased to 50%, the mechanical strength increased to 30.1 MPa. In the SEM images of the 50% MK geopolymer, the formed gel was sufficient to encapsulate the unreacted crystals. The presence of andradite and more crystalline quartz was suggested to reduce the gel in the geopolymer. The results of the TCLP tests showed that the Zn concentration increased from 12.7 to 58.2 ppm as the MK amount decreased, while for the 50% MK specimen, the Zn concentration was 2.7 ppm, and the percentage of Zn leached was 0.91% of the total Zn in the tailings, demonstrating that Zn was immobilized [
12].
Pumice (PP) is a material composed mainly of SiO
2 and Al
2O
3 [
13], making it suitable for the manufacture of geopolymers. The mechanical properties of reported geopolymers made from PP achieved the highest compressive strength of 40 MPa with the parameters: silica modulus Ms = 0.68, Na
2O 0.10%, and water/binder ratio = 0.36, indicating good mechanical properties [
14].
However, there is limited research on the use of this material in the production of mine tailing based geopolymers or its use together with other aluminosilicates such as MK or fly ash [
4,
5,
9], making it necessary to explore and investigate more potential resources for obtaining geopolymers that can help in the stabilization and encapsulation of heavy metals.
The objective of this study is to evaluate the mechanical, toxicological, and microstructural behavior of geopolymers made from MTs, MK, and PP, by varying the MTs content in their composition from 100% to 0% of the total solids including the MK, PP, and MTs. The aim is to obtain a specimen that contains the highest possible amount of MTs, ensuring optimal mechanical, toxicological, and microstructural properties for its long-term integrity and durability, whether in safety fills or as alternative construction materials.
2. Materials and Methods
2.1. Materials
The materials utilized in this study included: MTs [
15]; MK and PP as binder materials; and sodium hydroxide and sodium silicate solution as alkaline activators. Additional materials employed included a commercial Superplasticizer admixture and distilled water.
2.1.1. Mining Tailings (MTs)
Tailings samples were obtained from the beneficiation plant of Mining company Paraíso, located in Chala district, province of Caraveli, Arequipa region, Peru. Sampling collection was conducted following the Soil Sampling Guide from the Ministry of Environment (MINAM-2014) ensuring the representativeness of the sample within the sampling area.
From the various MTs analyzed from different locations in the Arequipa region, the ones from the Paraíso Mining Company were chosen as one of the most contaminated,
Table 1 and
Table 2. Mineralogical composition is shown in
Table 3. Concentrations of heavy and toxic metals (HTM) were determined using the multi-element assay method by ICP-OES with acid digestion, utilizing the Perkin Elmer AVIO-550 max instrument. Analysis of the particle size distribution showed a D90 of 65 µm, signifying that 90% of the particles were smaller than a 65 µm screen size.
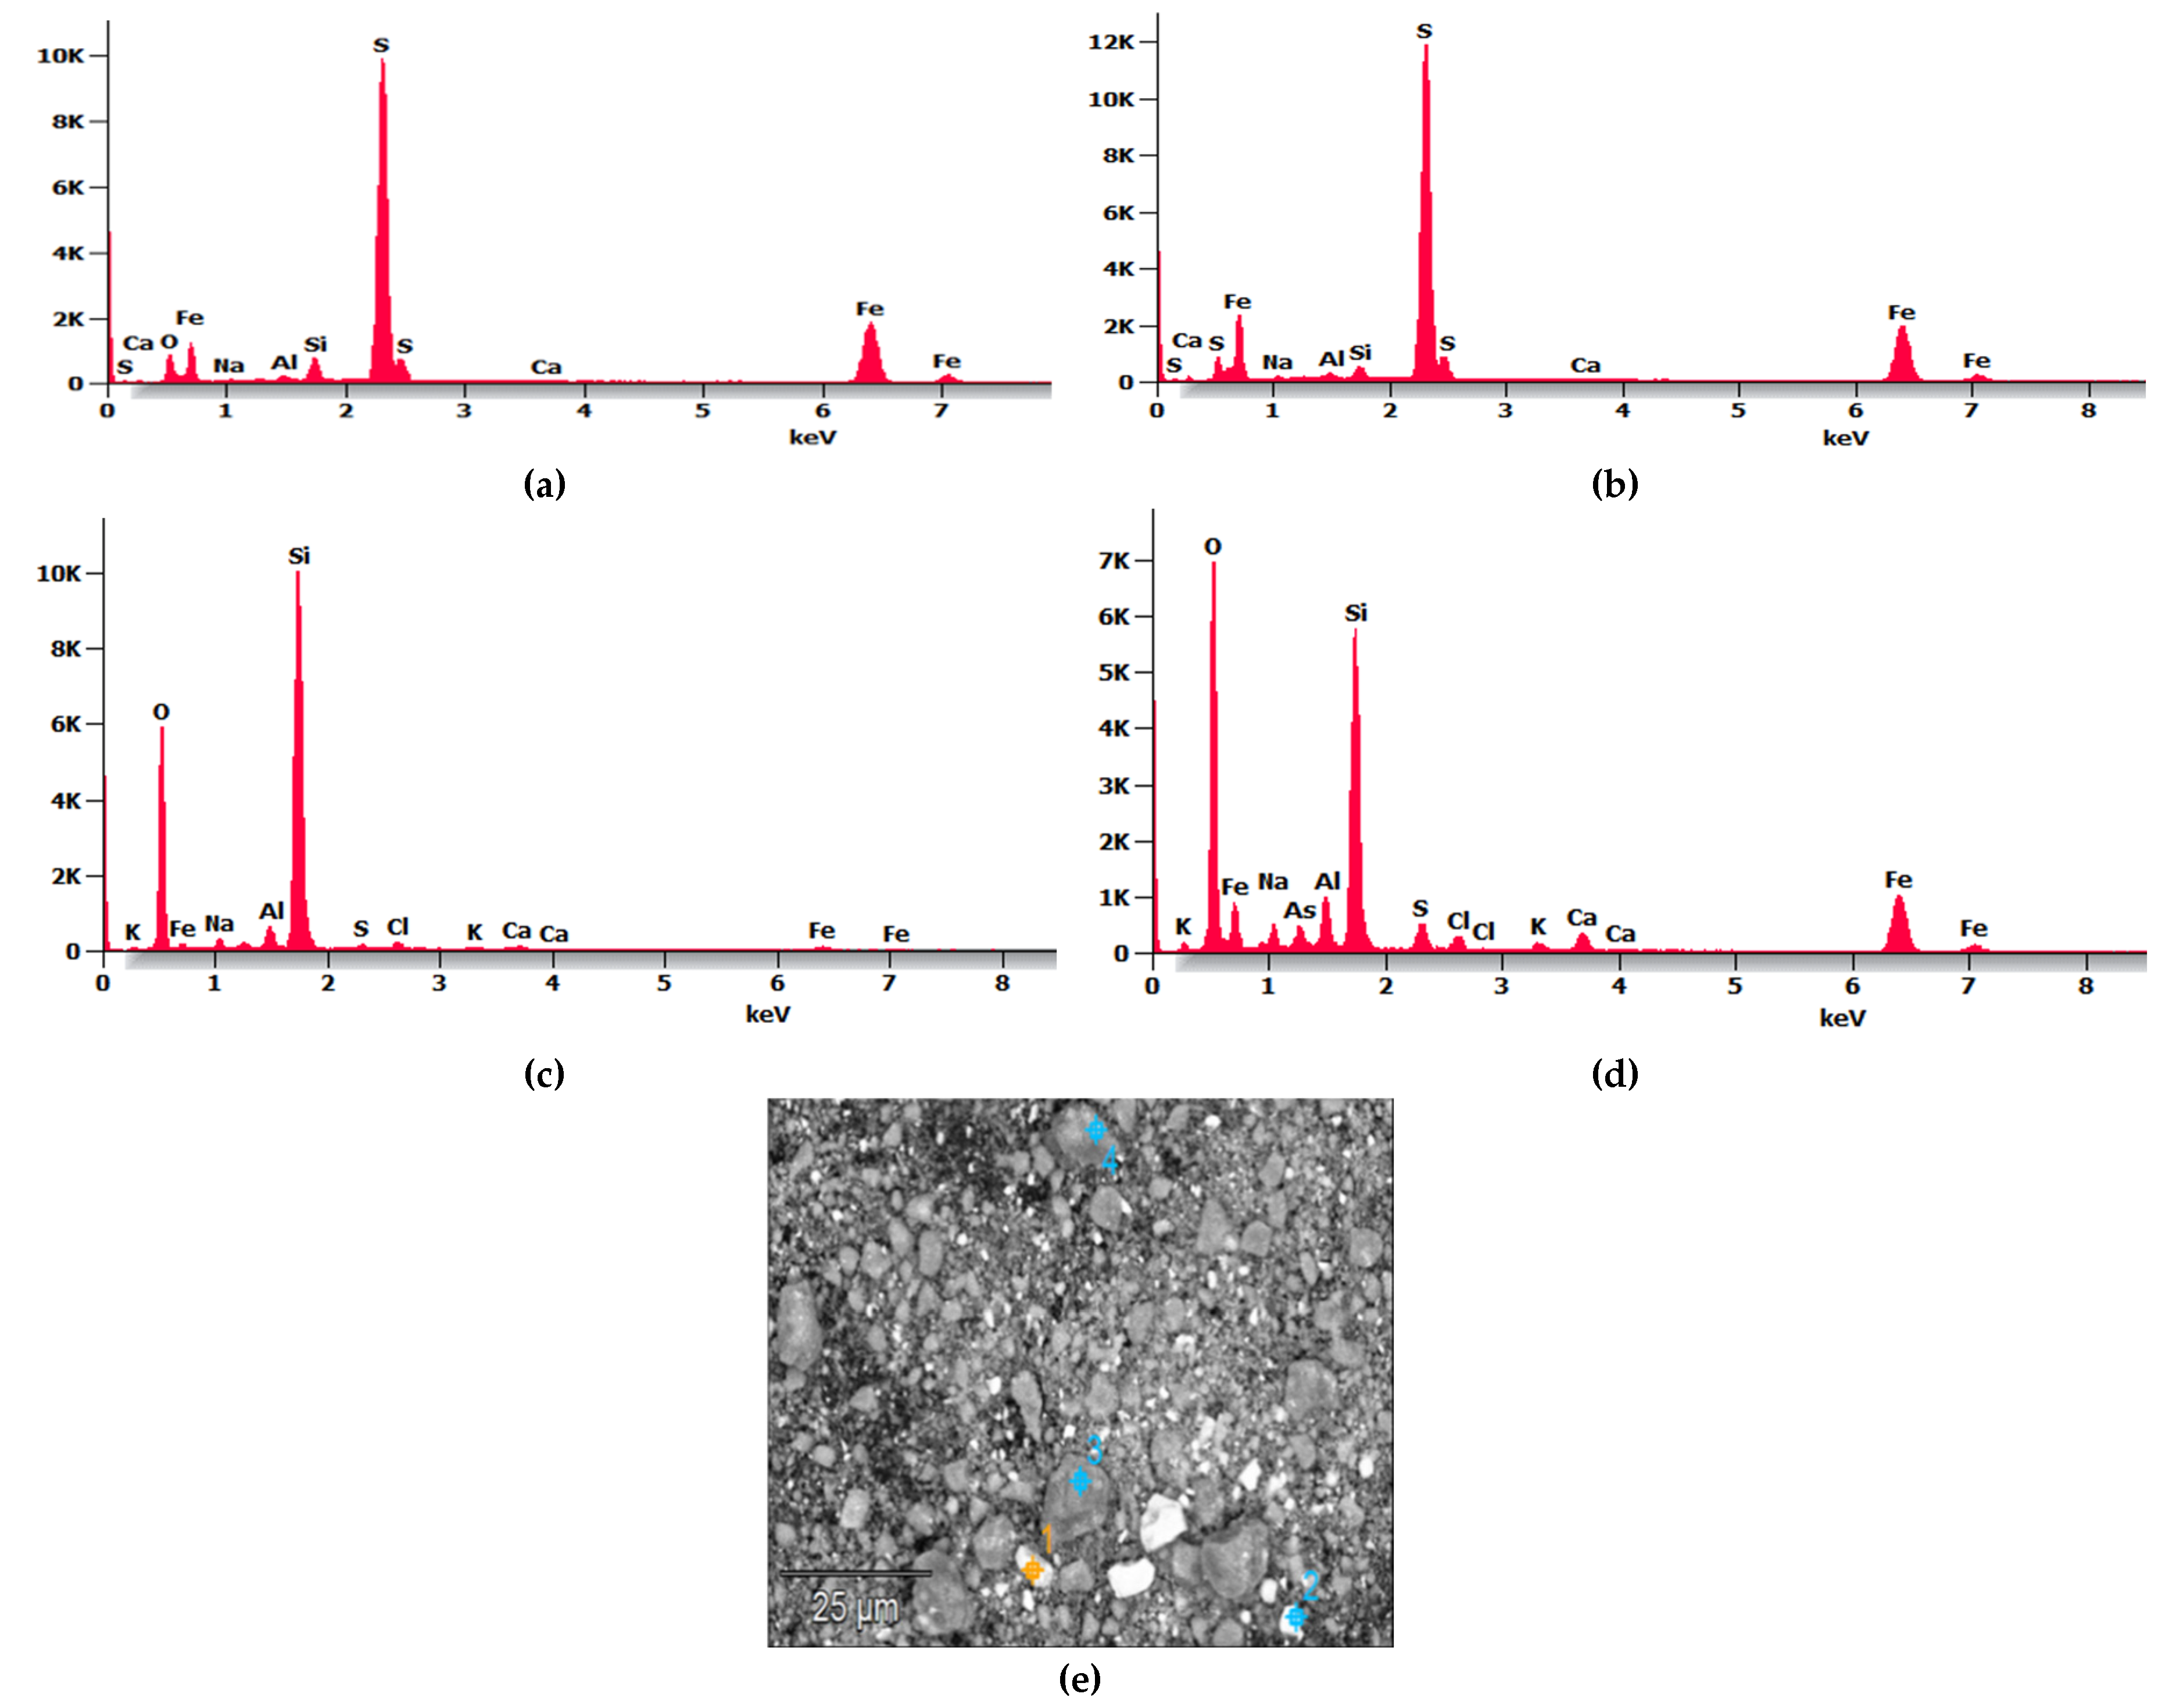
Figure 1 shows the SEM micrograph and EDS analysis of the MTs, where
Figure 1e depicts the morphology of the tailings as particulate grains stacked freely without segmentation, exhibiting various angular and irregular geometries of varied sizes; no predominant angular shape is observed, consistent with other analyses [
16].
Figure 1a–d present the EDS spectra from the four points identified in the SEM micrograph shown in
Figure 1e.
The results indicate that in
Figure 1a,b, sulfur shows a peak of higher intensity, iron appears with moderate intensity, followed by Al, Si, and Ca as main components, while
Figure 1c,d show two peaks of higher intensity corresponding to Si and O
2, followed by Fe, Al, and Ca; it is noteworthy that arsenic (As) and chlorine (Cl) appear in
Figure 1d compared to the other points. The intensity of Al in the MTs was significantly lower compared to MK according to Figure 3; therefore, it was necessary to mix tailings with amorphous aluminosilicates such as MK and PP to adjust the Si:Al ratio to enhance reactivity and thereby improve the geopolymerization process.
2.1.2. Pumice (PP)
PP is a volcanic mineral material composed mainly of silica and alumina, approximately 70% SiO
2 and 13 % Al
2O
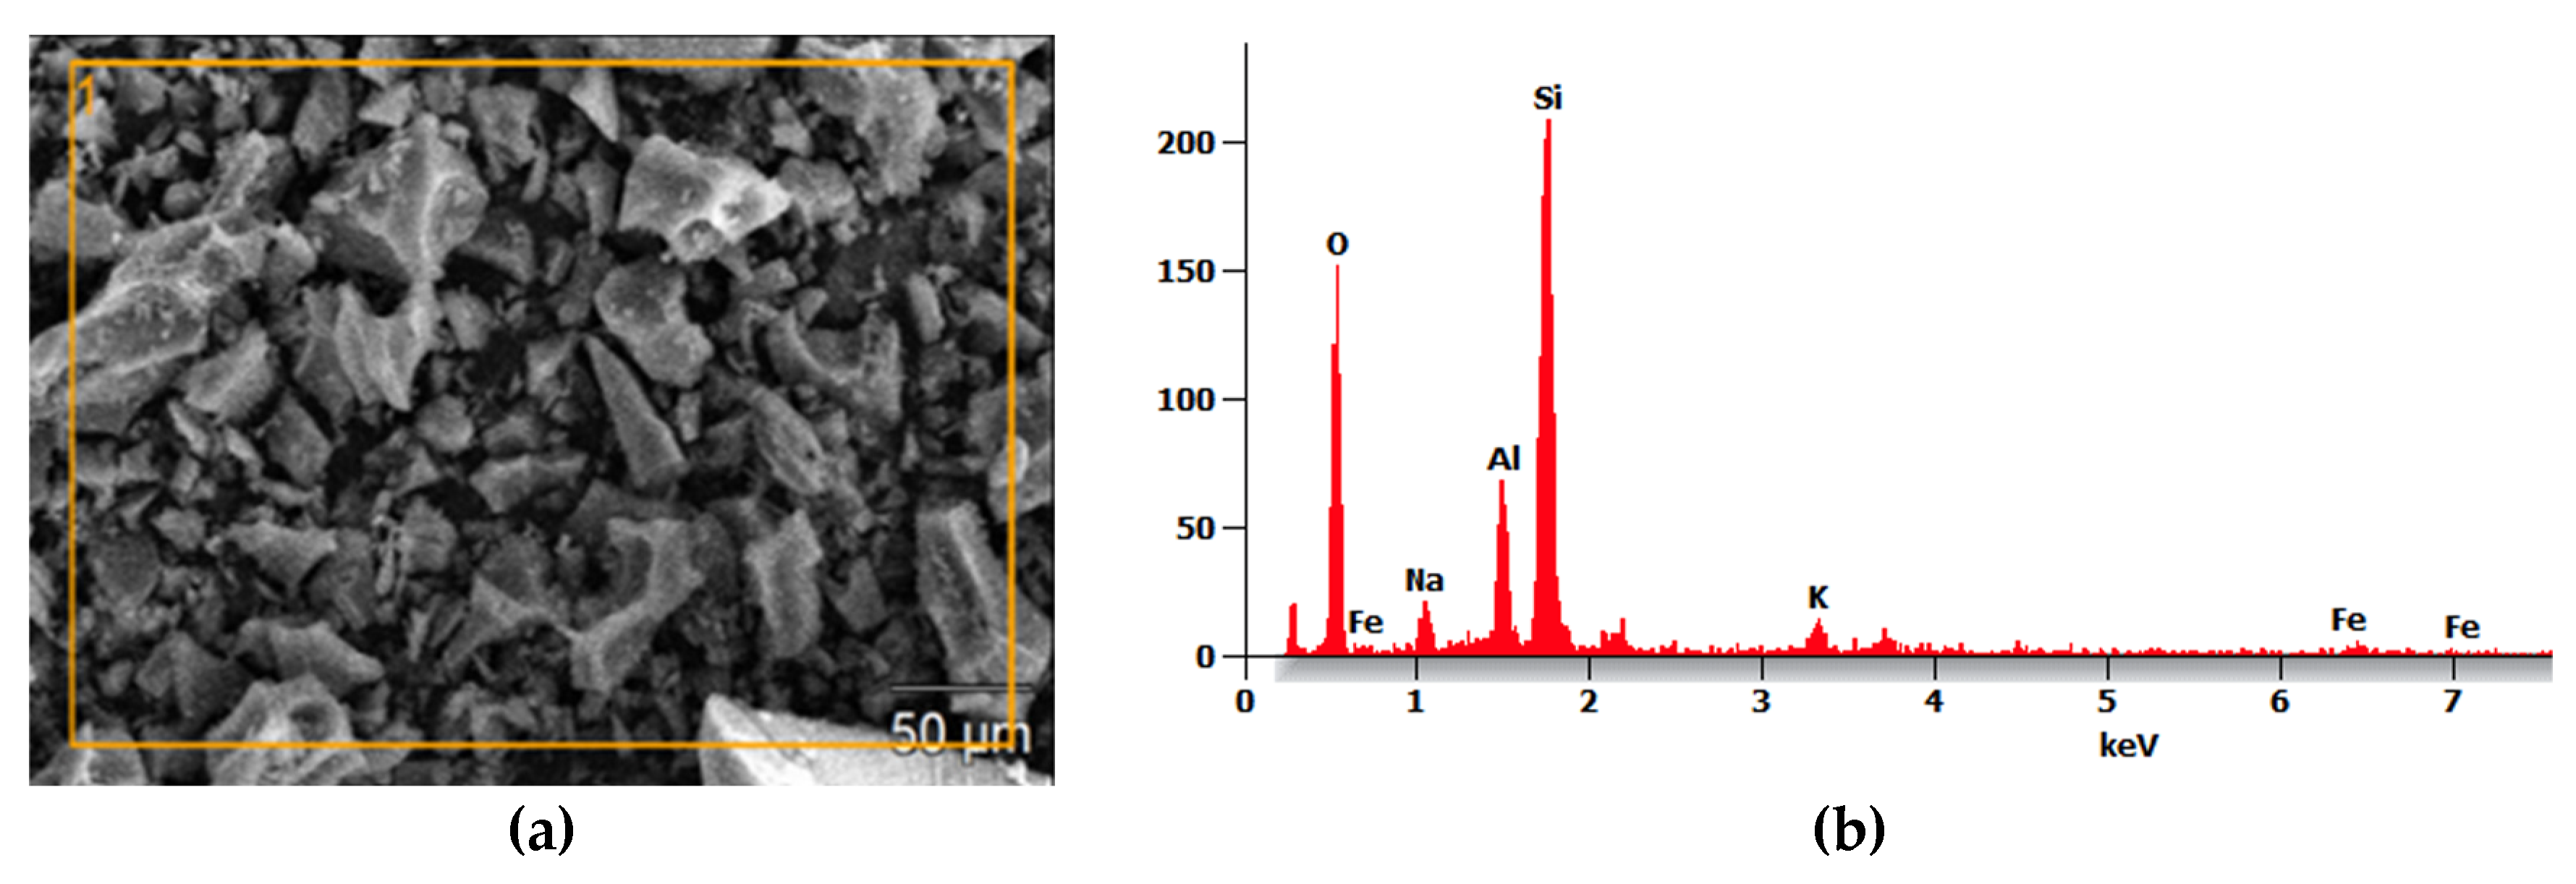
3, making it ideal for alkaline activation in geopolymer synthesis, as shown in
Figure 2b [
17]. The PP was sieved through a #200 mesh, with 88% of material passing through. For activation, it underwent thermal treatment in a furnace at 750 °C for 4 hours [
13].
2.1.3. Metakaolin (MK)
MK was obtained through the calcination process of PZ-400 kaolin in a furnace at 750 °C for 4 hours. The main composition of this material is quartz and alumina, as shown in
Figure 3b.
2.2. Methods
MTs and binding materials were previously characterized in terms of their chemical composition, toxicology, and microstructure, as described in the materials section.
2.2.1. Preparation of Alkaline Activating Solution
Alkali-activator solution was prepared using commercial 10 M NaOH and commercial sodium silicate (Na2SiO3) with a molar ratio (SiO2/Na2O) of 2.5. This solution was prepared 24 hours before use to ensure complete activation of the reagents. NaOH, with a purity of 98%, was used in granular form, while sodium silicate had a density of 50.3 °Bé at 20 °C and a viscosity of 1283 cps at the same temperature, with a total solids content of 45.26%.
2.2.2. Preparation of Geopolymer
MTs, previously characterized in terms of their chemical composition, toxicology, and microstructure, underwent a mechanochemical stabilization process. This included grinding the tailings with sodium sulfide nonahydrate (Na2S·9H2O) and elemental sulfur at 1% and 0.5% by weight, respectively, for 30 minutes in a ball mill at 60 rpm. The objective was to stabilize the metal cations and reduce the particle size to less than 65 µm by 90% of the weight.
Subsequently, the stabilized MTs were mixed with 1% by weight of plasticizer in a planetary mixer for 5 minutes at 160 rpm. MK and PP were then added according to the formulation in
Table 4, mixed at 60 rpm for 5 minutes to homogenize the mixture.
Finally, the alkali-activator solution was added with a volumetric ratio (NaOH/Na2SiO3) of 1.9. The mixture was stirred for 5 minutes at 60 rpm, followed by 10 minutes at 160 rpm until a paste-like and homogeneous aluminosilicate gel was obtained. This paste mixture was poured into 50 mm cubic molds and manually compacted to remove air bubbles.
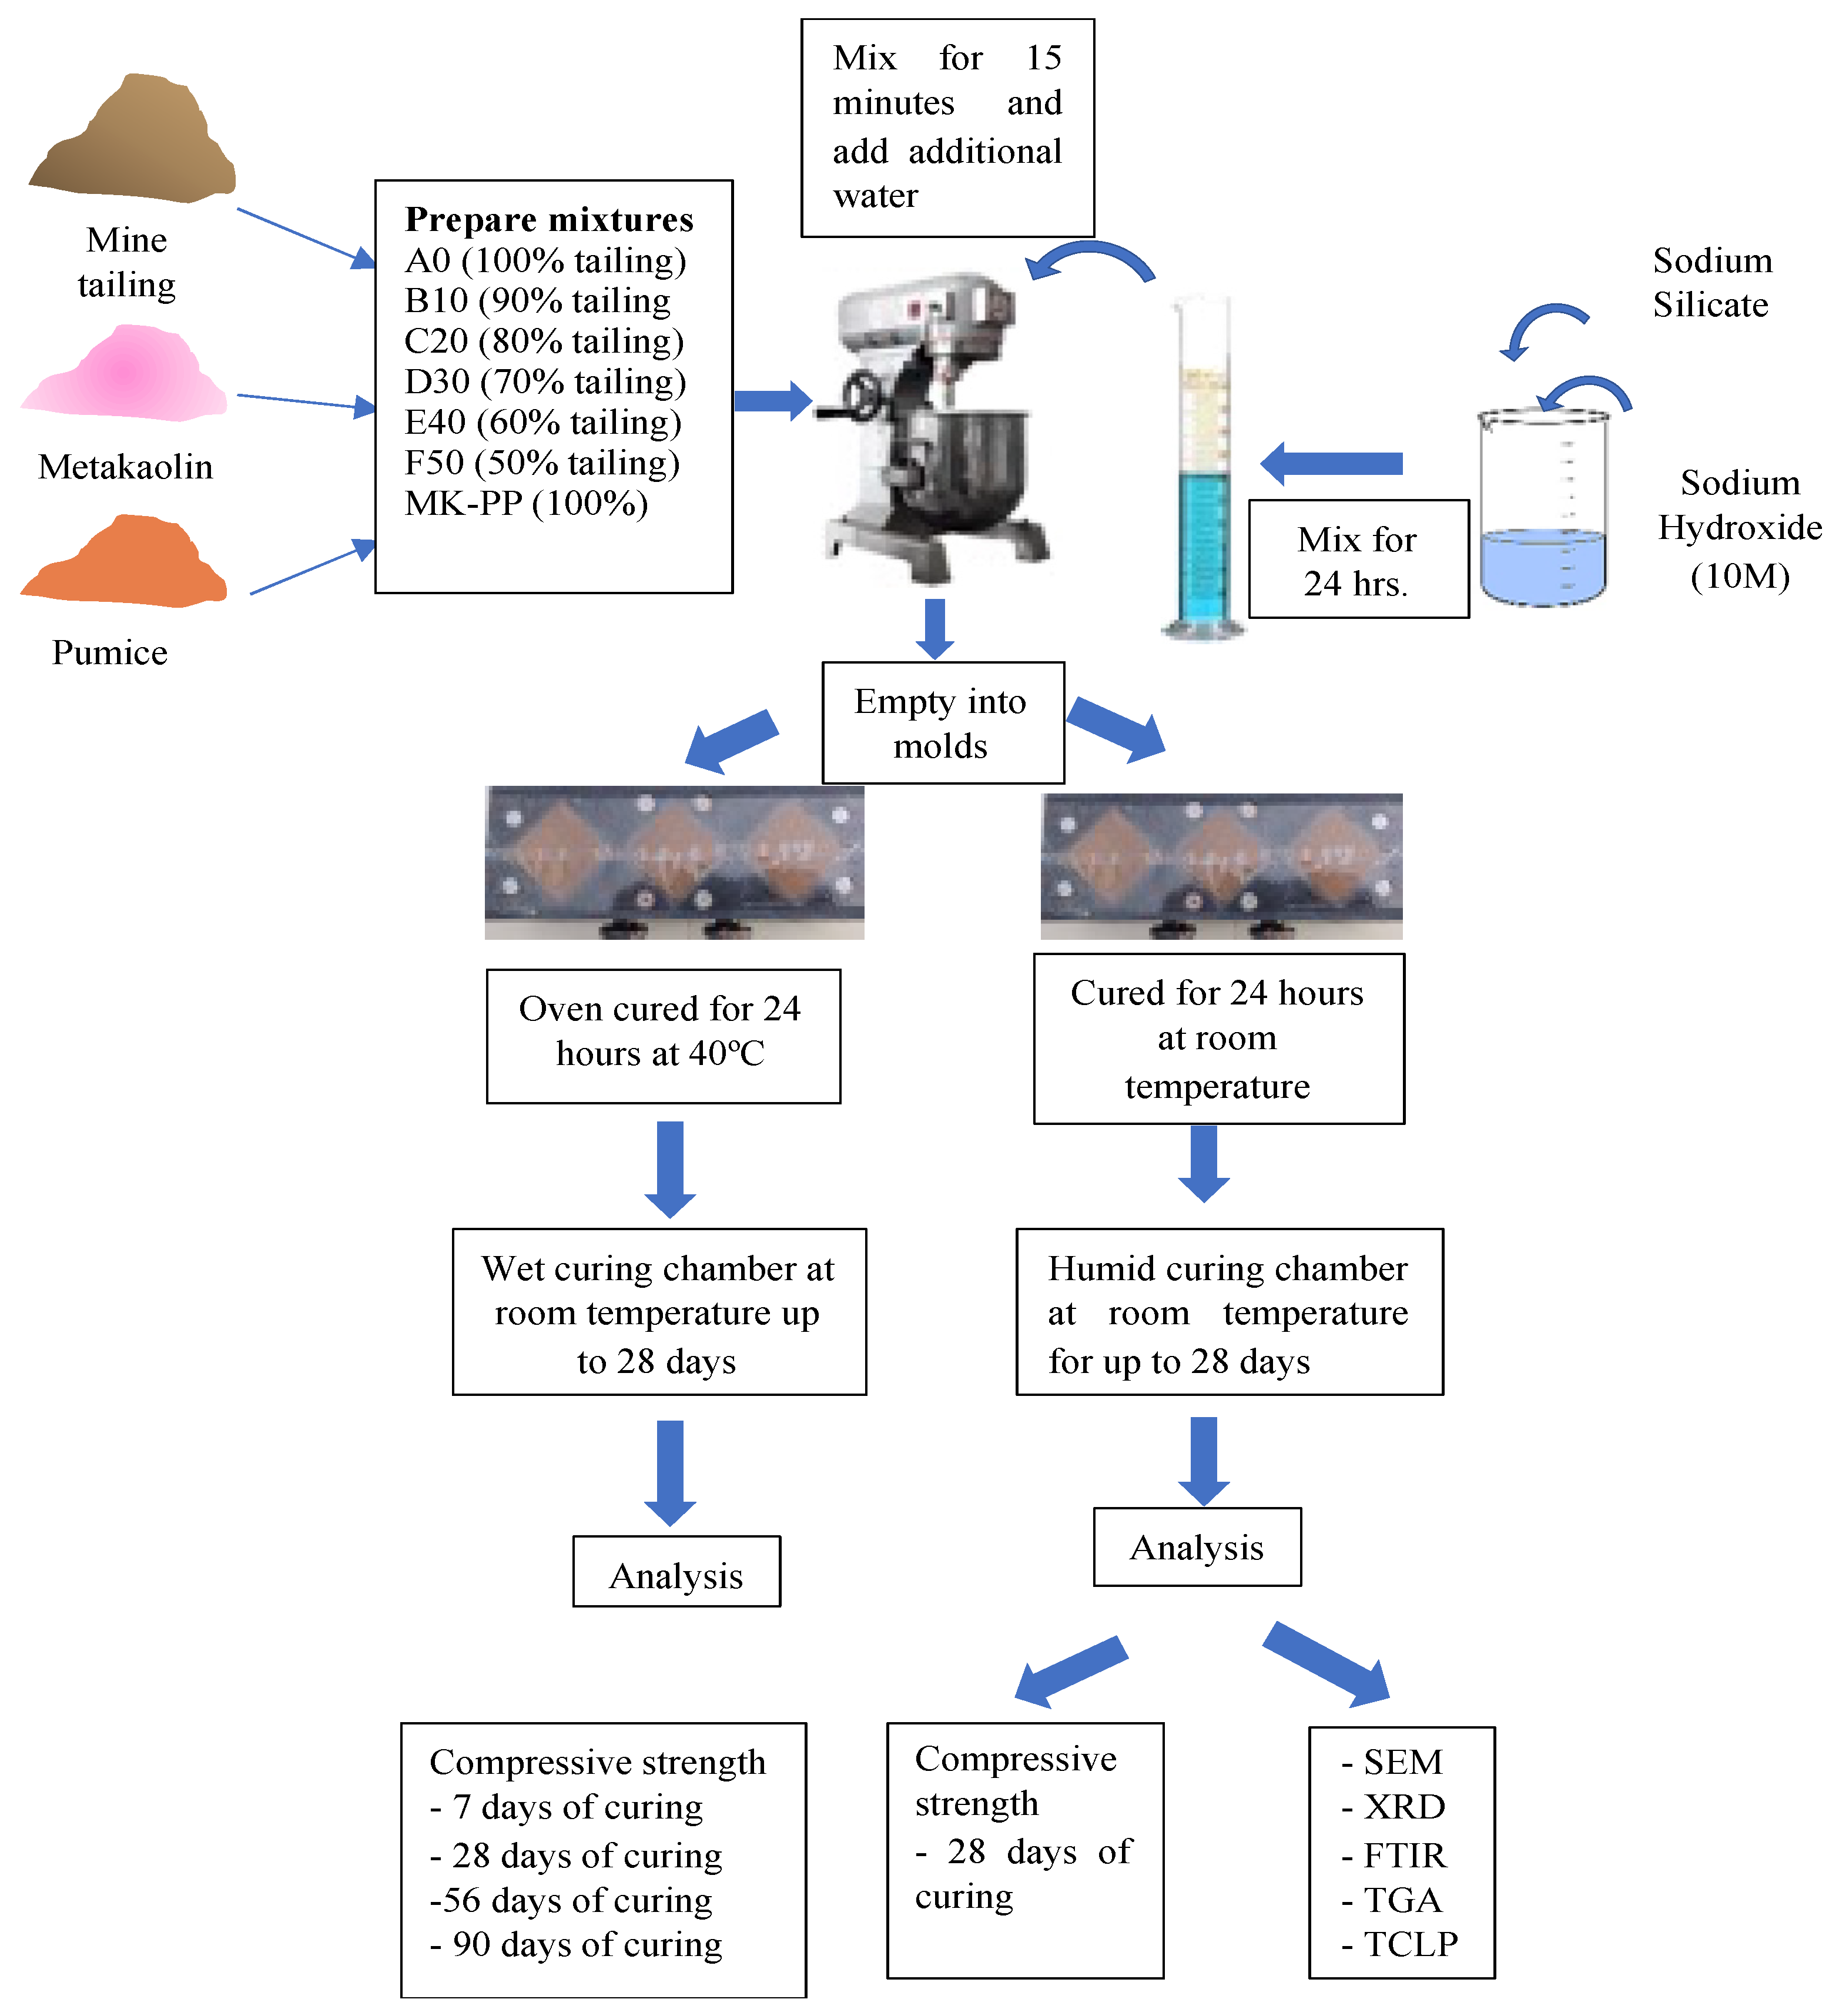
The molds were sealed with adhesive tape and cured at 40°C for 20 hours or under ambient conditions (20±2°C) for the same period. After curing, the specimens were demolded and transferred to a curing chamber with 80% relative humidity for compression strength tests at 7, 14, 28, and 56 days, as seen in
Figure 4.
2.3. Techniques for Characterization of Mine Tailings-Based Geopolymers
2.3.1. Mechanical Compression Strength
Tests were conducted following ASTM C-109 (Standard Test Method for Compressive Strength of Hydraulic Cement Mortars) using 2-inch or 50 mm cubic specimens. A digital press ADR Touch 2000 from ELE International with a capacity of 2000 kN was employed. A constant load rate of 0.024 inches per minute was used for the load application. Mechanical properties were evaluated using two approaches. The first set of geopolymers underwent initial curing at 40°C for 20 hours, while the second set cured at ambient temperature for the same duration. Both sets were demolded and placed in a humid chamber for scheduled monitoring. Evaluations for geopolymers cured at 40°C were conducted at 7, 14, 28, 56, and 90 days, whereas geopolymers cured at ambient temperature were evaluated only at 28 days.
Fragments resulting from the mechanical compression test of the block showing the best mechanical performance were used for microstructural and toxicological assays to assess microstructural stability and immobilization of the 5 PTHMs (As, Pb, Cd, Hg, and Zn).
2.3.2. Mineralogical Analysis of Geopolymers
X-ray diffraction (XRD) was used to characterize the mineral components of the MTs. A D8 Advance Diffractometer with Co Tube (38 kV, 25 mA) and wavelengths of Kα1 equal to 1.78897 Å and Kα2 equal to 1.79285 Å was used. It includes a Kbeta filter and a LynxEye XE detector with a measurement range of 2θ from 4° to 70°. Additionally, it is equipped with a database-driven phase identification using the International Centre for Diffraction Data (ICDD) PDF-2 – 2014, with quantification based on the Rietveld refinement method (TOPAS Structure Database).
2.3.3. Infrared Spectroscopic Analysis of Geopolymers
A PerkinElmer Frontier spectrometer was used, which performs two scans with a resolution of 4, using the MIR-TGS detector and a mid-range infrared source. This spectrometer has a scan speed of 0.2 cm/s and covers a range from 4000 to 400 cm⁻¹.
2.3.4. Morphological Analysis of Geopolymers
The samples are the same as those used for XRD and FTIR analyses. The equipment used was a THERMO SCIENTIFIC SCIOS 2 Scanning Electron Microscope to scan and examine the surface of the geopolymer, enabling measurement and evaluation of details.
2.3.5. Thermogravimetric Analysis
A Perkin Elmer TGA 8000 thermogravimetric analyzer (TG/DTA, up to 1000 °C) was used to determine water loss temperatures (free, adsorbed, and chemically bound water) and the thermal decomposition of minerals in the geopolymer samples. The samples were loaded into a platinum crucible and heated from 40 to 1000 °C at 10 °C/min in a pure nitrogen atmosphere at a flow rate of 200 ml/min.
2.3.6. Toxicological Analysis of Geopolymers
To evaluate the environmental impact, leaching tests were conducted using the Toxicity Characteristic Leaching Procedure (TCLP) 1311 from the U.S. EPA. The process began by weighing 5 g of sample with a particle size less than 9 mm, which were placed in a beaker. Subsequently, 96.5 ml of distilled and deionized water were added to form a homogeneous mixture. This mixture was stirred for 5 minutes on a magnetic stirrer to ensure complete dispersion of the sample.
Next, the pH of the solution was measured using a HANNA pH meter. If the pH obtained was equal to or less than 5, extraction solution No. 1 was chosen. Otherwise, 3.5 mL of 1N hydrochloric acid were added to the mixture and homogenized again.
Then, this solution was heated to 50°C for 10 minutes and subsequently cooled to room temperature, followed by a new pH measurement. If the resulting pH was equal to or less than 5 after this process, extraction solution No. 1 was used; otherwise, extraction solution No. 2 was selected.
Regarding the preparation of the extraction solutions, the following specific procedures were carried out: For extraction solution No. 1, precisely 64.3 mL of 1N NaOH was measured and diluted with distilled water to a total volume of 1 L of solution, ensuring that the resulting pH was within the range of 4.93 ± 0.05. On the other hand, for extraction solution No. 2, exactly 5.7 mL of glacial acetic acid was measured in a flask and completed with distilled water to a volume of 1 L of solution, ensuring that the final pH was within the range of 2.88 ± 0.05.
Leaching of the selected sample: 5 g of material with a particle size less than 9.0 mm was weighed, maintaining a weight/volume ratio of 1/20. The sample was transferred to a suitable container and sealed tightly with tape to prevent possible leaks. It was then continuously stirred for a period of 18 ± 2 hours at room temperature, followed by filtration using filter paper, thereby obtaining the leachate extract.
Subsequently, tests were conducted to determine the concentration of heavy metals present in the leachate, following the USEPA-SW-846 method “Test Methods for Evaluating Solid Waste”. These analyses were performed using the ICP-OES technique with the Perkin Elmer AVIO-550 max equipment at Analytics’ Laboratories del Sur S.R.L.
3. Results
3.1. Mechanical Properties
3.1.1. Mechanical Compression Strength of Geopolymers with Initial Curing at 40°C for 20 Hours
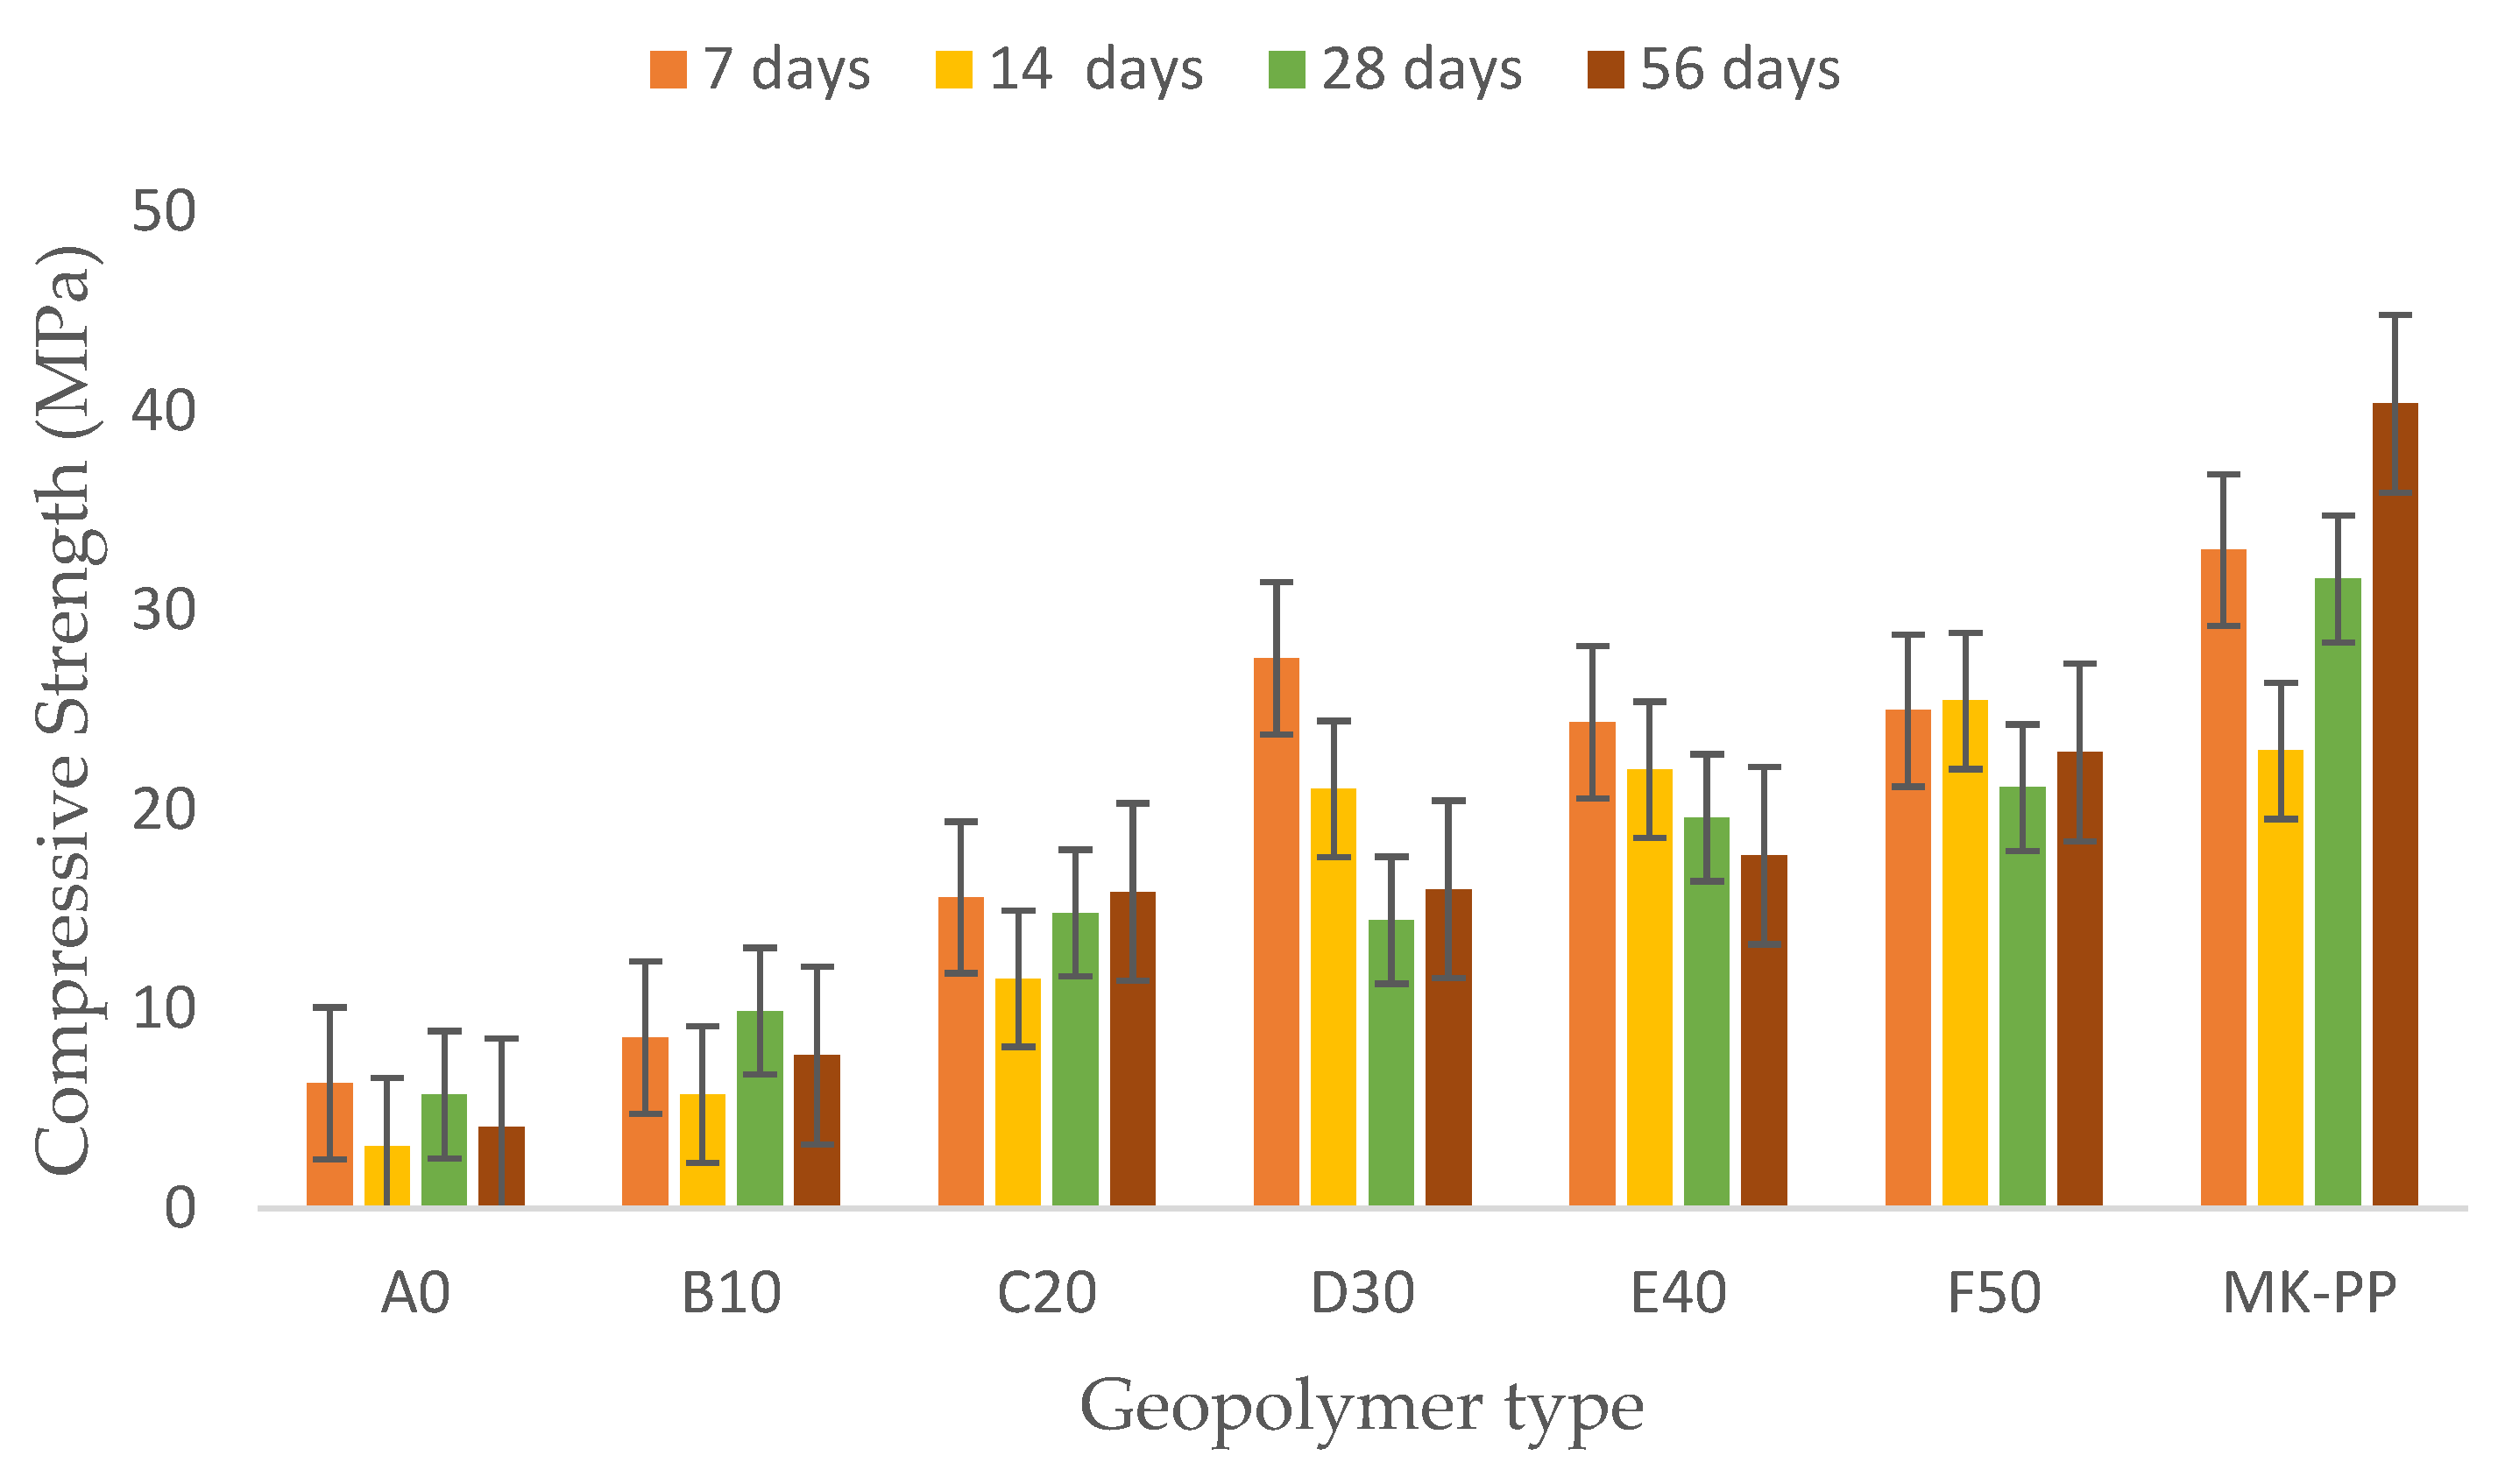
As shown in
Figure 5, geopolymer A0, with a binder-to-MTs ratio of 0/100 (i.e., Pure MTs as the solid precursor), exhibited a compressive strength of 6.27 MPa. With a 10% binder (i.e., binder-to-MTs ratio of 10/90), the strength increased by 27% compared to the initial value. Increasing the ratio to 20/80 improved the compressive strength by 109%, and at 30/70, the improvement rose to 185% compared to the initial value. However, increasing the binder-to-MTs ratio to 40/60 resulted in an 11% decrease, and finally, with a ratio of 50/50, there was a slight increase of 2.4% compared to geopolymer E40. This behavior was consistent across all four evaluated periods.
It is understood that as the binder content increases, there is a general improvement in mechanical behavior at each evaluated period. This behavior is related to the increased content of reactive aluminosilicate binder materials, resulting in increased Si and Al, which are fundamental components for the formation of sodium aluminosilicate hydrate gels (Na-A-S-H).
At 7 days of curing, geopolymer D30 exhibited the best mechanical performance, followed by E40 and F50. By day 14, geopolymer F50 showed the best performance, followed by E40 and D30. At 28 and 56 days of curing, geopolymers F50 and E40 demonstrated the best mechanical results. In contrast, the pure binder geopolymer, composed of 100% binder, achieved a maximum strength of 40.37 MPa at 56 days and a minimum of 22.95 MPa at 14 days as shown in
Figure 5.
Additionally, a notable development of compression strength is observed during the first week of curing, likely due to the initial thermal curing at 40°C for 20 hours. However, the trend towards decreasing mechanical behavior could be related to water loss during the thermal curing process.
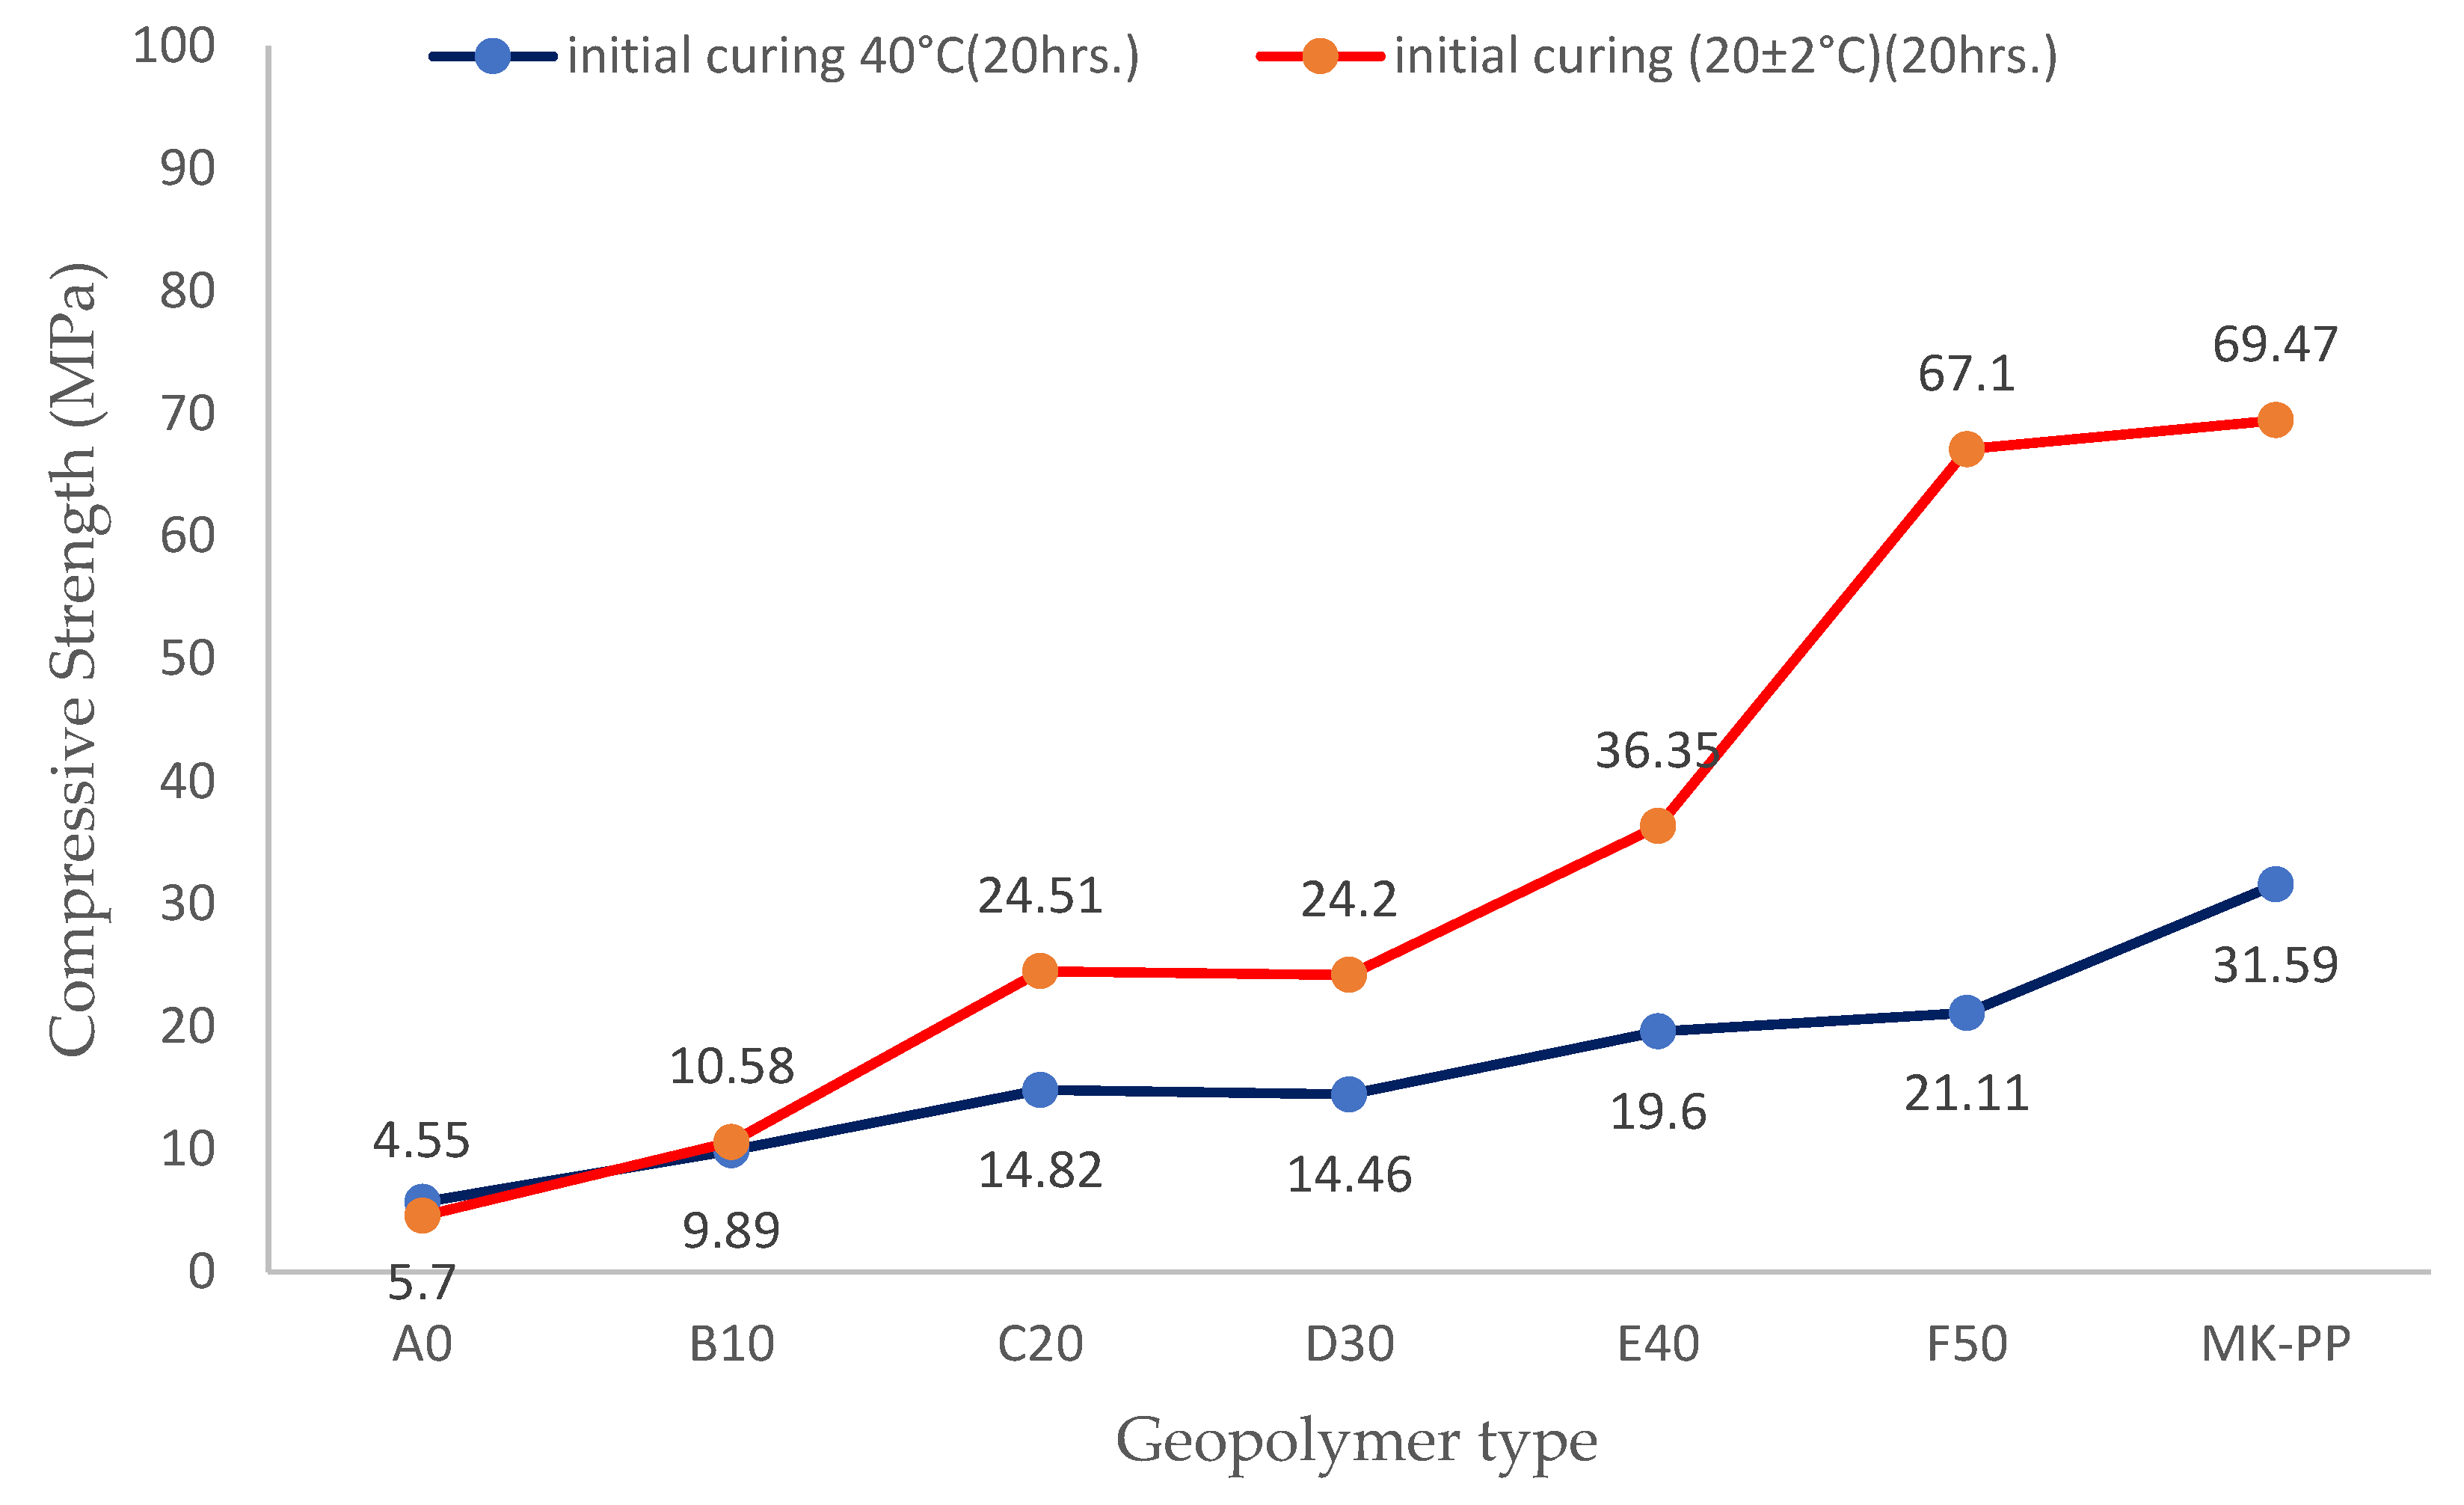
Figure 6 presents the strength development for the two curing regimes at 28 days for the analyzed geopolymers. Dataset shown in blue pertains to specimens that underwent initial curing for 20 hours at 40°C in an oven, while data for geopolymers represented by the red line correspond to initial curing for 20 hours under ambient conditions. It is observed that geopolymers treated under ambient conditions during the first 20 hours exhibit better performance.
For instance, at 28 days of curing, the geopolymer without binder reached a strength of 4.7 MPa, whereas the geopolymer with 50% binder achieved a maximum value of 67.1 MPa. In contrast, the geopolymer subjected to slightly elevated temperature curing during the first 20 hours at 40°C shows nearly similar values, with a strength of 4.55 MPa without binder and a maximum of 21.11 MPa with 50% binder. Therefore, geopolymers treated under ambient conditions showed better mechanical development over time.
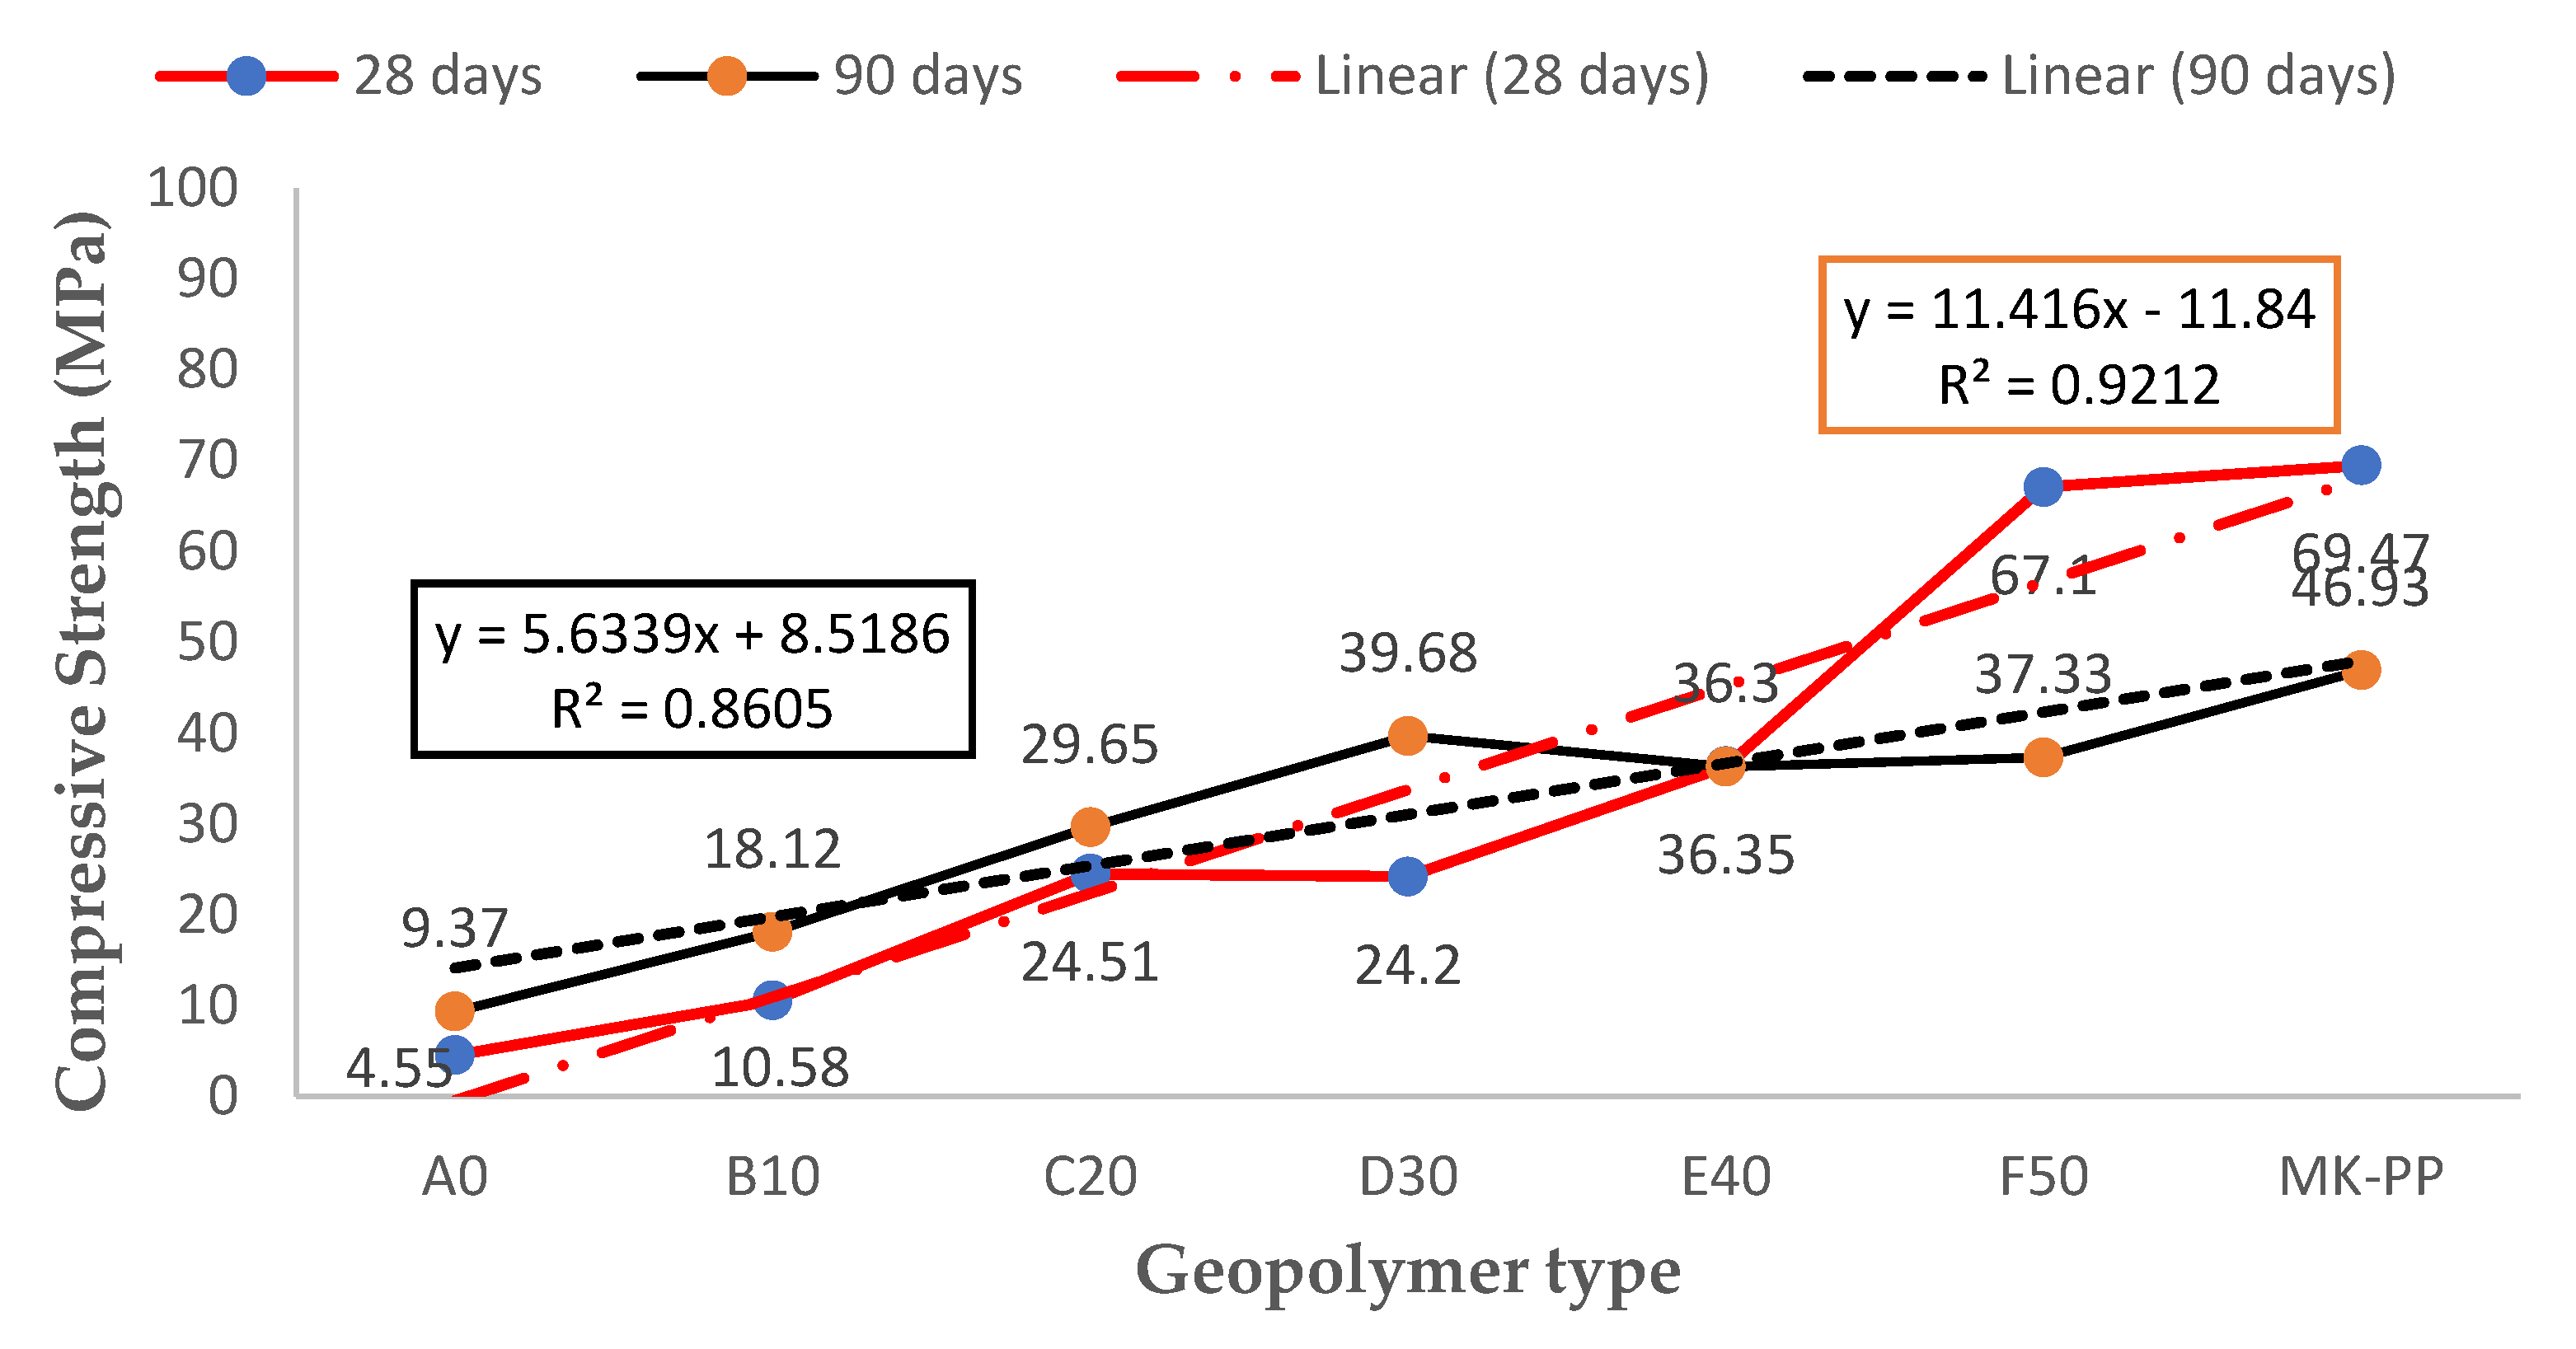
Figure 7 presents a comparison of compression strength results for two geopolymers cured under ambient conditions, one for 28 days and the other for 90 days. It is observed that geopolymer A0, cured for 90 days, experienced a 105% increase in compression strength compared to its counterpart cured for 28 days.
On the other hand, geopolymer D30 increases by 163%, while geopolymer E40 shows equal compression strength values at both 28 and 90 days. Additionally, geopolymer F50, cured for 28 days, exhibits better compression strength performance (an 80% increase) compared to its counterpart cured for 90 days.
It can be deduced that curing time has a significant impact on mechanical properties. It is suggested that prolonging curing time may not be necessary, especially when using a higher percentage of MTs in geopolymer formation, with a 50/50 ratio achieving a compression strength of 67 MPa. This behavior is described by a linear model with a correlation coefficient of 0.92, which is good for a linear regression.
3.2. Mineralogical Analysis
3.2.1. XRD Analysis
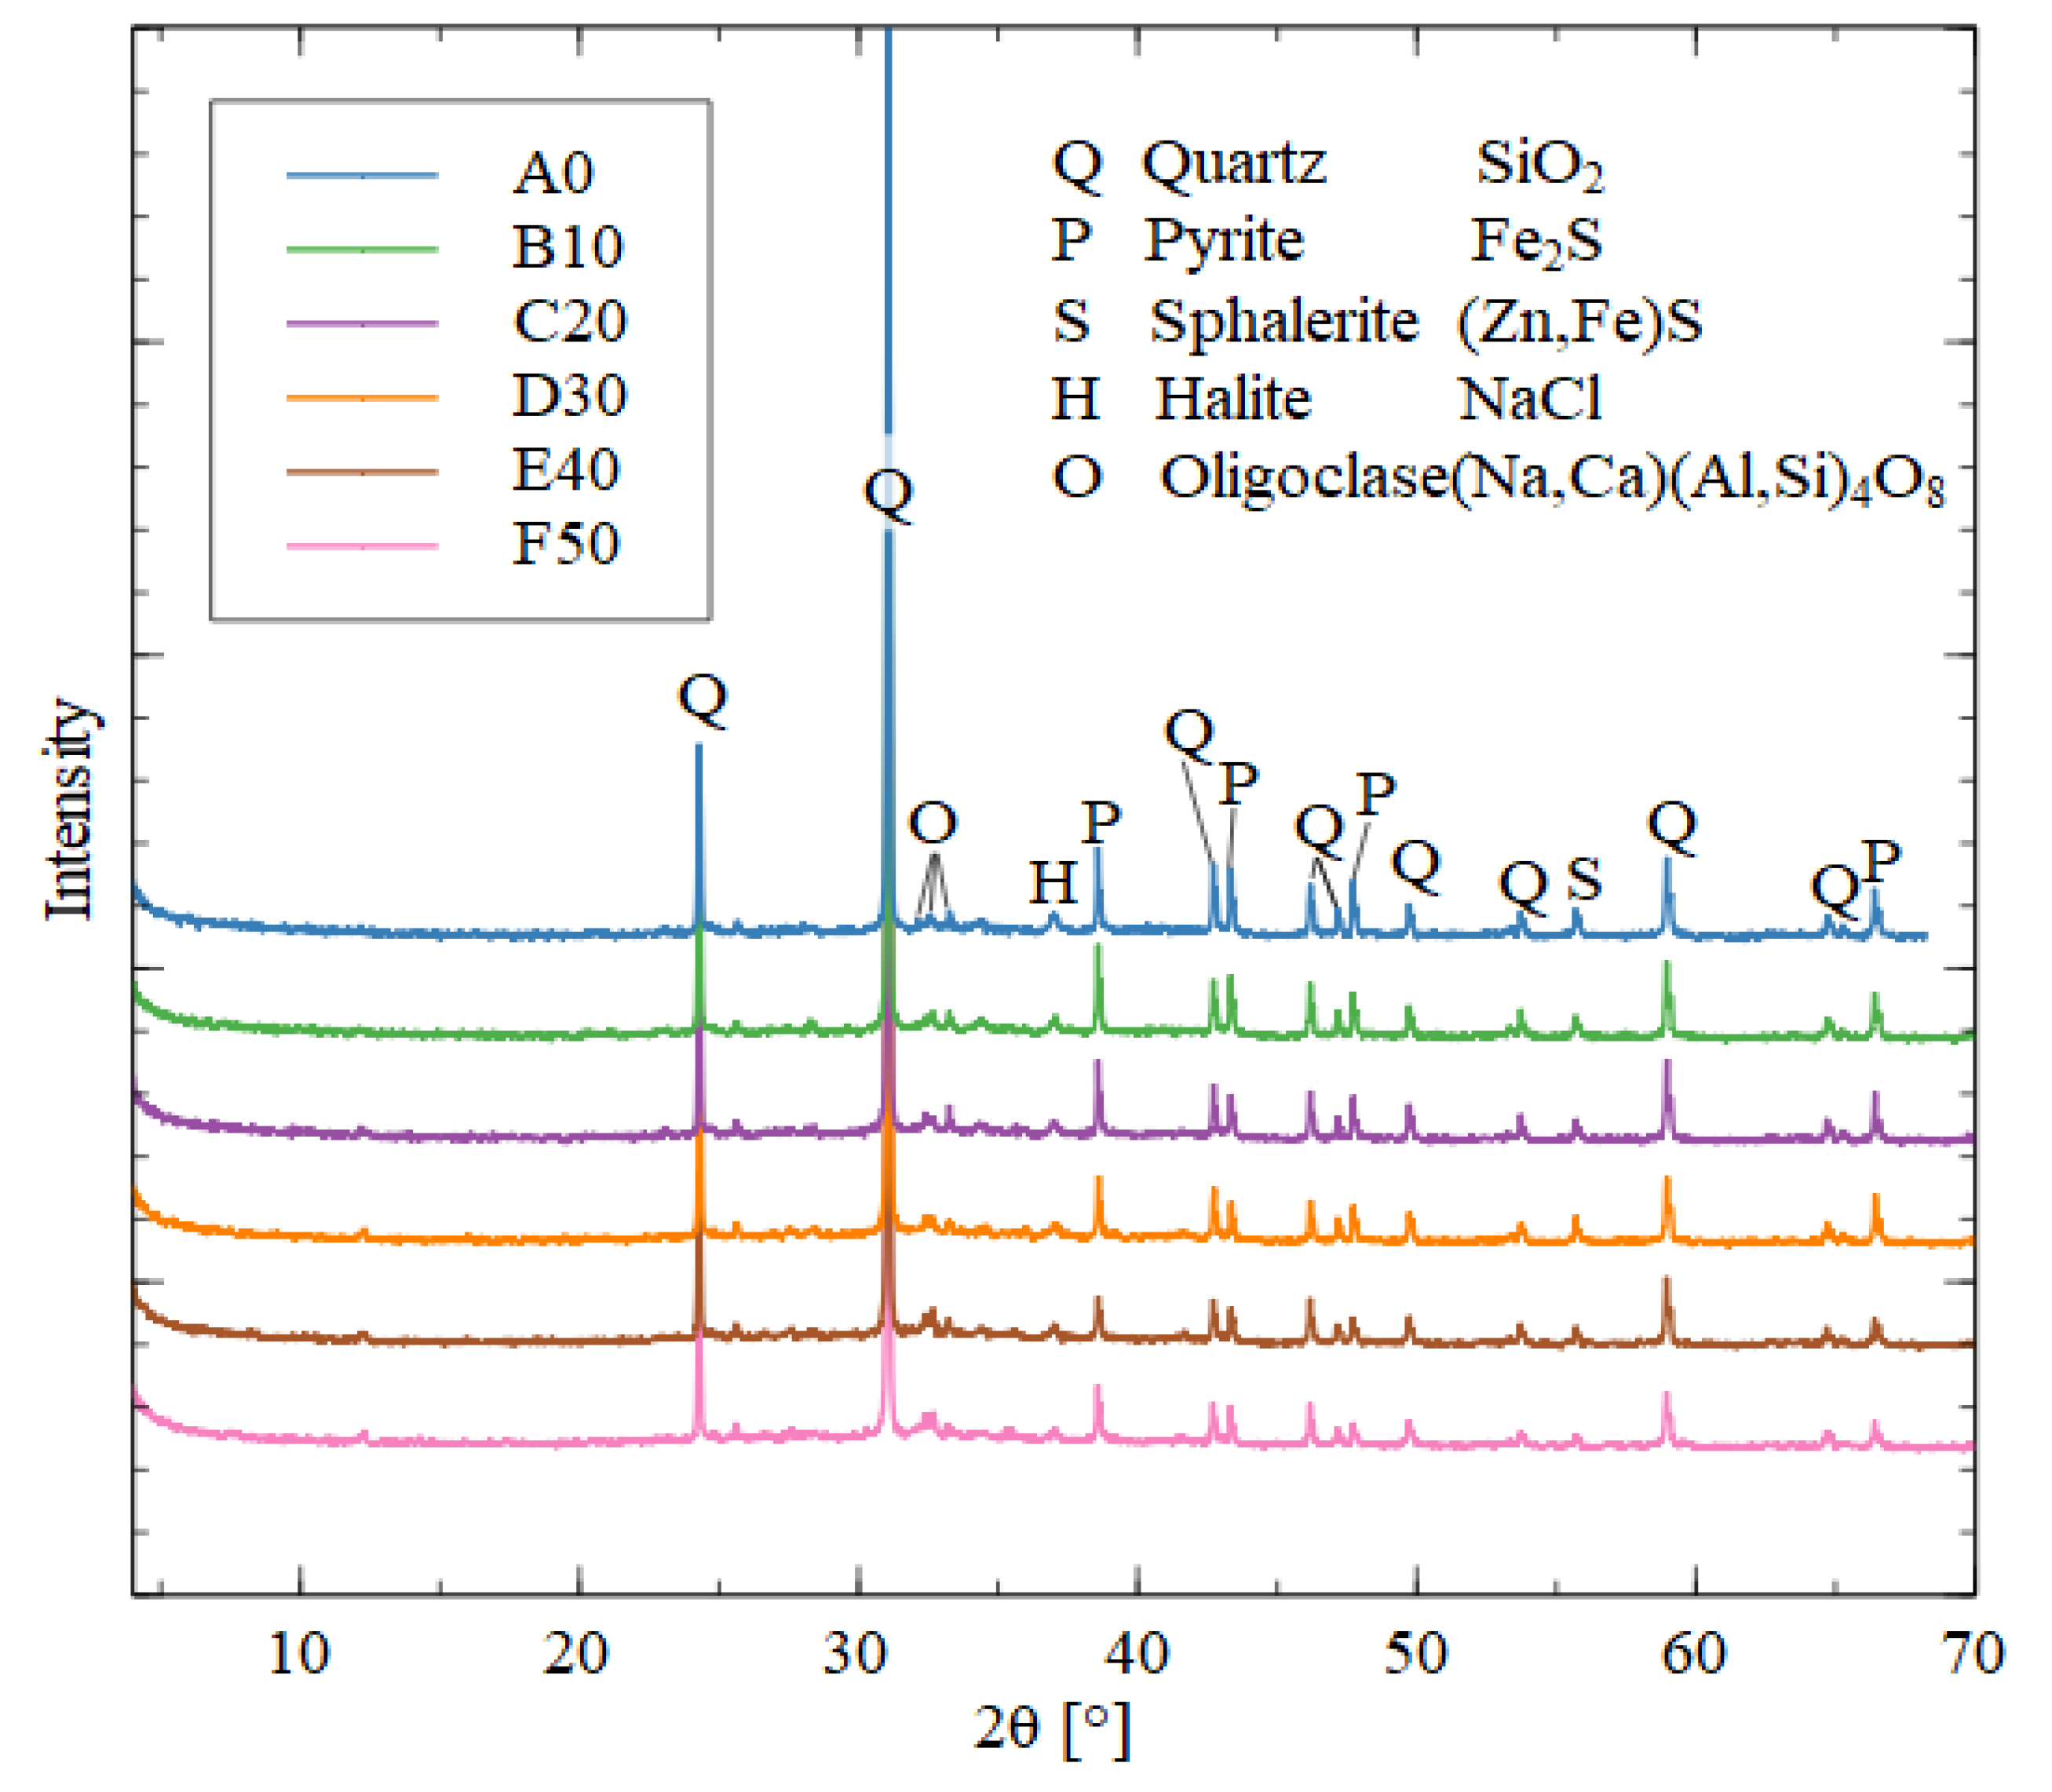
In
Figure 8, X-ray diffractogram of geopolymer A0 (100% MT), sharp peaks are observed, suggesting the formation of semi-crystalline to crystalline phases. The absence of a halo indicates that the geopolymeric material is not highly amorphous. Therefore, it is a geopolymer with low levels of geopolymerization, due to the absence of aluminosilicate material from the binder.
The dominant phase is quartz, followed by pyrite and oligoclase, with a notable presence of calcium carbonate, likely due to exposure to CO2 from the environment and the high calcium concentration in MTs.
The
Figure 8 present diffractograms of five samples, B10, C20, D30, E40, and F50. In all samples, quartz was the dominant phase, with concentrations exceeding 60%. However, there was a decrease in its concentration, from 67.4% to 61%.
This pattern is also observed in pyrite, indicating that both phases were incorporated into the geopolymeric material, contributing to enhanced compression strength. Additionally, goethite showed a decrease from 5.2% to 1.9%, suggesting that both goethite and pyrite integrate into geopolymers in the form of Na (Fe)-A-S-H.
In
Figure 8 the samples D30, E40, and F50, a halo was observed, indicating the presence of amorphous material in the geopolymer. This is due to the predominance of aluminosilicate material from the binder. This behavior is characteristic of a geopolymeric material with good geopolymerization [
18,
19].
3.3. Infrared Spectroscopic Analysis of Geopolymer
3.3.1. FTIR Analysis
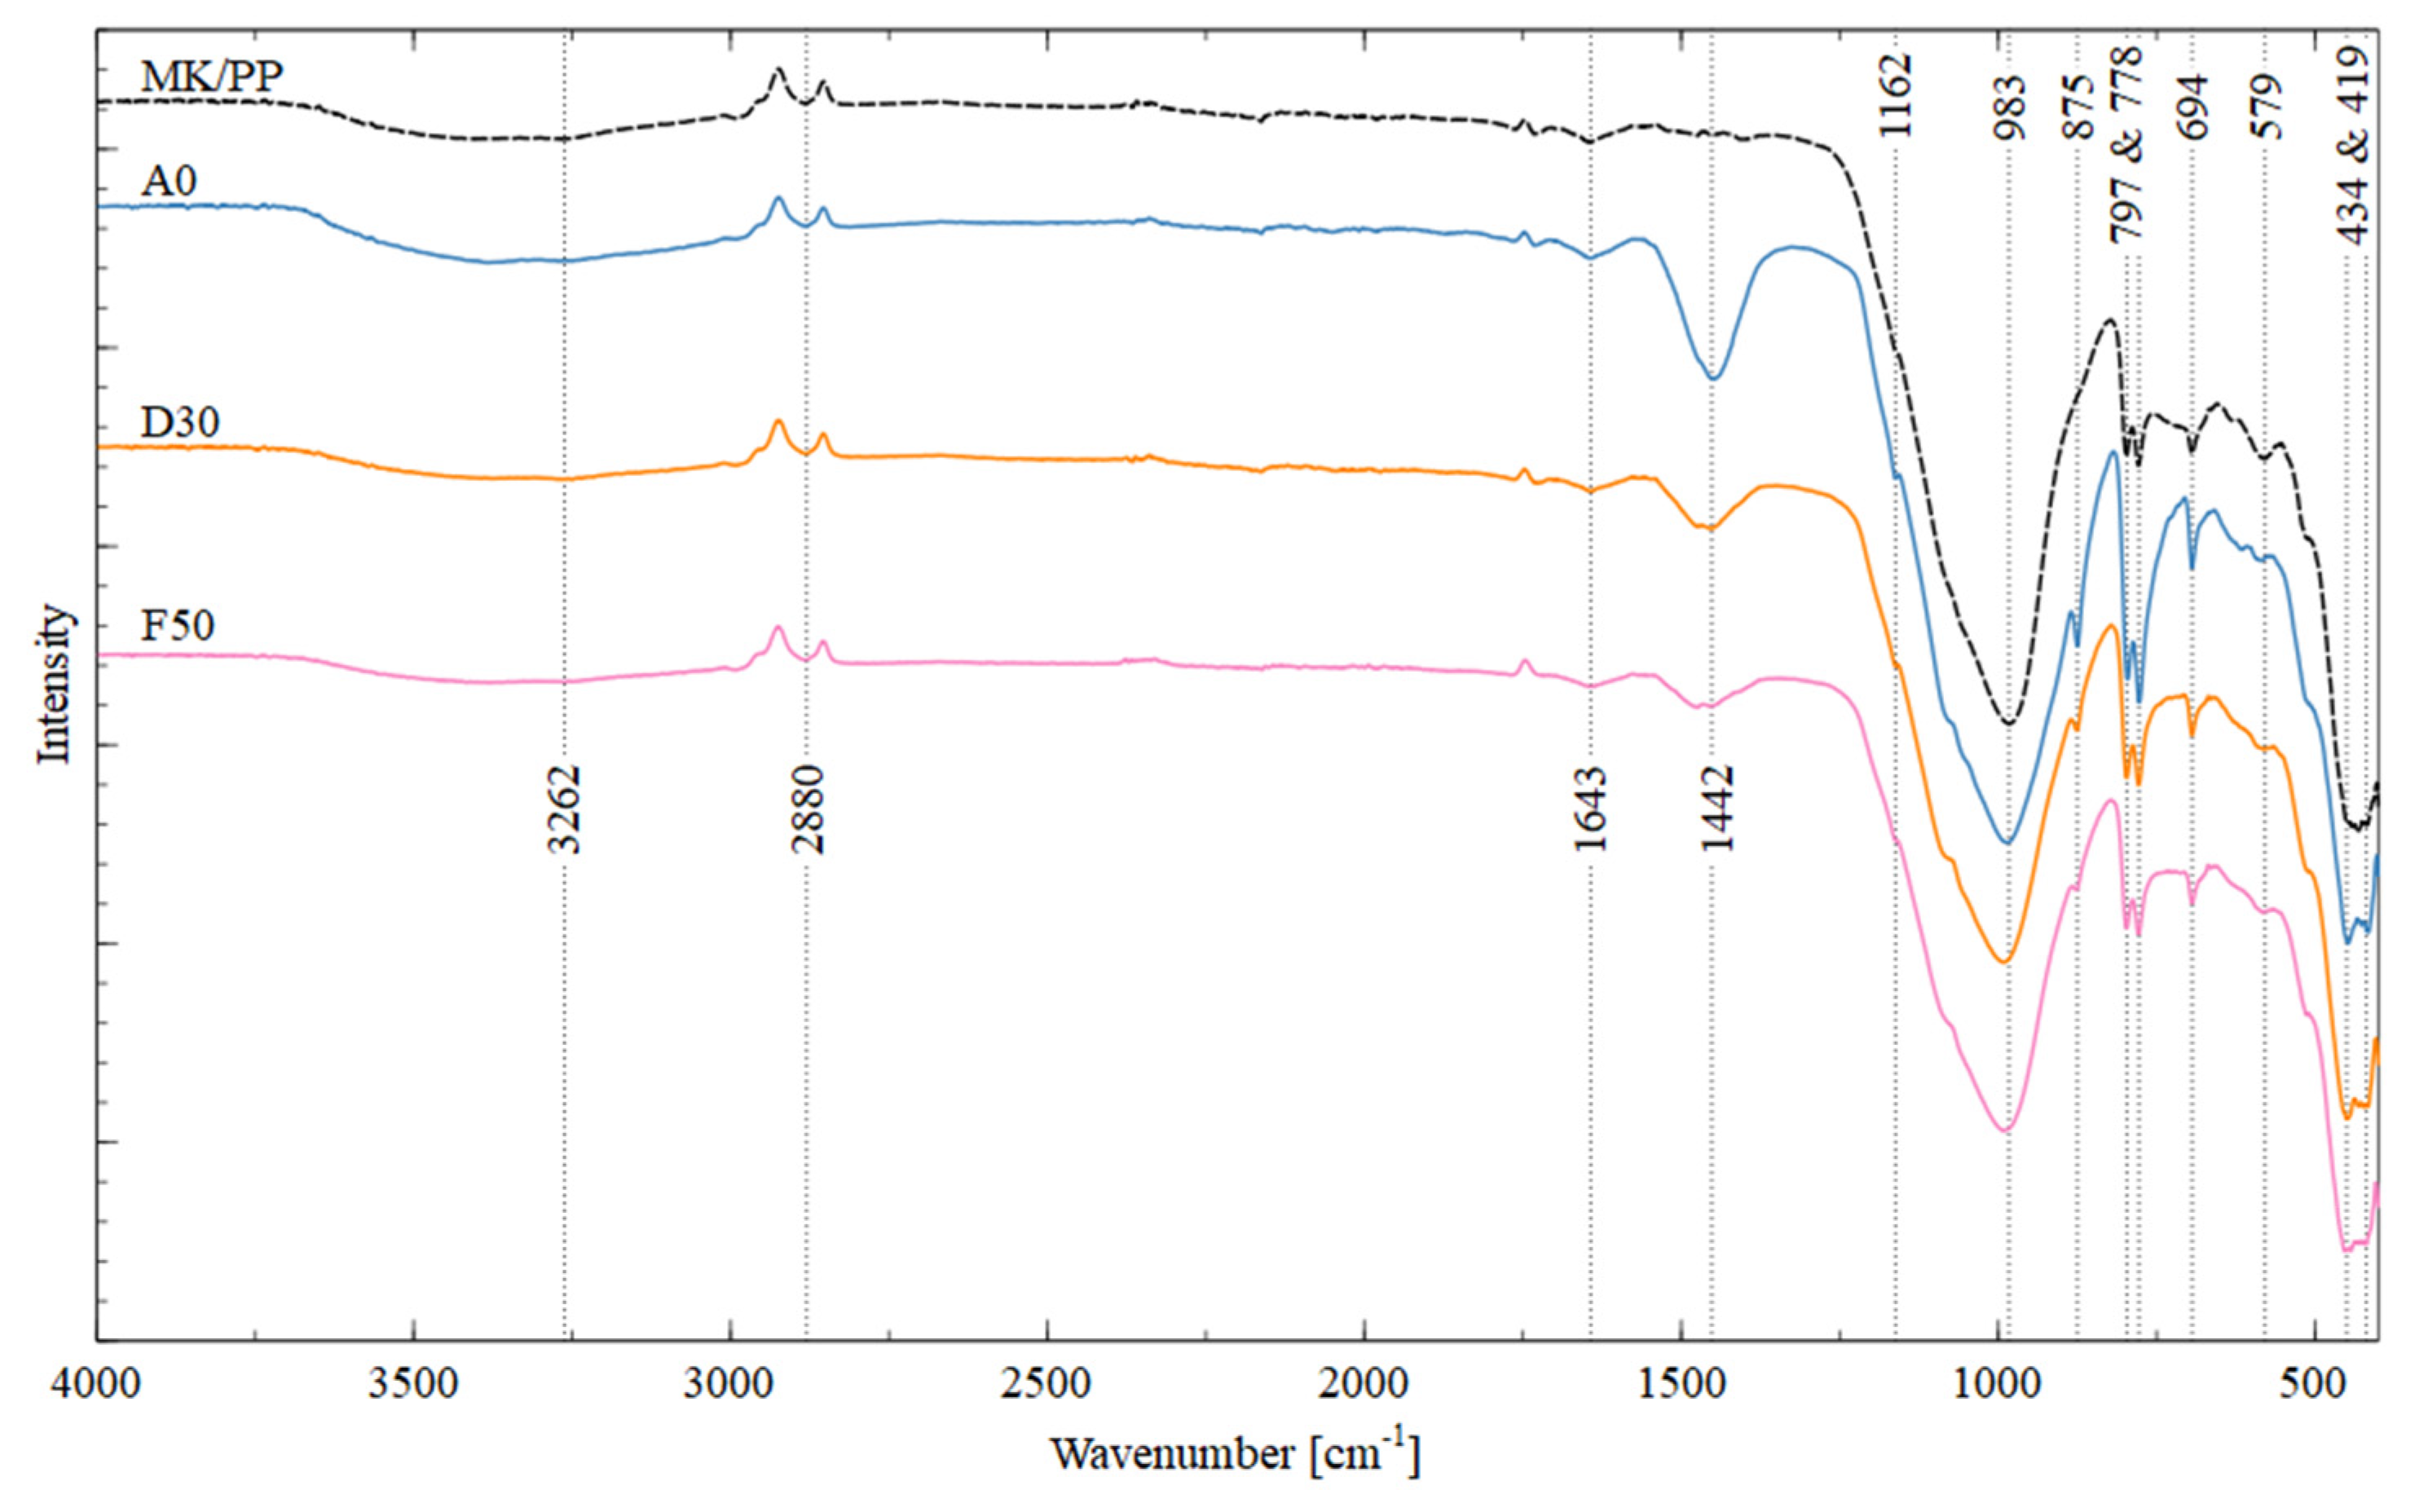
The FTIR spectrum showed that both the geopolymer and the raw materials consist primarily of Si-O and Al-O bonds, due to the high content of Si and Al in the binder and MTs. Additionally, it was observed that H-O and H-O-H bonds could correspond to the formation of water molecules, while C-O bonds could be associated with the formation of alkaline carbonates due to environmental carbonation and the presence of calcite in the tailings.
Figure 9 shows that the band 2280 cm
-1 located between 3250.48 and 3380 cm^-1 correspond to the stretching vibrations of the H-O bond of water molecules loosely bound to sodium aluminosilicate hydrate gels (N-A-S-H) [
20]. Furthermore, the band around 1641 cm^-1 is associated with the bending vibration of -OH from absorbed water [
21].
The bands between 1448, 1452, and 1474 cm^-1, within the range of 1340 to 1460 cm^-1, correspond to the asymmetric stretching vibration of the C-O bond of CO32- from Na2CO3, a compound formed by excess Na in geopolymers and atmospheric CO2 [
22], or from calcium carbonate (due to the presence of calcite in MTs). The band near 1162 cm^-1 is attributed to the asymmetric stretching vibration of the Si-O-Si bond and the bending vibration of the Al-O-Si bond, indicative of the presence of geopolymers and unreacted binder materials [
21], present in all four analyzed samples.
Additionally, main bands are observed in all four samples in the range of 983 to 991 cm^-1, corresponding to the asymmetric stretching vibration of Si-O-T bonds (T=Tetrahedron of Si and Al), which are shifted bands observed at 1162 cm^-1, indicating that the geopolymerization process has completed and stabilized around 987 – 1010 cm
-1 [
23].
On the other hand, the band present in three samples, except in the control sample, at a wavelength of 875 cm^-1 is attributed to the stretching vibration of the Si-O bond and the bending vibration of OH from Si-OH groups.
The bands in the range of 797 to 694 cm
-1 are related to symmetric vibrations of Si-O-T bonds and appear in all four studied samples [
21]. Finally, the bands between 450 and 470 cm
-1 correspond to the stretching vibrations of Si-O-Si and O-Si-O bonds [
12,
24], while the bands around 419 cm
-1 present in all four studied samples are attributed to Fe
2+O
- vibrations [
25].
3.4. Morphological Analysis of Geopolymers
3.4.1. SEM/EDS Analysis of Formed Geopolymers
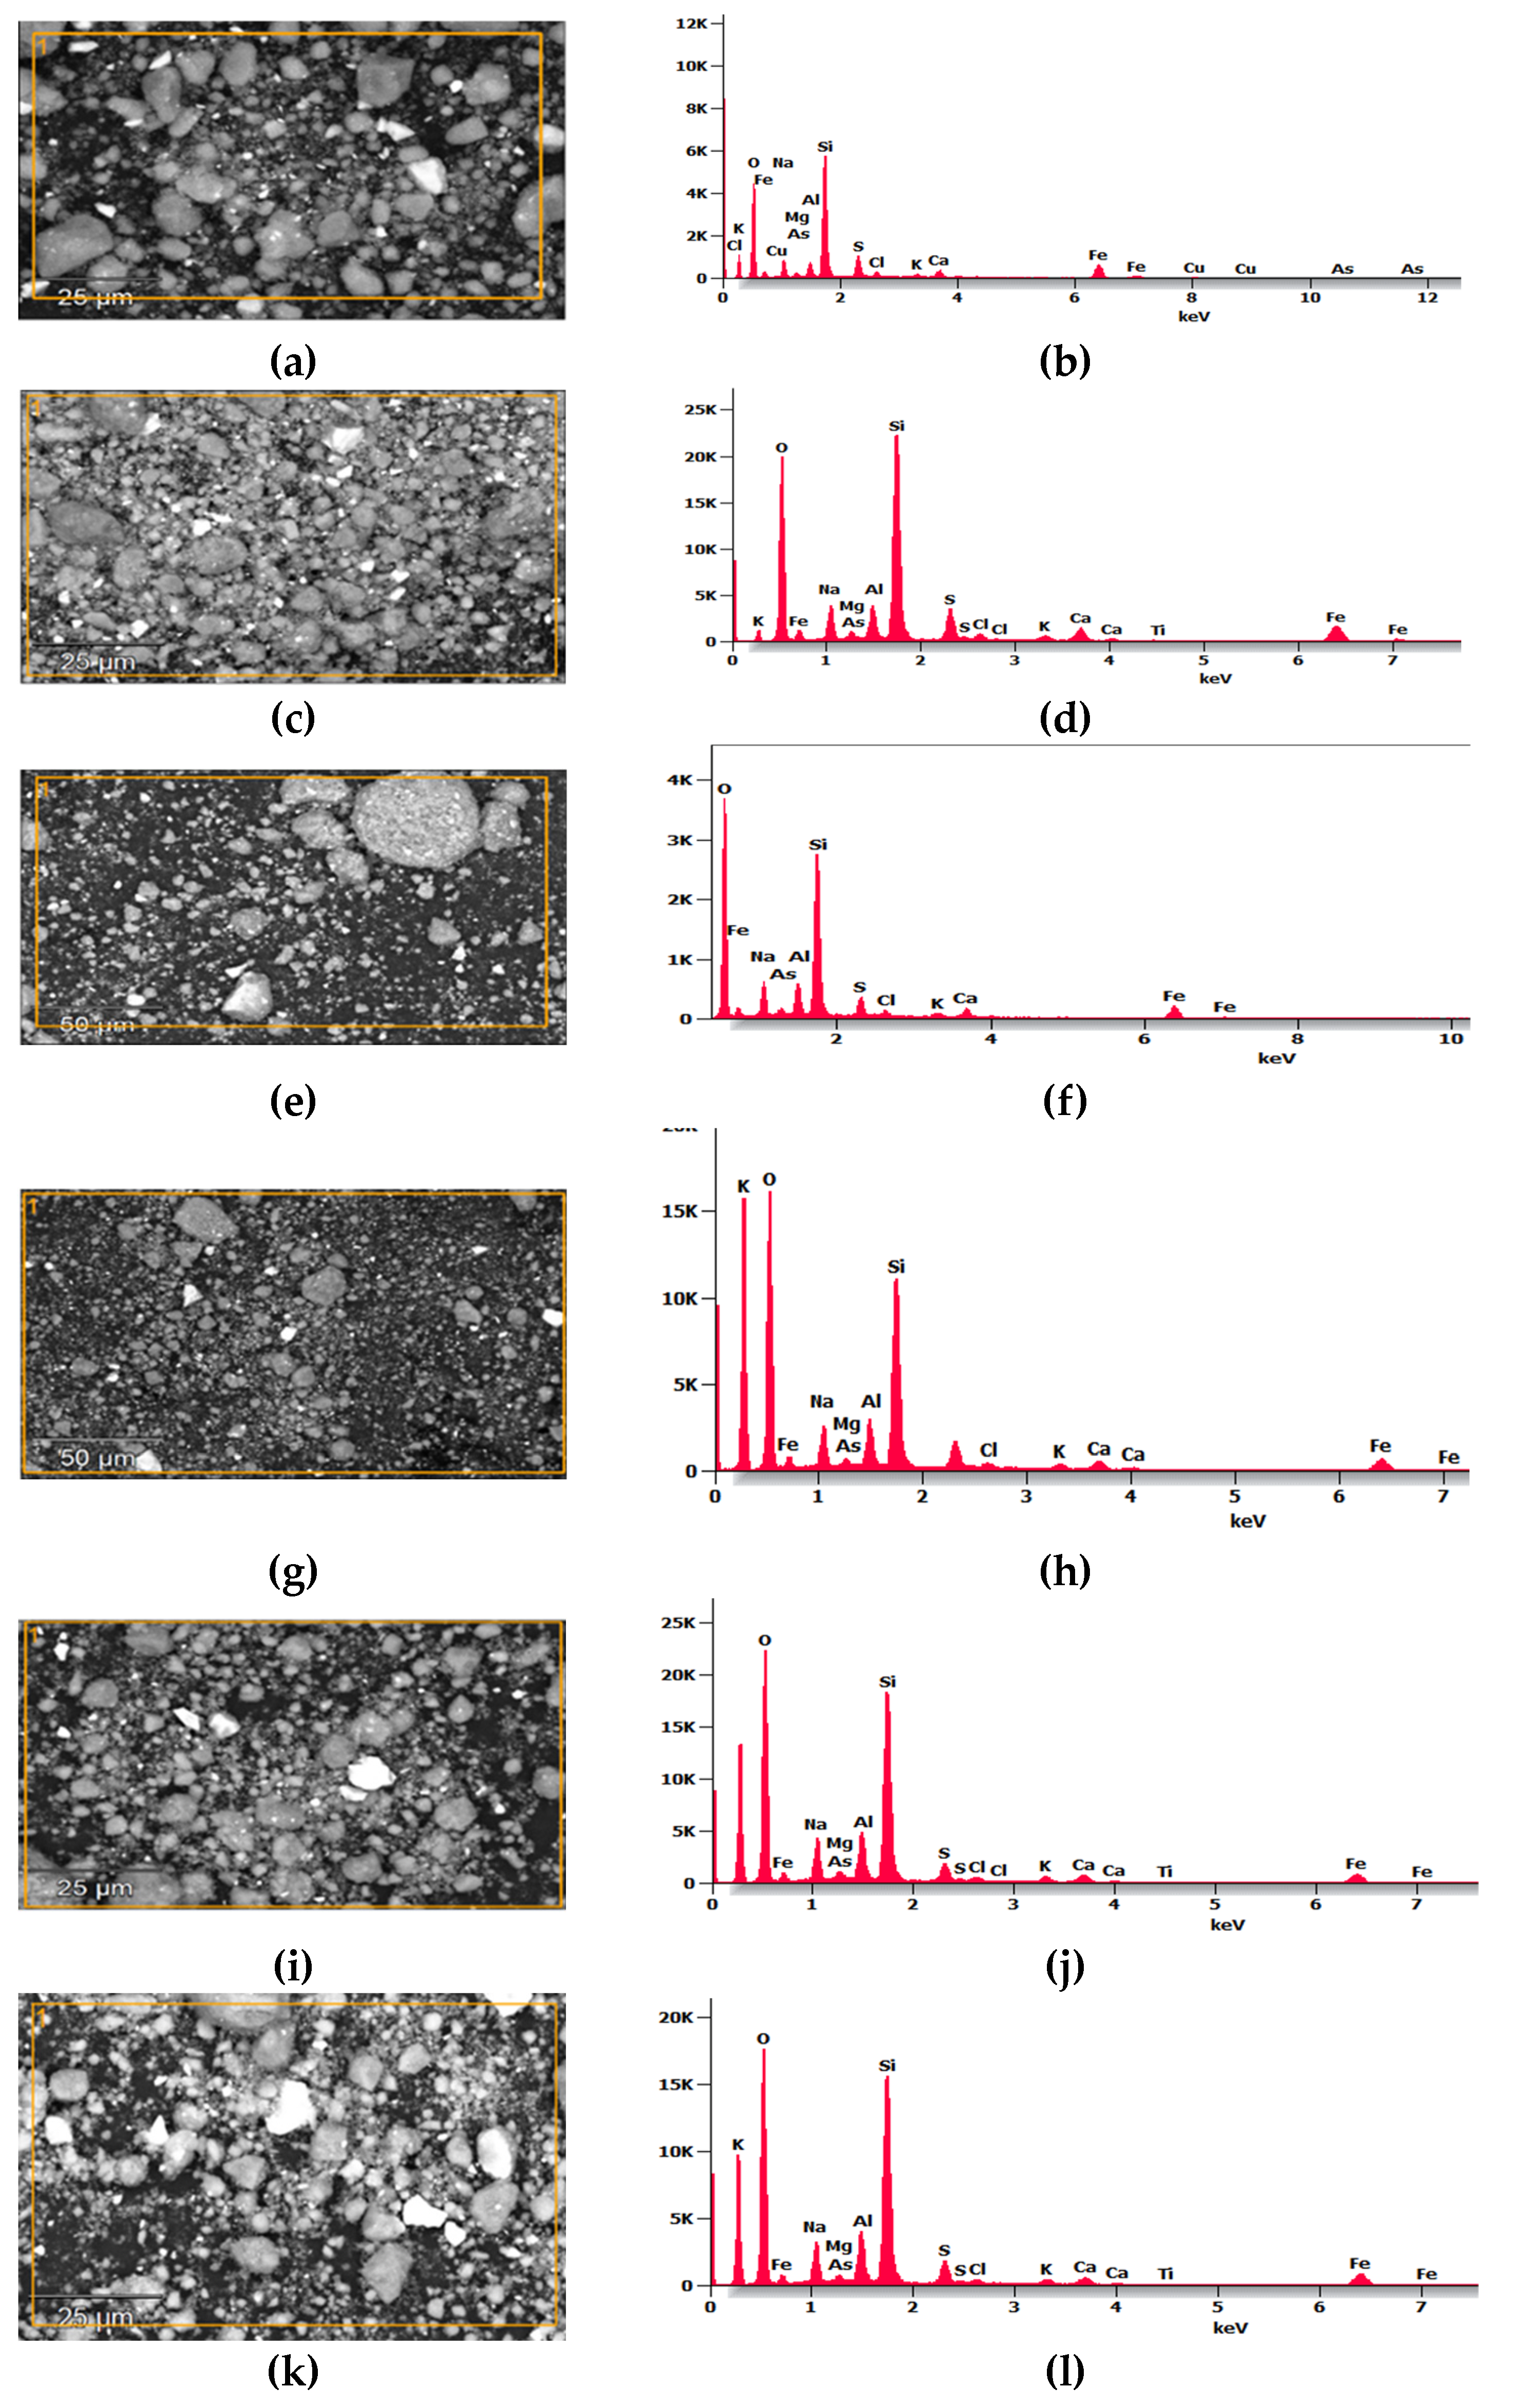
Energy-dispersive X-ray spectroscopy (EDS) analysis was conducted on specific areas of the sample to obtain semi-quantitative data of Si, Al, Ca, Na, O, Mg, Cu, S, As, K, and Fe in different areas of the geopolymers (A0, B10, C20, D30, E40, F50, and MK-PP), as shown in
Figure 10, and the data are presented in
Table 5.
The main contributors to the geopolymers’ matrix for good mechanical performance are the amorphous and semi-crystalline particles of MK and PP (contributing Si and Al). From the analysis, it is evident that silicon is the most abundant element in all analyzed geopolymers, averaging 25%. The control geopolymer shows the highest percentage of silicon (32%), followed by Fe and Al, whose percentages increase from 2% to 8.64% in the control geopolymer, depending on the increase in binder material (MK and PP). Other important elements present include sodium and sulfur, whose percentages decrease as binders are added to the tailings.
It is noteworthy that one of the elements considered as heavy metals, As, appeared in the EDS analysis up to 10% in geopolymer C20, while in the other geopolymers As was below 1%. Geopolymers contain a higher percentage of silicon, consistent with the FTIR spectra, where vibrations near a wavelength of 1162 cm^-1 correspond to vibrations of Si-O-T bonds (T= rich in Si and Al), suggesting improved long-term mechanical compression resistance, provided they are cured under ambient conditions.
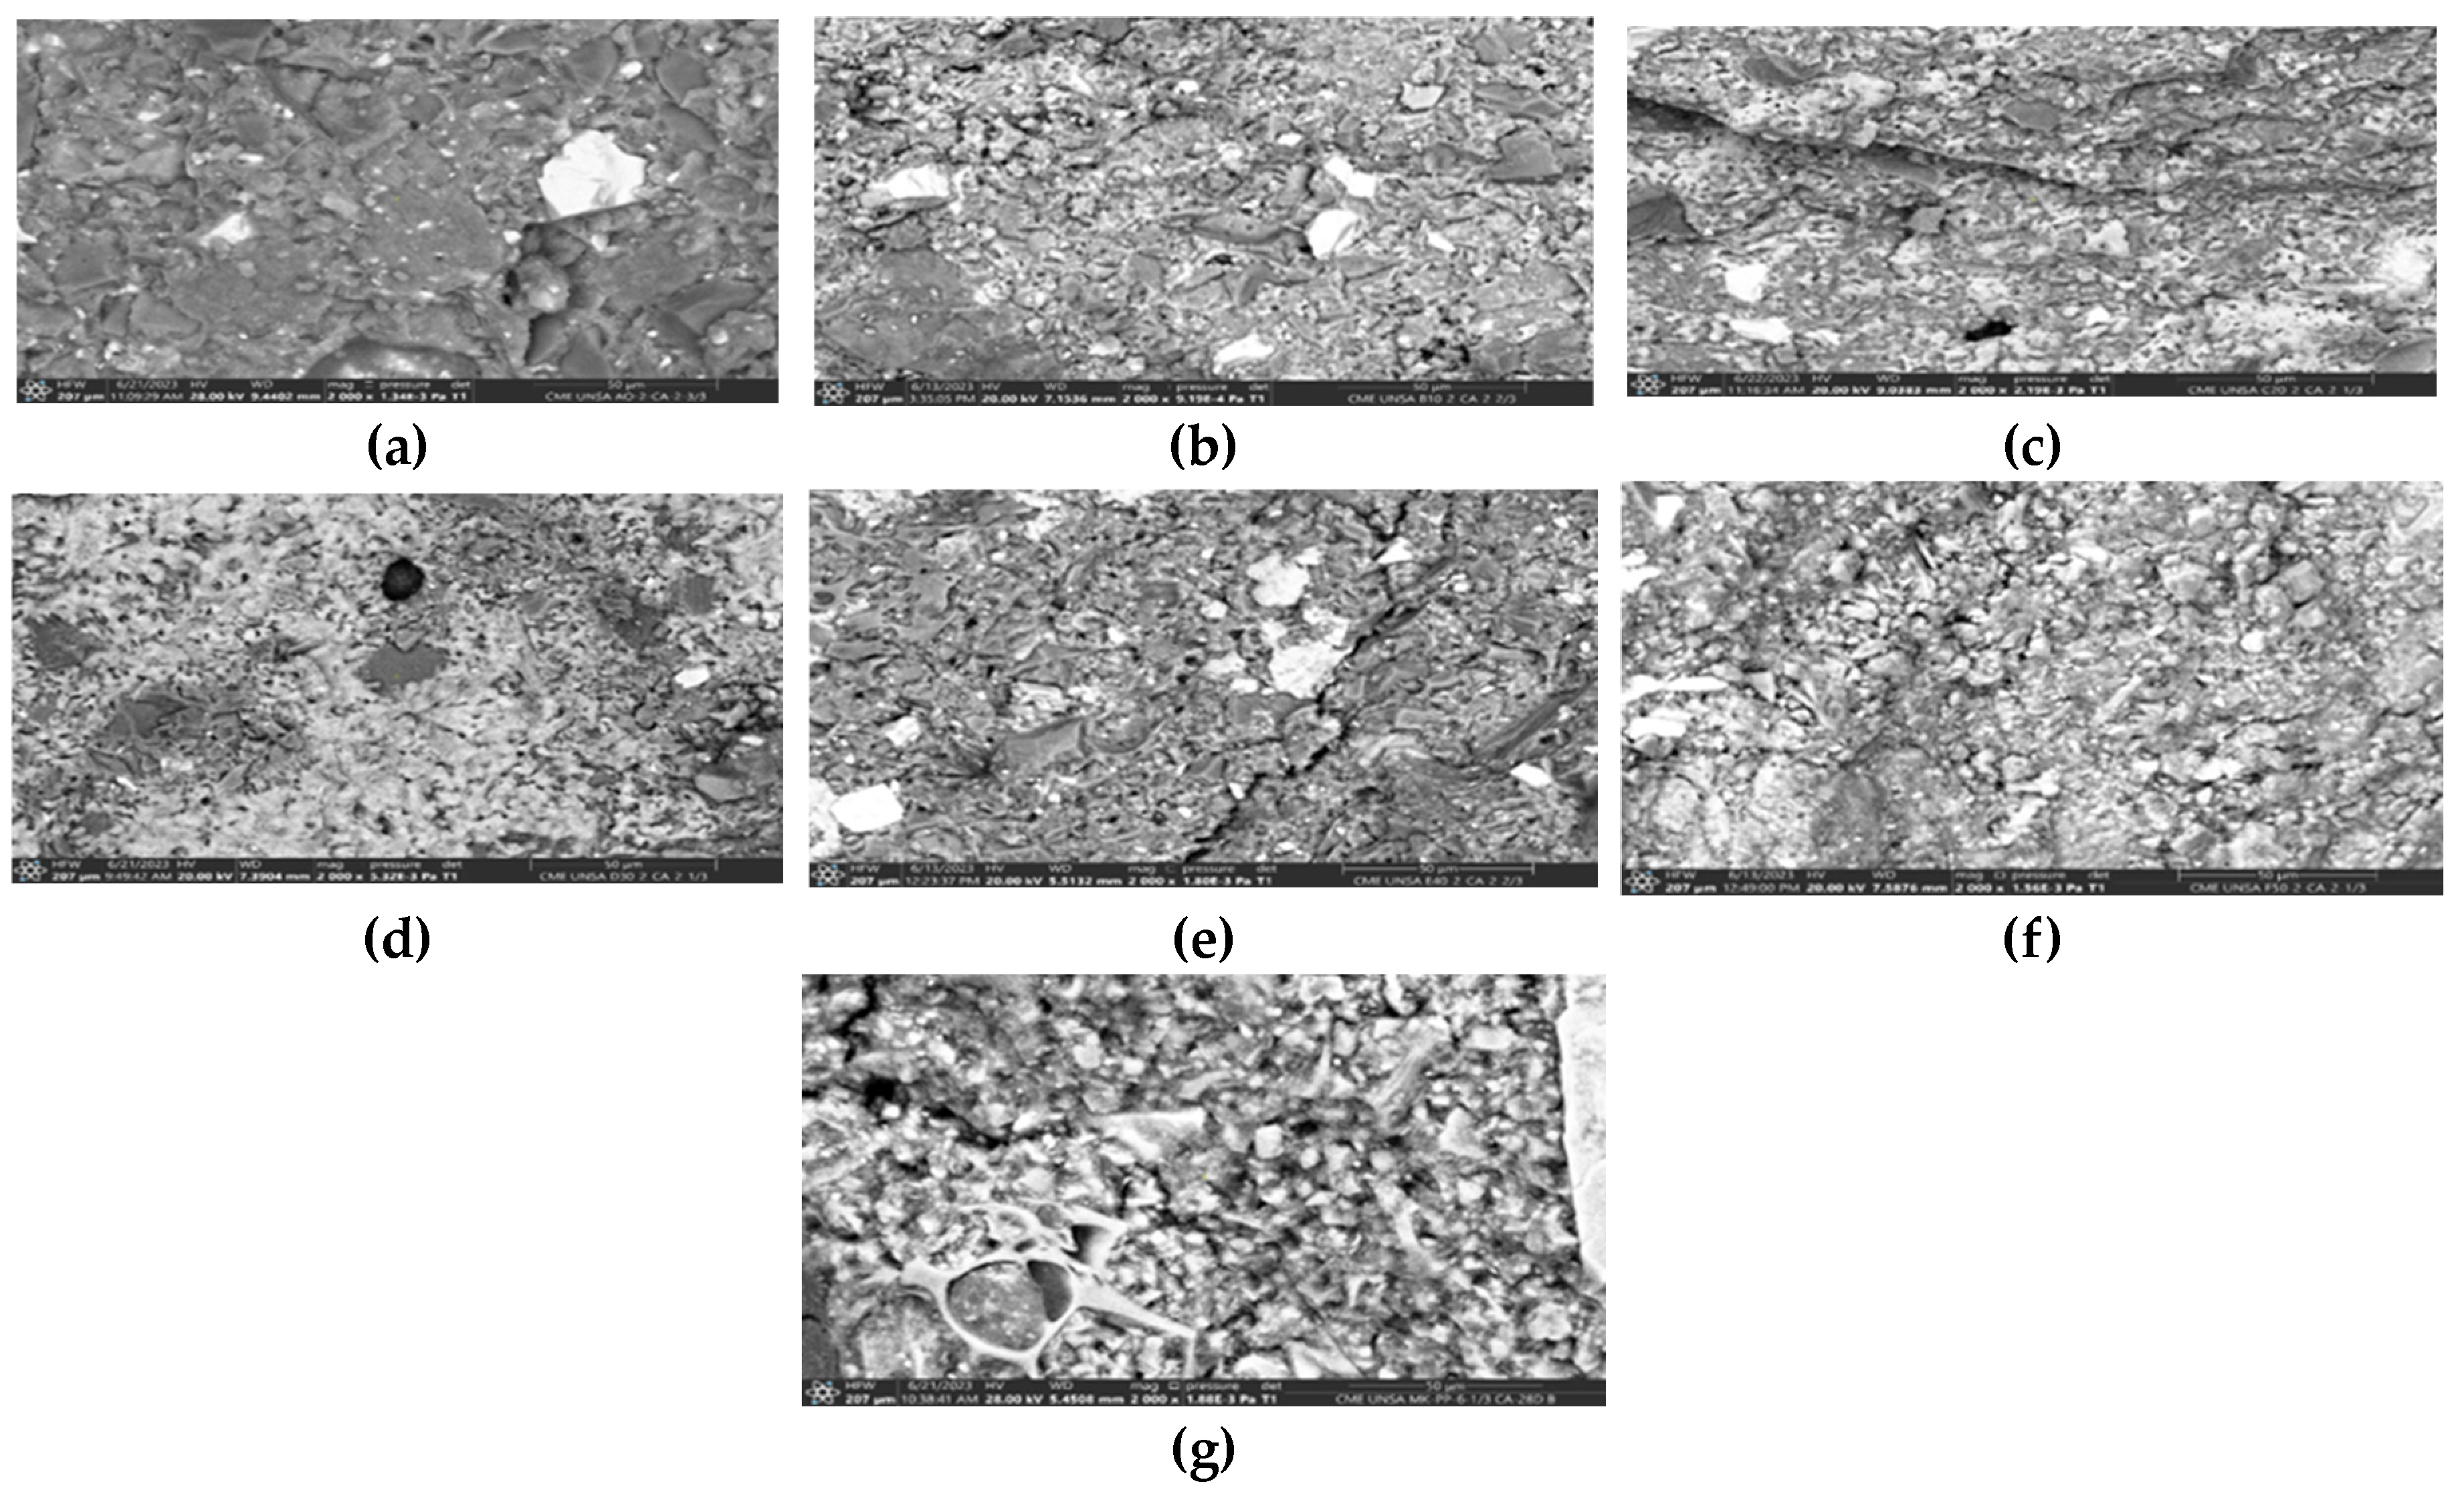
Figure 11 displays SEM microphotographs of the 07 geopolymers under study in solid state. It can be observed that all of them exhibit microcracks, the quantity of which decreases as the binder material content in the geopolymers increases. Similarly, the average pore sizes are 7.47, 7.56, 7.48, 10.36, 5.43, 6.50, and 6.70 µm respectively, indicating very close values. Therefore, we could specify that the percentage variation of binder material is not associated with the variation in pore size of the evaluated samples. Additionally, all geopolymers showed void volumes corresponding to air bubbles trapped during fabrication and subsequently expelled.
Regarding the density or compactness of the geopolymers, it improves as the proportion of binder material increases. It is important to note that there is material that has not contributed to the geopolymerization and remains unreacted.
3.5. Thermogravimetric Analysis (TGA)
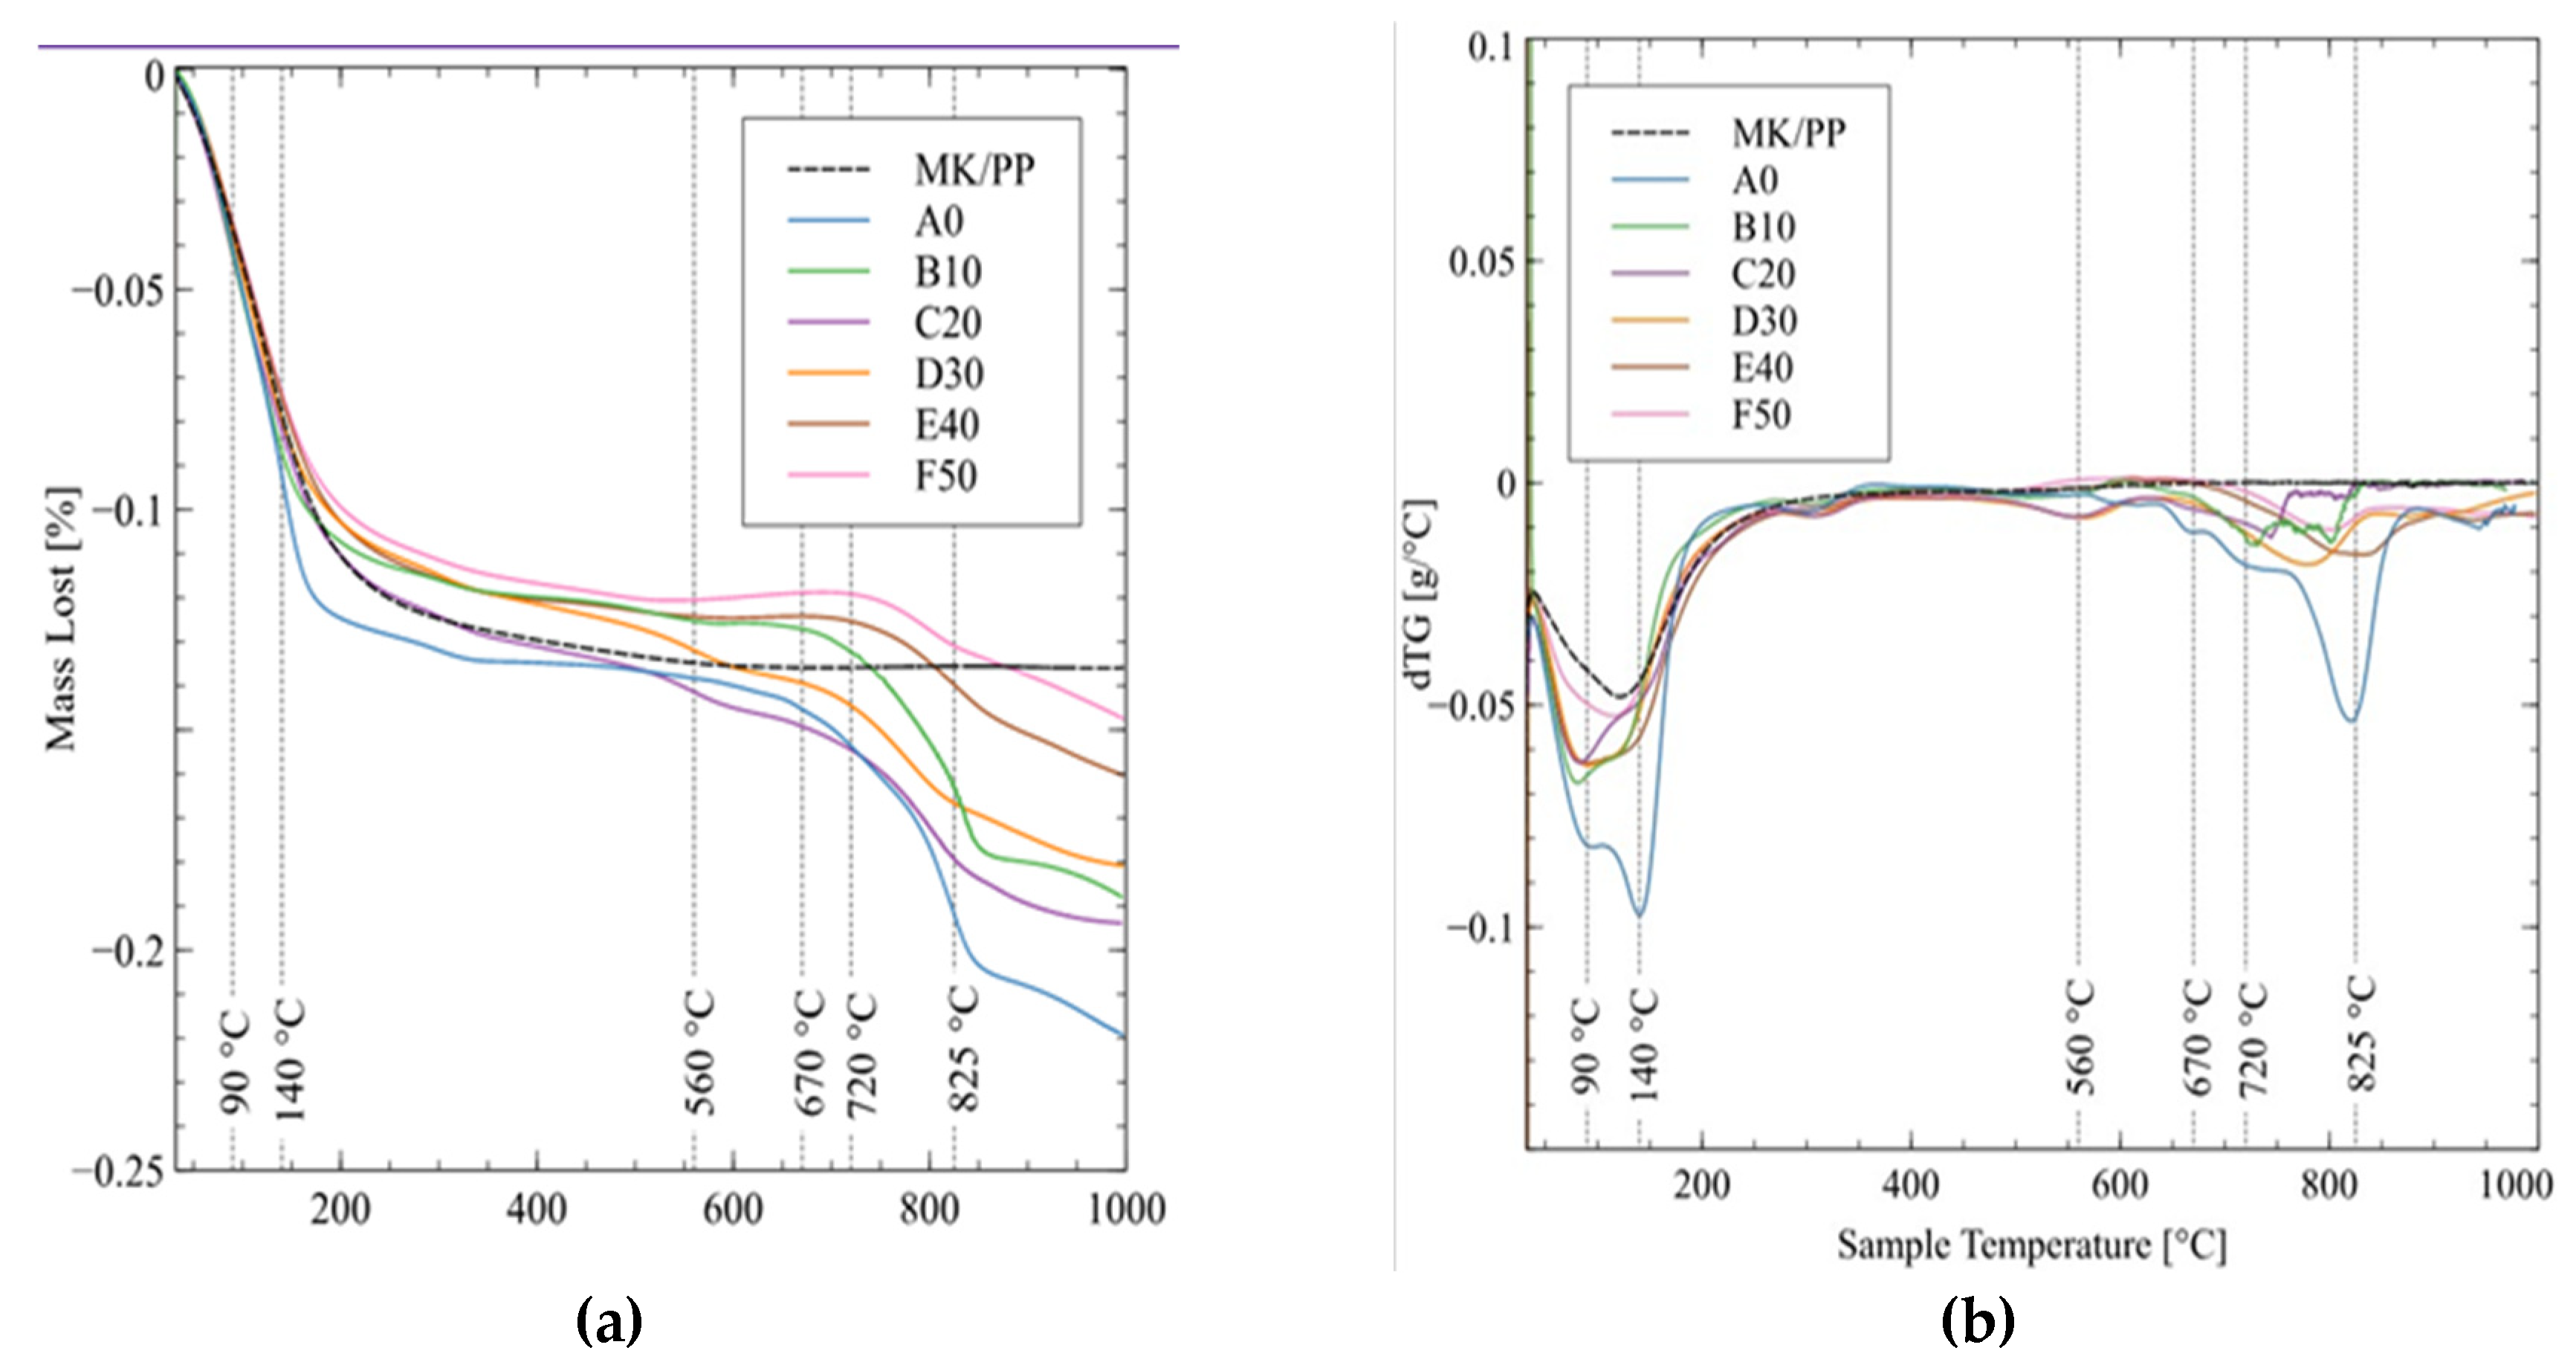
The mass loss of the sample (TGA) and the derived weight (DTG) are shown in
Figure 12a,b. The pozzolanic mixture-based control geopolymer (MK/PP) showed mass loss largely below 200°C, which can be attributed to water evaporation within the sample. For the geopolymer samples, water evaporates in a similar temperature range but exhibits two distinct peaks in DTG. The first peak at 90°C is caused by the evaporation of free water in the sample, while the second peak at 140°C is attributed to the evaporation of water from capillary pores. Due to capillary tension in these voids, water evaporates at a temperature higher than its boiling point. The mass loss in this region (100°C - 220°C) can also be attributed to water evaporation between layers leading to dehydration of clay minerals.
The mass loss peaks between 500°C and 1000°C are caused by the decomposition of various minerals found in the geopolymer samples. Between 400°C and 450°C, sulfides from iron sulfide minerals decompose, and between 400°C and 480°C, pyrite decomposes. Peaks at 670°C and 720°C can be attributed to the dihydroxylation of minerals in the parent rock, where terminal hydroxide groups (-OH) are removed during heating. Mass loss between 700°C and 900°C is caused by the decomposition of calcite in the sample, with a DTG peak at 825°C.
On the other hand, in all samples, the greatest mass variation occurs between ambient temperature and 200°C, likely due to the release of water molecules present in the geopolymer structure, promoting the formation of structural defects related to porosity and cracking [
26].
3.6. Environmental Impact of Geopolymer
3.6.1. TCLP Analysis
In order to evaluate the efficiency of immobilizing metals and metalloids and to determine the degree of hazardousness of the geopolymer and its potential environmental impact, a comparative study was conducted between the obtained results and the Environmental Quality Standards (ECA) of Peru (Supreme Decree No. 011-2017-MINAM) and those of the Australian Ministry of Environment (NSW EPA 2014). This analysis considered the concentrations of five heavy metals and metalloids, detailed in
Table 6, as well as the values of leachate concentrations from the five samples analyzed, specified in
Table 7.
From the analysis regarding the hazard classification of MTs and synthesized geopolymer material, based on
Table 8, we can indicate the following: The metalloid as categorizes both the MTs and geopolymer samples A0-2, B10-2, C20-2, D30-2, and E40-2 as highly hazardous materials because the concentration values of as in these materials exceed the threshold of 2000 mg/kg (NSW EPA 2014). Additionally, the metal Cd exhibits environmentally favorable conditions because its concentration values in both the material and leachates are below established thresholds, indicating effective geopolymerization processes for this element in particular.
On the other hand, the heavy metal Hg designates the MTs as hazardous material, while in the geopolymers, the concentrations of their leachates do not exceed the established limits, indicating that the stabilization and solidification processes are functioning properly. However, lead appears with values above the thresholds in both MTs and geopolymers A0, B10, and C20, classifying them as environmentally hazardous materials. In contrast, geopolymers D30 and E40 are classified as non-hazardous materials.
For zinc, there is insufficient information to evaluate its hazard classification. Therefore, to prevent them from being considered potentially contaminating materials, all geopolymeric materials should have a minimum binder content in their mix design exceeding 30%.
The efficiency of heavy metal immobilization is primarily defined by strength and leaching resistance [
27]. While strength development is considered an indicator of solidification, leaching tests are likely the most critical measure for assessing the stabilization degree of heavy metals [
28].
The literature [
29] indicates that geopolymers are inorganic polymers with excellent properties suitable for stabilization/solidification of hazardous contaminants. According to them, stabilization/solidification mechanisms for cationic heavy metals include physical encapsulation, adsorption, precipitation, and binding within a silicate structure. However, they note that geopolymers have poor performance in immobilizing anions due to repulsion effects, which leads to high leaching. Despite this, they argue that through electrostatic interactions, it is possible to trap metalloids such as arsenic and selenium present in MTs.
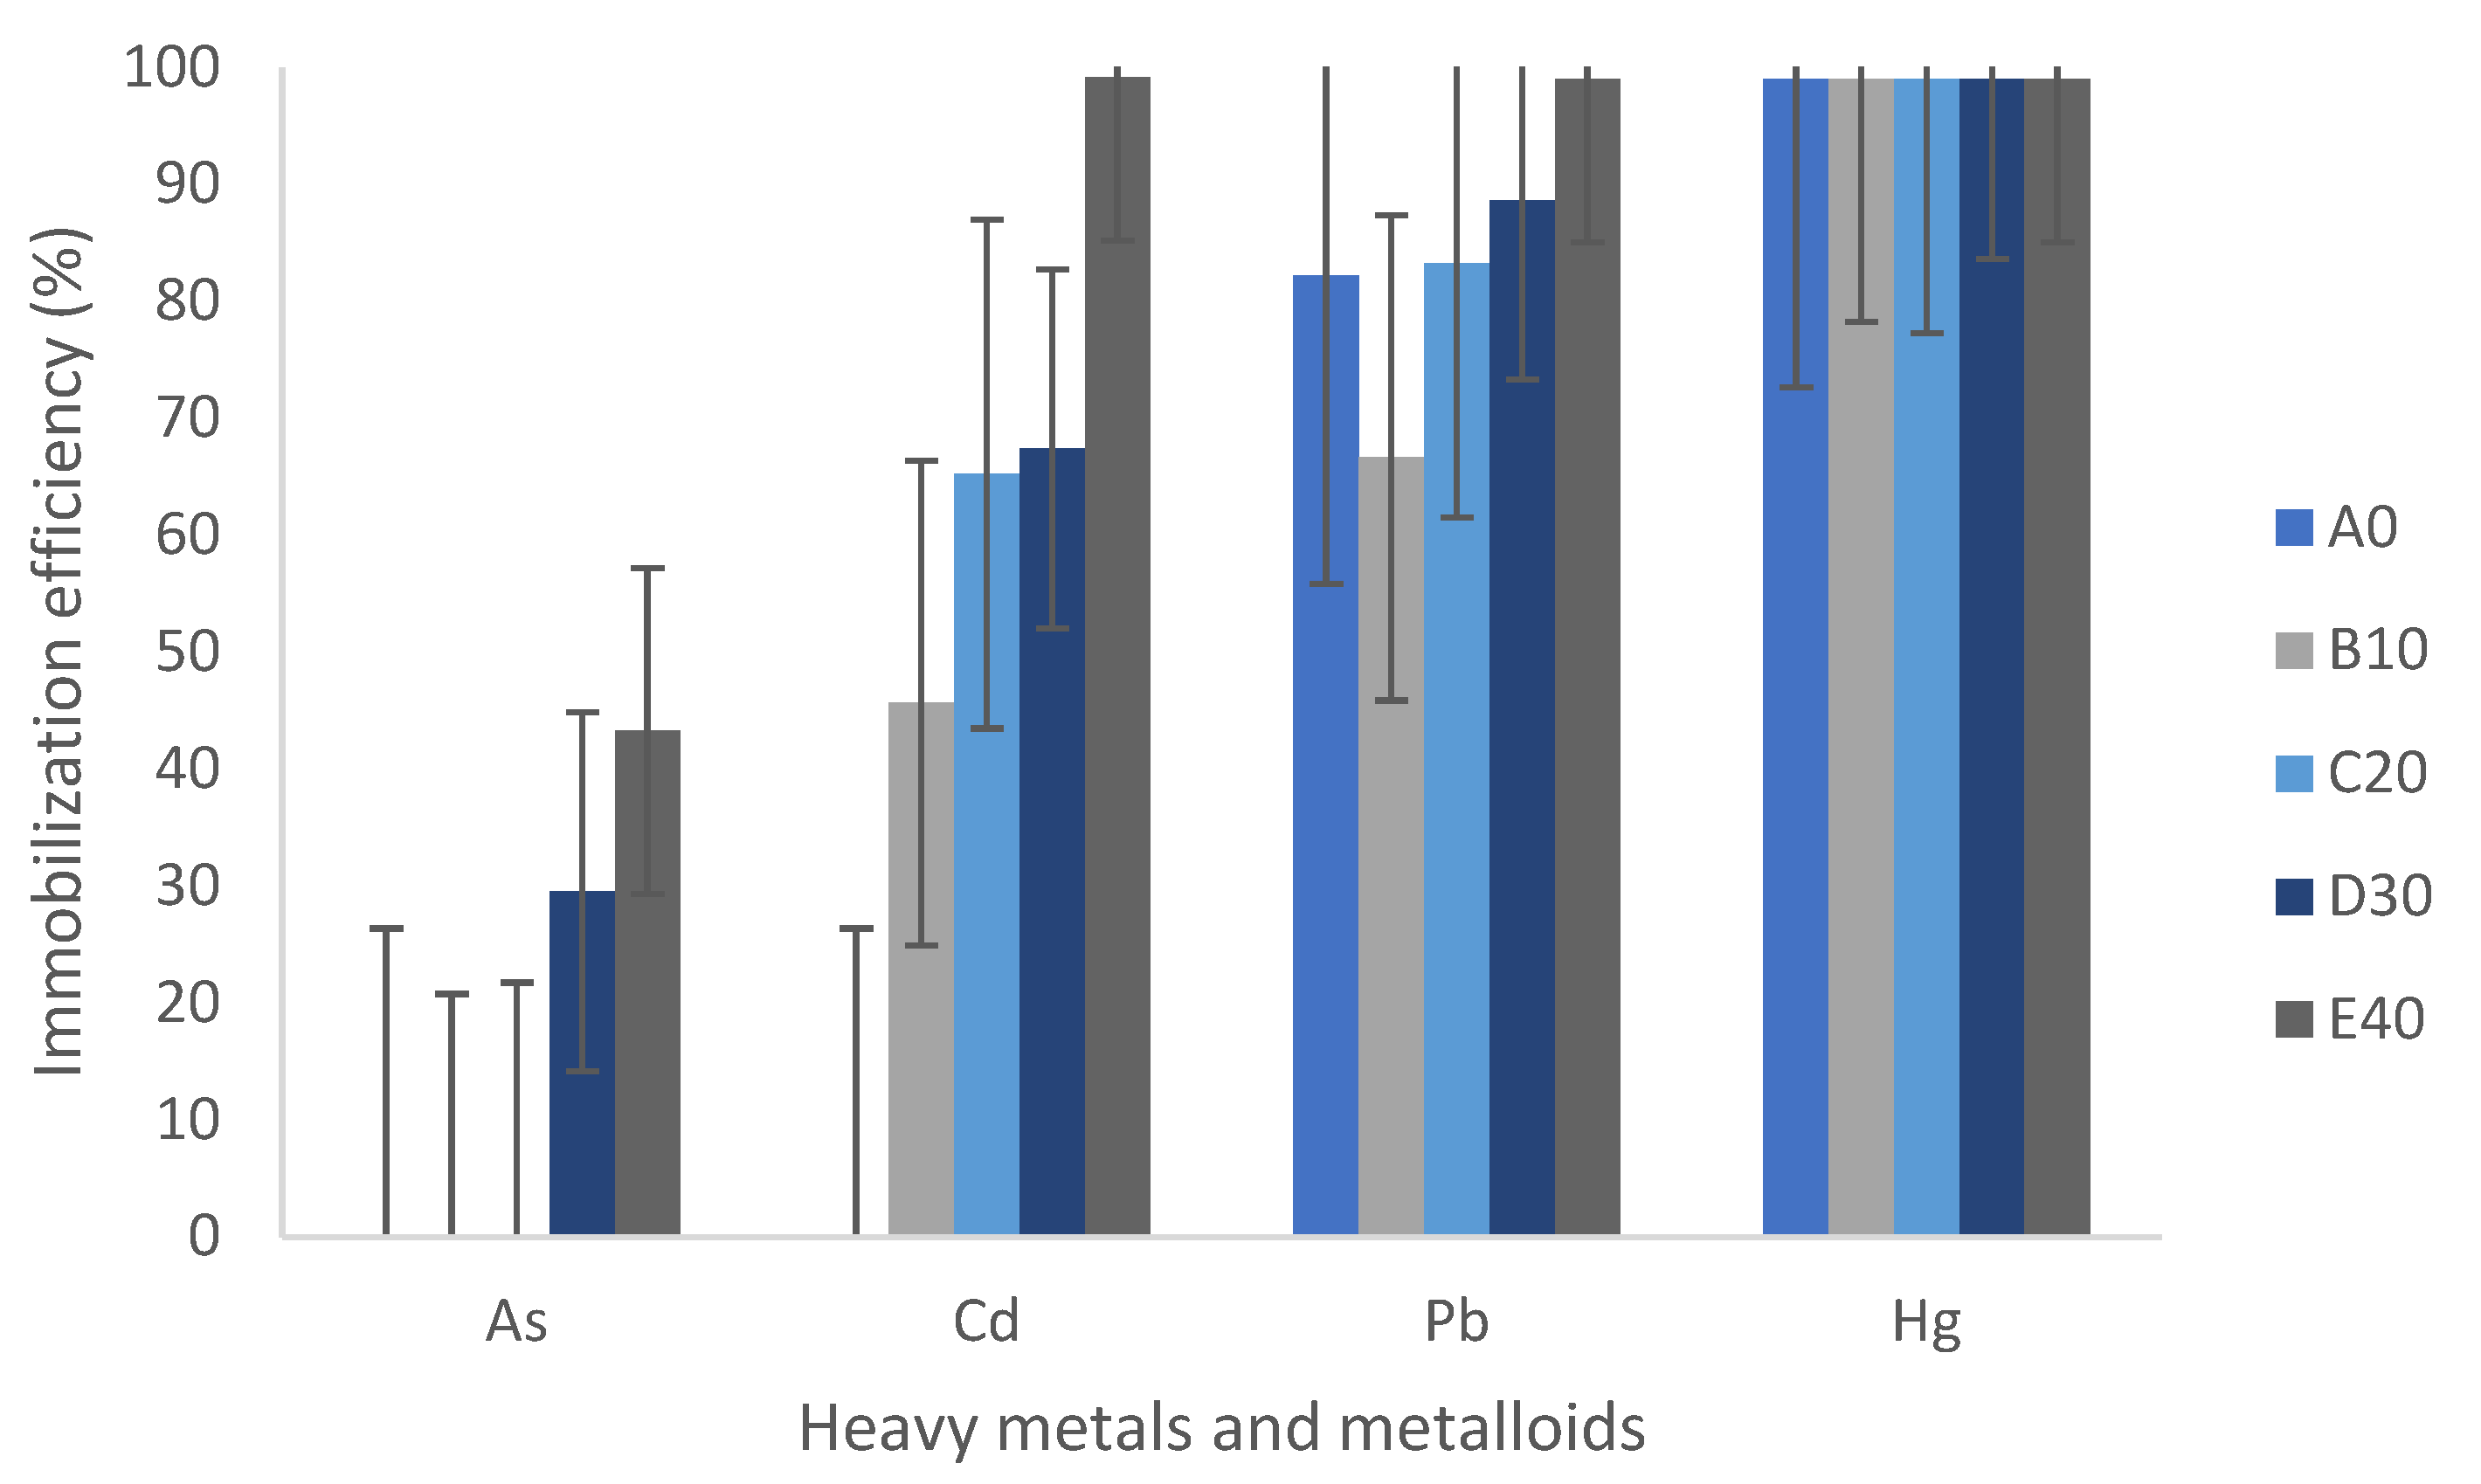
This is reflected in
Figure 13, which summarizes Tian’s comments on the immobilization capacity of geopolymers. It shows poor immobilization of anions, except when the geopolymer contains between 30% and 40% binder material, achieving a maximum of 40% immobilization. Cadmium is immobilized between 45% and 99% with 40% binder material, lead between 70% and 99%, and mercury up to 99%, even when the geopolymer is composed solely of MTs. Metals are effectively immobilized, whereas the metalloid arsenic does not achieve the same immobilization effectiveness.
4. Discussion
The mechanical strength values of the samples either matched or exceeded those obtained by Wan [
12] and the observed behavior that as the binder content increased, the strength increased, but decreased upon reaching 40/60 replacement, is consistent with other studies [
8,
12].
Research conducted by Burciaga-Diaz [
30] and Rovnaník [
31] demonstrated that curing geopolymers at temperatures > 60°C favors rapid early-age compressive strength gain. However, curing at 20°C ±2°C (ambient temperature) proves more effective in the long term, promoting greater progress in reaction processes, resulting in denser microstructures with high compressive strength.
Geopolymers cured under ambient conditions show better mechanical development over time, suggesting greater formation of aluminum silicate gels (N-A-S-H), consistent with findings by Paiva [
32]. Mechanical properties are influenced by curing time, espe ially when using higher percentages of MTs prolonged curing time is not necessary.
The high values of compressive strength tests could be explained by the findings in samples analyzed by SEM/EDS, where quartz and pyrite phases initially highly diminish, indicating their incorporation into the geopolymer. The geopolymerization process effectively immobilized heavy metals; however, arsenic was present in higher amounts than anticipated, and additional research is needed to improve the immobilization potential of the process.
5. Conclusions
Research has shown that the highest compressive strength of the geopolymer based on MTs, MK, and PP was achieved under specific conditions: a concentration of 10 M NaOH, a NaSiO3/NaOH ratio of 1.9, and a curing temperature of 20 ± 2°C, using 50% MTs and 50% binder (MK and PP) ratio, achieving a compressive strength of 67 MPa.
It was observed that curing time influenced the increase in compressive strength; however, prolonging the curing time with MTs percentages equal to or greater than 50% is not recommended. Additionally, geopolymers with 30% and 40% binder replacement showed better results in immobilizing heavy metals, classifying them as non-hazardous materials since contaminant concentrations do not exceed the standards set by NSW EPA 2014. However, if the geopolymer contains less than 30% replacement, some heavy metals such as lead (Pb) or mercury (Hg) may exceed these limits.
The addition of binders such as MK and PP not only improved the mechanical properties of the geopolymer but also promoted the stabilization and encapsulation of MTs, thereby contributing to the production of safer and higher-performance materials.
Author Contributions
Conceptualization, G.P. and H.B.; methodology, G.P.; software, G.P and C.C.; data validation, G.P. and A.H.; formal analysis, A.H. and C.C.; research, G.P.; resources, H.B. y R.H.; data curation, G.P.; writing: preparing the original draft G.P.; writing: review and editing, A.H., C.C., H.B. and R.H; visualization, G.P.; supervision, G.P. and H.B.; project management, G.P.; acquisition of financing, H.B and R.H. All authors have read and accepted the published version of the manuscript.
Funding
This research was funded by the National University of San Agustin of Arequipa, through the IBA Project, according to Financing Contract No. 10-2019- UNSA, “Applied Basic Research Projects”, call 2018-2b.
Data Availability Statement
Not applicable.
Acknowledgments
Oscar Jesús Flores Avendaño, Lic Miguel Ángel Alarcón García y Andrea Del Pilar Machaca Arcana for their valuable support in the administrative and logistical aspects.
Conflicts of Interest
The authors declare that there is no conflict of interest. As well as “The sponsors had no role in the design, execution, interpretation or writing of the study.
References
- Taghipour, M.; Jalali, M. Heavy Metal Release from Some Industrial Wastes: Influence of Organic and Inorganic Acids, Clay Minerals, and Nanoparticles. Pedosphere 2018, 28, 70–83. [CrossRef]
- González-Valoys, A. C.; Arrocha, J.; Monteza-Destro, T.; Vargas-Lombardo, M.; Esbrí, J. M.; Garcia-Ordiales, E.; Jiménez-Ballesta, R.; García-Navarro, F. J.; Higueras, P. Environmental Challenges Related to Cyanidation in Central American Gold Mining; the Remance Mine (Panama). J Environ Manage 2022, 302, 113979. [CrossRef]
- Saeed, A.; Najm, H. M.; Hassan, A.; Sabri, M. M. S.; Qaidi, S.; Mashaan, N. S.; Ansari, K. Properties and Applications of Geopolymer Composites: A Review Study of Mechanical and Microstructural Properties. Materials. MDPI November 1, 2022, 15, 8250. [CrossRef]
- Ji, Z.; Pei, Y. Bibliographic and Visualized Analysis of Geopolymer Research and Its Application in Heavy Metal Immobilization: A Review. Journal of Environmental Management, 2019, 231, pp 256–267. [CrossRef]
- Tian, Q.; Bai, Y.; Pan, Y.; Chen, C.; Yao, S.; Sasaki, K.; Zhang, H. Application of Geopolymer in Stabilization/Solidification of Hazardous Pollutants: A Review. Molecules 2022, 27, 4570. [CrossRef]
- Davidovits, J. Geopolymers: Ceramic-like Inorganic Polymers. Journal of Ceramic Science and Technology. Goller Verlag 2017, 8, pp 335–350. [CrossRef]
- Sikder, A.; Mishra, J.; Nanda, B.; Patro, S. K. Geopolymer Concrete as a Revolutionary Green Building Material for Modern Infrastructures. In Encyclopedia of Green Materials; Springer Nature Singapore: Singapore, 2022; pp 1–9. [CrossRef]
- Wan, Q.; Rao, F.; Song, S.; García, R. E.; Estrella, R. M.; Patiño, C. L.; Zhang, Y. Geopolymerization Reaction, Microstructure and Simulation of Metakaolin-Based Geopolymers at Extended Si/Al Ratios. Cement and Concrete Composites 2017, 79, 45–52. [CrossRef]
- Lazorenko, G.; Kasprzhitskii, A.; Shaikh, F.; Krishna, R. S.; Mishra, J. Utilization Potential of Mine Tailings in Geopolymers: Physicochemical and Environmental Aspects. Process Safety and Environmental Protection. Institution of Chemical Engineers 2021, 147, pp 559–577. [CrossRef]
- Xiaolong, Z.; Shiyu, Z.; Hui, L.; Yingliang, Z. Disposal of Mine Tailings via Geopolymerization. Journal of Cleaner Production 2021, 284, p 124756. [CrossRef]
- Kiventerä, J.; Lancellotti, I.; Catauro, M.; Poggetto, F. D.; Leonelli, C.; Illikainen, M. Alkali Activation as New Option for Gold Mine Tailings Inertization. J Clean Prod 2018, 187, 76–84. [CrossRef]
- Wan, Q.; Rao, F.; Song, S.; Zhang, Y. Immobilization Forms of ZnO in the Solidification/Stabilization (S/S) of a Zinc Mine Tailing through Geopolymerization. Journal of Materials Research and Technology 2019, 8, 5728–5735. [CrossRef]
- Almalkawi, A. T.; Hamadna, S.; Soroushian, P. One-Part Alkali Activated Cement Based Volcanic Pumice. Constr Build Mater 2017, 152, 367–374. [CrossRef]
- Yadollahi, M. M.; Benli, A.; Demirboga, R. The Effects of Silica Modulus and Aging on Compressive Strength of Pumice-Based Geopolymer Composites. Constr Build Mater 2015, 94, 767–774. [CrossRef]
- Qaidi, S. M. A.; Tayeh, B. A.; Zeyad, A. M.; de Azevedo, A. R. G.; Ahmed, H. U.; Emad, W. Recycling of Mine Tailings for the Geopolymers Production: A Systematic Review. Case Studies in Construction Materials 2022, 16, e00933. [CrossRef]
- Simonsen, A. M. T.; Solismaa, S.; Hansen, H. K.; Jensen, P. E. Evaluation of Mine Tailings’ Potential as Supplementary Cementitious Materials Based on Chemical, Mineralogical and Physical Characteristics. Waste Management 2020, 102, 710-721. [CrossRef]
- Felaous, K.; Aziz, A.; Achab, M.; Fernández-Raga, M.; Benzaouak, A. Optimizing Alkaline Activation of Natural Volcanic Pozzolan for Eco-Friendly Materials Production: An Investigation of NaOH Molarity and Na2SiO3-to-NaOH Ratio. Sustainability (Switzerland) 2023, 15 (5), 4453. [CrossRef]
- Churata, R.; Almirón, J.; Vargas, M.; Tupayachy-Quispe, D.; Torres-Almirón, J.; Ortiz-Valdivia, Y.; Velasco, F. Study of Geopolymer Composites Based on Volcanic Ash, Fly Ash, Pozzolan, Metakaolin and Mining Tailing. Buildings 2022, 12 , 1118. [CrossRef]
- Sedira, N.; Castro-Gomes, J. Effect of Activators on Hybrid Alkaline Binder Based on Tungsten Mining Waste and Ground Granulated Blast Furnace Slag. Construction and Building Materials 2020, 232, 117176. [CrossRef]
- Li, C.; Ouyang, J.; Yang, H. Novel Sensible Thermal Storage Material from Natural Minerals. Phys Chem Minerals 2013, 40, 681–689. [CrossRef]
- Figueiredo, R. A. M.; Silveira, A. B. M.; Melo, E. L. P.; Costa, G. Q. G.; Brandão, P. R. G.; Aguilar, M. T. P.; Henriques, A. B.; Mazzinghy, D. B. Mechanical and Chemical Analysis of One-Part Geopolymers Synthesised with Iron Ore Tailings from Brazil. Journal of Materials Research and Technology 2021, 14, 2650–2657. [CrossRef]
- Pan, Z.; Hu, S.; Zhang, C.; Zhou, T.; Hua, G.; Li, Y.; Lv, X. Mechanical and Hydration Characteristics of Stabilized Gold Mine Tailings Using a Sustainable Industrial Waste-Based Binder. Materials 2023, 16, 634. [CrossRef]
- Longhi, M. A.; Rodríguez, E. D.; Bernal, S. A.; Provis, J. L.; Kirchheim, A. P. Valorisation of a Kaolin Mining Waste for the Production of Geopolymers. J Clean Prod 2016, 115, 265–272. [CrossRef]
- Catauro, M.; Papale, F.; Lamanna, G.; Bollino, F. Geopolymer/PEG Hybrid Materials Synthesis and Investigation of the Polymer Influence on Microstructure and Mechanical Behavior. Materials Research 2015, 18, 698–705. [CrossRef]
- Ferreira, I. C.; Galéry, R.; Henriques, A. B.; Paula De Carvalho Teixeira, A.; Prates, C. D.; Lima, A. S.; Souza Filho, I. R. Reuse of Iron Ore Tailings for Production of Metakaolin-Based Geopolymers. Journal of Materials Research and Technology 2022, 18, 4194–4200. [CrossRef]
- Burciaga-Díaz, O.; Escalante-Garcia, J. I.; Magallanes-Rivera, R. X. Resistencia a La Compresión y Evolución Microestructural de Geopolímeros Base Metacaolín Expuestos a Alta Temperatura. ALCONPAT 2015, 5, 58–75. [CrossRef]
- Malviya, R.; Chaudhary, R. Factors Affecting Hazardous Waste Solidification/Stabilization: A Review. J Hazard Mater 2006, 137, 267–276. [CrossRef]
- Vu, T. H.; Gowripalan, N. Mechanisms of Heavy Metal Immobilisation Using Geopolymerisation Techniques – A Review. Journal of Advanced Concrete Technology. Japan Concrete Institute 2018, pp 124–135. [CrossRef]
- Tian, Q.; Guo, B.; Sasaki, K. Immobilization Mechanism of Se Oxyanions in Geopolymer: Effects of Alkaline Activators and Calcined Hydrotalcite Additive. J Hazard Mater 2020, 387, 121994. [CrossRef]
- Burciaga-Diaz, O.; Escalante-Garcia, J. I.; Gorokhovsky, A. Geopolymers Based on a Coarse Low-Purity Kaolin Mineral: Mechanical Strength as a Function of the Chemical Composition and Temperature. Cement and Concrete Composites 2012, 34, 18–24. [CrossRef]
- Rovnaník, P. Effect of Curing Temperature on the Development of Hard Structure of Metakaolin-Based Geopolymer. Constr Build Mater 2010, 24 (7), 1176–1183. [CrossRef]
- Paiva, H.; Yliniemi, J.; Illikainen, M.; Rocha, F.; Ferreira, V. M. Mine Tailings Geopolymers as Awaste Management Solution for a More Sustainable Habitat. Sustainability 2019, 11, 995. [CrossRef]
Figure 1.
Microstructural analysis of MTs: EDS with four-point samples at (a) point 1, (b) point 2, (c) point 3, and (d) point 4, and (e) Scanning Electron Micrograph.
Figure 1.
Microstructural analysis of MTs: EDS with four-point samples at (a) point 1, (b) point 2, (c) point 3, and (d) point 4, and (e) Scanning Electron Micrograph.
Figure 2.
Microstructural analysis of PP: (a) Scanning Electron Micrograph and (b) EDS.
Figure 2.
Microstructural analysis of PP: (a) Scanning Electron Micrograph and (b) EDS.
Figure 3.
Microstructural analysis of MK: (a) Scanning Electron Micrograph; (b) EDS.
Figure 3.
Microstructural analysis of MK: (a) Scanning Electron Micrograph; (b) EDS.
Figure 4.
General process flow diagram for the production of mine tailings-based geopolymers.
Figure 4.
General process flow diagram for the production of mine tailings-based geopolymers.
Figure 5.
Mechanical behavior as a function of samples with different percentages of binder addition (MK-PP), ranging from 0% to 50%, and a 100% MK-PP specimen, at 7, 14, 28, and 56 days of ambient temperature curing, and initial curing at 40°C for 20 hours.
Figure 5.
Mechanical behavior as a function of samples with different percentages of binder addition (MK-PP), ranging from 0% to 50%, and a 100% MK-PP specimen, at 7, 14, 28, and 56 days of ambient temperature curing, and initial curing at 40°C for 20 hours.
Figure 6.
28-day compressive strength for different geopolymer simples for two initial curing regimes.
Figure 6.
28-day compressive strength for different geopolymer simples for two initial curing regimes.
Figure 7.
Comparative strength development of geopolymers at different curing times.
Figure 7.
Comparative strength development of geopolymers at different curing times.
Figure 8.
Diffractogram of sample A0, sample B10, sample C20, sample D30, sample E40 y sample F50.
Figure 8.
Diffractogram of sample A0, sample B10, sample C20, sample D30, sample E40 y sample F50.
Figure 9.
FTIR spectra of synthesized geopolymers: control geopolymer MK-PP, AO, D30 and F50.
Figure 9.
FTIR spectra of synthesized geopolymers: control geopolymer MK-PP, AO, D30 and F50.
Figure 10.
SEM/EDS images of geopolymers: (a) and (b): A0; (c) and (d): B10; (e) and (f): C20; (g) and (h): D30; (i) and (j): E40; (k) and (l): F50; and (m) and (n): MK-PP (powder state), respectively.
Figure 10.
SEM/EDS images of geopolymers: (a) and (b): A0; (c) and (d): B10; (e) and (f): C20; (g) and (h): D30; (i) and (j): E40; (k) and (l): F50; and (m) and (n): MK-PP (powder state), respectively.
Figure 11.
SEM images of geopolymers (a) A0, (b) B10, (c) C20, (d) D30, (e) E40, (f) F50, and (g) MK-PP (solid state).
Figure 11.
SEM images of geopolymers (a) A0, (b) B10, (c) C20, (d) D30, (e) E40, (f) F50, and (g) MK-PP (solid state).
Figure 12.
(a) Thermogravimetric and (b) Differential Thermogravimetric analysis of the geopolymers.
Figure 12.
(a) Thermogravimetric and (b) Differential Thermogravimetric analysis of the geopolymers.
Figure 13.
Efficiency of heavy metal immobilization process.
Figure 13.
Efficiency of heavy metal immobilization process.
Table 1.
Chemical composition expressed as total metals (mg/kg) of the mining environmental passive samples from the Arequipa region.
Table 1.
Chemical composition expressed as total metals (mg/kg) of the mining environmental passive samples from the Arequipa region.
| Samples of mining environmental liabilities |
Toxic heavy metals |
| Arsenic (As) |
Cadmium (Cd) |
Lead
(Pb) |
Mercury
(Hg) |
Zinc
(Zn) |
| Kiowa- Au |
49.9 |
1.47 |
168.22 |
0.1 |
21 |
| Kiowa-Cu |
291.9 |
2.42 |
1585.8 |
0.2 |
161.9 |
| Topacio |
609.6 |
29.75 |
828.72 |
8.1 |
1221 |
| Coriminas |
145 |
4.17 |
191.47 |
0.6 |
205.2 |
| Madrigal |
195 |
6.03 |
2290.49 |
0.4 |
323.3 |
| Secocha |
160.1 |
21.95 |
1028.8 |
276 |
375.3 |
| Century |
28 |
2.25 |
21.27 |
0.1 |
21.1 |
| Mollehuaca |
2052.2 |
7.96 |
875.74 |
193.1 |
41.3 |
| Paraíso |
6001 |
332.54 |
2081.87 |
35 |
2309 |
| Otapara |
26.3 |
9.29 |
12.71 |
0.8 |
23.4 |
Table 2.
Toxicological analysis of samples (mg/L) of mining environmental liabilities from the Arequipa region.
Table 2.
Toxicological analysis of samples (mg/L) of mining environmental liabilities from the Arequipa region.
| Samples of mining environmental liabilities |
Toxic heavy metals |
|
Arsenic
(As) |
Cadmiun
(Cd) |
Lead
(Pb) |
Mercury
(Hg) |
Zinc
(Zn) |
| Kiowa- Au |
0.011 |
<0.004 |
0.237 |
< 0.003 |
0.051 |
| Kiowa-Cu |
0.023 |
0.063 |
0.01 |
< 0.003 |
9.286 |
| Topacio |
0.587 |
0.201 |
0.034 |
0.003 |
2.612 |
| Coriminas |
0.051 |
0.005 |
< 0.005 |
< 0.003 |
0.317 |
| Madrigal |
< 0.006 |
0.072 |
0.020 |
< 0.003 |
6.162 |
| Secocha |
< 0.006 |
0.005 |
0.403 |
0.026 |
0.139 |
| Century |
< 0.006 |
< 0.004 |
0.008 |
< 0.003 |
0.093 |
| Mollehuaca |
0.020 |
0.004 |
0.071 |
< 0.003 |
0.071 |
| Paraíso |
0.393 |
0.046 |
0.590 |
0.041 |
1.828 |
| Otapara |
< 0.006 |
< 0.004 |
0.006 |
< 0.003 |
0.105 |
Table 3.
Mineralogical analysis of the sample of the “Paraíso” environmental liability.
Table 3.
Mineralogical analysis of the sample of the “Paraíso” environmental liability.
| Mineral name |
General Formula |
% in weigh |
| Quartz +bargain |
SiO2+ varied composition |
60.7 |
| Pyrite |
FeS2
|
15.39 |
| Arsenopyrite |
FeAsS |
9.30 |
| Chalcopyrite |
CuFeS2
|
6.40 |
| Goethite |
Fe3+O(OH) |
4.27 |
| Galena |
PbS |
2.29 |
| rutile |
TiO2
|
1.30 |
| Sphalerite |
ZnS |
Trace |
| Covellite |
CuS |
Trace |
| Pyrrhotite |
Fe(1-X)S |
Trace |
| gray coppers |
varied composition |
Trace |
Table 4.
Geopolymer formulation and alkaline activator solution.
Table 4.
Geopolymer formulation and alkaline activator solution.
| Geopolymer |
Bs∗
(%) |
MT (%)
|
MT
(gr) |
Bs (gr) |
Bs + MT (gr) |
AAS∗∗ |
AAS/Bs |
| MK |
PP |
NaOH
(gr) |
Na2SiO3 (gr) |
AAS (gr) |
| A0 |
0 |
100 |
750 |
0 |
0 |
750 |
64.18 |
188.6 |
252.78 |
0 |
| B10 |
10 |
90 |
675 |
37.5 |
37.5 |
750 |
64.18 |
188.6 |
252.78 |
3.37 |
| C20 |
20 |
80 |
600 |
75 |
75 |
750 |
64.18 |
188.6 |
252.78 |
1.69 |
| D30 |
30 |
70 |
525 |
112.5 |
112.5 |
750 |
64.18 |
188.6 |
252.78 |
1.12 |
| E40 |
40 |
60 |
450 |
150 |
150 |
750 |
64.18 |
188.6 |
252.78 |
0.84 |
| F50 |
50 |
50 |
375 |
187.5 |
187.5 |
750 |
64.18 |
188.6 |
252.78 |
0.67 |
| MK-PP |
0 |
0 |
0 |
375 |
375 |
750 |
64.18 |
188.6 |
252.78 |
0.34 |
Table 5.
Comparative SEM/EDS analysis (% weight) in geopolymers samples.
Table 5.
Comparative SEM/EDS analysis (% weight) in geopolymers samples.
| Element |
A0 |
B10 |
C20 |
D30 |
E40 |
F50 |
MK-PP |
| O |
45.96 |
45.59 |
45.43 |
46.06 |
46.03 |
45.79 |
48.08S |
| F |
- |
- |
- |
- |
- |
1.15 |
- |
| Na |
5.53 |
4.90 |
5.64 |
6.06 |
6.41 |
5.84 |
6.41 |
| Mg |
0.85 |
0.69 |
- |
0.85 |
0.75 |
0.65 |
0.56 |
| Al |
2.53 |
3.41 |
4.37 |
4.95 |
5.81 |
5.39 |
8.64 |
| Si |
24.11 |
23.51 |
24.38 |
23.91 |
25.37 |
24.96 |
31.99 |
| S |
5.15 |
4.63 |
3.83 |
4.41 |
3.04 |
3.47 |
- |
| Cl |
1.17 |
0.86 |
1.13 |
0.88 |
0.71 |
0.53 |
- |
| K |
0.84 |
0.99 |
0.98 |
1.03 |
1.15 |
0.80 |
1.20 |
| Ca |
2.12 |
2.70 |
2.35 |
2.15 |
1.81 |
1.64 |
0.97 |
| Ti |
- |
0.18 |
- |
- |
0.13 |
0.12 |
- |
| Fe |
10.10 |
11.52 |
10.29 |
8.91 |
7.51 |
8.32 |
1.45 |
| Cu |
0.97 |
- |
- |
- |
- |
- |
0.66 |
| As |
0.93 |
1.03 |
10.29 |
0.80 |
1.28 |
1.33 |
0.03 |
Table 6.
Paraíso Total toxic heavy metal content in Paradise MTs.
Table 6.
Paraíso Total toxic heavy metal content in Paradise MTs.
Mine
tailking |
Concentration of Heavy Metals and Metalloids (mg/kg) |
| As |
Cd |
Pb |
Zn |
Hg |
| Paraíso |
6000 |
32,54 |
2081,87 |
2309,00 |
35,00 |
Table 7.
Concentration of toxic heavy metals in MTs leachate and geopolymers.
Table 7.
Concentration of toxic heavy metals in MTs leachate and geopolymers.
Heavy
Metals |
Concentration of Heavy Metals and Metalloids (mg/L) |
| As |
Cd |
Pb |
Zn |
Hg |
| MTs Paraíso |
0.393 |
0.046 |
0.590 |
1.828 |
0.401 |
| A0 |
10.460 |
0.0660 |
0.105 |
5.4060 |
<0.004 |
| B10 |
2.602 |
0.0250 |
0.197 |
6.8870 |
<0.004 |
| C20 |
0.625 |
0.0160 |
0.099 |
7.7940 |
<0.004 |
| D30 |
0.277 |
0.0150 |
0.067 |
7.4240 |
<0.004 |
| E40 |
0.223 |
<0.0004 |
<0.006 |
7.2670 |
<0.004 |
Table 8.
Hazardousness of synthesized geopolymers based on total metal concentrations in MTs and leachates.
Table 8.
Hazardousness of synthesized geopolymers based on total metal concentrations in MTs and leachates.
| Sample |
Arsenic
|
Cadmium
|
Mercury
|
Lead
|
Zinc
|
Clasification |
Conc.
(mg/
Kg) |
TCLP
(ml/L) |
Conc.
(mg/Kg) |
TCLP
(ml/L) |
Conc.
(mg/Kg) |
TCLP
(ml/L) |
Conc.
(mg
/Kg) |
TCLP
(ml/L) |
Conc.
(mg/
Kg) |
TCLP
(ml/L) |
No information for assessment |
| MTs-P |
6000 |
0.393 |
32.54 |
0.046 |
35 |
0.401 |
2081.87 |
0.59 |
2309 |
1.828 |
very hazardous material |
| A0 |
6000 |
10.460 |
32.54 |
0.0660 |
35 |
<0.004 |
2081.87 |
0.105 |
2309 |
5.4060 |
| B10 |
5400 |
2.602 |
29.25 |
0.0250 |
31.5 |
<0.004 |
1873.68 |
0.197 |
2078.1 |
6.8870 |
hazardous material |
| C20 |
4800 |
0.625 |
26.00 |
0.0160 |
28.00 |
<0.004 |
1665.49 |
0.099 |
1847.2 |
7.7940 |
| D30 |
4200 |
0.277 |
22.75 |
0.0150 |
24.5 |
<0.004 |
1457.31 |
0.067 |
1616.3 |
7.4240 |
No hazardous material |
| E40 |
3600 |
0.223 |
19.5 |
<0.0004 |
21.0 |
<0.004 |
1249.12 |
<0.006 |
1385.4 |
7.2670 |
|
Disclaimer/Publisher’s Note: The statements, opinions and data contained in all publications are solely those of the individual author(s) and contributor(s) and not of MDPI and/or the editor(s). MDPI and/or the editor(s) disclaim responsibility for any injury to people or property resulting from any ideas, methods, instructions or products referred to in the content. |
© 2024 by the authors. Licensee MDPI, Basel, Switzerland. This article is an open access article distributed under the terms and conditions of the Creative Commons Attribution (CC BY) license (http://creativecommons.org/licenses/by/4.0/).
