1. Introduction
Permafrost, characterized by ground where temperature remains below 0°C for at least two consecutive years [
1,
2], covers approximately one-quarter of the land area in the Northern Hemisphere [
3,
4,
5]. The thermal state of permafrost is highly sensitive to changes, primarily due to climate conditions [
1,
6,
7]. Arctic warming amplification, a well-established phenomenon with the Arctic warming approximately twice as fast as the global average, is altering the distribution of permafrost worldwide and causing its decline. [
7,
8,
9]. The top layer of soil above the permafrost is subject to seasonal thawing and freezing, so called the Active Layer. Frequent thawing and freezing caused by climate warming will increase the Active Layer Thickness (ALT) and lead to a general reduction in surface permafrost area. This seasonal thawing and freezing of the active layer will shrink and expand due to the contraction and expansion of pore water, which will cause thawing and settlement, reduce foundation stress and ground bearing capacity, and lead to infrastructure deformation [
10].
As permafrost thawing intensifies, an observable increase in ALT is noted across permafrost regions, reflecting ongoing climate change impacts.[
11,
12,
13,
14,
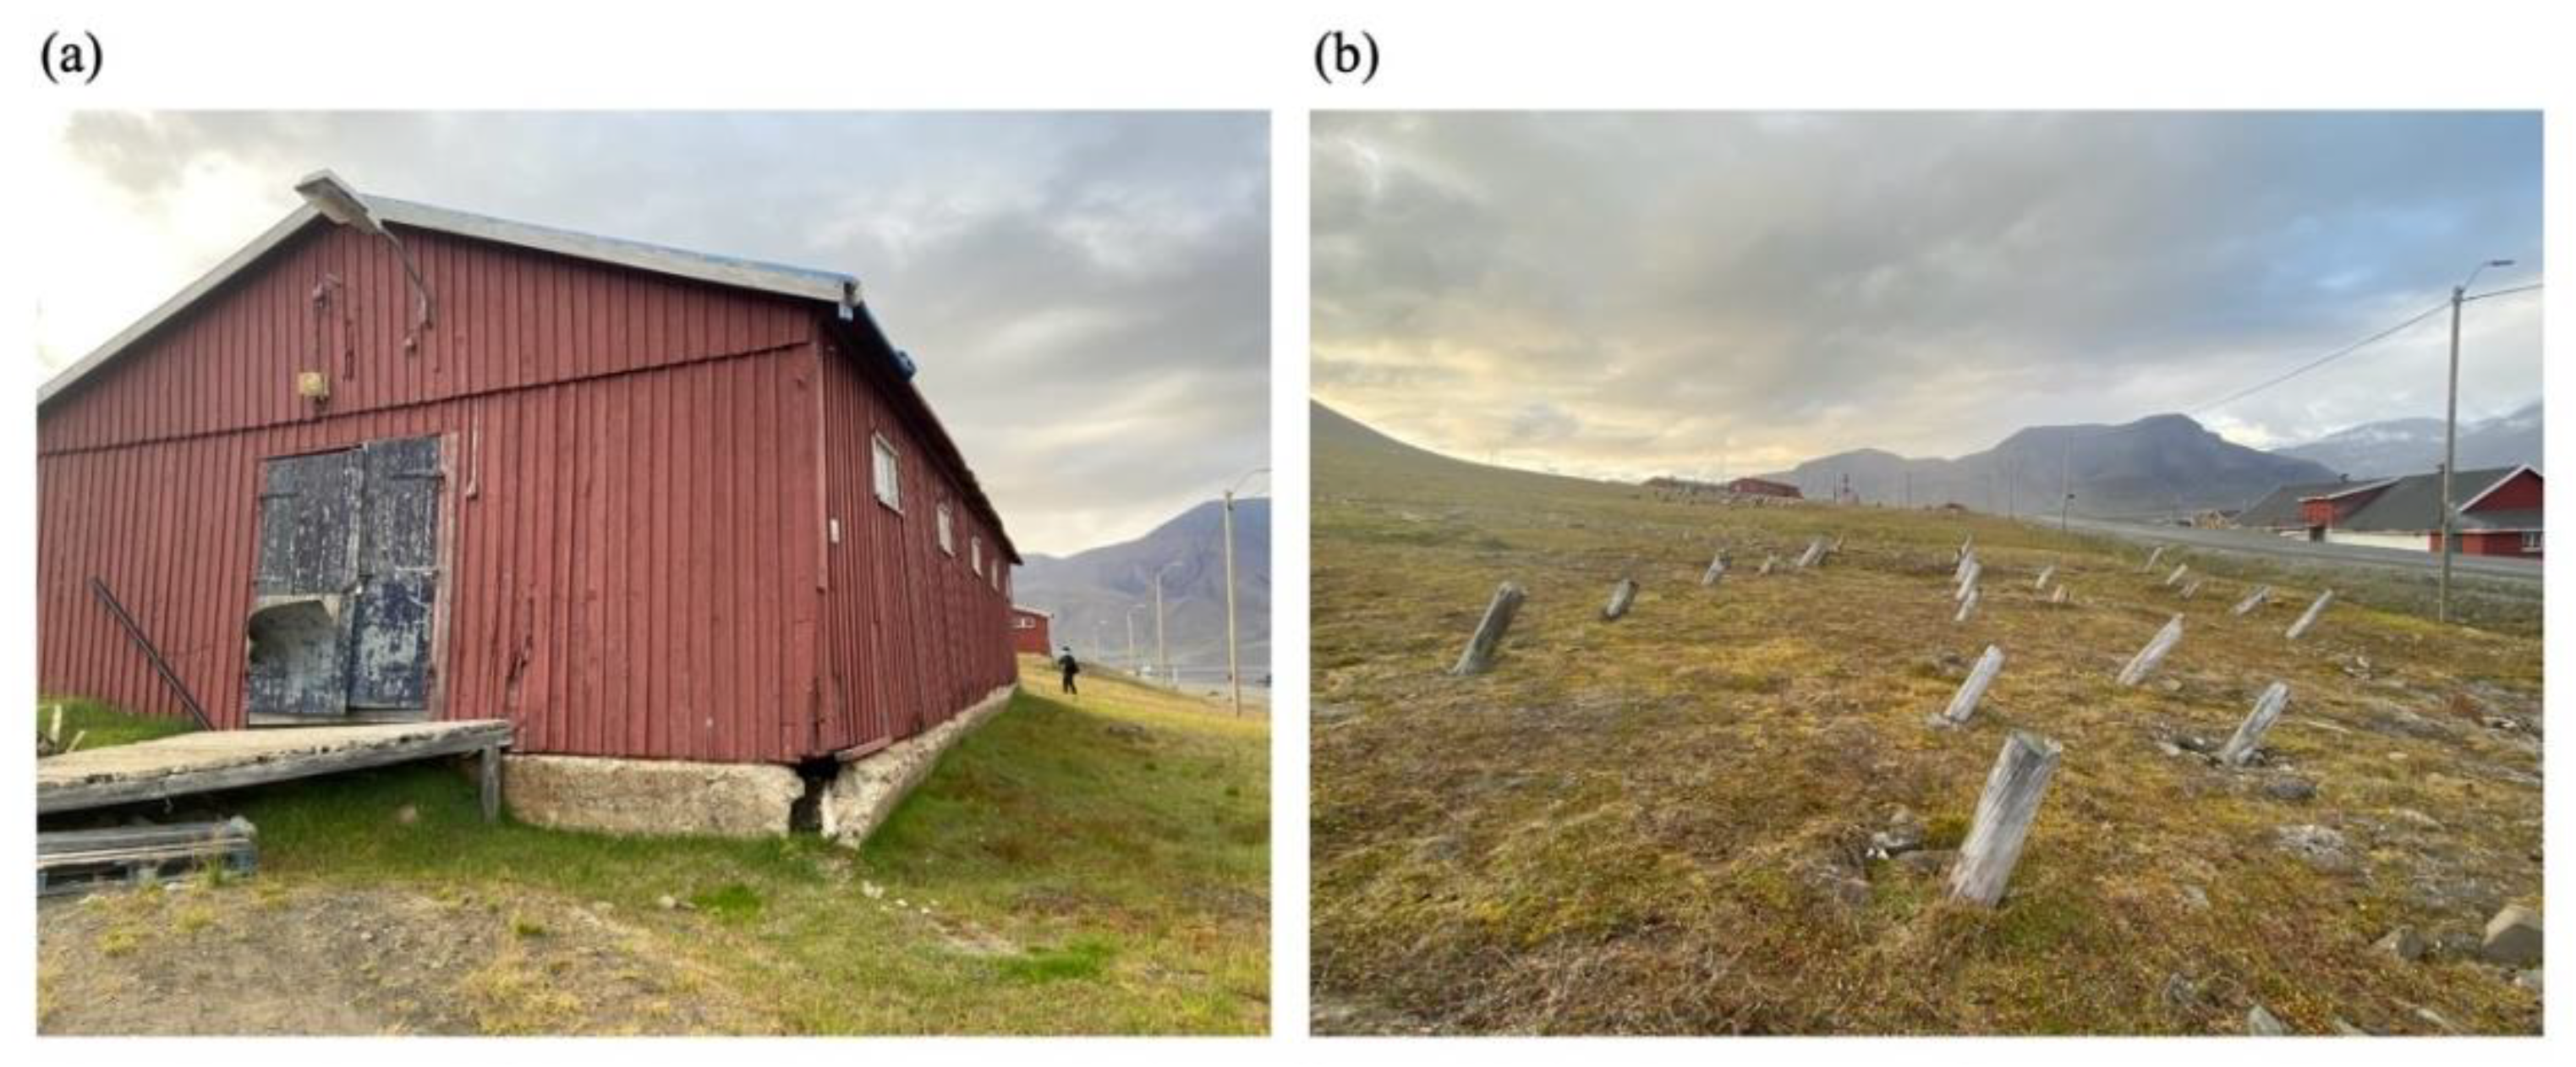
15]. The phenomena might become more rapidly in the future, thawing permafrost could also impact the local construction (
Figure 2). Therefore, monitoring permafrost variation becomes crucial. However, it is challenging to determine and monitor active layer conditions through direct excavation, core drilling, or the installation of downhole temperature sensors. Consequently, indirect geophysical surveys, such as Electrical Resistivity Imaging (ERI) and Ground Penetrating Radar (GPR), are often employed for regional ALT investigation, providing near-surface indicators of subsurface soil conditions [
16,
17,
18]. In our study, we conducted ERI survey at the Kaffiørya Plain, near the Nicholas Copernicus University Polar Station (NCUPS) during the summers of 2022 and 2023. The 185-meter long survey line extends from the research station to the coastline, allowing us to monitor and analyze changes in the permafrost and active layers changes influenced by global warming.
2. Study Site and Survey Configuration
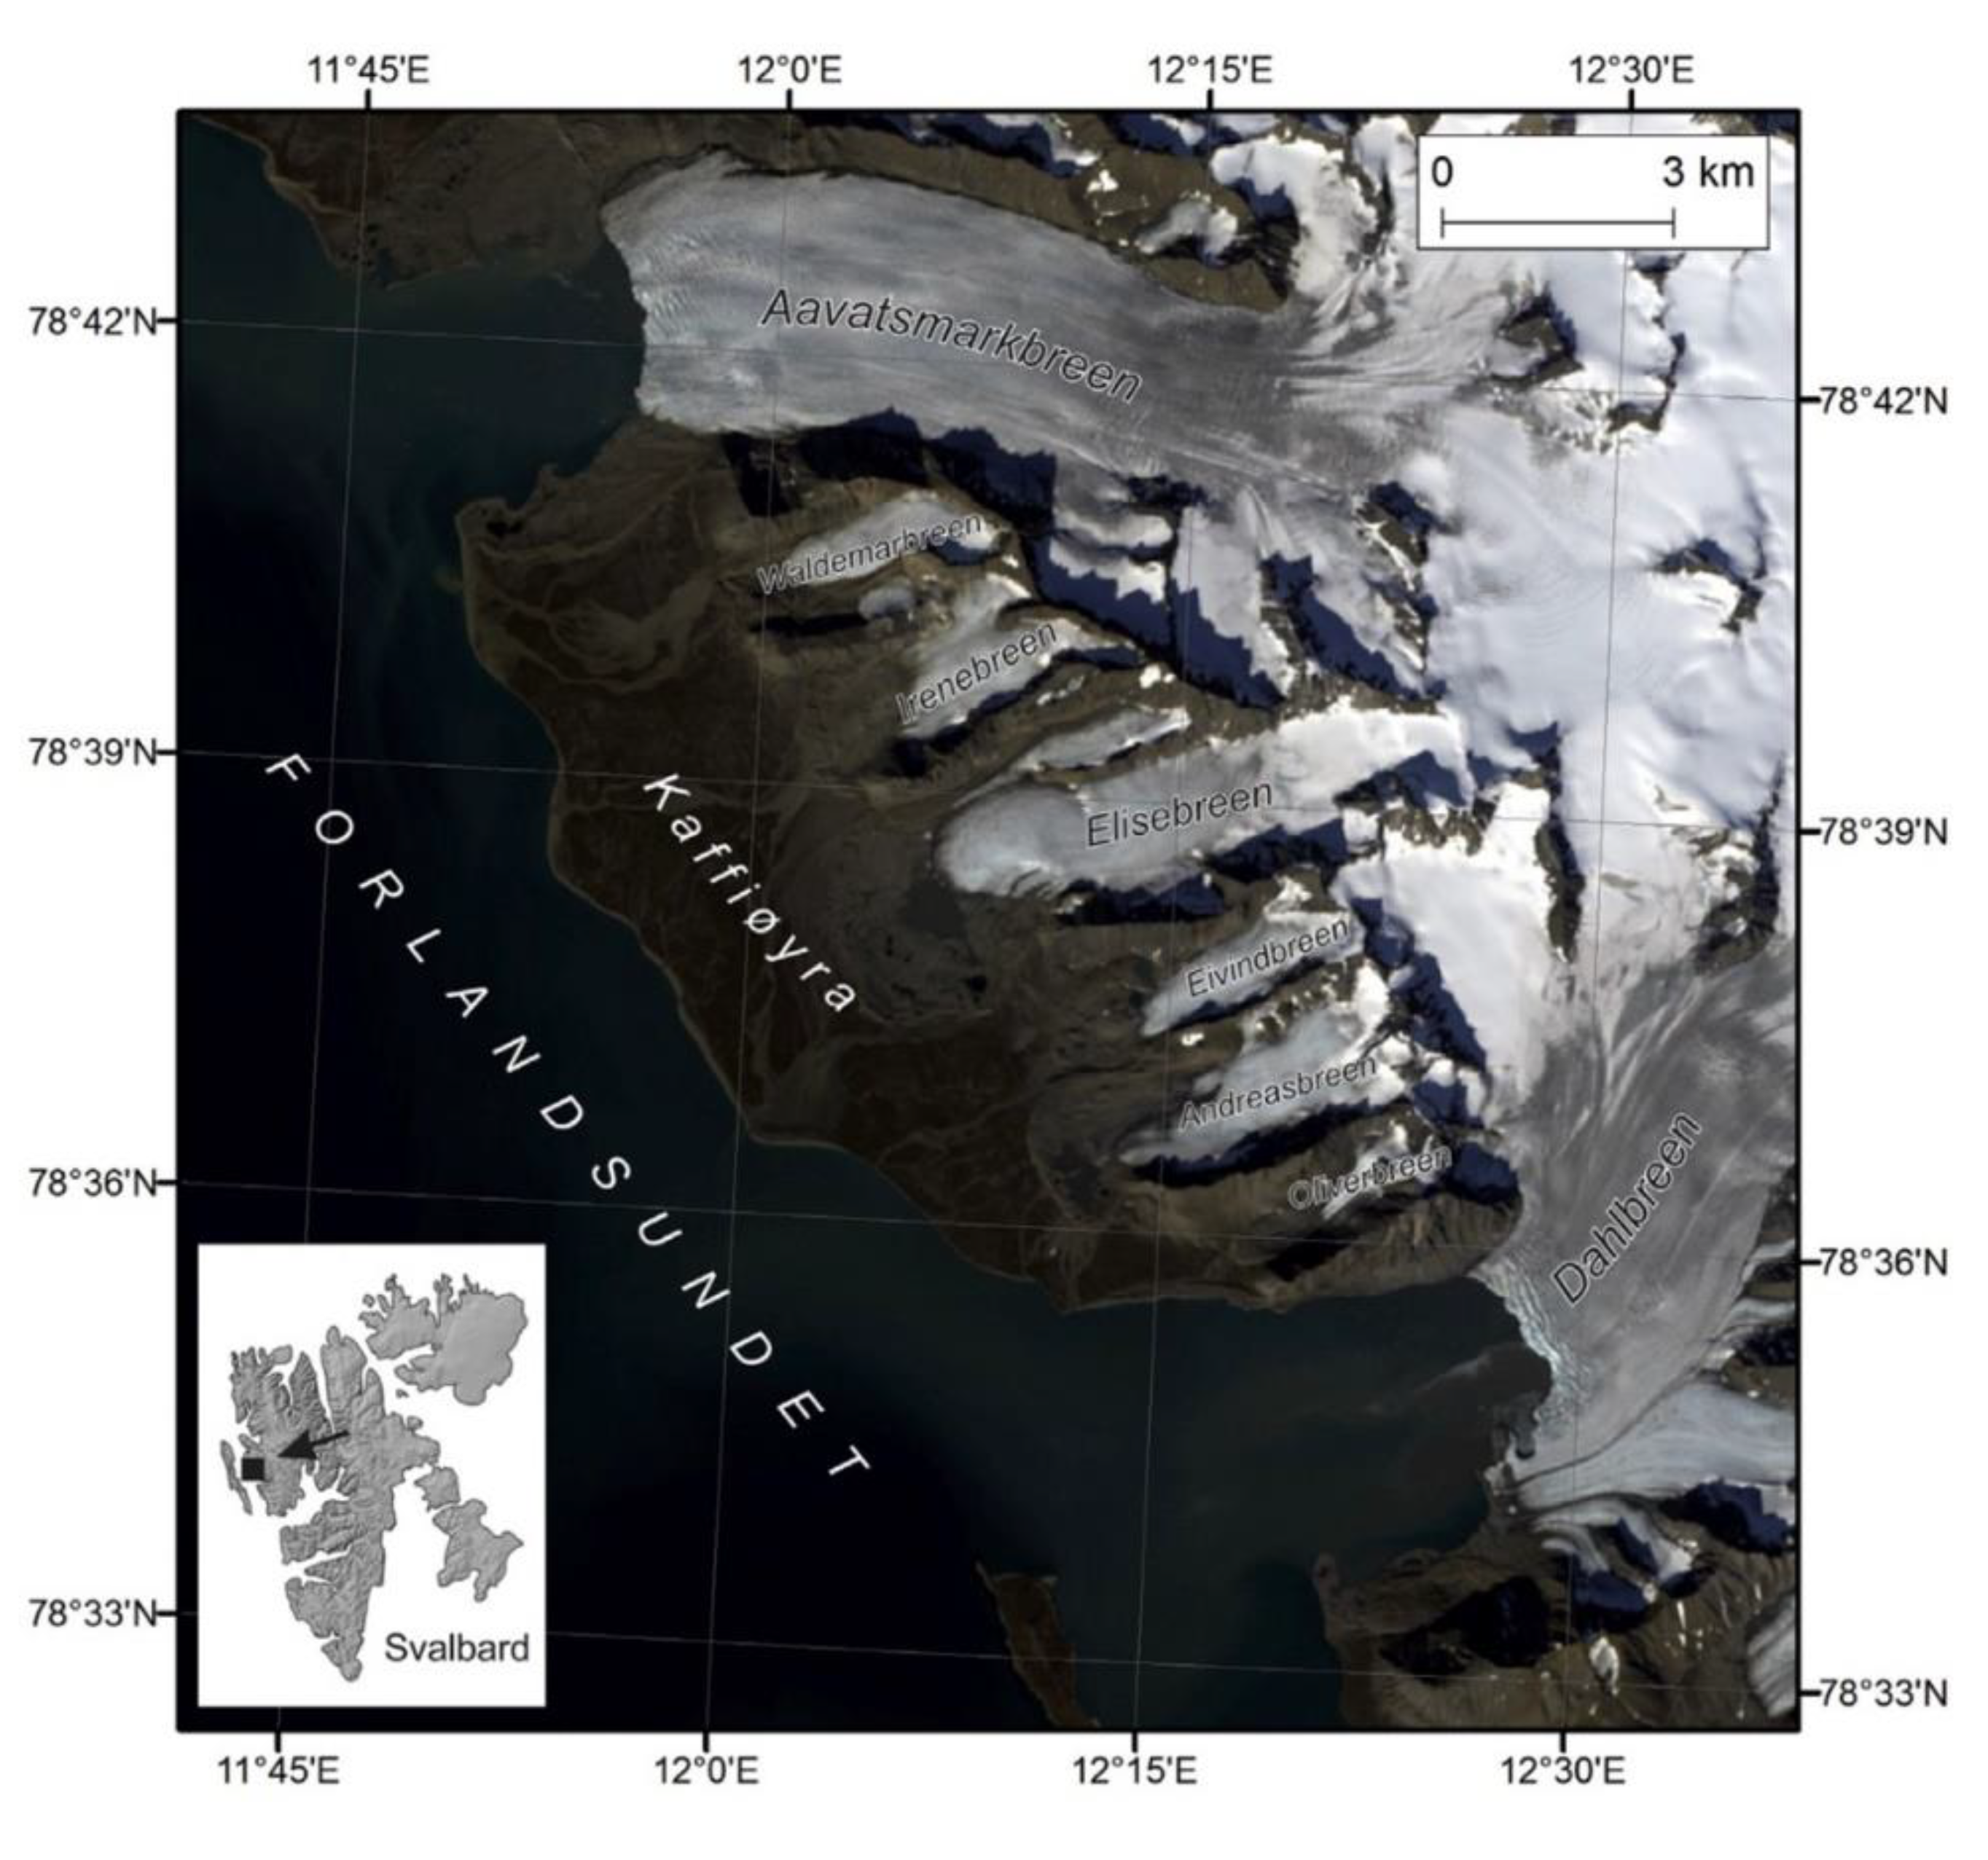
T Our study area is located at the Kaffiøyra Plain near the Nicolaus Copernicus University Polar Station (NCUPS) on the western Spitsbergen Island of Svalbard archipelago (
Figure 1). Kaffiøyra is a coastal plain located in north-western Spitsbergen (Oscar II Land), constitutes the largest island of the Svalbard archipelago. It covers an area of 2 582 km
2, 70% of which is represented by glaciers, stretching across nearly 1,600 km
2. The glacierized areas predominantly comprise ice plateau, from which glaciers emanate [
20]. The majority of Kaffiøyra terrain is covered by moraines and tundra, consisting of outwash from the adjacent glaciers. The NCUPS is situated in the northern part of the Kaffiørya, adgacent to Hornbreak bay, fromed by the retreating Avatsmarkbreen. Near the NCUPS, the river system is primarily contributed by a smaller glacier, Waldemarbreen, which is located south of the large glacier bounding the Kaffiøyra Plain to the north, Aavatsmarkbreen (
Figure 1). The recession of the glaciers in the Kaffiøyra area during the analytical period is attributed to a negative trend in the mass balance and dynamics of the Svalbard glaciers [
19,
21]. Consequently, the dry creek bed of the Waldemarbreen river system is observed near the NCUPS. The air temperature displayed a statistically significant upward trend of 0.3 °C·10yr
-1. Since the beginning of the measurements, the temperature has risen by 1.4 °C [
22]). Temperature also impacts the active layer above the permafrost; compared to the period between 1996 and 2012, the average thickness of the active layer in the Kaffiøyra region increased by 3% (tundra), 5% (glacier moraine), and 6% (beach) from 2008 to 2012.
Figure 1.
The location of Kaffiørya plan and the adjacent glaciers in north-western Spitsbergen [
19].
Figure 1.
The location of Kaffiørya plan and the adjacent glaciers in north-western Spitsbergen [
19].
Figure 2.
The impact of the thawing permafrost on construction in Svalbard. (a) Warehouse damaged and (b) Slanted house foundation due to permafrost thawing.
Figure 2.
The impact of the thawing permafrost on construction in Svalbard. (a) Warehouse damaged and (b) Slanted house foundation due to permafrost thawing.
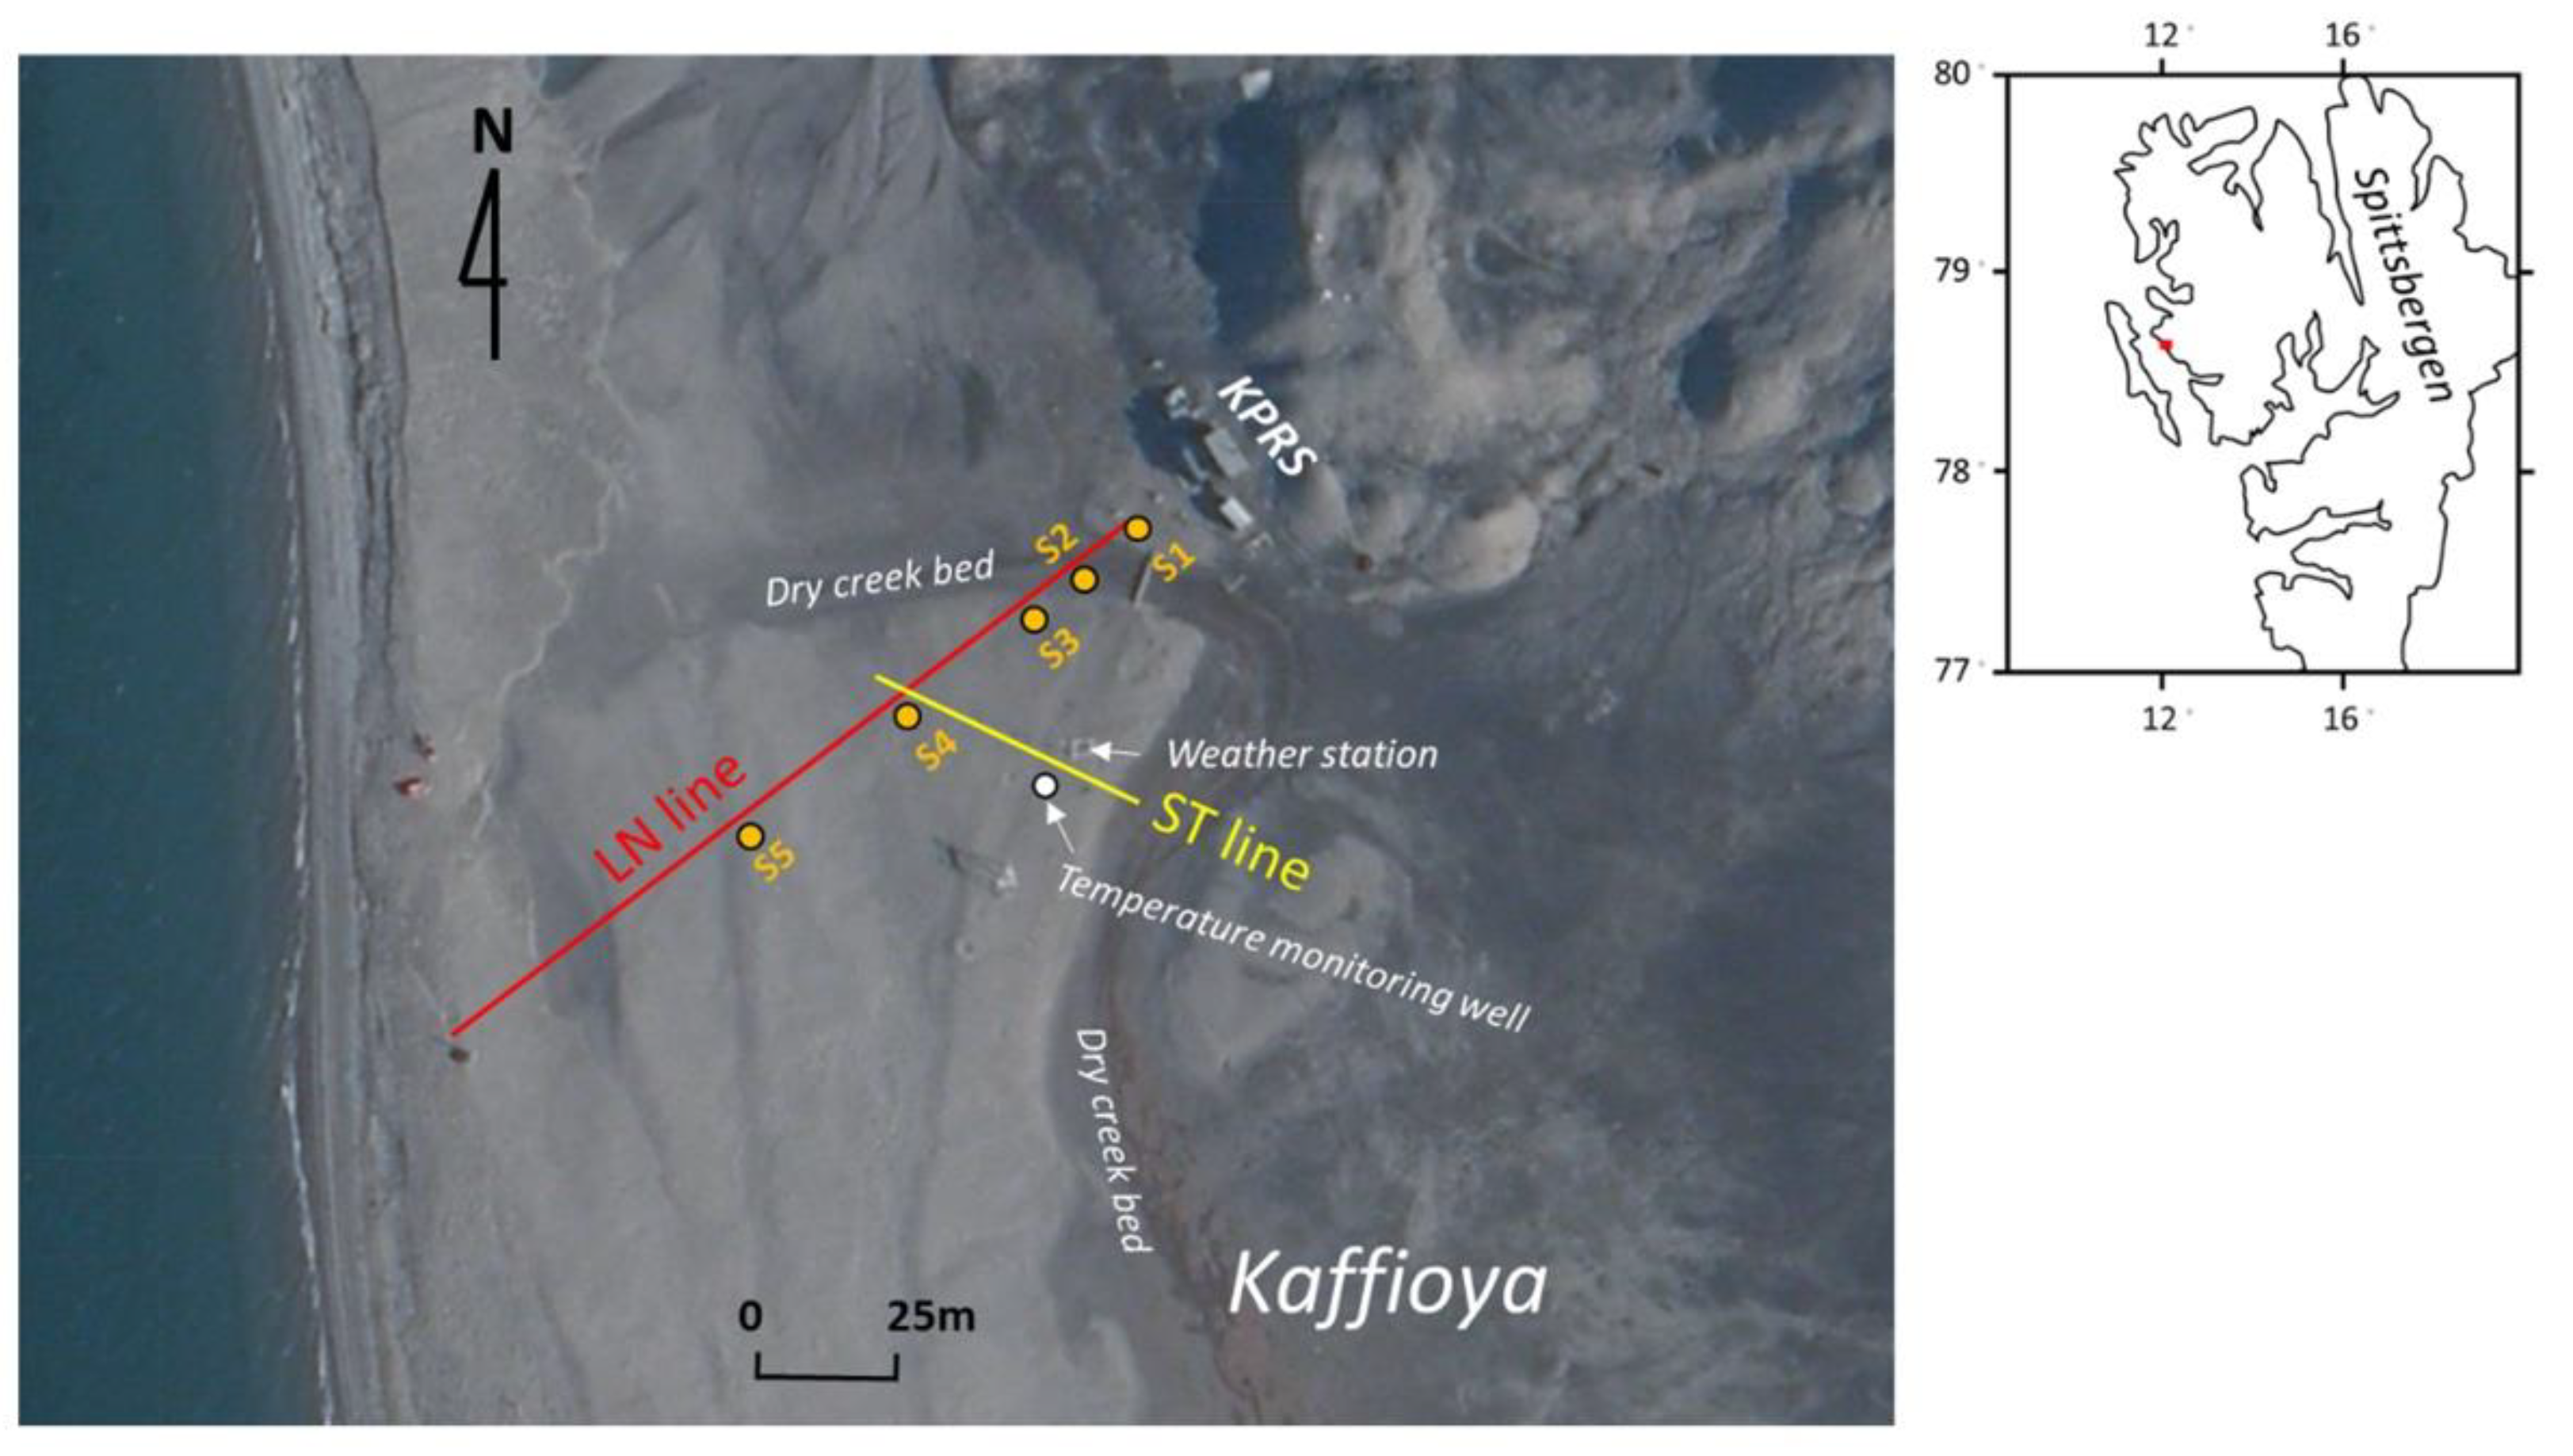
We conducted the ERI survey along the LN line (
Figure 3) in August of 2022 and 2023. The LN line is about 148-m long, with direction perpendicular to the coastline and. Along the LN line, we have drilled five shallow boreholes, namely S1, S2, S3, S4, and S5, see
Table 1, to monitor the groundwater levels and temperatures. In other side, a new borehole equipped with temperature sensors was installed near the weather station as shown in
Figure 3. We conducted ERI survey along the 40-m long ST line, in order to compare measured resistivity with subsurface temperatures.
The field data measurements were conducted using the 4-point light 10W resistivity meter and the multiple active electrode (ActEle) system [
23] In August 2022, we utilized 20 ActEle electrodes in a roll-along configuration to collect data along the profile. In order to achieve greater exploration depth, we increase the number of electrodes to 40 in the August 2023 survey. We applied the Wenner (WN) array with 1-meter electrode spacing for the ERI surveys, as higher signal-to-noise ratios and greater sensitivity to horizontal structures are frequently obtained with the WN array [
24], such as variation of groundwater tables [
25,
26]. This study uses EarthImager2D
TM [
27], a two-dimensional (2D) inversion program. EarthImager2D
TM facilitates the computation of the optimum resistivity models by utilizing an iterative conjugate gradient inversion method and finite-element forward solutions [
28]. A comprehensive review of inversion method for resistivity studies can be found in Sharma and Verma [
29].
3. Results
T
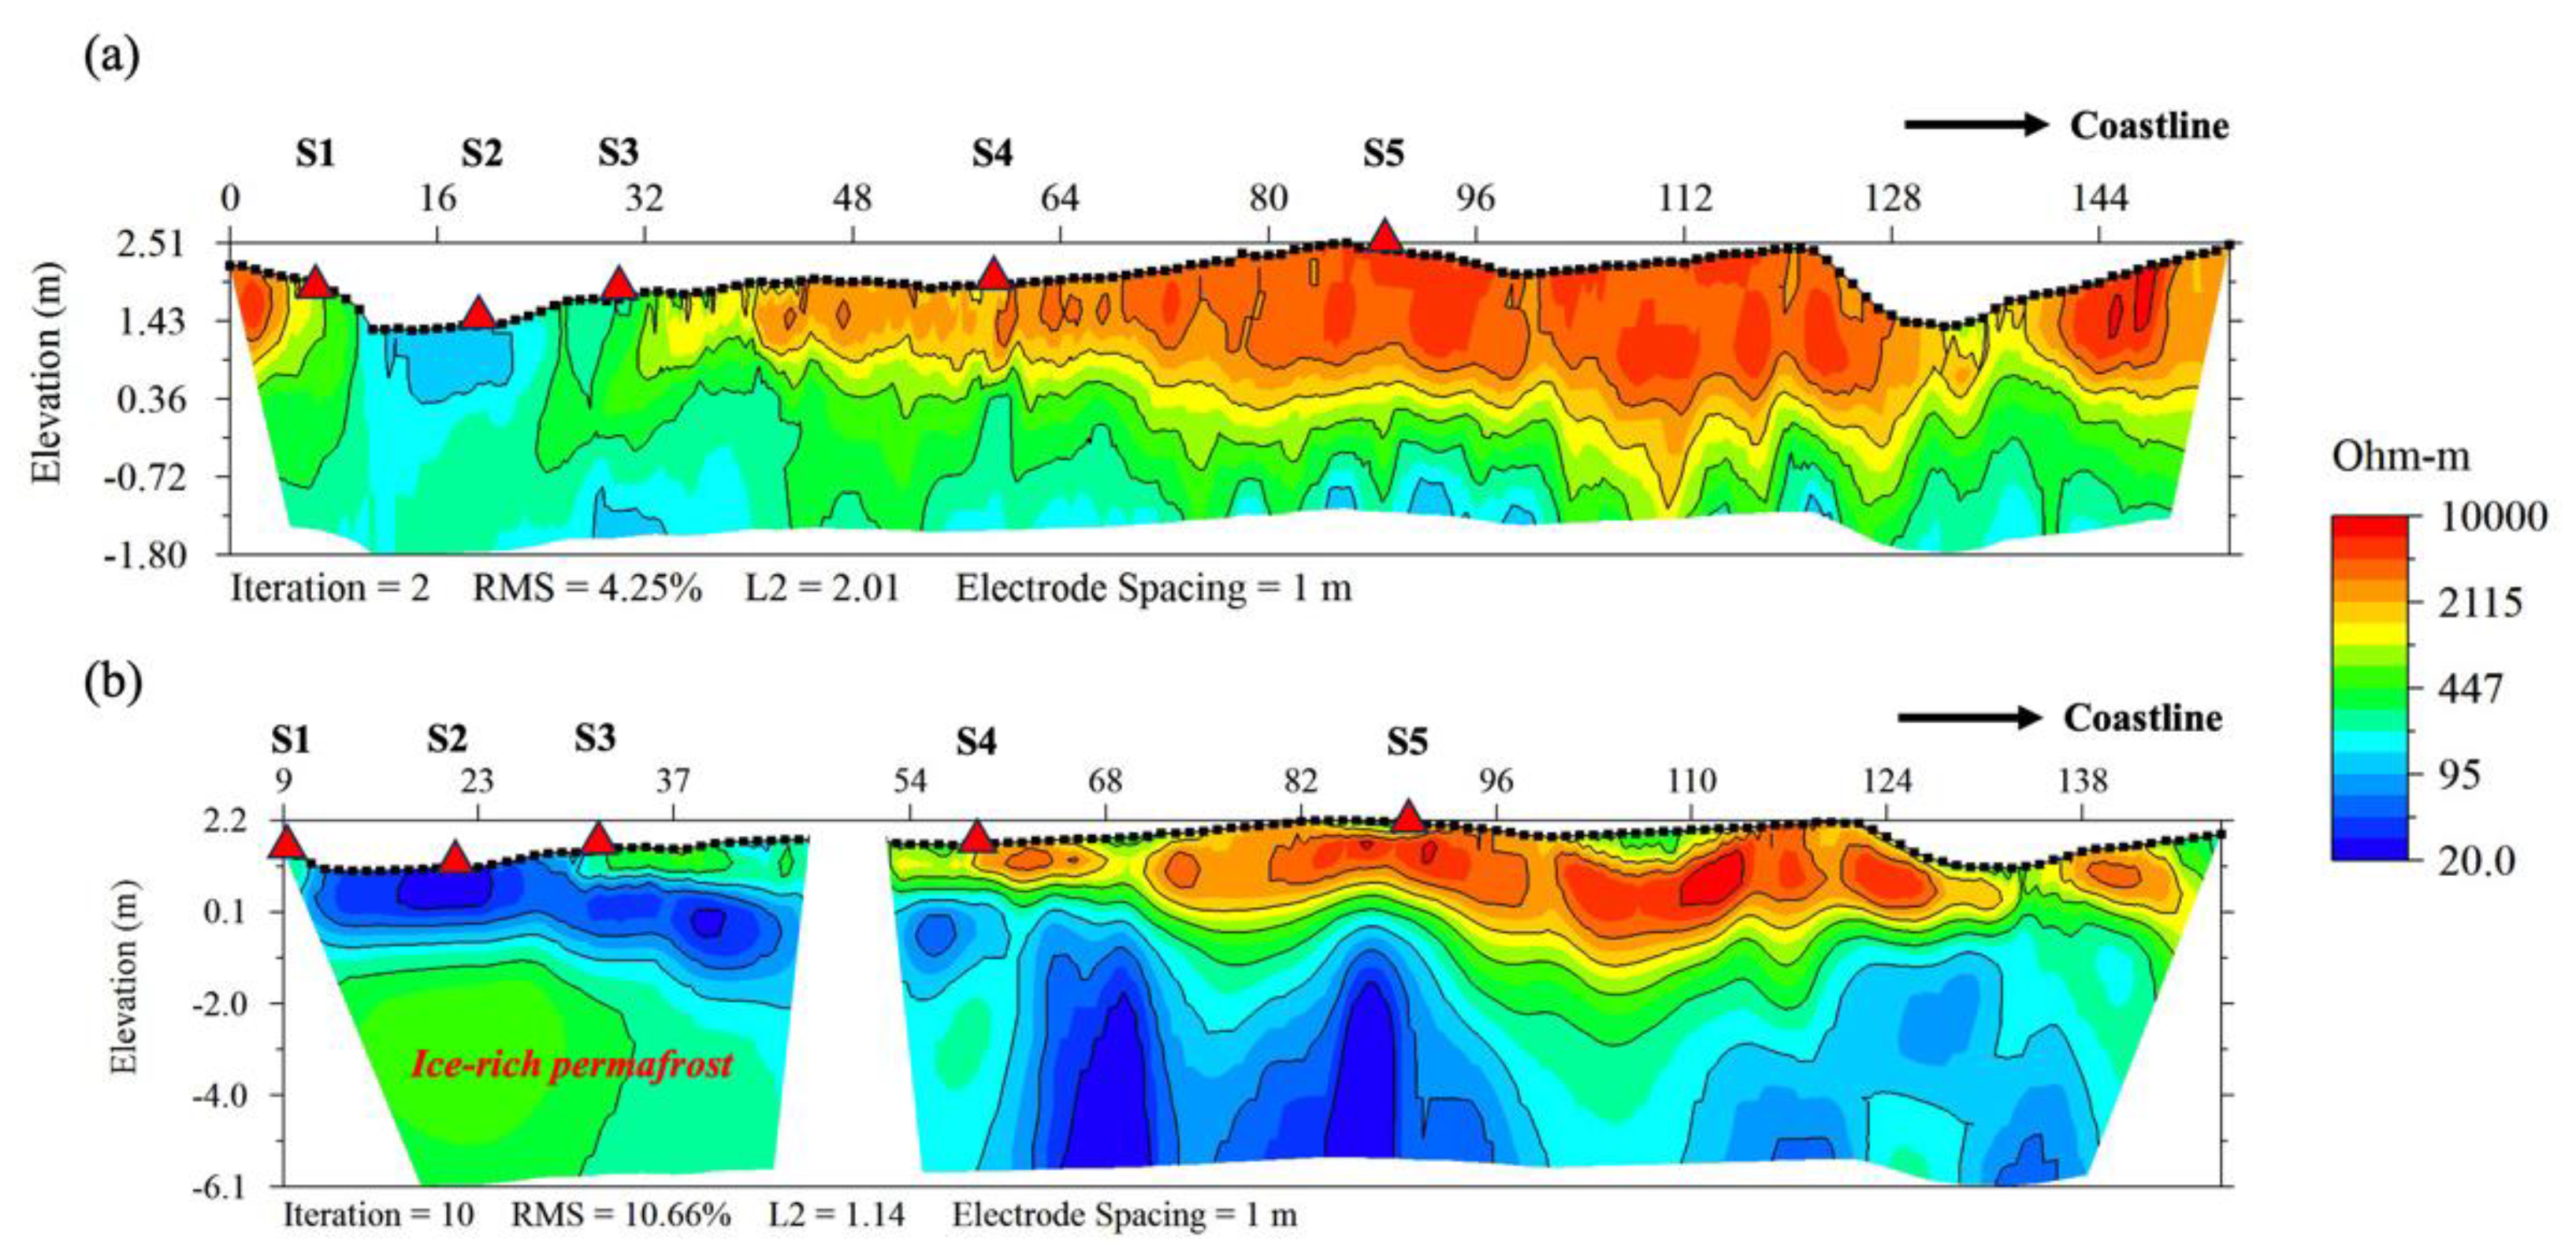
Figure 4a displays the inverted resistivity images of the LN line collected in 2022. Boreholes S1, S2, S3, S4, and S5 are located at 9 meters, 19 meters, 29 meters, 59 meters, and 89 meters along the LN survey line. In August 2022, we observed that the near-surface regions consist mainly of resistive materials with resistivity values exceeding 2000 Ohm-m, spanning from 0 to 9 meters and 33 to 158 meters along the LN line. These resistive regions correspond to unsaturated outwash sediments, with a thickness of the resistive ranging from 1 to 2 meters. Below the surface resistive layer, the resistivity rapidly decreases to less than 500 Ohm-m, which may indicate the presence of the permafrost layer. Between 13 to 24 meters along the LN line, the near-surface region exhibits resistivity of less than 100 Ohm-m, indicating the possibility of perched groundwater beneath the dried creek bed. Some conductive structures extending deeper from the shallow perched groundwater may suggest vertical infiltration paths through the talik in the permafrost.
Figure 4b displays the resistivity images of the LN line collected in 2023. The survey originates from the location of the S1 borehole, designated as 9 meters in the 2023 surveys, due to the loss of the original starting marker. Owing to poor electrode contact, measurements from four electrodes had to be excluded, resulting in blank areas in the inverted results beneath these electrodes. Similar to the result in 2022, we have identified a resistive unsaturated layer extending from 55 to 148 meters along the LN line, with a thickness ranging from 1 to 2 meters. Below this unsaturated layer, the resistivity decreases to mostly less than 500 Ohm-m between 0 to 60 meters on the LN line, indicative of the permafrost layer. However, the region beneath the unsaturated sediments exhibits resistivity values of less than 100 Ohm-m between 0 to 60 meters on the LN line. Furthermore, the conductive structure above the possible resistive ice-rich permafrost beneath the dry riverbed appears to connect horizontally to this conductive region, suggesting the distribution of melting talik and groundwater conduits due to the thermokarst effect.
Compared to the measured groundwater table during the same period in 2022 and 2023 , it is evident that the groundwater table appears to be shallower in wells S2 and S3, which are located in the dry creek bed, and deeper in wells S1, S4, and S5 (
Table 2). Additionally, the groundwater table is roughly consistent with the 400 Ohm-m boundary between the resistive shallow ground and the conductive subsurface.
In August 2023, a new monitoring well, equipped with temperature sensor arrays was completed. To compare the temperature measurements with the resistivity data, we conducted the ST line, which extends from the area near the S4 borehole to the weather station.
Figure 5 displays the inverted electrical resistivity image of the ST survey line. The upper 1-2 meters consist of unsaturated resistive sediments with resistivity higher than 1000 Ohm-m. Below the unsaturated sediments lies a conductive layer with resistivity less than 200 Ohm-m, which may indicate possible groundwater above the permafrost layer. Further below the conductive layer, the resistivity increases to approximately 200-600 Ohm-m in the region between 5 and 27 meters on the ST line, suggesting the presence of frozen permafrost. In addition to the permafrost region, the areas between 0 and 4 meters, and between 28 and 39 meters mainly consist of low-resistivity materials with resistivity less than 150 Ohm-m, indicating the possible presence of a melting talik.
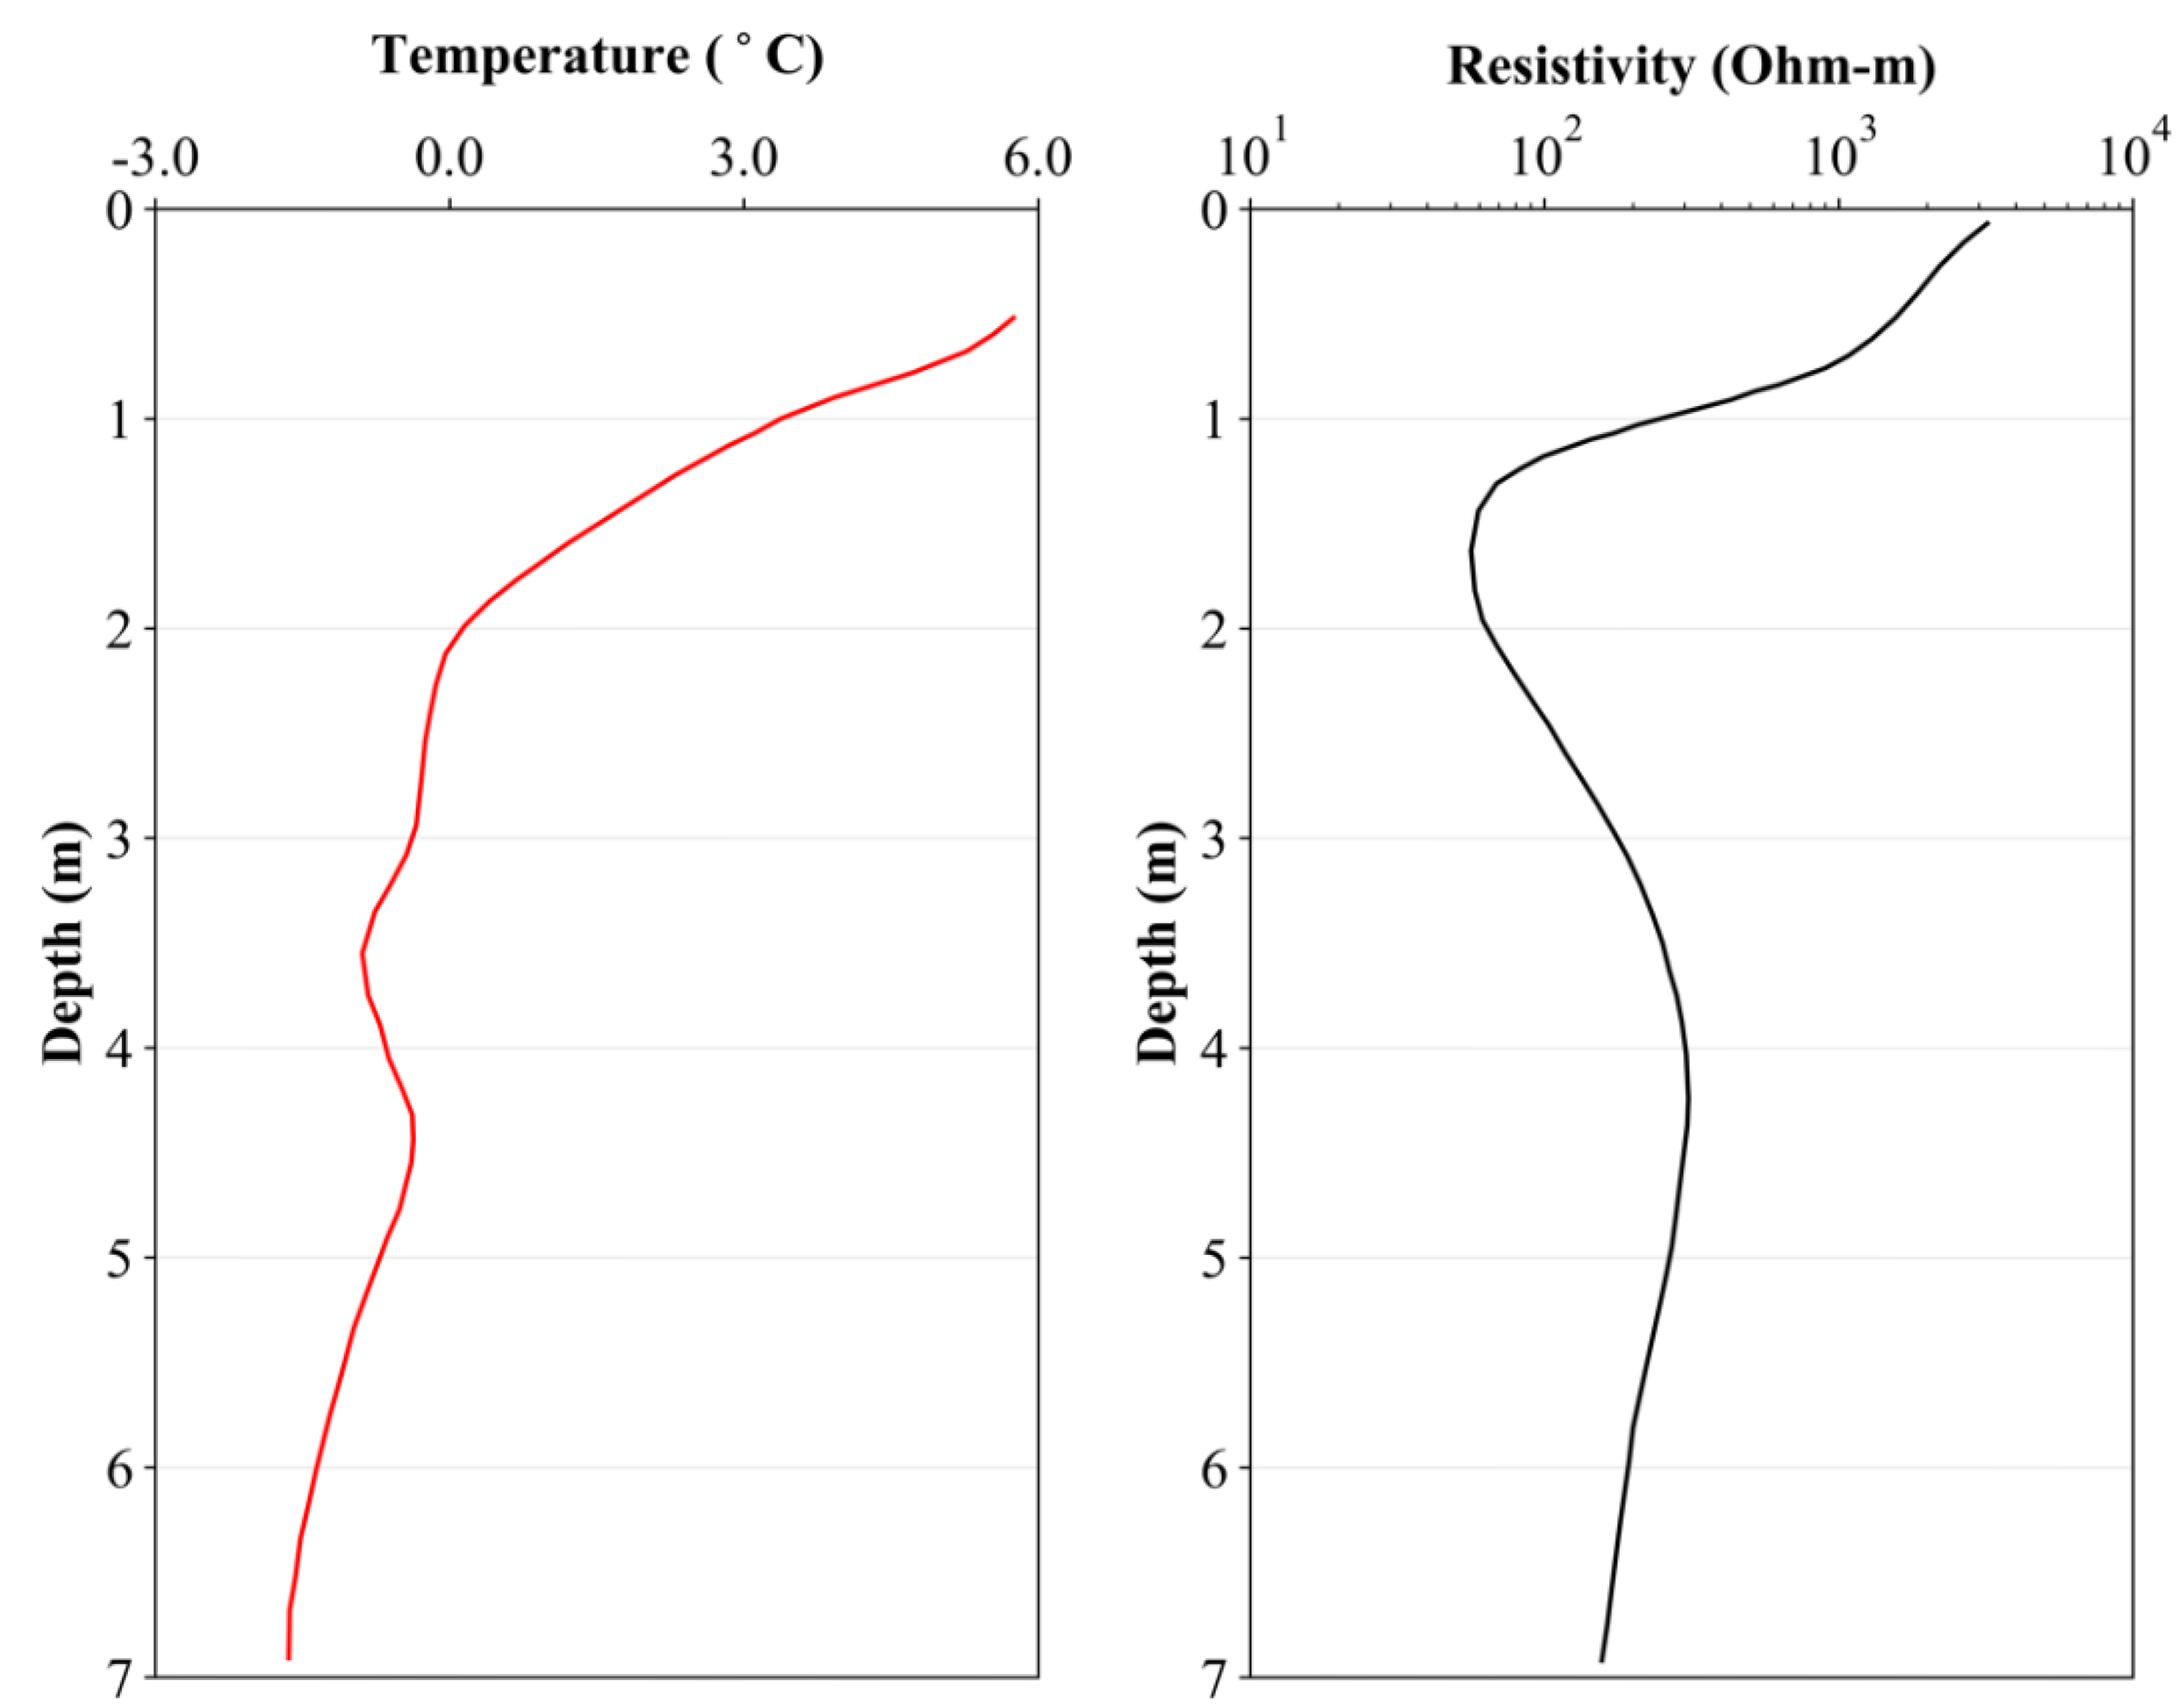
Figure 6 shows the downhole temperature measured in the borehole temperature monitoring well alongside the vertical resistivity measurements near the well. Generally, the temperature between 2 meters and 8 meters deep mainly ranges from 0 to -2°C. We also observe that the soil above a depth of 2 meters is above 0
, with resistivity reaching a low value of about 50 Ohm-m at a depth of 1.8 meters.
These temperature measurements confirm the existence of a deeper permafrost level below 2 meters. Furthermore, we observed inconsistent trends between the vertical temperature and resistivity. Specifically, the resistivity reaches its lowest at a depth of about 1.6 meters, then increases to over 200 Ohm-m at about 4 meters, and slightly decreases to around 150 Ohm-m at a depth of 7 meters. However, the temperature quickly decreases from 6 at the ground surface to 0℃ at about 2 meters deep. The temperature remains between 0 and -2 from 2 to 5 meters deep, gradually decreasing to lower than -1 at a depth of 7 meters. This observation may imply the existence of resistive ice-rich permafrost between 2 meters and 5 meters deep in the ST line.
4. Discussion
4.1. Resistivity Difference between 2022 and 2023
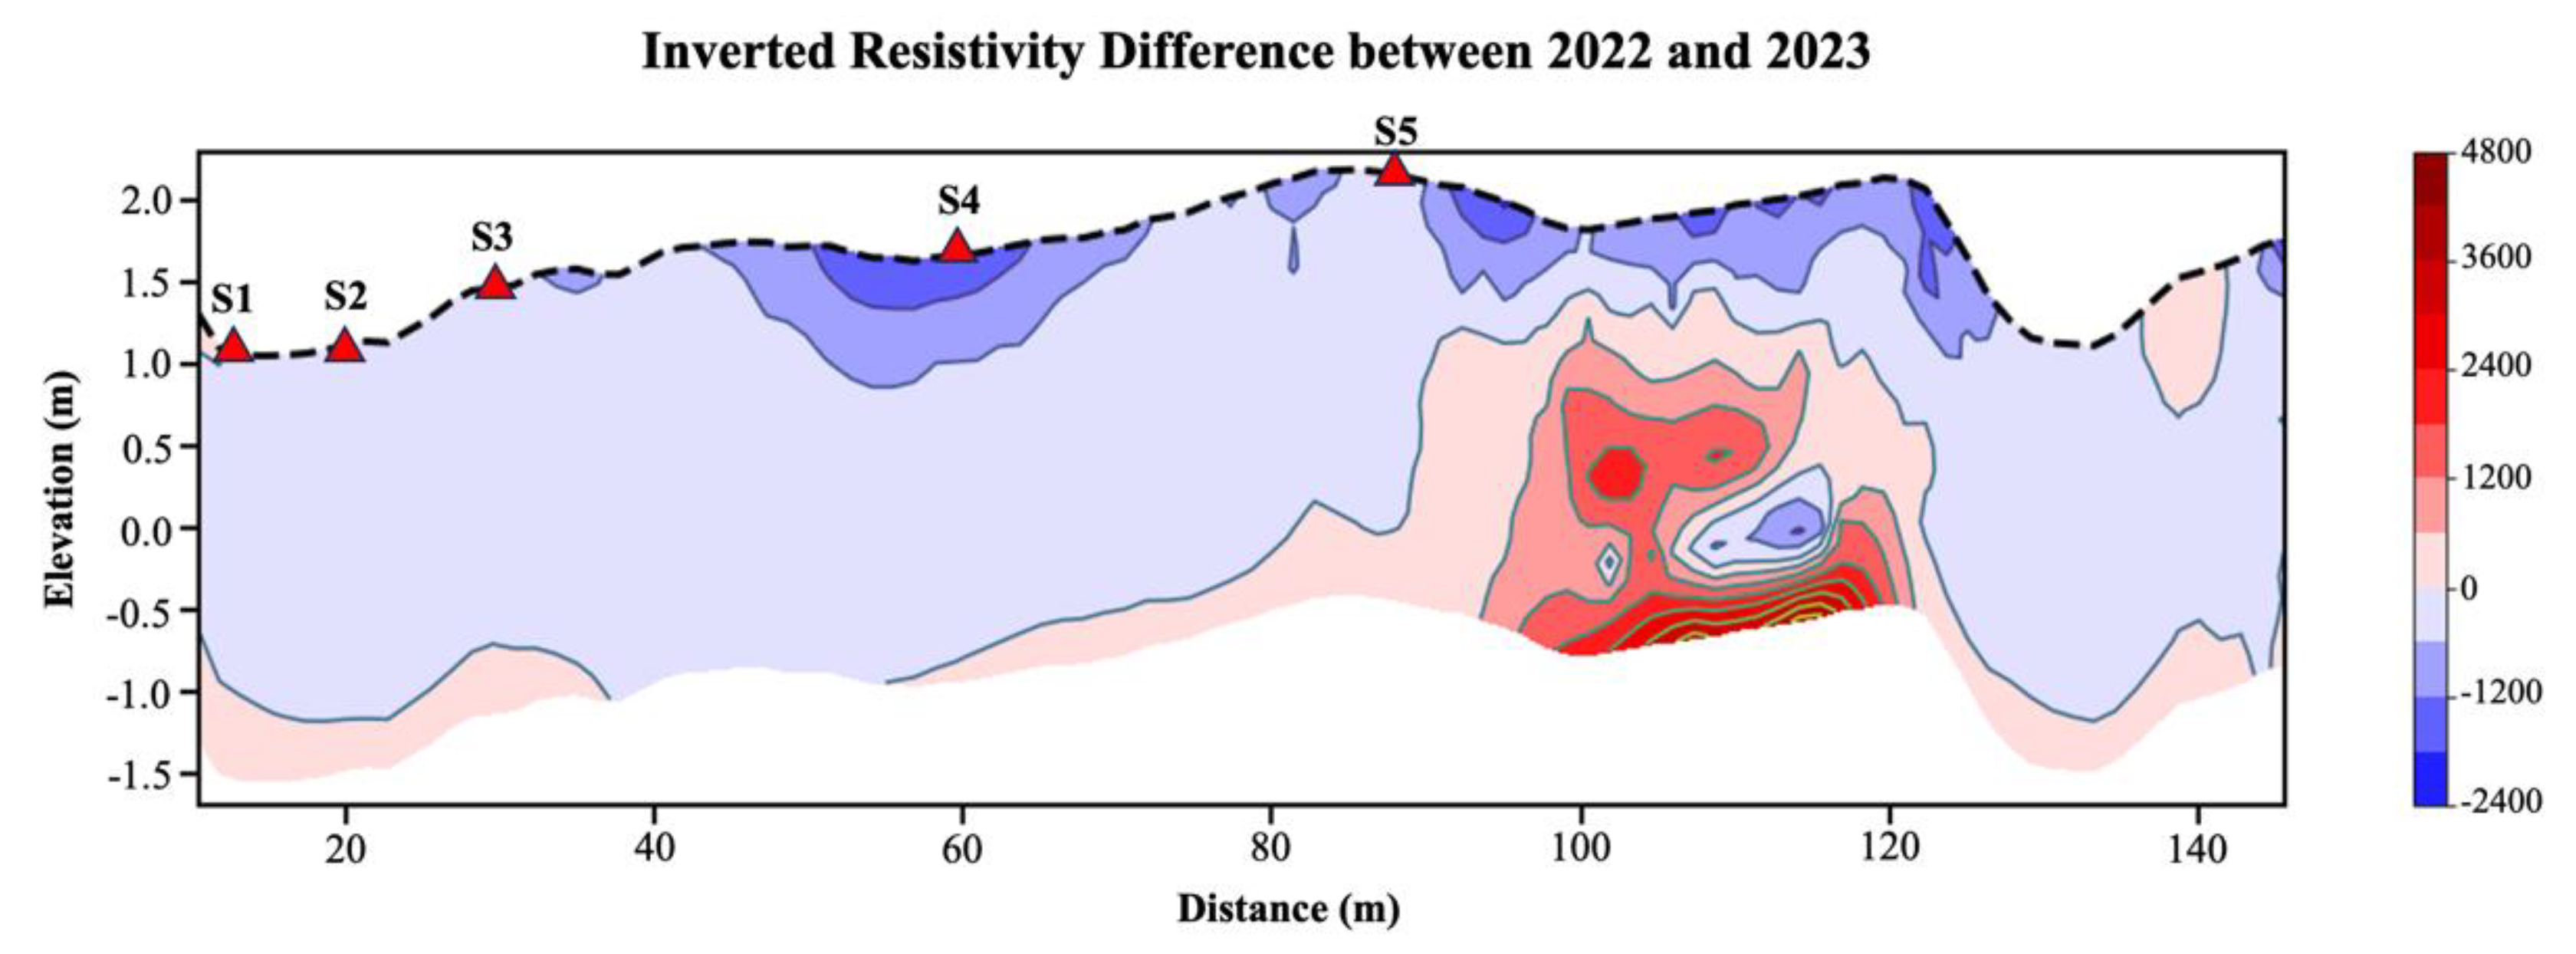
Figure 7 illustrates the differences in inverted resistivity between August, 2022 and August, 2023. Svalbard experienced average temperatures of 2.5
and 8.3
in August during the measuring periods of 2022 and 2023, respectively (
https://www.yr.no/en/statistics/table/5-99910/Norway/Svalbard/Svalbard). Several physical factors may affect the measured subsurface resistivity, including lithology, mineral composition, water content, porosity, pore structure and connectivity, and pore water composition [Archie, 1942], along with temperature variations [Dachnov, 1962]. Since there were no precipitations during the measuring periods in both 2022 and 2023, the temperature increase of 5.8
resulted in a significant decrease of several hundred Ohm-m in resistivity in the active layer near the surface.
Additionally, we observed a region with increased resistivity exceeding 1200 Ohm-m between 90 and 120 meters along the survey line at depths of 0.5-3 meters in the LN profile. This higher resistivity may indicate the presence of remaining ice wedges in the active layer, as ice typically exhibits higher resistivity compared to unfrozen soils.
4.2. Determining Hydraulic Parameters within the Active Zone
In the active zone above the permafrost, soil and rock resistivity are influenced by the resistivity of pore fluid, porosity, as well as saturation and cementation status. Archie [
30] developed an empirical formula to describe the relationships between the bulk resistivity of soils/rocks (
), porosity (
), saturation (
), and resistivity of pore water (ρ
w):
where
is the tortuosity factor,
and
are the saturation index and cementation index, respectively. In general, homogeneous rocks and soils,
ranges from 1.8 to 2.2, and the value of
is about 2; thus, considering
, the Equation (1) is approximated as:
where
is the volumetric water content.
According to
Table 1, the groundwater table is at a depth of 1.3 meters in S4. Thus, if we use the resistivity measured below 1.3 meters deep as the saturated soils, we can estimate the volumetric water content based on Equations (3) and (2) for the active zone. We can first correct the temperature effect according to Equation (3) and then estimate the water content from Equation (2) by assuming homogeneous soil. Since the water content (
) equal to the average porosity (
in the unfrozen saturated zone, we have:
The volumetric water content in the active layer can be estimated as:
Additionally, resistivity is affected by the decrease in rock temperatures above the freezing point. Keller and Frischknecht [
31] derived the relationships between resistivity (ρ) and the temperature difference (T – T
0) from the resistivity value (ρ
0) at a reference temperature (T
0):
Here, the constant α approaches values of 0.025 K
−1 for most electrolytes [
31]. Hence, by correcting the temperature effect using equation (5) and assuming that the average porosity of the washout is similar to that of the fluvial gravels (approximately 0.26), we should be able to estimate the water content in the active layer above the permafrost based on equation (4).
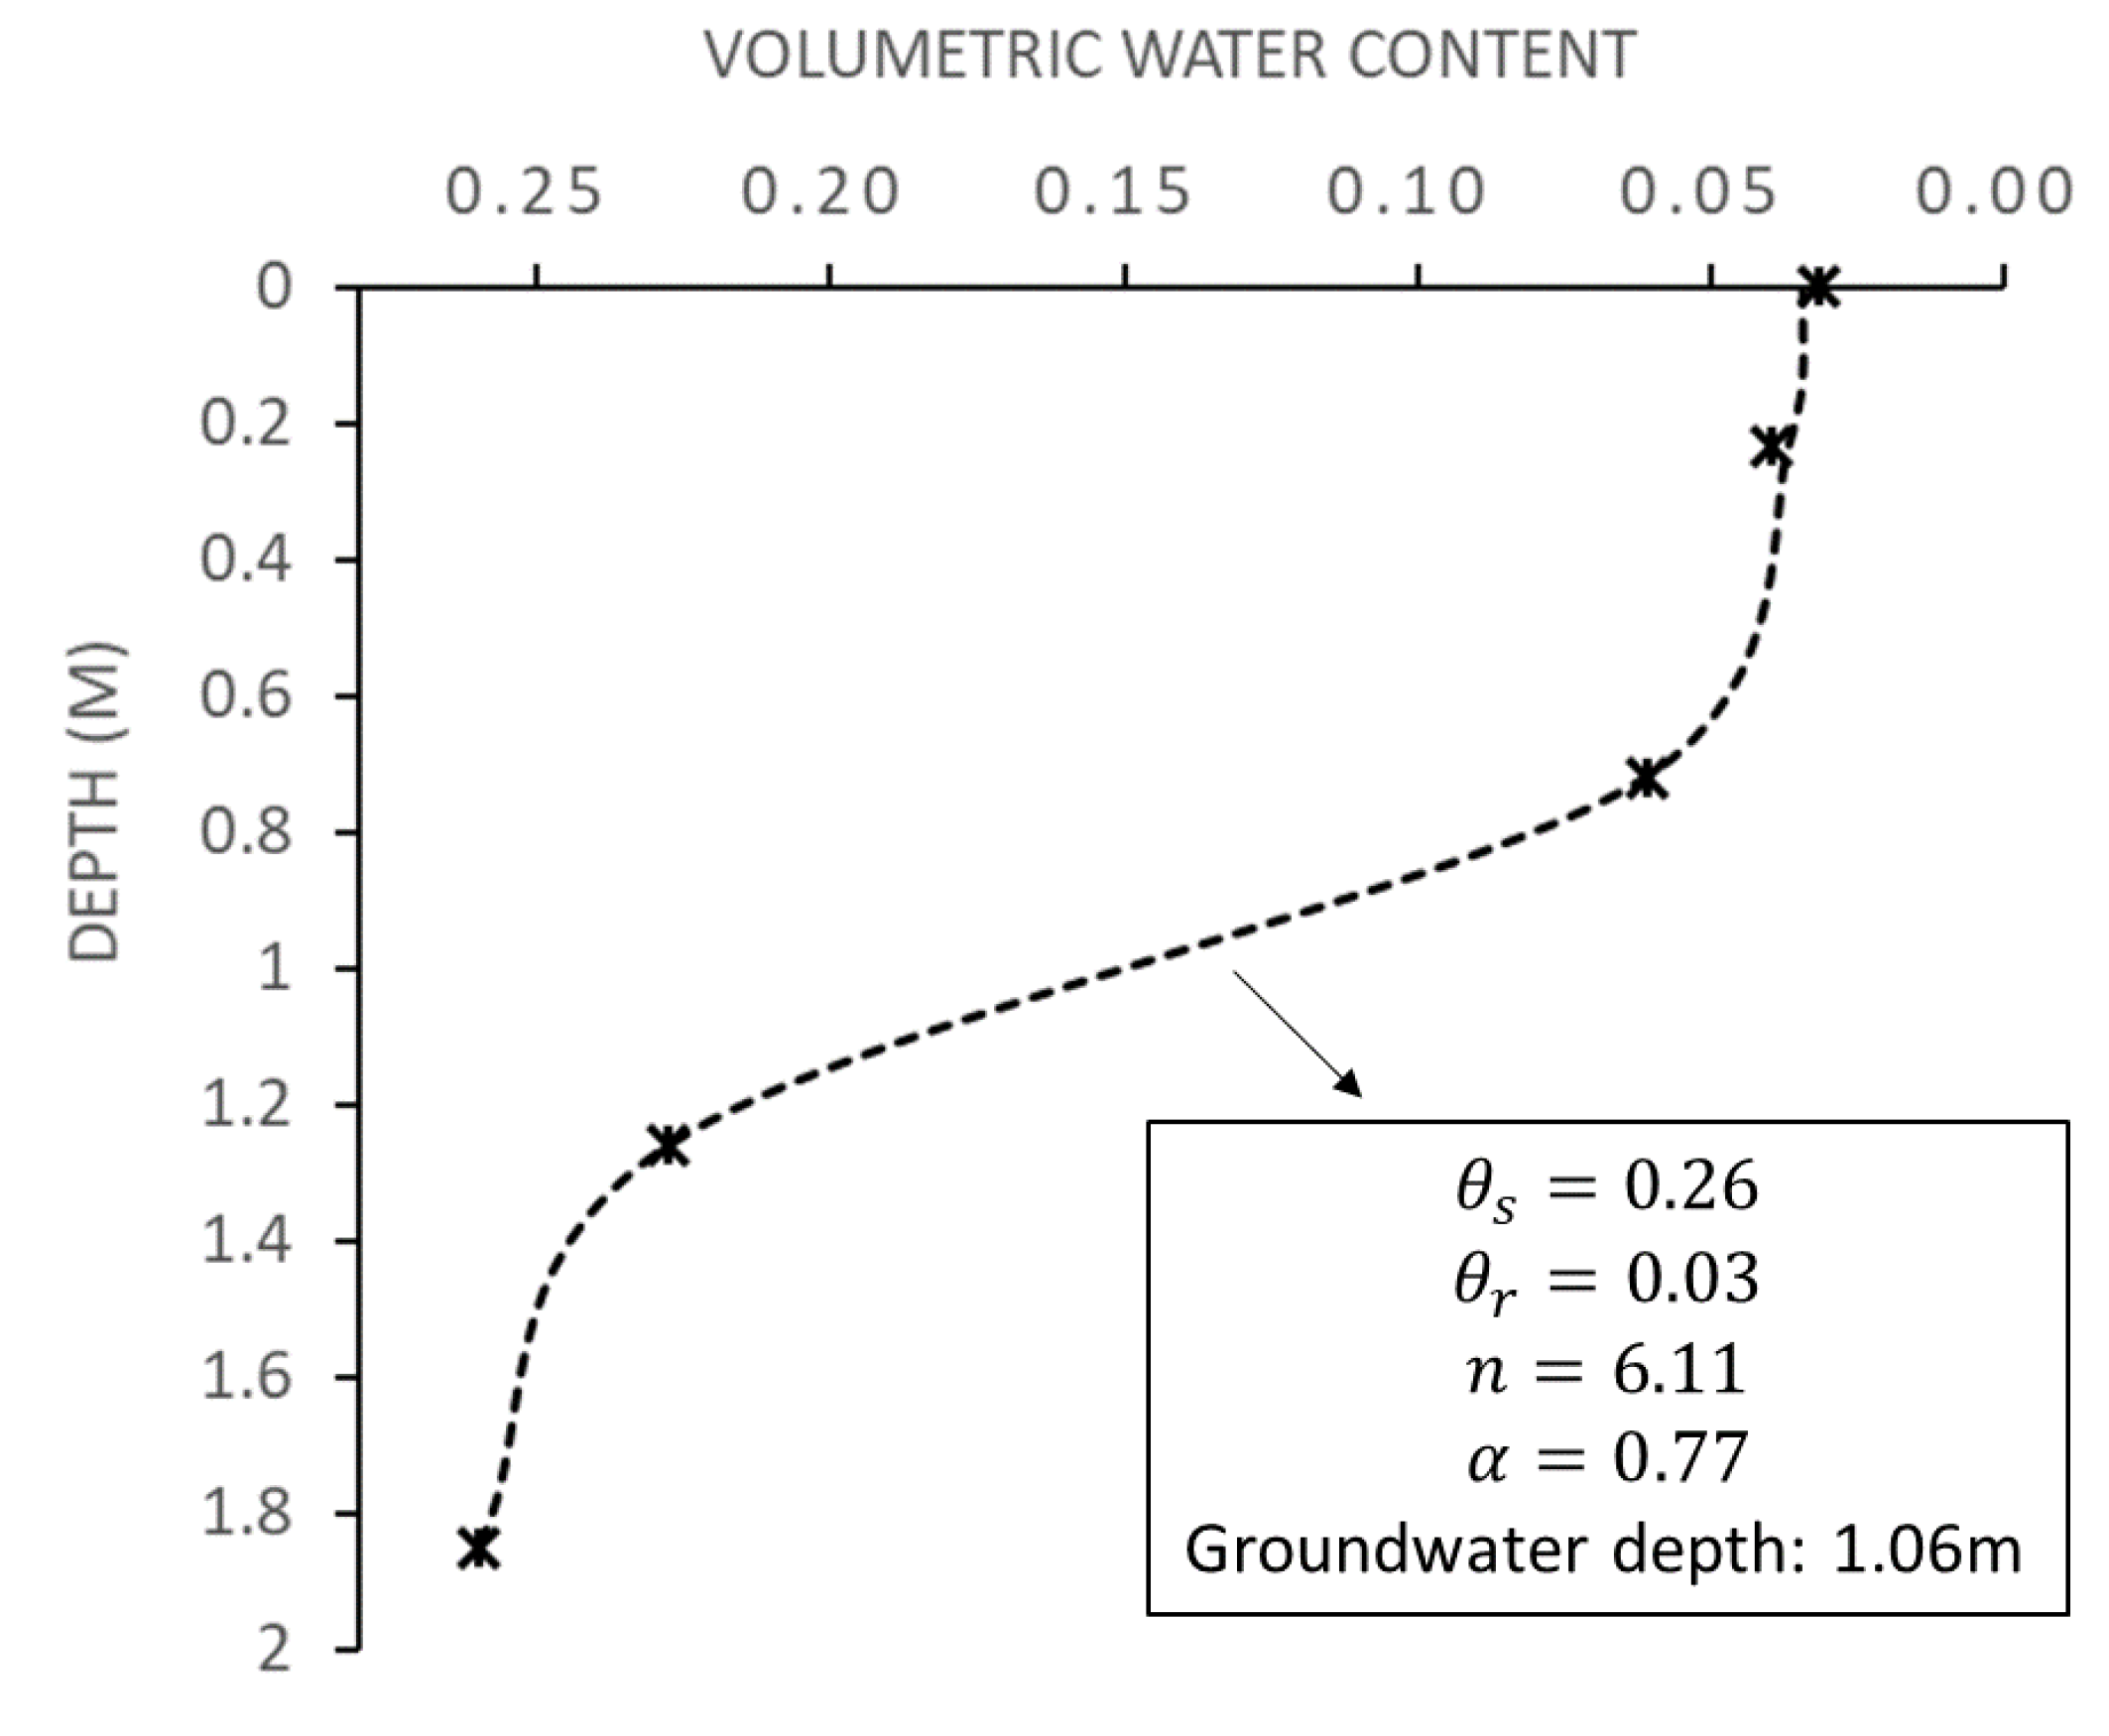
Figure 8 presents the estimated water content in the active layer above the permafrost in the monitoring well.
Further determination of hydraulic parameters and groundwater table within the Soil Water Characteristic Curve (SWCC) from the Van Genuchten model [
32] can be achieved utilizing the methodologies delineated by Lin
, et al. [
25] and [
26]. The Van Genuchten model can be described as:
where represents the normalized water content, α is related to the inverse of air entry value, Where is the residual water content, is the saturated water content, is the suction head, n is related to the pore size distribution of the soil, and m is associated with the asymmetry of the model, equals to the .
The parameters were derived through fitting the water content to the SWCC of Van Genuchten model, aiming to minimize the root mean square discrepancies between predicted and observed water content values. The measured water content was obtained through resistivity measurements. Therefore, we are able to estimate the depth of the groundwater table without using pressure sensor but estimate the depth of groundwater with the air-entry suction head
, and the depth where water content is in a saturated condition (
) as describe in Chang
, et al. [
33] and Puntu
, et al. [
26]:
where
is the groundwater depth;
is the depth of the saturated layer.
The estimate depth of the groundwater table for the position of temperature monitoring well on ST line is approximately 1.06 meters. This estimation closely aligns with the groundwater table measured in the S4 borehole (about 1.30 meters deep), given that the ground surface at the monitoring well is about 20 cm higher than that of S4.
5. Conclusions
In the study, we conducted electrical resistivity imaging (ERI) measurements near the Nicolaus Copernicus University Polar Station (NCUPS), located on the western coast of Spitsbergen in the Svalbard archipelago. Along the 148-meter-long LN survey line, approximately perpendicular to the coastline, we conducted ERI surveys in August of both 2022 and 2023. Additionally, we performed ERI surveys along the 40-meter-long ST line to compare measured resistivity with subsurface temperatures.
Overall, the LN resistivity profile in 2022 and 2023 exhibit a similar distribution pattern. However, the difference of the inverted resistivity images between 2022 and 2023 reveals a decrease in resistivity by about 600 Ohm-m in the unsaturated active layer, except for some regions rich in remaining ice. Considering the temperature increased by 5.8 with no significant precipitation variation in 2023 compared to 2022, we attribute the decreased resistivity to the temperature increase possibly caused by global climate change.
The ST line shows that the resistivity reaches its lowest point at a depth of approximately 1.6 meters, then increases to over 200 Ohm-m at around 4 meters, and slightly decreases to approximately 150 Ohm-m at a depth of 7 meters. Temperature measurements collected from the monitoring well along the ST line confirm the presence of permafrost at a depth of around 1.6 to 2 meters.
Additionally, we attempted to estimate the water content distribution and groundwater table in the ST line by using the Soil Water Characteristic Curve of Van Genuchten model. The results show that the estimated groundwater depth is located at about 1.06 meters deep, consistent with the measured groundwater table in the S4 borehole on the ST line.
Furthermore, this study presents a advance understanding of permafrost behavior in the Arctic and provides insight into the sensitivity of resistivity patterns to climate change, providing substantial information on subsurface dynamics in the region.
Author Contributions
Conceptualization, Ding-Jiun Lin, Ping-Yu Chang, Ying-Lon Chen and Chuen-Fa Ni; Data curation, Ding-Jiun Lin, Ping-Yu Chang, Jordi Mahardika Puntu, Chuen-Fa Ni, Kamil Czarnecki and Yu-Huan Chang; Formal analysis, Ding-Jiun Lin, Ping-Yu Chang, Ying-Lon Chen and Jordi Mahardika Puntu; Funding acquisition, Ping-Yu Chang, Chuen-Fa Ni and Giletycz Jack Slawomir; Investigation, Ding-Jiun Lin, Ping-Yu Chang, Ying-Lon Chen, Chuen-Fa Ni, Giletycz Jack Slawomir, Kamil Czarnecki and Yu-Huan Chang; Methodology, Ding-Jiun Lin, Ping-Yu Chang, Ying-Lon Chen and Jordi Mahardika Puntu; Project administration, Ping-Yu Chang, Chuen-Fa Ni, Giletycz Jack Slawomir and Ireneusz Sobota; Resources, Ping-Yu Chang, Chuen-Fa Ni, Giletycz Jack Slawomir and Ireneusz Sobota; Visualization, Ding-Jiun Lin, Ying-Lon Chen, Jordi Mahardika Puntu and Giletycz Jack Slawomir; Writing – original draft, Ding-Jiun Lin and Ping-Yu Chang; Writing – review & editing, Ding-Jiun Lin, Ping-Yu Chang, Giletycz Jack Slawomir and Ireneusz Sobota.
Funding
This research supported by the National Academy of Marine Research, Taiwan, Ministry of Foreign Affairs, R.O.C. (Taiwan) and National Central University, Taiwan.
Data Availability Statement
The datasets used and/or analyzed during the current study are available from the corresponding author on reasonable request.
Acknowledgments
The author thanks the Ministry of Foreign Affairs, Taiwan, National Central University (NCU), and the National Academy of Marine Research (NAMR), Taiwan for founding the research. The author also thank the Nicholas Copernicus University Polar Station and the Taiwan Polar Institute for supporting the in-situ survey and monitoring.
Conflicts of Interest
The authors declare no conflicts of interest.
References
- ACGR. Glossary of permafrost and related ground-ice terms; Technical Memorandum No. 142; Associate Committee on Geotechnical Research, Permafrost Subcommittee, National Research Council of Canada: 1988; p. 155.
- Rossi, M.; Dal Cin, M.; Picotti, S.; Gei, D.; Isaev, V.S.; Pogorelov, A.V.; Gorshkov, E.I.; Sergeev, D.O.; Kotov, P.I.; Giorgi, M.; et al. Active Layer and Permafrost Investigations Using Geophysical and Geocryological Methods—A Case Study of the Khanovey Area, Near Vorkuta, in the NE European Russian Arctic. Frontiers in Earth Science 2022, 10. [Google Scholar] [CrossRef]
- Zhang, T.; Barry, R.; Knowles, K.; Heginbottom, J.; Brown, J. Statistics and characteristics of permafrost and ground-ice distribution in the Northern Hemisphere. Polar Geography 2008, 31, 47–68. [Google Scholar] [CrossRef]
- Gruber, S. Derivation and analysis of a high-resolution estimate of global permafrost zonation. The Cryosphere 2012, 6, 221–233. [Google Scholar] [CrossRef]
- Wang, C.; Wang, Z.; Kong, Y.; Zhang, F.; Yang, K.; Zhang, T. Most of the northern hemisphere permafrost remains under climate change. Scientific reports 2019, 9, 3295. [Google Scholar] [CrossRef]
- Harris, S.A.; Brouchkov, A.; Guodong, C. Geocryology: characteristics and use of frozen ground and permafrost landforms; CRC press: 2017.
- IPCC. Meeting report of the intergovernmental panel on climate change expert meeting on mitigation, sustainability and climate stabilization scenarios. 2017.
- Biskaborn, B.K.; Smith, S.L.; Noetzli, J.; Matthes, H.; Vieira, G.; Streletskiy, D.A.; Schoeneich, P.; Romanovsky, V.E.; Lewkowicz, A.G.; Abramov, A. Permafrost is warming at a global scale. Nature communications 2019, 10, 264. [Google Scholar] [CrossRef]
- NSIDC. Advancing Knowledge of Earth’s Frozen Regions. Cryosphere Glossary. Available online: https://nsidc.
- Chen, T.; Ma, W.; Wu, Z.-J.; Mu, Y.-h. Characteristics of dynamic response of the active layer beneath embankment in permafrost regions along the Qinghai–Tibet Railroad. Cold regions science and technology 2014, 98, 1–7. [Google Scholar] [CrossRef]
- Isaksen, K.; Sollid, J.L.; Holmlund, P.; Harris, C. Recent warming of mountain permafrost in Svalbard and Scandinavia. Journal of Geophysical Research: Earth Surface 2007, 112. [Google Scholar] [CrossRef]
- Sobota, I.; Nowak, M. Changes in the dynamics and thermal regime of the permafrost and active layer of the high arctic coastal area in north-west spitsbergen, svalbard. Geografiska Annaler: Series A, Physical Geography 2014, 96, 227–240. [Google Scholar] [CrossRef]
- Sobota, I.; Weckwerth, P.; Grajewski, T.; Dziembowski, M.; Greń, K.; Nowak, M. Short-term changes in thickness and temperature of the active layer in summer in the Kaffiøyra region, NW Spitsbergen, Svalbard. Catena 2018, 160, 141–153. [Google Scholar] [CrossRef]
- Keating, K.; Binley, A.; Bense, V.; Van Dam, R.L.; Christiansen, H.H. Combined geophysical measurements provide evidence for unfrozen water in permafrost in the Adventdalen valley in Svalbard. Geophysical Research Letters 2018, 45, 7606–7614. [Google Scholar] [CrossRef]
- Rouyet, L.; Lauknes, T.R.; Christiansen, H.H.; Strand, S.M.; Larsen, Y. Seasonal dynamics of a permafrost landscape, Adventdalen, Svalbard, investigated by InSAR. Remote Sensing of Environment 2019, 231, 111236. [Google Scholar] [CrossRef]
- Hinkel, K.; Doolittle, J.; Bockheim, J.; Nelson, F.; Paetzold, R.; Kimble, J.M.; Travis, R. Detection of subsurface permafrost features with ground-penetrating radar, Barrow, Alaska. Permafrost and Periglacial processes 2001, 12, 179–190. [Google Scholar] [CrossRef]
- Kim, K.; Lee, J.; Ju, H.; Jung, J.Y.; Chae, N.; Chi, J.; Kwon, M.J.; Lee, B.Y.; Wagner, J.; Kim, J.-S. Time-lapse electrical resistivity tomography and ground penetrating radar mapping of the active layer of permafrost across a snow fence in Cambridge Bay, Nunavut Territory, Canada: Correlation interpretation using vegetation and meteorological data. Geosciences Journal 2021, 25, 877–890. [Google Scholar] [CrossRef]
- Forte, E.; French, H.M.; Raffi, R.; Santin, I.; Guglielmin, M. Investigations of polygonal patterned ground in continuous Antarctic permafrost by means of ground penetrating radar and electrical resistivity tomography: Some unexpected correlations. Permafrost and Periglacial Processes 2022, 33, 226–240. [Google Scholar] [CrossRef]
- Sobota, I.; Nowak, M.; Weckwerth, P. Long-term changes of glaciers in north-western Spitsbergen. Global and Planetary Change 2016, 144, 182–197. [Google Scholar] [CrossRef]
- Sobota, I. Współczesne zmiany kriosfery północno-zachodniego Spitsbergenu na przykładzie regionu Kaffiøyry; Wydawnictwo Naukowe Uniwersytetu Mikołaja Kopernika: 2013.
- Schuler, T.V.; Kohler, J.; Elagina, N.; Hagen, J.O.M.; Hodson, A.J.; Jania, J.A.; Kääb, A.M.; Luks, B.; Małecki, J.; Moholdt, G. Reconciling Svalbard glacier mass balance. Frontiers in Earth Science 2020, 8, 523648. [Google Scholar] [CrossRef]
- Kejna, M.; Sobota, I. Meteorological conditions on Kaffiøyra (NW Spitsbergen) in 2013–2017 and their connection with atmospheric circulation and sea ice extent. Polish Polar Research 2019, 40, 175–204. [Google Scholar] [CrossRef]
- Lippmann, E. 4-point light hp technical data and operating instructions, ver. 3.37. Geophysikalische Messgerate, Schaufling, Germany 2005, 28.
- Dahlin, T.; Zhou, B. A numerical comparison of 2D resistivity imaging with 10 electrode arrays. Geophys. Prospect. 2004, 52, 379–398. [Google Scholar] [CrossRef]
- Lin, D.-J.; Chang, P.-Y.; Puntu, J.M.; Doyoro, Y.G.; Amania, H.H.; Chang, L.-C. Estimating the specific yield and groundwater level of an unconfined aquifer using time-lapse electrical resistivity imaging in the pingtung plain, Taiwan. Water 2023, 15, 1184. [Google Scholar] [CrossRef]
- Puntu, J.M.; Chang, P.-Y.; Amania, H.H.; Lin, D.-J.; Sung, C.-Y.; Suryantara, M.; Chang, L.-C.; Doyoro, Y.G. Groundwater monitoring and specific yield estimation using time-lapse electrical resistivity imaging and machine learning. Frontiers in Environmental Science 2023. [Google Scholar] [CrossRef]
- AGI. Instruction Manual for EarthImager 2D 2.3.0. 2006, 62.
- Yang, X.; Lagmanson, M.B. Planning resistivity surveys using numerical simulations. In Proceedings of the 16th EEGS Symposium on the Application of Geophysics to Engineering and Environmental Problems, 2003; pp. cp–190-00047. [Google Scholar]
- Sharma, S.; Verma, G.K. Inversion of electrical resistivity data: a review. International Journal of Computer and Systems Engineering 2015, 9, 400–406. [Google Scholar]
- Archie, G.E. The electrical resistivity log as an aid in determining some reservoir characteristics. Transactions of the AIME 1942, 146, 54–62. [Google Scholar] [CrossRef]
- Keller, G.V.; Frischknecht, F.C. Electrical Methods in Geophysical Prospecting; Pergamon: Oxford, U.K., 1966.
- Van Genuchten, M.T. A closed-form equation for predicting the hydraulic conductivity of unsaturated soils. Soil Sci Soc Am J 1980, 44, 892–898. [Google Scholar] [CrossRef]
- Chang, P.-Y.; Puntu, J.M.; Lin, D.-J.; Yao, H.-J.; Chang, L.-C.; Chen, K.-H.; Lu, W.-J.; Lai, T.-H.; Doyoro, Y.G. Using Time-Lapse Resistivity Imaging Methods to Quantitatively Evaluate the Potential of Groundwater Reservoirs. Water 2022, 14, 420. [Google Scholar] [CrossRef]
|
Disclaimer/Publisher’s Note: The statements, opinions and data contained in all publications are solely those of the individual author(s) and contributor(s) and not of MDPI and/or the editor(s). MDPI and/or the editor(s) disclaim responsibility for any injury to people or property resulting from any ideas, methods, instructions or products referred to in the content. |
© 2024 by the authors. Licensee MDPI, Basel, Switzerland. This article is an open access article distributed under the terms and conditions of the Creative Commons Attribution (CC BY) license (http://creativecommons.org/licenses/by/4.0/).
