Submitted:
03 August 2024
Posted:
08 August 2024
You are already at the latest version
Abstract
Keywords:
1. Introduction
1.1. Background and Motivation
1.2. Problem Statement and Research Question
1.3. Paper’s Significance and Contribution
2. Theoretical Foundation And Sybil Attack Landscape
2.1. Sybil Attacks: Concepts, Core Characteristics, Varieties, and Impact on Network Integrity
2.2. Targeted Networks and Vulnerabilities
2.3. Unleashing Defense Strategies: Safeguarding Against Sybil Attacks
2.4. Sybil Detection Algorithms
3. Methodology: Proposed SybilSocNet Algorithm
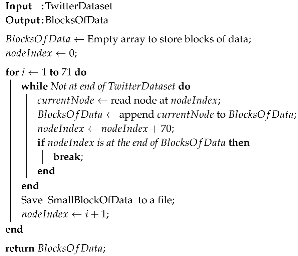
| Algorithm 1:Pseudocode For Splitting The Data. |
 |
3.1. Applied ML Terminologies And Methodologies By This Study
3.1.1. Machine Learning
3.1.2. Supervised Learning
3.1.3. Support Vector Machine Algorithm (SVM)
- Data Prep: As SVM is supervised, labeled data gets deployed for training. Instances must be associated with specific classes where data collection takes various routes like downloading datasets from platforms like Kaggle [60] or customizing existing ones.
- Feature Scaling: SVM gives weight to features based on values where scaling ensures fairness among features. While some features hold more magnitude, maintaining equitable treatment prevents bias. Scaling methods like standardization and normalization are often employed.
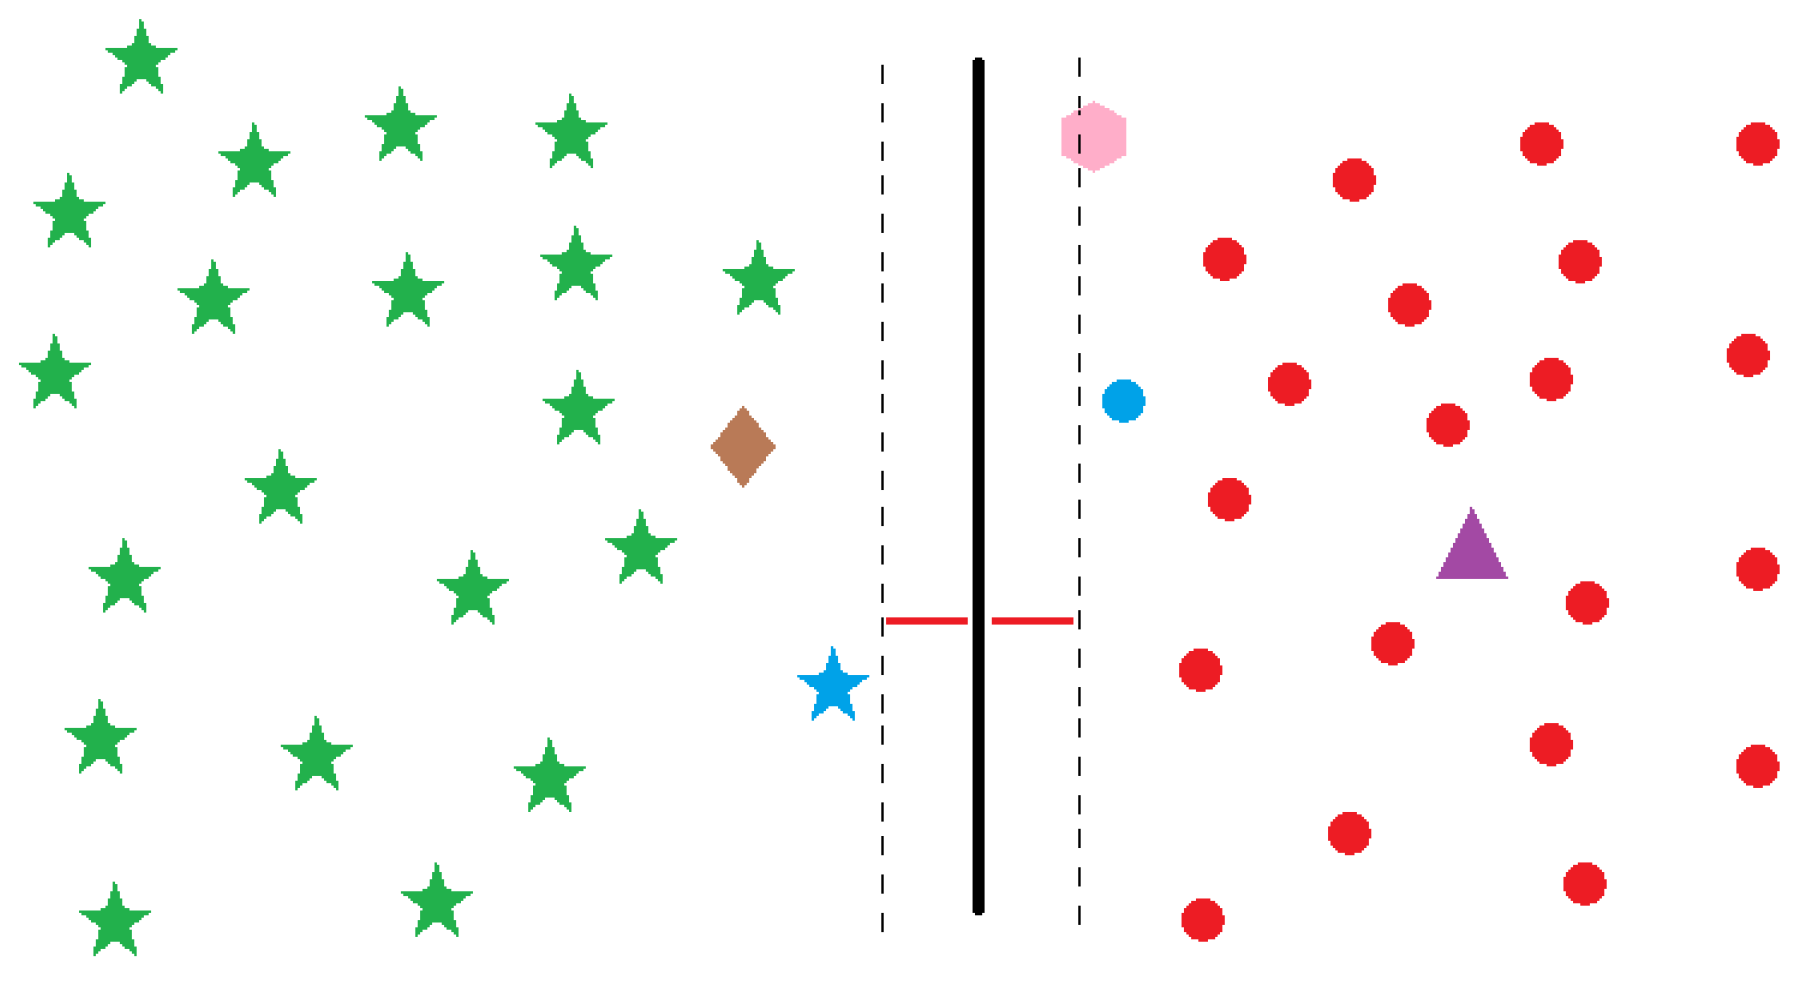
- Kernel Selection: SVM utilizes the kernel trick, mapping data to higher dimensions for easier classification. Kernels are of various types, suited to different data and applications. Optimal kernel choice impacts computational efficiency.
- Training and Optimization: occurs where after the kernel gets selected, training involves determining the hyperplane position. This necessitates solving an optimization problem, minimizing the cost function while considering margin and regularization factors. Different algorithms, e.g., SMO and Quadratic Programming can get deployed.
- Testing: SVM can handle classification and regression. In classification, algorithm predictions are compared to known instances. For regression, SVM predicts values based on the point’s distance from the hyperplane.
3.1.4. Random Forest Algorithm
- Dataset preparation: like prior algorithms requires labeled data for training with dataset consists of features linked to corresponding classes, e.g., car quality correlates with attributes like make, model, and price.
- Decision tree: creation and grouping of it via a central tree consisting of smaller decision trees that predict outcomes via dataset’s distinct portions without all features getting related to target outputs to form a diverse set of trees, akin to people uniquely solving problems. The ensemble voting aggregates their solutions to determine the final prediction.
- Trees’ feature selection: Different randomly chosen features get assigned to each tree, to curb overfitting.
- Bootstrapping: this involves newly created dataset’s data samples, generating variations for each tree to avoid uniformity. Bootstrapping introduces randomness, yielding a diverse array of perspectives on the problem, crucial to preventing overfitting (Figure 6).
- Output Prediction: where the algorithm predicts output, either class for classification or value for regression. All decision trees contribute predictions, and a voting mechanism selects the majority class for classification or the average output for regression.
4. Data Analysis
4.1. Steps, Results, and Validation
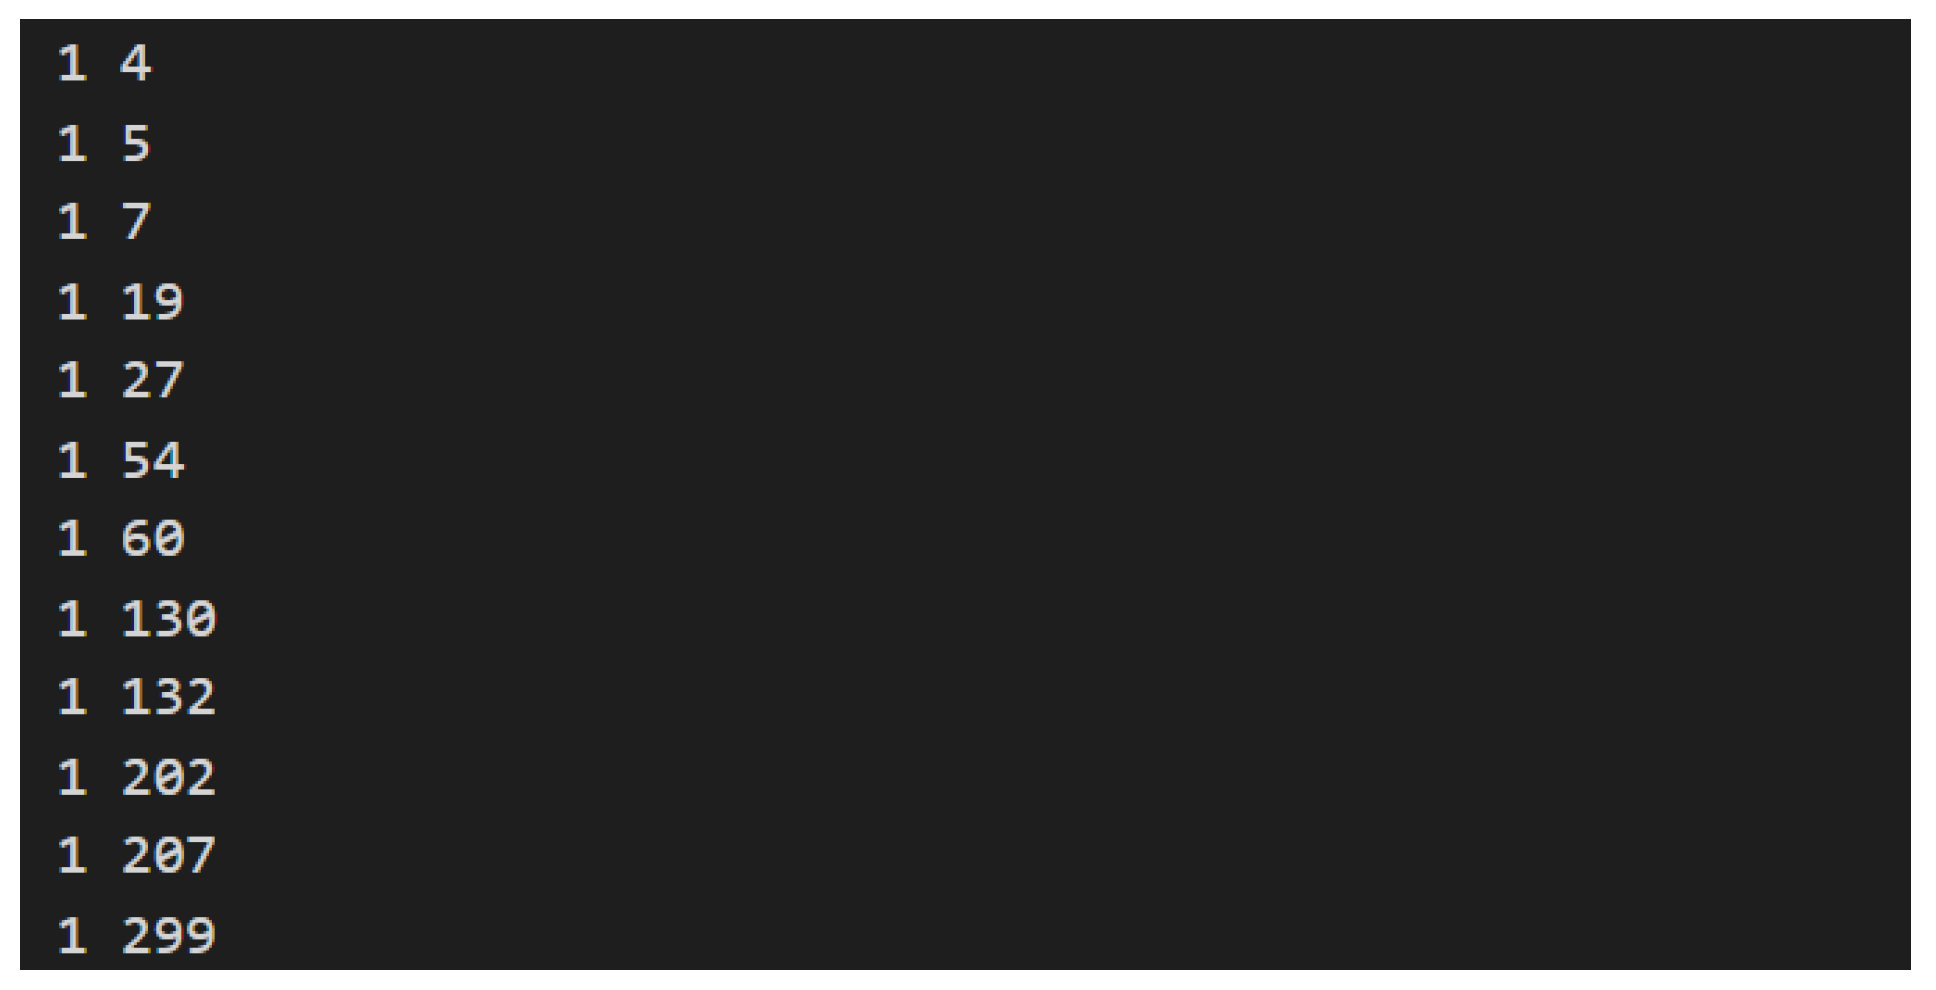
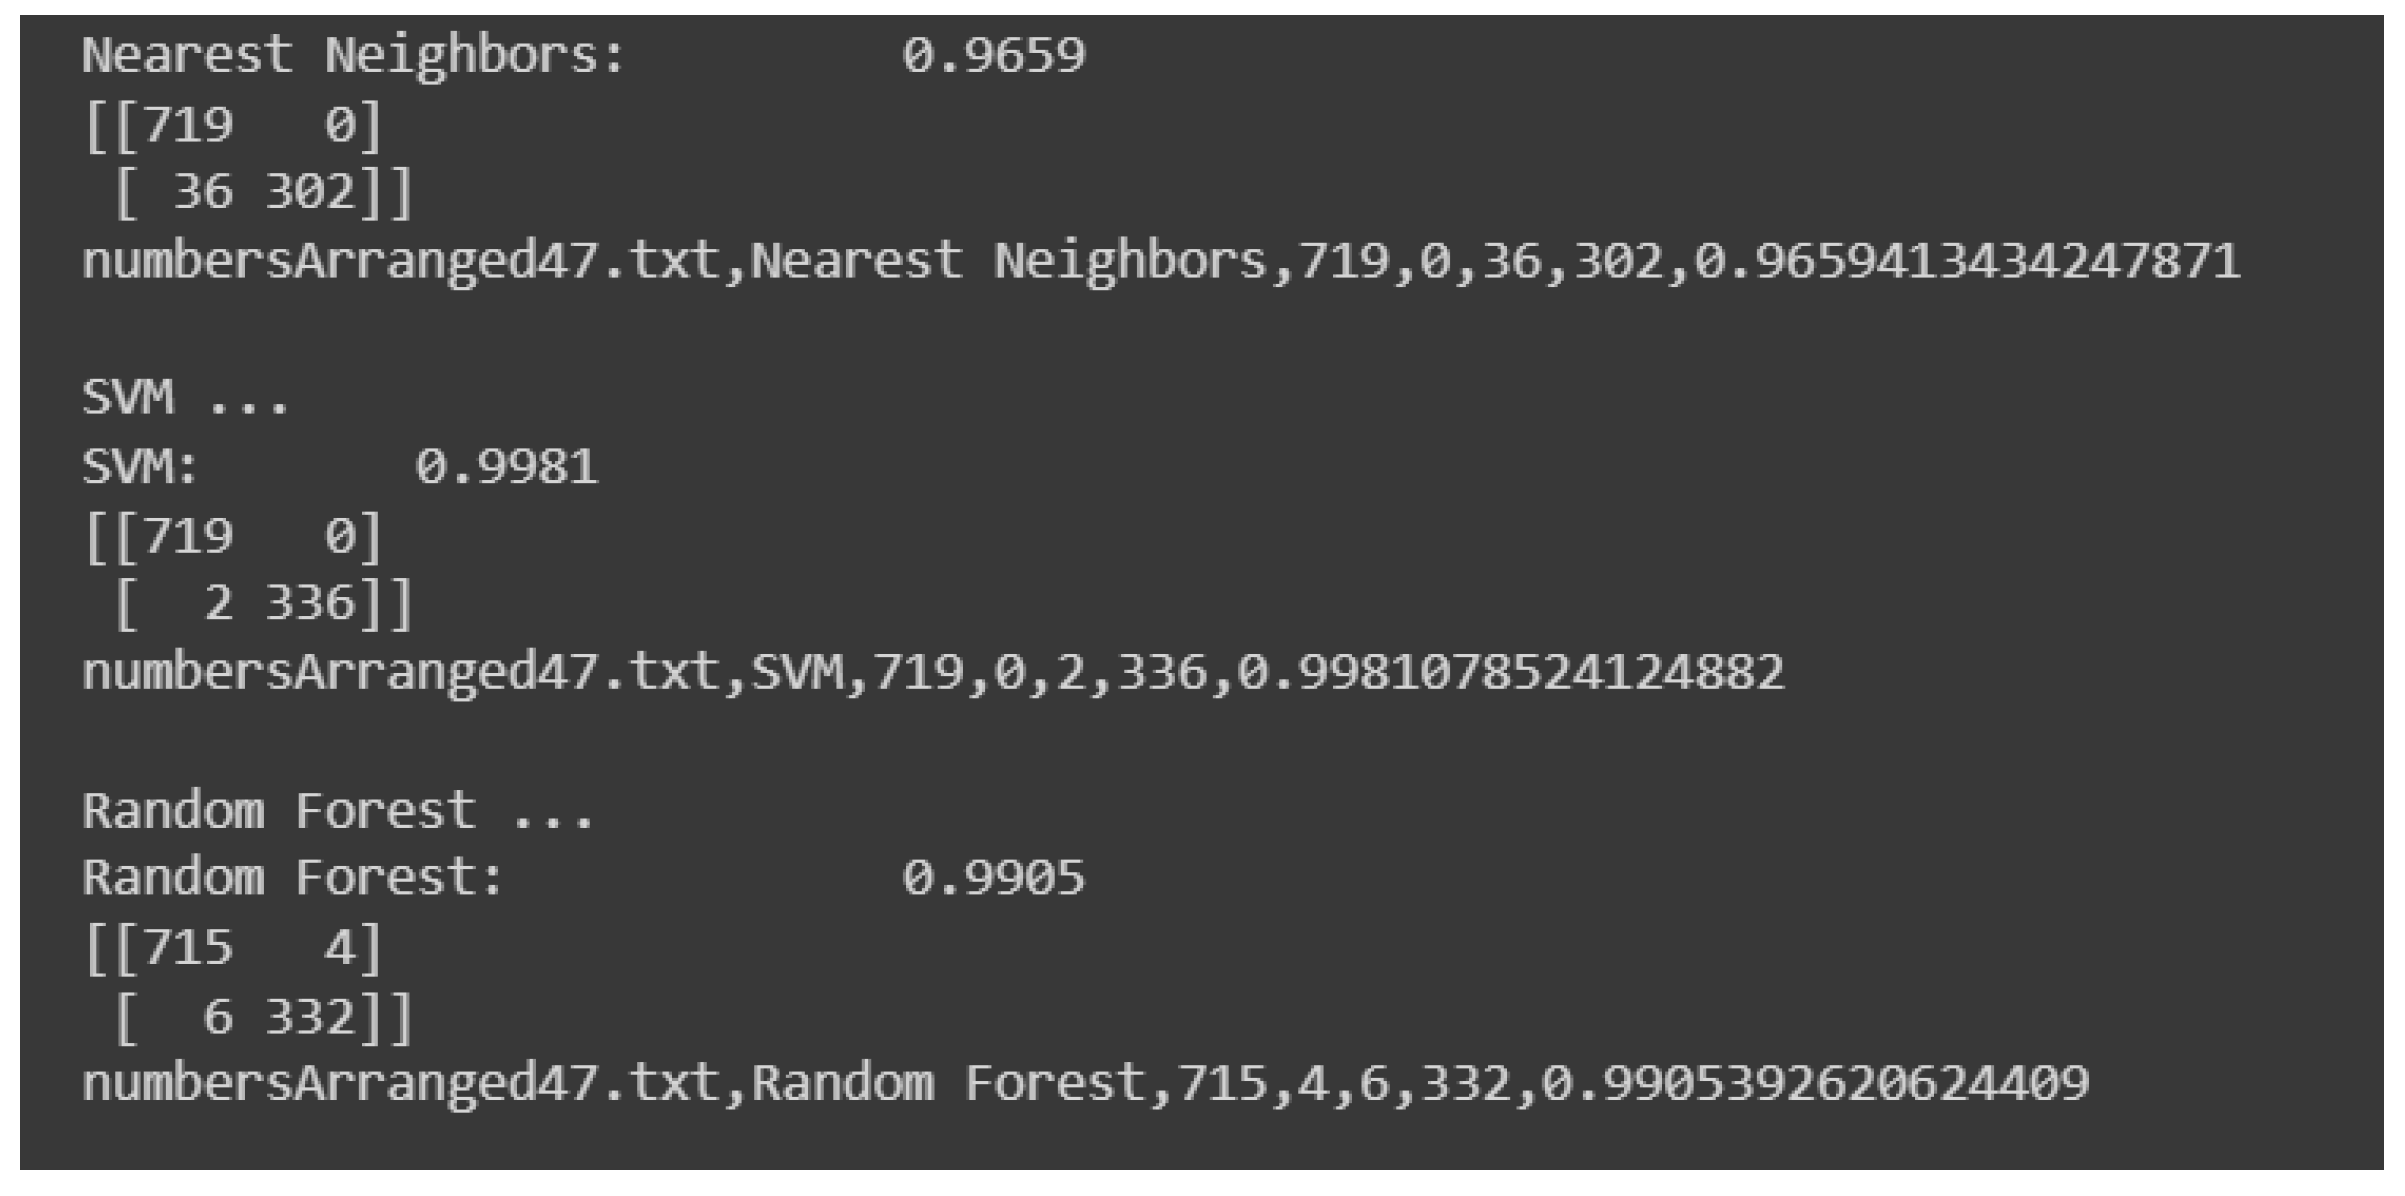
- Element I00 : indicates true positives for non-Sybil instances, a value representing legit nodes correctly detected by the algorithm as such.
- Element I01 : represents false positives for Sybil instances, signifying nodes falsely labeled as Sybil by the algorithm. Ideally, this value is minimal or zero, preventing the mislabeling of legit nodes as Sybil.
- Element I10 : reflects undetected Sybil nodes by the algorithm while the general aim was to keep this count minimum to ensure Sybil detection.
- Element I11 : stands for Sybil instances’ true positives, indicating correctly identified Sybil nodes.
4.2. Data Overview
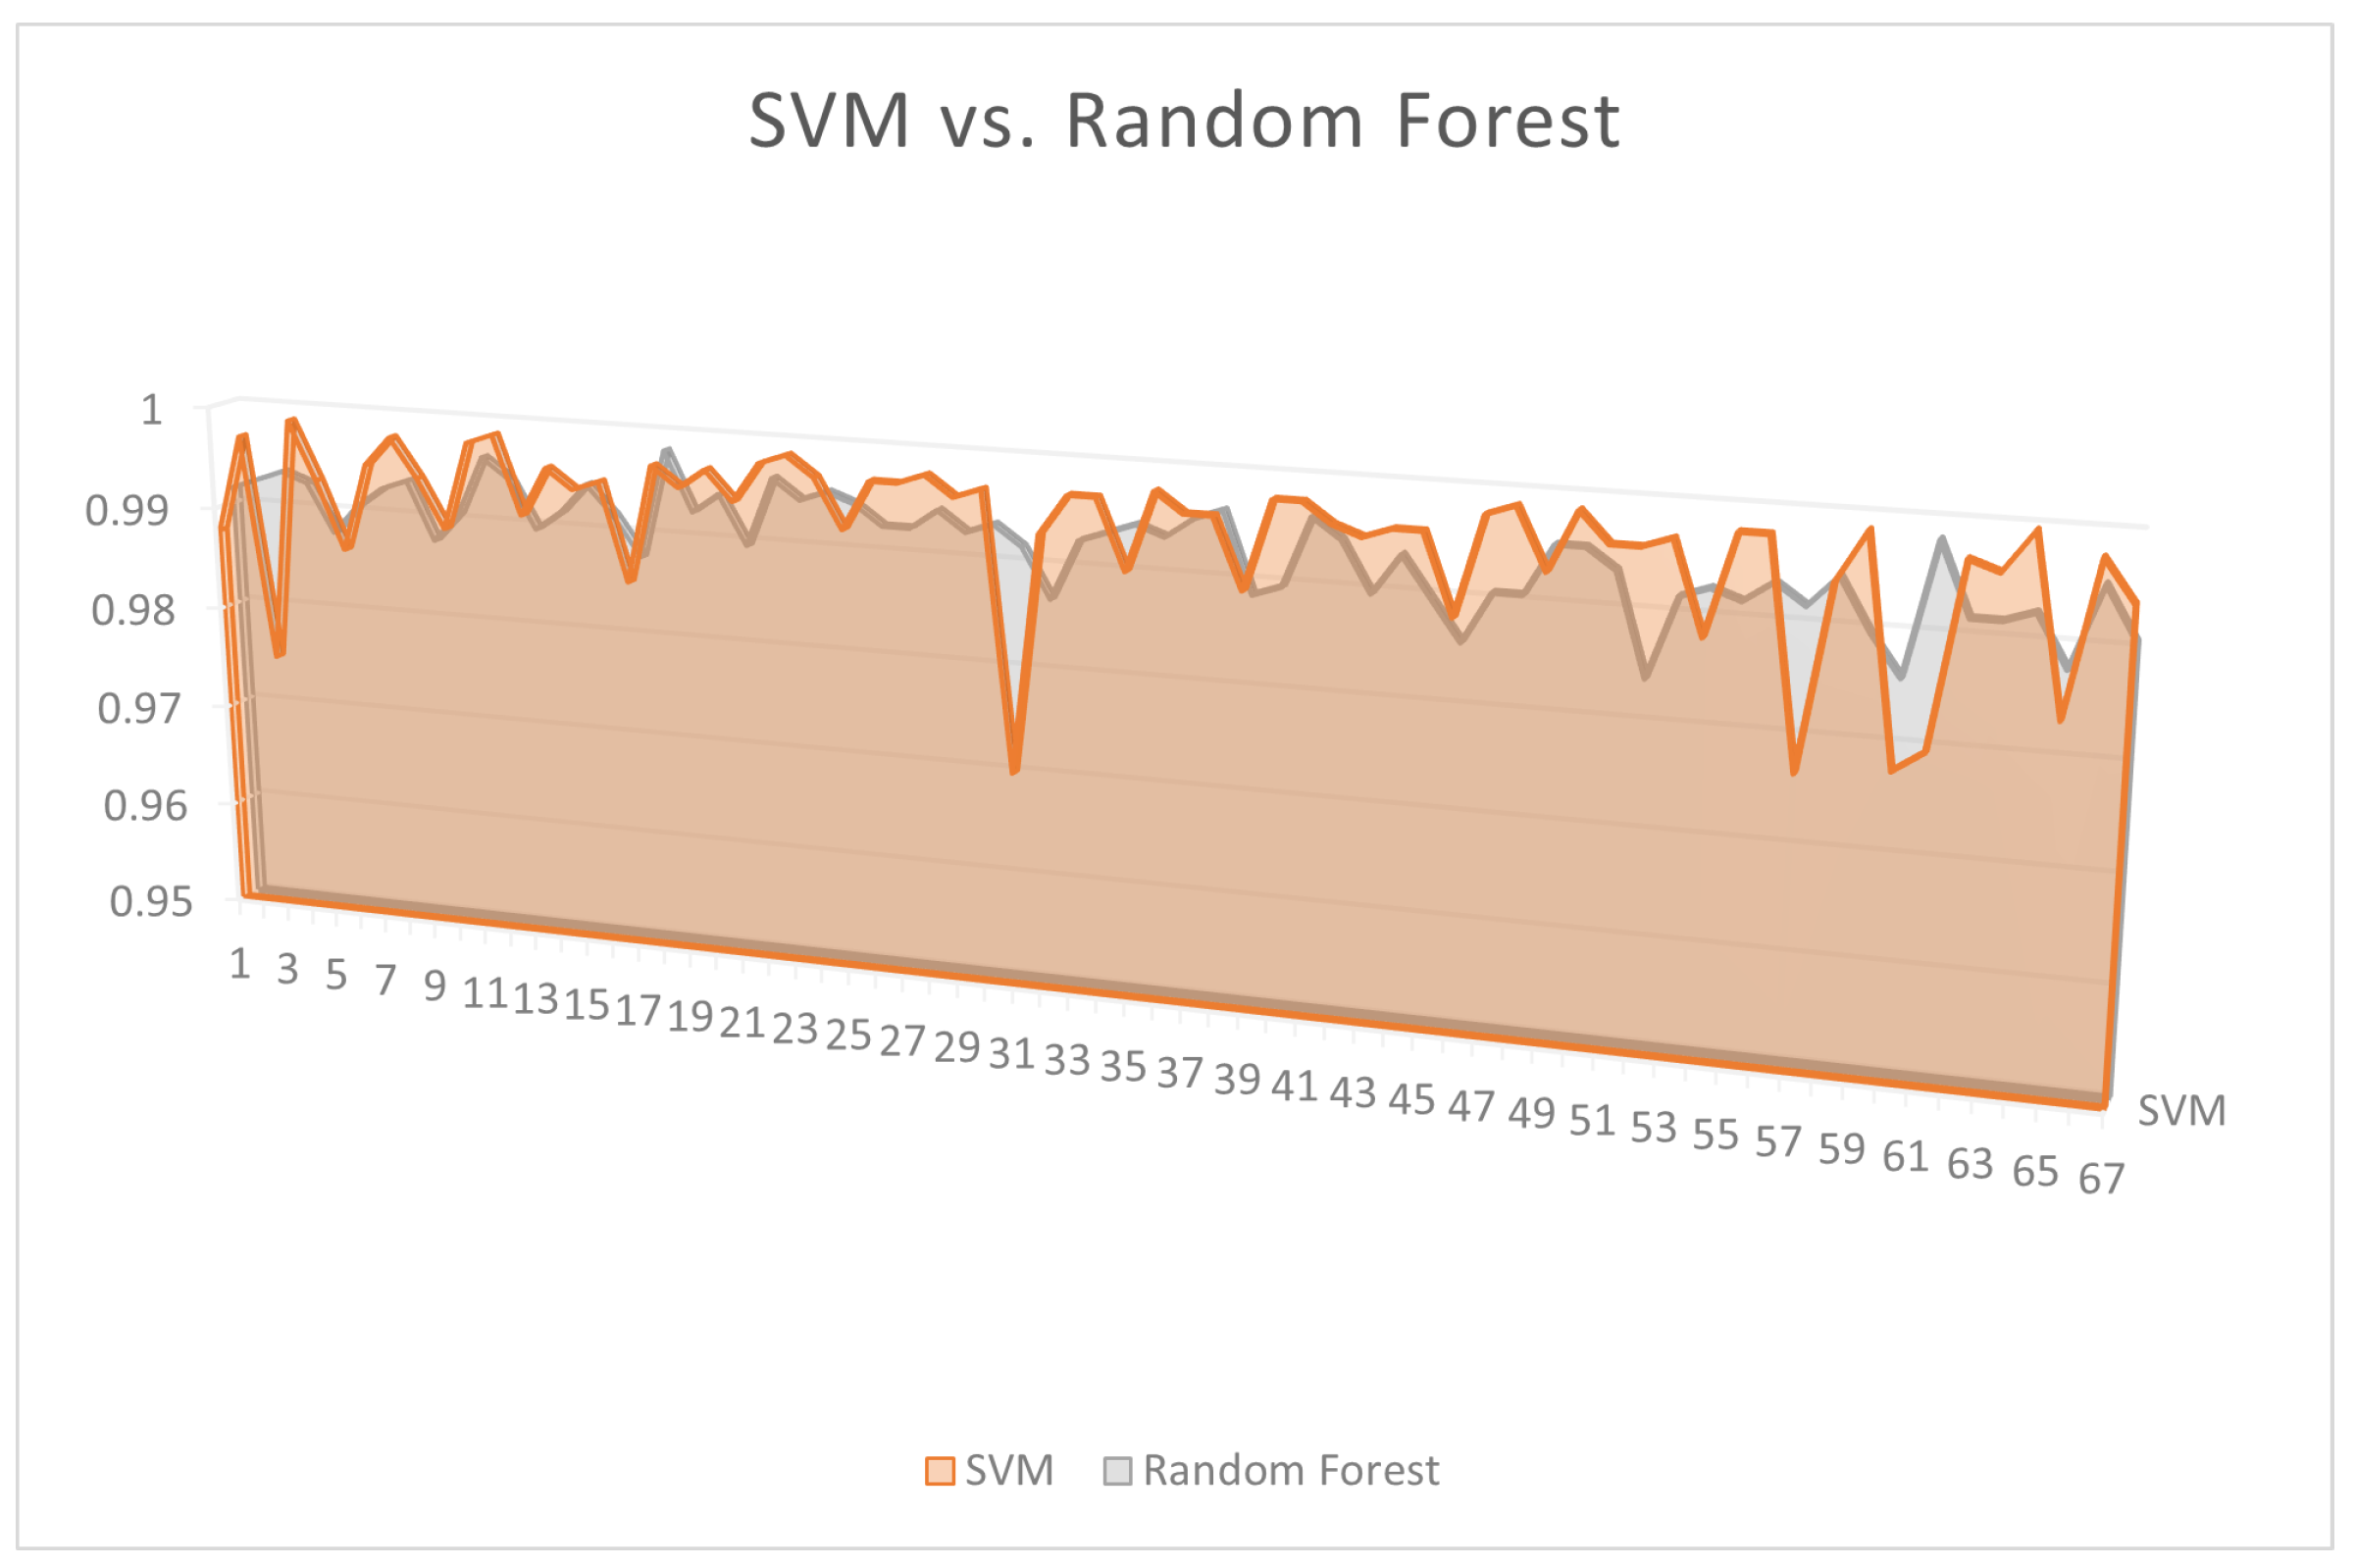
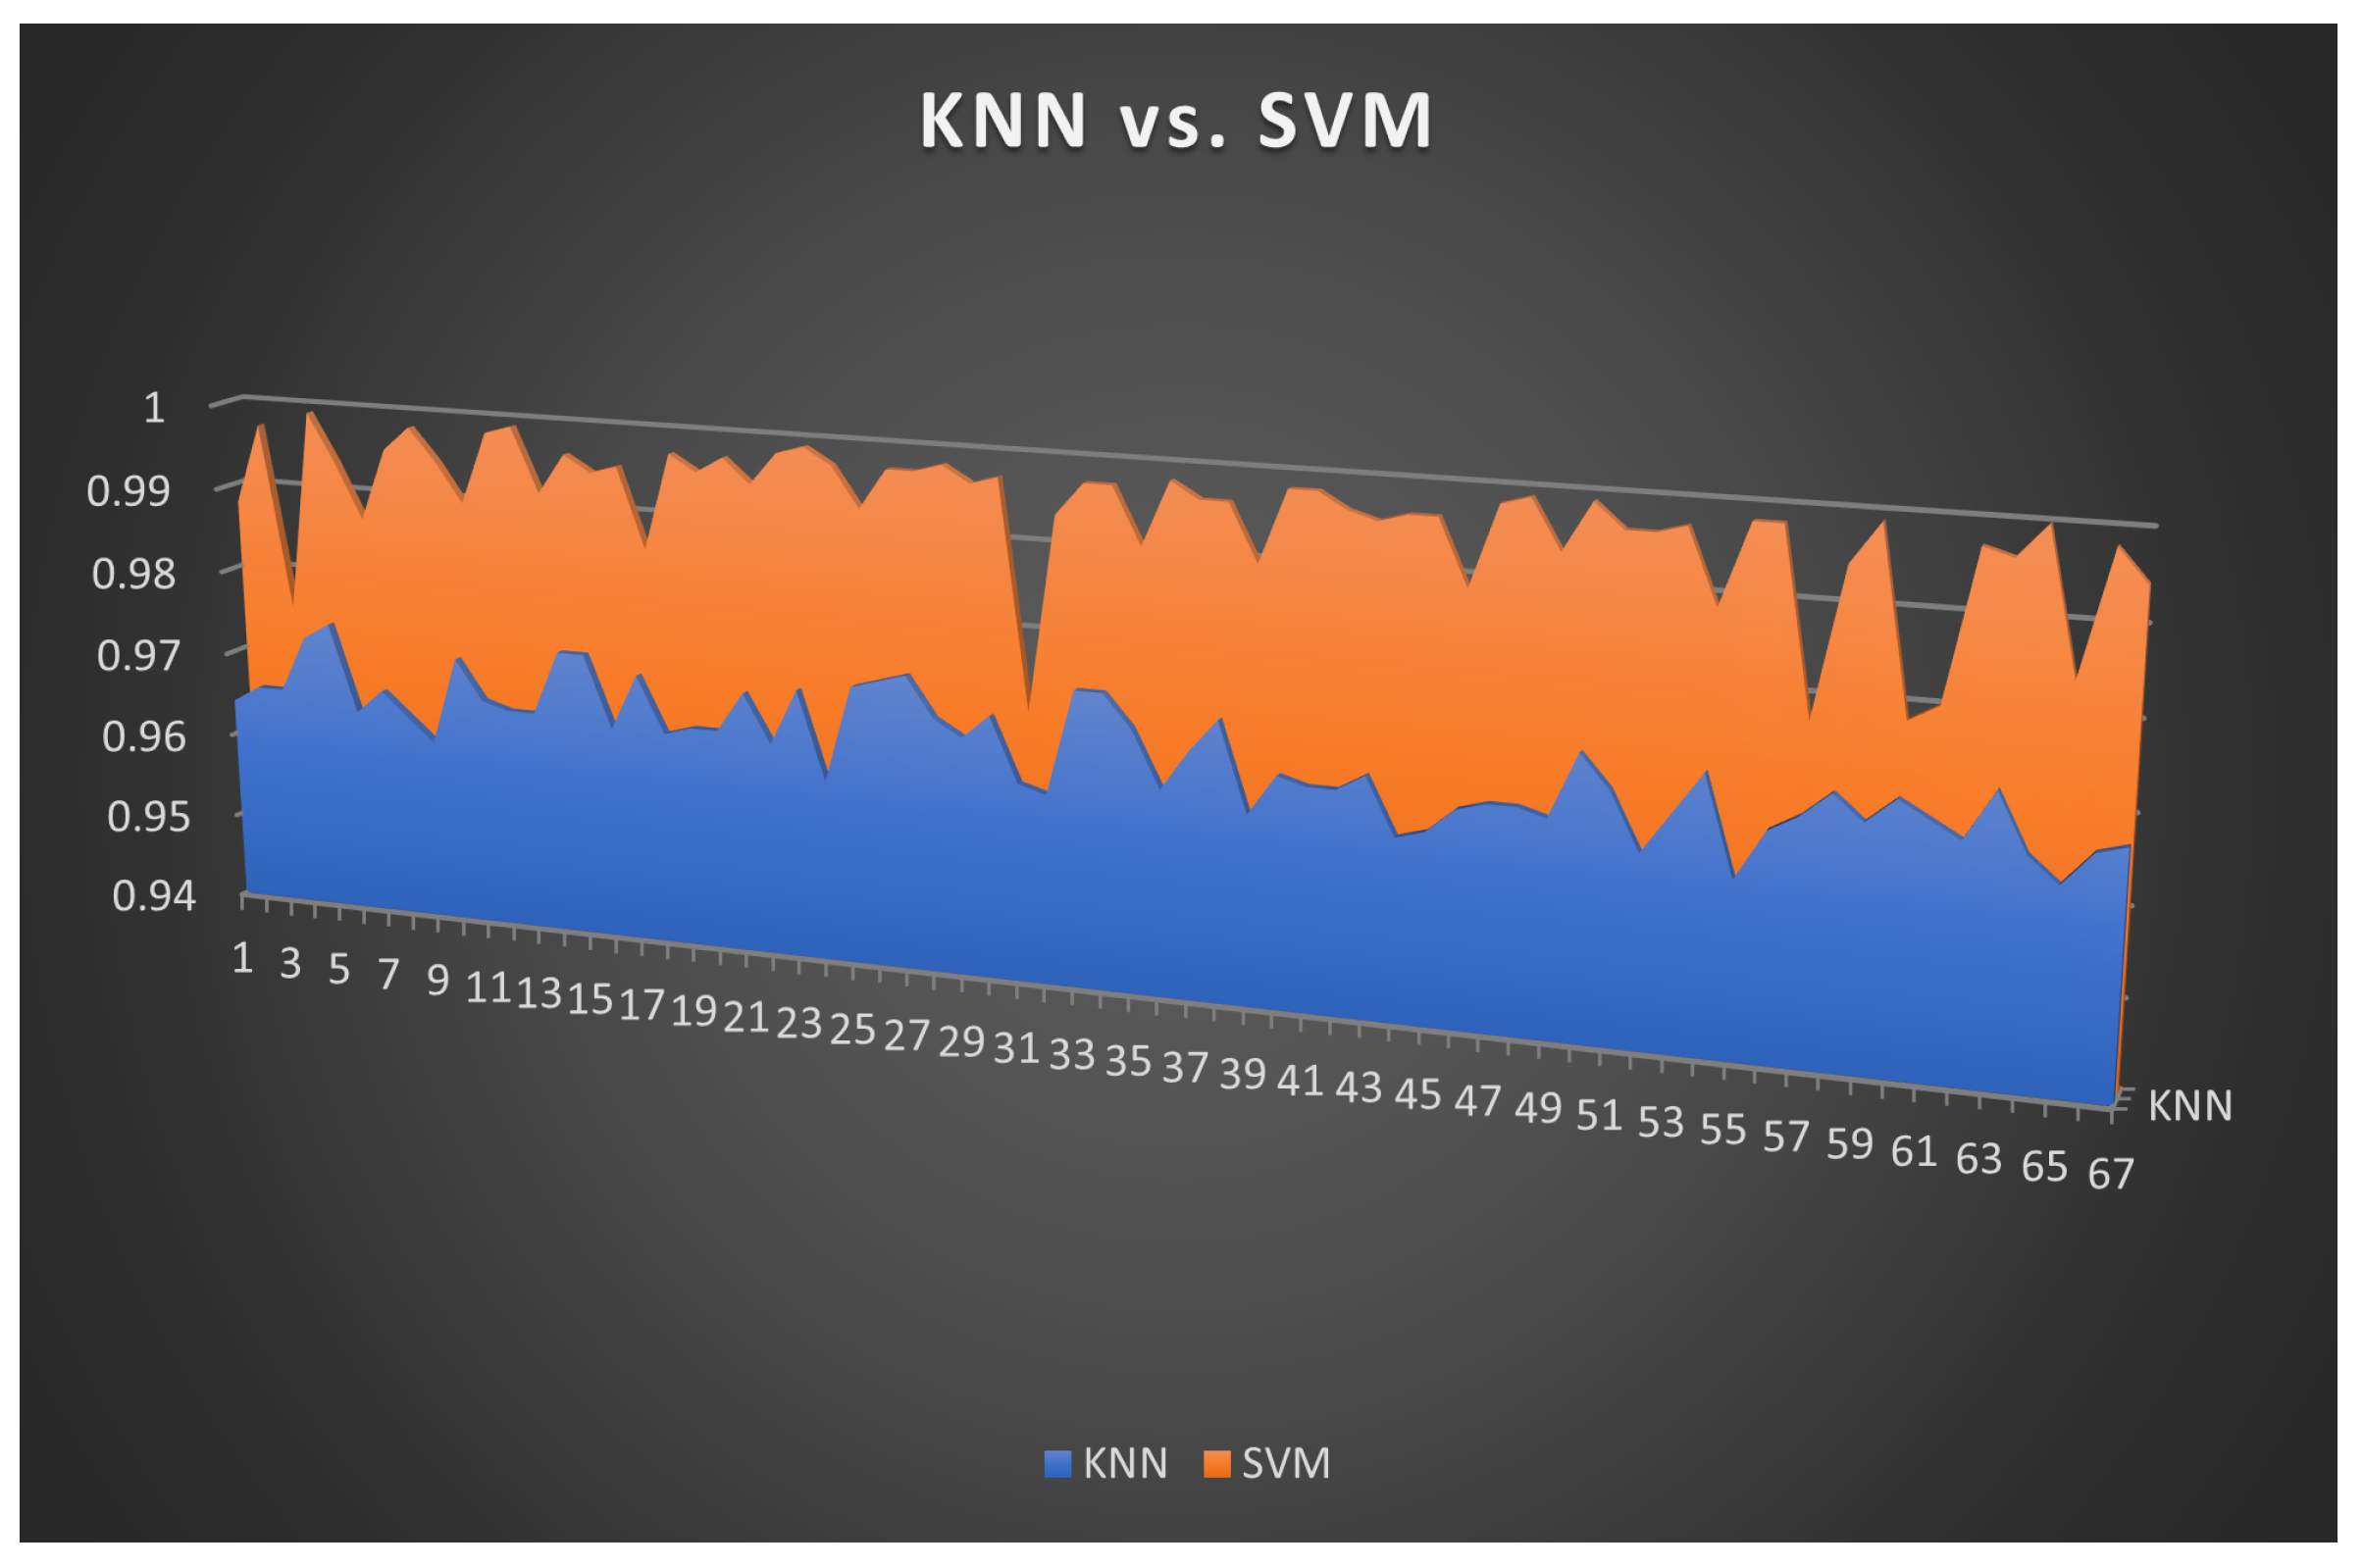
5. Conclusions, Limitations, and Future Recommendations
5.1. Conclusions
5.2. Limitations
5.3. Future Research Opportunities
Data Availability
Funding
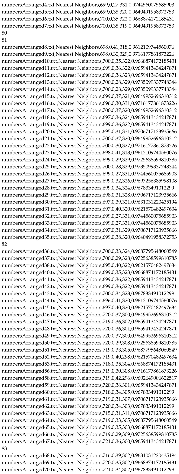
Appendix A

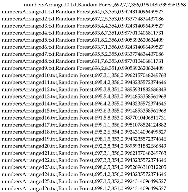
Appendix B

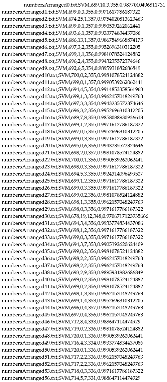
Appendix C

References
- Saxena, G.D.; Dinesh, G.; David, D.S.; Tiwari, M.; Tiwari, T.; Monisha, M.; Chauhan, A. Addressing The Distinct Security Vulnerabilities Typically Emerge On The Mobile Ad-Hoc Network Layer. NeuroQuantology 2023, 21, 169–178. [Google Scholar]
- Manju, V. Sybil attack prevention in wireless sensor network. International Journal of Computer Networking, Wireless and Mobile Communications (IJCNWMC) 2014, 4, 125–132. [Google Scholar]
- Mahesh, B. Machine learning algorithms-a review. International Journal of Science and Research (IJSR).[Internet] 2020, 9, 381–386. [Google Scholar] [CrossRef]
- Rahbari, M.; Jamali, M.A.J. Efficient detection of Sybil attack based on cryptography in VANET. arXiv preprint arXiv:1112.2257, arXiv:1112.2257 2011.
- Chang, W.; Wu, J. A survey of sybil attacks in networks. Sensor Networks for Sustainable Development 2012. [Google Scholar]
- Balachandran, N.; Sanyal, S. A review of techniques to mitigate sybil attacks. arXiv preprint arXiv:1207.2617, arXiv:1207.2617 2012.
- Misra, S.; Tayeen, A.S.M.; Xu, W. SybilExposer: An effective scheme to detect Sybil communities in online social networks. 2016 IEEE International Conference on Communications (ICC). IEEE, 2016, pp. 1–6.
- Fong, P.W. Preventing Sybil attacks by privilege attenuation: A design principle for social network systems. 2011 IEEE Symposium on Security and Privacy. IEEE, 2011, pp. 263–278.
- Margolin, N.B.; Levine, B.N. Informant: Detecting sybils using incentives. International Conference on Financial Cryptography and Data Security. Springer, 2007, pp. 192–207.
- Du, W.; Deng, J.; Han, Y.S.; Varshney, P.K.; Katz, J.; Khalili, A. A pairwise key predistribution scheme for wireless sensor networks. ACM Transactions on Information and System Security (TISSEC) 2005, 8, 228–258. [Google Scholar] [CrossRef]
- Lu, H.; Gong, D.; Li, Z.; Liu, F.; Liu, F. SybilHP: Sybil Detection in Directed Social Networks with Adaptive Homophily Prediction. Applied Sciences 2023, 13, 5341. [Google Scholar] [CrossRef]
- Patel, S.T.; Mistry, N.H. A review: Sybil attack detection techniques in WSN. 2017 4th International conference on electronics and communication systems (ICECS). IEEE, 2017, pp. 184–188.
- Almesaeed, R.; Al-Salem, E. Sybil attack detection scheme based on channel profile and power regulations in wireless sensor networks. Wireless Networks 2022, 28, 1361–1374. [Google Scholar] [CrossRef]
- Batchelor, B.G. Pattern recognition: Ideas in practice; Springer Science & Business Media, 2012.
- Kafetzis, D.; Vassilaras, S.; Vardoulias, G.; Koutsopoulos, I. Software-defined networking meets software-defined radio in mobile ad hoc networks: State of the art and future directions. IEEE Access 2022, 10, 9989–10014. [Google Scholar] [CrossRef]
- Cui, Z.; Fei, X.; Zhang, S.; Cai, X.; Cao, Y.; Zhang, W.; Chen, J. A hybrid blockchain-based identity authentication scheme for multi-WSN. IEEE Transactions on Services Computing 2020, 13, 241–251. [Google Scholar] [CrossRef]
- Saraswathi, R.V.; Sree, L.P.; Anuradha, K. Support vector based regression model to detect Sybil attacks in WSN. International Journal of Advanced Trends in Computer Science and Engineering 2020, 9. [Google Scholar]
- Choy, G.; Khalilzadeh, O.; Michalski, M.; Do, S.; Samir, A.E.; Pianykh, O.S.; Geis, J.R.; Pandharipande, P.V.; Brink, J.A.; Dreyer, K.J. Current applications and future impact of machine learning in radiology. Radiology 2018, 288, 318–328. [Google Scholar] [CrossRef]
- Tong, F.; Zhang, Z.; Zhu, Z.; Zhang, Y.; Chen, C. A novel scheme based on coarse-grained localization and fine-grained isolation for defending against Sybil attack in low power and lossy networks. Asian Journal of Control 2023. [Google Scholar] [CrossRef]
- Nayyar, A.; Rameshwar, R.; Solanki, A. Internet of Things (IoT) and the digital business environment: A standpoint inclusive cyber space, cyber crimes, and cybersecurity. The evolution of business in the cyber age 2020, 10, 9780429276484–6. [Google Scholar]
- Alsafery, W.; Rana, O.; Perera, C. Sensing within smart buildings: A survey. ACM Computing Surveys 2023, 55, 1–35. [Google Scholar] [CrossRef]
- NBC News. https://www.nbcnews.com/tech/social-media/, 2023. [NBC News Home.].
- Vincent, J. Emotion and the mobile phone. Cultures of participation: Media practices, politics and literacy, 2011; 95–109. [Google Scholar]
- Xiao, L.; Greenstein, L.J.; Mandayam, N.B.; Trappe, W. Channel-based detection of sybil attacks in wireless networks. IEEE Transactions on Information Forensics and Security 2009, 4, 492–503. [Google Scholar] [CrossRef]
- Samuel, S.J.; Dhivya, B. An efficient technique to detect and prevent Sybil attacks in social network applications. 2015 IEEE International Conference on Electrical, Computer and Communication Technologies (ICECCT). IEEE, 2015, pp. 1–3.
- Douceur, J.R. The sybil attack. International workshop on peer-to-peer systems. Springer, 2002, pp. 251–260.
- Arif, M.; Wang, G.; Bhuiyan, M.Z.A.; Wang, T.; Chen, J. A survey on security attacks in VANETs: Communication, applications and challenges. Vehicular Communications 2019, 19, 100179. [Google Scholar] [CrossRef]
- Iswanto, I.; Tulus, T.; Sihombing, P. Comparison of distance models on K-Nearest Neighbor algorithm in stroke disease detection. Applied Technology and Computing Science Journal 2021, 4, 63–68. [Google Scholar] [CrossRef]
- Helmi, Z.; Adriman, R.; Arif, T.Y.; Walidainy, H.; Fitria, M.; others. Sybil Attack Prediction on Vehicle Network Using Deep Learning. Jurnal RESTI (Rekayasa Sistem dan Teknologi Informasi) 2022, 6, 499–504. [Google Scholar] [CrossRef]
- Ben-Hur, A.; Ong, C.S.; Sonnenburg, S.; Schölkopf, B.; Rätsch, G. Support vector machines and kernels for computational biology. PLoS computational biology 2008, 4, e1000173. [Google Scholar] [CrossRef]
- Hu, L.Y.; Huang, M.W.; Ke, S.W.; Tsai, C.F. The distance function effect on k-nearest neighbor classification for medical datasets. SpringerPlus 2016, 5, 1–9. [Google Scholar] [CrossRef]
- Lee, G.; Lim, J.; Kim, D.k.; Yang, S.; Yoon, M. An approach to mitigating sybil attack in wireless networks using zigBee. 2008 10th International Conference on Advanced Communication Technology. IEEE, 2008, Vol. 2, pp. 1005–1009.
- Eschenauer, L.; Gligor, V.D. A key-management scheme for distributed sensor networks. Proceedings of the 9th ACM Conference on Computer and Communications Security, 2002, pp. 41–47.
- Dhamodharan, U.S.R.K.; Vayanaperumal, R.; others. Detecting and preventing sybil attacks in wireless sensor networks using message authentication and passing method. The Scientific World Journal 2015, 2015. [Google Scholar] [CrossRef]
- Ammari, A.; Bensalem, A. ; others. Fault tolerance and VANET (Vehicular Ad-Hoc Network). PhD thesis, UNIVERSITY of M’SILA, 2022.
- Quevedo, C.H.; Quevedo, A.M.; Campos, G.A.; Gomes, R.L.; Celestino, J.; Serhrouchni, A. An intelligent mechanism for sybil attacks detection in vanets. ICC 2020-2020 IEEE International Conference on Communications (ICC). IEEE, 2020, pp. 1–6.
- Yu, H.; Gibbons, P.B.; Kaminsky, M.; Xiao, F. Sybillimit: A near-optimal social network defense against sybil attacks. 2008 IEEE Symposium on Security and Privacy (sp 2008). IEEE, 2008, pp. 3–17.
- Abbas, S.; Merabti, M.; Llewellyn-Jones, D.; Kifayat, K. Lightweight sybil attack detection in manets. IEEE systems journal 2012, 7, 236–248. [Google Scholar] [CrossRef]
- Newsome, J.; Shi, E.; Song, D.; Perrig, A. The sybil attack in sensor networks: Analysis & defenses. Proceedings of the 3rd international symposium on Information processing in sensor networks, 2004, pp. 259–268.
- Chen, Y.; Yang, J.; Trappe, W.; Martin, R.P. Detecting and localizing identity-based attacks in wireless and sensor networks. IEEE Transactions on Vehicular Technology 2010, 59, 2418–2434. [Google Scholar] [CrossRef]
- Shetty, N.P.; Muniyal, B.; Anand, A.; Kumar, S. An enhanced sybil guard to detect bots in online social networks. Journal of Cyber Security and Mobility, 2022; 105–126. [Google Scholar]
- Mounica, M.; Vijayasaraswathi, R.; Vasavi, R. RETRACTED: Detecting Sybil Attack In Wireless Sensor Networks Using Machine Learning Algorithms. IOP Conference Series: Materials Science and Engineering. IOP Publishing, 2021, Vol. 1042, p. 012029.
- Twitter follower-followee graph. https://figshare.com/articles/dataset/Twitter_follower-followee_graph_labeled_with_benign_Sybil/20057300, 2022. [Labeled with benign/Sybil.].
- Demirbas, M.; Song, Y. An RSSI-based scheme for sybil attack detection in wireless sensor networks. 2006 International symposium on a world of wireless, mobile and multimedia networks (WoWMoM’06). ieee, 2006, pp. 5–pp.
- Machine LEarning Research. https://machinelearning.apple.com/research/hey-siri, 2023. [Apple’s siri voice recognition software.].
- Alexa. https://developer.amazon.com/, 2023. [Amazon’s alexa voice recognition software.].
- Kak, S. A three-stage quantum cryptography protocol. Foundations of Physics Letters 2006, 19, 293–296. [Google Scholar] [CrossRef]
- Sahami, M.; Dumais, S.; Heckerman, D.; Horvitz, E. A Bayesian approach to filtering junk e-mail. Learning for Text Categorization: Papers from the 1998 workshop. Citeseer, 1998, Vol. 62, pp. 98–105.
- Schiappa, M.C.; Rawat, Y.S.; Shah, M. Self-supervised learning for videos: A survey. ACM Computing Surveys 2023, 55, 1–37. [Google Scholar] [CrossRef]
- Zamsuri, A.; Defit, S.; Nurcahyo, G.W. Classification of Multiple Emotions in Indonesian Text Using The K-Nearest Neighbor Method. Journal of Applied Engineering and Technological Science (JAETS) 2023, 4, 1012–1021. [Google Scholar] [CrossRef]
- Gupta, M.; Judge, P.; Ammar, M. A reputation system for peer-to-peer networks. Proceedings of the 13th international workshop on Network and operating systems support for digital audio and video, 2003, pp. 144–152.
- Michalski, R.S.; Stepp, R.E.; Diday, E. A recent advance in data analysis: Clustering objects into classes characterized by conjunctive concepts. In Progress in pattern recognition; Elsevier, 1981; pp. 33–56.
- Medjahed, S.A.; Saadi, T.A.; Benyettou, A. Breast cancer diagnosis by using k-nearest neighbor with different distances and classification rules. International Journal of Computer Applications 2013, 62. [Google Scholar]
- Swamynathan, G.; Almeroth, K.C.; Zhao, B.Y. The design of a reliable reputation system. Electronic Commerce Research 2010, 10, 239–270. [Google Scholar] [CrossRef]
- Valarmathi, M.; Meenakowshalya, A.; Bharathi, A. Robust Sybil attack detection mechanism for Social Networks-a survey. 2016 3rd International conference on advanced computing and communication systems (ICACCS). IEEE, 2016, Vol. 1, pp. 1–5.
- Vasudeva, A.; Sood, M. Survey on sybil attack defense mechanisms in wireless ad hoc networks. Journal of Network and Computer Applications 2018, 120, 78–118. [Google Scholar] [CrossRef]
- Yu, H.; Kaminsky, M.; Gibbons, P.B.; Flaxman, A. Sybilguard: Defending against sybil attacks via social networks. Proceedings of the 2006 conference on Applications, technologies, architectures, and protocols for computer communications, 2006, pp. 267–278.
- Yuan, D.; Miao, Y.; Gong, N.Z.; Yang, Z.; Li, Q.; Song, D.; Wang, Q.; Liang, X. Detecting fake accounts in online social networks at the time of registrations. Proceedings of the 2019 ACM SIGSAC conference on computer and communications security, 2019, pp. 1423–1438.
- Zhang, K.; Liang, X.; Lu, R.; Shen, X. Sybil attacks and their defenses in the internet of things. IEEE Internet of Things Journal 2014, 1, 372–383. [Google Scholar] [CrossRef]
- Kaggle. https://www.kaggle.com/, 2023. [Level up with the largest AI & ML community.].
- Jain, N.; Jana, P.K. LRF: A logically randomized forest algorithm for classification and regression problems. Expert Systems with Applications 2023, 213, 119225. [Google Scholar] [CrossRef]
- Jethava, G.; Rao, U.P. User behavior-based and graph-based hybrid approach for detection of sybil attack in online social networks. Computers and Electrical Engineering 2022, 99, 107753. [Google Scholar] [CrossRef]
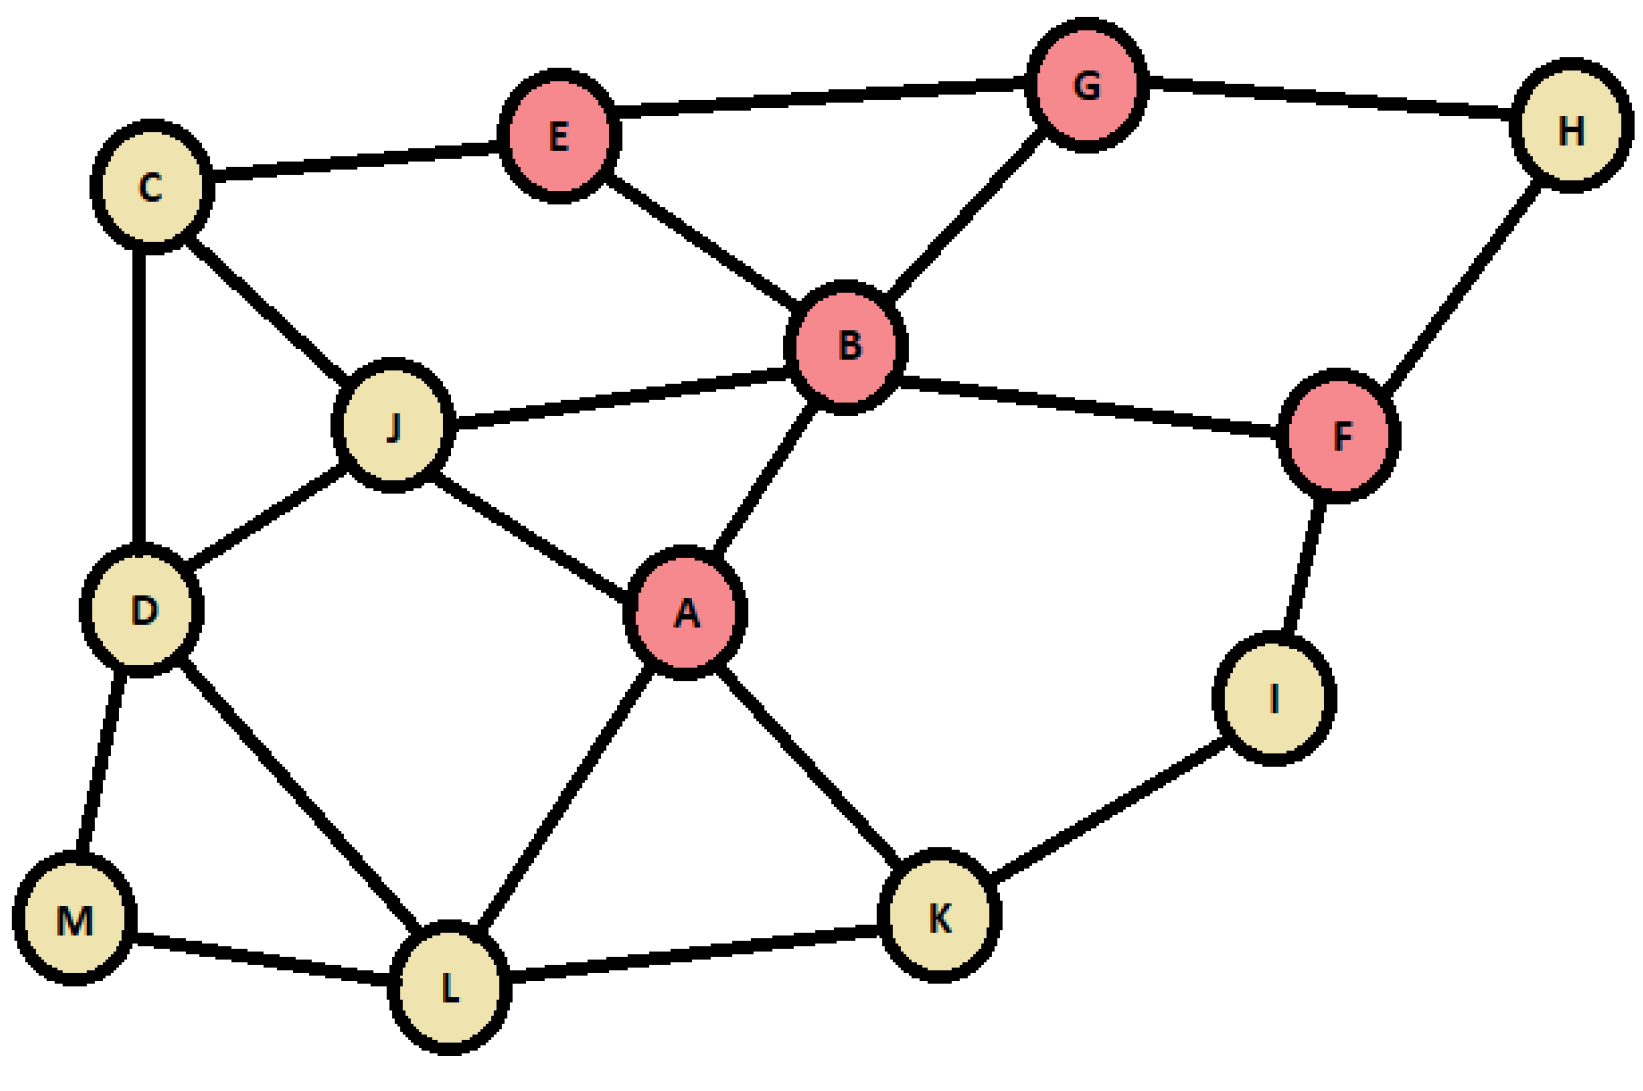



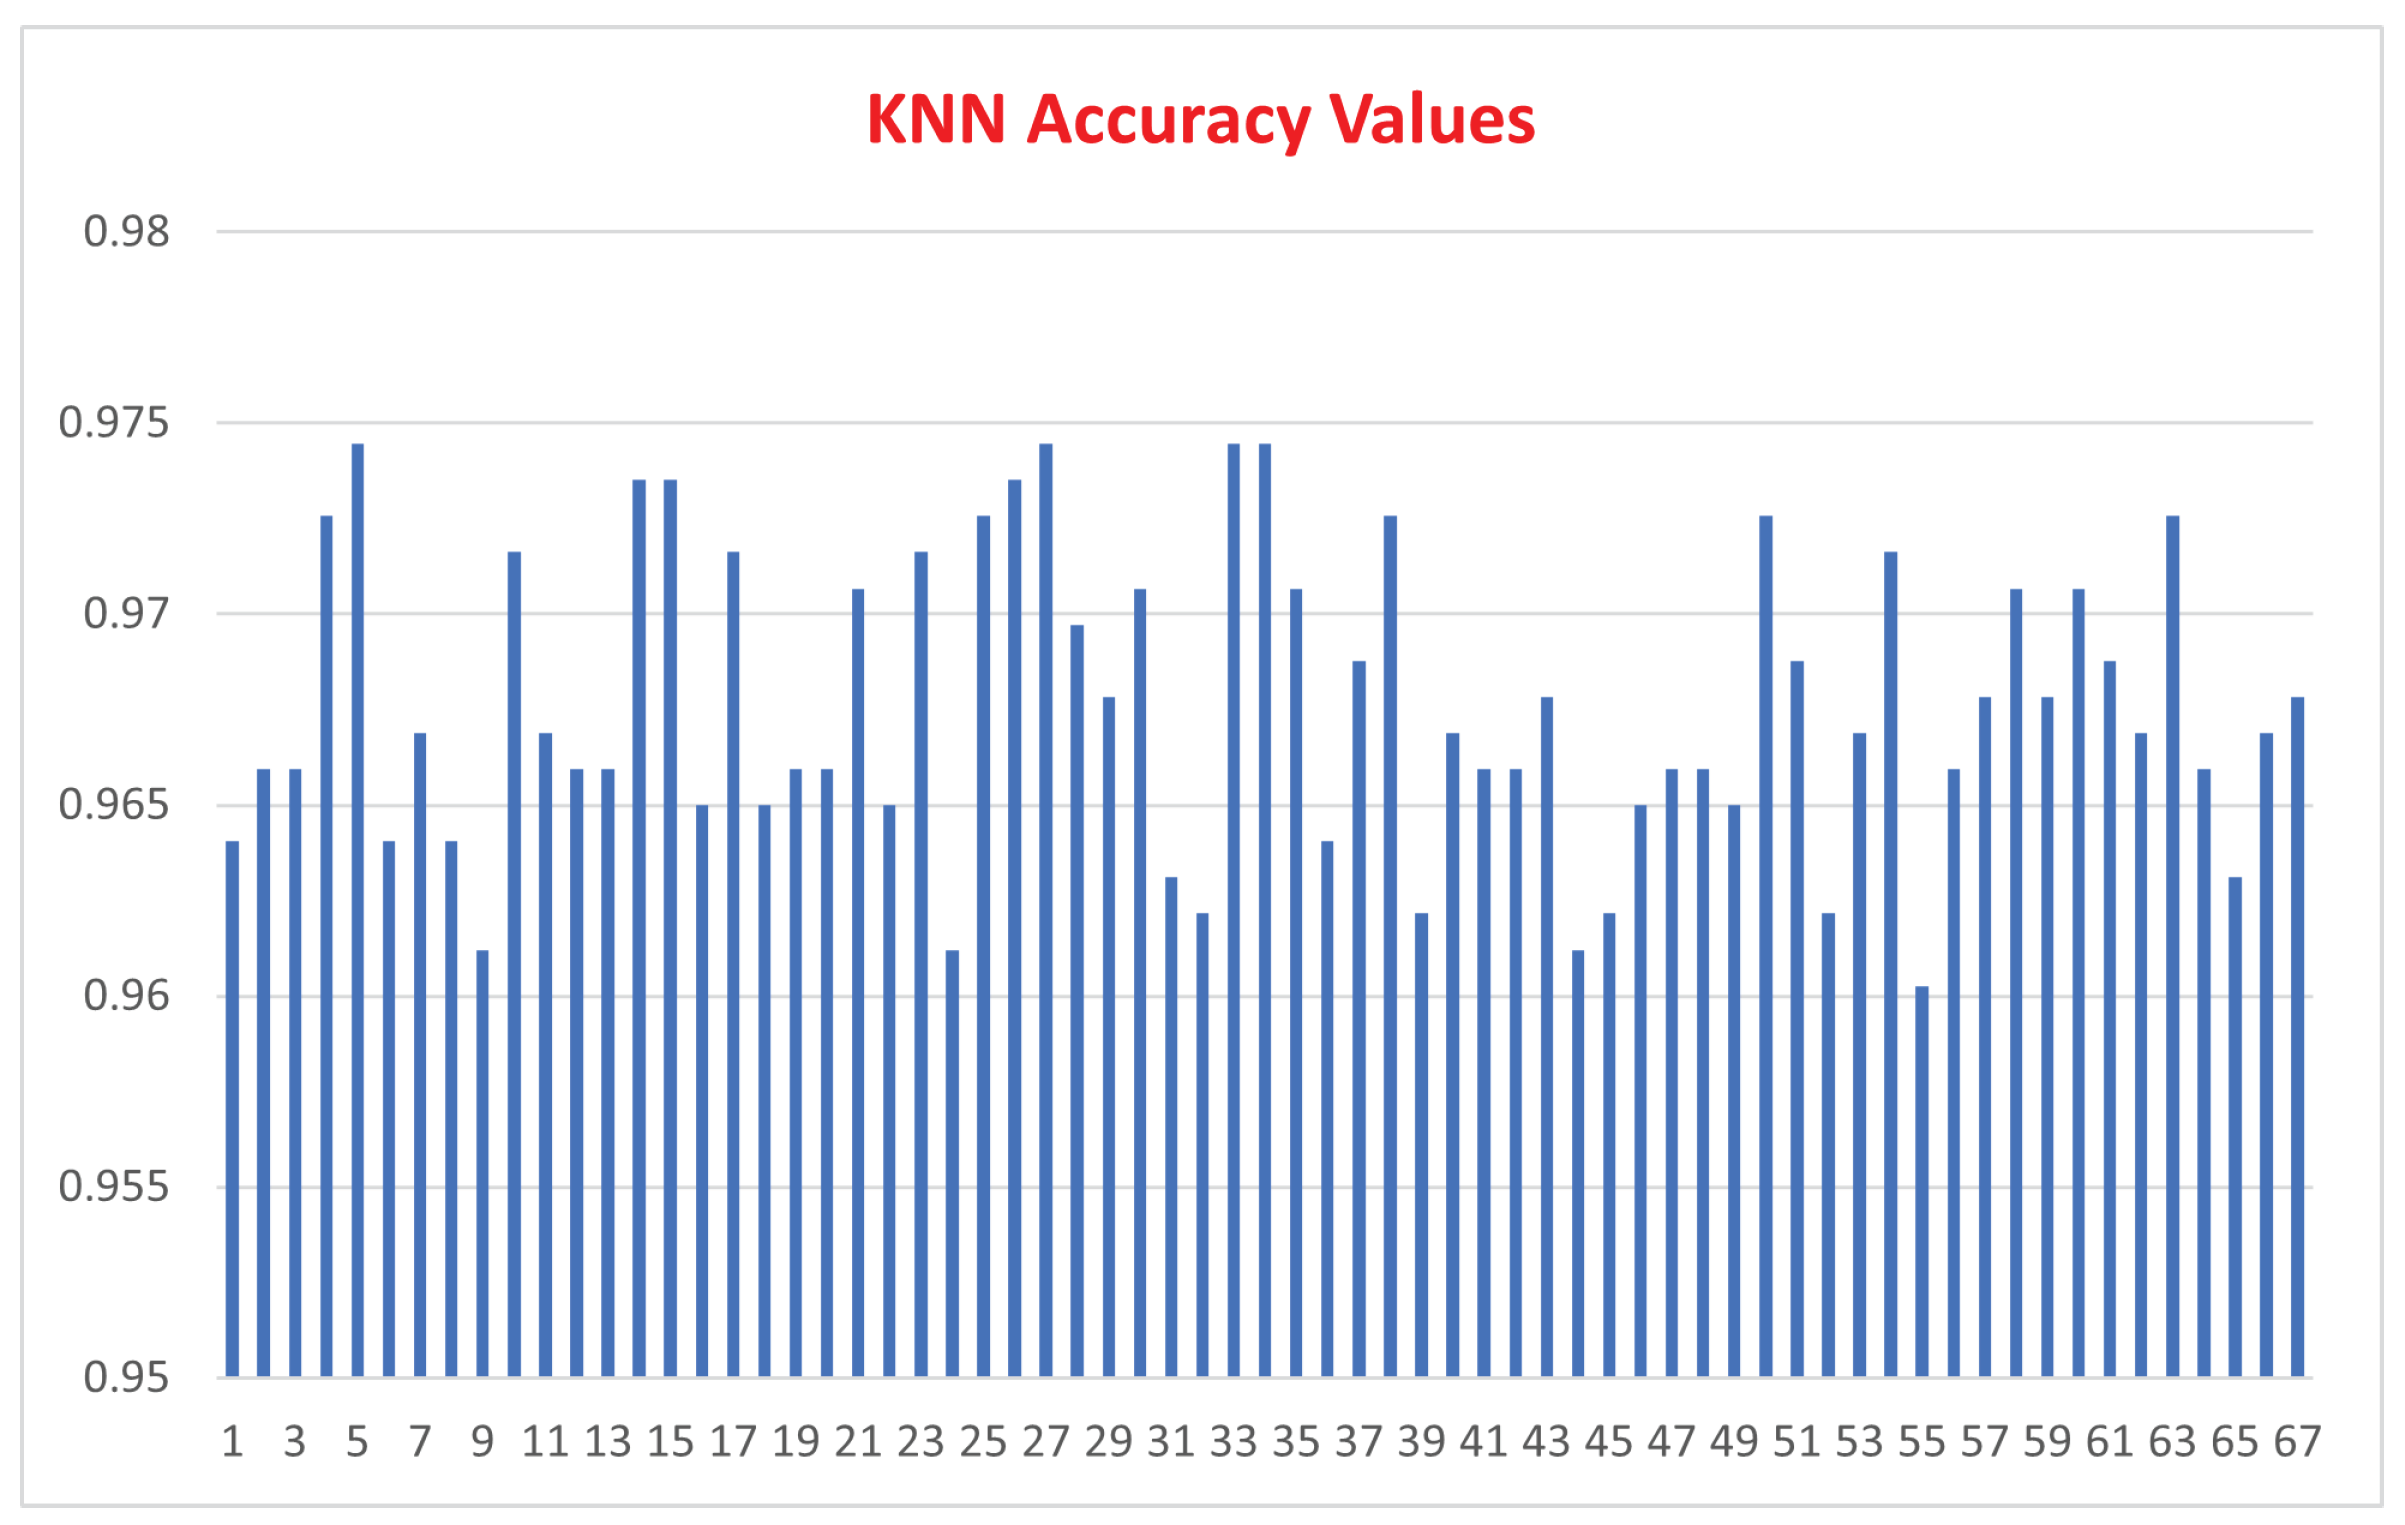
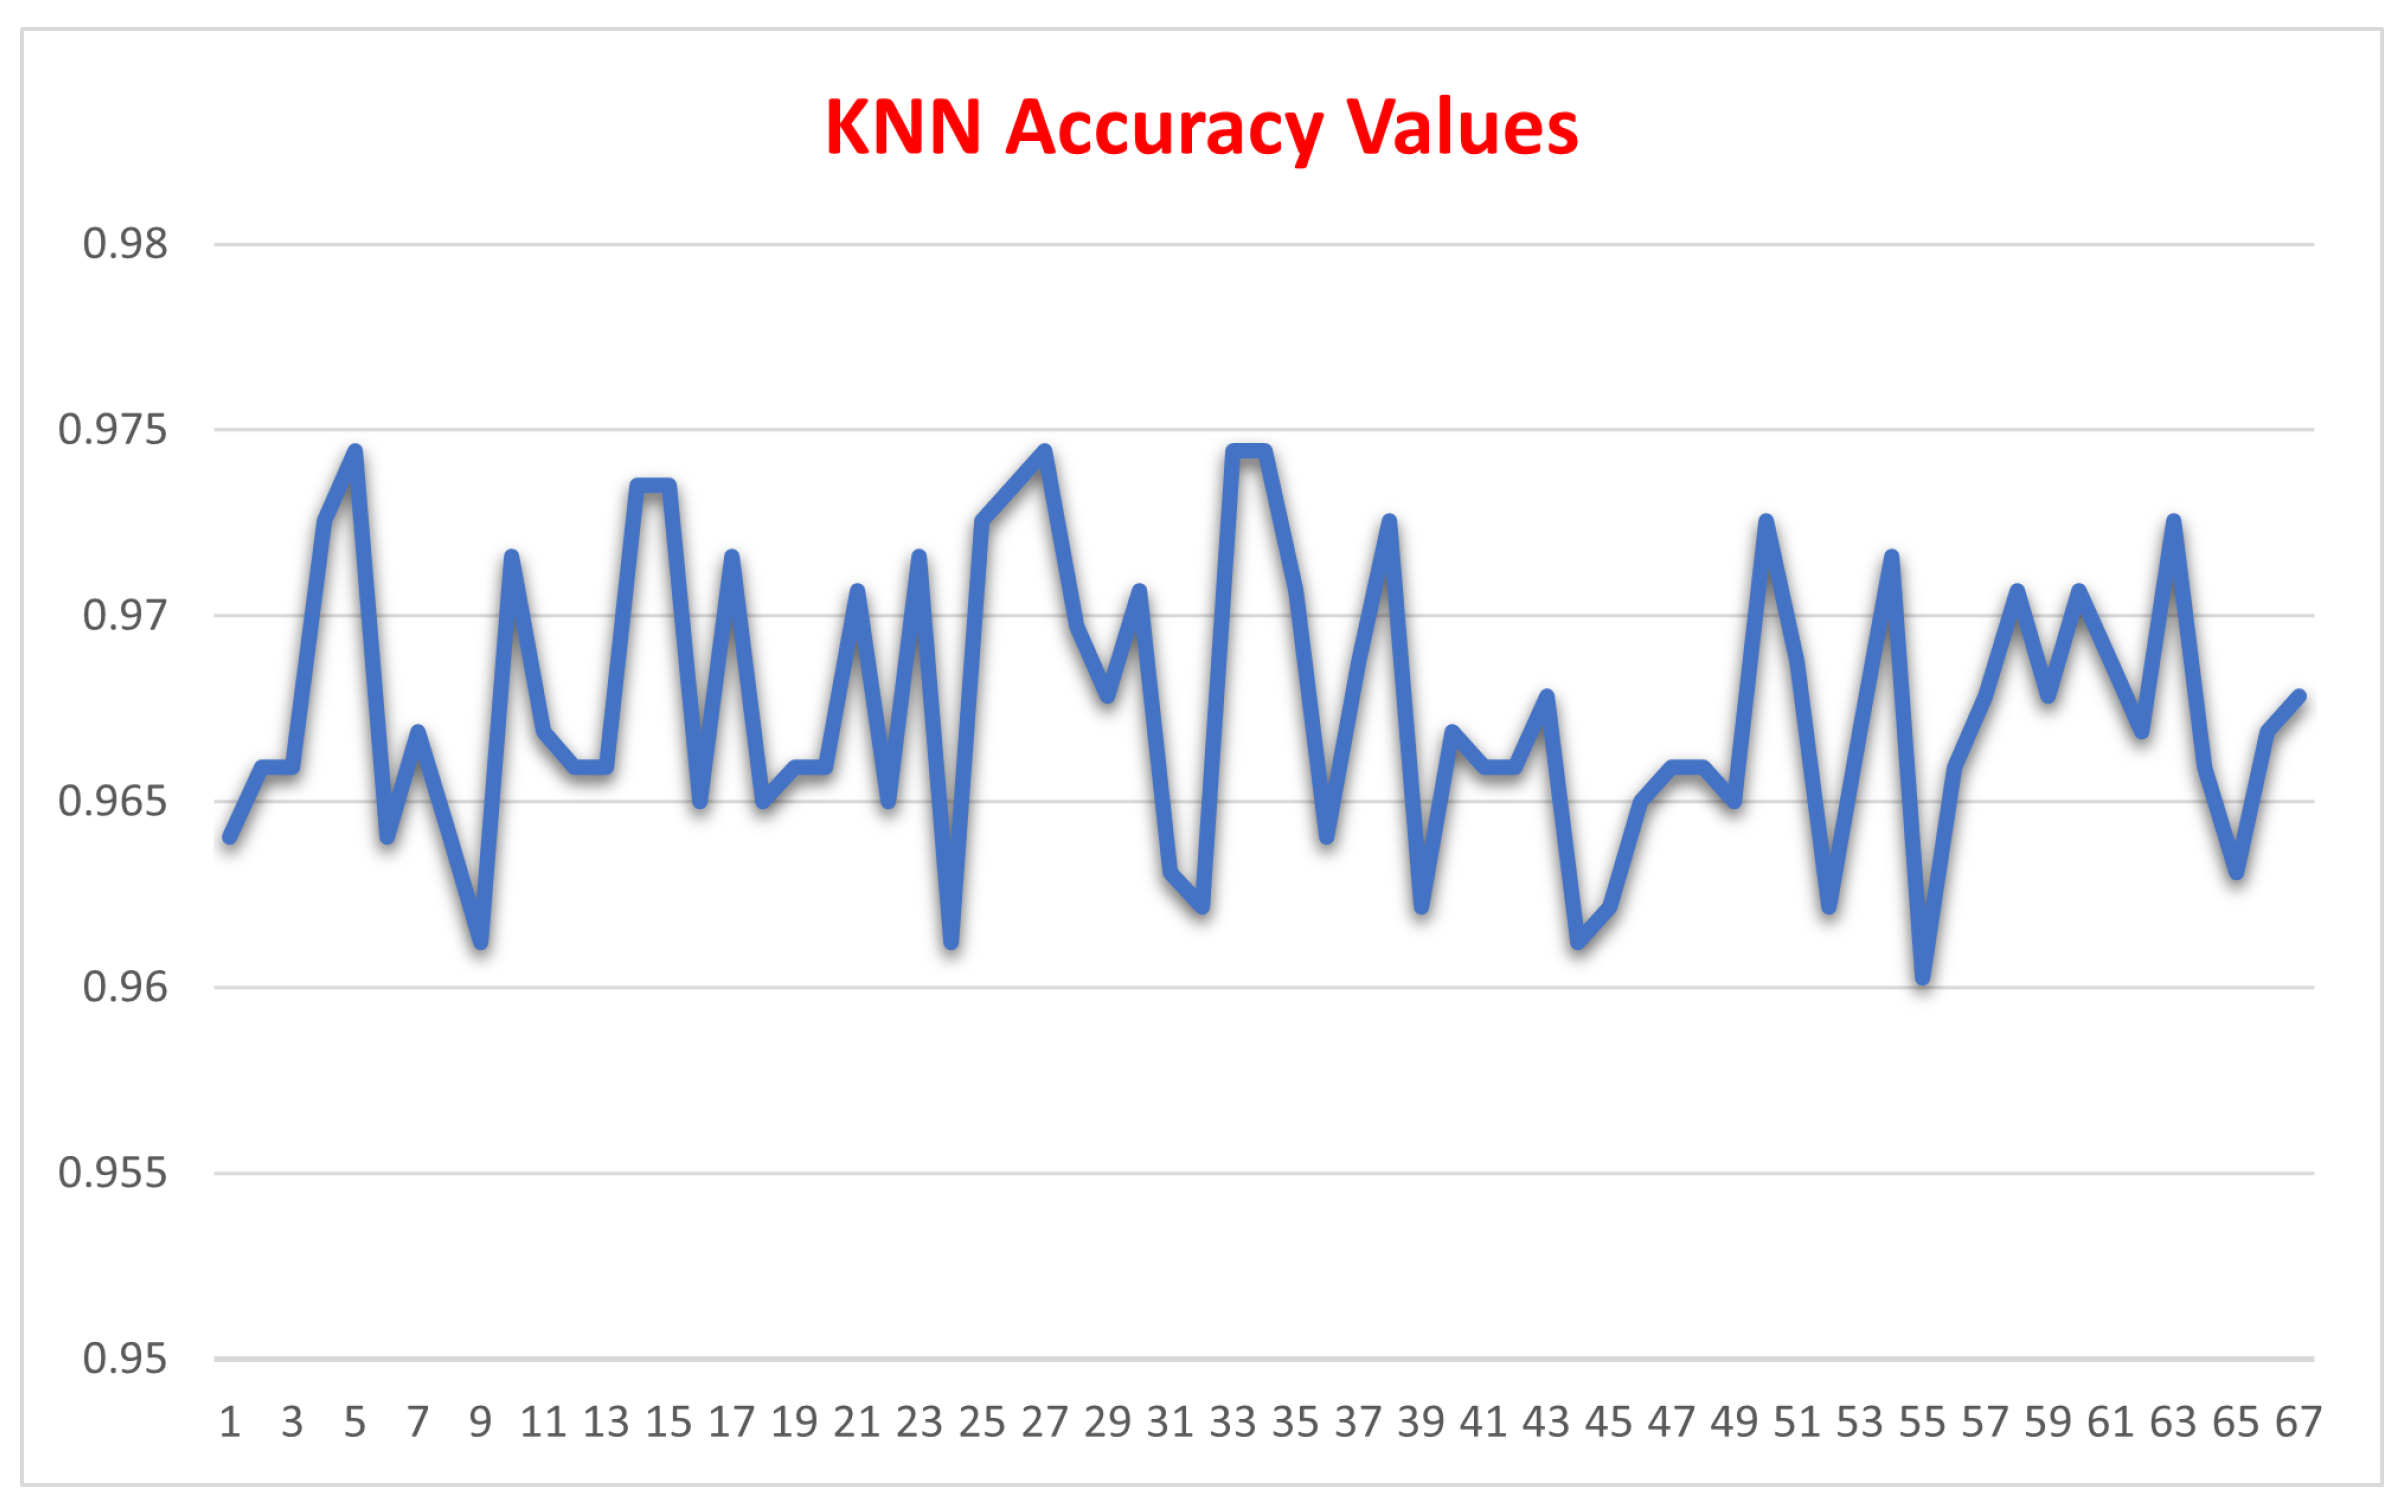
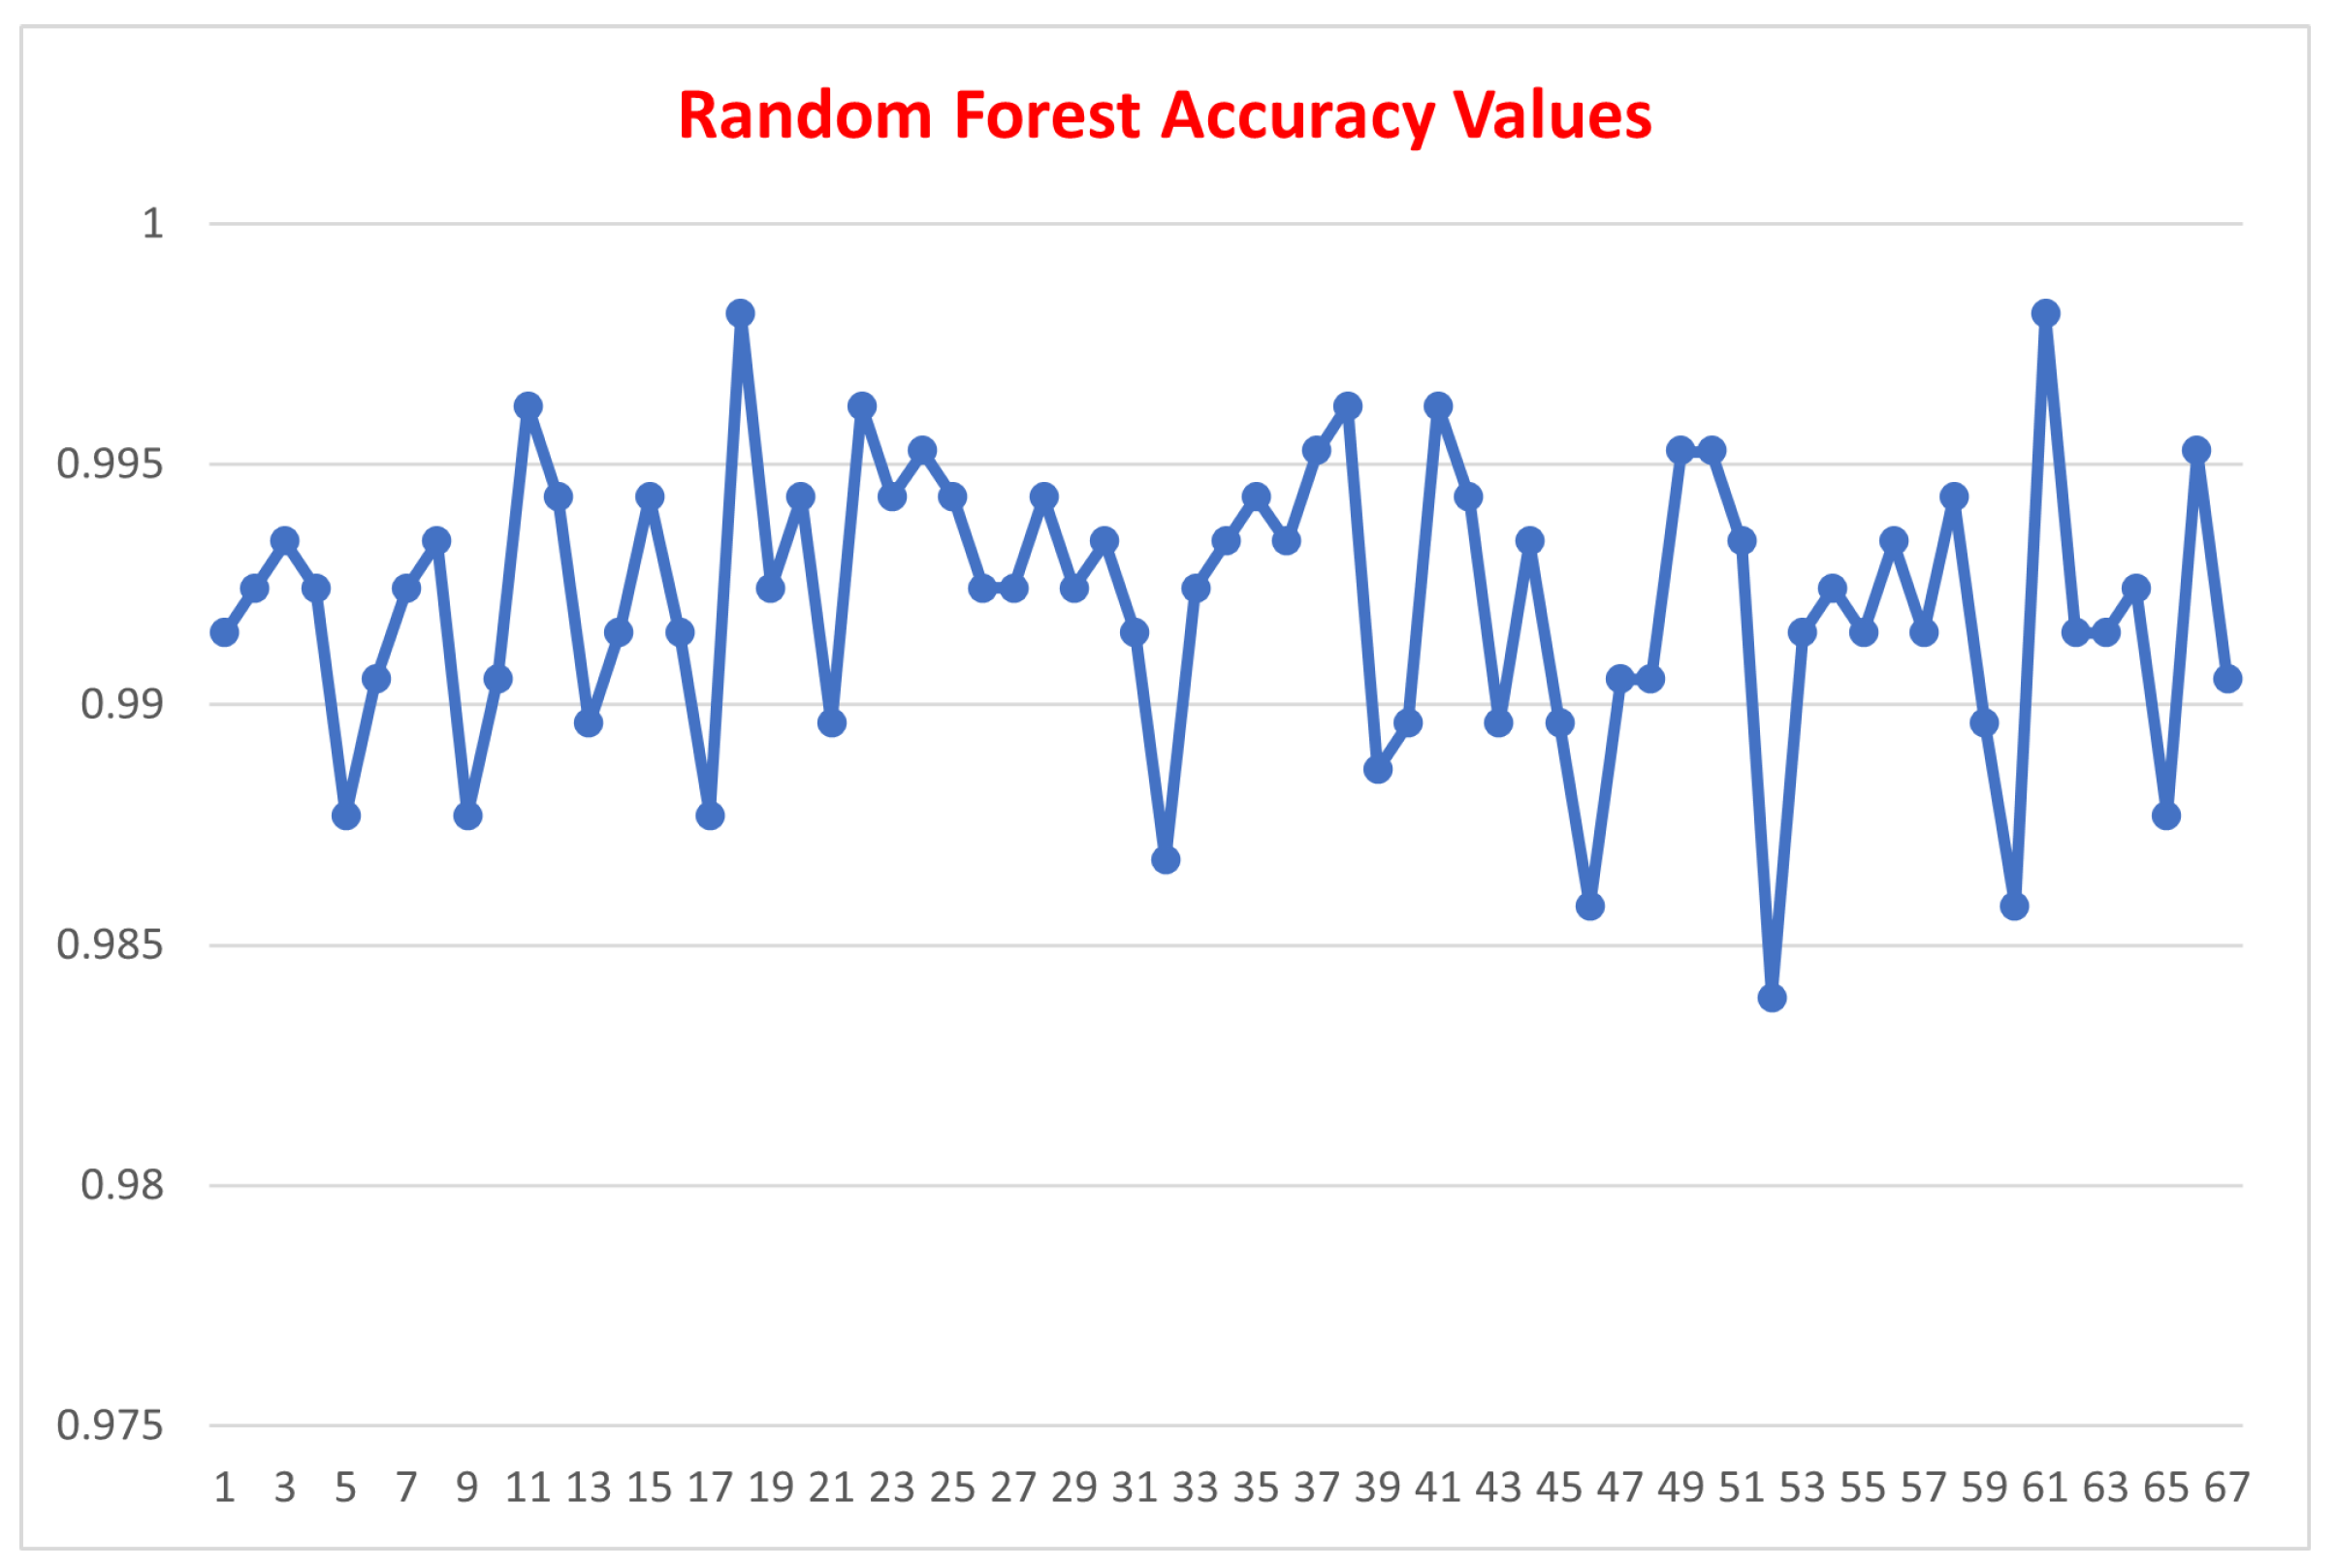
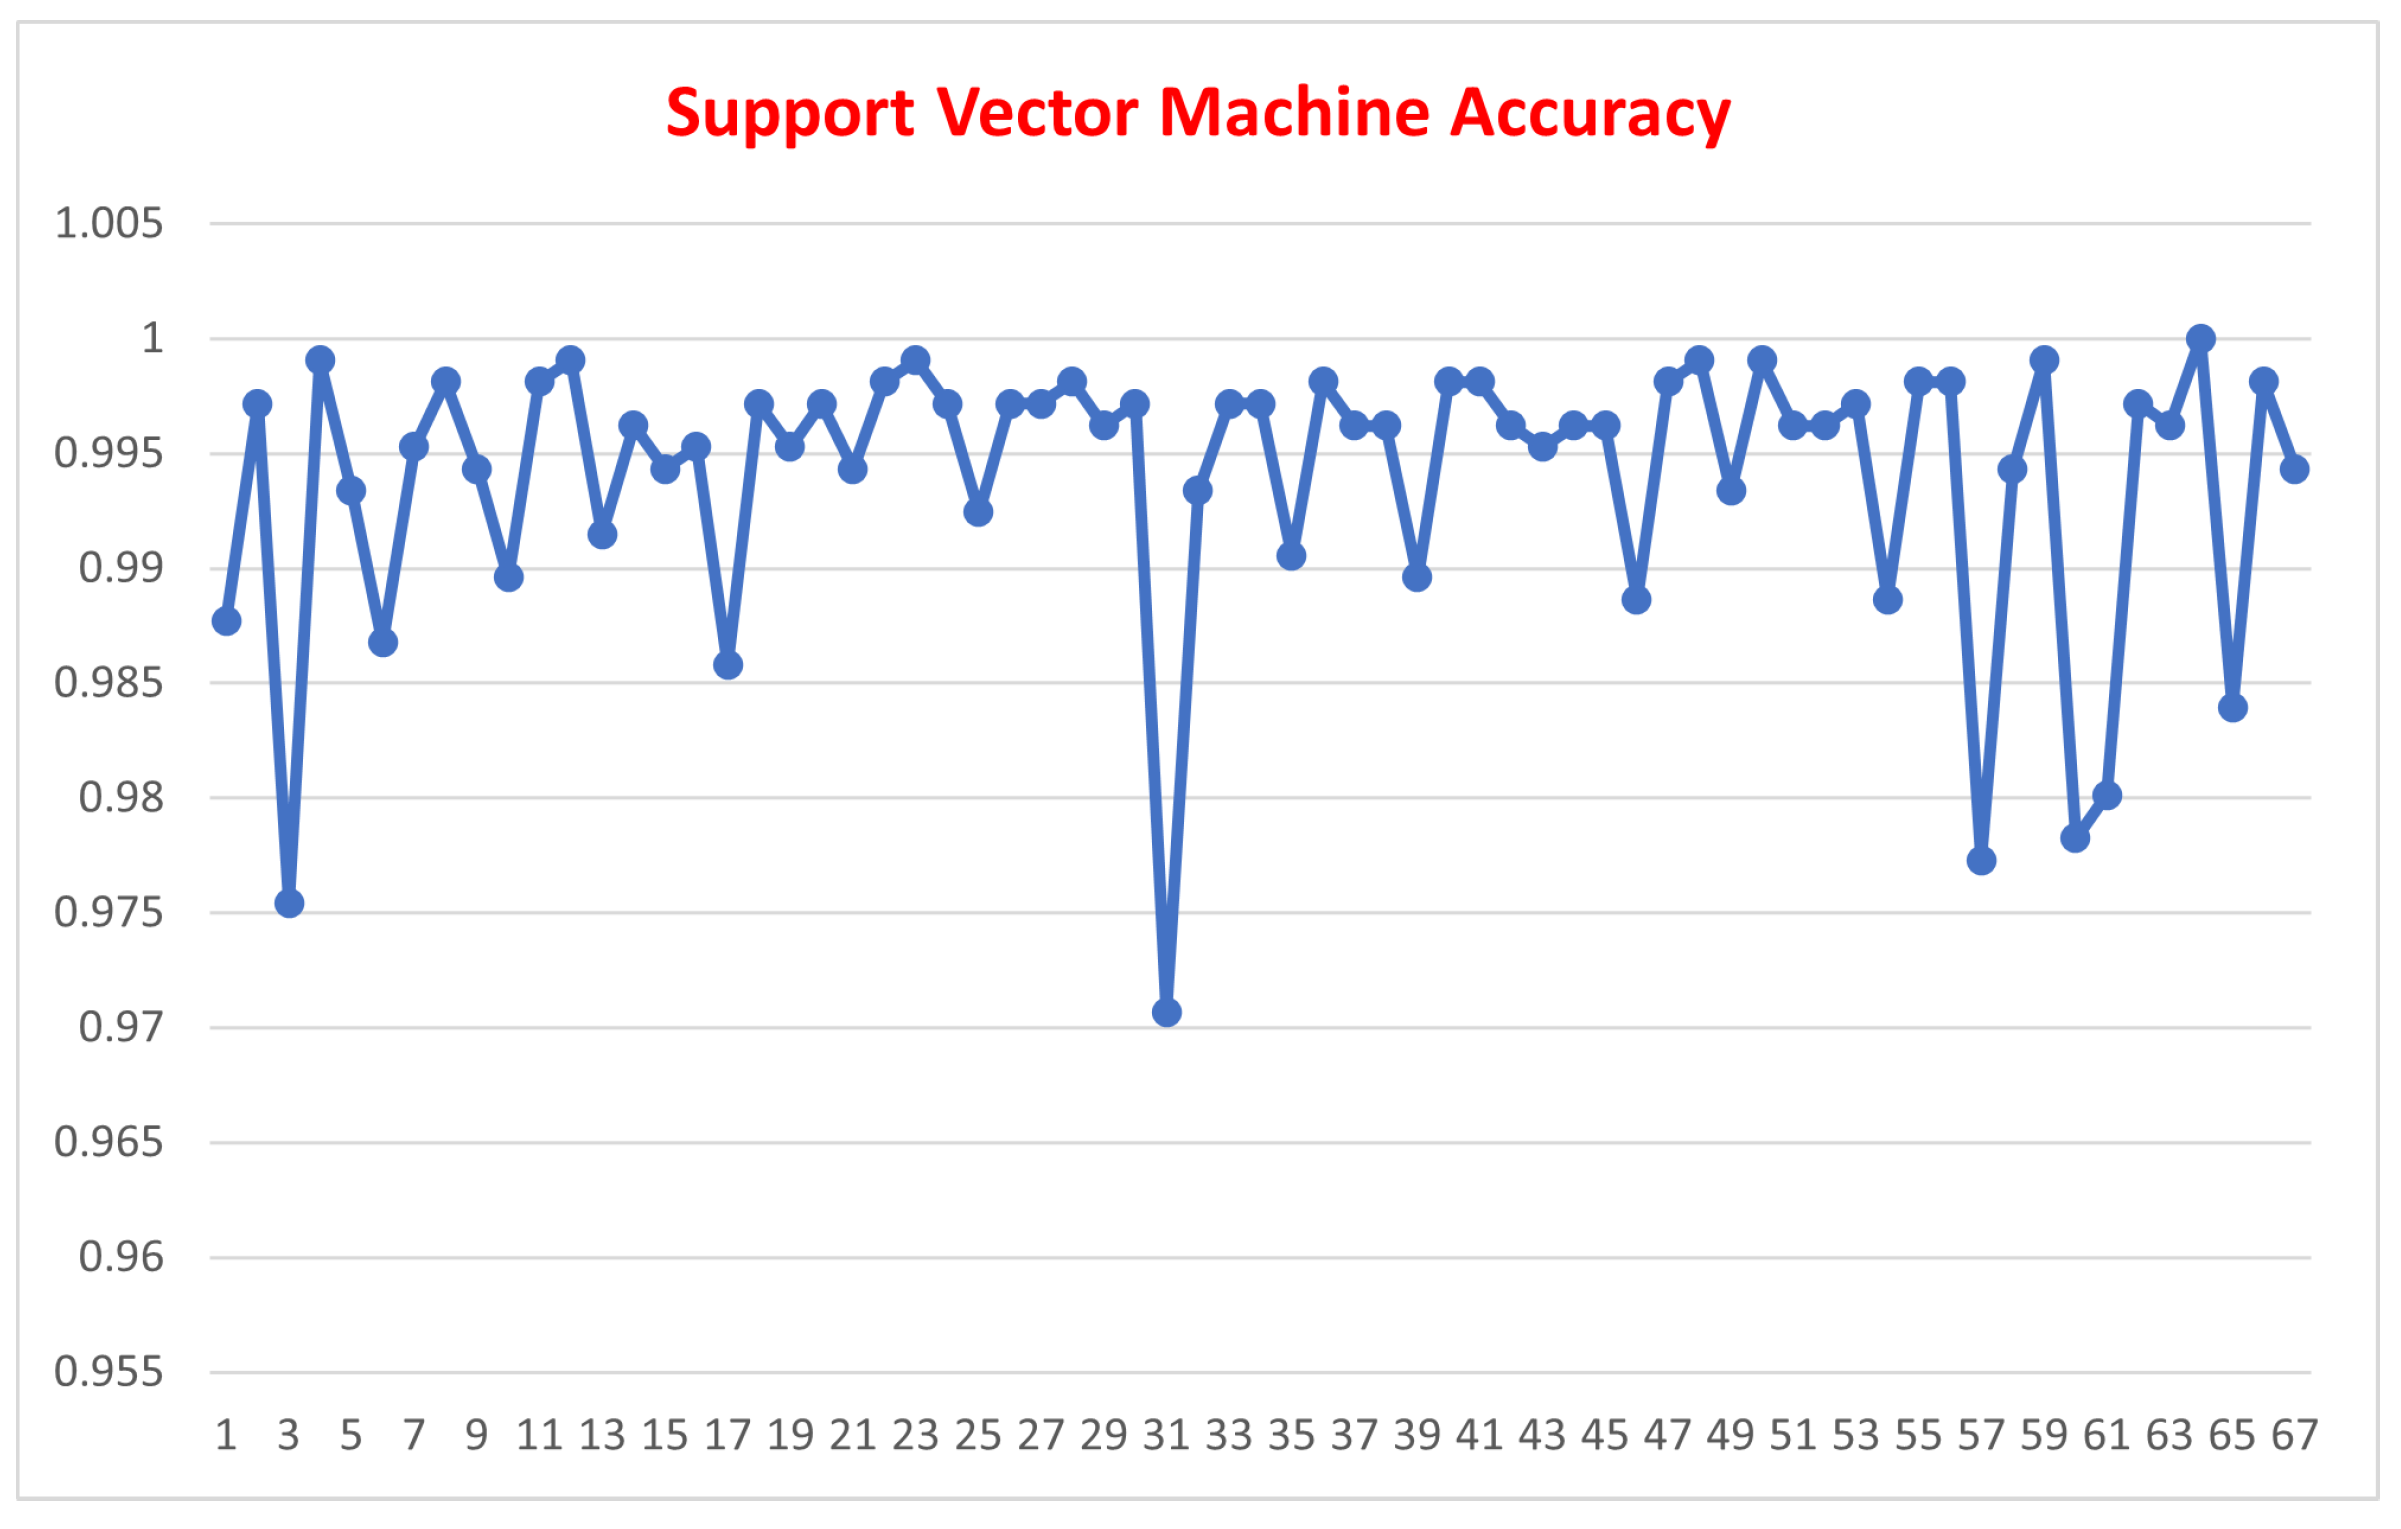
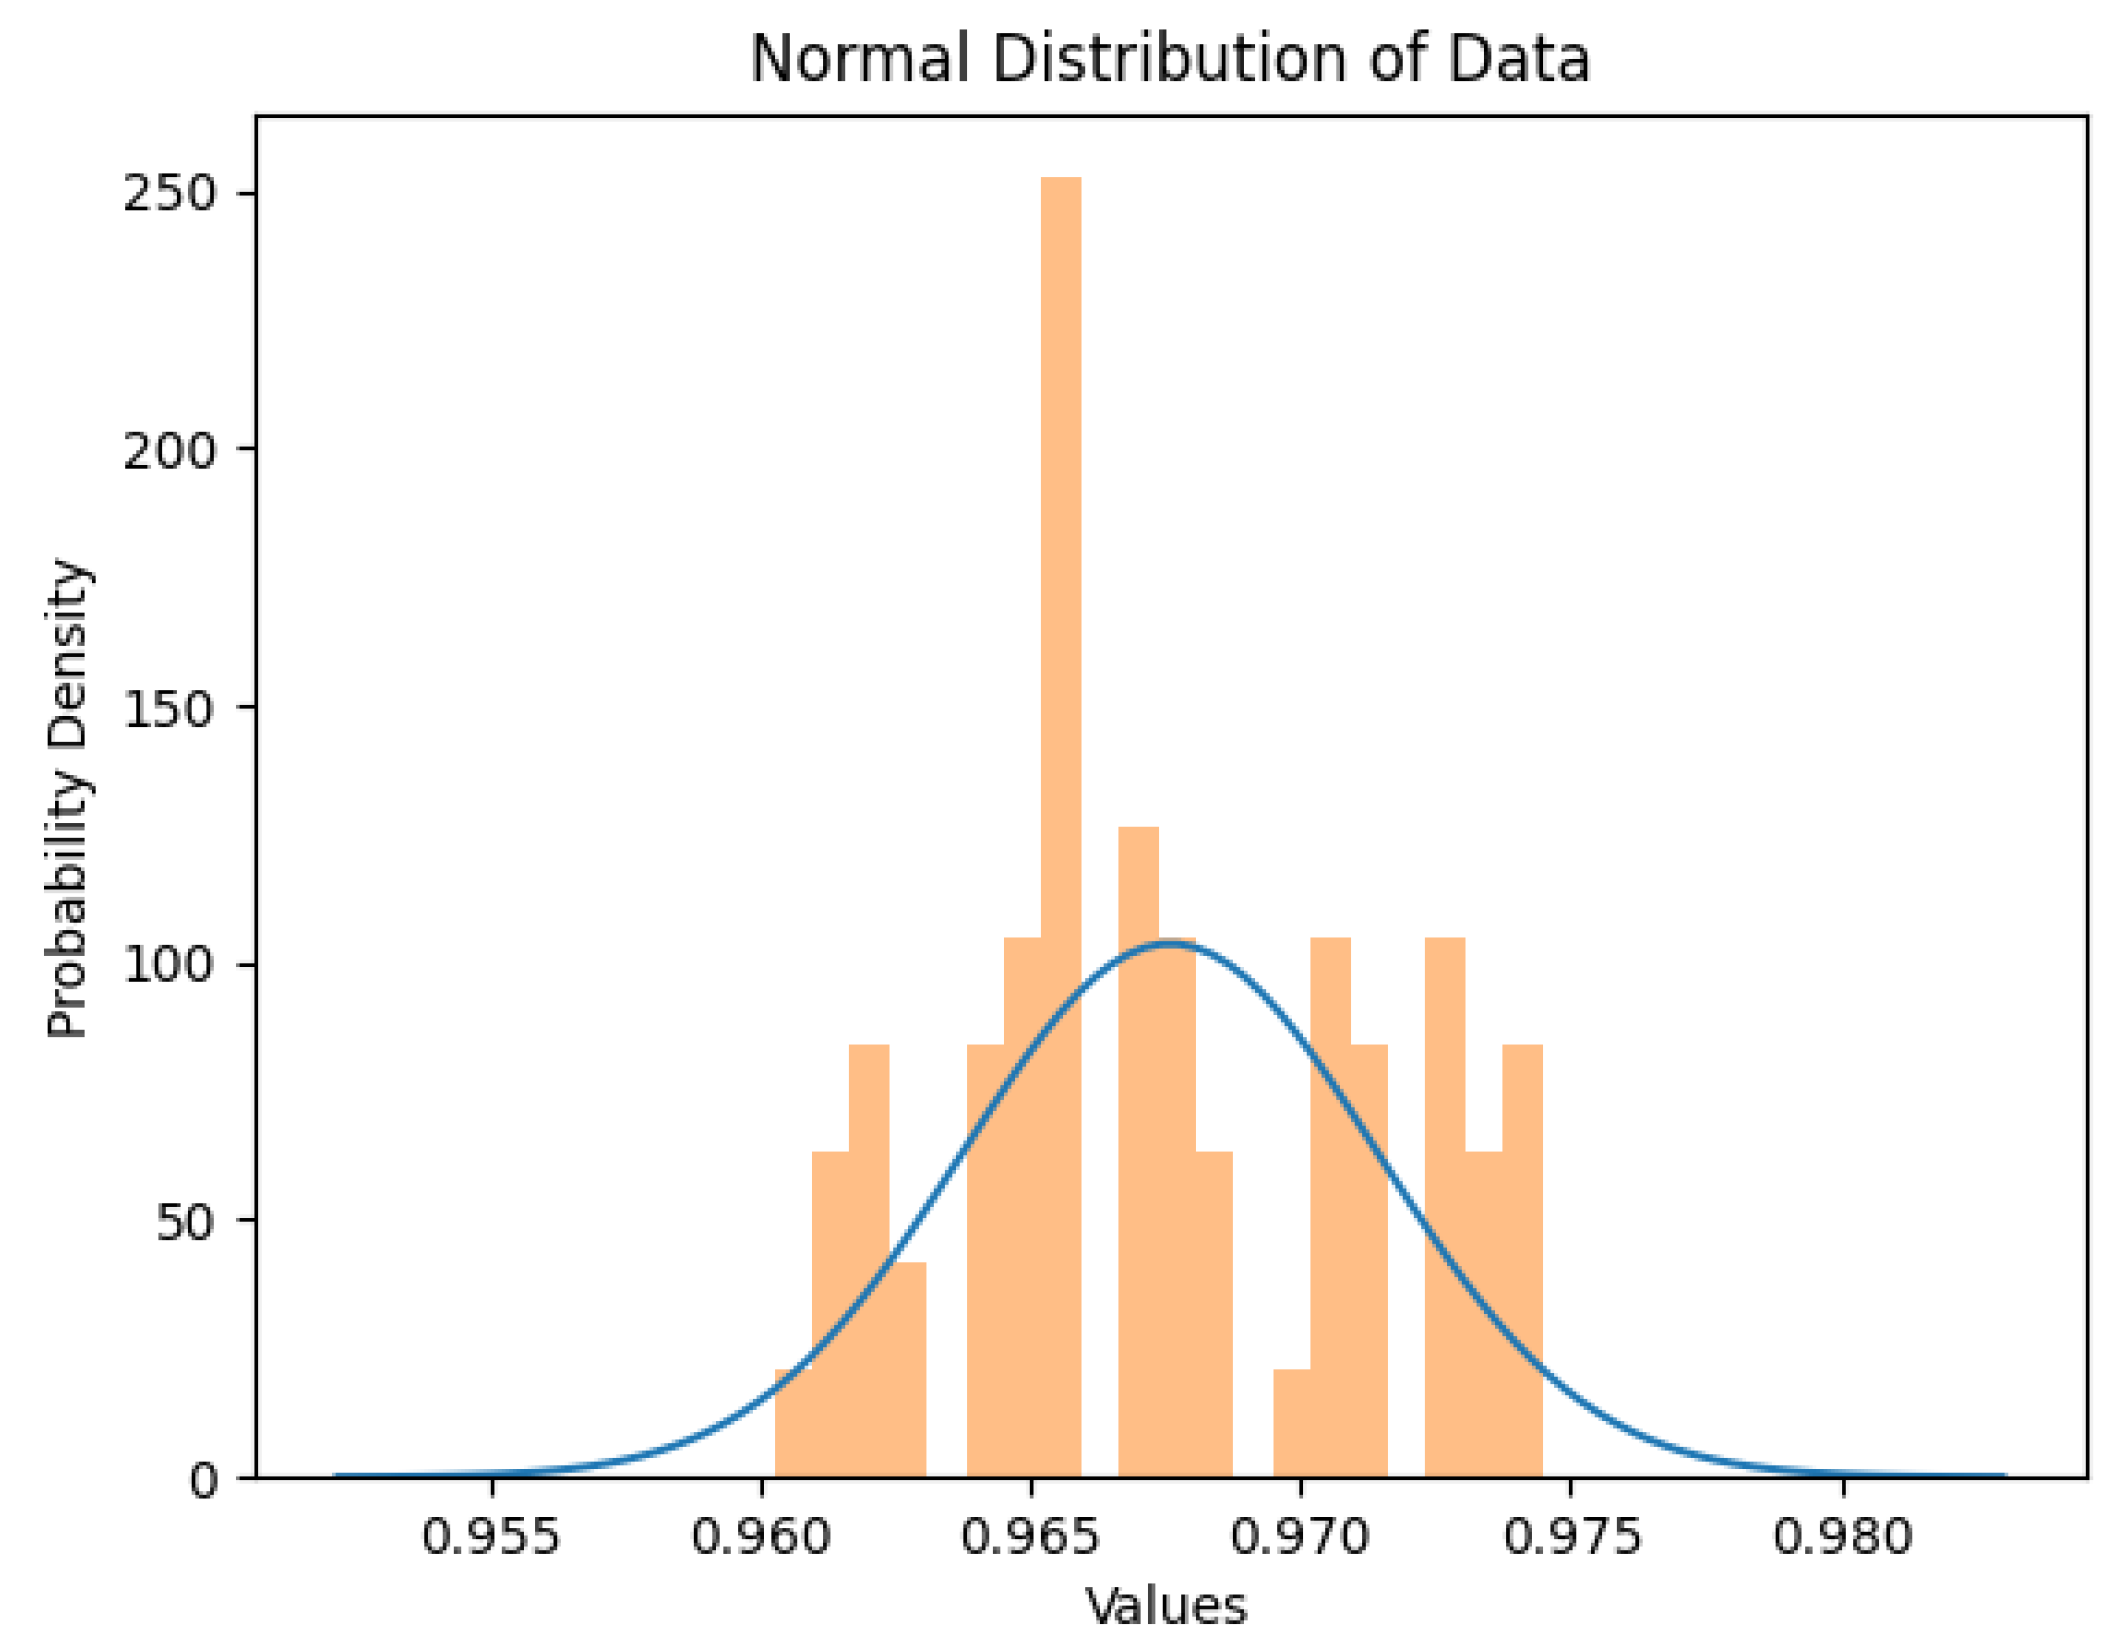
| K Nearest Neighbor | Support Vector Machine | Random Forest | |
|---|---|---|---|
| Mean Value | 96.759 | 99.394 | 99.213 |
| Std. Dev. | 0.0038 | 0.0061 | 0.0029 |
Disclaimer/Publisher’s Note: The statements, opinions and data contained in all publications are solely those of the individual author(s) and contributor(s) and not of MDPI and/or the editor(s). MDPI and/or the editor(s) disclaim responsibility for any injury to people or property resulting from any ideas, methods, instructions or products referred to in the content. |
© 2020 by the authors. Licensee MDPI, Basel, Switzerland. This article is an open access article distributed under the terms and conditions of the Creative Commons Attribution (CC BY) license (https://creativecommons.org/licenses/by/4.0/).


