1. Introduction
The illicit trafficking of nuclear and radioactive materials poses a significant threat to global security, particularly at border crossings and ports. Traditional security measures, such as X-ray systems, have limitations in detecting shielded or dense materials, necessitating the development of more advanced detection techniques. Muon tomography, a technique based on the interaction of cosmic muons with matter, has emerged as a promising solution for homeland security applications [
1,
2].
Cosmic muons are high-energy charged particles produced by the interaction of cosmic rays with the Earth’s atmosphere. Due to their penetrating nature and relatively long lifetime, cosmic muons can traverse dense materials, making them ideal probes for imaging applications [
3,
4]. When cosmic muons interact with materials, they undergo multiple Coulomb scattering, resulting in changes in their trajectory and scattering angles.
Muon tomography utilizes the information obtained from detecting these cosmic muons to reconstruct tomographic images of inspected objects. By measuring the trajectories and scattering angles of muons as they pass through the inspected volume, it is possible to infer the internal structure and composition of the materials within. This non-invasive imaging technique has gained traction in various fields, including nuclear waste imaging and homeland security [
5,
6].
Muon tomography shows great promise for security applications, but current reconstruction algorithms have limitations in terms of complexity and computational efficiency. Although the Point of Closest Approach (POCA) algorithm is effective and fast, its accuracy is lower compared to the Expectation-Maximization Maximum Likelihood (EM-ML) algorithm [
7]. However, the EM-ML algorithm is highly complex, difficult to implement, and requires significant computational time. Consequently, there is a need to develop a faster algorithm that offers higher accuracy than POCA while maintaining shorter computational times.
To address this research gap, we propose a novel reconstruction algorithm, termed the Slope Intersection (SI) algorithm. This algorithm simplifies the reconstruction process by calculating the scattering points of materials using hit-position information obtained from detector planes. By leveraging a simple geometrical approach, the SI algorithm offers fast and efficient reconstruction of tomographic images, making it well-suited for real-time applications in homeland security.
2. Challenges in Muon Tomography Station
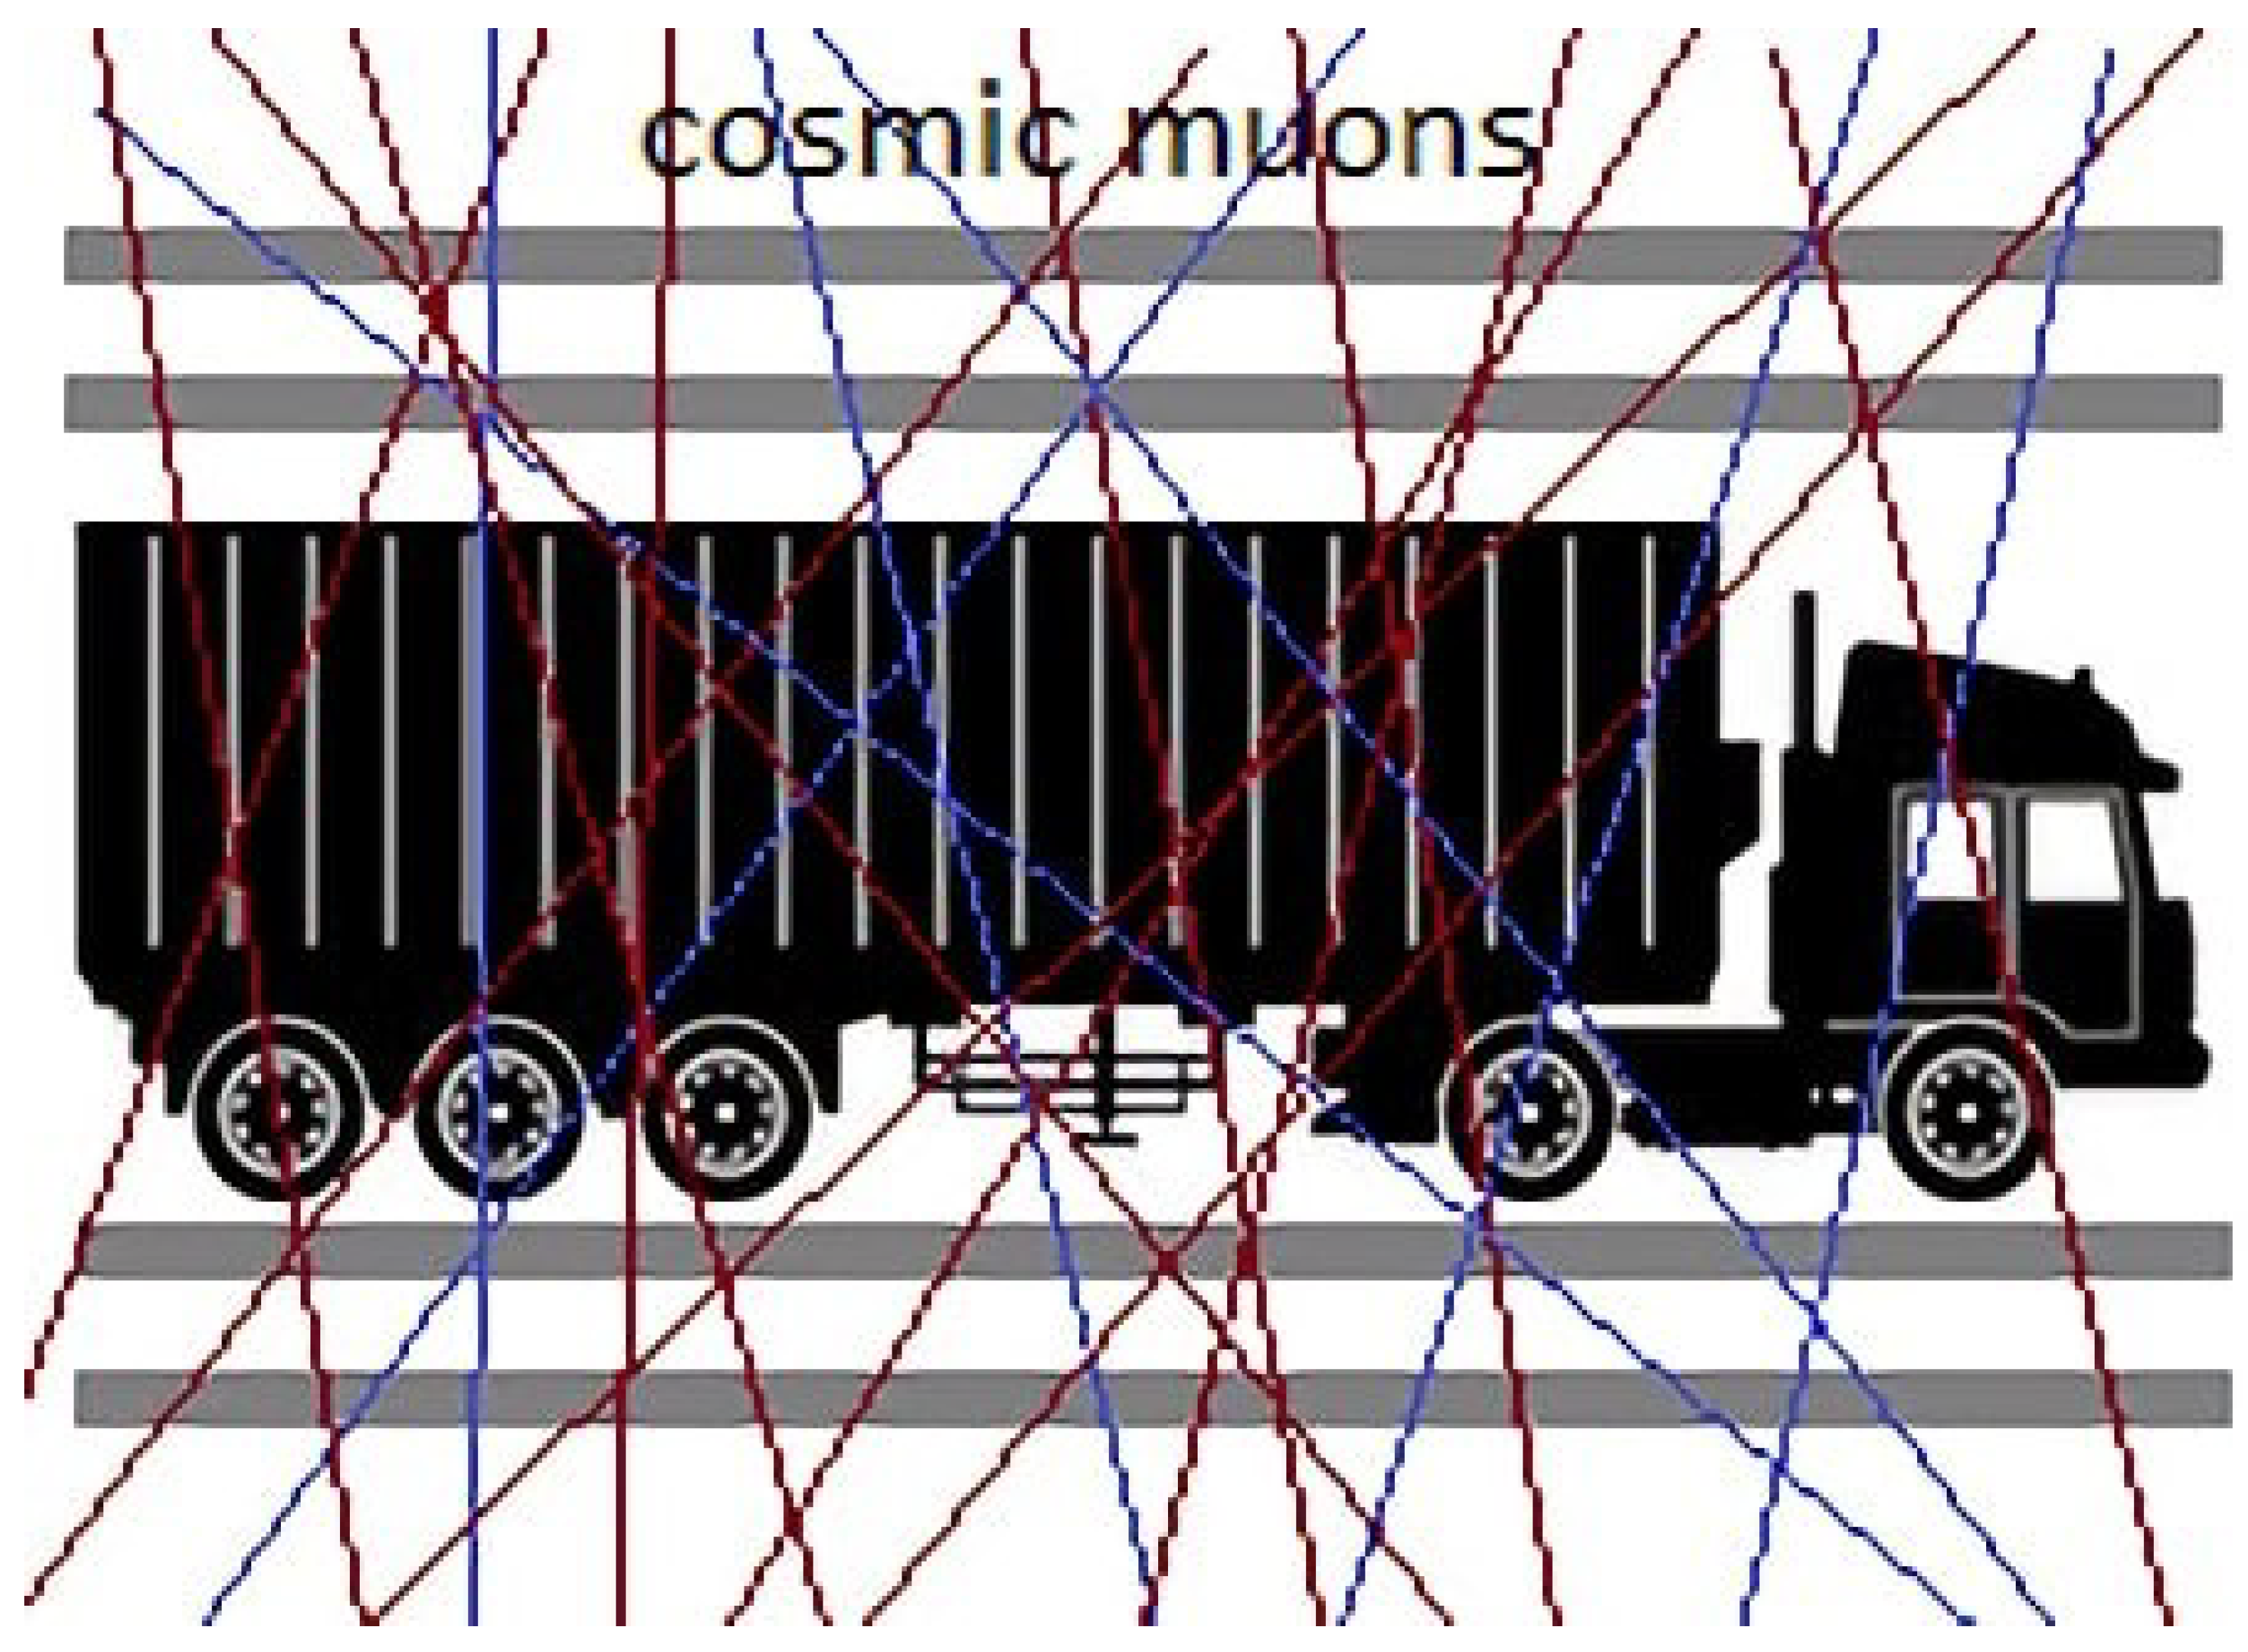
The general concept of muon tomography for container scanning is illustrated in
Figure 1. A muon tomography station typically consists of a set of detector planes placed above and below the sample volume to provide information regarding the hit position and angle of the incoming and outgoing muon tracks, which are used as the basis for reconstruction.
It is possible to reconstruct the muon track and obtain the scattering angle with information from the upper and lower detectors. The deviation angle distribution is approximately a zero-mean Gaussian, in which the variance is related to the radiation length of the material that the muon passes through [
8,
9].
Clearly, there are some problems associated with muon tomography. Firstly, muons do not travel in a straight line through the sample volume. Secondly, natural muons have limited flux and come from directions with wide angular distribution around the zenith. Finally, the multiple Coulomb scattering angle is stochastic and is approximated as a zero-mean Gaussian, but there are long tails in the actual distribution.
To achieve good precision in the reconstruction of the tomographic image, a high-quality tracking muon detector is required. On the other hand, imaging algorithms of good quality with relatively short computing time are also needed. Therefore, along with designing a high-quality detector system, utilizing effective imaging algorithms has a significant impact on the performance of muon tomography systems.
3. Reconstruction Algorithm
A simple reconstruction algorithm, which can be comparable with the POCA method, is proposed. In this method, the space coordinates of the target materials are calculated using the hit-position information measured by the detector planes in the muon tomography station. The intersection point of the incoming and outgoing tracks in the xz and yz projection planes is considered as the scattering point of the target material. In addition to being simple and easy to use, this method also allows obtaining a three-dimensional image of the materials. Considering the passive nature and high energy of the muons, we can think of the traces of the muons passing through the detector planes as straight lines because the scattering angles from the detector planes and air molecules are very small compared to the target materials.
For a muon tomography system, we need at least four detector planes so that we can identify the trace of the muon and approximate the muon trace as a straight line. As seen in
Figure 2, cosmic muons pass through the top two detector planes, scatter from the atoms of the possible hazardous material placed between the top and bottom detectors, and then pass through the bottom two detector planes. The interaction points of muons at the detectors or hit-positions are
and
where i = 1,2,3,4.
3.1. Traditional POCA Algorithm
The POCA algorithm makes the simplified assumption that the muon scattering occurs at a single point. It therefore searches for the geometrical point of closest approach
between the incoming
and outgoing
reconstructed track directions with respect to the inspected volume. The positions of the incoming and outgoing points are given by:
Where are two points on the incoming and outgoing tracks, , , , , , , .
3.2. SI Algorithm
The SI algorithm introduces an alternative approach by considering the slopes of the muon tracks in both the
and
planes. This method is designed to improve the accuracy of the scattering point estimation while maintaining computational efficiency. The SI algorithm calculates the slopes and intercepts of the muon tracks in the
,
, and
planes:
The intersection points
,
,
,
,
, and
are:
Finally, the scattering point coordinates
are:
In the equations, a and c represent the slopes, and b and d represent the intercepts of the incoming and outgoing tracks, respectively, with subscripts , and denoting the sections of the inspected volume. The calculation of the scattering point involves determining the intersection of the tracks in the , and planes.
3.3. Comparison of POCA and SI Algorithms
The POCA algorithm is widely used due to its simplicity and computational efficiency. However, while it provides fast computation, its image resolution is not as high compared to statistical, iterative algorithms such as the EM-ML algorithm. The EM-ML algorithm, though offering better image resolution, involves lengthy computation times due to its iterative nature, making it impractical for national security applications.
The primary advantage of the POCA algorithm lies in its simplicity and short computation time. In comparison, the SI algorithm offers advantages over POCA in terms of both simplicity and computational speed while maintaining comparable image acquisition quality. In the following sections, the SI algorithm will be compared with the Geant4 simulation method.
4. Simulation Setup
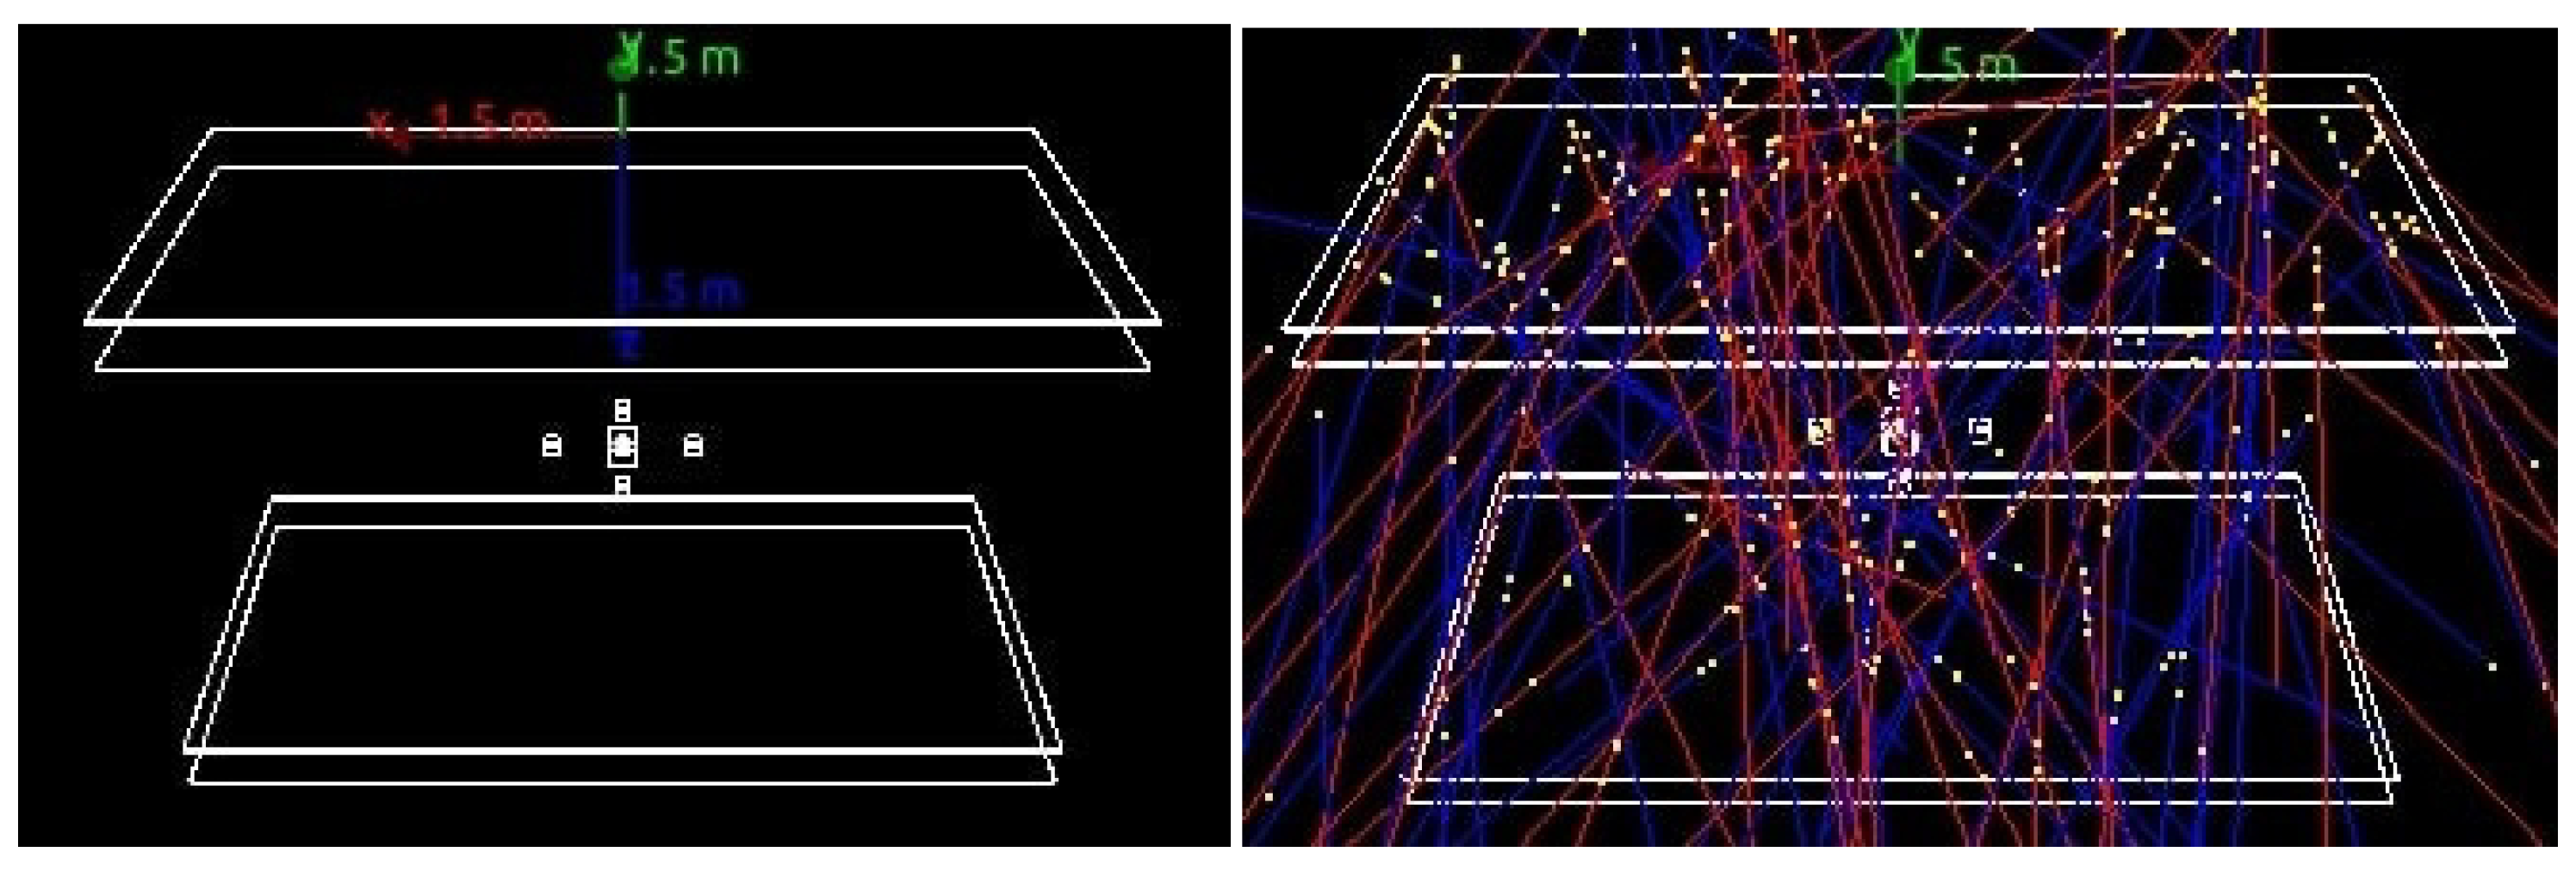
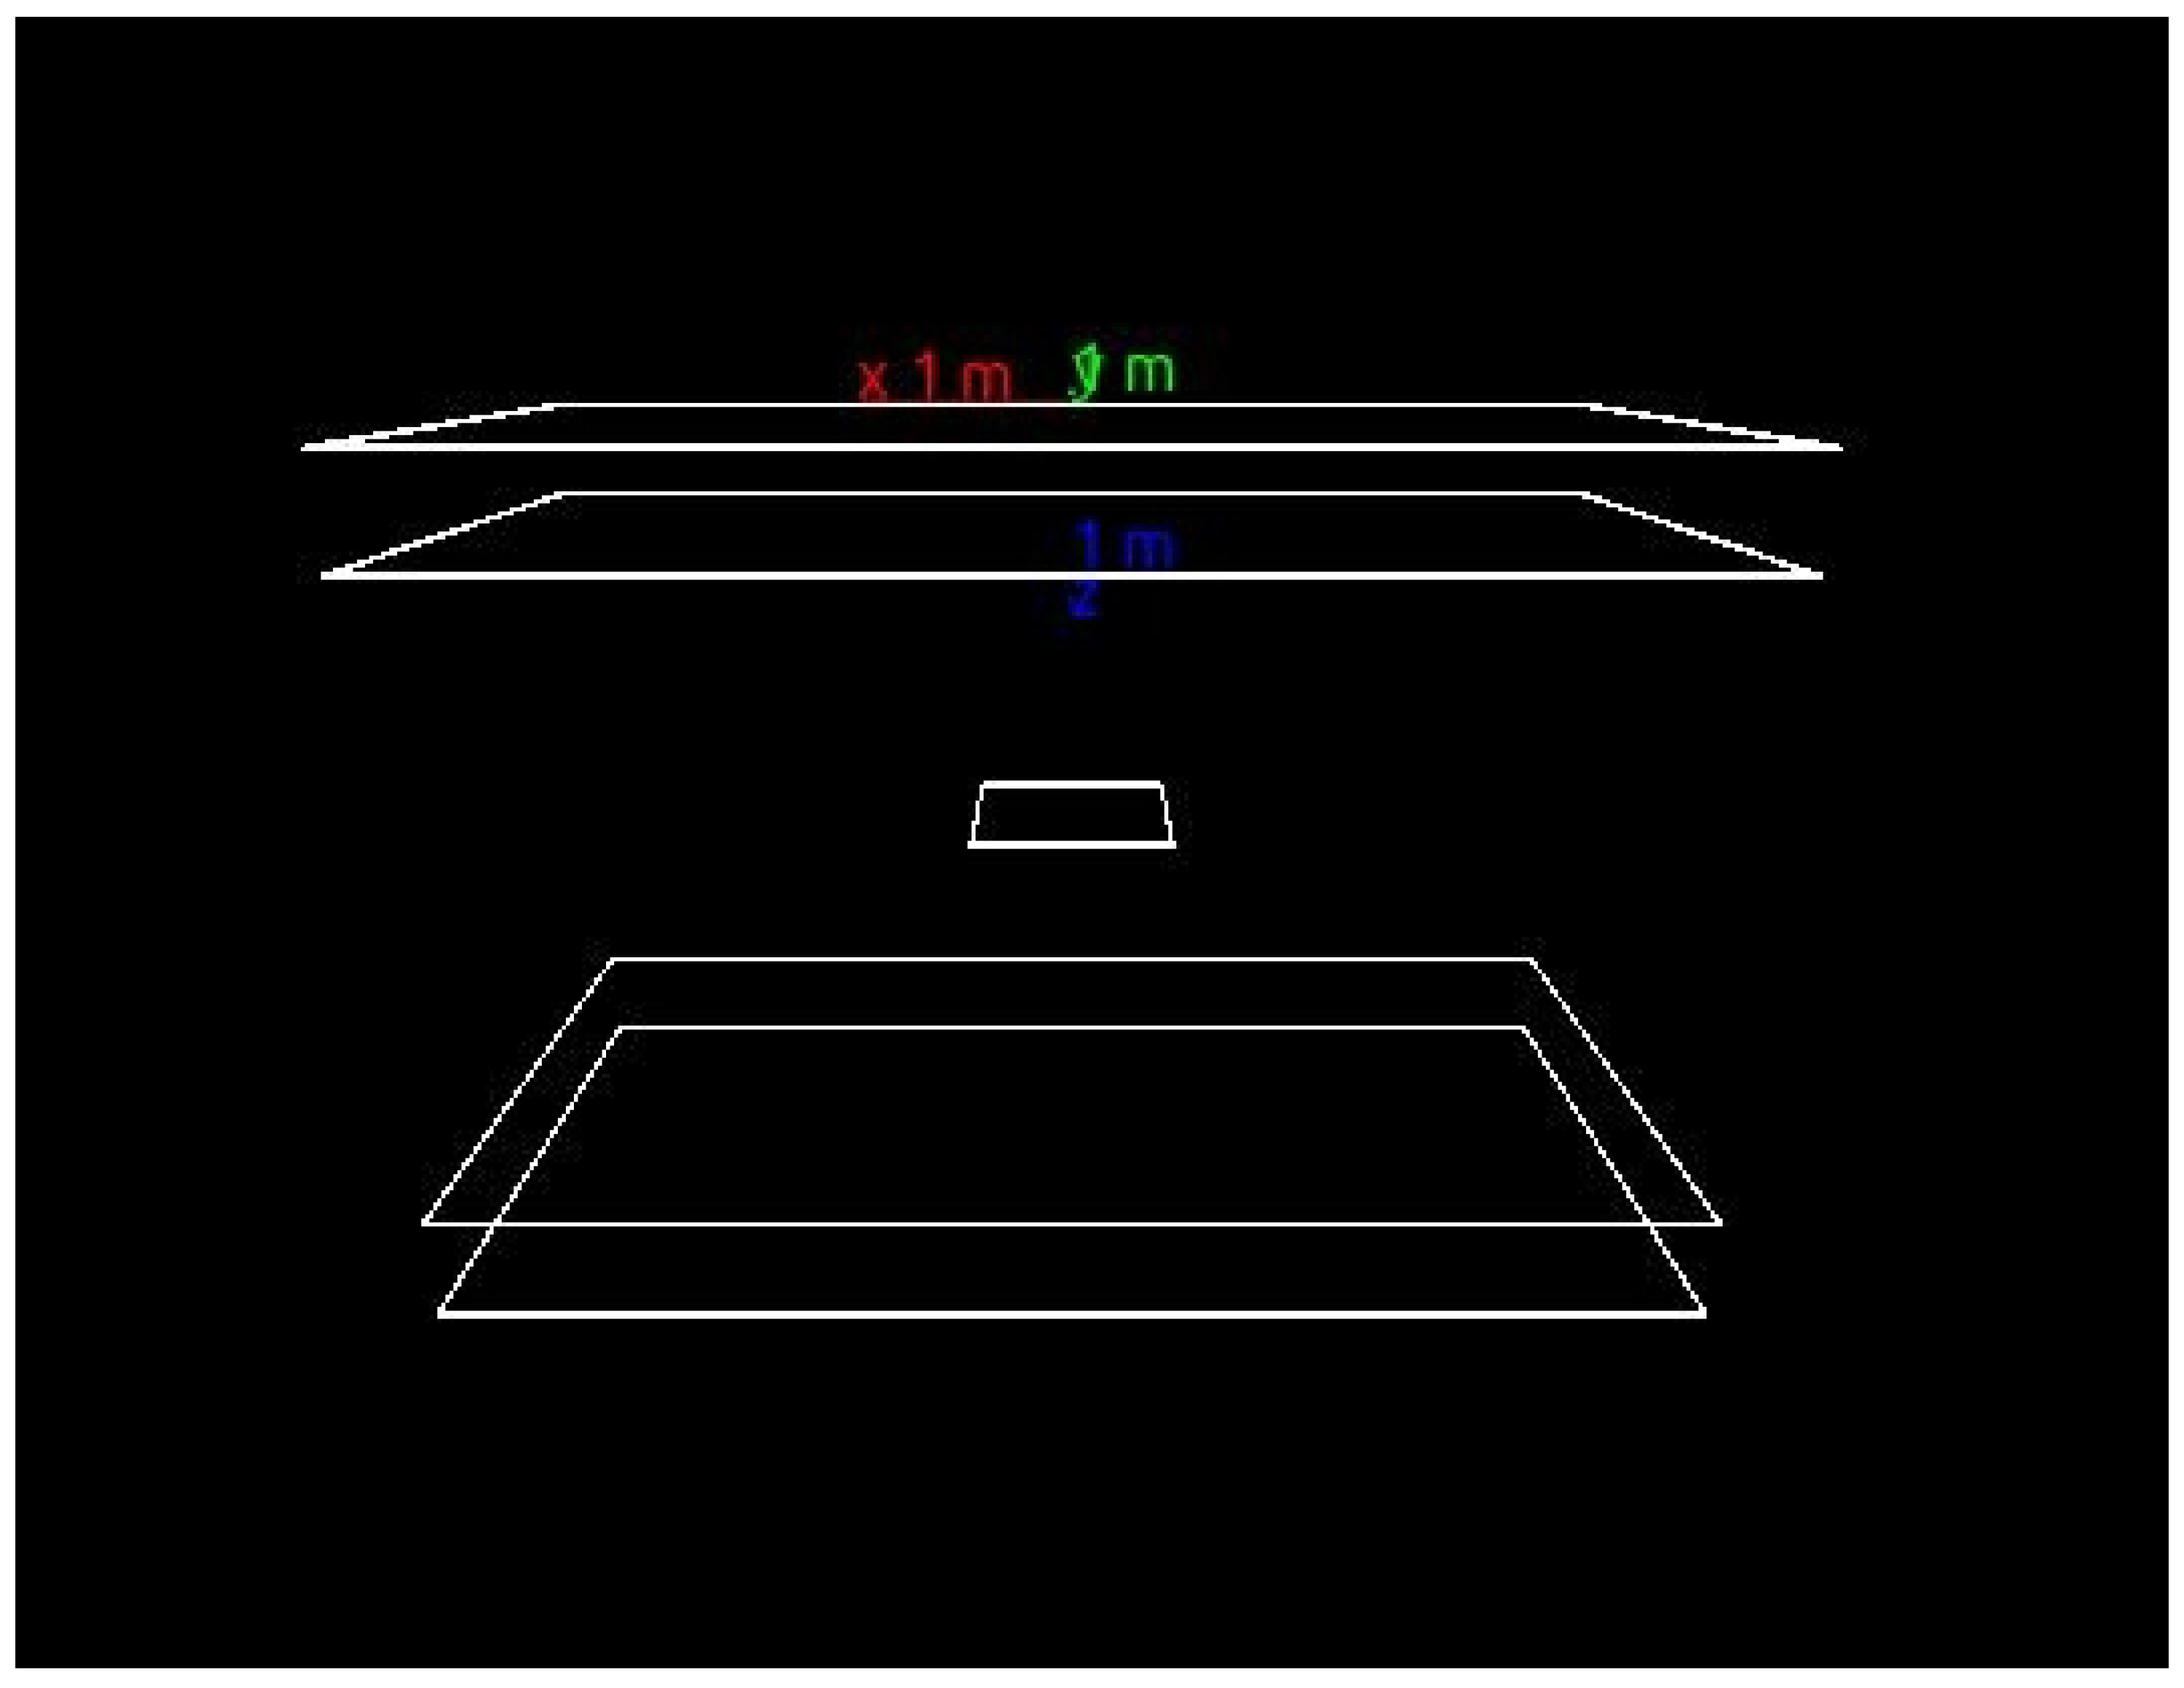
The typical geometry of the muon tomography station for simulation study is shown in
Figure 3. The muon tomography station includes tracking detectors at the top and bottom. Each tracker consists of two 10mm thick plastic scintillator detector plates with 20cm separation. The upper and lower tracking detectors have an area of
with 3 m spacing.
We placed five material blocks representing different Z values; low-Z: Aluminium (Al), medium-Z: Iron (Fe) and high-Z: Lead (Pb), Uranium (U) with typical sizes of
in the middle of the muon tomography station for a simple target scenario that simulates the real situation with Geant4 simulation package (Geant4-11.1.3) [
10,
11]. Monte Carlo cosmic ray generator (CRY) package was used for the simulation [
12,
13].
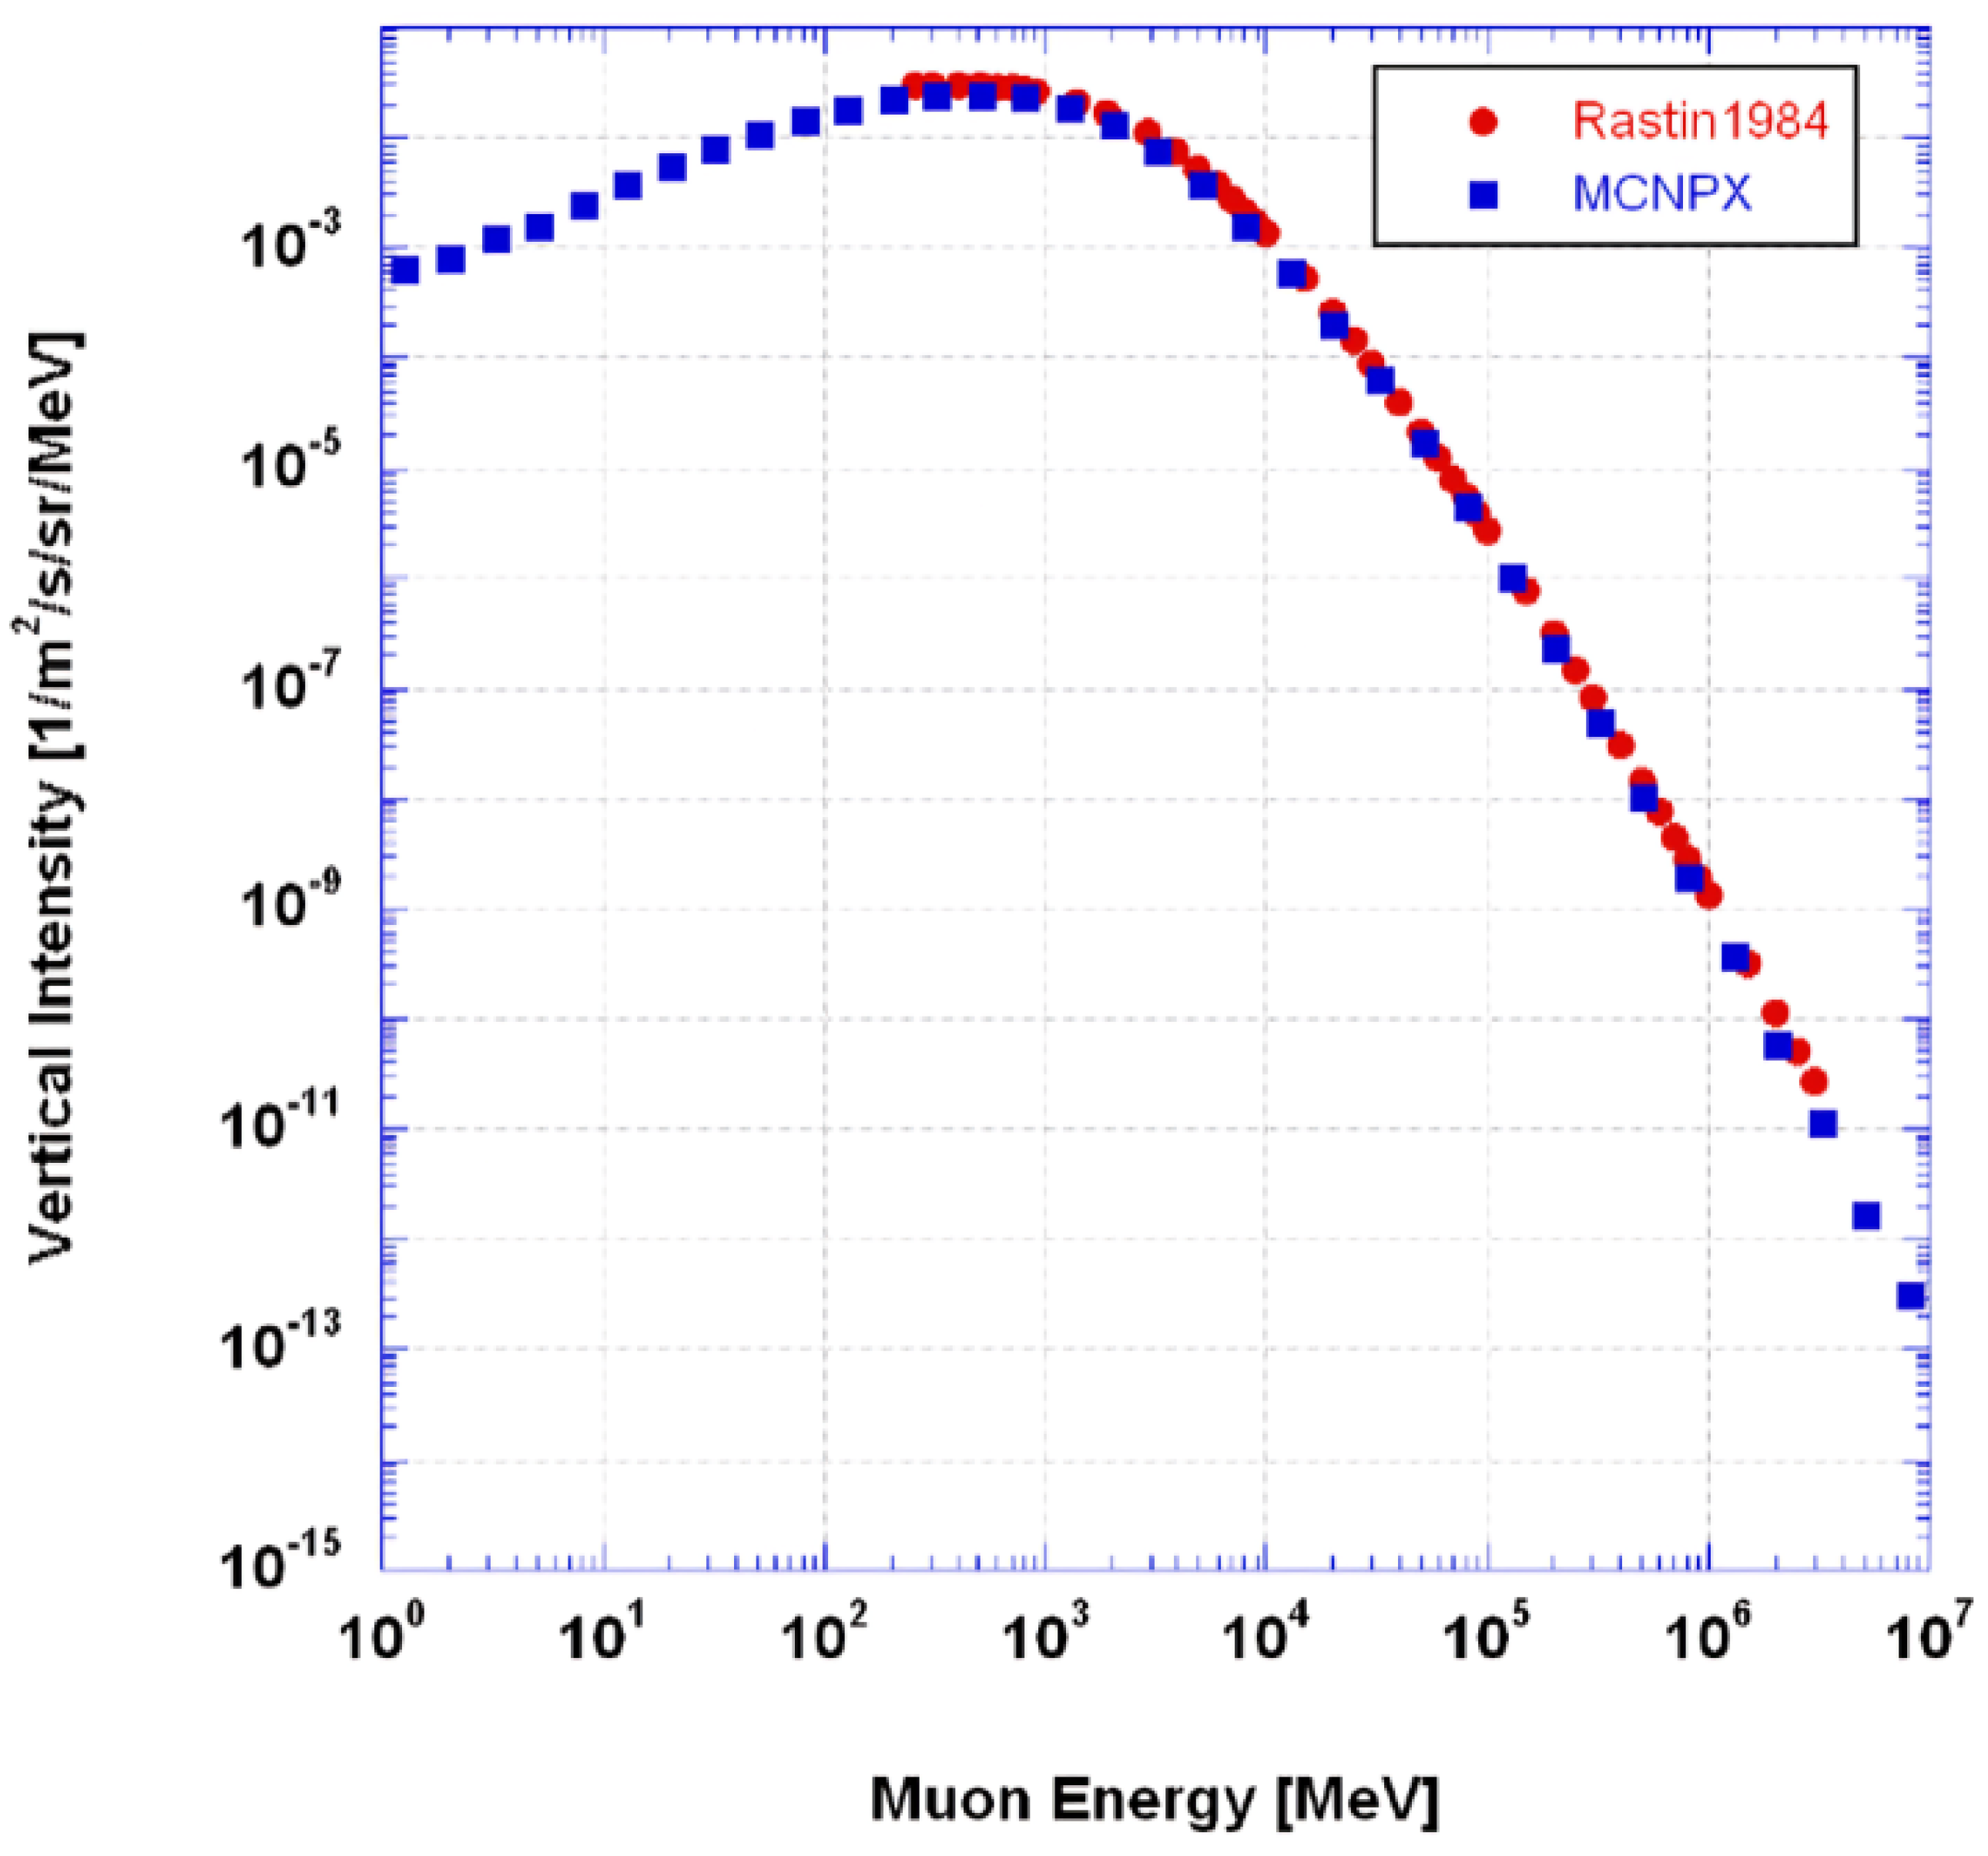
Muons are generated above the horizontal plane with an angular distribution and energy spectrum corresponding to cosmic ray muons at sea level (As can be seen in
Figure 4). The generator was interfaced with Geant4 for simulating the geometry of the muon tomography station, including interactions of the muons with targets, including multiple scattering. The natural flux of cosmic ray muons is approximately
[
14]. Therefore,
events were generated, which is equivalent to about 10 minutes of exposure time in real conditions.
We implemented uncertainties for the hit-positions due to the fact that there are measuring errors in the actual application. Hit-positions are smeared with a Gaussian of width equal to the detector position resolution as:
Where
p is the WLS fiber separation. We chose a 10 mm pitch length for our application in which plastic scintillator with WLS fiber-embedded tracker detectors are used. Similar detector systems for muon tomography applications are reported in [
15].
5. Results
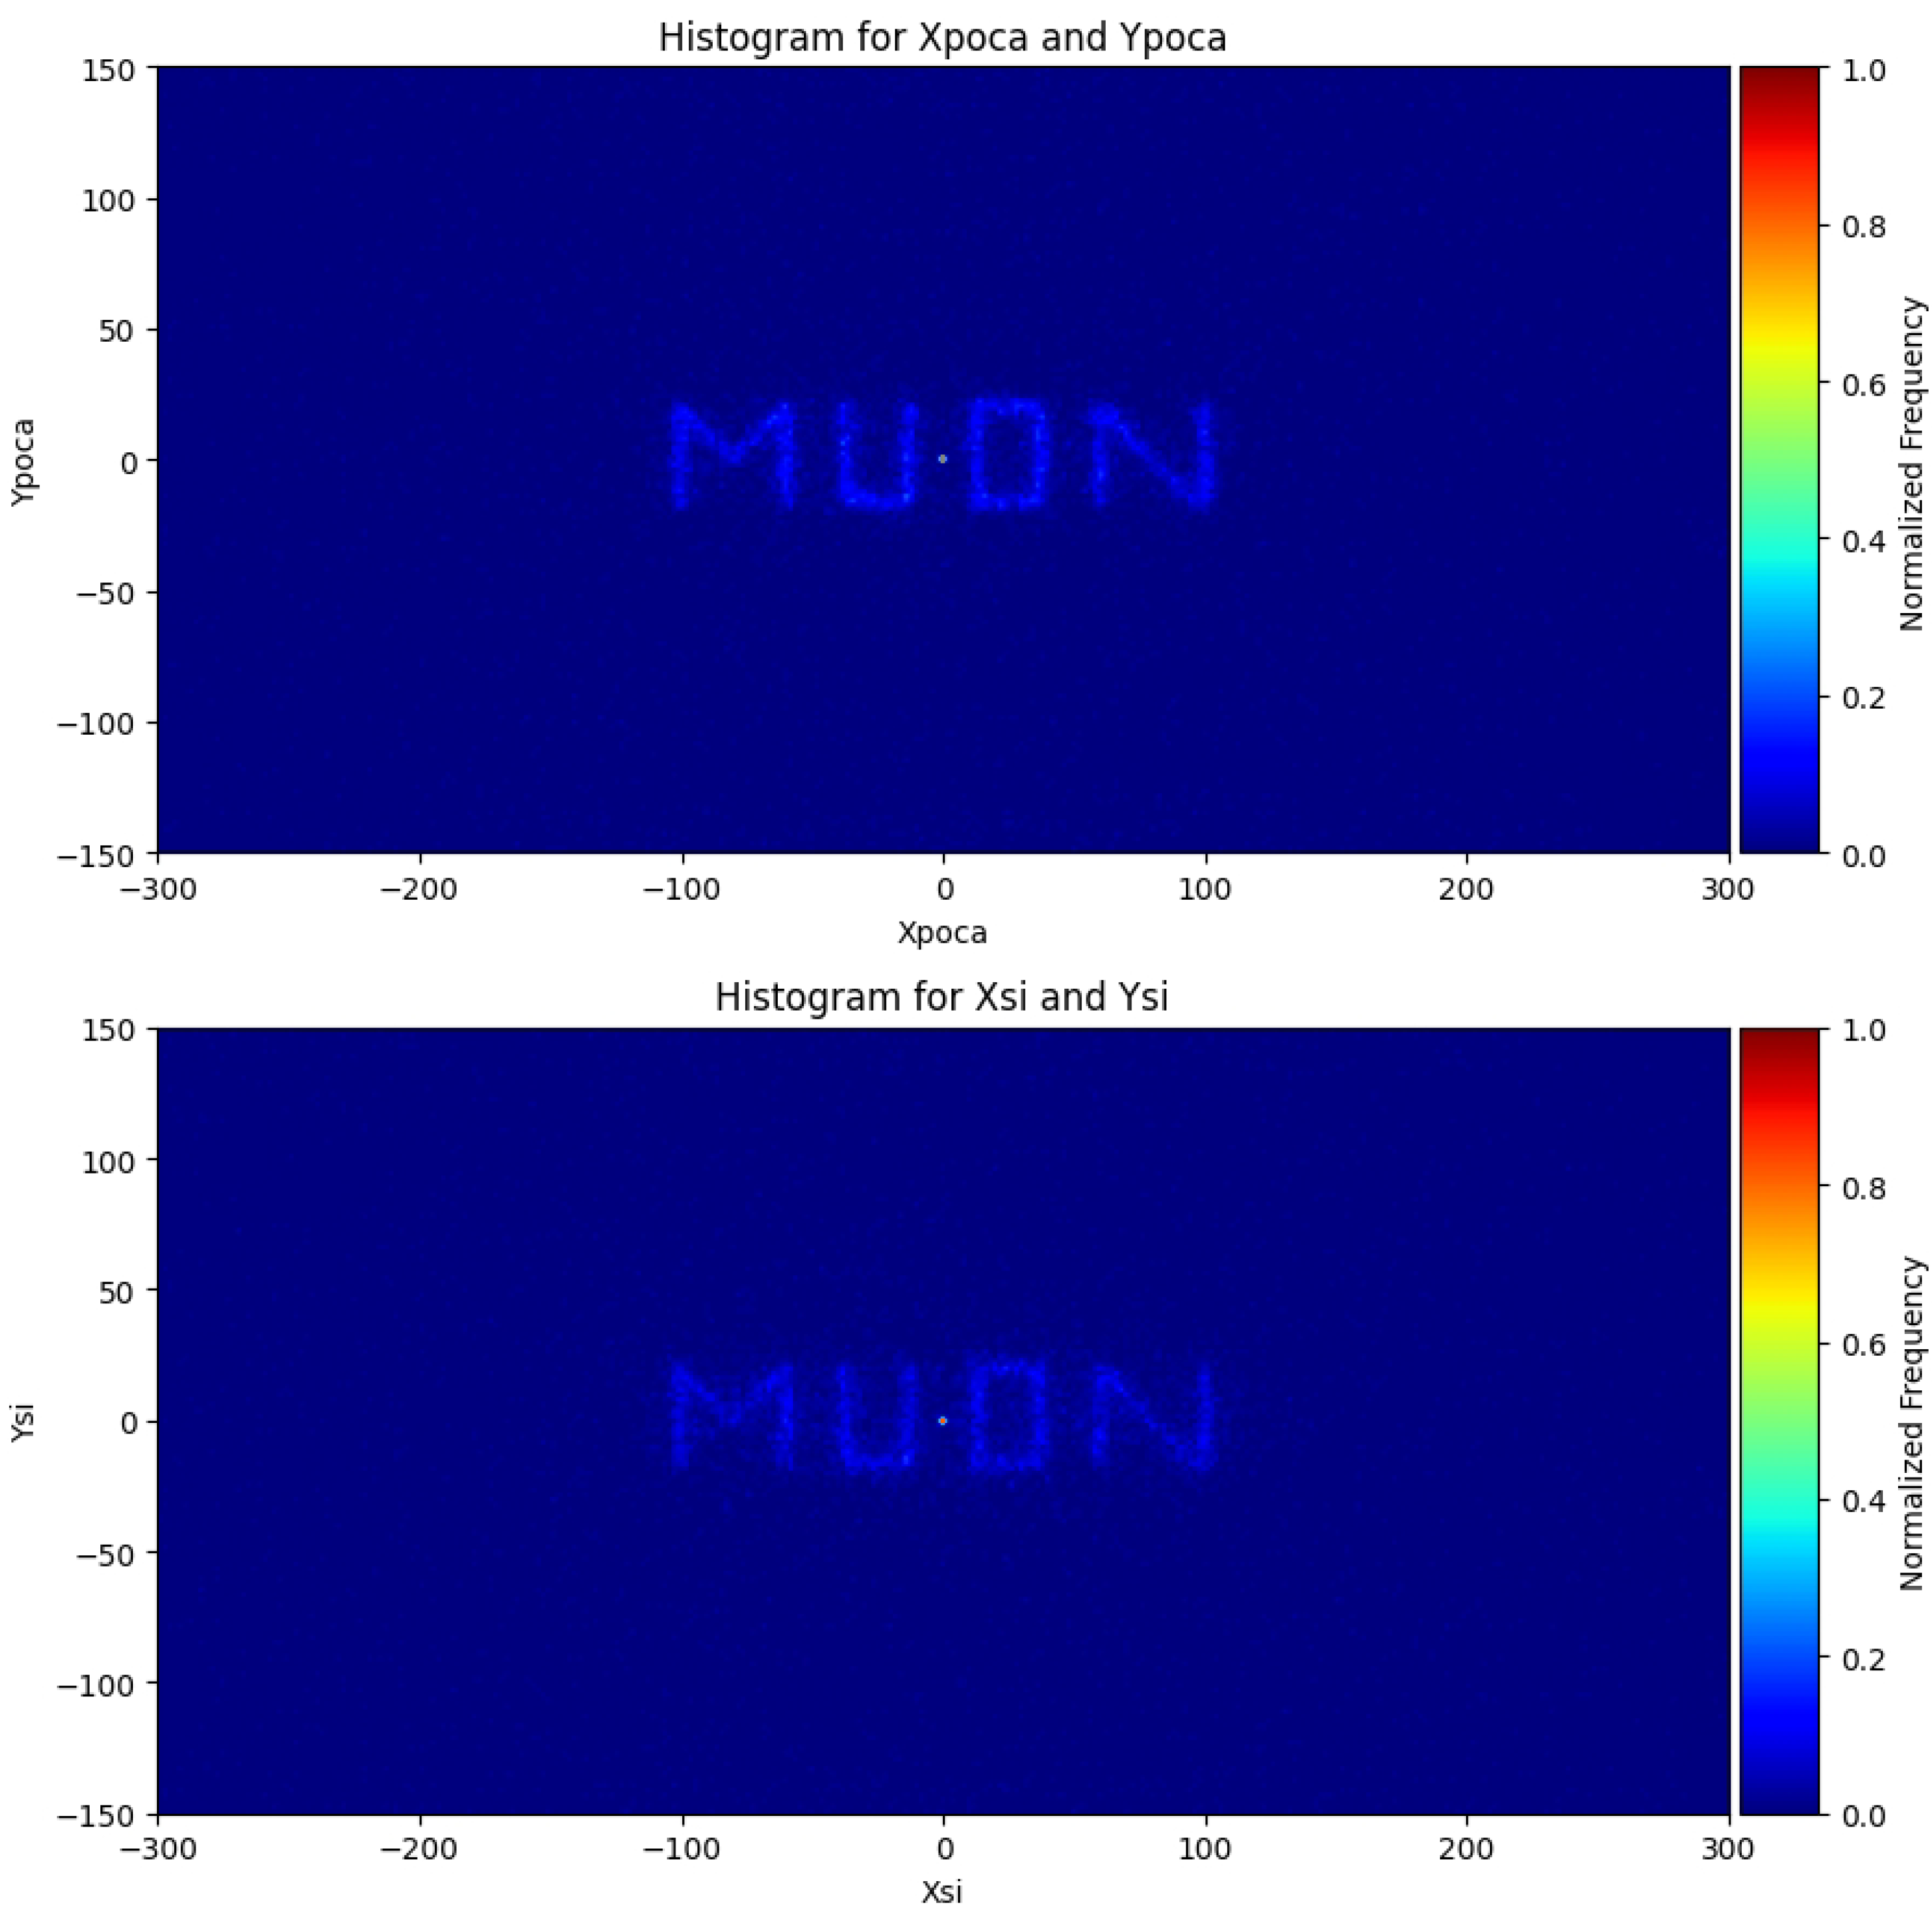
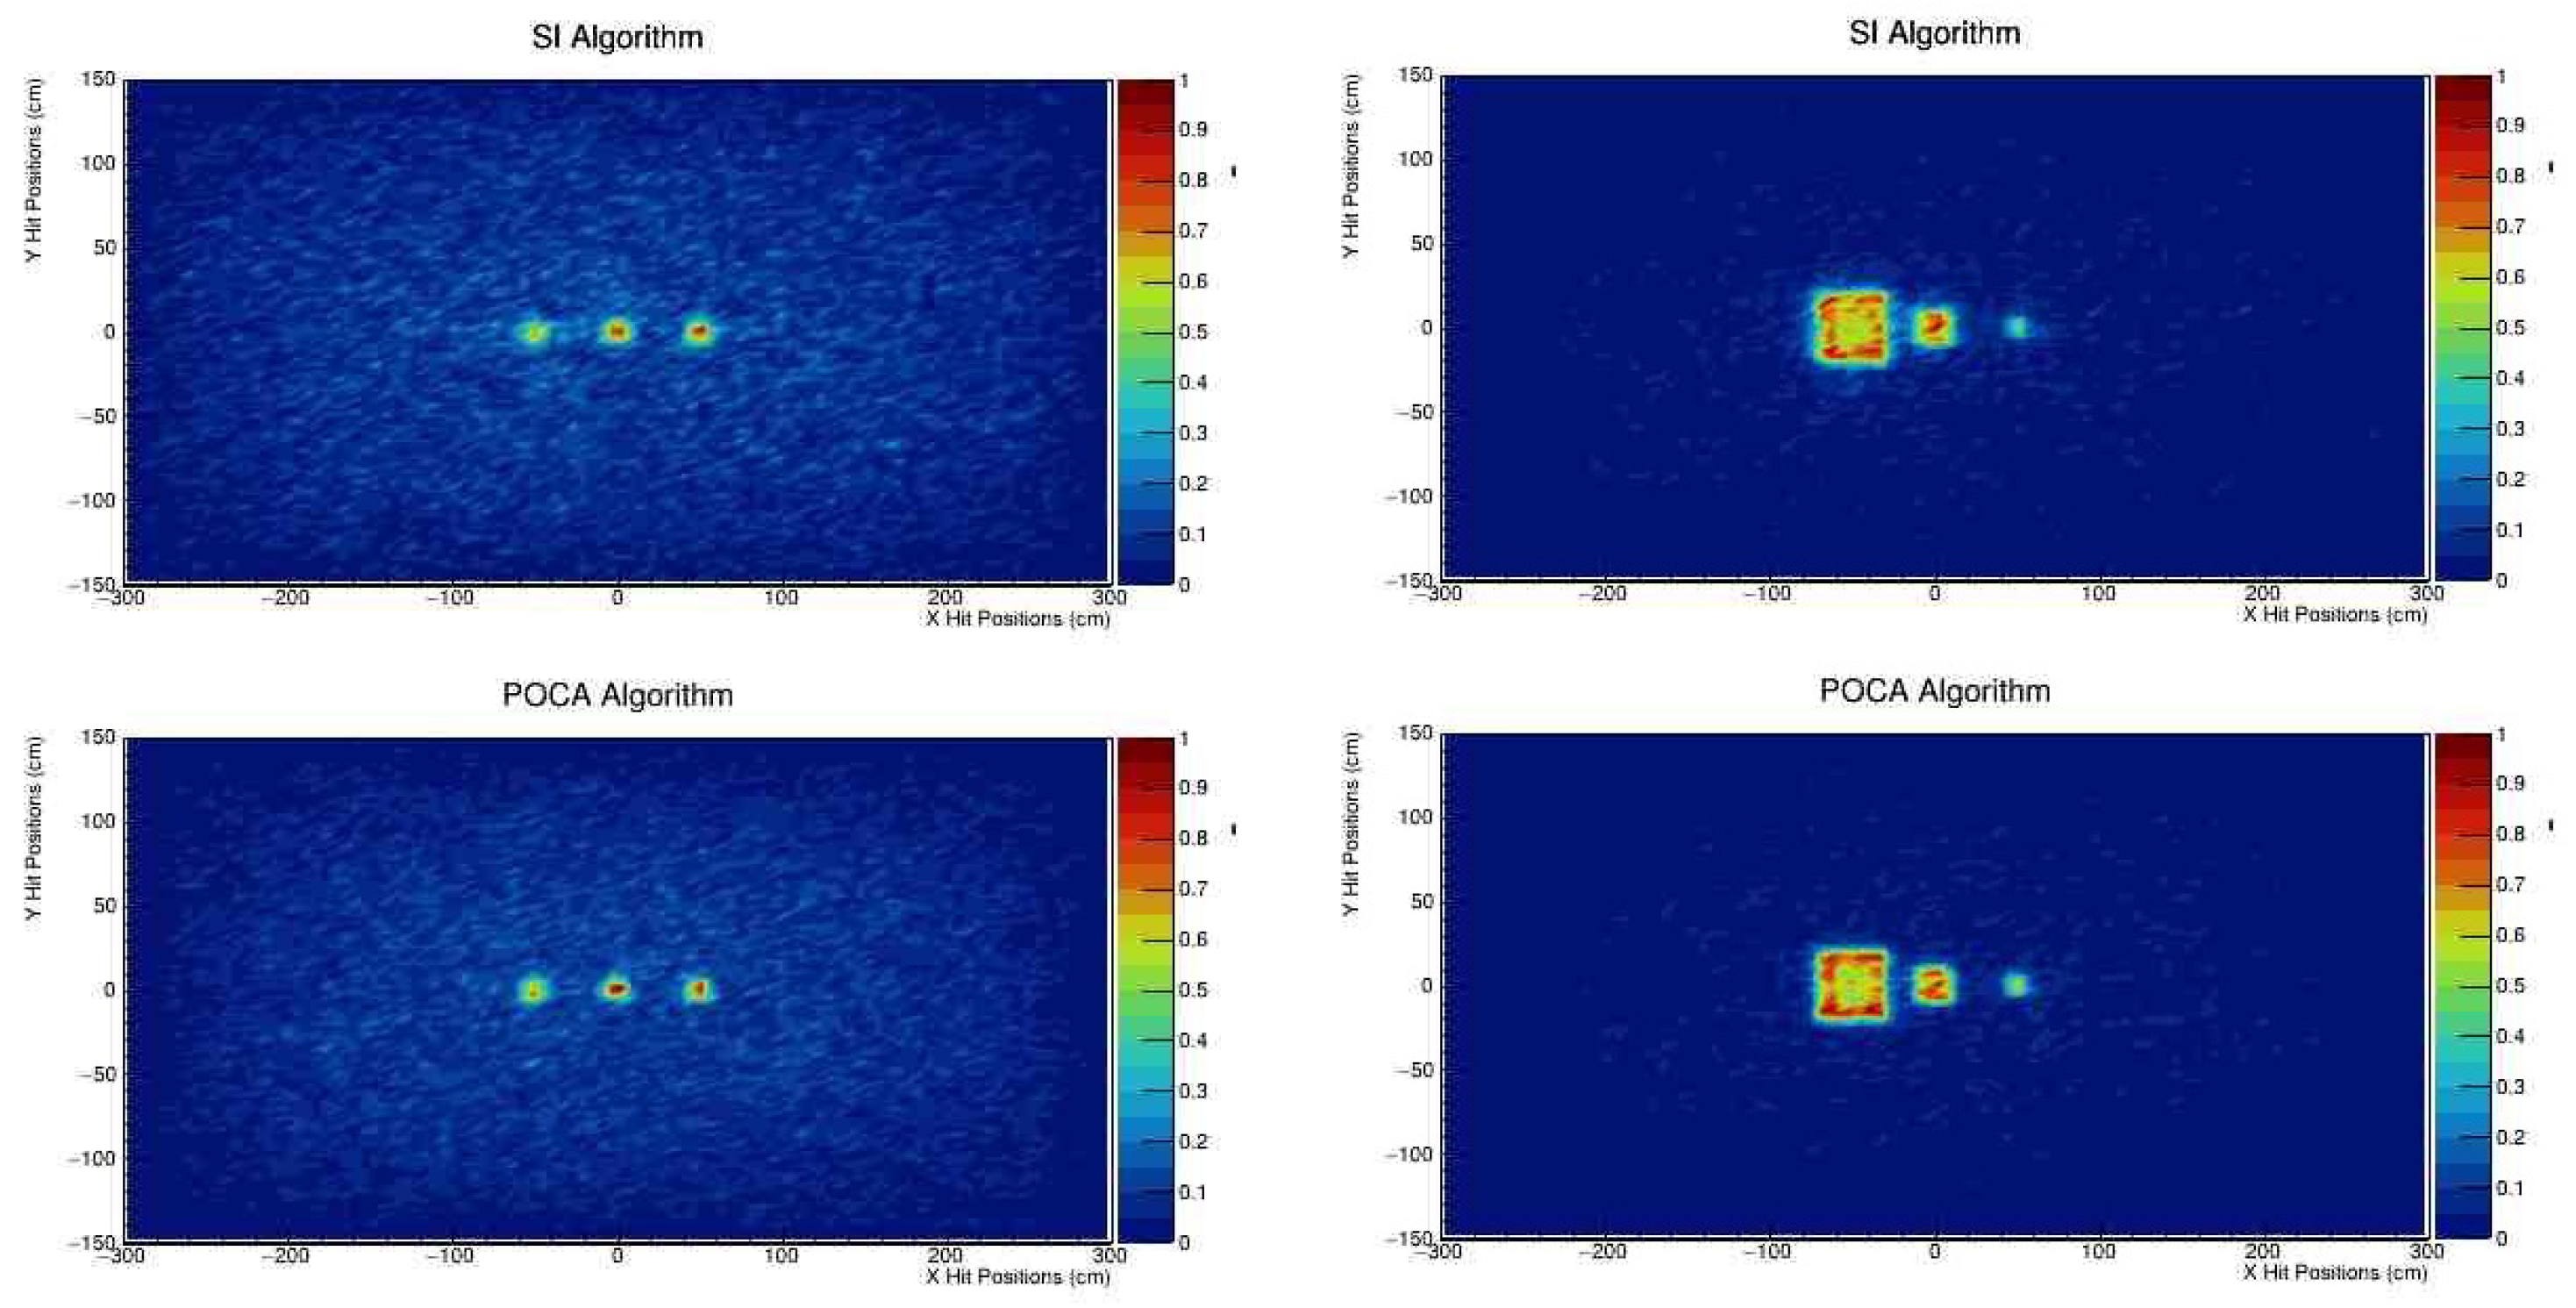
Figure 5 displays the reconstruction results of a scenario involving five target boxes using the SI and POCA algorithms with a 10 mm uncertainty after a 10-minute exposure to cosmic muons. The colorbar represents the number of muons, normalized to one. In both the POCA and SI reconstruction algorithms, the images undergo a filtering process where a threshold higher than the standard deviation of the energy difference observed between the upper and lower trackers is applied. This filtering ensures that only significant features, corresponding to regions with substantial muon interaction, are retained in the final reconstructed images. This step enhances the contrast and clarity of the reconstructed objects, facilitating more accurate analysis and interpretation of the tomographic results. Both the SI and POCA algorithms produce nearly identical results under identical conditions. In
Figure 6, centrally positioned within the muon tomography station, lead letters shaped like "MUON" are reconstructed, showcasing the SI algorithm’s capability in imaging.
As can be seen in
Figure 7, the experimental results were analyzed to evaluate the impact of varying sizes and materials of blocks on the performance of the detection system. We tested three different materials (iron, lead, uranium from left to right) with blocks of uniform size and three blocks of varying sizes (20 cm, 10 cm, 5 cm from left to right) made of the same material (lead).
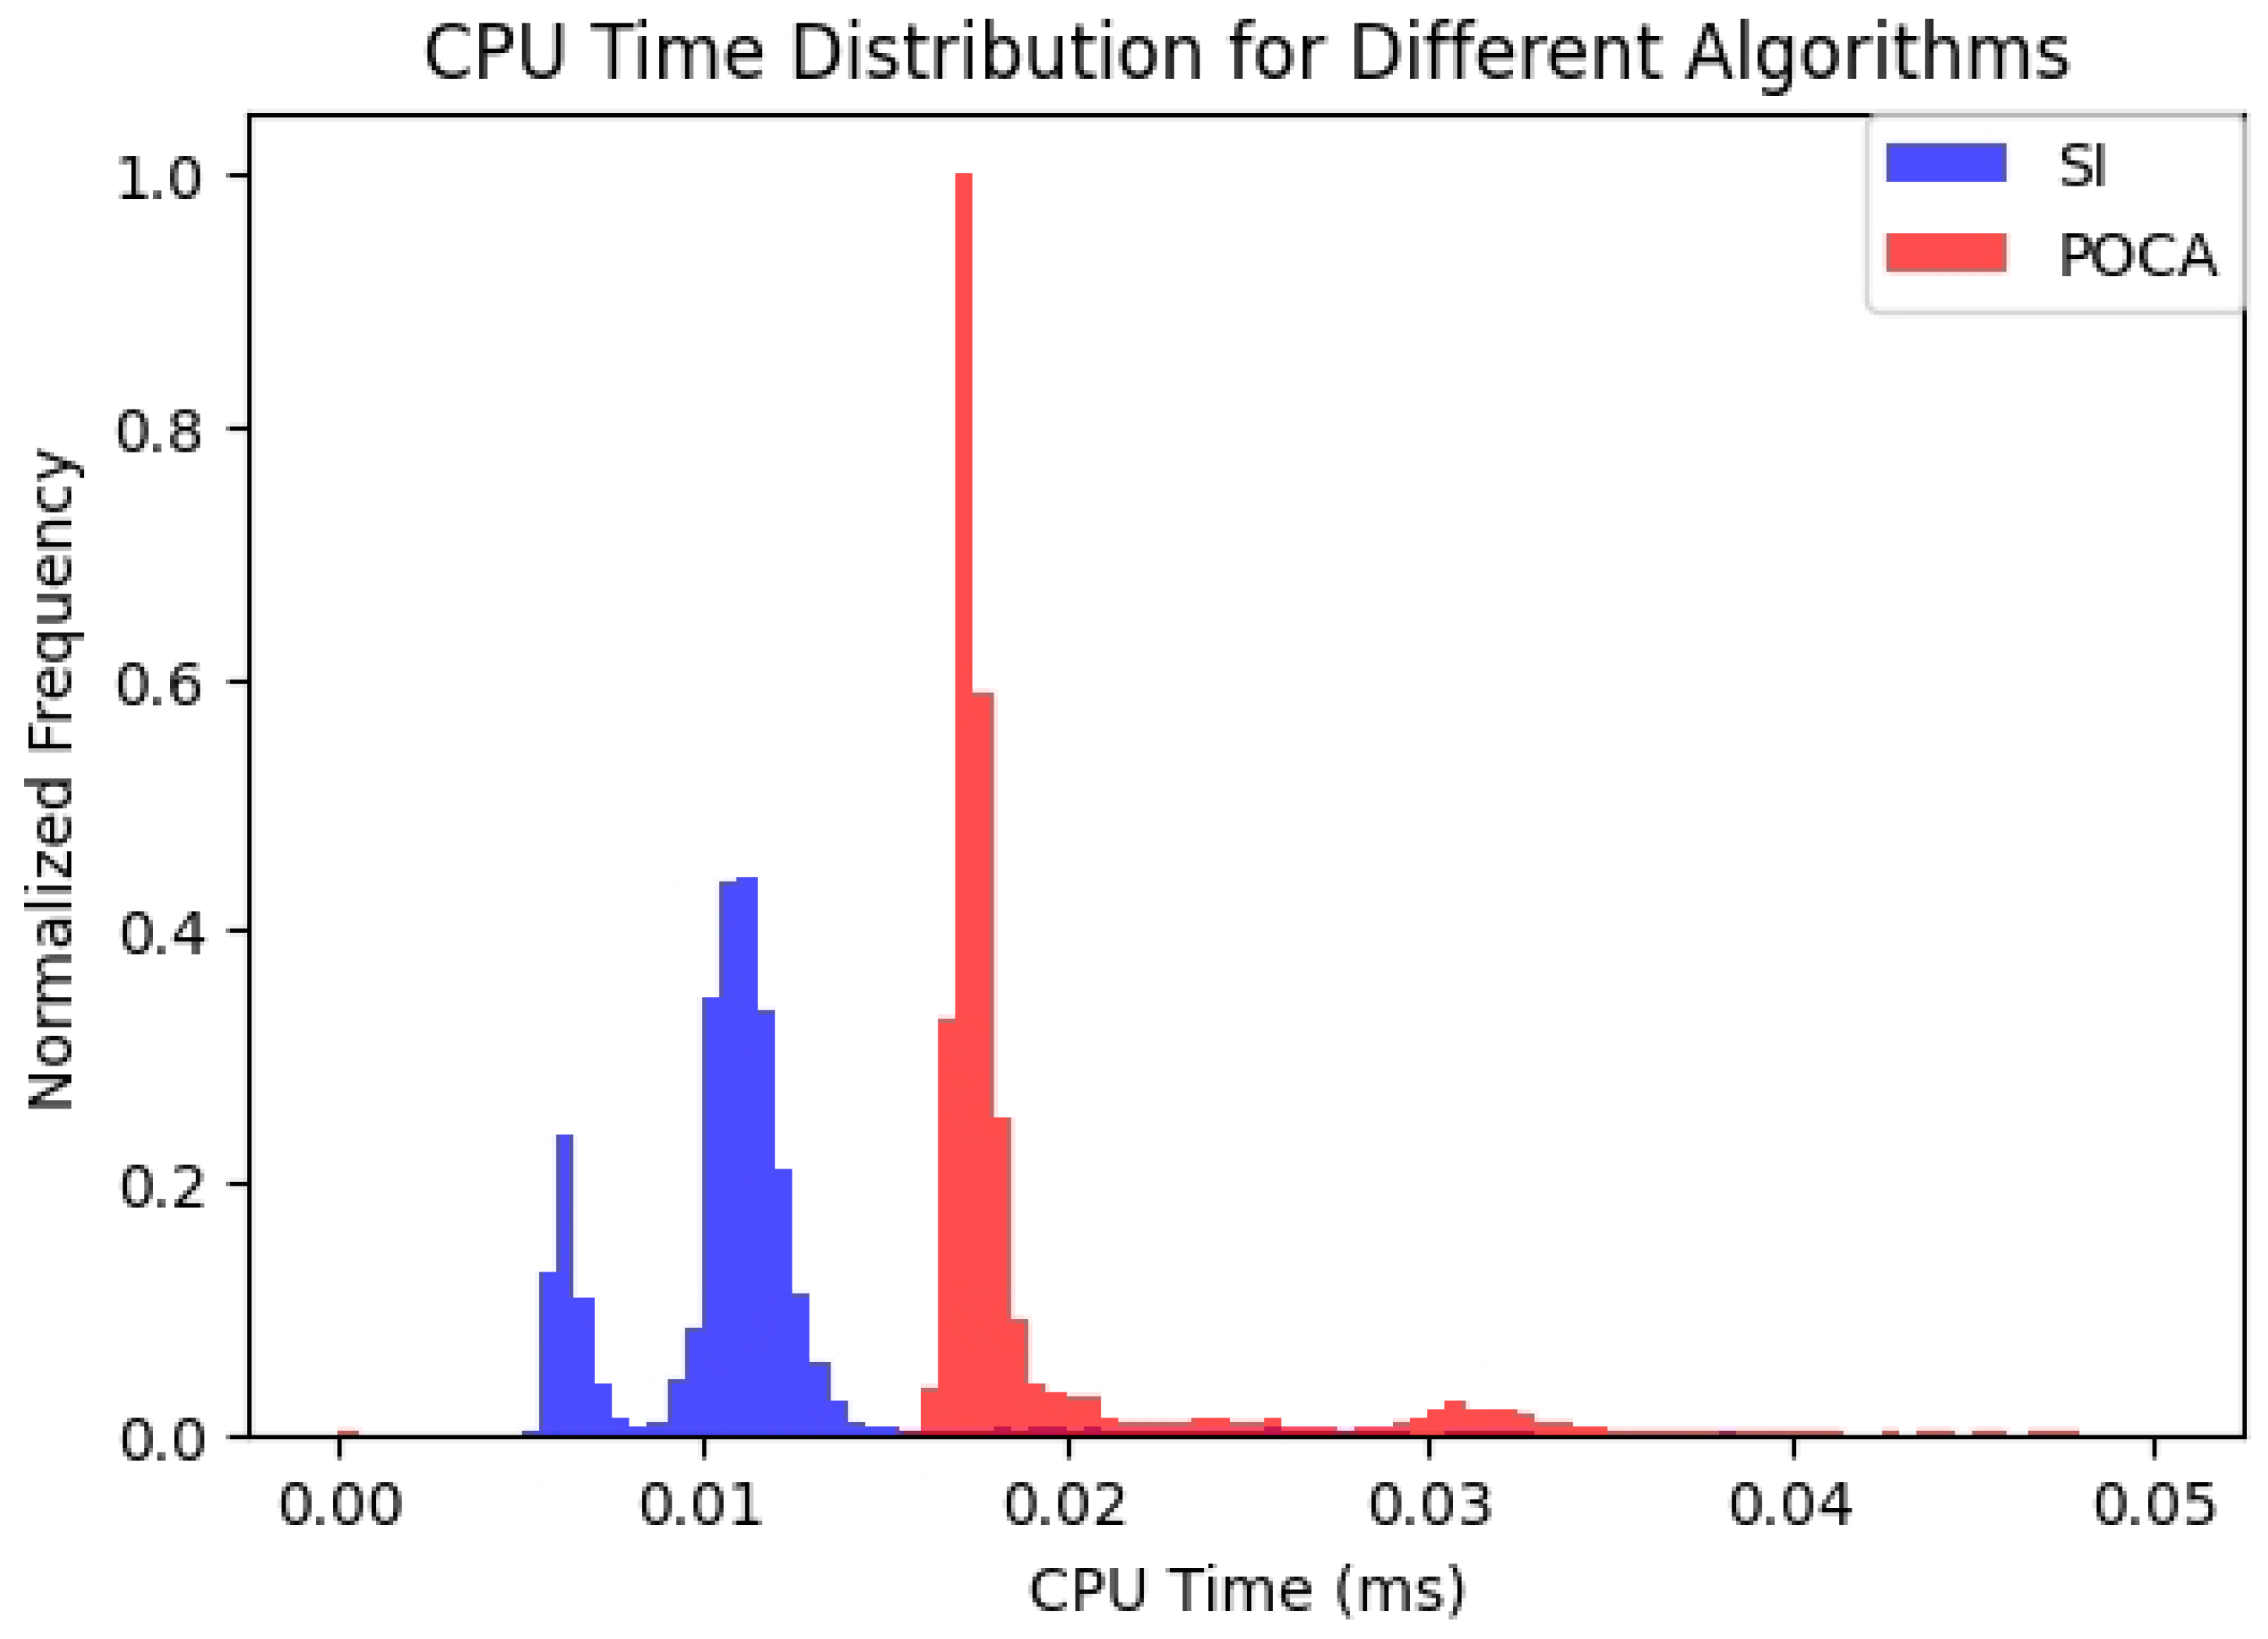
Figure 8 illustrates a comparison of CPU time between the SI and POCA algorithms. It is evident that the SI method not only generates clear images but also requires shorter computational time compared to the POCA algorithm.
To visually compare the SI and POCA algorithms in muon tomography, a plastic scintillator measuring one meter by one meter was positioned at the center of the system (
Figure 9). By examining the residuals between the measured and calculated hit positions (
Figure 10), it becomes evident that the margin of error is smaller when using the SI algorithm compared to the POCA algorithm.
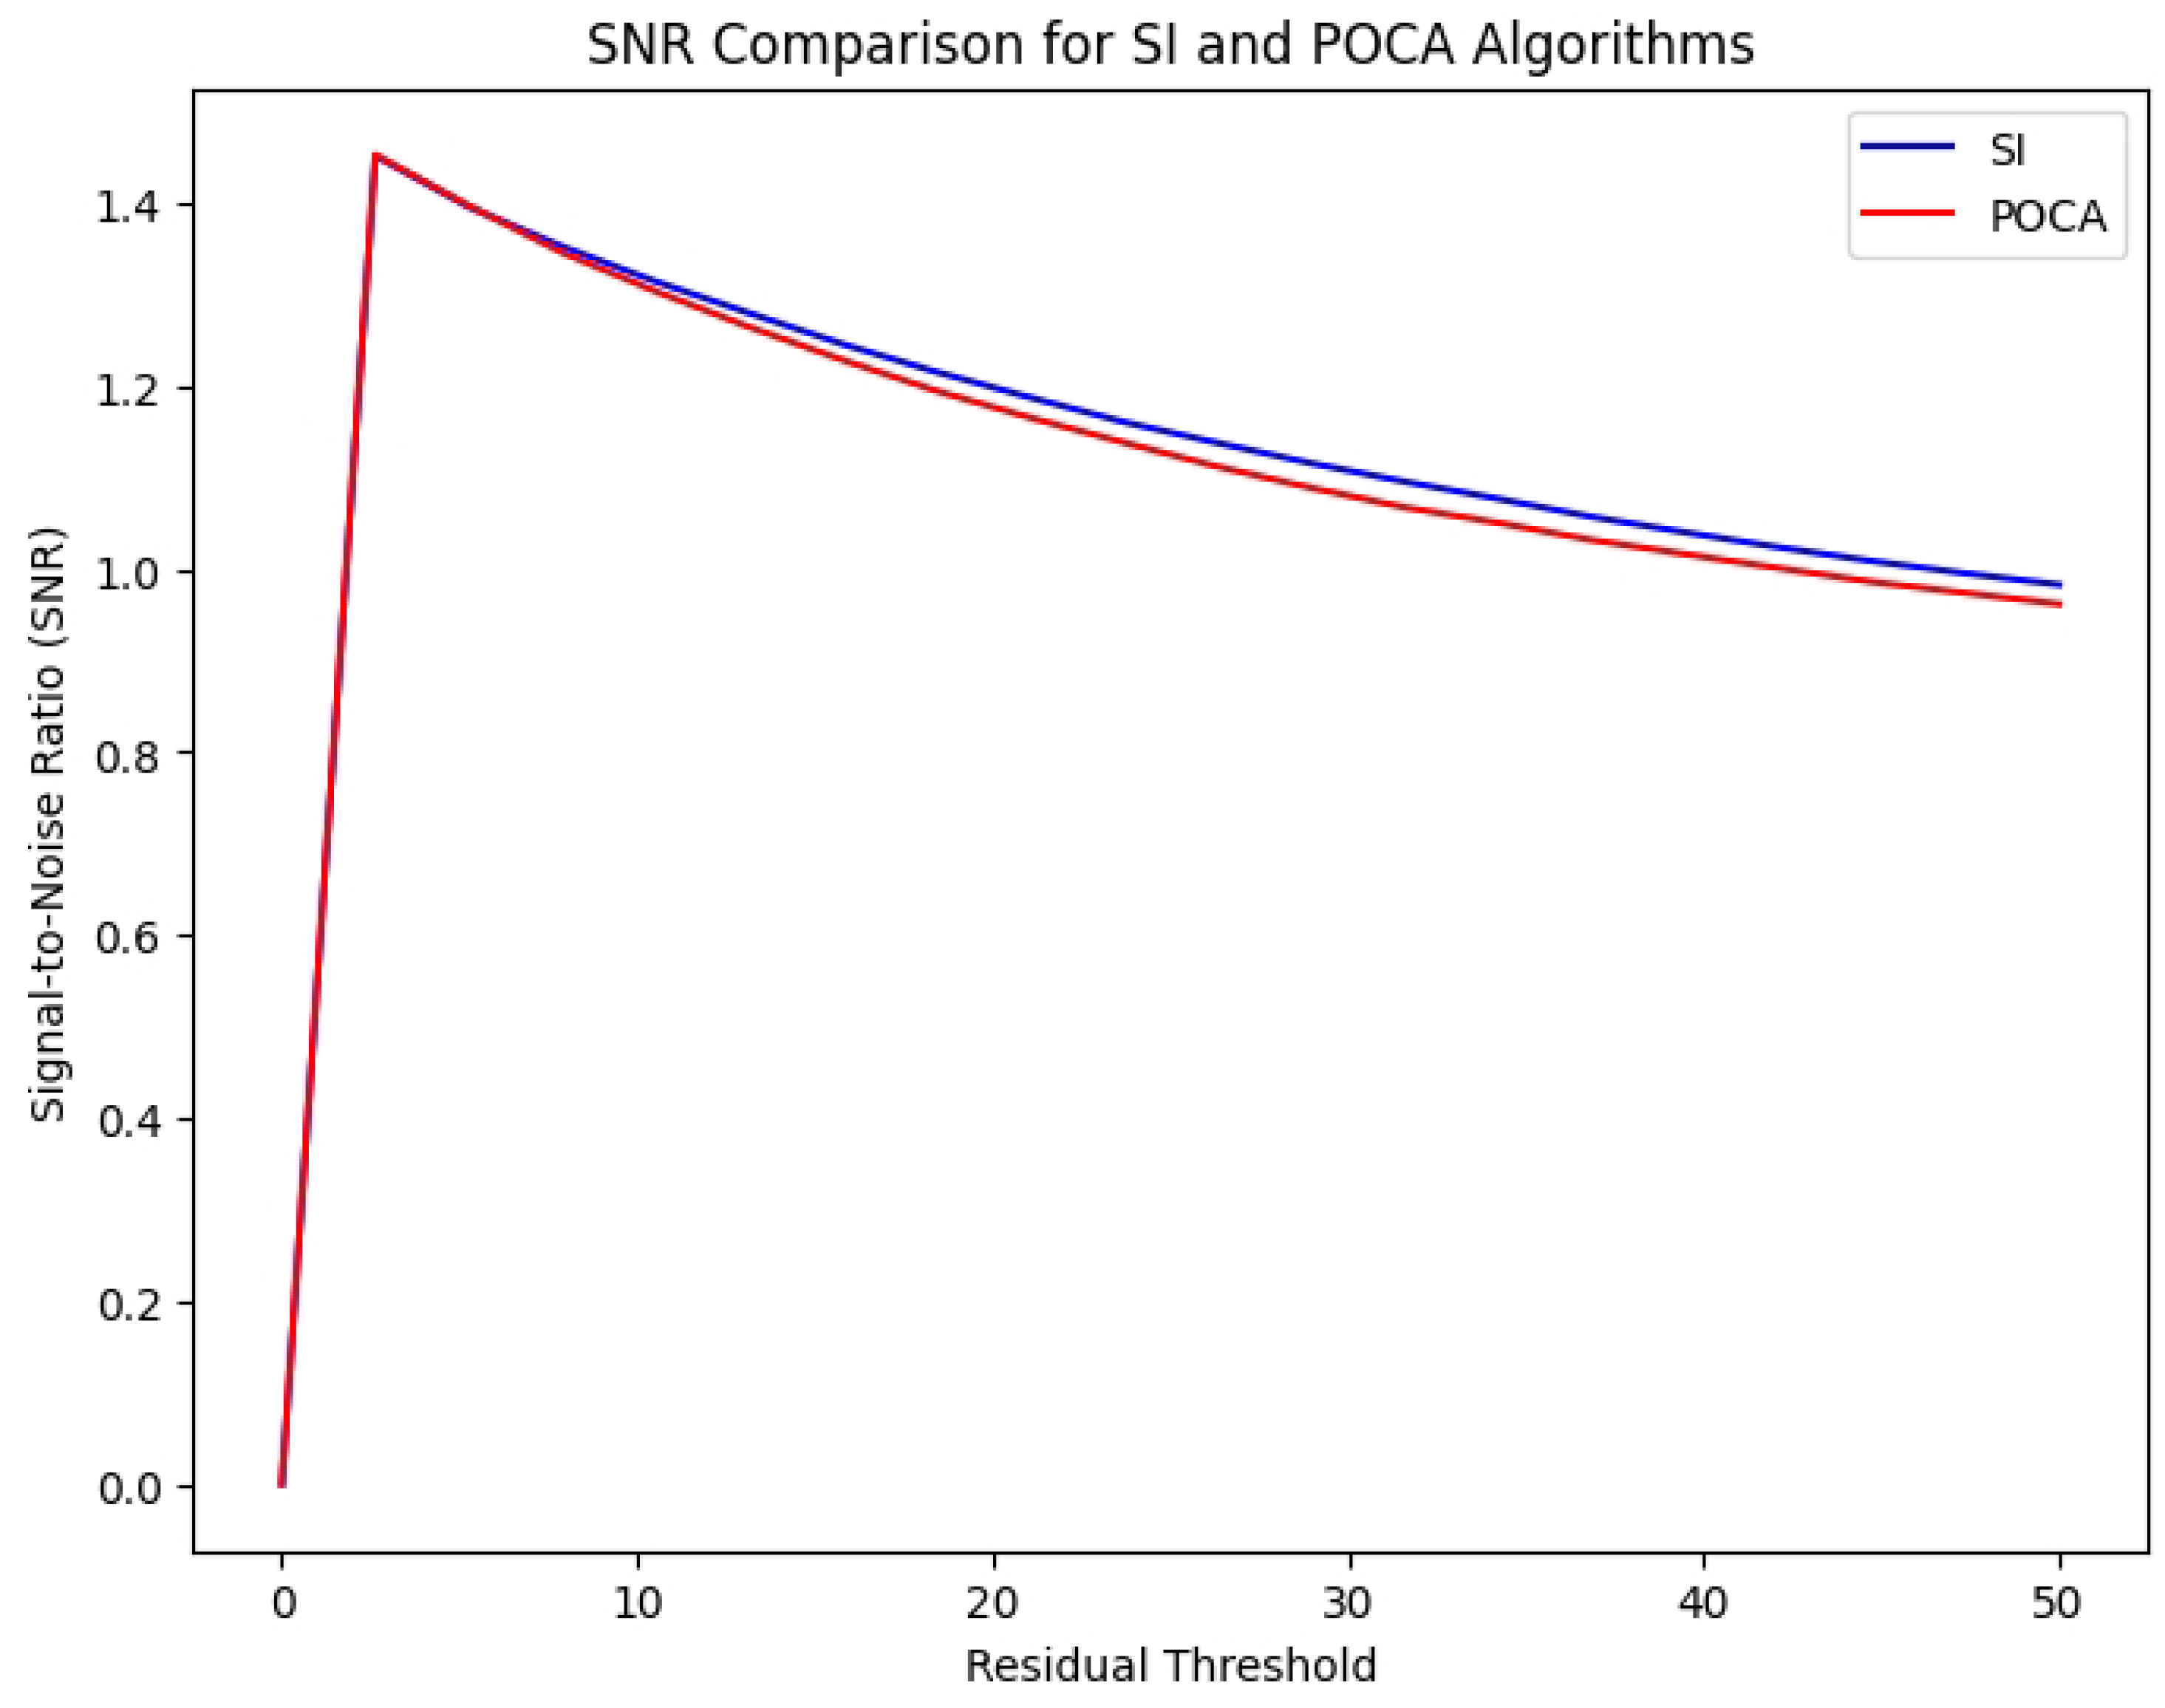
We defined the Signal-to-Noise Ratio (SNR) as a measure of performance based on the residual distribution relative to the true hit positions. SNR evaluates how well the algorithms perform by comparing the residuals of calculated hit positions with the true positions. As depicted in
Figure 11, the SI algorithm shows superior performance compared to the POCA algorithm, with higher SNR values indicating smaller residuals and thus better accuracy in hit position estimation. The SNR values reflect the performance of each algorithm in estimating hit positions, with higher SNR indicating better accuracy and lower residuals.
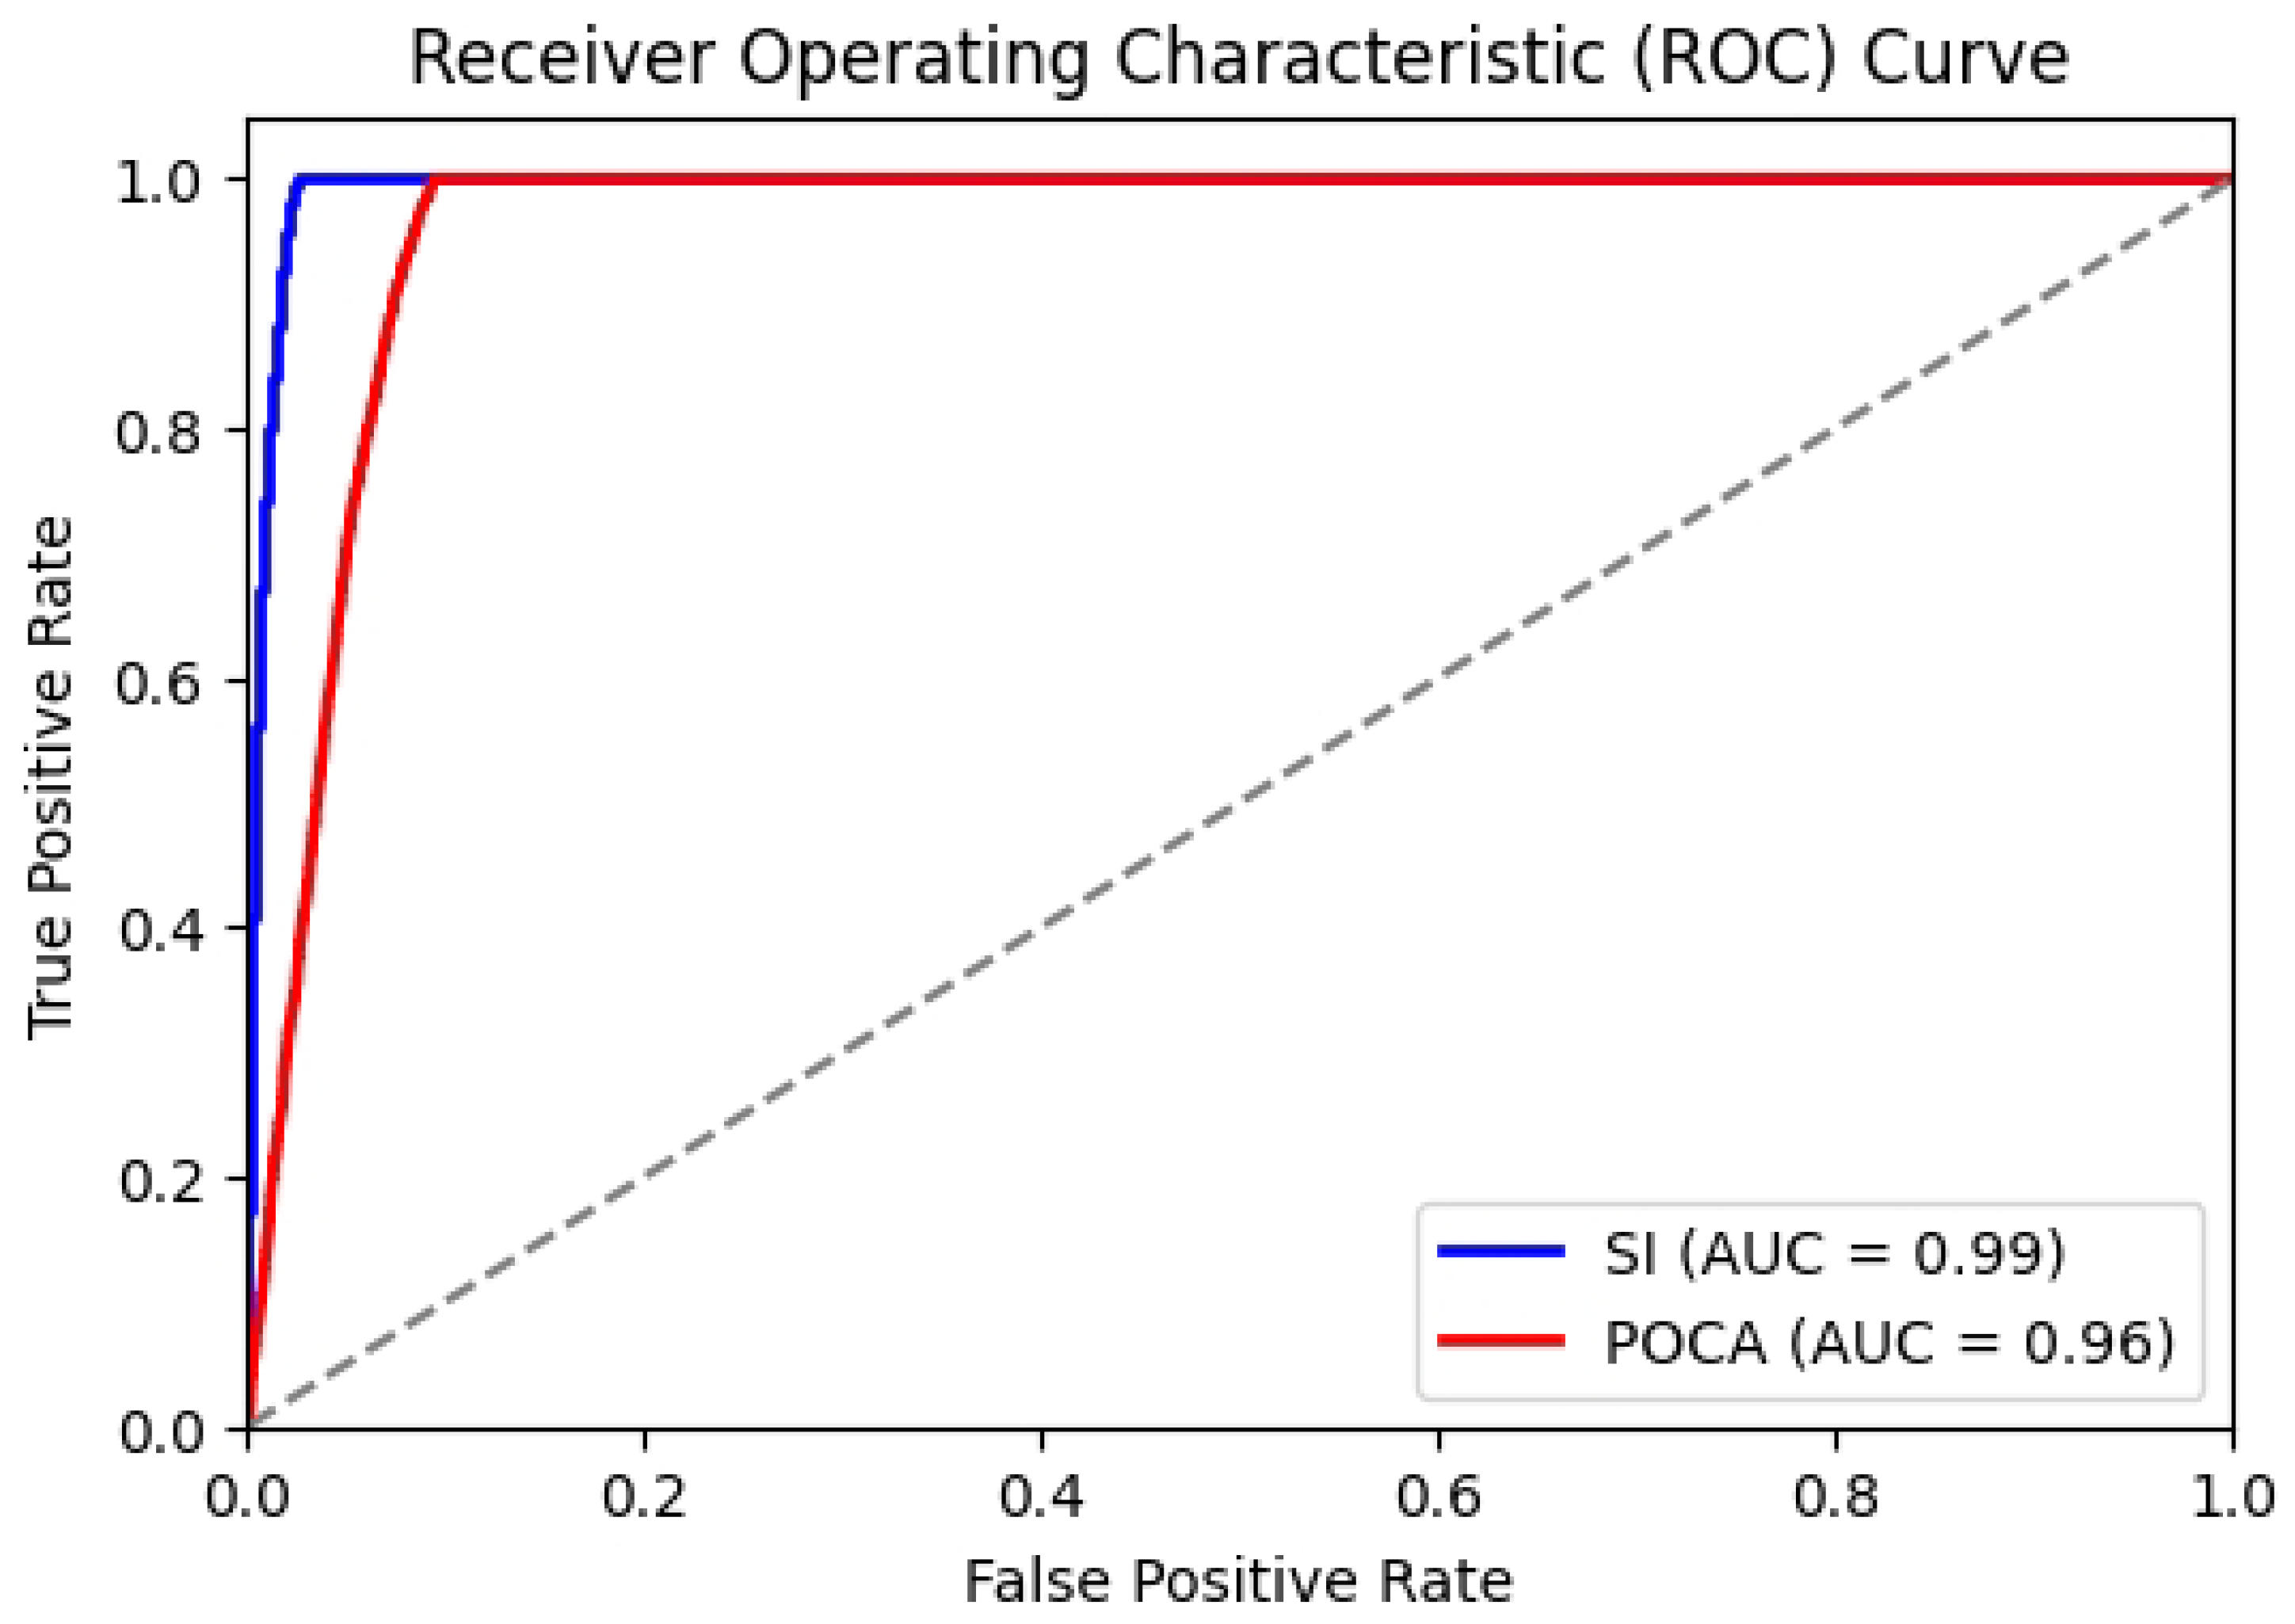
Additionally, we conducted an analysis using the receiver operating characteristic (ROC) for the scattering angle. The scattering angles were calculated using the reconstructed scattering points, and we set a threshold of 10 milliradians. The ROC analysis helps to understand the discrimination capability of the algorithms. As shown in
Figure 12, the area under the curve (AUC) values for SI and POCA are 0.99 and 0.96, respectively. This indicates that the SI algorithm has a superior ability to correctly classify the scattering events compared to the POCA algorithm.
6. Discussion
Reconstructed images in
Figure 5 (five-block scenario),
Figure 6 (MUON-shaped lead letters) and
Figure 7 (three-block scenario) show nearly identical results for the SI and POCA algorithms.
The results in
Figure 7 indicate that the choice of material and size significantly impacts the performance of the detection system. Lead, with its high atomic number, provides better performance in terms of detection efficiency due to its higher interaction cross-section with cosmic muons. In contrast, materials like iron and uranium showed lower detection efficiencies. Similarly, larger blocks offered better signal strength and accuracy compared to smaller blocks. These findings underscore the importance of selecting appropriate materials and sizes to optimize the performance of cosmic ray detection systems.
Figure 8 compares CPU time, demonstrating that the SI algorithm operates more efficiently under identical conditions. To assess positional accuracy, we placed a 1x1 m² scintillator plate at the center of the muon tomography station, comparing measured hit positions with reconstructed positions.
Figure 10 illustrates the comparison of X residuals distribution, revealing that the SI algorithm produces smaller residuals, indicating more accurate hit position calculations. We also analyzed the Signal-to-Noise Ratio (SNR), which measures the clarity of a signal relative to background noise. The SI algorithm exhibits a higher SNR, underscoring the SI algorithm’s superior performance in accurately identifying true hit positions. Finally, ROC analysis using a 10 milliradian scattering angle threshold shows an AUC of 0.99 for the SI algorithm and 0.96 for POCA, underscoring the SI algorithm’s superior performance in accurately identifying true hit positions.
In conclusion, these findings demonstrate that the SI algorithm offers comparable imaging quality, lower CPU time, smaller residuals in hit position calculations, higher SNR, and superior performance in ROC analysis compared to the POCA algorithm in muon tomography. These advantages position the SI algorithm as a promising choice for enhancing the accuracy and efficiency of muon tomography applications.
7. Conclusions
The comparative analysis between the Slope Intercept (SI) and Point of Closest Approach (POCA) algorithms in muon tomography reveals compelling advantages of SI across several critical metrics. SI consistently outperforms POCA in key aspects. Firstly, SI enables superior visualization of inspected volumes, resulting in clearer and more accurate image reconstructions crucial for effective material identification and characterization. Additionally, SI demonstrates enhanced computational efficiency with reduced CPU time compared to POCA, facilitating faster data processing and analysis.
Moreover, SI shows fewer residuals, indicating closer agreement between measured and estimated impact positions. This reduction in disparity enhances the sensitivity of SI-based reconstructions, ensuring more reliable imaging results. SI also excels in metrics such as Signal-to-Noise Ratio (SNR) and Area Under the Curve (AUC) in Receiver Operating Characteristic (ROC) analyses, signifying its superior capability for precise material identification and localization.
Overall, these findings highlight SI’s suitability for applications requiring robust imaging and efficient data processing, which are crucial for advancing security measures and scientific research. While further research is necessary to optimize SI’s accuracy and practical implementation, its promising performance indicates significant potential for real-time imaging of materials in inspected volumes. SI represents a valuable advancement in muon tomography algorithms, offering a straightforward yet effective solution to enhance imaging capabilities across security, industrial, and scientific applications.
Author Contributions
Conceptualization, Mahmut Can Özuygur and Suat Özkorucuklu; methodology, Mahmut Can Özuygur; software, Mahmut Can Özuygur; validation, Suat Özkorucuklu; formal analysis, Mahmut Can Özuygur; investigation, Mahmut Can Özuygur; resources, Suat Özkorucuklu; data curation, Suat Özkorucuklu; writing—original draft preparation, Suat Özkorucuklu; writing—review and editing, Suat Özkorucuklu; visualization, Mahmut Can Özuygur; supervision, Suat Özkorucuklu; project administration, Suat Özkorucuklu; funding acquisition, Suat Özkorucuklu. All authors have read and agreed to the published version of the manuscript.
Funding
This research received no external funding
Data Availability Statement
The data presented in this study are available on request from the corresponding author due to privacy.
Acknowledgments
This study is partly supported by ONAP-51392 and IRP-50123 projects from the Istanbul University Scientific Project Office and partly by IRADETS company.
Conflicts of Interest
The authors declare no conflicts of interest.
Abbreviations
The following abbreviations are used in this manuscript:
| POCA |
Point of Closest Approach |
| SI |
Slope Intercept |
| EM-ML |
pectation Maximization-Maximum Likelihood |
| SNR |
Signal-to-Noise Ratio |
| ROC |
River Operating Characteristic |
| AUC |
Area Under the Curve |
References
- F. Riggi, V. Antonuccio, M. Bandieramonte, U. Becciani, G. Bonanno, D. L. Bonanno, D. Bongiovanni, P. G. Fallica, G. Gallo, S. Garozzo, et al., The Muon Portal Project: Commissioning of the full detector and first results, Nuclear Instruments and Methods in Physics Research Section A, 912, 2018, pp. 16-19.
- S. Barnes, et al., Cosmic-ray tomography for border security, Instruments, 7(1), 2023, 13. [CrossRef]
- L. Bonechi, R. D’Alessandro, and A. Giammanco, Atmospheric muons as an imaging tool, Reviews in Physics, 5, 2020, 100038. [CrossRef]
-
International Atomic Energy Agency, Muon Imaging: Present Status and Emerging Applications; IAEA TECDOC 2012, IAEA: Vienna, Austria, 2022.
- R. Kouzes, Radiation Detection Technology for Homeland Security, Handbook of Particle Detection and Imaging, Cham: Springer International Publishing, 2021, pp. 897-927.
- C. Park, et al., Design and characterization of a Muon tomography system for spent nuclear fuel monitoring, Nuclear Engineering and Technology, 54(2), 2022, pp. 601-607. [CrossRef]
- L. J. Schultz, et al., Statistical reconstruction for cosmic ray muon tomography, IEEE Transactions on Image Processing, 16(8), 2007, pp. 1985-1993. [CrossRef]
- P. Zyla, R. Barnett, J. Beringer, O. Dahl, D. Dwyer, D. Groom, C. J. Lin, K. Lugovsky, E. Pianori, D. J. Robinson, et al., Review of particle physics, Progress of Theoretical and Experimental Physics, 2020, 083C01.
- W. T. Scott, The Theory of Small-Angle Multiple Scattering of Fast Charged Particles, Reviews of Modern Physics, 35, 1963, pp. 231-313. [CrossRef]
- S. Agostinelli, et al., Geant4—a simulation toolkit, Nuclear Instruments and Methods in Physics Research Section A, 506(3), 2003, pp. 250-303. [CrossRef]
- J. Allison, et al., Geant4 developments and applications, IEEE Transactions on Nuclear Science, 53(1), 2006, pp. 270-278. [CrossRef]
- A. Mitra, et al., CRY—a cosmic ray shower library, Nuclear Instruments and Methods in Physics Research Section A, 587(3), 2008, pp. 340-346.
- C. Hagmann, et al., Cosmic-ray shower generator (CRY) for Monte Carlo transport codes, IEEE Nuclear Science Symposium Conference Record, 2, 2007, pp. 1143-1146. [CrossRef]
- P. K. F. Grieder, Cosmic Rays at Earth: Researcher’s Reference Manual and Data Book, Elsevier, 2001.
- W.J. Jo, H.-I. Kim, S.J. An, C.Y. Lee, C.-H. Baek, and Y.H. Chung, \textit{Design of a muon tomography system with a plastic scintillator and wavelength-shifting fiber arrays}, Nuclear Instruments and Methods in Physics Research Section A: Accelerators, Spectrometers, Detectors and Associated Equipment \textbf{732} (2013) 568. [CrossRef]
|
Disclaimer/Publisher’s Note: The statements, opinions and data contained in all publications are solely those of the individual author(s) and contributor(s) and not of MDPI and/or the editor(s). MDPI and/or the editor(s) disclaim responsibility for any injury to people or property resulting from any ideas, methods, instructions or products referred to in the content. |
© 2024 by the authors. Licensee MDPI, Basel, Switzerland. This article is an open access article distributed under the terms and conditions of the Creative Commons Attribution (CC BY) license (http://creativecommons.org/licenses/by/4.0/).
