1. Introduction
Ovarian cancer is a malignant tumor of the ovary, it is the most common type of gynecological cancer among women and the fifth leading cause of death [
1,
2,
3]. Recent studies reported the therapeutic effects of numerous natural products in patients with ovarian cancer. Significantly, these natural components have no negative effects on healthy cells or tissues, indicating that using natural products could be a secure substitute for medications to treat ovarian cancer. Corilagin is a natural plant polyphenol tannin compound. It is an active ingredient in plants such as
Phyllanthus urinaria, geranium, orange grass, and white clover [
4]. Also, it exists in plants with antioxidant and antiaging effects, such as emblica, longan, and olive [
5,
6]. Research demonstrated that corilagin has various biological activities, such as antitumor properties [
7]. cardiovascular disease treatment [
8], antioxidant [
9], anti-inflammatory [
10]. Recently, corilagin has received extensive attention from researchers and is worth further research and development.
Jia et al [
11]. found that corilagin inhibits the growth of ovarian cancer cells by blocking the transforming growth factor (TGF) via the β signal pathway. Their subsequent research revealed that corilagin acts on the apoptosis pathway and makes epithelial ovarian cancer sensitive to chemotherapy by inhibiting the Snail-glycolysis pathway [
12]. Rukset Attar et al [
13]. found that corilagin can stimulate MAPK and phosphatidylinositol signaling systems, indicating its antitumor effect on downstream pathways. These findings indicate that corilagin has antitumor effects on ovarian cancer cells and could serve as a new treatment method for epithelial ovarian cancer.
Josianne Rocha Barboza et al [
14]. reported that the Difeng Gum extract containing corilagin components regulates the cell cycle by activating caspase-3 and PARP protein lysis, inducing apoptosis in A2780 ovarian cancer cells. This suggests that corilagin may have an apoptotic effect on A2780 cells, but the specific mechanism by which it affects A2780 cells remains unclear. Our team investigated the mechanism of corilagin inhibiting A2780 cell activity through flow cytometry to determine cell cycle, apoptosis, mitochondrial cross-membrane potential, cell calcium concentration, and microscopic observation of cell Acridine Orange staining experiment; then, we explored the molecular mechanism of corilagin inducing A2780 cell apoptosis through transcriptome gene sequencing and real-time fluorescence qPCR.
2. Materials and Methods
2.1. Materials and Reagents
Corilagin was isolated in the laboratory; the A2780 human ovarian cancer cell line was purchased from the Shanghai Institute of Cell Research, Chinese Academy of Sciences. The T25 cell culture flask, 96-well and 6-well cell plate, and cell cryopreservation tube were bought from Costar, USA; a 24-well 8μm transwell cell chamber was obtained from Costar, USA. Matrigel was acquired from Becton, Dickinson company. Moreover, the CCK-8 reagent was provided by Tongren, Japan; 5-fluorouracil (5-FU) was acquired from Sigma, USA. Fetal bovine serum (FBS) and penicillin-streptomycin were sourced from Hangzhou Sijiqing company. Dulbecco's Modified Eagle Medium, dimethyl sulfoxide, and phosphate-buffered saline (PBS) buffer were supplied by Gibco, USA. Trypsin cell digest was purchased from Hangzhou Jinuo Bio-Pharmaceutical Technology Co., Ltd. Crystal violet, absolute ethanol, and methanol were obtained from Sinopharm Chemical Reagent Co., Ltd. Acridine Orange fluorescent dye was obtained from Omega, USA.
2.2. Cell Cycle Assay
A cell suspension with a logarithmic growth phase was inoculated, having a concentration of 1×10⁶/mL, into a 6-well plate. Then, 1 mL of the suspension was added to each well and cultured for 24 h. The culture solution was replaced with 2 mL containing varying concentrations of corilagin (20, 40, 60, 80, and 100 μmol/mL). Then, culturing was continued for 48 h in a 37 °C constant-temperature incubator. Subsequently, trypsin was used to digest the cells for 30 s. The mixture was centrifuged at 1500 rpm for 5 min at 4 °C to collect the cells. The cells were washed twice with 4 °C PBS, and then the PBS was discarded. Furthermore, 1 mL of precooled 75% ethanol was added, and the mixture was placed in the refrigerator at 4 °C to fix overnight in the dark. The fixed cells were collected by centrifugation, and 200 μL of RNase was added and incubated for 30 min at 37 °C in the dark. Finally, 100 μL of PI staining was added for 30 min at 4 °C in the dark to detect the cells on a flow cytometer within 1 h.
2.3. Apoptosis Detection
A cell suspension in a logarithmic growth phase was inoculated, with a concentration of 1×10⁵/mL, into a 6-well plate. A 1 mL of the suspension to each well was added and cultured for 24 h. After that, 1 mL of a solution containing various concentrations of corilagin was added (20, 40, 60, 80, and 100 μmol/mL) at 37 °C. Then, culturing was continued in a constant-temperature incubator for 48 h. The culture was digested with trypsin for 30 s, the suspended cells were blown down, and the cells were collected after centrifugation. Subsequently, the cells were washed twice with precooled PBS, and the PBS was discarded. The number of suspended cells in the Annexin V binding solution was adjusted to 5 × 10⁴ cells/mL; 5 μL Annexin-V-FITC staining solution was added for 15 min at 4 °C in the dark, and finally, 10 μL PI staining solution was added, and incubated for 5 min at 4 °C in the dark to detect the cells by flow cytometry within 1 h.
2.4. Assessment of the Mitochondrial Membrane Potential
A 6-well plate with a cell suspension in a logarithmic growth phase with a concentration of 1 × 10⁵/mL was inoculated. Typically, 1 mL of the suspension was added to each well and cultured for 24 h. Then, the culture was replaced with a new one containing varying concentrations of corilagin (20, 40, 60, 80, and 100 μmol/mL). After adding 2 mL of solution, the culture was continued in a 37 °C constant-temperature incubator for 48 h. Cells were digested with trypsin for 30 s and centrifuged at 1500 rpm for 5 min at 4 °C. Then, the cells were collected and washed twice with precooled PBS, and the PBS was discarded. Moreover, 0.5 mL of JC-1 staining working solution was added and incubated at 37 °C for 20 min. The cells were rinsed with JC-1 Staining Buffer twice, and the number of suspended cells was adjusted to 5 × 10⁴/mL and detected on a flow cytometer within 1 h.
2.5. Intracellular Calcium Ion Concentration Assay
A logarithmic growth phase cell suspension 1×10⁵/mL was taken and inoculated into a 6-well plate, 1 mL per well. After culturing for 24 h, it was replaced with 2 mL of culture medium containing different concentrations of corilagin (20, 40, 60, 80, and 100 μmol/mL). Finally, the culture was continued in a constant-temperature incubator at 37 °C for 48 h. The cells were collected after trypsin digestion and centrifugation. After washing twice with Hanks’ Balanced Salt Solution (HBSS), the cell concentration was adjusted to 5×10⁴/mL. BBcellProbeTM F3 staining solution was added and incubated at 37 °C for 20 min. Furthermore, the cells were washed 2--3 times with HBSS, resuspended, set at 37 °C for 10 min, and placed on a flow cytometer for detection within 1 h.
BBcellProbeTM F3 staining working solution: BBcellProbeTM F3 solution was diluted in HBSS to a dilution factor of 800 times to prepare BBcellProbeTM F3 staining working solution.
2.6. Cell Autophagy Detection
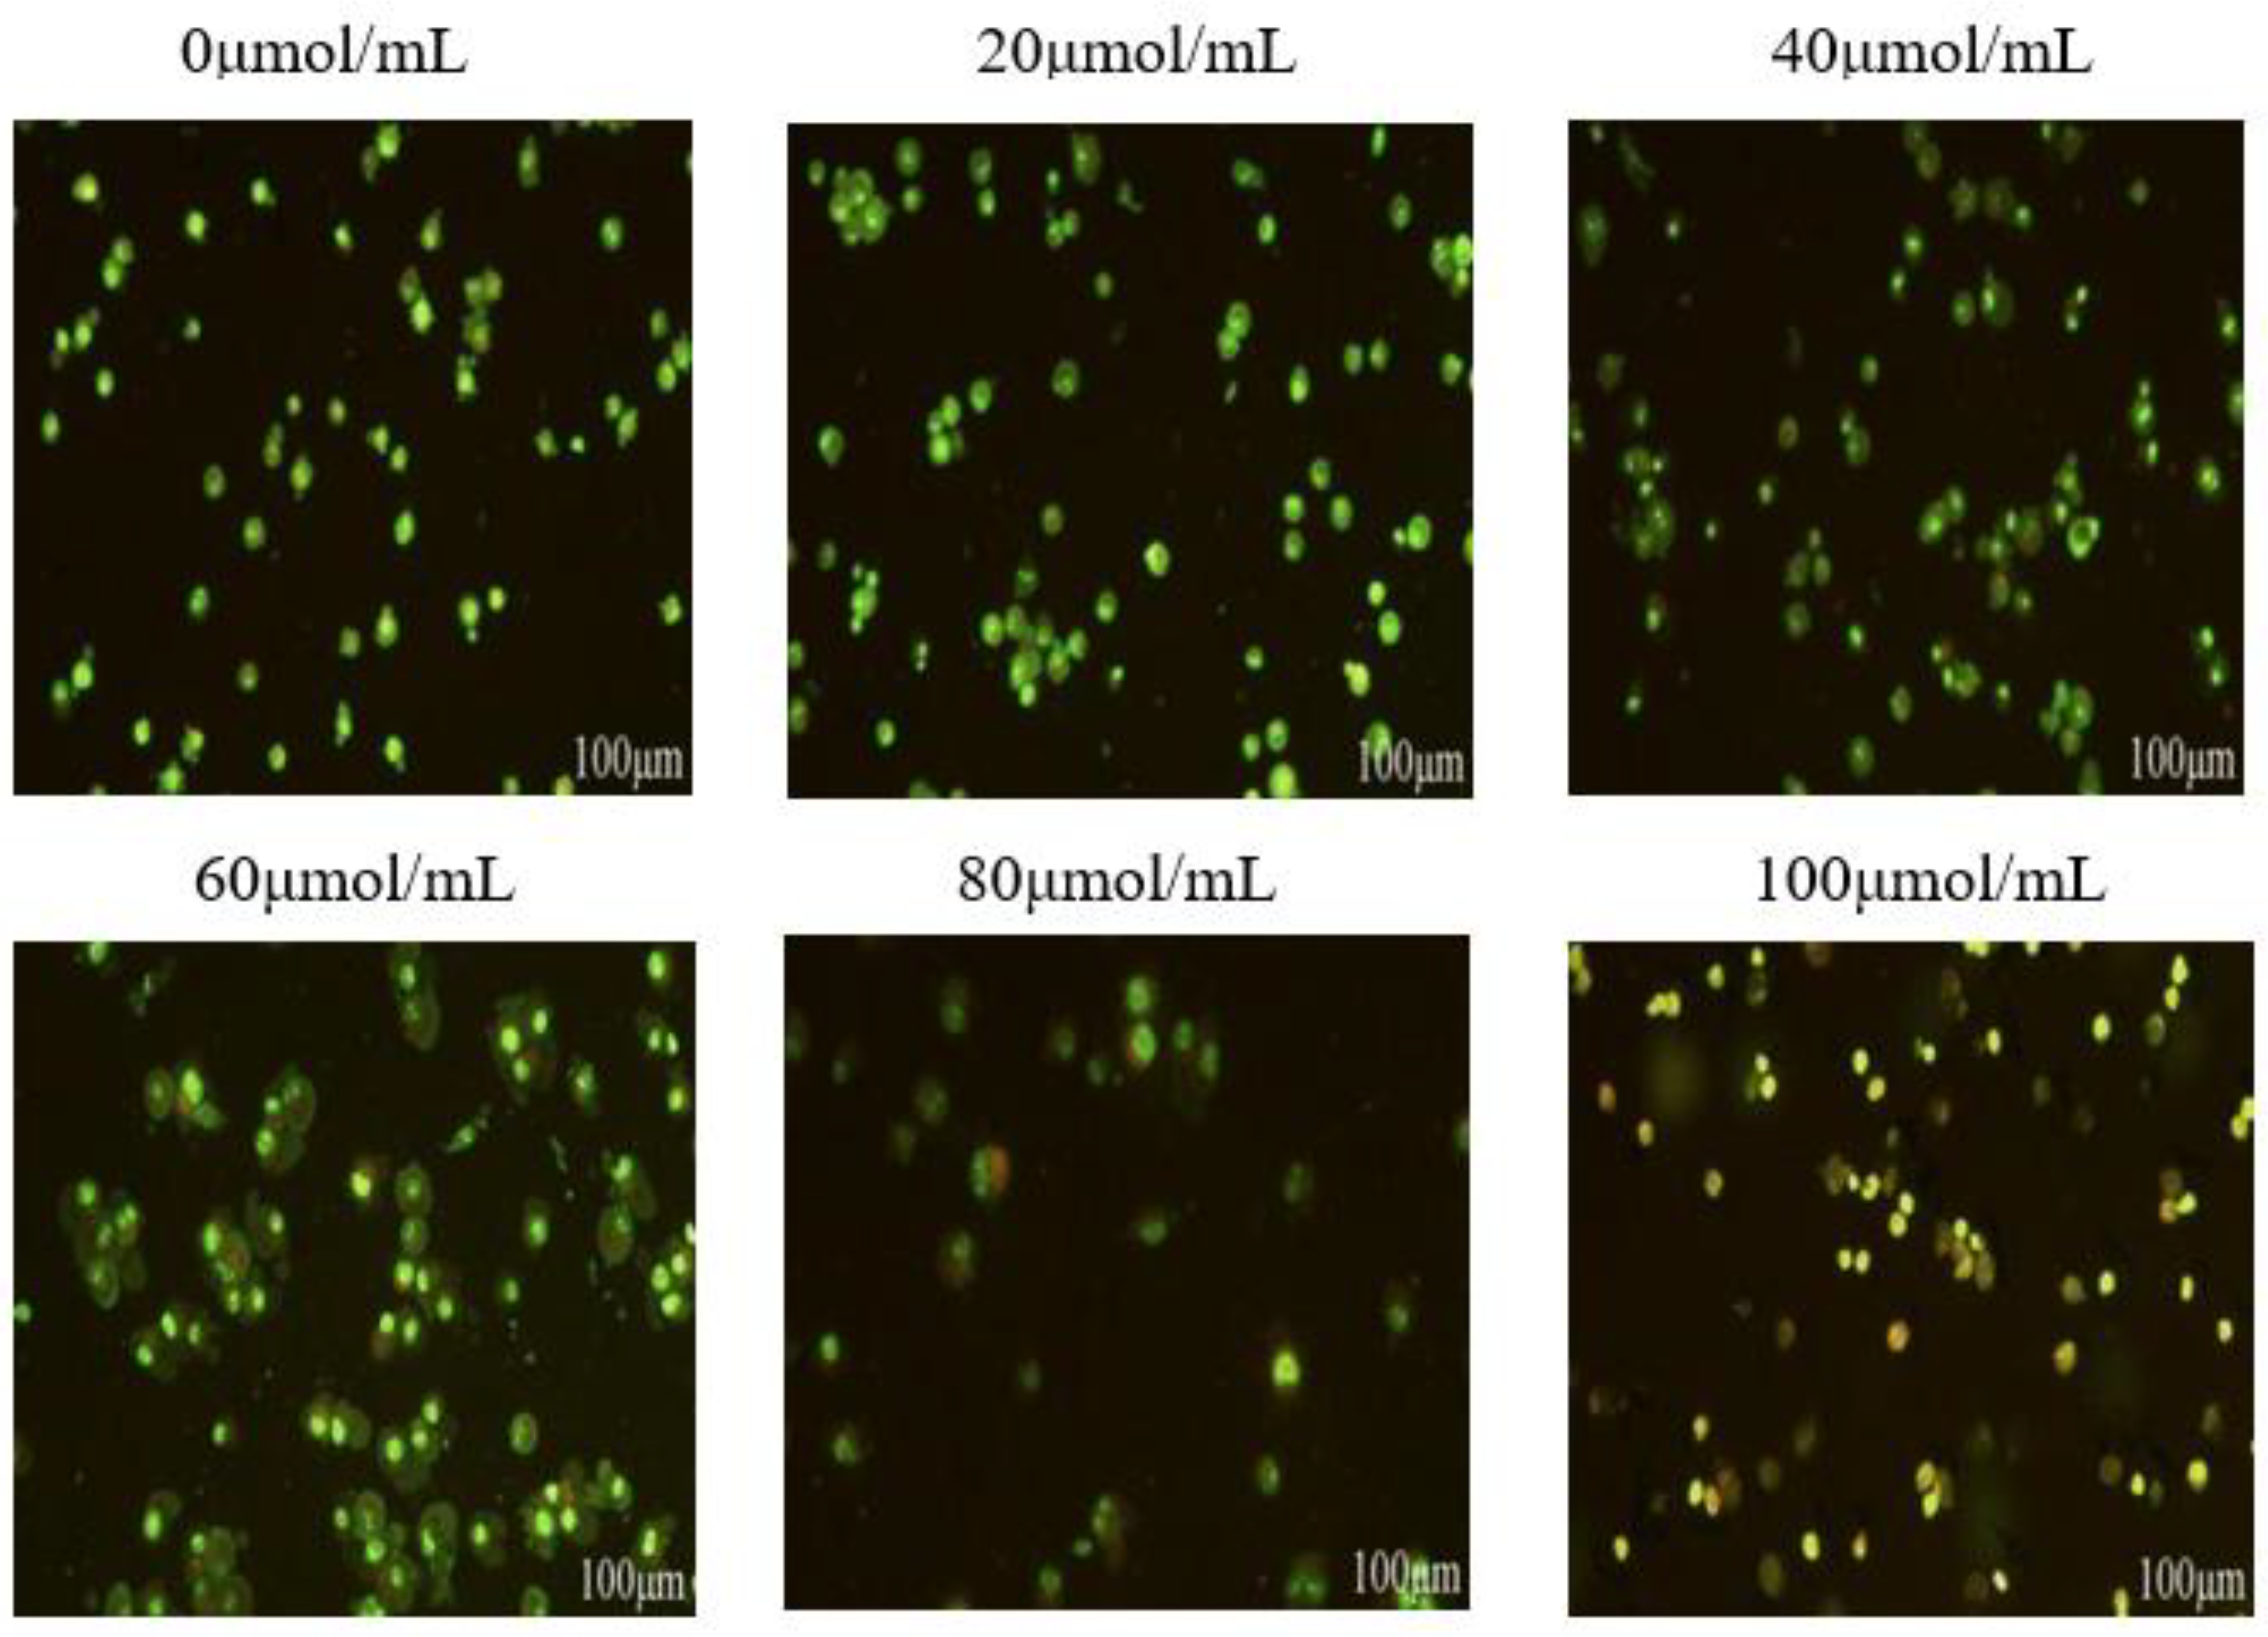
A 6-well plate was placed on a sterilized glass slide in the well and stuck to the bottom of the well. Then, a 1×10⁵/mL of logarithmic growth phase cell suspension was taken and inoculated on the glass slide in the 6-well plate. After culturing for 24 h in a constant-temperature incubator at 37 °C, 1 mL of corilagin containing different concentrations (20, 40, 60, 80, and 100 μmol/mL) was added, and the culture was continued for 24 h. The culture medium was discarded and washed gently twice with PBS. Moreover, 200 μL of Acridine Orange dye (1 mmol/mL) was added to the medium, which was incubated at 37 °C in the dark for 15 min. Then, it was fixed with a methanol solution for 2 h, placed on a glass slide, and observed the culture under a fluorescence microscope.
2.7. Transcriptomic Data Analysis
A 1×10⁵/mL cell suspension was inoculated in a logarithmic growth phase into a 6-well plate, 1 mL per well, and 60 μmol/mL corilagin was added. The culture was continued in a 37 °C constant-temperature incubator for 24 h. Then, the cells were trypsinized for 30 s and centrifuged at 1500 rpm for 5 min at 4 °C to collect the cells. The cells were washed twice with precooled PBS, and the PBS was discarded. Subsequently, the cells were collected and stored in liquid nitrogen. There are six A2780 cell samples, three of which are in the blank group and three in the corilagin-treated group. The TRIzol method was used to extract total RNA from the samples of the treatment group and the blank group. The gene background of the treatment group was compared with that of the blank group to screen for differentially expressed genes. The data results were compared with the KEGG database, and the differentially expressed genes were compared and analyzed to screen out the primary genes involved in apoptosis, apoptosis-related signaling pathways, or related metabolic pathways.
2.8. Real-Time Fluorescent Quantitative PCR
This study conducted real-time fluorescence quantitative analysis of relevant genes on the predicted pathways of transcriptome gene sequencing. Simply put, adding 100 μ Add m/mL corilagin to A2780 cells, incubate for 24 hours, extract RNA, prepare a reverse transcription reaction system according to the reverse transcription kit, and reverse transcribe to synthesize cDNA. Using real-time fluorescence quantitative polymerase chain reaction (qRT PCR) for analysis β- Actin is an internal reference gene.
(
Table 1 shows sequences of the used PCR amplification primers).
4. Discussion
Research to reveal the anticancer potential of corilagin was started in 1985 [
15]. In the RNA tumor virus, it inhibited reverse transcriptase activity [
16]. Tong and coworkers [
17]. reported that corilagin stimulated autophagy and reactive oxygen species-mediated apoptosis in breast cancer cell lines (MDA-MB-231 and MCF-7). Deng et al [
18]. observed that corilagin downregulated the p-AKT expression while upregulating p53 protein expression in the SMMC-7721 cell line in a concentration-dependent manner. Furthermore, the breakdown of caspase-9, caspase-3, and PARP was detected, which supported the stimulation of the intrinsic apoptotic pathway. However, although previous studies have shown that corilagin can effectively inhibit tumor activity, the relative effect of corilagin on ovarian cancer and its potential mechanisms have not been evaluated [
19,
20]. The aim of this study is to elucidate the effects of corilagin on the proliferation, apoptosis, and autophagy of ovarian cancer cells. Through transcriptome sequencing analysis and qPCR analysis, the relationship between its mechanism of action and the PI3K Akt signaling pathway is explored.
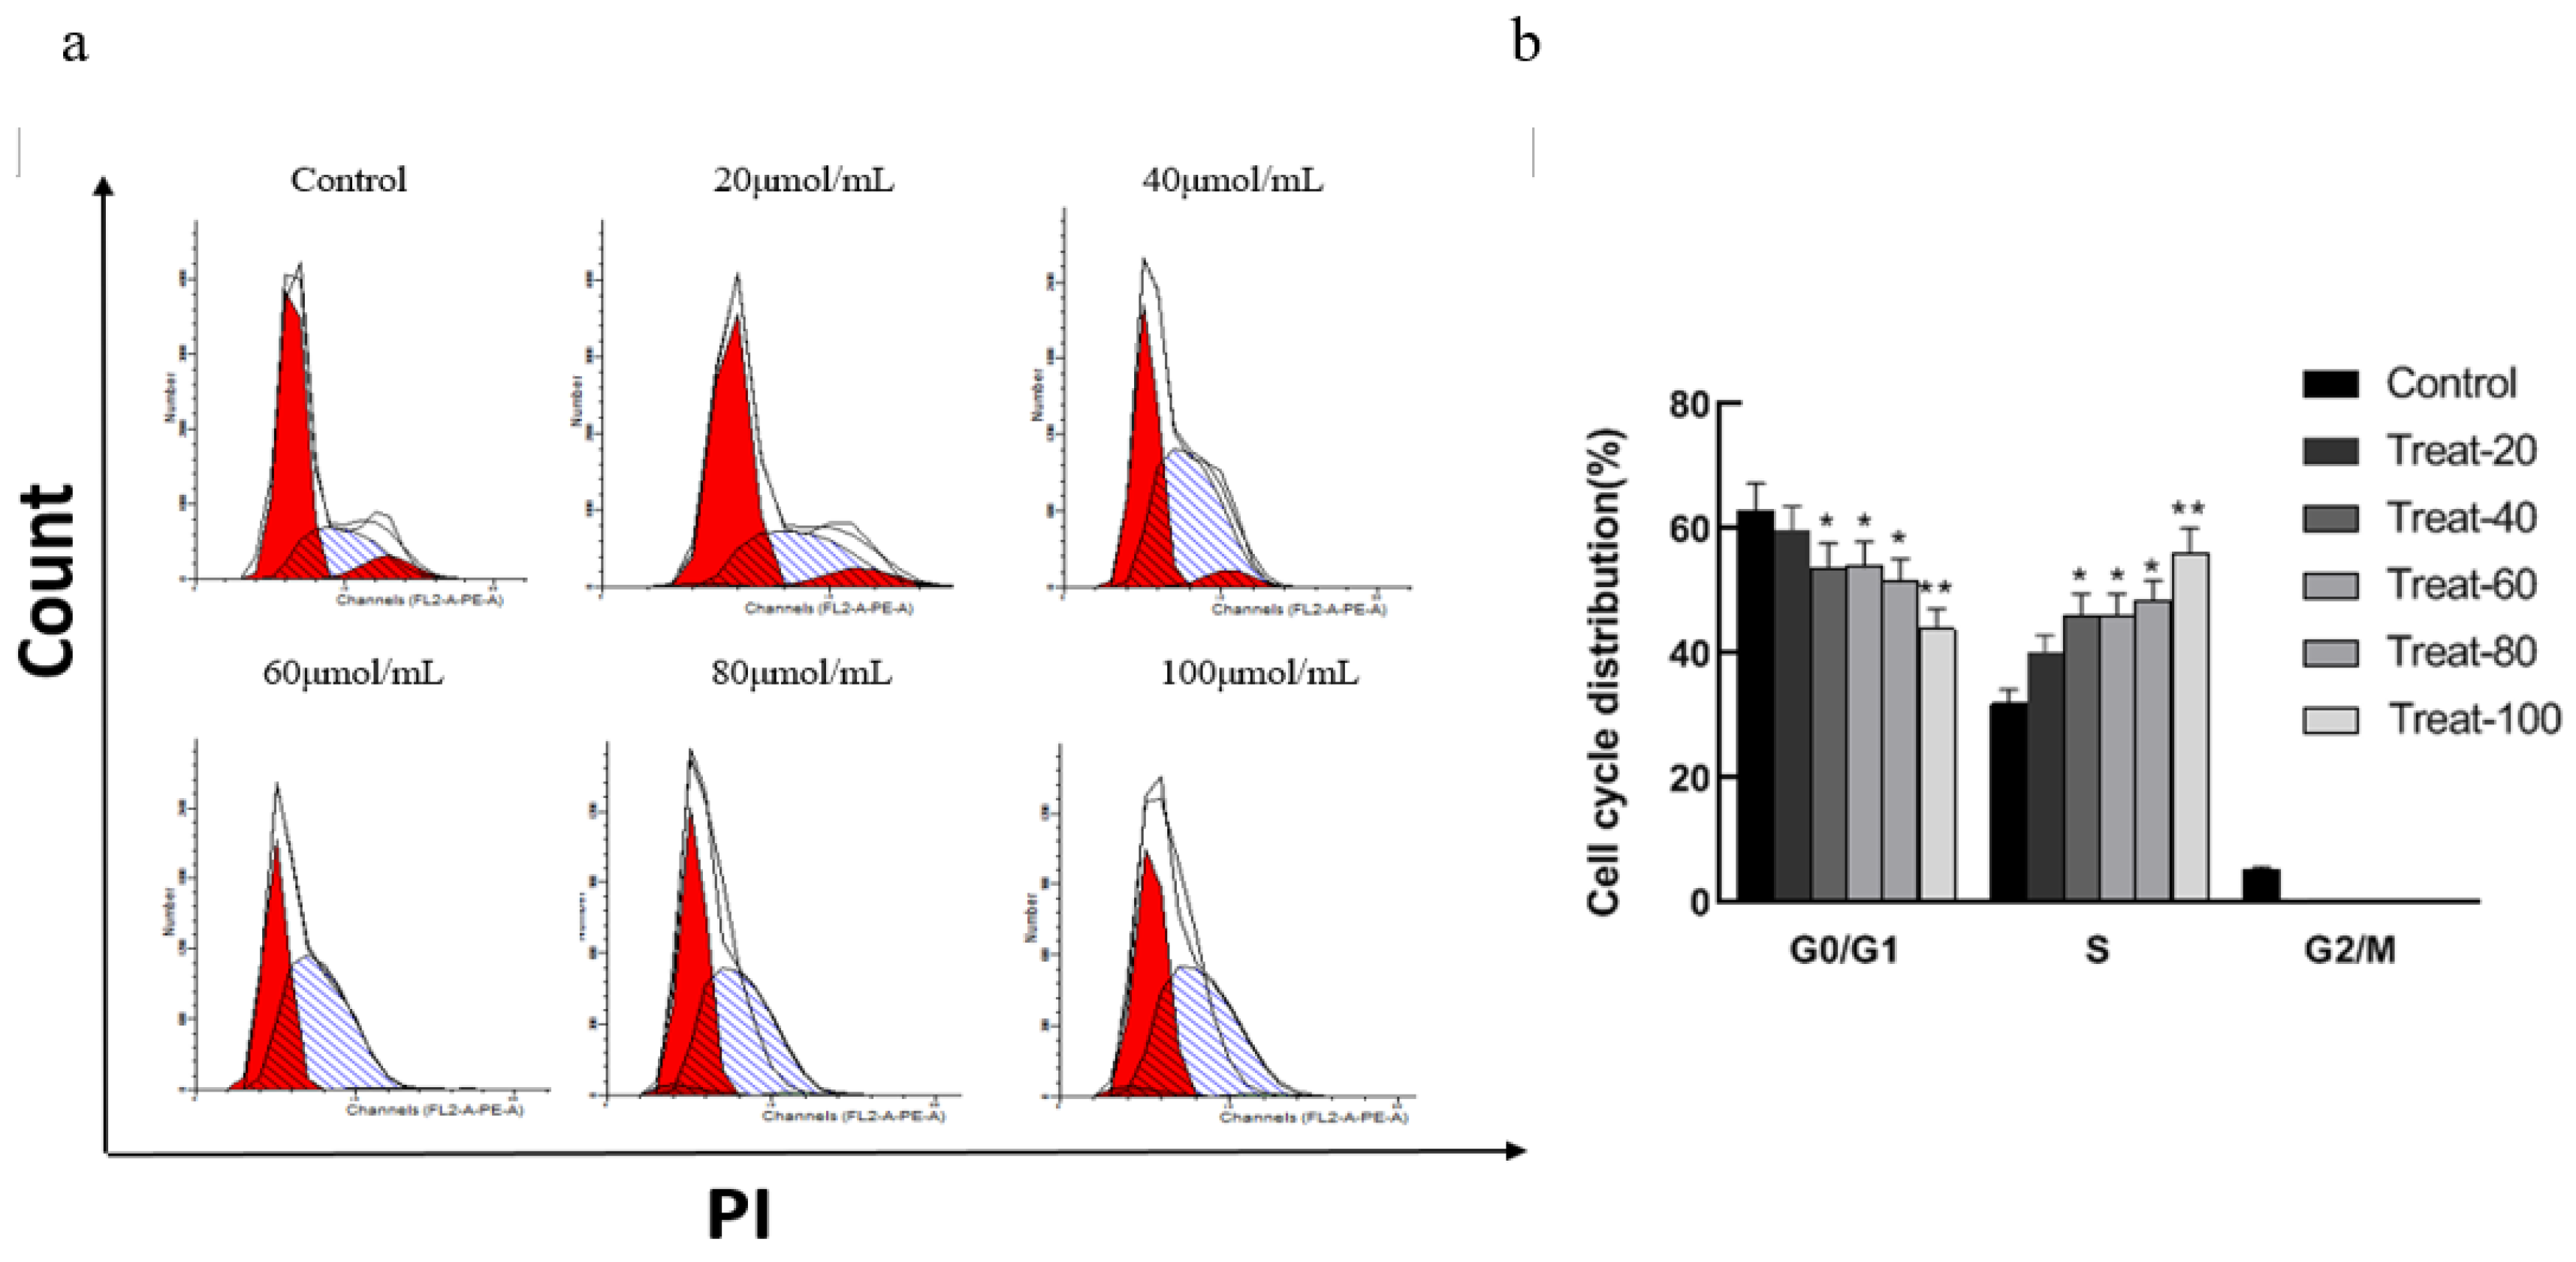
We established an in vitro ovarian cell carcinoma model using A2780 cells. The results of flow cytometry showed that, Corilagin significantly affects the cell cycle of A2780, and low doses can significantly reduce the proportion of G2/M and G0/G1 phase cells in A2780 cells, blocking S-phase cells. The P21 gene is a downstream gene regulated by P53, The P21 gene plays an important role in the cell cycle process [
21,
22,
23], The expression of P21 controls the activity of cyclin dependent protein kinase (CDK), thereby affecting the cell cycle and controlling the process of cell proliferation [
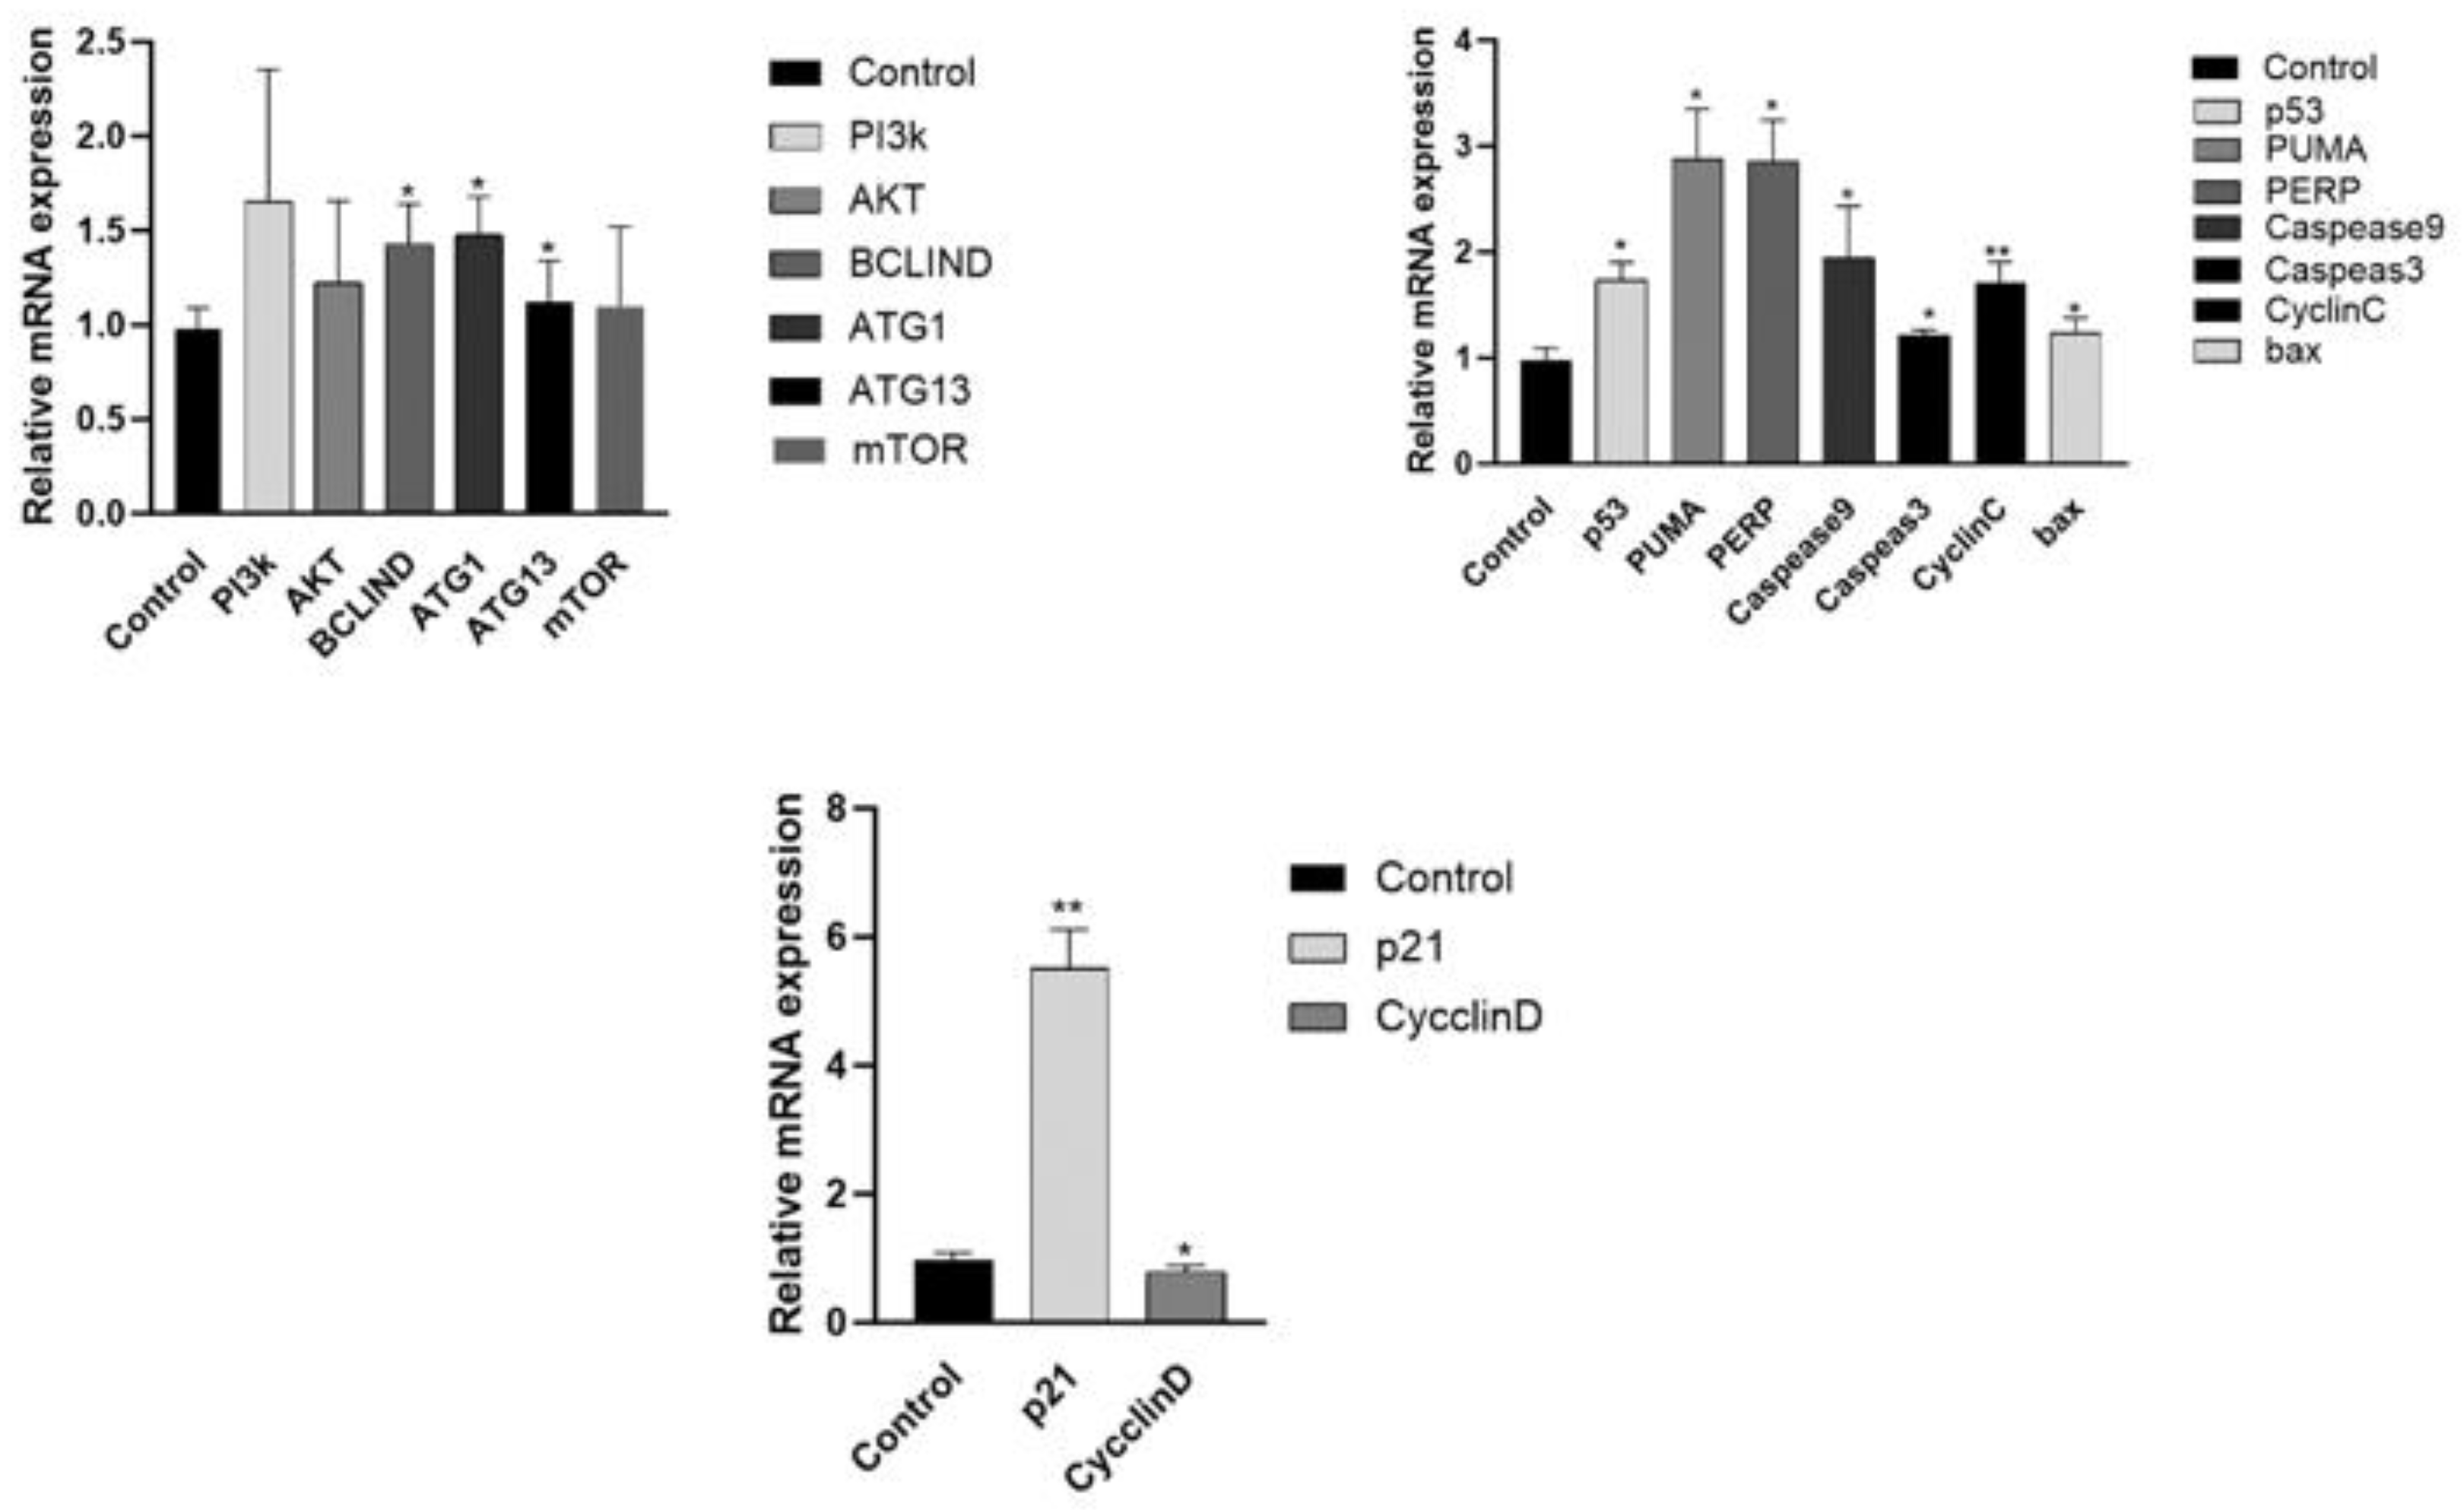
24]. The qPCR data showed that compared with the blank group, the P21 gene expression in the treatment group was significantly increased while the CYCLIND gene expression was significantly reduced. The effect of Corilagin on P21 gene expression may be a partial reason for its cell cycle changes and proliferation inhibition.
Apoptosis is an autonomous and orderly process of cell death controlled by genes under certain physiological or pathological conditions, which is beneficial for maintaining the stability of the organic environment in vivo [
25,
26,
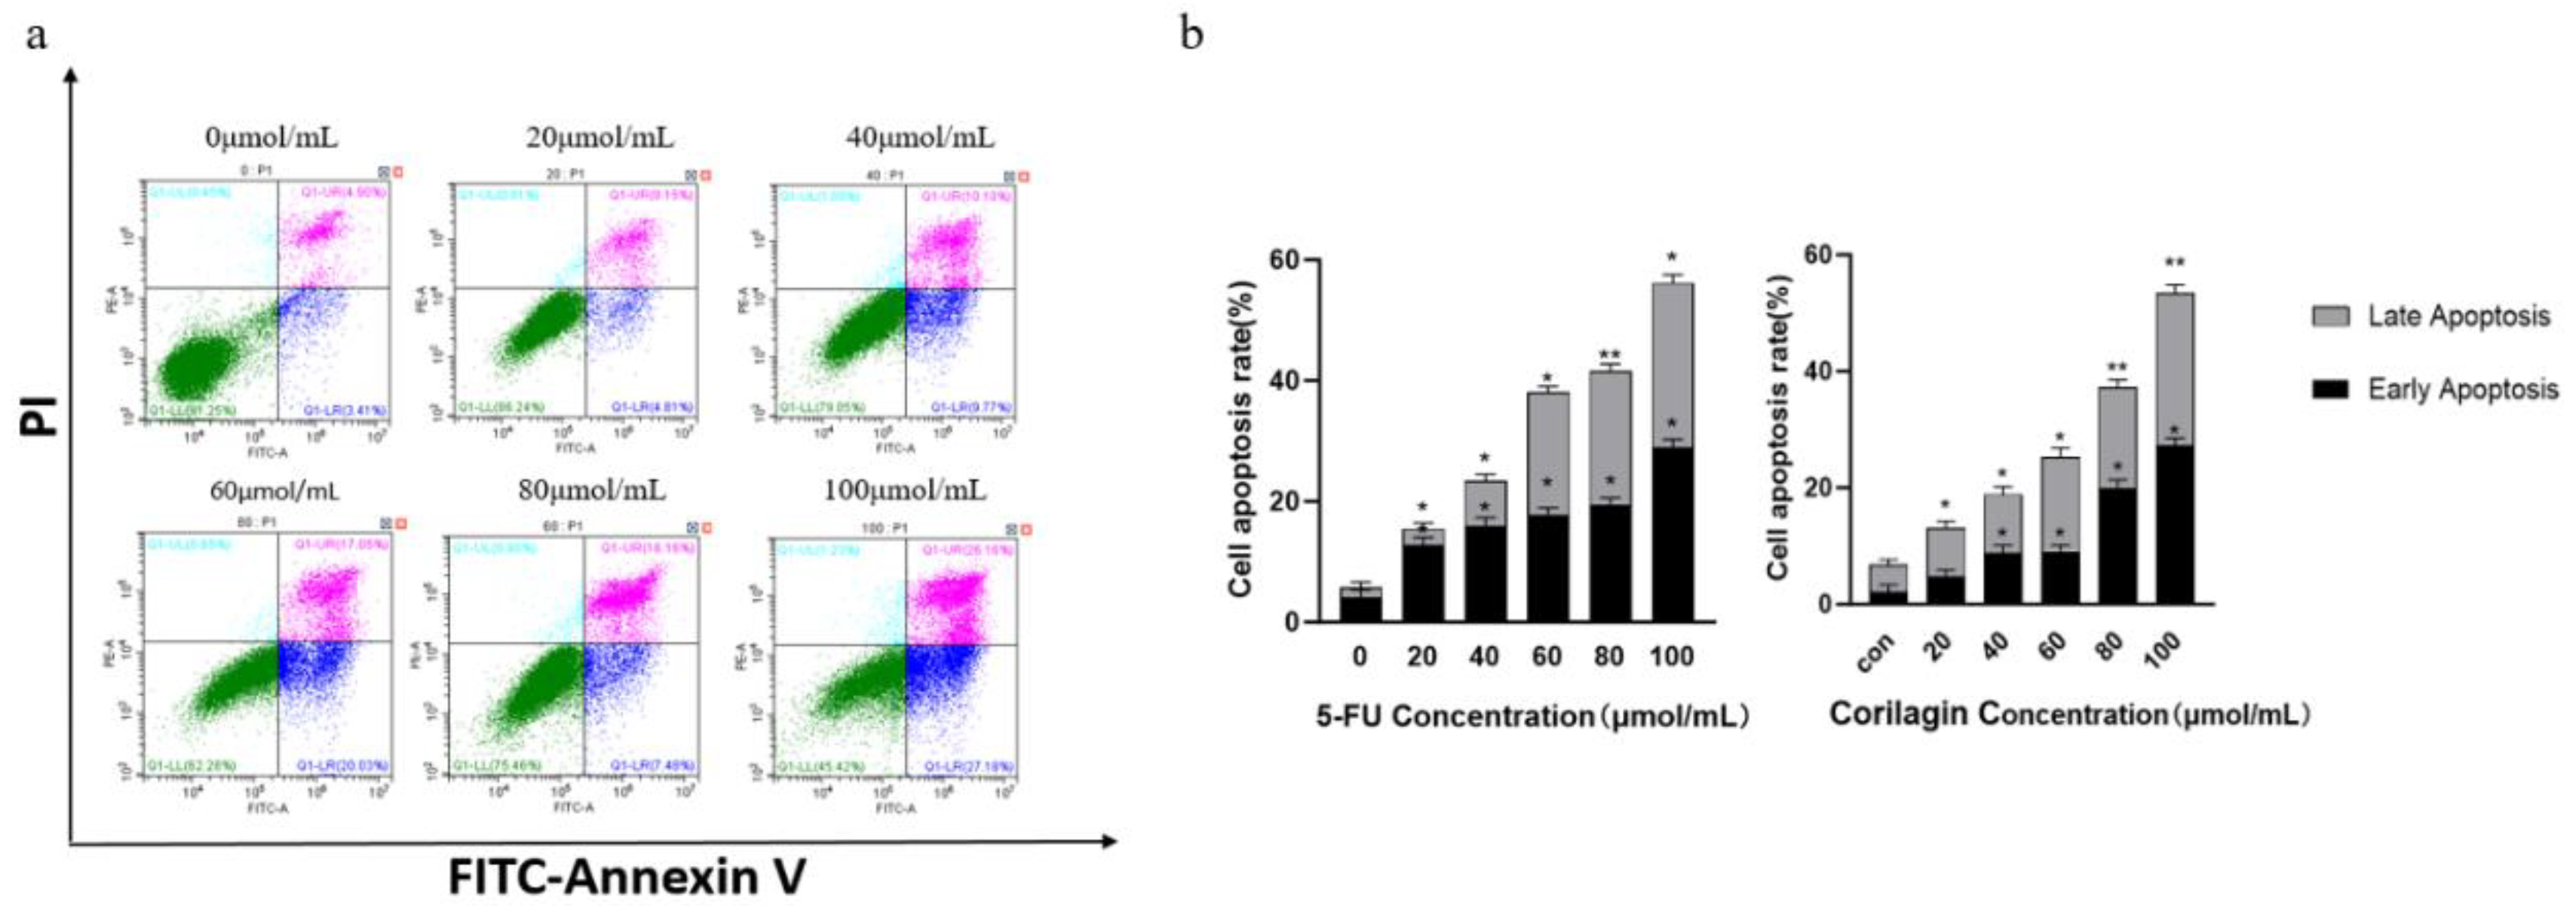
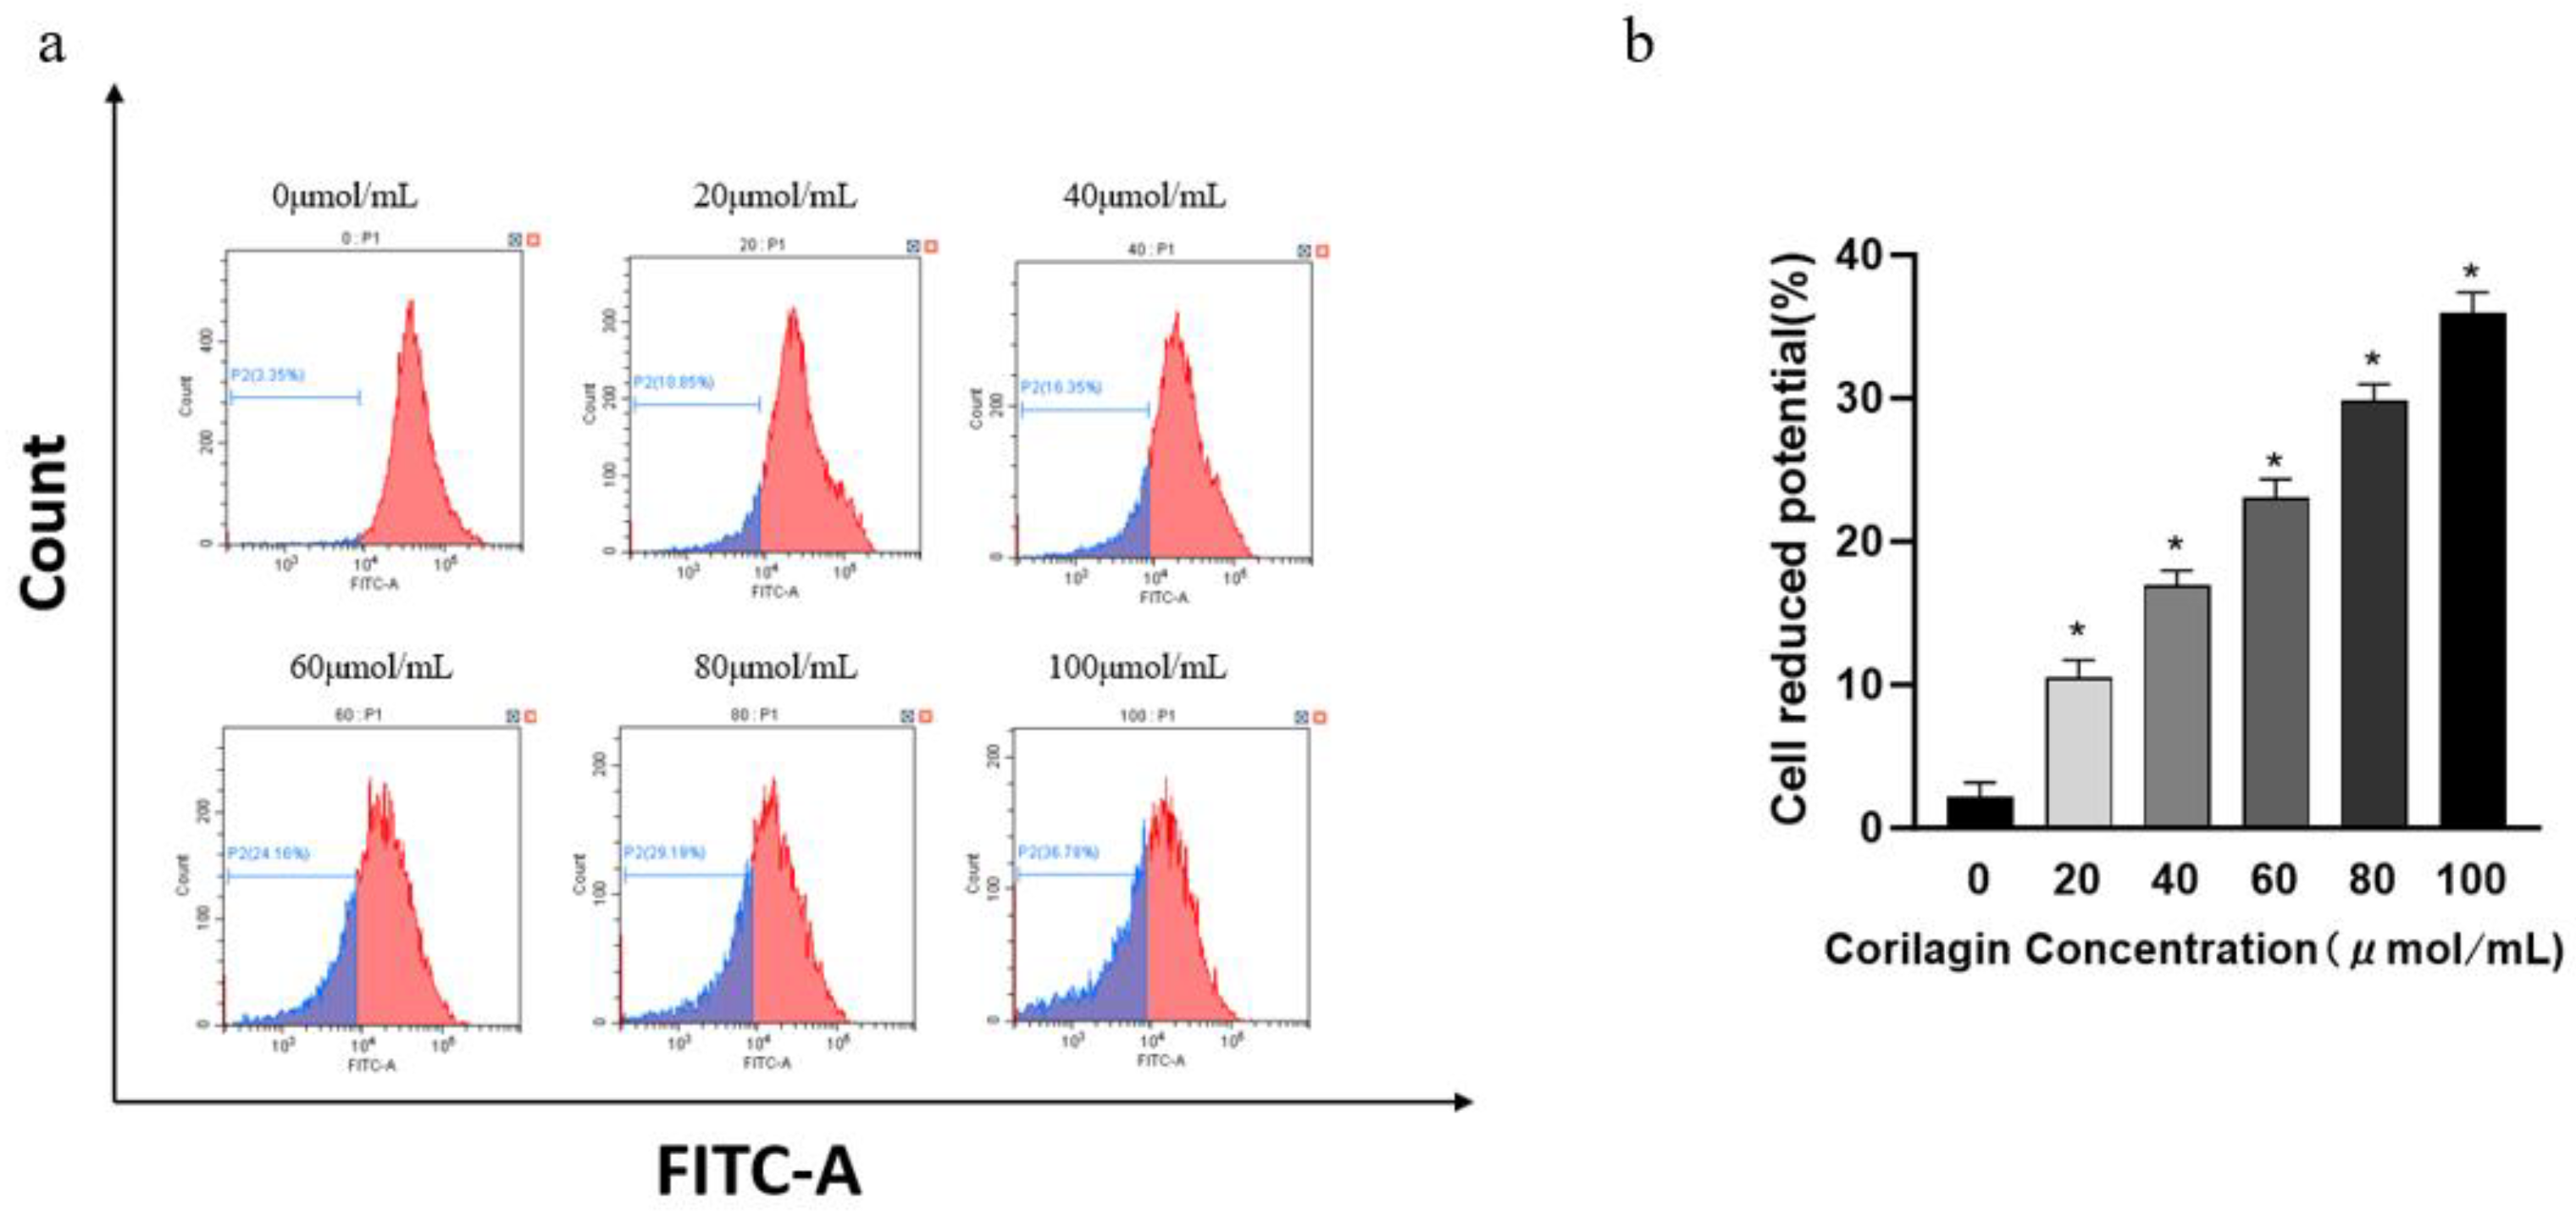
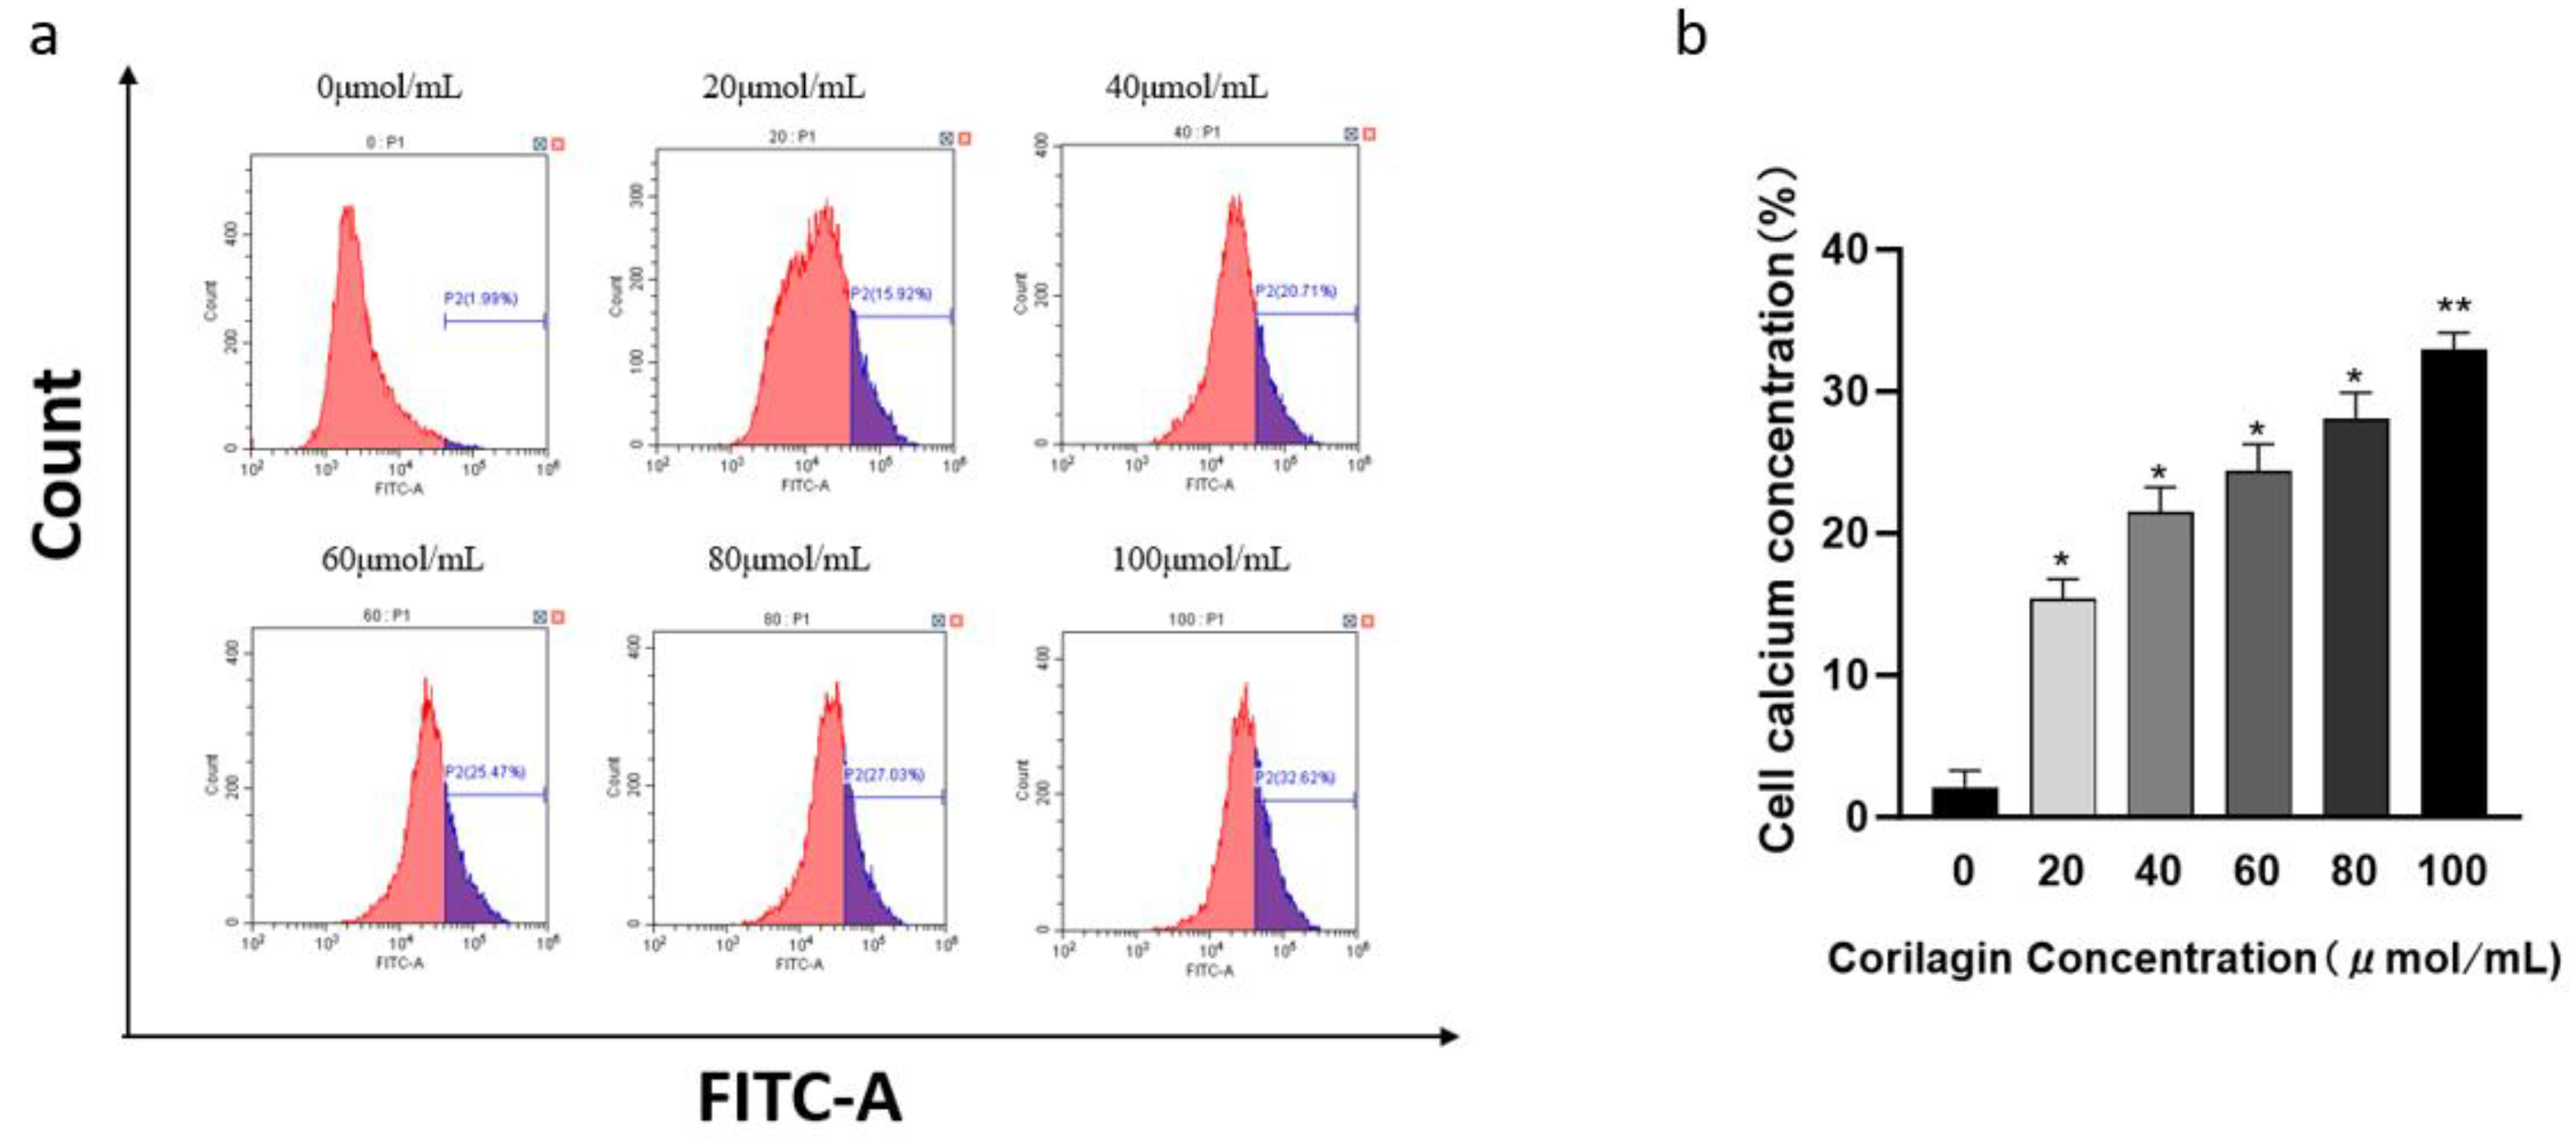
27]. In this study, flow cytometry results showed that Corilagin can induce cell apoptosis. With the increase of Corilagin concentration, the total apoptosis rate and early and late withered cells also increased. This result is consistent with the changes in MMP and Ca2+concentrations. We found through transcriptome gene analysis that a large number of apoptosis related genes were concentrated in the PI3K-AKT pathway after Corilagin acted on A2780 cells, which may induce cell apoptosis through the PI3K-AKT pathway. In order to further investigate the relationship between Corilagin's inhibition of cell apoptosis and the p53 signaling pathway, we first analyzed the changes in related genes and proteins on the p53 signaling pathway using qRT PCR method. The qPCR results showed that the expression of P53 gene was upregulated in cells after the action of Corilagin, which stimulated the expression of downstream gene Bax to increase , leading to an increase in Bax expression in cells, BCL-2 reduces the onset of cell apoptosis, and in addition, CASPEASE9 The increased expression of apoptosis factors in CASPEASE3, PUMA, and CYTOCHROME C indicates that the effect of colilagin can induce cell apoptosis through the PI3K/P53 pathway. This result is consistent with the flow cytometry detection of cell apoptosis, mitochondrial membrane potential, and intracellular calcium ion concentration.
In addition, we investigated the effect of corilagin on autophagy in A2780 cells. There is a complex interaction between autophagy and cell apoptosis, and various stress stimuli can activate both, share multiple regulatory molecules, and even coordinate with each other [
28,
29,
30,
31]. Members of the Bcl-2 family play a crucial role in cellular autophagy, BECLIN-1 is a key protein in cellular autophagy among members of the Bcl-2 family [
32]. In the early stages of autophagy, BECLIN-1 forms a complex with Vps34 and Vps15 to promote autophagosome generation [
33]. Experiments have shown that after acting on A2780 cells, the PI3K There were no significant changes in the levels of AKT and MTOR genes, but the formation of ULK complexes in cells during autophagy stimulated an increase in BECLIN 1 expression, leading to the ultimate occurrence of autophagy. BECLIN-1 in cells The increased expression of ATG13 and ATG8 genes suggests that autophagy may occur in cells. This result suggests that the effect of corilagin may induce autophagy through the PI3K/mTOR pathway.
In summary, this study indicates that the in vitro anti-tumor effect of corilagin is mainly achieved through three aspects. Firstly, corilagin regulates the expression of P21 related genes in A2780 cells, leading to changes in the cell cycle; Secondly, it improves BECLIN-1 ATG13 and ATG8 gene expression induce cellular autophagy; Finally, it upregulates P53 The expression of PUMA, BAX, CASPEASE9, CASPEASE3, and CYTOCHROME C genes induces apoptosis in A2780 cells. It is worth noting that the mechanism of occurrence and development of ovarian cancer is complex, therefore further in vivo experimental research is needed in the future. In addition, The low bioavailability of corilagin and its metabolites is also an important issue. Therefore, exploring existing and updated drug delivery systems, as well as delivering effective concentrations of drugs into the body to achieve therapeutic goals, is crucial for overcoming this problem [
34,
35,
36]. In the future, designing a more reasonable delivery system to complete the internal delivery of corilagin will be an important research direction. In summary, this study provides more directions for the treatment of ovarian cancer and references for the development of related health foods.
5. Conclusion
(1) Corilagin has a significant impact on the A2780 cell cycle and can significantly reduce G0/G1 G2/M phase cell ratio, which blocks cells in the S phase; Low concentration of corilagin can significantly induce apoptosis, decreased mitochondrial transmembrane potential, and calcium ion influx in A2780 cells. After corilagin treatment, the cells were stained with acridine orange and observed under a fluorescence microscope to produce autophagosomes, which increased with increasing concentration.
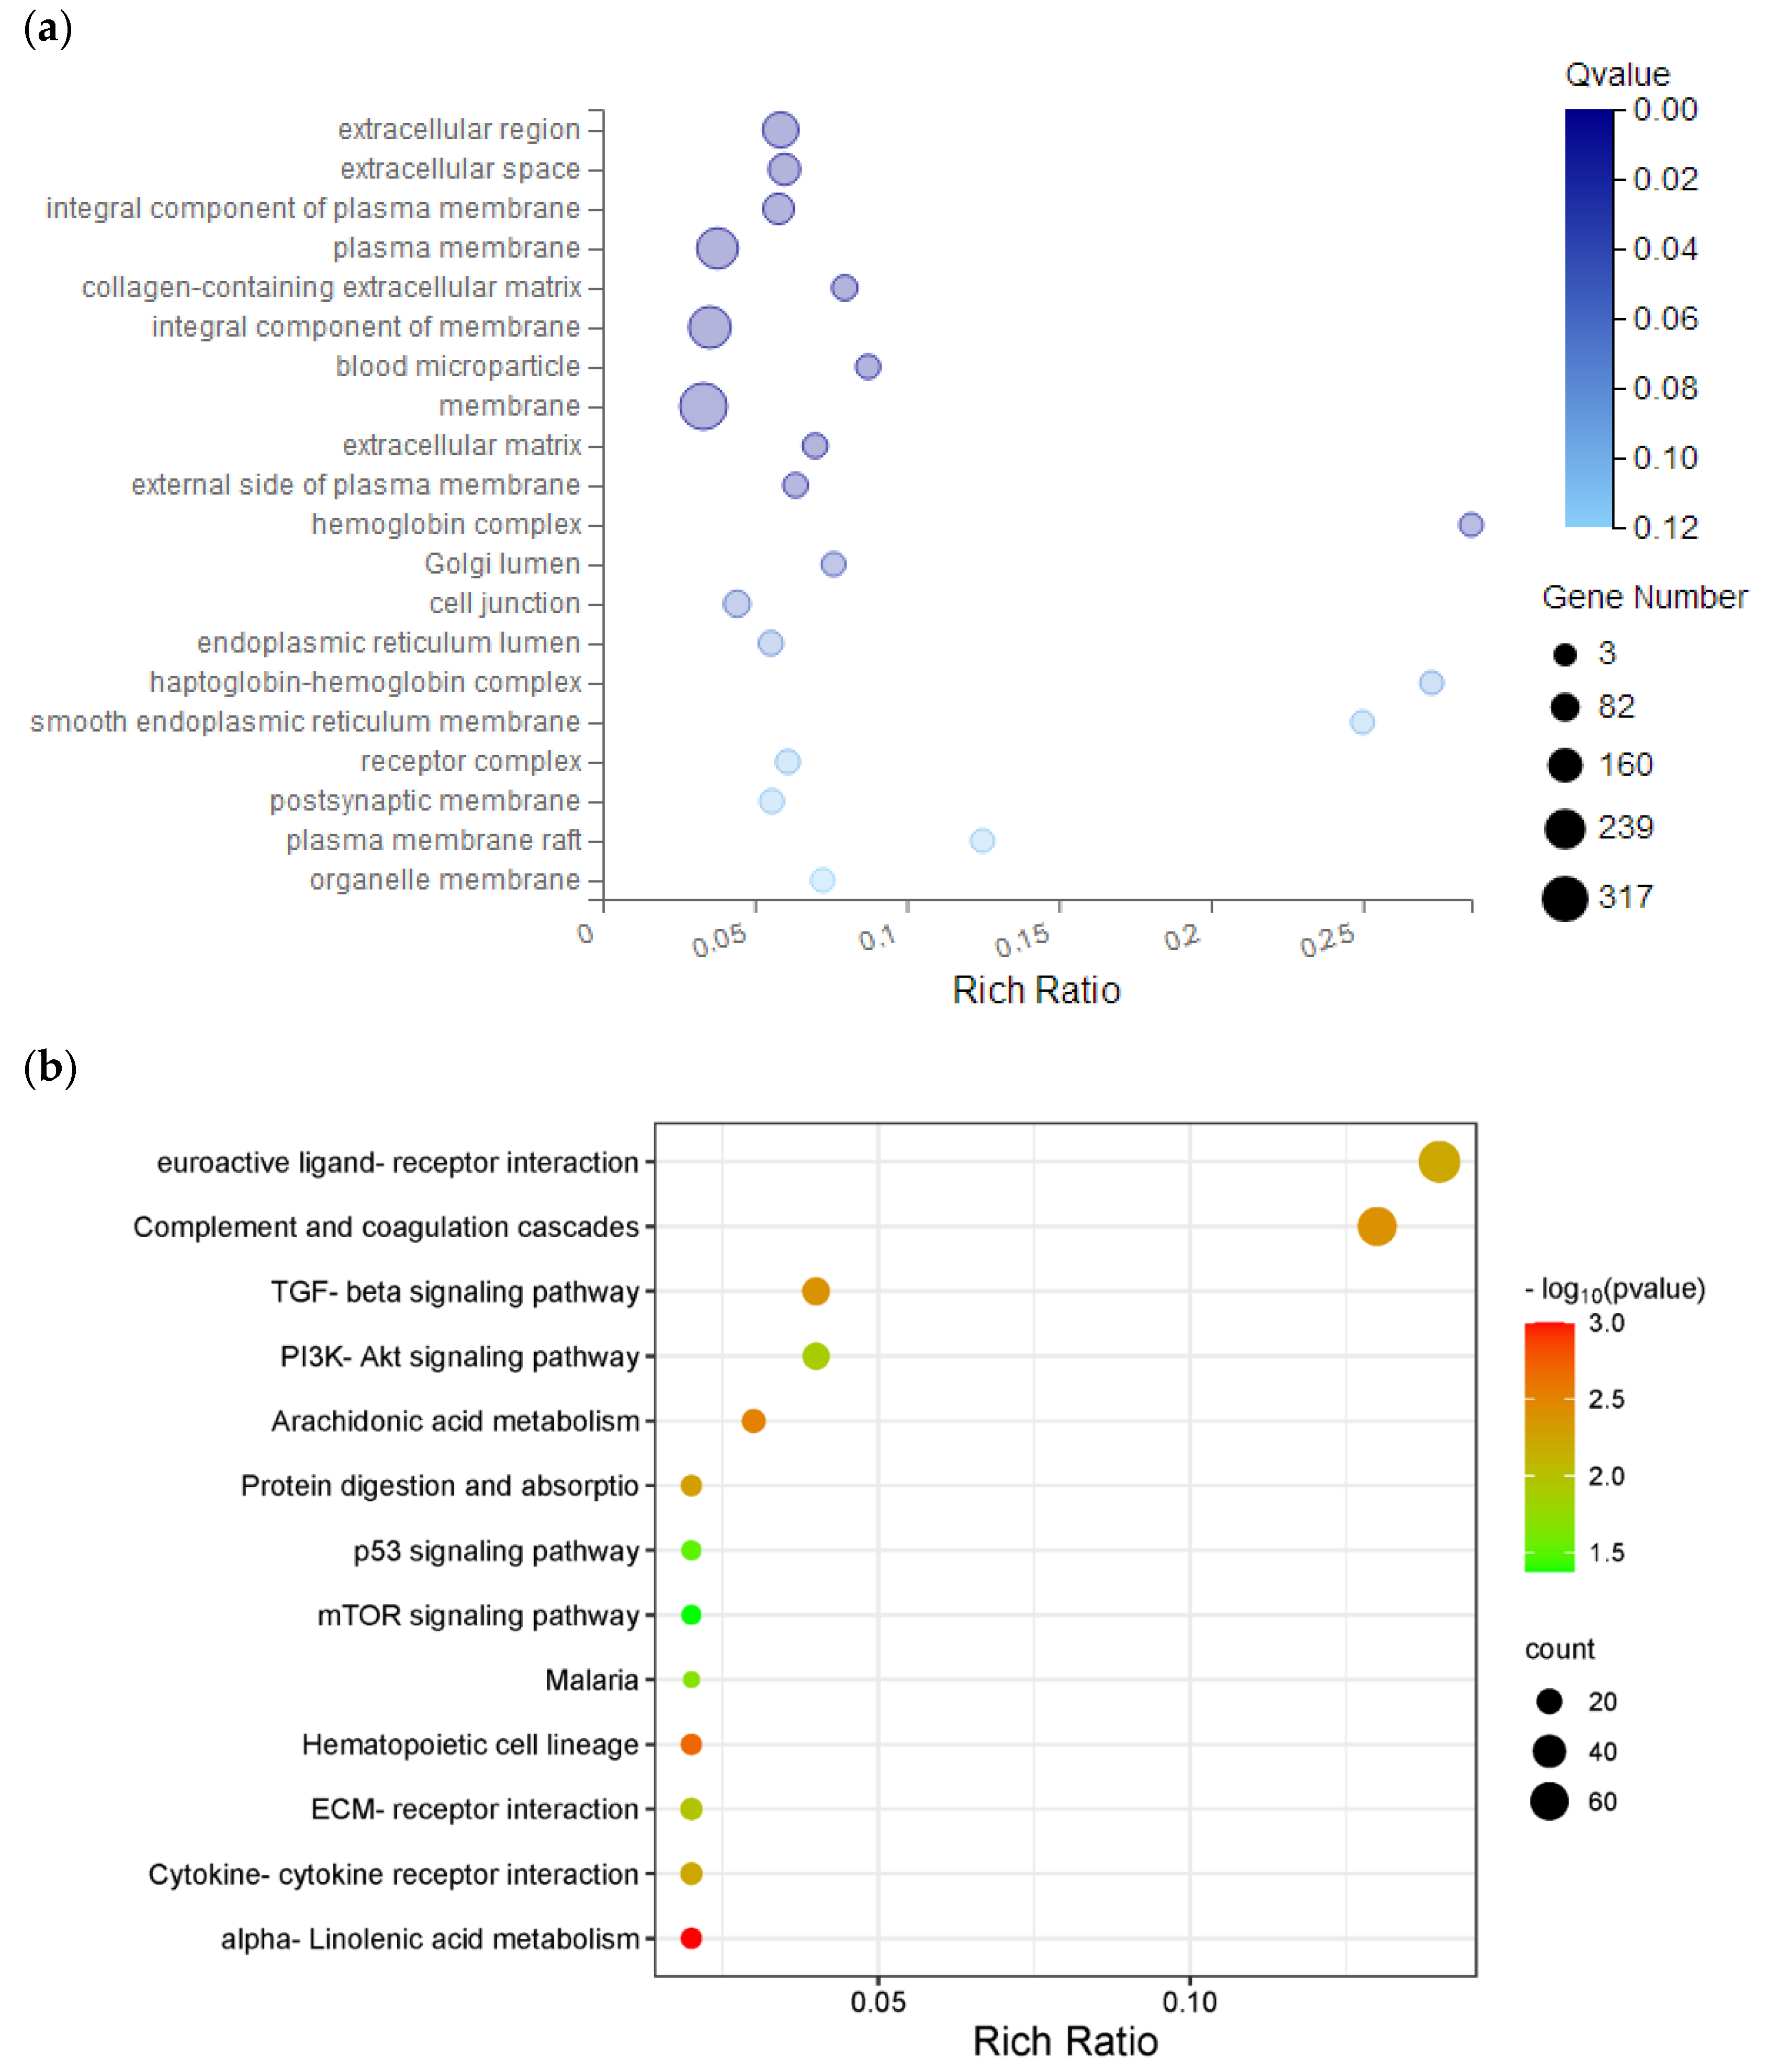
(2) After acting on A2780 cells, transcriptome gene analysis revealed that a large number of apoptosis related genes were concentrated in the PI3K-AKT pathway, which may induce cell apoptosis through the PI3K-AKT pathway. Through qPCR validation, it was found that incubation of A2780 cells with 100 μ mol/mL of corilagin for 24 hours resulted in an increase in P21 gene expression, Decreased expression of CycliND induces changes in the cell cycle; Increased expression of BECLIN-1, ATG13, and ATG8 genes leads to cellular autophagy; Upregulation of P53, PUMA, BAX, CASPEASE9, CASPEASE3, and CYTOCHROME C gene expression induces cell apoptosis.
Figure 1.
Effects of corilagin on A2780 cell cycle.(a) Intracellular fluorescence intensity of A2780 cells cultured with corilagin (0, 20, 40, 60, 80, 100 μmol/mL) for 48 h. (b) Average fluorescence intensity of A2780 cells. *P < 0.05, **P < 0.01 vs. 0 μmol/mL.
Figure 1.
Effects of corilagin on A2780 cell cycle.(a) Intracellular fluorescence intensity of A2780 cells cultured with corilagin (0, 20, 40, 60, 80, 100 μmol/mL) for 48 h. (b) Average fluorescence intensity of A2780 cells. *P < 0.05, **P < 0.01 vs. 0 μmol/mL.
Figure 2.
Effects of corilagin on apoptosis of A2780 cells. (a) FITC-Annexin V/PI double-staining flow cytometry showing apoptosis rate of A2780 cells after treatment with corilagin(0, 20, 40, 60, 80, 100 μmol/mL) for 48 h. (b) Average apoptosis rate of A2780 cells. PI, propidium iodide. *P < 0.05, **P < 0.01 vs. 0 μmol/mL.
Figure 3.
Effects of corilagin on mitochondrial membrane potential in A2780 cells. A2780 cells were incubated with different concentrations of corilagin for 48 h. ∆ψm was evaluated using JC-1 in treated cells. (a) ∆ψm after treatment of cells with 0, 20, 40, 60, 80, 100 μmol/mL corilagin (b) Average mitochondrial membrane potential rate of A2780 cells.corilagin.*P < 0.05, **P < 0.01 vs. 0 μmol/mL.
Figure 4.
Effect of corilagin on intracellular Ca2+ concentration in A2780 cells. A2780 cells were incubated with different concentrations of corilagin for 48 h. Fluo 3-AM assay was performed to determine Ca2+ concentration. (a) Intracellular Ca2+ concentration after treatment of cells with 0, 20, 40, 60, 80, and 100 μmol/mL (b) Average Cytoplasmic calcium rate of A2780 cells. *P < 0.05, **P < 0.01 vs. 0 μmol/mL.
Figure 5.
Effect of corilagin on autophagy in ovarian cancer A2780 cell.A2780 cells were incubated with different concentrations of corilagin(0, 20, 40, 60, 80, 100 μmol/mL) for 24 h, determine the autophagy status of cells treated with acridine orange staining as shown in the figure.
Figure 5.
Effect of corilagin on autophagy in ovarian cancer A2780 cell.A2780 cells were incubated with different concentrations of corilagin(0, 20, 40, 60, 80, 100 μmol/mL) for 24 h, determine the autophagy status of cells treated with acridine orange staining as shown in the figure.
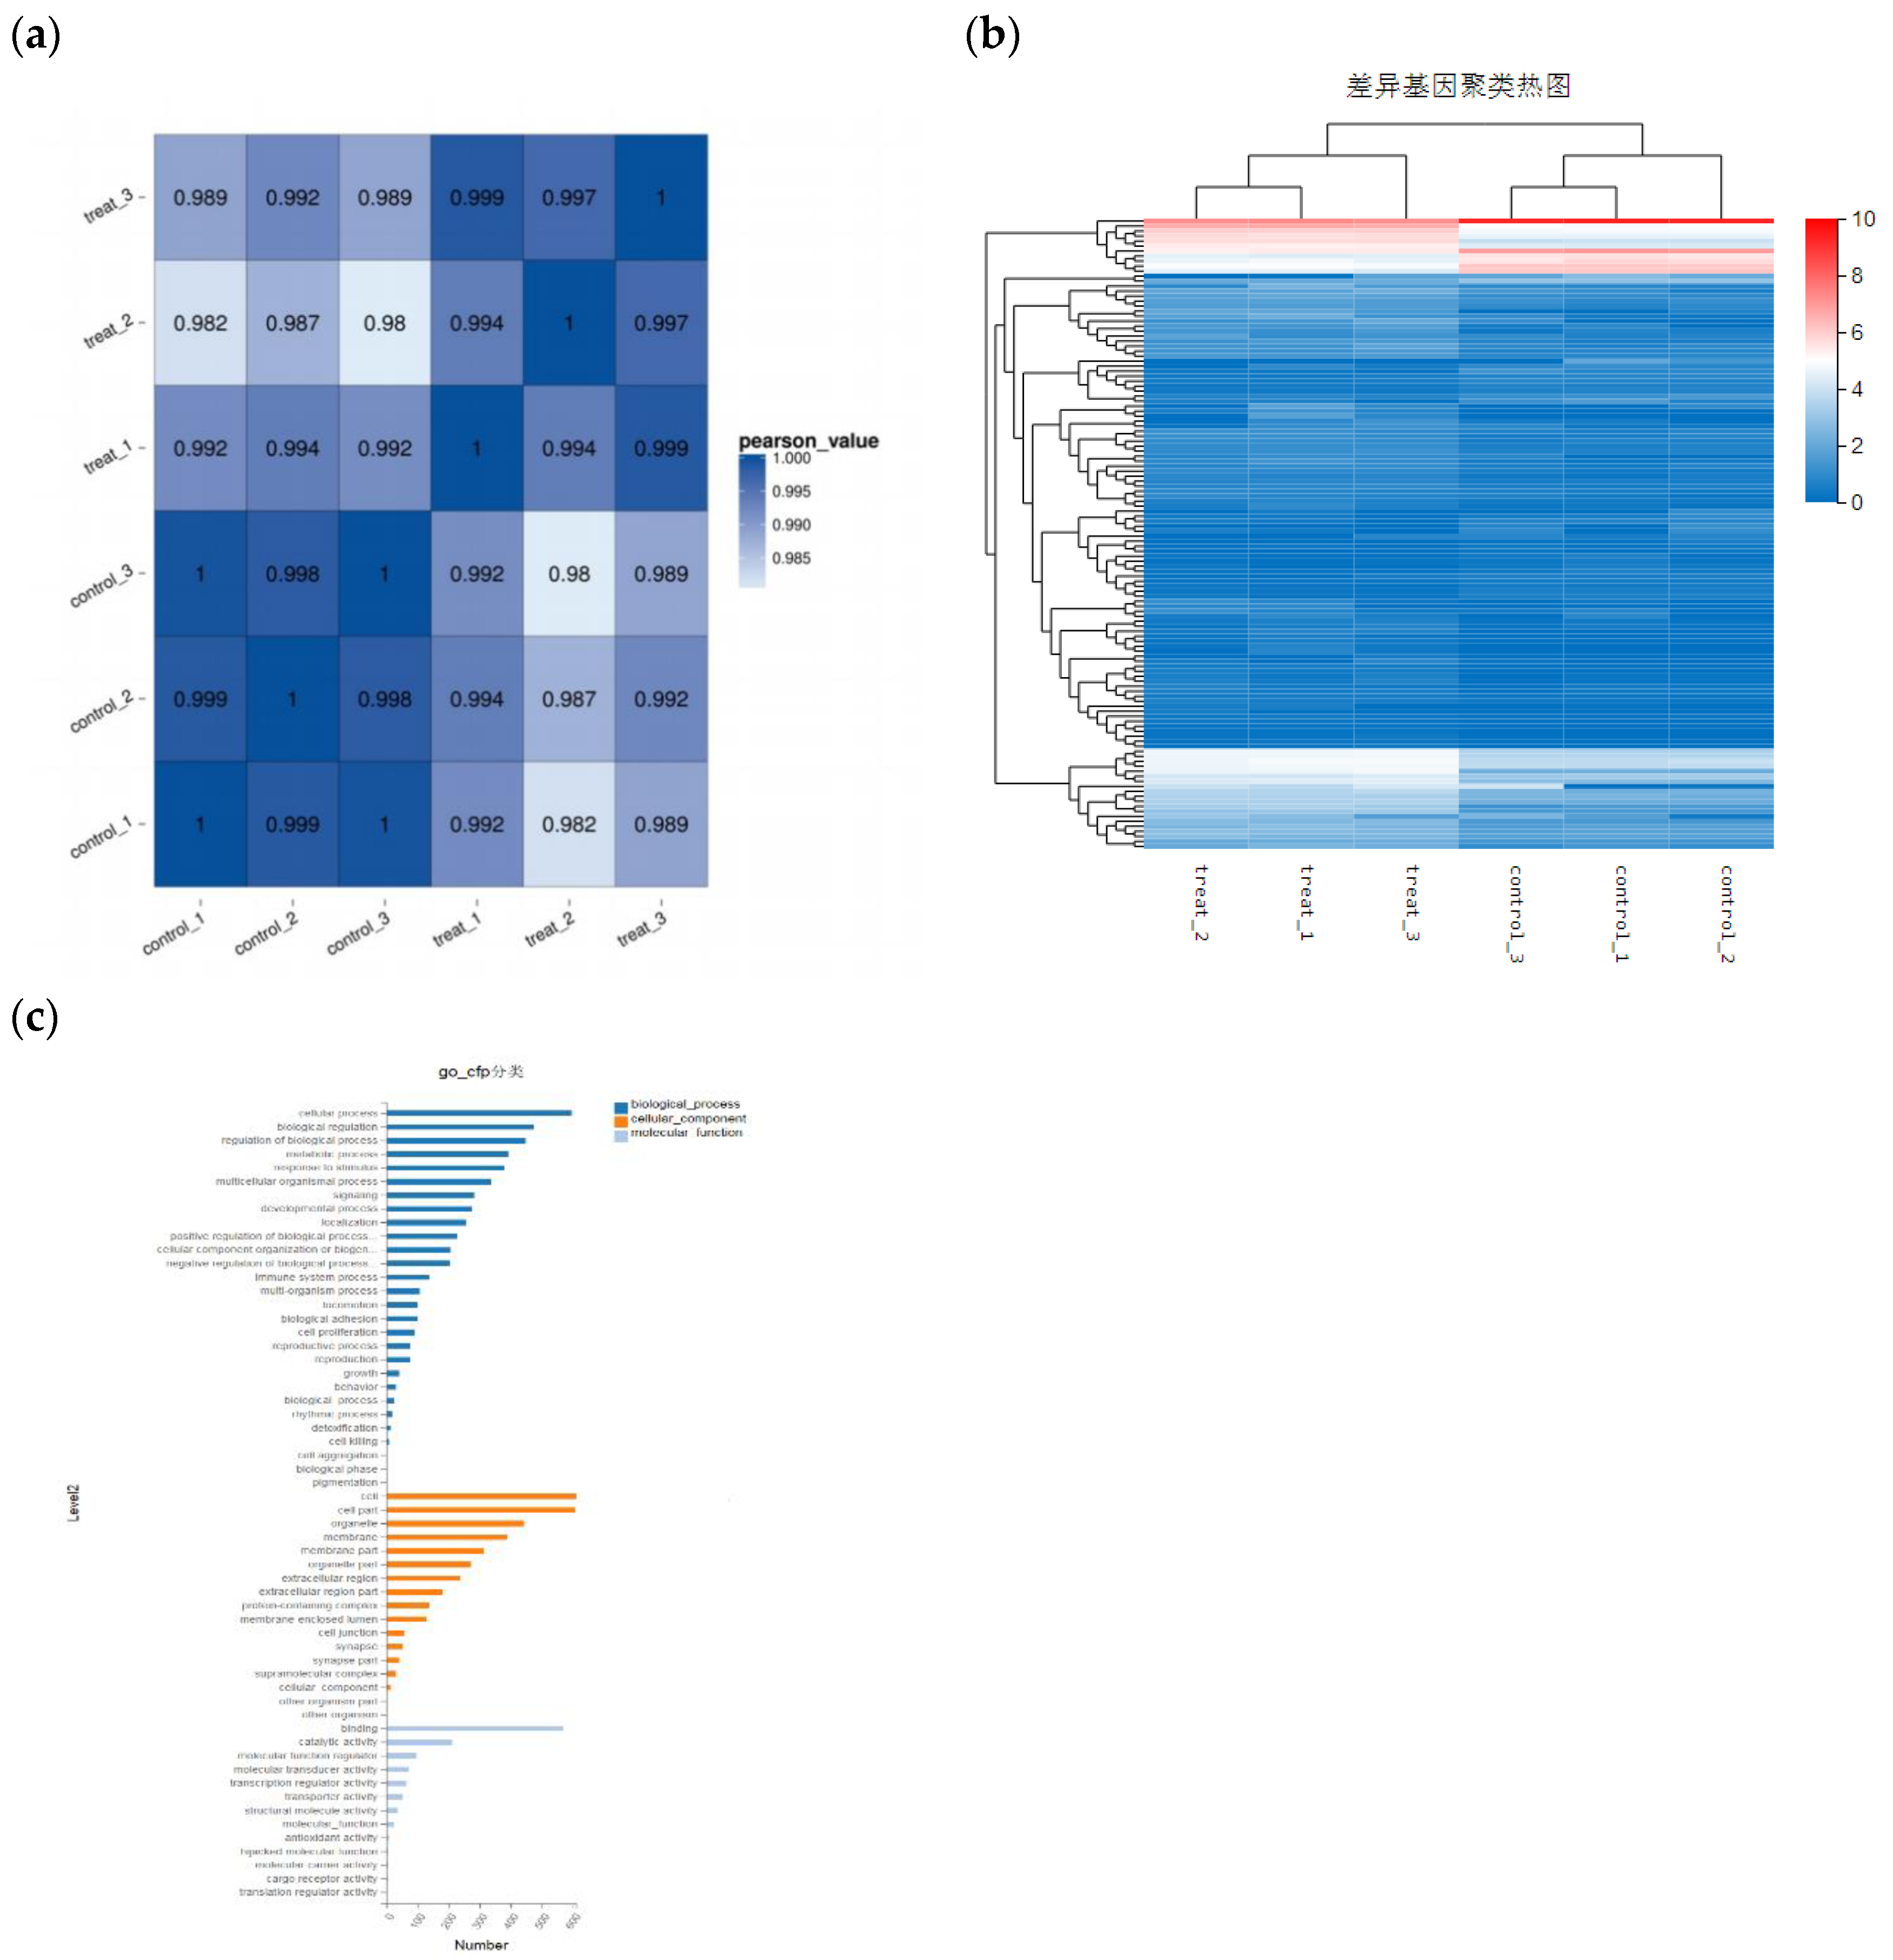
Figure 6.
Distribution of differential gene expression. (a) Sample correlation analysis. (b) Analysis of gene differential expression among samples. (c) Differential gene function GO-cfp classification.
Figure 6.
Distribution of differential gene expression. (a) Sample correlation analysis. (b) Analysis of gene differential expression among samples. (c) Differential gene function GO-cfp classification.
Figure 7.
GO and KEGG pathway analysis of hub genes. (a) GO analysis. (b) KEGG pathway analysis. GO, gene ontology; KEGG, Kyoto encyclopedia of genes and genomes.
Figure 7.
GO and KEGG pathway analysis of hub genes. (a) GO analysis. (b) KEGG pathway analysis. GO, gene ontology; KEGG, Kyoto encyclopedia of genes and genomes.
Figure 8.
qPCR testing gene changes in A2780 cell,*p < 0.05; **p < 0.01.
Figure 8.
qPCR testing gene changes in A2780 cell,*p < 0.05; **p < 0.01.
Table 1.
PCR primer sequence.
Table 1.
PCR primer sequence.
| Gene |
Gene Forward primer (5’→3’) |
Reverse primer (5’→3’) |
| P53 |
GTTCCGAGAGCTGAATGAGG |
TCTGAGTCAGGCCCTTCTGT |
| P21 |
GACACCACTGGAGGGTGACT |
CAGGTCCACATGGTCTTCCT |
| CYCLIND |
AACTACCTGGACCGCTTCCT |
CCACTTGAGCTTGTTCACCA |
| BAX |
AAGAAGCTGAGCGAGTGTCT |
GTTCTGATCAGTTCCGGCAC |
| BCL-2 |
GCCTTCTTTGAGTTCGGTGG |
CAAATCAAACAGAGGCCGCA |
| CASPEASE3 |
ACTGGACTGTGGCATTGAGA |
GCACAAAGCGACTGGATGAA |
| CASPASE9 |
GCCCCATATGATCGAGGACA |
CAGAAACGAAGCCAGCATGT |
| CYTOCHROME C |
ATGAAGTGTTCCCAGTGCCA |
CTCTCCCCAGATGATGCCTT |
| PERP |
TGCCATCATTCTCATTGCAT |
AACCCCAGTTGAACTCATGG |
| PUMA |
GAGGAGGAACAGTGGGCC |
GGAGTCCCATGATGAGATTGT |
| PI3K |
AAACAAAGCGGAGAACCTATTG |
TAATGACGCAATGCTTGACTTC |
| AKT |
TGCACAAACGAGGGGAATATAT |
CGTTCCTTGTAGCCAATAAAGG |
| MTOR |
GAGATACGCTGTCATCCCTTTA |
CTGTATTATTGACGGCATGCTC |
| BECLIN 1 |
ATCTAAGGAGCTGCCGTTATAC |
CTCCTCAGAGTTAAACTGGGTT |
| ATG13 |
AGCTGGAAATATGGTGTCTTGA |
CAGCAATGACAGTCTGTTGTAC |
| ATG8 |
CTCGTTTAGTGAACCGTCAGAAT |
AACCGGAACCCTTAAACATGT |
| β-ACTIN |
CATCCGCAAAGACCTGTACG |
CCTGCTTGCTGATCCACATC |
