Preprint
Article

Residue Addition Can Mitigate Soil Health Challenges with Climate Change in Drylands: Insights from a Field Warming Experiment in Semi-arid Texas

Altmetrics

Downloads

103

Views

47

Comments

0

A peer-reviewed article of this preprint also exists.

Submitted:

07 August 2024

Posted:

08 August 2024

You are already at the latest version

Alerts
Abstract
Texas cotton production is facing challenges arising from increased temperatures and extended droughts. One potential solution to mitigate these environmental stresses lies in enhancing soil health through measures aimed at increasing soil organic matter and microbial biomass. Our field study investigated the effectiveness of adding residue on soil surface to increase soil organic matter content, microbial biomass, and cotton production under experimental warming with open-top chambers (OTCs). The OTCs raised the air temperature by 2 °C but did not affect soil temperature. OTCs also increased microbial biomass and soil respiration rate. Residue addition increased moisture content in non-irrigated (i.e., dryland) soils under experimental warming and concurrently reduced the daily temperature range in warmed plots. Furthermore, residue addition increased microbial biomass and soil respiration, particularly under OTC treatments in dryland soils. We also observed increased soil organic matter, microbial biomass, cotton biomass, and yield in irrigated fields compared to dryland. Our findings suggest that residue retention can mitigate the adverse effects of warming by stabilizing soil microclimate and enhancing soil organic matter and microbial biomass levels, especially in drylands. This, in turn, can help attenuate the potential impacts of future climate change on soil health and crop production in semiarid environments.
Keywords: 
Subject: Biology and Life Sciences  -   Agricultural Science and Agronomy

Introduction

The High Plains of Texas have a semi-arid climate where plant growth and agricultural production are limited by high summer temperatures and low water availability. Increased climate extremes such as increased temperature, and more frequent and severe droughts driven by changes in precipitation patterns, have further exacerbated the agricultural soil degradation in this region. As a result, the physical, chemical, and biological aspects of soils have been severely affected, especially in dryland soils. Despite this soil degradation, the total cotton acreage planted in the Texas High Plains has increased over the past few years. However, this increased cotton acreage has not led to a concurrent increase in total cotton production [1]. Furthermore, groundwater, which is the region’s main source of irrigation, is being depleted at an increasing rate [2]. Thus, growers are being forced to reduce irrigation or switch to dryland (i.e., no irrigation) cultivation, a practice that could reduce yields by up to half [3]. Regenerative agricultural practices, for example no tillage, crop rotation, residue retention, and cover crops, have been proposed as a potential mitigation approach as these practices are believed to stabilize the soil microenvironment, thereby maintaining better soil conditions for plant and microbial activity. Several cotton growers in the High Plains of Texas have already taken the initiative to incorporate these practices in their cropping systems [4]. Nevertheless, little is known about how effective these practices would be in moisture-limited arid and semi-arid environments to improve soil health and crop productivity under future projected climate change.
Soil organic matter content in the soil is considered a key soil health indicator. It promotes plant growth by supplying nutrients, improves soil aggregate formation [5], improves water retention [6], and supports soil biological activity [7]. Soil carbon in agricultural soils is declining because of unsustainable land management practices and increasing extreme climate events such as extreme temperature and precipitation. In total, agricultural soils have lost 25-75% of their soil organic carbon pool [8]. In arable agricultural soil, depending on the extent of soil manipulation and farming technique used, cultivation can positively or negatively impact soil organic carbon storage and release [9]. For instance, Luo et al. [10] showed that soil organic carbon at 10 cm below the surface in cultivated land was 51 percent lower than in a natural ecosystem after five decades of farming, indicating that farming decreases organic matter in the soil. Further climate related changes exacerbate this soil carbon loss. Therefore, it becomes crucial to investigate the various factors that have the potential to influence soil organic matter stocks and carbon loss in a warmer world. By understanding these key driving forces, we can effectively address the challenges posed by climate change, ensuring agricultural sustainability and maintaining a balanced ecosystem.
Soil organic matter in the cultivated soil can be increased by adopting regenerative agricultural management practices such as no-tillage, cover cropping, mulching, residue retention, and crop rotation [11,12]. Residue mulching is an important agronomic practice that involves the covering of soil surfaces using organic or inorganic materials. Organic mulches include straw, husk, grasses, compost, and plant residue, while polyethylene plastic mulch is the most used inorganic mulch [13]. The use of mulches helps to minimize water runoff, improve infiltration, and regulate soil temperature and moisture [14]. Organic mulches such as grasses or plant residues not only regulate the soil environment but also contribute to soil health by providing carbon input and plant nutrients, enhancing biological activity in the soil [14]. Residue also reduces evaporation and enhances the water retention rate of the soil, minimizing moisture loss due to excessive evaporation at higher temperatures [15]. Several studies have shown that adding residue to the soil can increase soil organic matter content [16,17]. Conversely, it is important to note that the increased presence of active soil organic matter resulting from residue addition may accelerate the decomposition rate and lead to carbon loss to the atmosphere [18]. Nevertheless, this process keeps the soil system active and dynamic by promoting microbial growth and activities, soil aggregate stability, and continuous recycling of nutrients in the soils.
Climate change can, directly and indirectly, affect soil health by changing the amount of carbon stored in soils and soil biological activity [19,20] although whether it causes net carbon loss or net increases soil carbon is still debated [21,22,23]. Warming stimulates soil respiration, organic matter decomposition, and nutrient mineralization [24,25,26,27], thereby releasing more carbon from the soil as CO2 [23,28]. Warming also increases plant carbon assimilation, which can enhance soil carbon inputs [29,30,31]. The net change, expressed as the difference between increased carbon loss and increased net primary production in response to warming, determines whether carbon is stored or released from the soil in a warmer world [30,32].
Temperature is not the sole factor influencing soil organic matter decomposition and soil respiration; moisture, microbial abundance, availability and accessibility of soil microbes to the substrate, enzyme activity, and soil properties all play a crucial role [33,34]. Soil organic matter decomposition and soil respiration both increase with temperature if all other factors remain constant [22]. However, in a natural environment, temperature interacts with various other factors within the soil system [35] with the temperature–moisture interaction being the most important factor determining the soil carbon response to warming. Warming reduces soil water availability by increasing evapotranspiration and decreasing soil moisture [36], thereby lowering the rate of organic matter decomposition, even to the point at which soil respiration no longer responds to warming [27]. Soil moisture regulates the warming induced daily temperature fluctuations in the soil. Higher soil moisture increases the specific heat capacity of the soil, which increases the amount of heat needed to raise the soil temperature [37,38]. Dry soils show quicker and larger temperature variation than wet soils under climate extremes. Hence, the complexity of the temperature–moisture interaction in the soil, and its subsequent effects on soil organic matter decomposition need further attention to better understand the effects of future climate change on soil carbon dynamics.
Soil microorganisms and their activity are another important factor influencing soil carbon dynamics by driving plant litter decomposition and soil organic matter formation or directly contributing to the soil carbon pool through microbial biomass [19]. Warming alters plant growth, litter production, and root-derived carbon via root exudates, stimulating soil microbial growth and activity [39,40]. Microbial biomass carbon is highly correlated with plant-derived carbon via root exudation and decomposition [41]. Warming may increase [42], decrease [11,43], or have no effects [44] on microbial biomass carbon. The precipitation pattern, which may govern soil moisture regime and substrate availability, influences the response of microbial biomass carbon to warming. Microbial biomass is negatively correlated with warming when soil moisture is a limiting factor, but not under abundant moisture conditions [45]. Therefore, the microbial contribution to soil organic matter is sensitive to temperature–moisture interactions and its resulting effects on microbial growth and activity.
While retaining crop residue from the cash crop is a common management practice in the Texas High Plains, some growers have recently shown interest in adding extra residue, such as planting perennial grasses between crop rows and terminating them shortly after crop germination. Here, we evaluated whether the physical aspect of adding dried grasses to the soil surface would show potential as a beneficial soil amendment practice in agriculture due to its role as a biodegradable cover and carbon source. A few previous studies have already shown that adding a layer of dried grasses on the soil surface is beneficial in improving irrigation efficiency and reducing the irrigation water demand in cotton farms in semiarid ecosystems [46,47]. In our study, we evaluated the effectiveness of using multispecies dried grass mulching (referred to as residue addition hereafter) as a viable strategy for reducing temperature and moisture fluctuations and increasing organic matter in the soil profile, thereby minimizing soil health degradation during climate extremes.
We examined the effects of summer warming and residue addition on soil carbon dynamics and cotton yield in both irrigated and dryland soils of the semi-arid Texas High Plains. Irrigation would not be a sustainable crop management strategy, because of dwindling water sources in semiarid regions, including the rapidly depleting Ogallala aquifer in our study area [48]. Hence, we used the irrigated fields to examine whether residue addition and warming effects were similar under drier versus wetter conditions. We hypothesized that residue addition would lower daily fluctuations in soil temperature and soil moisture and reduce evaporation rates such that soil moisture levels would be higher in residue-added plots compared to plots without residue. We also hypothesized that organic matter content and soil carbon respiration would be greatest in irrigated, warmed plots with added residue due to the increased decomposition rate resulting from temperature-induced changes in microbial enzyme activity and the increased carbon substrate availability from the added residue. Overall, this study aimed to evaluate the importance of multispecies grass residue addition on buffering the negative impacts of soil temperature and moisture extremes on soil organic matter, cotton biomass, and yield. If so, mulching could be implemented as one of many practices aimed at mitigating the negative effects of climate change on cotton production.

Materials And Methods

Site Characteristics

The research was carried out during the growing season of 2021 at the Texas Tech Quaker Avenue Research Farm, Lubbock, Texas (33° 41’ 36.4596” N, -101° 54’ 18.612 “W, 992 m a.s.l.). The study site was in a semi-arid climate with a 30-year mean annual precipitation (MAP) of 466 mm and a mean annual temperature of 16.3 ⁰C [49].The hottest month was July, with an average monthly temperature of 27.3 ⁰C, and the coolest month was January, with an average monthly temperature of 5.1 ⁰C [49]. A weather station installed in the center of the research field was used to record field-level temperature, precipitation, relative humidity, and wind speed. During the growing season of 2021 the average temperature was 24.2 ⁰C (the hottest month was June, with an average monthly temperature of 27.3 ⁰C, and the coolest month was October with an average monthly temperature of 18.21 ⁰C). During our study period (June through October), the field received a total rainfall of 337 mm, i.e., 72.3% of MAP. The mean soil pH was 8.49. The soil had 1.042 + 0.10 % organic matter and a bulk density of 1.29 g/cm3 at 0-10 cm depth. The soil had a sandy clay loam texture with 61.45 % sand, 15 % silt, and 23.55 % clay. The soil was classified as Amarillo-Acuff sandy clay loam (Fine-loamy, mixed, superactive, thermic Aridic Paleustalfs).

Experimental Design

The field was divided into two adjacent field sections, irrigated by a drip irrigation system and non-irrigated (i.e., dryland). Prior to this experiment, both sections had been operating under an irrigated cotton monocropping system. During the experiment period, the irrigated section received drip irrigation in addition to rainfall, while the dryland section had no additional irrigation (i.e., rainfall was the sole water source). During the growing season, a total of 218 mm of irrigation water was provided via drip lines to the irrigated section. There was a 4 m buffer zone between the irrigated and dryland sections. Each irrigation section was then divided into 3 blocks each (a total of 6 blocks) to capture the spatial gradient in soil properties. There were eight 1 meter × 1 meter plots in each block. The passive warming treatment was installed during the growing season. The warming treatments were implemented using 1m ×1m × 1m open-top chambers (OTC) made of aluminum rods and clear polycarbonate sheets. We set up the OTCs in the field immediately after sowing cotton seeds, using stakes and zip ties to secure them to the ground. In the plots with residue treatments, multispecies grass residue (Bermuda (Cynodon dactylon (L.) Pers.), blue grama (Bouteloua gracilis (Kunth) Lag. ex Griffiths), and fescue grasses (Festuca arundinacea Schreb.)) was added to the soil surface at a rate of 3 kg residue/m2. The added residue was covered by plastic garden netting to keep the mulches in place. Cotton (variety: Phytogen 394) was planted in early June continuously in a row and harvested in late October. Each plot had a single crop row containing 7-8 cotton plants spaced approximately 10 -12 cm apart.

Measurement of Environmental Variables

5TM sensors linked to EM50 data loggers (Meter Group, Inc., Pullman, Washington, USA) were used to record soil temperature and volumetric moisture content every 30 minutes at 10 cm soil depth in each plot. Ibuttons (Maxim Integrated, California, USA) were used to record air temperature and relative humidity every four hours at the canopy level of mature cotton plants (i.e., 50 cm above the ground). The ibuttons were inside radiation shields to prevent the heating of sensors from direct solar radiation. Ventilation of the radiation shields was achieved by overlapping two perforated plastic funnels in such a way that the holes in one funnel did not line up with the holes in the other. On top of the radiation shield, we placed HOBO Pendant Temperature/light data loggers (MX2022; Onset Computer Corp., Massachusetts, USA) to monitor the amount of light intercepted at the canopy level.

Soil Sample Collection and Laboratory Analysis

Soil samples were collected from each plot shortly after crop harvest in late October. We took samples from 0-15 cm deep with a soil corer (3 cm diameter). Two soil samples were collected per plot, one from each side of the crop row in the plot. For each soil sample, the soil was taken from three randomly selected sites within a side of the crop row in the plot and mixed to create one composite sample (i.e., one of two composite samples per plot). As a result, the field yielded a total of 96 soil samples from 48 plots. The soil samples were transferred to the laboratory in a refrigerated container. The samples were kept at 4 ⁰C after passing through a 2-mm sieve to remove bigger plant roots, debris, and stones and analyzed by Waters Agricultural Laboratories Inc. for soil macro- and micronutrients, soil organic matter, pH, and cation exchange capacity. Soil inorganic nitrogen availability (NH4+-N and NO3--N) were extracted with 2 M KCl and measured on a FIA analyzer (FIA Lab Instruments, Inc, Seattle WA). Other nutrients were extracted with a Mehlich III solution and analyzed on an ICP. Soil organic matter was measured using the loss-on-ignition method at 350oC for 2 hours.
Microbial biomass was measured using the chloroform fumigation extraction procedure [50]. Four, 5 g dry weight equivalent soil samples were weighed in glass beakers, two of which were fumigated for 48 hours with 25 ml of chloroform and the other left unfumigated. Extractable carbon was extracted from fumigated and non-fumigated samples using 50 ml of 0.5 M K2SO4 and filtered through Whatman 43 filter paper. We measured the extracts at 280 nm wavelength using GENESYS 150 UV-Visible Spectrophotometer (ThermoFisher Scientific, Madison, USA). The difference in absorbance between the fumigated and unfumigated samples was used to calculate soil microbial biomass [51], using a KEC (extractable fraction of microbial biomass carbon) value of 0.45 for the calculation [52].

Soil Respiration Measurement

We used the LI-8100A soil CO2 flux system (LI-COR Inc, Nebraska, USA) to measure soil respiration rates monthly starting in July. To enable a good seal with the soil surface for soil respiration measurements we installed soil collars in each plot at the beginning of the experiment; the 20-cm diameter soil collars were installed 2-3 cm deep into the soil in the middle of the plot, 5 cm apart from the crop row. Plant structures inside the soil collar were periodically removed to exclude aboveground plant tissue respiration. The measurement time was set to 2 minutes for each soil respiration measurement. Soil respiration data were taken during the same time window, from 8:30 AM to 11:30 AM, to eliminate measurement variability due to time-of-day.

Harvesting and Biomass Measurements

Cotton was harvested by hand in late October when most of the bolls were fully open. Cotton bolls were harvested from all plants within a plot and stored in separate plastic bags. The weight of the harvested seed cotton was recorded after it was air-dried for a week. The total number of plants per plot and the number of bolls in each plant were also recorded.
Plant biomass in each plot was recorded after a week of drying to remove all moisture. To quantify relative changes in belowground root biomass, we used soil cores with a diameter of 3 cm and a length of 10 cm. Three plants were chosen at random within each plot, and two soil cores of root samples (one sample from each side of the plant row) were obtained. Root samples were taken at 3-5 cm from the plant stem. As a result, six root samples were collected from each plot. We used a 2 mm sieve to separate roots from the soil. The roots were hand-picked from the sieved sample, washed, and dried before taking dry root weight.

Statistical Analysis

We evaluated the interaction between warming, residue, and irrigation treatments on soil temperature, air temperature, volumetric soil moisture content, and soil organic matter using linear mixed effects models in R [53]. Microbial biomass and soil respiration rate were evaluated using generalized linear mixed effects models. For these variables, the residuals showed non-normal error distribution, and hence we chose generalized linear mixed effects models. The distribution for the generalized linear mixed model was selected based on AIC values. The best model for microbial biomass carbon and soil respiration had a log-linked gamma distribution and inverse-linked gamma distribution, respectively, which improved the behavior of residuals and had lower AIC values. Seed cotton yield, the number of bolls per plant, aboveground biomass, and belowground biomass was analyzed using linear mixed effect models. We used ‘lmer’ and ‘glmer’ function in ‘lme4’ package [54] for linear mixed effects, and generalized linear mixed effects models, respectively. Since we took two soil samples from each plot, the data from the two samples were averaged to get plot level data before fitting the model. Blocks were included as a random intercept term in each of the models. For repeated time measurements (soil temperature, air temperature, volumetric water content, and soil respiration rate), we first calculated monthly averages for each plot, and then included the month and plots as an additional random intercept term. We also fit a separate model to evaluate the effects of climate data and soil variables for each response variable. First, we shortlisted a few predictors for each of our response variables based on the literature, then, we fit the liner mixed effects models in R. We used ‘car’ package [55] to generate the ANOVA tables and p values for fixed effect predictors. Following that, post hoc analyses were performed using Tukey’s HSD with a 95% confidence interval to determine if there were significant differences between treatments. We used the ‘emmeans’ package [56] for post hoc analysis. The ‘ggplot2’ package [57] was used to visualize the data.

Results

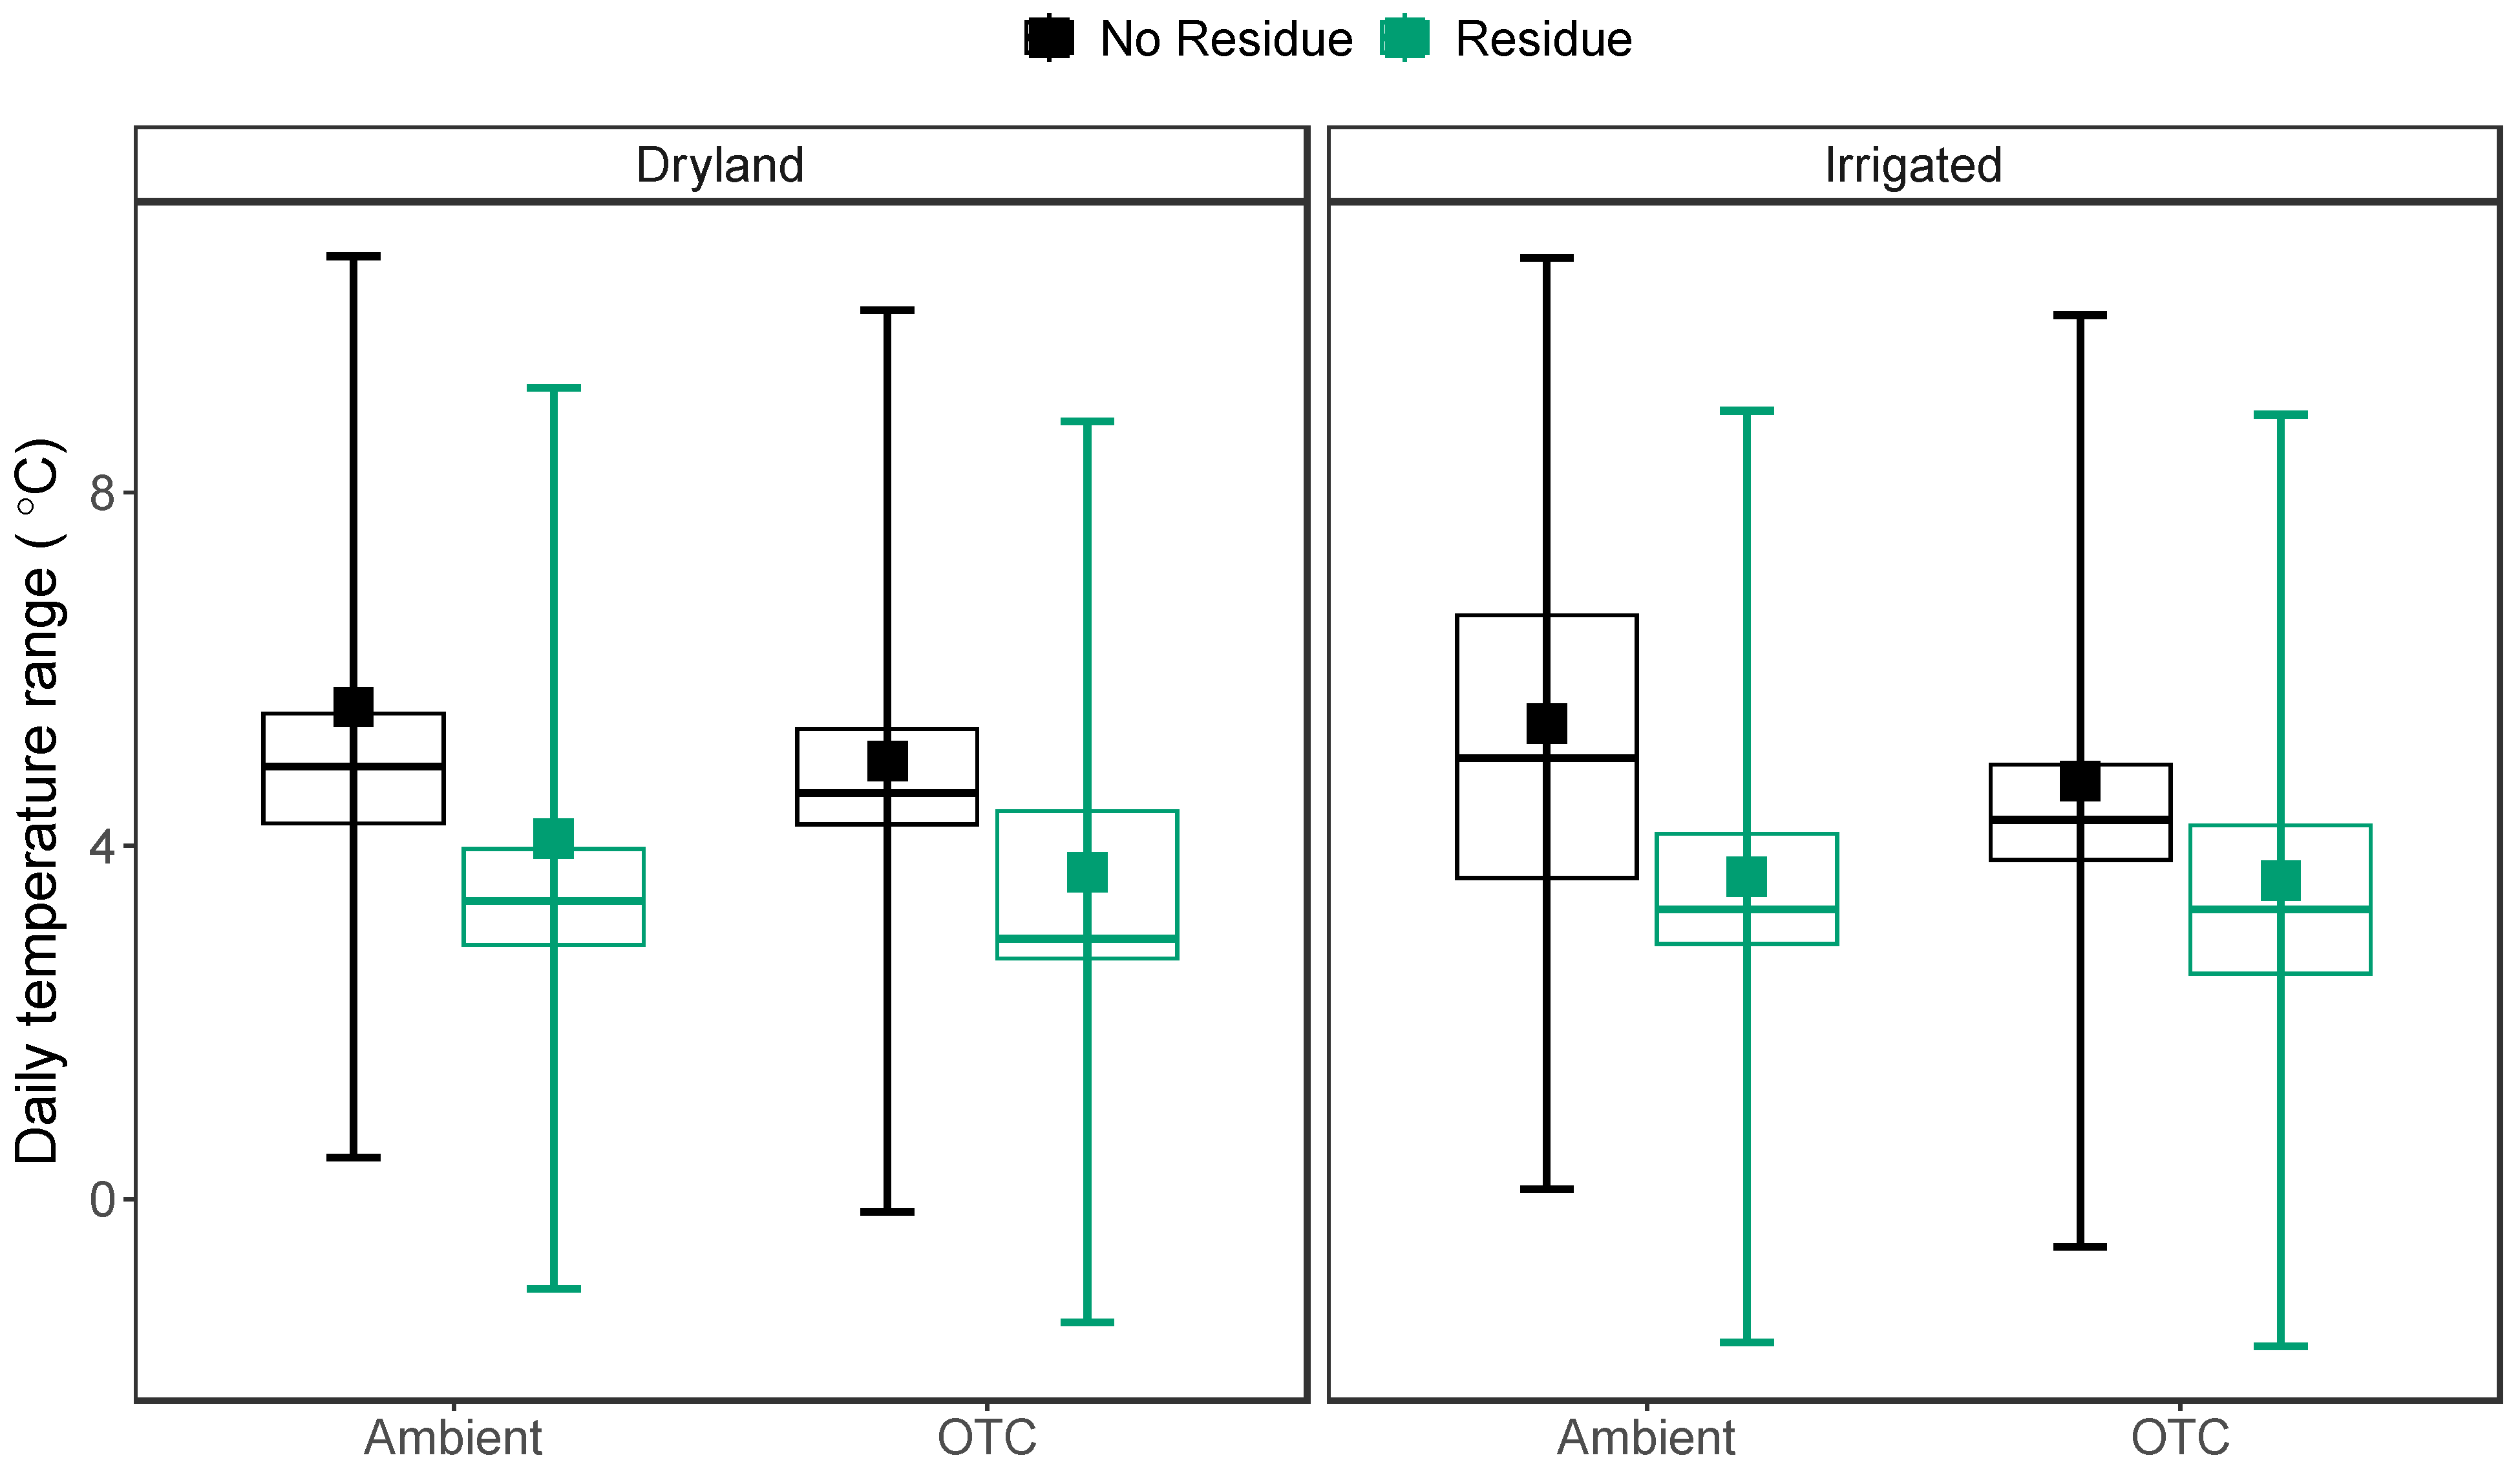
We observed strong temporal variation in soil and air temperature throughout the growing season (Figure 1). OTCs (χ2 = 498.31, P < 0.001) increased average air temperature by 2.2 ⁰C (Figure 1b) but did not affect soil temperatures. Rather, soil temperatures were more affected by residue (χ2 = 17.18, P < 0.001) and irrigation (χ2 = 18.51, P < 0.001). Residue decreased soil temperature by 0.5 ⁰C, while irrigation decreased soil temperature by 0.7 ⁰C (Figure 1a). Irrigation also decreased the air temperature by 0.6 °C (χ2 = 12.64, P = 0.003). Residue addition decreased (χ2 = 80.15, P < 0.001) the average daily temperature range in the soil system by 1.4 °C (Figure 2).
Volumetric water content also showed a temporal fluctuation throughout the growing season (Figure 3a). Irrigation and OTCs did not have a significant main effect on volumetric water content, but residue (χ2 = 8.56, P = 0.003) significantly changed volumetric water content. Our results also showed a significant three-way interaction between OTCs, residue, and irrigation (χ2 = 4.96, P = 0.025). In dryland, in the presence of OTCs, residue increased volumetric water content by 9.16 %, but decreased by 18.12 % when OTCs were not present (Figure 3b). In irrigated fields residue decreased volumetric water content irrespective of OTCs treatment.
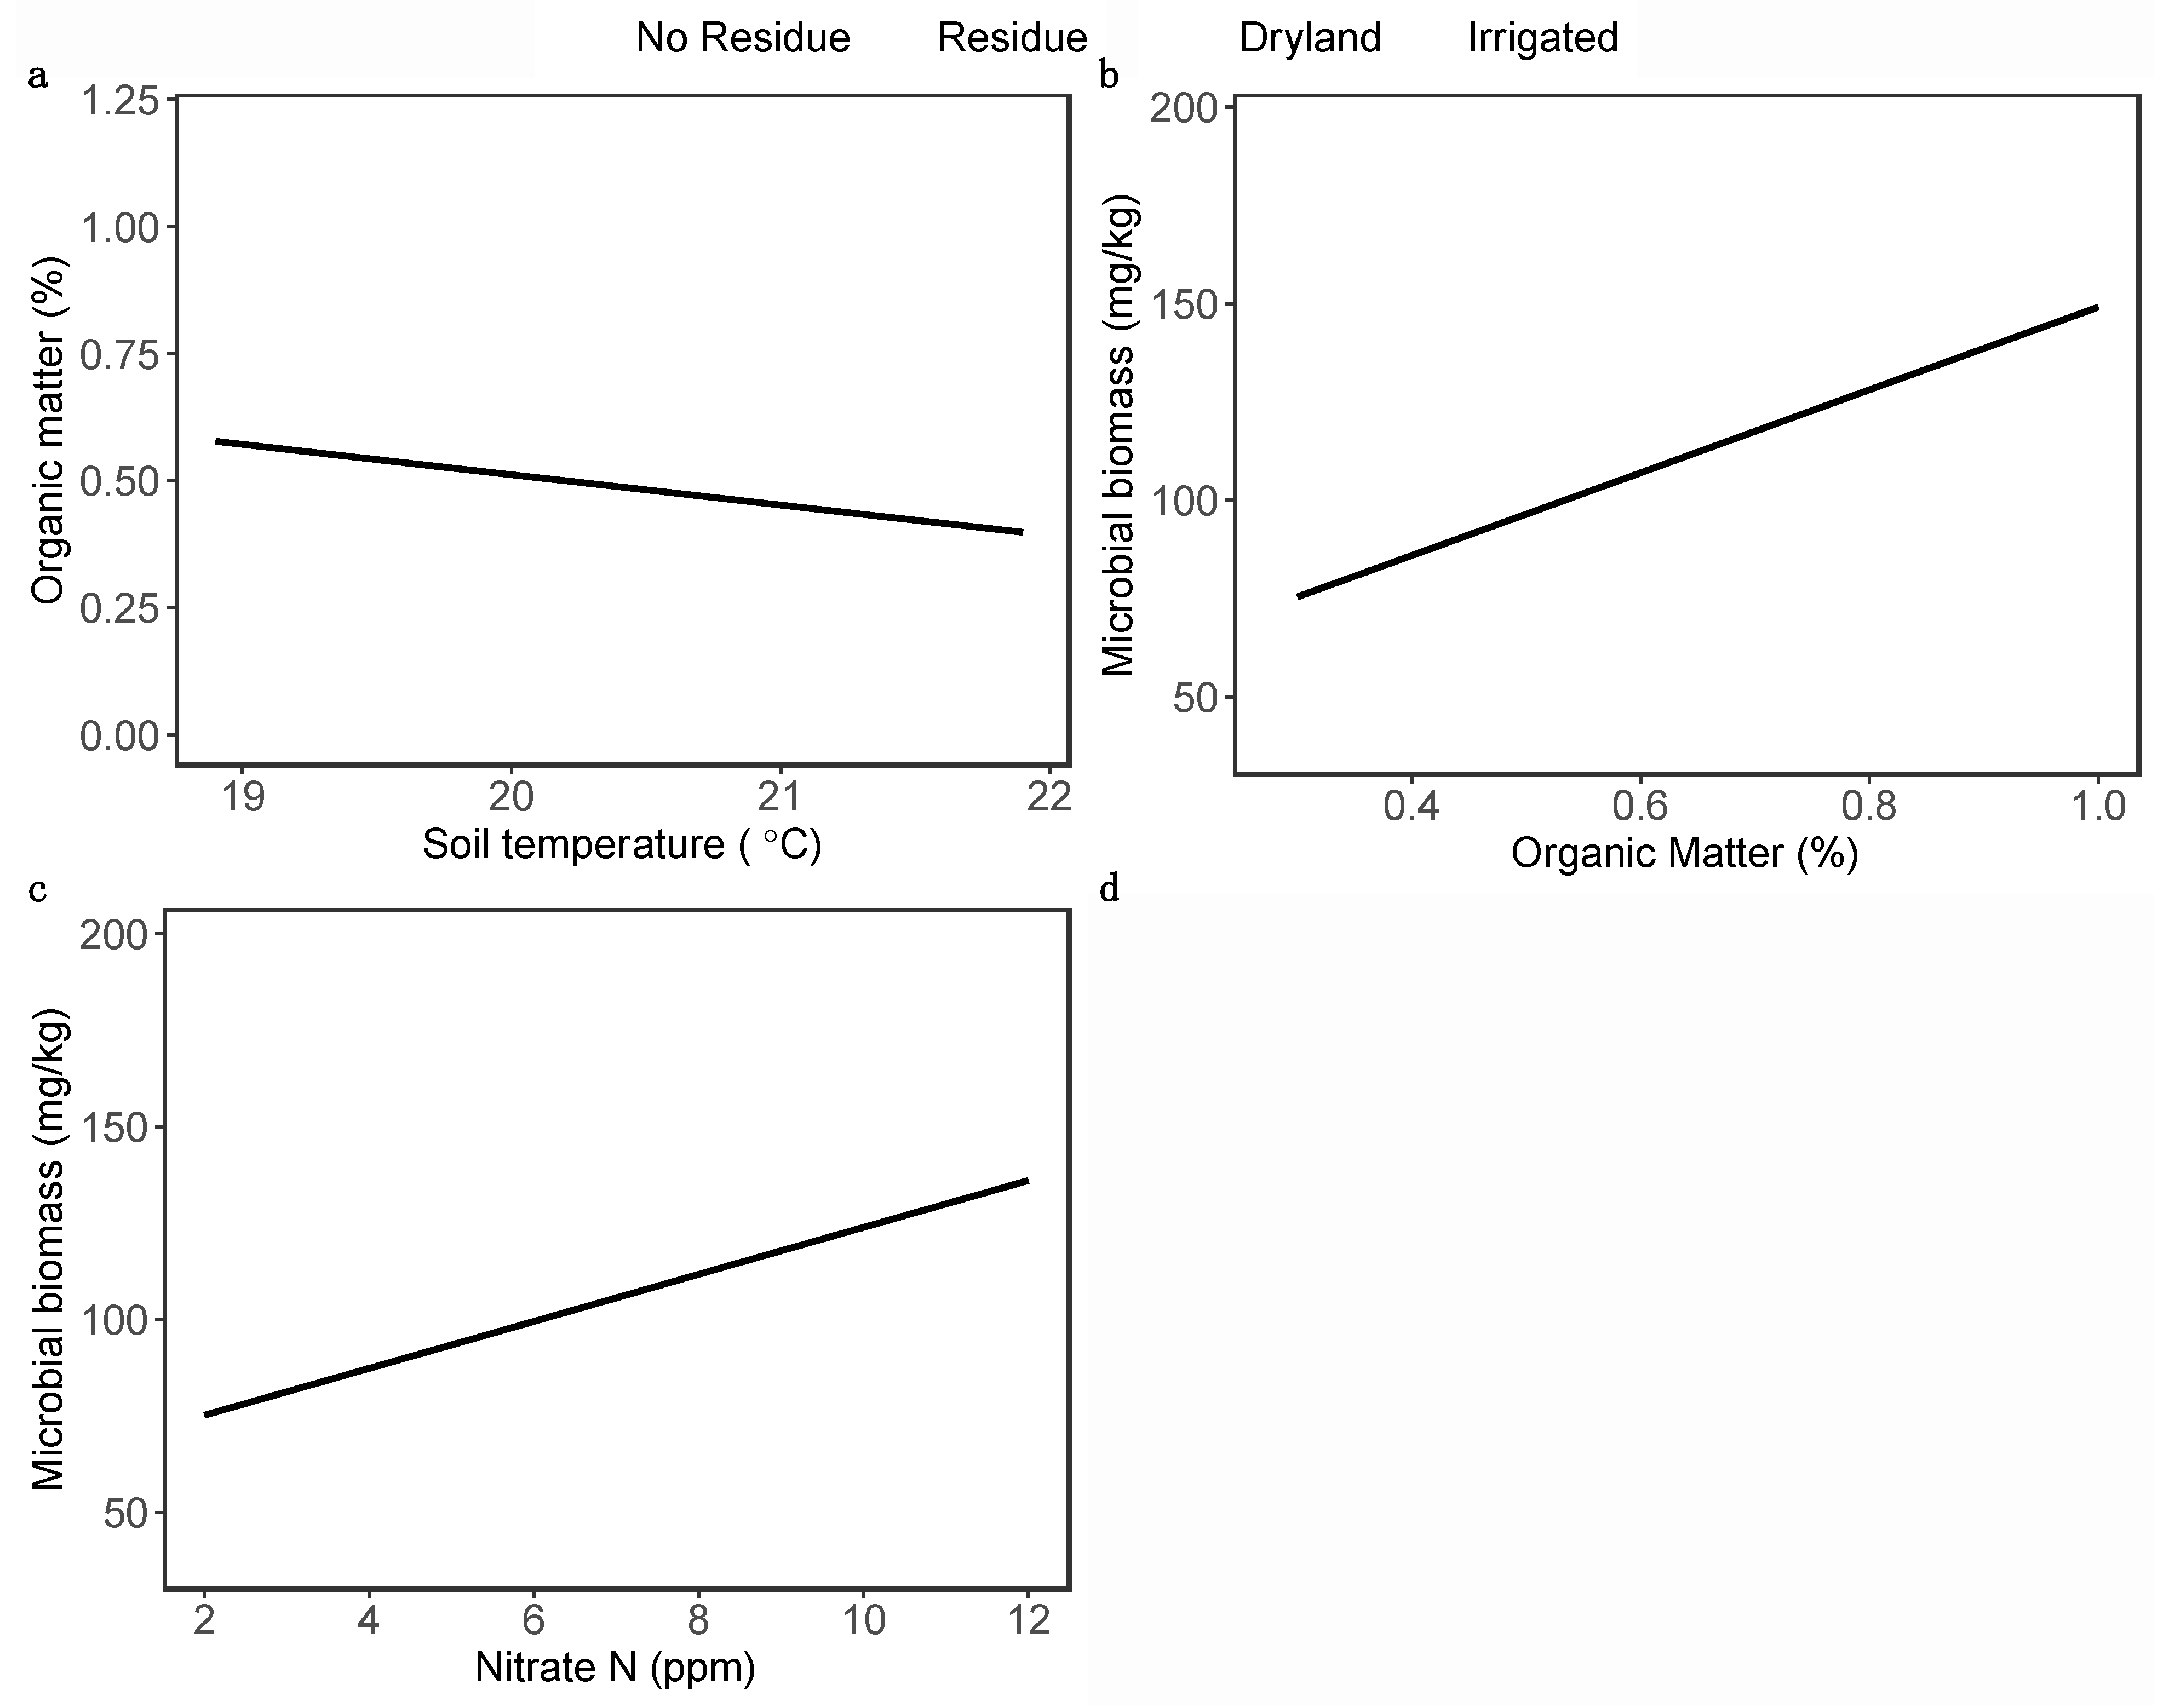
OTCs and residue did not affect soil organic matter content. However, there was a significant effect of irrigation on soil organic matter (χ2 = 8.05, P = 0.0046), with dryland soils having 36.8 % lower soil organic matter compared to irrigated soils (Figure 4a). Soil organic matter was also negatively correlated with soil temperature (χ2 = 4.02, P = 0.044; Figure 5a). We observed a significant interaction effect of OTC and residue (χ2 = 7.37, P = 0.0066) on microbial biomass: OTCs increased microbial biomass by 34.9 % under residue-added condition, but OTCs had no effect on microbial biomass when residue was not applied (Figure 4b). Irrigation (χ2 = 4.73, P = 0.029) increased microbial biomass by 27.5 %. Additionally, a significant positive relation was observed between microbial biomass and organic matter (χ2 = 8.39, P = 0.003; Figure 5b), as well as microbial biomass and available nitrates (χ2 = 7.42, P = 0.0064; Figure 5c).
Residue addition (χ2 = 72.84, P < 0.001) significantly increased soil respiration; the residue-added plots had a 78.2 % higher soil CO2 flux rate than plots without residue (Figure 4c). We also observed a significant interaction effect between the irrigation and warming treatments on soil respiration (χ2 = 5.64, P = 0.017): OTCs increased soil respiration in dryland by 35.1% but had no effect in irrigated plots.
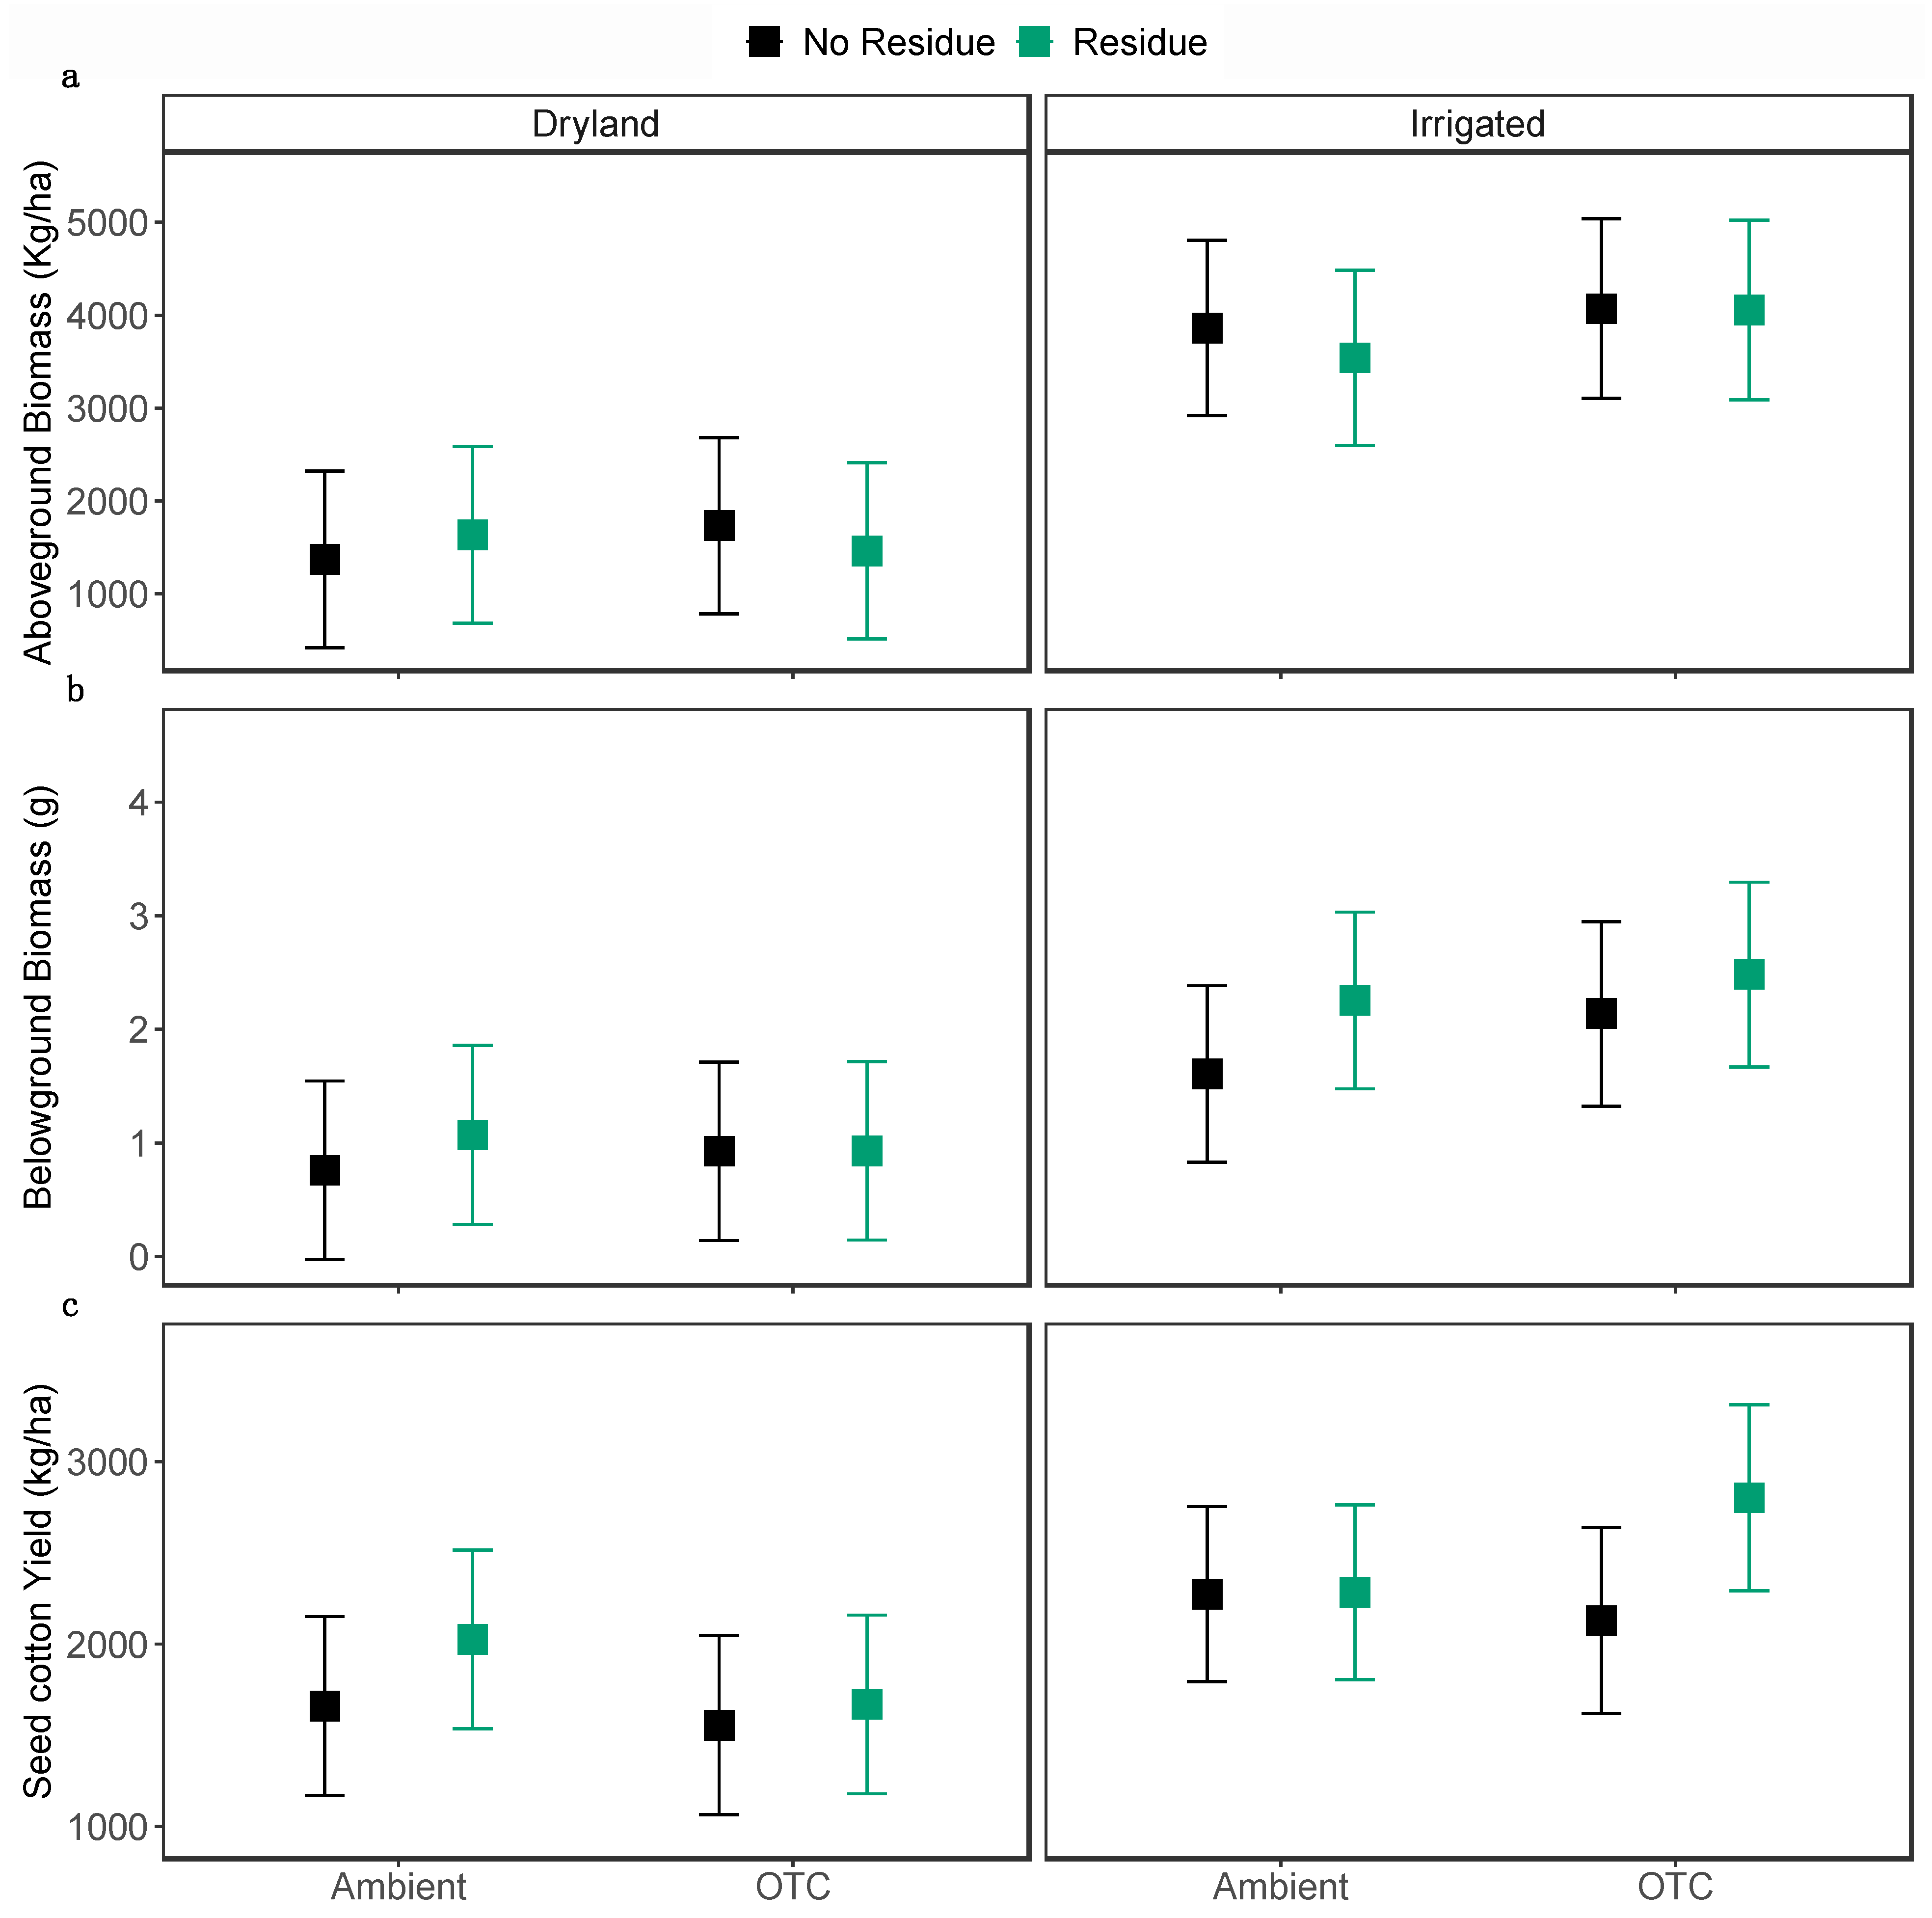
Seed cotton yield was not affected by OTCs, but irrigation (χ2 = 6.87, P = 0.0087) and residue (χ2 = 4.83, P < 0.027) had a significant impact on seed cotton yield. The residue addition and irrigation increased seed cotton yield by 15.2 % and 37.3 %, respectively (Figure 6c). Moreover, both OTCs and residue addition did not change aboveground biomass and belowground biomass. Irrigation, however, increased aboveground biomass by 150.5 % (χ2 = 22.61, P < 0.0001; Figure 6a) and belowground biomass by 129.7% (χ2 = 9.01, P < 0.0026 Figure 6b).

Discussion

Water-limited ecosystems are expected to be particularly susceptible to an increase in temperature. This is why we sought to investigate how covering semi-arid soil with multispecies grass residue would affect soil environmental conditions, soil carbon dynamics, and plant productivity under warming conditions that mimic expected future conditions under climate change.

Residue Reduced the Soil Temperature and Moisture Fluctuation in Warmed Dryland Soils

OTCs are a simple, cost-effective technique to simulate global warming in field studies, particularly in areas with no access to power for active warming [58]. However, their efficiency varies depending on the vegetation structure and environment of the study area. Previous warming studies in high-latitude regions suggested that OTCs could efficiently raise air temperature, but not necessarily soil temperatures [59,60]. On the other hand, OTCs have successfully elevated both air and soil temperatures in semi-arid regions in soil organic matter studies [61,62]. We expected to see a change in both air and soil temperature with open top chamber in our study, open top chambers increased only air temperature, but not soil temperature.
As hypothesized, residue addition lowered daily soil temperature fluctuations in our study, which is consistent with Turmel et al. [63]. This decrease occurred whether or not the soils were irrigated. Covering soils with residue can insulate the surface or reflect sunlight, limiting heat absorption and resulting in lower soil temperatures than uncovered soils [14,64]. Soils were cooler in irrigated soil compared to dryland soil. Soil moisture increases the specific heat capacity of soil as well as the conductivity. Hence, the surface of dry soils warms more quickly during the day and cools more promptly at night [37,65]. As a result, dryland soils showed more rapid temperature fluctuations and hotter temperatures than irrigated soil. Additionally, the 150% increase in aboveground cotton biomass in the irrigated field may have created a shading effect on the soil, thereby reducing temperature variation.
OTCs reduced volumetric water content in dryland soils, but not irrigated soils. Higher mean soil temperature and greater diurnal temperature fluctuation in dryland compared to irrigated fields may have increased the evaporation rate from the soil surface [66,67], speeding up moisture loss, resulting in a greater reduction in water content in the dryland compared to the irrigated soils. Surprisingly, irrigation did not increase volumetric water content. A possible explanation is that the growing season was rainier than usual: the study area received nearly three-quarters of mean annual precipitation, thereby muting the effect of irrigation on soil moisture levels. A second explanation, and not mutually exclusive from the first, is that cotton biomass was more than doubled under irrigation, which may have led to a rise in plant water consumption and transpiration.
Residue cover offers shade and prevents soil moisture loss by lowering soil temperature and reducing evaporation [13]. Therefore, we expected that soils covered with residue would contain more moisture. Unexpectedly, our results showed that residue covered soils were drier than when left uncovered. Surface residue may have impeded the rainwater infiltration, acting as barrier, resulting in a reduction in water content in the soil. However, this was not always the case; with OTCs in dryland, the application of residue increased volumetric water content, indicating that the application of residue in dryland farming may have the potential to increase soil moisture in a warmer world.

Residue Addition Increased Microbial Biomass and Soil Respiration, but Had No Effect on Soil Organic Matter

Warming has been shown to enhance microbial activity and speed up the decomposition of soil organic matter, thereby releasing more CO2 in previous studies [24,68,69,70]. In our study, however, OTCs had no influence on soil organic matter stocks, but we did observe significantly higher soil respiration rates from OTC plots. Though OTCs did not have the expected warming effect on soil temperature at our depth of measurement (10 cm), they may have increased temperatures closer to the soil surface, increasing microbial activity leading to a higher rate plant litter decomposition, and greater CO2 flux.
The highest soil organic matter and microbial biomass carbon were observed in irrigated fields. The labile carbon pool and decomposition of recalcitrant carbon are positively correlated with root biomass [71]. Root exudates form another important source of labile organic matter in the soil which, in turn, is proportional to below-ground biomass [72,73,74]. Increased below-ground biomass in the irrigated fields (Figure 6b) may have contributed to observed differences in soil organic matter content between irrigated and dryland fields in our study. Likewise, increased labile carbon in the form of root exudates promotes microbial biomass [72], which explains the observed increment in microbial biomass carbon in the irrigated compared to dryland plots. In dry soils, moisture is a greater limitation to microbial development and activity than temperature [69]. Soil water facilitates microbial movement in the soil, maintains osmotic equilibrium in microbial cells, and improves metabolic efficiency, all of which contribute to improved microbial growth and development [75]. When microorganisms are stressed by water, they synthesize osmolytes to maintain osmotic equilibrium, which requires energy that reduces the amount of carbon available for microbial growth [76]. Therefore, a more stable soil moisture content, either due to irrigation or residue, may contribute to increased microbial biomass carbon levels by enhancing microbial carbon use efficiency and growth.
Residue addition was anticipated to increase soil organic matter, but that was not the case. Nevertheless, residue addition did increase microbial biomass and soil respiration rates, as expected. The interaction between residue and OTC was synergistic on microbial biomass; OTCs increased microbial biomass in residue-applied plots, but without residue, OTCs decreased microbial biomass. The increase in microbial biomass carbon in plots with added residue and OTC treatment is likely contributed by the reduction in daily temperature range, which creates the more stable soil temperatures [77]. The storage and release of organic carbon via CO2 flux in response to temperature is a complex process driven by substrate quality, moisture availability, microbial carbon use efficiency, and enzyme activities [78,79]. The direction of soil carbon sequestration is determined by the balance between carbon input from plant litter, roots, and microbial compounds and carbon release from organic matter breakdown and soil respiration [80,81]. Furthermore, soil organic matter chemistry affects carbon transport; unstable carbon has a fast turnover rate and, consequently, a short residence period in the soil [82]. The residue added in our study consisted of dry grasses, which have a low C:N ratio (approximately 18:1) [83]. Substrates with low C:N ratio favor microbial decomposition and increase microbial carbon use efficiency [84,85,86]. Microbial carbon use efficiency, the ratio of carbon taken up by microbes to carbon allocated for their growth, also depends on the availability and nutrient composition of substrate and soil microclimate [87]. The carbon released to the soil in our study via residue was more labile, decomposing at a quicker rate, and was constantly replaced by fresh carbon into the soil. Therefore, increased accessibility of microbes to fresh, easily degradable carbon might have boosted carbon use efficiency, increasing carbon allocated for microbial growth and increasing microbial biomass under residue addition.

Soil Moisture Had Stronger Effects on Cotton Biomass Production and Yield than Warming in Semi-Arid Regions

Warming has been linked to a decline in cotton yield and plant biomass, particularly in dry environments [88,89]. Warmer temperatures enhance the growth rate of crops, thereby shortening their life cycle [90]. Consequently, this accelerates the stages of flowering, boll opening, boll retention, and boll filling in cotton [91], leading to a reduced reproductive duration and potential yield. The increase in temperature promotes vegetative growth, cotton boll development, and boll maturity up to 25 ⁰C, but decreases boll growth rate above 25 ⁰C [92]. Cotton bolls can withstand temperatures up to 32°C, albeit their retention rate drops considerably when temperatures exceed 28°C [92]. In addition, increased atmospheric temperature reduces cotton photosynthesis and growth rate [93], thereby reducing carbon that could be allocated to biomass yield and fiber growth. Our findings, however, contradicted the results of those previous warming studies. A 2-degree increase in air temperature caused by OTCs had no effect on seed cotton yield, aboveground biomass, or belowground biomass in our study. Even with the OTC treatments, the daily mean air temperature was within the optimum range during the boll development and filling stage in late August to early September. This is likely why, unlike prior warming studies, we did not see a decline in cotton yield and biomass with warming.
Irrigation had the strongest impact on cotton yield and biomass production in our study, indicating that wetter years should see greater cotton production. Cotton yield is dependent on moisture, more so in water-limited environments. Irrigation likely alleviated moisture stress, resulting in increased seed cotton yield and whole-plant biomass (aboveground and belowground) production in our study. Consistent with our findings, DeLaune et al. [94] and Ale et al. [95] also observed that irrigation increased seed cotton yield and biomass production while mitigating the detrimental effects of heat stress in upland cotton [96]. Irrigation improved the distribution of fine roots within the topsoil surface, allowing the plant to absorb more soil moisture. The higher fine root biomass in the topsoil layer at the late reproductive stage helps increase aboveground biomass, resulting in enhanced total bolls and seed cotton yield [97]. However, irrigation cannot be considered a sustainable crop management strategy in these dry environments. This is why we regarded irrigation to study whether residue application was as effective in increasing soil health under different precipitation scenarios in a warmer world. More research should focus on identifying the soil management strategies that enhances water retention efficiency of soils and increase soil organic matter, thereby reducing the demand for irrigation in dry regions for the agricultural sustainability during future climate extremes. We show that residue on the surface dampens extremes in temperature and moisture, which likely resulted in a more favorable environment for soil microbes. Perhaps adding residue during one growing season was not sufficiently long to see resulting changes in soil organic matter. Nevertheless, increased microbial biomass is a promising early indicator of increased soil organic matter [98], and hence of improved soil health.

Conclusion

In a semi-arid agroecosystem, OTCs and residue resulted in variation in soil temperate and moisture, thereby affecting several biochemical processes in the soil and carbon movement to and from the soil. Our data suggest that soil organic matter is more sensitive to moisture than temperature fluctuations in this semi-arid environment. OTCs enhanced carbon loss from the soil via increased soil respiration rates, but irrigation improved plant and microbial biomass production, thereby maintaining total soil organic matter stocks in the soil. Meanwhile, residue stabilized soil temperature regime and increased microbial biomass. Hence, we conclude that soil conservation strategies, such as residue addition, could help to compensate for carbon loss and improve microbial growth, thereby mitigating soil health degradation in semi-arid regions under future projected climate change.

Author Contributions

Conceptualization, P.D. and N.V.G.; Methodology, P.D, R.K.S, N.G.S, L.C.S, N.V.G.; Formal Analysis, P.D.; Investigation, P.D, R.K.S, N.V.G.; Resources, P.D, R.K.S, N.G.S, L.C.S, N.V.G .; Data Curation, P.D., R.K.S; Writing – Original Draft Preparation, P.D.; Writing – Review & Editing, P.D, R.K.S, N.G.S, L.C.S, N.V.G .; Visualization, P.D., R.K.S; Supervision, N.G.S, L.C.S, N.V.G .; Project Administration, P.D, R.K.S, N.V.G.; Funding Acquisition, N.V.G. All authors have read and agreed to the published version of the manuscript.

Funding

This research was funded by Cotton Incorporated (#17-042) and James ‘Buddy’ Davidson Foundation.

Institutional Review Board Statement

Not applicable.

Informed Consent Statement

Not applicable.

Data Availability Statement

The data, codes and supplemental figures related to this article is publicly available in the following GitHub repository: https://github.com/ppawand/MSProject/tree/main/MS_Paper.

Conflicts of Interest

The authors declare no conflicts of interest.

References

  1. USDA-NASS Annual Cotton Review; 2023.
  2. Lauer, S.; Sanderson, M.R. Producer Attitudes Toward Groundwater Conservation in the U.S. Ogallala-High Plains. Groundwater 2020, 58, 674–680. [Google Scholar] [CrossRef] [PubMed]
  3. Dorminey, B. Dryland Farmers Work Wonders without Water in U.S. West. Available online: https://www.scientificamerican.com/article/dryland-farmers-work-wonders-without-water-us-west/ (accessed on 24 July 2024).
  4. Hailu, T.; Devkota, P.; Osoko, T.O.; Singh, R.K.; Zak, J.C.; van Gestel, N. No-till and crop rotation are promising practices to enhance soil health in cotton-producing semiarid regions: insights from on-farm research. Biol Fert Soils (under Review).
  5. Zhou, M.; Liu, C.; Wang, J.; Meng, Q.; Yuan, Y.; Ma, X.; Liu, X.; Zhu, Y.; Ding, G.; Zhang, J.; et al. Soil Aggregates Stability and Storage of Soil Organic Carbon Respond to Cropping Systems on Black Soils of Northeast China. Sci Rep 2020, 10, 265. [Google Scholar] [CrossRef] [PubMed]
  6. Rawls, W.J.; Pachepsky, Y.A.; Ritchie, J.C.; Sobecki, T.M.; Bloodworth, H. Effect of Soil Organic Carbon on Soil Water Retention. Geoderma 2003, 116, 61–76. [Google Scholar] [CrossRef]
  7. Benbi, D.K.; Sharma, S.; Toor, A.S.; Brar, K.; Sodhi, G.P.S.; Garg, A.K. Differences in Soil Organic Carbon Pools and Biological Activity between Organic and Conventionally Managed Rice-Wheat Fields. Org. Agr. 2018, 8, 1–14. [Google Scholar] [CrossRef]
  8. Lal, R.; Negassa, W.; Lorenz, K. Carbon Sequestration in Soil. Current Opinion in Environmental Sustainability 2015, 15, 79–86. [Google Scholar] [CrossRef]
  9. Godde, C.M.; Thorburn, P.J.; Biggs, J.S.; Meier, E.A. Understanding the Impacts of Soil, Climate, and Farming Practices on Soil Organic Carbon Sequestration: A Simulation Study in Australia. Front. Plant Sci. 2016, 7. [Google Scholar] [CrossRef] [PubMed]
  10. Luo, Z.; Wang, E.; Sun, O.J. Soil Carbon Change and Its Responses to Agricultural Practices in Australian Agro-Ecosystems: A Review and Synthesis. Geoderma 2010, 155, 211–223. [Google Scholar] [CrossRef]
  11. Mandal, A.; Patra, A.K.; Singh, D.; Swarup, A.; Ebhin Masto, R. Effect of Long-Term Application of Manure and Fertilizer on Biological and Biochemical Activities in Soil during Crop Development Stages. Bioresource Technology 2007, 98, 3585–3592. [Google Scholar] [CrossRef] [PubMed]
  12. Page, K.L.; Dang, Y.P.; Dalal, R.C. The Ability of Conservation Agriculture to Conserve Soil Organic Carbon and the Subsequent Impact on Soil Physical, Chemical, and Biological Properties and Yield. Front. Sustain. Food Syst. 2020, 4. [Google Scholar] [CrossRef]
  13. Iqbal, R.; Raza, M.A.S.; Valipour, M.; Saleem, M.F.; Zaheer, M.S.; Ahmad, S.; Toleikiene, M.; Haider, I.; Aslam, M.U.; Nazar, M.A. Potential Agricultural and Environmental Benefits of Mulches—a Review. Bulletin of the National Research Centre 2020, 44, 75. [Google Scholar] [CrossRef]
  14. El-Beltagi, H.S.; Basit, A.; Mohamed, H.I.; Ali, I.; Ullah, S.; Kamel, E.A.R.; Shalaby, T.A.; Ramadan, K.M.A.; Alkhateeb, A.A.; Ghazzawy, H.S. Mulching as a Sustainable Water and Soil Saving Practice in Agriculture: A Review. Agronomy 2022, 12, 1881. [Google Scholar] [CrossRef]
  15. Russel, J.C. The Effect of Surface Cover on Soil Moisture Losses by Evaporation. Soil Science Society of America Journal 1940, 4, 65–70. [Google Scholar] [CrossRef]
  16. Luo, Z.; Wang, E.; Viscarra Rossel, R.A. Can the Sequestered Carbon in Agricultural Soil Be Maintained with Changes in Management, Temperature and Rainfall? A Sensitivity Assessment. Geoderma 2016, 268, 22–28. [Google Scholar] [CrossRef]
  17. Potter, K.N.; Velazquez-Garcia, J.; Scopel, E.; Torbert, H.A. Residue Removal and Climatic Effects on Soil Carbon Content of No-till Soils. Journal of Soil and Water Conservation 2007, 62, 110–114. [Google Scholar]
  18. Zhao, G.; Bryan, B.A.; King, D.; Luo, Z.; Wang, E.; Song, X.; Yu, Q. Impact of Agricultural Management Practices on Soil Organic Carbon: Simulation of Australian Wheat Systems. Global Change Biology 2013, 19, 1585–1597. [Google Scholar] [CrossRef] [PubMed]
  19. Bardgett, R.D.; Freeman, C.; Ostle, N.J. Microbial Contributions to Climate Change through Carbon Cycle Feedbacks. The ISME Journal 2008, 2, 805–814. [Google Scholar] [CrossRef] [PubMed]
  20. Bradford, M.A.; Wieder, W.R.; Bonan, G.B.; Fierer, N.; Raymond, P.A.; Crowther, T.W. Managing Uncertainty in Soil Carbon Feedbacks to Climate Change. Nature Clim Change 2016, 6, 751–758. [Google Scholar] [CrossRef]
  21. Knorr, W.; Prentice, I.C.; House, J.I.; Holland, E.A. Long-Term Sensitivity of Soil Carbon Turnover to Warming. Nature 2005, 433, 298–301. [Google Scholar] [CrossRef]
  22. Davidson, E.A.; Janssens, I.A. Temperature Sensitivity of Soil Carbon Decomposition and Feedbacks to Climate Change. Nature 2006, 440, 165–173. [Google Scholar] [CrossRef]
  23. van Gestel, N.; Shi, Z.; van Groenigen, K.J.; Osenberg, C.W.; Andresen, L.C.; Dukes, J.S.; Hovenden, M.J.; Luo, Y.; Michelsen, A.; Pendall, E.; et al. Predicting Soil Carbon Loss with Warming. Nature 2018, 554, E4–E5. [Google Scholar] [CrossRef]
  24. Lloyd, J.; Taylor, J.A. On the Temperature Dependence of Soil Respiration. Functional Ecology 1994, 8, 315–323. [Google Scholar] [CrossRef]
  25. Lefèvre, R.; Barré, P.; Moyano, F.E.; Christensen, B.T.; Bardoux, G.; Eglin, T.; Girardin, C.; Houot, S.; Kätterer, T.; van Oort, F.; et al. Higher Temperature Sensitivity for Stable than for Labile Soil Organic Carbon – Evidence from Incubations of Long-Term Bare Fallow Soils. Global Change Biology 2014, 20, 633–640. [Google Scholar] [CrossRef]
  26. Rustad, L.; Campbell, J.; Marion, G.; Norby, R.; Mitchell, M.; Hartley, A.; Cornelissen, J.; Gurevitch, J. ; GCTE-NEWS A Meta-Analysis of the Response of Soil Respiration, Net Nitrogen Mineralization, and Aboveground Plant Growth to Experimental Ecosystem Warming. Oecologia 2001, 126, 543–562. [Google Scholar] [CrossRef]
  27. Wang, X.; Liu, L.; Piao, S.; Janssens, I.A.; Tang, J.; Liu, W.; Chi, Y.; Wang, J.; Xu, S. Soil Respiration under Climate Warming: Differential Response of Heterotrophic and Autotrophic Respiration. Global Change Biology 2014, 20, 3229–3237. [Google Scholar] [CrossRef]
  28. Zhang, K.; Dang, H.; Zhang, Q.; Cheng, X. Soil Carbon Dynamics Following Land-Use Change Varied with Temperature and Precipitation Gradients: Evidence from Stable Isotopes. Global Change Biology 2015, 21, 2762–2772. [Google Scholar] [CrossRef] [PubMed]
  29. Piao, S.; Friedlingstein, P.; Ciais, P.; Zhou, L.; Chen, A. Effect of Climate and CO2 Changes on the Greening of the Northern Hemisphere over the Past Two Decades. Geophysical Research Letters 2006, 33. [Google Scholar] [CrossRef]
  30. Liu, J.; Wennberg, P.O.; Parazoo, N.C.; Yin, Y.; Frankenberg, C. Observational Constraints on the Response of High-Latitude Northern Forests to Warming. AGU Advances 2020, 1, e2020AV000228. [Google Scholar] [CrossRef]
  31. Keenan, T.F.; Riley, W.J. Greening of the Land Surface in the World’s Cold Regions Consistent with Recent Warming. Nature Clim Change 2018, 8, 825–828. [Google Scholar] [CrossRef]
  32. Luo, Y. Terrestrial Carbon–Cycle Feedback to Climate Warming. Annual Review of Ecology, Evolution, and Systematics 2007, 38, 683–712. [Google Scholar] [CrossRef]
  33. Chapin, F.S.; Matson, P.A.; Vitousek, P.M. Decomposition and Ecosystem Carbon Budgets. In Principles of Terrestrial Ecosystem Ecology; Chapin, F.S., Matson, P.A., Vitousek, P.M., Eds.; Springer: New York, NY, 2011; pp. 183–228. ISBN 978-1-4419-9504-9. [Google Scholar]
  34. Robertson, G.P.; Paul, E.A. Decomposition and Soil Organic Matter Dynamics. In Methods in Ecosystem Science; Sala, O.E., Jackson, R.B., Mooney, H.A., Howarth, R.W., Eds.; Springer: New York, NY, 2000; pp. 104–116. ISBN 978-1-4612-1224-9. [Google Scholar]
  35. Jia, Y.; Kuzyakov, Y.; Wang, G.; Tan, W.; Zhu, B.; Feng, X. Temperature Sensitivity of Decomposition of Soil Organic Matter Fractions Increases with Their Turnover Time. Land Degradation & Development 2020, 31, 632–645. [Google Scholar] [CrossRef]
  36. Dolschak, K.; Gartner, K.; Berger, T.W. The Impact of Rising Temperatures on Water Balance and Phenology of European Beech (Fagus Sylvatica L.) Stands. Model. Earth Syst. Environ. 2019, 5, 1347–1363. [Google Scholar] [CrossRef]
  37. Licht, M.A.; Al-Kaisi, M. Strip-Tillage Effect on Seedbed Soil Temperature and Other Soil Physical Properties. Soil and Tillage Research 2005, 80, 233–249. [Google Scholar] [CrossRef]
  38. Abu-Hamdeh, N.H. Thermal Properties of Soils as Affected by Density and Water Content. Biosystems Engineering 2003, 86, 97–102. [Google Scholar] [CrossRef]
  39. Yin, H.; Li, Y.; Xiao, J.; Xu, Z.; Cheng, X.; Liu, Q. Enhanced Root Exudation Stimulates Soil Nitrogen Transformations in a Subalpine Coniferous Forest under Experimental Warming. Global Change Biology 2013, 19, 2158–2167. [Google Scholar] [CrossRef]
  40. Carlyle, C.N.; Fraser, L.H.; Turkington, R. Tracking Soil Temperature and Moisture in a Multi-Factor Climate Experiment in Temperate Grassland: Do Climate Manipulation Methods Produce Their Intended Effects? Ecosystems 2011, 14, 489–502. [Google Scholar] [CrossRef]
  41. Eisenhauer, N.; Lanoue, A.; Strecker, T.; Scheu, S.; Steinauer, K.; Thakur, M.P.; Mommer, L. Root Biomass and Exudates Link Plant Diversity with Soil Bacterial and Fungal Biomass. Sci Rep 2017, 7, 44641. [Google Scholar] [CrossRef] [PubMed]
  42. Bell, T.H.; Klironomos, J.N.; Henry, H.A.L. Seasonal Responses of Extracellular Enzyme Activity and Microbial Biomass to Warming and Nitrogen Addition. Soil Science Society of America Journal 2010, 74, 820–828. [Google Scholar] [CrossRef]
  43. Qi, R.; Li, J.; Lin, Z.; Li, Z.; Li, Y.; Yang, X.; Zhang, J.; Zhao, B. Temperature Effects on Soil Organic Carbon, Soil Labile Organic Carbon Fractions, and Soil Enzyme Activities under Long-Term Fertilization Regimes. Applied Soil Ecology 2016, 102, 36–45. [Google Scholar] [CrossRef]
  44. Zhou, X.; Chen, C.; Wang, Y.; Xu, Z.; Han, H.; Li, L.; Wan, S. Warming and Increased Precipitation Have Differential Effects on Soil Extracellular Enzyme Activities in a Temperate Grassland. Science of The Total Environment 2013, 444, 552–558. [Google Scholar] [CrossRef]
  45. Liu, W.; Allison, S.D.; Xia, J.; Liu, L.; Wan, S. Precipitation Regime Drives Warming Responses of Microbial Biomass and Activity in Temperate Steppe Soils. Biol Fertil Soils 2016, 52, 469–477. [Google Scholar] [CrossRef]
  46. Yamada, H.; Miller, J.; Stockton, J. Desiccated Grass Mulch Increases Irrigation Efficiency for Cotton. Hilgardia 1963, 17, 12–13. [Google Scholar]
  47. Adekalu, K.O.; Olorunfemi, I.A.; Osunbitan, J.A. Grass Mulching Effect on Infiltration, Surface Runoff and Soil Loss of Three Agricultural Soils in Nigeria. Bioresource Technology 2007, 98, 912–917. [Google Scholar] [CrossRef]
  48. Lauer, S.; Sanderson, M.R.; Manning, D.T.; Suter, J.F.; Hrozencik, R.A.; Guerrero, B.; Golden, B. Values and Groundwater Management in the Ogallala Aquifer Region. Journal of Soil and Water Conservation 2018, 73, 593–600. [Google Scholar] [CrossRef]
  49. NOAA Lubbock 1991-2020 Climate Normals. Available online: https://www.weather.gov/lub/climate-klbb-norm-2020 (accessed on 25 July 2024).
  50. Vance, E.D.; Brookes, P.C.; Jenkinson, D.S. An Extraction Method for Measuring Soil Microbial Biomass C. Soil Biology and Biochemistry 1987, 19, 703–707. [Google Scholar] [CrossRef]
  51. Nunan, N.; Morgan, M.A.; Herlihy, M. Ultraviolet Absorbance (280 Nm) of Compounds Released from Soil during Chloroform Fumigation as an Estimate of the Microbial Biomass. Soil Biology and Biochemistry 1998, 30, 1599–1603. [Google Scholar] [CrossRef]
  52. Joergensen, R.G.; Mueller, T. The Fumigation-Extraction Method to Estimate Soil Microbial Biomass: Calibration of the kEN Value. Soil Biology and Biochemistry 1996, 28, 33–37. [Google Scholar] [CrossRef]
  53. R Core Team R: The R Project for Statistical Computing 2024.
  54. Bates, D.; Mächler, M.; Bolker, B.; Walker, S. Fitting Linear Mixed-Effects Models Using Lme4. Journal of Statistical Software 2015, 67, 1–48. [Google Scholar] [CrossRef]
  55. Fox, J.; Weisberg, S. An R Companion to Applied Regression; SAGE Publications, 2018; ISBN 978-1-5443-3648-0.
  56. Searle, S.R.; Speed, F.M.; Milliken, G.A. Population Marginal Means in the Linear Model: An Alternative to Least Squares Means. The American Statistician 1980, 34, 216–221. [Google Scholar] [CrossRef]
  57. Wickham, H. Ggplot2: Elegant Graphics for Data Analysis; Springer: New York, NY, 2009; ISBN 978-0-387-98140-6. [Google Scholar]
  58. Hollister, R.D.; Elphinstone, C.; Henry, G.H.R.; Bjorkman, A.D.; Klanderud, K.; Björk, R.G.; Björkman, M.P.; Bokhorst, S.; Carbognani, M.; Cooper, E.J.; et al. A Review of Open Top Chamber (OTC) Performance across the ITEX Network. Arctic Science 2023, 9, 331–344. [Google Scholar] [CrossRef]
  59. Welshofer, K.B.; Zarnetske, P.L.; Lany, N.K.; Thompson, L.A.E. Open-Top Chambers for Temperature Manipulation in Taller-Stature Plant Communities. Methods in Ecology and Evolution 2018, 9, 254–259. [Google Scholar] [CrossRef]
  60. Hollister, R.D.; Webber, P.J.; Nelson, F.E.; Tweedie, C.E. Soil Thaw and Temperature Response to Air Warming Varies by Plant Community: Results from an Open-Top Chamber Experiment in Northern Alaska. Arctic, Antarctic, and Alpine Research 2006, 38, 206–215. [Google Scholar] [CrossRef]
  61. León-Sánchez, L.; Nicolás, E.; Goberna, M.; Prieto, I.; Maestre, F.T.; Querejeta, J.I. Poor Plant Performance under Simulated Climate Change Is Linked to Mycorrhizal Responses in a Semi-Arid Shrubland. Journal of Ecology 2018, 106, 960–976. [Google Scholar] [CrossRef]
  62. Escolar, C.; Martínez, I.; Bowker, M.A.; Maestre, F.T. Warming Reduces the Growth and Diversity of Biological Soil Crusts in a Semi-Arid Environment: Implications for Ecosystem Structure and Functioning. Philosophical Transactions of the Royal Society B: Biological Sciences 2012, 367, 3087–3099. [Google Scholar] [CrossRef] [PubMed]
  63. Turmel, M.-S.; Speratti, A.; Baudron, F.; Verhulst, N.; Govaerts, B. Crop Residue Management and Soil Health: A Systems Analysis. Agricultural Systems 2015, 134, 6–16. [Google Scholar] [CrossRef]
  64. Blanco-Canqui, H.; Lal, R. Crop Residue Removal Impacts on Soil Productivity and Environmental Quality. Critical Reviews in Plant Sciences 2009, 28, 139–163. [Google Scholar] [CrossRef]
  65. Greiser, C.; Hederová, L.; Vico, G.; Wild, J.; Macek, M.; Kopecký, M. Higher Soil Moisture Increases Microclimate Temperature Buffering in Temperate Broadleaf Forests. Agricultural and Forest Meteorology 2024, 345, 109828. [Google Scholar] [CrossRef]
  66. Irmak, S. CropWatch. June 21 2016.
  67. Ma, L.; Shao, M.; Li, T. Characteristics of Soil Moisture and Evaporation under the Activities of Earthworms in Typical Anthrosols in China. Sustainability 2020, 12, 6603. [Google Scholar] [CrossRef]
  68. Qin, S.; Chen, L.; Fang, K.; Zhang, Q.; Wang, J.; Liu, F.; Yu, J.; Yang, Y. Temperature Sensitivity of SOM Decomposition Governed by Aggregate Protection and Microbial Communities. Science Advances 2019, 5, eaau1218. [Google Scholar] [CrossRef]
  69. Li, Y.; Lv, W.; Jiang, L.; Zhang, L.; Wang, S.; Wang, Q.; Xue, K.; Li, B.; Liu, P.; Hong, H.; et al. Microbial Community Responses Reduce Soil Carbon Loss in Tibetan Alpine Grasslands under Short-Term Warming. Global Change Biology 2019, 25, 3438–3449. [Google Scholar] [CrossRef]
  70. Bond-Lamberty, B.; Thomson, A. Temperature-Associated Increases in the Global Soil Respiration Record. Nature 2010, 464, 579–582. [Google Scholar] [CrossRef]
  71. Carrillo, Y.; Tissue, D.T.; Bruna, S.; Maier, C.; Dijkstra, F.A. Drought Impacts on Tree Root Traits Are Linked to Their Decomposability and Net Carbon Release. Front. For. Glob. Change 2022, 5. [Google Scholar] [CrossRef]
  72. Ma, W.; Tang, S.; Dengzeng, Z.; Zhang, D.; Zhang, T.; Ma, X. Root Exudates Contribute to Belowground Ecosystem Hotspots: A Review. Front Microbiol 2022, 13, 937940. [Google Scholar] [CrossRef]
  73. Shen, X.; Yang, F.; Xiao, C.; Zhou, Y. Increased Contribution of Root Exudates to Soil Carbon Input during Grassland Degradation. Soil Biology and Biochemistry 2020, 146, 107817. [Google Scholar] [CrossRef]
  74. Jones, D.L.; Nguyen, C.; Finlay, R.D. Carbon Flow in the Rhizosphere: Carbon Trading at the Soil–Root Interface. Plant Soil 2009, 321, 5–33. [Google Scholar] [CrossRef]
  75. Schimel, J.P. Life in Dry Soils: Effects of Drought on Soil Microbial Communities and Processes. Annual Review of Ecology, Evolution, and Systematics 2018, 49, 409–432. [Google Scholar] [CrossRef]
  76. Schimel, J.; Balser, T.C.; Wallenstein, M. Microbial Stress-Response Physiology and Its Implications for Ecosystem Function. Ecology 2007, 88, 1386–1394. [Google Scholar] [CrossRef]
  77. van Gestel, N.C.; Dhungana, N.; Tissue, D.T.; Zak, J.C. Seasonal Microbial and Nutrient Responses during a 5-Year Reduction in the Daily Temperature Range of Soil in a Chihuahuan Desert Ecosystem. Oecologia 2016, 180, 265–277. [Google Scholar] [CrossRef]
  78. Conant, R.T.; Ryan, M.G.; Ågren, G.I.; Birge, H.E.; Davidson, E.A.; Eliasson, P.E.; Evans, S.E.; Frey, S.D.; Giardina, C.P.; Hopkins, F.M.; et al. Temperature and Soil Organic Matter Decomposition Rates – Synthesis of Current Knowledge and a Way Forward. Global Change Biology 2011, 17, 3392–3404. [Google Scholar] [CrossRef]
  79. Chen, J.; Elsgaard, L.; van Groenigen, K.J.; Olesen, J.E.; Liang, Z.; Jiang, Y.; Lærke, P.E.; Zhang, Y.; Luo, Y.; Hungate, B.A.; et al. Soil Carbon Loss with Warming: New Evidence from Carbon-Degrading Enzymes. Global Change Biology 2020, 26, 1944–1952. [Google Scholar] [CrossRef] [PubMed]
  80. Allison, S.D.; Wallenstein, M.D.; Bradford, M.A. Soil-Carbon Response to Warming Dependent on Microbial Physiology. Nature Geosci 2010, 3, 336–340. [Google Scholar] [CrossRef]
  81. Tajik, S.; Ayoubi, S.; Zeraatpisheh, M. Digital Mapping of Soil Organic Carbon Using Ensemble Learning Model in Mollisols of Hyrcanian Forests, Northern Iran. Geoderma Regional 2020, 20, e00256. [Google Scholar] [CrossRef]
  82. Schnecker, J.; Borken, W.; Schindlbacher, A.; Wanek, W. Little Effects on Soil Organic Matter Chemistry of Density Fractions after Seven Years of Forest Soil Warming. Soil Biology and Biochemistry 2016, 103, 300–307. [Google Scholar] [CrossRef]
  83. Hamido, S.; Guertal, E.; Wood, W. Seasonal Variation of Carbon and Nitrogen Emissions from Turfgrass. American Journal of Climate Change 2016, 5, 448–463. [Google Scholar] [CrossRef]
  84. Winsome, T.; Silva, L.C.R.; Scow, K.M.; Doane, T.A.; Powers, R.F.; Horwath, W.R. Plant-Microbe Interactions Regulate Carbon and Nitrogen Accumulation in Forest Soils. Forest Ecology and Management 2017, 384, 415–423. [Google Scholar] [CrossRef]
  85. Córdova, S.C.; Olk, D.C.; Dietzel, R.N.; Mueller, K.E.; Archontouilis, S.V.; Castellano, M.J. Plant Litter Quality Affects the Accumulation Rate, Composition, and Stability of Mineral-Associated Soil Organic Matter. Soil Biology and Biochemistry 2018, 125, 115–124. [Google Scholar] [CrossRef]
  86. Ågren, G.I.; Bosatta, N. Theoretical Analysis of the Long-Term Dynamics of Carbon and Nitrogen in Soils. Ecology 1987, 68, 1181–1189. [Google Scholar] [CrossRef]
  87. Sinsabaugh, R.L.; Manzoni, S.; Moorhead, D.L.; Richter, A. Carbon Use Efficiency of Microbial Communities: Stoichiometry, Methodology and Modelling. Ecology Letters 2013, 16, 930–939. [Google Scholar] [CrossRef] [PubMed]
  88. Li, N.; Lin, H.; Wang, T.; Li, Y.; Liu, Y.; Chen, X.; Hu, X. Impact of Climate Change on Cotton Growth and Yields in Xinjiang, China. Field Crops Research 2020, 247, 107590. [Google Scholar] [CrossRef]
  89. Pettigrew, W.T. The Effect of Higher Temperatures on Cotton Lint Yield Production and Fiber Quality. Crop Science 2008, 48, 278–285. [Google Scholar] [CrossRef]
  90. Hatfield, J.L.; Prueger, J.H. Temperature Extremes: Effect on Plant Growth and Development. Weather and Climate Extremes 2015, 10, 4–10. [Google Scholar] [CrossRef]
  91. Arshad, A.; Raza, M.A.; Zhang, Y.; Zhang, L.; Wang, X.; Ahmed, M.; Habib-ur-Rehman, M. Impact of Climate Warming on Cotton Growth and Yields in China and Pakistan: A Regional Perspective. Agriculture 2021, 11, 97. [Google Scholar] [CrossRef]
  92. Reddy, K.R.; Davidonis, G.H.; Johnson, A.S.; Vinyard, B.T. Temperature Regime and Carbon Dioxide Enrichment Alter Cotton Boll Development and Fiber Properties. Agronomy Journal 1999, 91, 851–858. [Google Scholar] [CrossRef]
  93. Bibi, A.; Oosterhuis, D.; Gonias, E. Molecular Biology and Physiology Photosynthesis, Quantum Yield of Photosystem Ii and Membrane Leakage as Affected by High Temperatures in Cotton Genotypes. J. Cotton Sci. 2008, 12. [Google Scholar]
  94. DeLaune, P.B.; Mubvumba, P.; Ale, S.; Kimura, E. Impact of No-till, Cover Crop, and Irrigation on Cotton Yield. Agricultural Water Management 2020, 232, 106038. [Google Scholar] [CrossRef]
  95. Ale, S.; Himanshu, S.K.; Mauget, S.A.; Hudson, D.; Goebel, T.S.; Liu, B.; Baumhardt, R.L.; Bordovsky, J.P.; Brauer, D.K.; Lascano, R.J.; et al. Simulated Dryland Cotton Yield Response to Selected Scenario Factors Associated With Soil Health. Front. Sustain. Food Syst. 2021, 4. [Google Scholar] [CrossRef]
  96. Broughton, K.J.; Bange, M.P.; Baker, J.T.; Yates, C.; Tan, D.K.Y.; Tissue, D.T.; Payton, P. Effects of Elevated CO2 and Warmer Temperature on Early Season Field-Grown Cotton in High-Input Systems. Crop Science 2021, 61, 657–671. [Google Scholar] [CrossRef]
  97. Wang, J.; Du, G.; Tian, J.; Jiang, C.; Zhang, Y.; Zhang, W. Mulched Drip Irrigation Increases Cotton Yield and Water Use Efficiency via Improving Fine Root Plasticity. Agricultural Water Management 2021, 255, 106992. [Google Scholar] [CrossRef]
  98. Anderson, T.-H.; Domsch, K.H. Ratios of Microbial Biomass Carbon to Total Organic Carbon in Arable Soils. Soil Biology and Biochemistry 1989, 21, 471–479. [Google Scholar] [CrossRef]
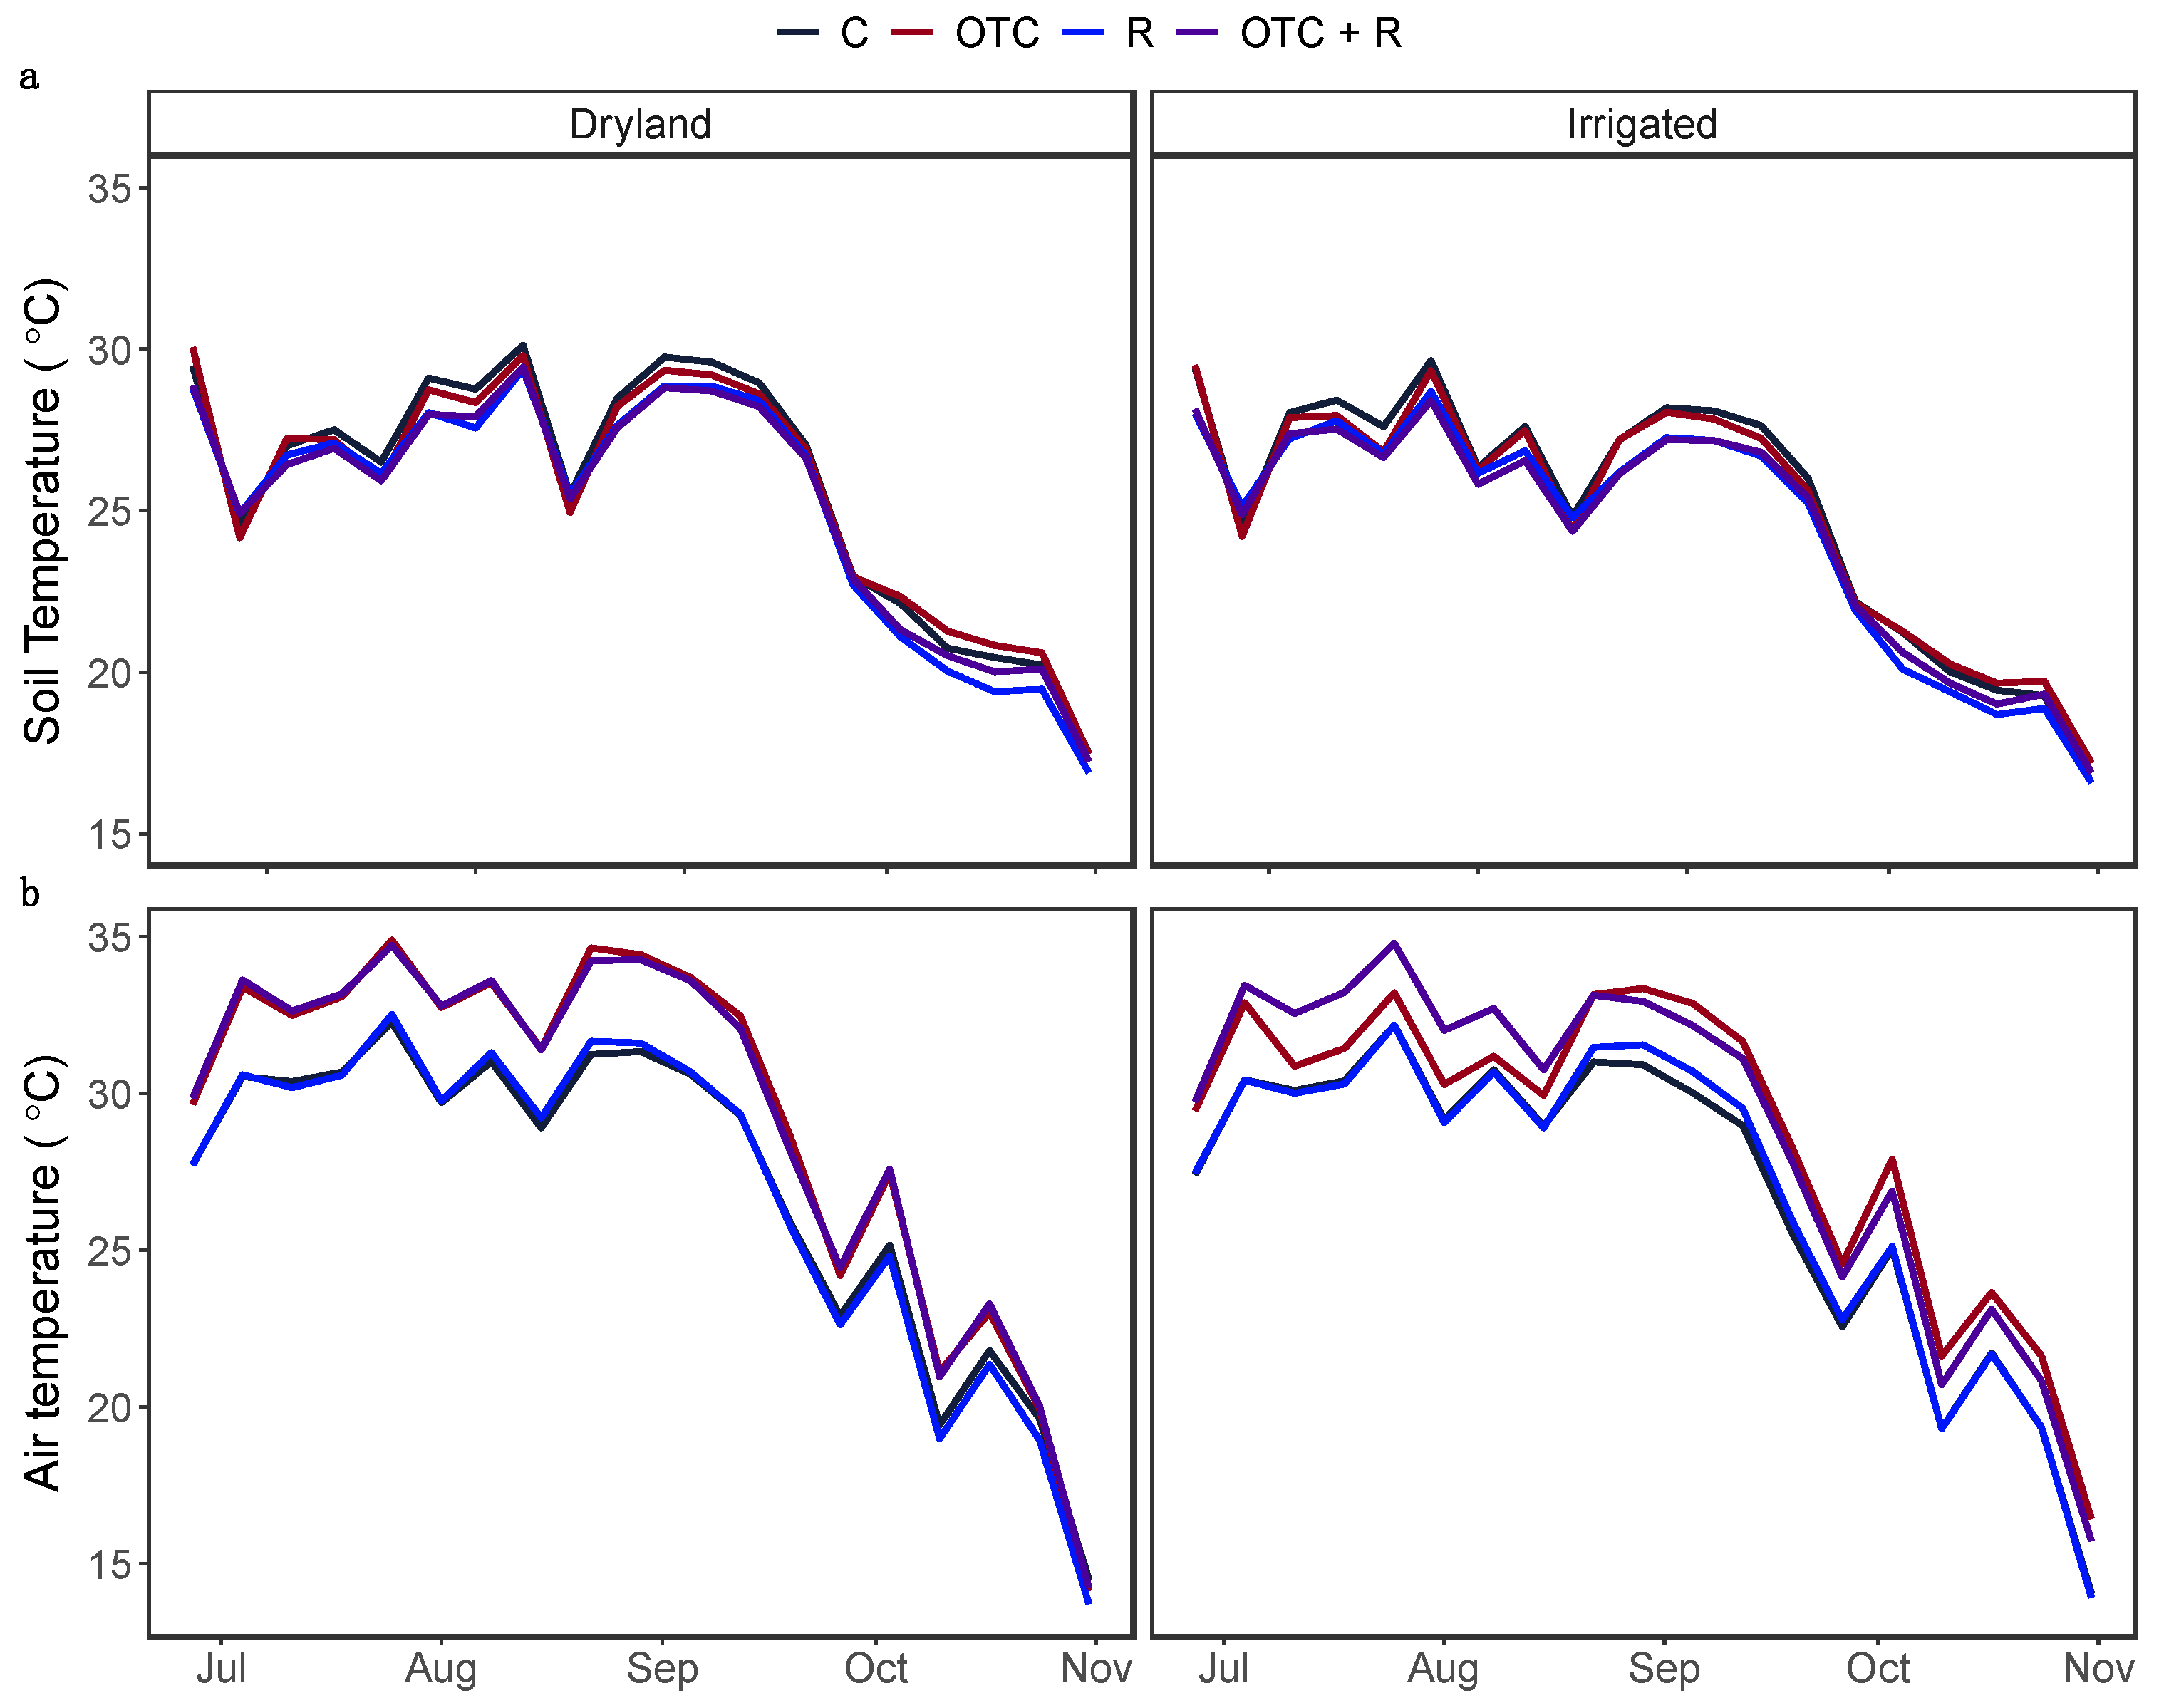
Figure 1. Weekly average of (a) soil temperature measured at 10 cm soil depth and (b) air temperature measured near leaf canopy, across the treatments. C: Ambient temperature, No Residue; OTC: Open Top Chamber, No Residue; R: Ambient temperature, Residue; and OTC + R: Open Top Chamber, Residue.
Preprints 114635 g001
Figure 2. Average daily temperature range (DTR) measured at 10 cm soil depth across OTC, irrigation, and residue treatments. The larger square dots indicate the model-predicted average temperature for each treatment, while error bars represent 95% confidence intervals. Each smaller dot represents the temperature range (averaged by month) of an individual plot. The boxes show the lower quartiles, median, and upper quartiles, and the whiskers extend to the most extreme observations.
Preprints 114635 g002
Figure 3. (a)Weekly average volumetric water contents (VWC) measured at 10 cm soil depth. The light blue, vertical bars show the weekly total rainfall. (b) Average VWC, across OTC, irrigation, and residue treatments. The larger square dots indicate the model-predicted average temperature, while error bars represent 95% confidence intervals. Each smaller dot represents the average temperature (averaged by months) of an individual plot. The boxes show the lower quartiles, median, and upper quartiles, and the whiskers extend to the most extreme observations. C: No Open Top Chamber, No Residue; OTC: Open Top Chamber, No Residue; R: No Open Top Chamber, Residue; and OTC + R: Open Top Chamber, Residue.
Preprints 114635 g003
Figure 4. Average (a) soil organic matter, (b) microbial biomass carbon, and (c) soil respiration, across OTC, irrigation, and residue treatments. The larger square dots indicate the model-predicted average values, while error bars represent 95% confidence intervals. Each smaller dot represents the data for an individual plot. The boxes show the lower quartiles, median, and upper quartiles, and the whiskers extend to the most extreme observations.
Preprints 114635 g004
Figure 5. Regression plots showing a relationship between (a) soil organic matter and soil temperature, (b) microbial biomass carbon and soil organic matter, and (c) microbial biomass carbon and available nitrate nitrogen in soil. The solid line represents a regression line predicted from linear mixed effect model. The shaded region represents 95% confidence intervals. The light red dots show the dryland while blue dots show the irrigated fields. The square dots indicate the residue added plots whereas the round dots indicate plots without residue.
Preprints 114635 g005
Figure 6. Average (a) above ground biomass, (b) belowground biomass and (c) seed cotton yield across OTC, irrigation, and residue treatments. The larger square dots indicate the model-predicted average values, while error bars represent 95% confidence intervals. Each smaller dot represents the data for an individual plot.
Preprints 114635 g006
Disclaimer/Publisher’s Note: The statements, opinions and data contained in all publications are solely those of the individual author(s) and contributor(s) and not of MDPI and/or the editor(s). MDPI and/or the editor(s) disclaim responsibility for any injury to people or property resulting from any ideas, methods, instructions or products referred to in the content.
Copyright: This open access article is published under a Creative Commons CC BY 4.0 license, which permit the free download, distribution, and reuse, provided that the author and preprint are cited in any reuse.
Prerpints.org logo

Preprints.org is a free preprint server supported by MDPI in Basel, Switzerland.

Subscribe

© 2024 MDPI (Basel, Switzerland) unless otherwise stated