Preprint
Article

A Comprehensive Analysis of the Genomic and Expressed Repertoire of the T Cell Receptor Beta Chain in Equus caballus

Altmetrics

Downloads

93

Views

49

Comments

0

A peer-reviewed article of this preprint also exists.

Submitted:

07 August 2024

Posted:

08 August 2024

You are already at the latest version

Alerts
Abstract
In this paper, we report a comprehensive and consistent annotation of the locus encoding the horse T cell receptor b-chain (TRB), as inferred from the most recent genome assembly. The horse TRB locus spans approximately 1 Mb, making it the largest locus among the mammalian species stud-ied to date, with a significantly higher number of genes related to extensive duplicative events. In the region, 136 TRBV, belonging to 29 subgroups, 2 TRBD, 13 TRBJ and 2 TRBC genes, were iden-tified. The general genomic organization resembles that of other mammals, with a V-cluster of 135 TRBV genes, located upstream of two in-tandem aligned TRBD-J-C clusters, and an inverted TRBV gene at the 3’ end of the last TRBC gene. However, the horse b-chain repertoire would be affected by a high number of non-functional TRBV genes. Thus, we queried a transcriptomic da-taset derived from splenic tissue of a healthy adult horse, using each TRBJ gene as a probe to ana-lyse clonotypes encompassing the V(D)J junction. This analysis provided insights into the usage of the TRBV, TRBD and TRBJ genes and the variability of the juxtaposition region. Our results clearly demonstrated that the horse β-chain constitutes a complex level of variability broadly like that described in other mammalian species.
Keywords: 
Subject: Biology and Life Sciences  -   Life Sciences

1. Introduction

The horse (Equus caballus), a representative of the perissodactyls, is a popular farm animal. Due to its great socio-economic, biomedical and evolutionary value, this species has played a key role throughout human history. The horse is commonly used as an animal model for human genetic diseases and, since the 19th century, has contributed our understanding of immune response [1,2,3,4]. The current interest in equine immunology makes it necessary to investigate the genetics underlying the equine immune response, and the generation of a reference genome contributes significantly to this goal. Within adaptive immunity, T lymphocytes are key components in the context of cell-mediated response, thanks to the ability of the T cell receptor (TR) they express to perceive peptides of various nature.
The TRs are heterodimeric T lymphocyte membrane proteins consisting of one α and β chain or one γ and δ chain. The αβ T cell receptor is able to specific recognize a multitude of antigenic processed peptides presented on heterologous cells by the class I or class II major histocompatibility complex (MHC) molecules [5]. The γδ TR are not limited by MHC restriction but they have the potential to recognize directly and without processing, diverse molecular entities in a manner similar to immunoglobulins or presented by RPI-MH1Like proteins, providing more flexible and not yet clear recognition of a wide range of ligands (soluble, membrane-bound, and unprocessed antigens) [6].
Each TR chain comprises a variable (V) domain in its N-terminus and a constant (C) region, in the C-terminus encoded by multigene families arranged in a TR locus [7]. To generate a large repertoire of TR capable of recognizing diverse antigens, during the development of the T lymphocytes in the thymus, the variable (V) and joining (J) genes of the TR a (TRA) and g (TRD) loci and the V, diversity (D) and J genes of the TR b (TRB) and d (TRD) loci undergo somatic recombination process, with the resulting rearranged V(D)J regions encoding the V domains of the a/b and g/d TR chains [7].
Random trimming and addition of non-template nucleotide (N additions) at the VD and DJ junctional sites greatly increases diversity and form the most variable complementarity-determining regions 3 (CDR3-IMGT) domain usually accountable for antigen recognition. Two other hypervariable loops, CDR1 (CDR1-IMGT) and CDR2 (CDR2-IMGT) are encoded by the germline V gene. CDR loops are spaced between four framework regions (FR-IMGT).
The process of somatic recombination involves the site-specific cleavage of DNA by RAG-1 and RAG-2 proteins at conserved recombination signal (RS) sequences flanking the borders of the V, D and J genes, composed of conserved heptamers and nonamers with intervening non-conserved 12- or 23-bp spacers. After transcription the V(D)J sequence is spliced to the C gene.
As evident, the recombination process implies that the number of V, D and J genes in the germline DNA is an important determinant of the extent of the primary TR repertoire, becoming the subject of study in many species. These comparative analyses, although not very useful in themselves, may reveal new insights into the multiple distinct mechanisms that may create TR diversity in vertebrates. [8].
Among the four TR loci, the genomic structure of the TRB locus is the most conserved across different species of mammals, with a V gene cluster (TRBV), consisting of a number that varies from species to species, positioned upstream of tandem-aligned TRBD-J-C clusters, each composed of a single D (TRBD) gene, several J (TRBJ) genes, and one C (TRBC) gene. A single TRBV gene with an inverted transcriptional orientation is located at the 3’ end of the locus. In most mammalian species [https://www.imgt.org/IMGTrepertoire/; 9] two TRBD-J-C clusters exist. Exceptionally, a third TRBD-J-C cluster was identified in cetartiodactyl species [10,11,12,13,14,15].
However, in all mammalian species, MOXD2 and EPHB6 genes border each TRB locus at the 5’ and 3’ end, respectively, whereas TRY genes are interspersed among TRBV genes, arranged in two distinct genomic positions [https://www.imgt.org/IMGTrepertoire/; 9].
In this paper, we provide a comprehensive genomic and expression analysis of the TRB locus in Equus caballus for the first time in a mammalian species belonging to the Perissodactyla. Based on the recently released horse genome, our analysis study showed that the horse TRB locus represents the largest locus identified so far in mammalian species, with 136 TRBV, 2 TRBD, 13 TRBJ and 2 TRBC genes in approximately 900 Kb. Furthermore, the availability in public databases of a transcriptome derived from splenic tissue of a healthy adult horse, allowed us to evaluate the characteristics of the V(D)J somatic rearrangements and the variability of the b-chain repertoire through a clonotype analysis. Although a significant number of germline TRBV genes are non-functional (69%), our results clearly demonstrate that the horse β-chain has a level of variability that is substantially similar to that described in other mammalian species. This is due not only to the present of effective TRBD and TRBJ genes available for somatic recombination, but also to the presence of inter-cluster and trans-cluster rearrangement process in addition to canonical intra cluster recombination.

2. Materials and Methods

2.1. Genome Analyses

To determine the TRB locus location, the latest version of the horse EquCab3.0 genome sequence was searched using the BLAST algorithm. A sequence of 994518 bp was retrieved directly from the reference sequence NC_009147 (Equus caballus chromosome 4 genomic scaffold) available at NCBI from 95080400 to 96074910 positions. Particularly, the analyzed region comprises the monooxygenase, dopamine-beta-hydroxylase-like 2 (MOXD2) and ephrin type-B receptor 6 (EPHB6) genes, flanking respectively, the 5′ and 3′ ends of the TRB locus.
The human genomic sequence was used against the Equus caballus genome sequence to identify, based on homology by the BLAST program, the corresponding genomic TRBV, TRBD, TRBJ and TRBC genes. The beginning and end of each coding exon were identified with accuracy by the presence of splice sites or flanking recombination signal (RS) sequences of the TRBV, TRBD and TRBJ genes. The location of the TRB genes is provided in Table S1. The sequence comparison has also allowed the identification and characterization of the horse protease genes (TRY) within the TRB locus. The locations of the TRY genes are also provided in Table S1.
Computational analysis of the horse TRB locus was conducted using the following programs: RepeatMasker for the identification of genome-wide repeats and low complexity regions [Smit, A.F.A. Hubley, R. Green, P. RepeatMasker open-4.0. at http://www.repeatmasker.org] and PipMaker [16] for the alignment of the horse TRB sequence against itself.

2.2. Classification of the Horse TR Genes

Considering the percentage of nucleotide identity of the genes with respect to humans and based on the genomic position within the locus, each horse TRB gene was classified, and the nomenclature was established according to IMGT at http://www.imgt.org/IMGTScientificChart/SequenceDescription/IMGTfunctionality.html [17] (see Table S1). The functionality of the V, D, J and C genes was predicted through the manual alignment of sequences adopting the following parameters: (a) identification of the leader sequence at the 5′ of the V genes; (b) determination of proper RS sequences located at 3′ of the V (V-RS), 5′ and 3′ ends of the D (5’D-RS and 3’D-RS) and 5′ of the J (J-RS), respectively; (c) determination of conserved acceptor and donor splicing sites; (d) estimation of the expected length of the coding regions; (e) absence of frameshifts and stop codons in the coding regions of the genes. Conversely, a germline gene is qualified as ORF (Open Reading Frame) if the coding region has an open reading frame, but alterations have described in the splicing sites and/or RS sequences, and/or in changes of conserved amino acids. Finally, a germline gene is qualified as pseudogene (P) if its coding region has stop codon(s) and /or frameshift mutation(s).
The TRBV genes were assigned to 29 different subgroups, based on the percentage of nucleotide identity by using Clustal Omega alignment tool, which is available at EMBL-EBI website [http://www.ebi.ac.uk/, 18], adopting the criterion that sequences with a nucleotide identity of more than 75% in the coding region of a TR V gene (i.e., L-PART1+V-EXON) belong to the same subgroup [19].
Subsequently, the name of each subgroup was assigned based on the comparative and phylogenetic analysis with the human TRBV subgroups according to the IMGT Nomenclature [20]. Thus, the horse TRBV genes were named by the number of the assigned subgroup followed by a hyphen and a number corresponding to their genomic position within the locus when the TRBV subgroups consisted of more than one member gene.
The TRBD, TRBJ and TRBC genes were annotated, according to the similarity with humans (https://www.imgt.org/IMGTrepertoire/LocusGenes/#h1_6). Each TRBJ gene was designed by a number in accordance with the name of the belonging D-J-C cluster, followed by a hyphen and a number corresponding to their position within the cluster. They were all predicted to be functional (Table S1, Figure S1B-D).

2.3. Phylogenetic Analysis

The human TRBV gene sequences used for the phylogenetic analysis were retrieved from the IMGT® (IMGT Repertoire (IG and TR), https://www.imgt.org/IMGTrepertoire/> 1. Locus and genes), IMGT/GENE-DB [21]. For the horse phylogenetic analysis, we combined the nucleotide sequences of all V-REGION of the horse TRBV genes with the corresponding gene sequences of humans. All functional genes, ORFs and pseudogenes (excepted for the TRBV1, TRBVA, TRBVB and TRBVC pseudogenes) were selected.
Multiple alignments of the gene sequences under analysis were carried out with the MUSCLE program [22]. The evolutionary analyses were conducted in MEGA X [23,24]. We used the neighbor-joining (NJ) method to reconstruct the phylogenetic tree [25]. The evolutionary distances were computed using the Maximum Composite Likelihood method [26] and are in the units of the number of base differences per site.

2.4. Horse Transcriptome Analysis

An RNA-seq transcriptomic dataset derived from spleen of an adult healthy horse and available at the NCBI Sequencing Reader Archive (SRA, ID: ERX2600993) was examined to identify distinct TRB clonotypes. All the 13 horse TRBJ germline gene sequences were used as a probe to analyse the transcriptome data and to create datasets distinct for each TRBJ gene, considering only sequences with a percentage of nucleotide identity from 98 to 100%. The resulting reads of each dataset were then translated and only the unique in frame sequence with a recognizable TRBJ and TRBC genes were analysed in detail. We obtained an output comprising continuous sequences of a length of 120 bp, each containing the 3’part of the TRBV region, the D region with any no-template bases, the TRBJ region and the 5’ part of the TRBC region. Therefore, all reads included the V-beta CDR3-IMGT, defined as the amino acid stretch 105-117, starting at the codon after the last cysteine (2nd-CYS 104) of the TRBV gene and ending at the amino acid before the phenylalanine (J-PHE 118) in the conserved motif FGXG of TRBJ genes [17].
Since the TRBD genes undergo substantial base deletion and overall transformation during V-D-J recombination, the determination of TRBD genes in CDR3 is usually complex. With respect to the two TRBD genomic sequences, we chose to consider the nt located in the CDR3 region as belonging to a TRBD sequence if they constituted a stretch of at least six consecutive nt or 2 AA (50% of the length of the TRBD1 germline gene) corresponding to the TRBD1 or TRBD2 germline sequences. Unambiguous detection of TRBD bases allows for precise identification of TRBD segment boundaries and characterization of non-templated bases at the V-D and D-J junction.

3. Results

3.1. General Organization of the Horse TRB Locus

To determine the genomic organization of the horse TRB locus we retrieved from the whole chromosome 4 contig (NC_009147) a continuous sequence between the MOXD2 and the EPHB6 genes, which, flanking all mammalian TRB loci studied to date, represent the IMGT 5’ and the 3’ borne, respectively (IMGT, https://www.imgt.org/IMGTrepertoire/LocusGenes/bornes/bornesTRB.html). Within this region of 930869 bp, we identified and annotated all the horse TRB genes using the human sequence as reference. The first TRB gene (TRBV1) is located 4.5 Kb downstream of the IMGT 5’borne (MOXD2 gene), while the last TRB gene (TRBV30) lies approximately 42 Kb upstream of the 3’ borne (EPHB6 gene).
Overall, we identified 136 TRBV genes, 2 TRBD, 13 TRBJ and 2 TRBC genes. 135 TRBV are in a region of about 900 Kb positioned upstream of two TRBD-J-C clusters, followed by a single TRBV with inverted transcriptional orientation. One TRBD, six TRBJs and one TRBC gene compose the TRBD-J-C cluster 1, while one TRBD, seven TRBJs and one TRBC gene are found in the TRBD-J-C cluster2. TRBD-J-C cluster 1 spans approximately 6.7 Kb with the six TRBJ genes occupying approximately 2.1 Kb. TRBD-J-C cluster 2 spans 6.5 Kb, of which the seven TRBJs occupy 1.1 Kb (Figure 1).
The classification, position and predicted functionality of all horse TRB genes are reported in Table S1.
Additionally, we identified and annotated the tripsin-like serine protease (TRY) genes that are typically interspersed among the mammalian TRB genes [ref varie]. Six TRY genes are located in 80 Kb, between the first and the second TRBV genes, while a single TRY gene is present upstream of the TRBD-J-C cluster 1 (Figure 1). The TRY genes were named with consecutive numbers based on their genomic location within the TRB locus. The position and predicted functionality of all unrelated horse TRB genes are also reported in Table S1.

3.2. Sequence Analysis of the TRBV Genes and Classification

The annotated TRBV genes grouped into 29 distinct subgroups according to the criterion that sequences with nucleotide identity above 75% belong to the same subgroup [19]. However, the membership of some genes to their own subgroup was then confirmed by phylogenetic analysis (see below) as the nucleotide identity with some but not all other members was found to be less than 75% (data not shown).
Five TRBV subgroups consist of one gene, while the remaining 24 contain at least two member genes with a massive expansion of the TRBV5 (20 genes) and the TRBV7 (11 genes) (Table 1). Out of the 136 TRBV genes, 47 (approximately 35%) are predicted to be functional genes as defined by the IMGT rules (see “Methods”), and 89 (65%) are not functional (84 pseudogenes and 5 ORFs).
The high number of not functional TRBV genes significantly reduces the possible horse beta chain repertoire, with 10 subgroups containing only not functional genes or with subgroups such as the TRBV5 where only six of twenty were maintained as functional genes. On the contrary, five multi members subgroups (TRBV3, TRBV6, TRBV21, TRBV27 and TRBV28) are formed by only functional TRBV genes. Thus, only 19 of the 29 subgroups would contribute to generating the horse’s beta chain repertoire.
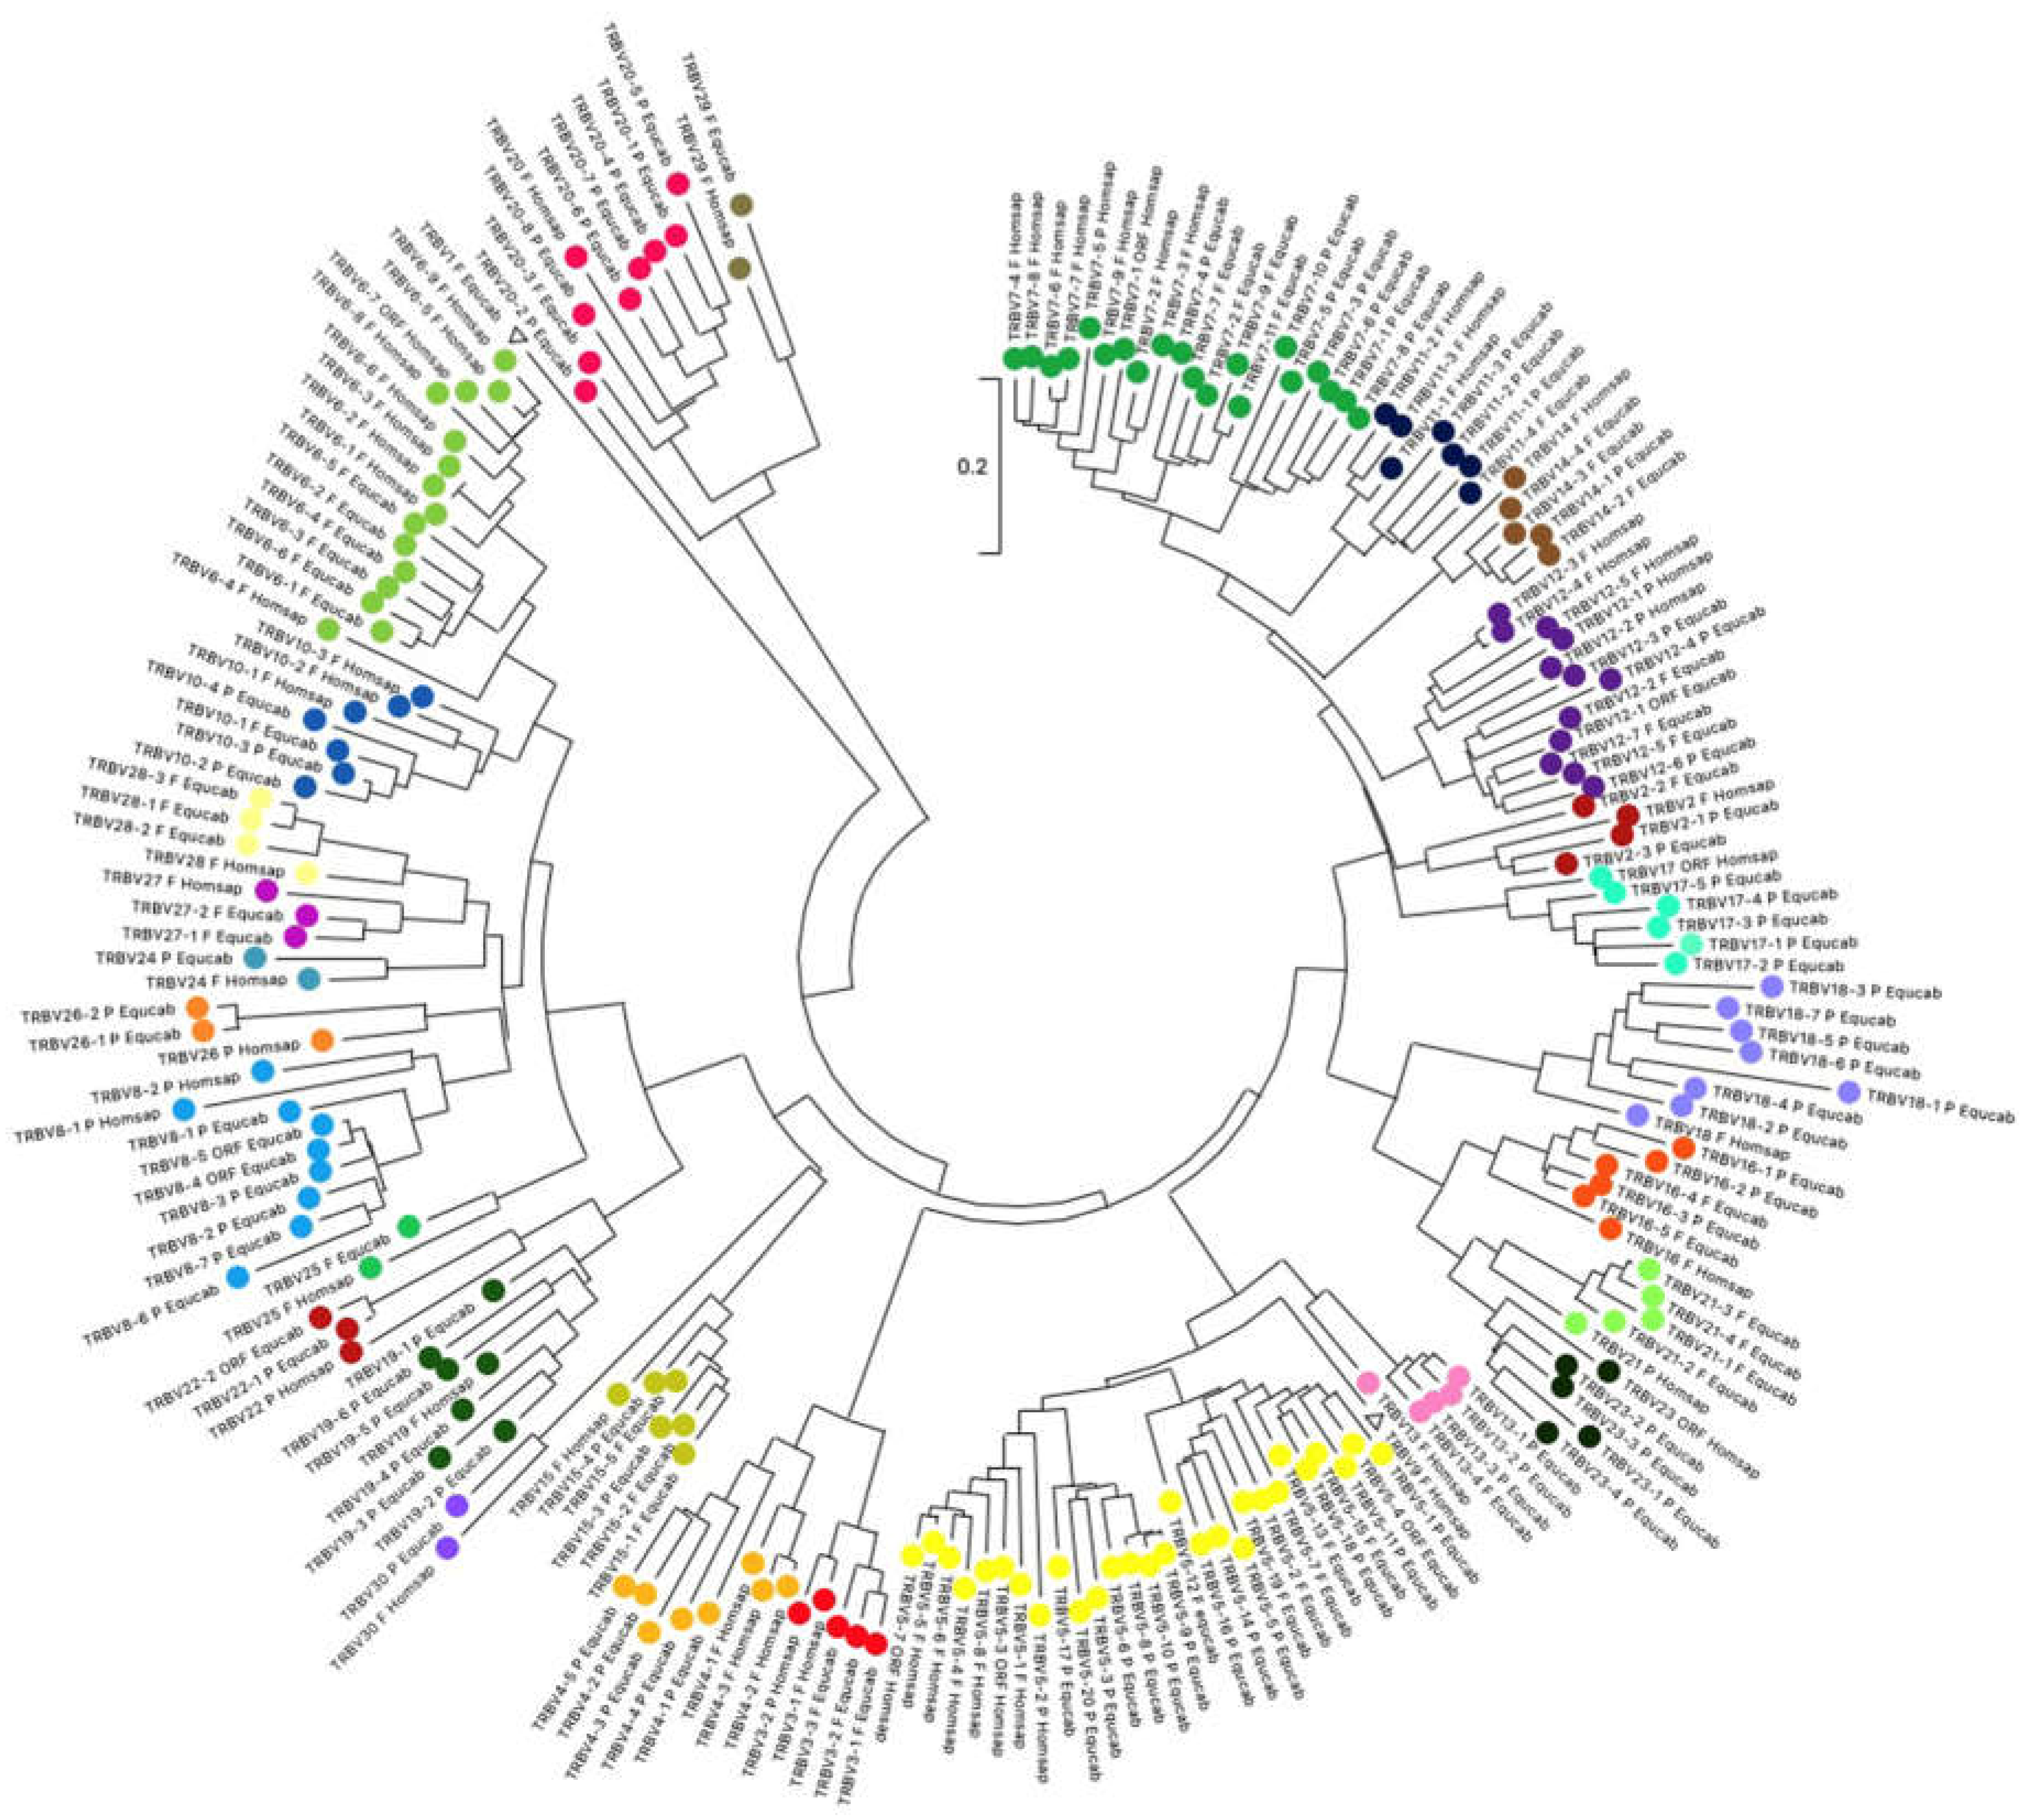
To validate the membership of the horse TRBV genes to the subgroups and classify each TRBV subgroup, the evolutionary relationship of these genes was investigated by comparing all horse gene sequences with all corresponding human gene sequences (except for the TRBV1, TRBVA, TRBVB and TRBVC pseudogenes). Thus, the V-REGION nucleotide sequences of all selected TRBV genes were combined in the same alignment, and an unrooted phylogenetic tree was constructed using the NJ method [25] (Figure 2). The tree shows a clear phylogenetic clustering of each horse TRBV subgroup (except for the TRBV1) with a corresponding human one. Therefore, based on the monophyletic groupings, each horse TRBV subgroup was named as the orthologous human one in accordance with the IMGT rules [20]. The exception is the horse TRBV1 gene which lacks the human counterpart in the tree. However, the structure and its genomic position, being the first gene within the horse TRB locus, indicated that it is the TRBV1 gene. Interestingly, all but one of the human TRBV subgroups, the TRBV9, are found in the horse genome, indicating that the emergence of distinct subgroups occurred before the divergence of the two species.
The deduced amino acid sequences of the potential functional germline TRBV genes, ORF and in frame pseudogenes are shown in Figure S1A, where they are aligned according to IMGT unique numbering for the V-REGION [27] to maximize the percentage of identity. The alignment shows the heterogeneity of amino acid sequence between and within subgroups, with distinctive structural features (i.e., CDR-IMGT and FR-IMGT) of the genes for each TRBV subgroup. It is notable that three germline TRBV genes (TRBV6-1, TRBV6-3 and TRBV25) have as unique defect an in-frame STOP-CODON at their region end (3' last codon for V-REGION based on IMGT [27]. These genes are classified as functional since this STOP-CODON may very frequently disappear during V-(D)-J rearrangements owing to the mechanisms of junctional and/or N-diversity and this results in a potential productive rearranged transcript.

3.3. Classification and Structure of the TRBD, TRBJ and TRBC Genes

As in humans and mostly mammalian species [https://www.imgt.org/IMGTrepertoire/; 28,29], the horse TRBD, TRBJ and TRBC genes are distributed within two in tandem TRBD-J-C clusters positioned at the 3’ end of the TRB locus, with a number corresponding to their position from 5’ to 3’ (Figure 1).
The nucleotide and deduced amino acid sequences of the two TRBD genes are showed in Figure S1B. They consist of a 12 (TRBD1) and 17 (TRBD2) G-rich stretches that can be productively read through their three coding phases and encode till 4 glycine residues, depending on the phase. The RSs that flank the 5′ and 3′ sides of the coding region are well conserved with respect to the consensus.
Figure S1C reports the nucleotides and deduced amino acid sequences of all the TRBJ genes. They were classified, based on the international nomenclature [IMGT, http://www.imgt.org; 30, 31], according to the subsequent TRBC gene and numbered in agreement with the genomic position within the respective cluster. Their length is between 47 bp and 53 bp and all conserve the canonical FGXG amino acid motif, whose presence define the functionality of the J genes. Each TRBJ is flanked by a 12 RS at the 5′ end and by a donor splice site at the 3′ end. All the RSs are well conserved with respect to the consensus.
Like in all mammalian species (https://www.imgt.org/IMGTrepertoire/Proteins/), the horse TRBC genes are composed of four exons and three introns. They are nearly identical and encode a similar protein of 177 amino acids (Figure S1D). Only three mismatches differentiate the nucleotide sequence of the coding region of the two genes, resulting in three amino acid (AA) changes, one in the C-domain and two in cytoplasmic region. The C-domain encoded by EX1 is 129 AA in length. The C region also comprises a connecting region (CO) of 21 AA (encoded by EX2 and the 5′ part of EX3) with a cysteine involved in the interchain disulphide binding, a transmembrane region (TM) of 22 AA (encoded by the 3′ part of EX3 and the first codon of EX4) and a cytoplasmic region (CY) of 5 AA (encoded by EX4).
Minimal length differences were detected in the first (459 bp and 455 bp for TRBC1 and TRBC2 gene, respectively), in the second (141 bp and 140 pb for TRBC1 and TRBC2 gene, respectively) and in the third intron (311 bp and 296 pb long in the TRBC1 and TRBC2 genes, respectively) introns. The percentage of nucleotide identity is greater than 98% between the first introns and between the second introns, while it is significantly reduced (31%) between the third introns. Likewise, the 3’UTR differs extensively both in length (222 bp for TRBC1 and 174 bp for TRBC2) and in composition (42% of nucleotide identity). The similarities and differences found between the two horse TRBC genes are a structural and distinctive feature of the TRBC genes conserved in many other mammalian species [10,28,29], indicating a likely distinctive role between the two genes.

3.4. Genomic Architecture of the TRBV-Cluster

To investigate on the genomic architecture of the horse TRBV-cluster we first analyzed the level of GC content, and the composition of the repeated sequences interspersed in the region. For this purpose, we carried out the analysis, using the Repeat Masker program, on the genomic sequence of approximately 900 Kb comprising from TRBV1 to TRBV29 genes. The results are summarized in Table S2. The GC content is 41,62%. The density of total interspersed repeats is 30,35%. LINEs, predominantly of the LINE1 family, are the most abundant repeat elements (19,77%). On the contrary, SINE are poorly represented (1,66%).
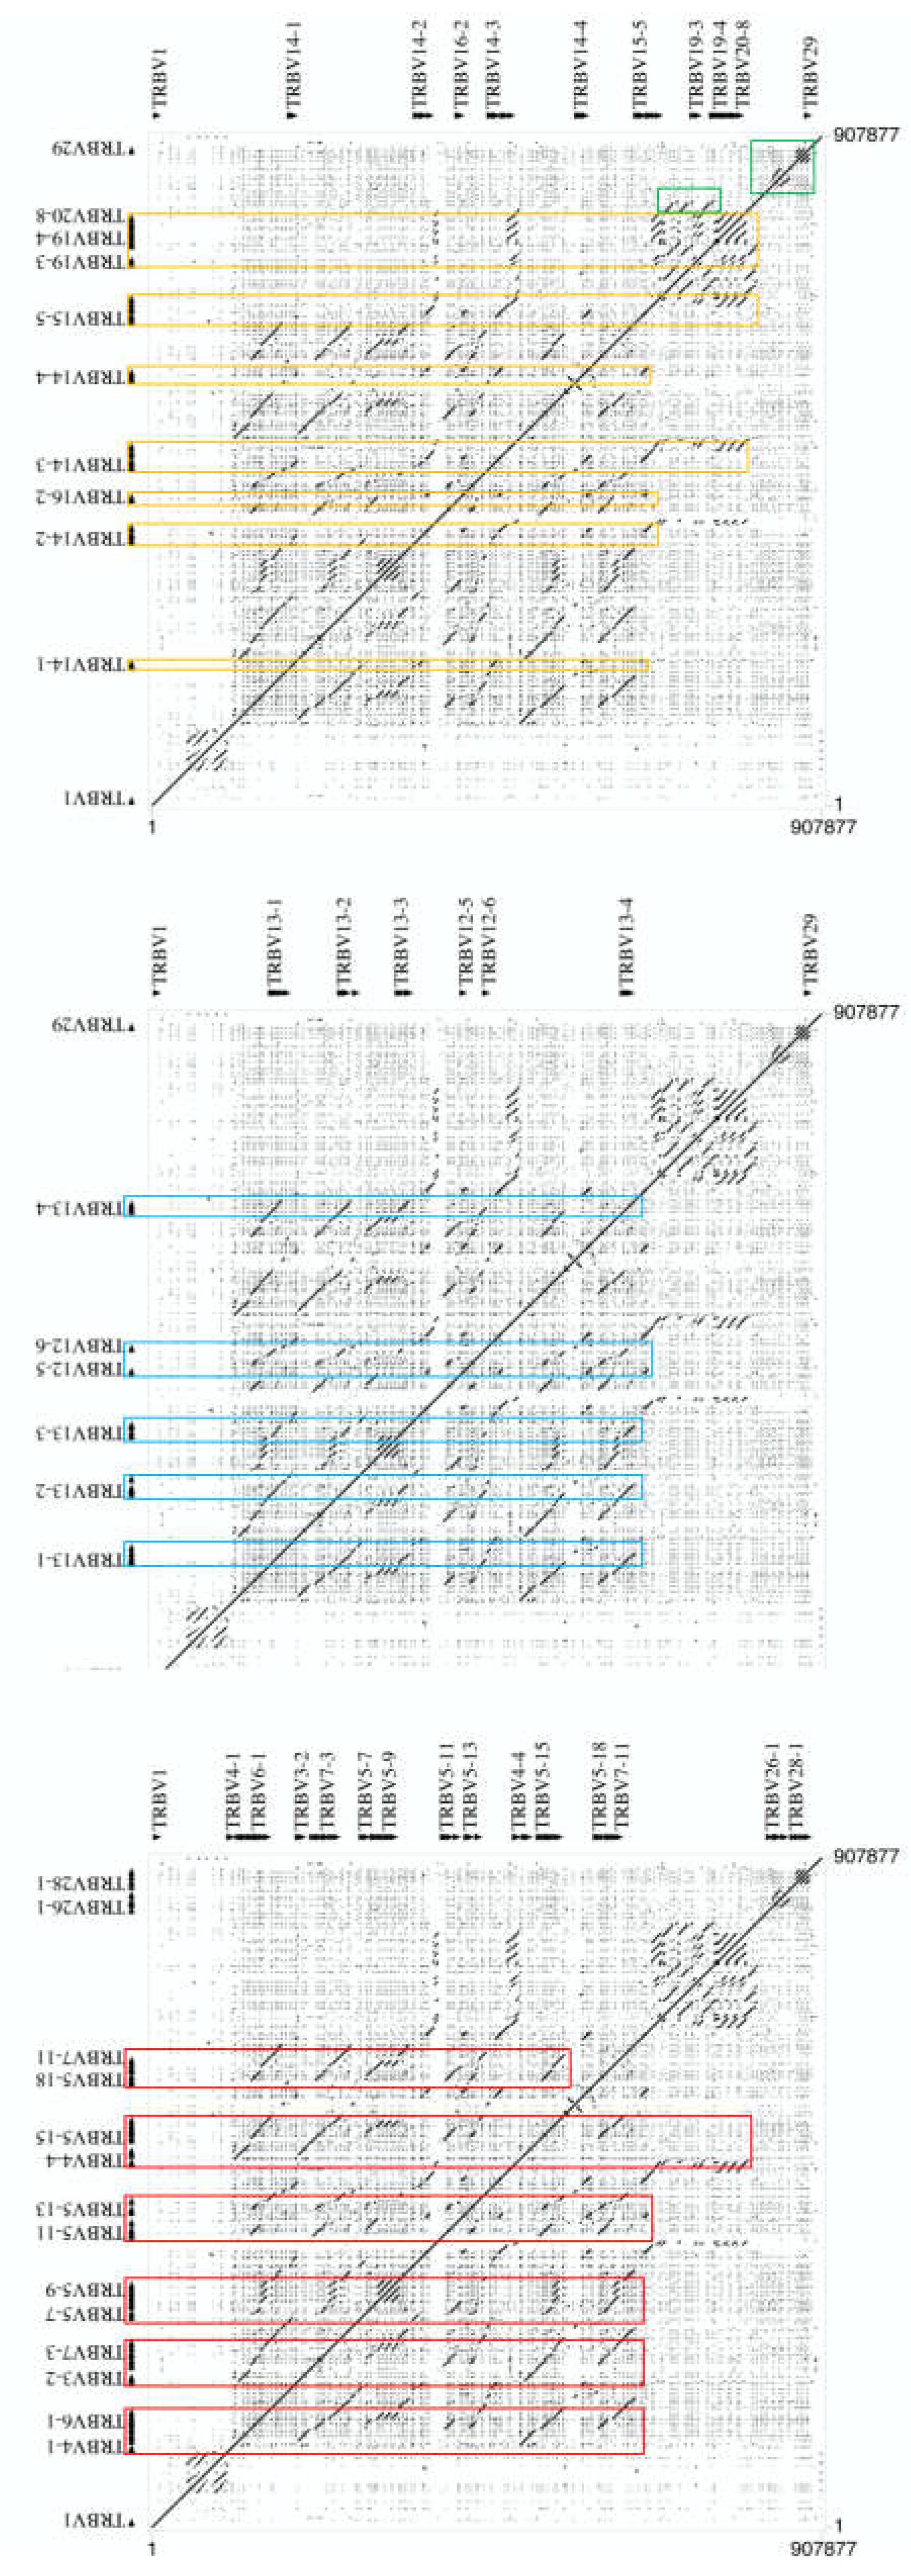
The masked sequence was then aligned against itself with the PipMaker program to identify, through identity lines, the model of duplications that have generated the expansion of the TRBV gene subgroups (Figure 3). The dot matrix confirms the high level of nucleotide identity between TRBV genes as indicated by dots that correspond with gene location. Furthermore, we observed, in addition to the perfect main diagonal line for the match of each base with itself, parallel lines identifying duplicate portions of the sequence which align with multiple regions within the sequence itself.
The parallel lines are of different sizes, indicating that individual genes (the smaller lines) but also groups of contiguous genes (the larger lines) were involved during the duplication events. Different duplication units can be distinguished involving different groups of contiguous genes, which alternate within the locus. A first group consists of the genes from the TRBV2 to the TRBV8 subgroup which, although with various gene arrangements, has been duplicated several times in the locus (left part of the Figure 3), generating the most numerous subgroups, such as the TRBV5 (20 genes) and the TRBV7 (11 genes). A second duplicated gene block involved from the TRBV10 to TRBV13 subgroups (central part in the Figure 3), including the multimember TRBV12 subgroup (7 genes). Furthermore, seven duplicate gene blocks of different sizes involve the subsequent gene subgroups, from the TRBV14 to the TRBV20 (right part in the Figure 3), the latter consisting of 8 member genes.
Looking in more detail, it is possible to recognize longer parallel lines in the matrix, made up of the union of the three different units, which form a higher order repetitive unit in tandem duplicated.
Furthermore, small parallel lines are evident at the 3’ end of the V-cluster region (Figure 3), where the homology units corresponding to the TRBV21-TRBV22-TRBV23 and TRBV26-TRBV27 gene blocks are duplicated. Tandem duplications of the TRBV28 subgroup genes are also evident.
The PipMaker program also allows to express the sequence alignment as a percentage identity plot (pip) (Figure S2). The pip shows the position of all genes identified in the region as well as the location and orientation of all repetitive sequences. In this regard, among the interspersed repeats, we note the high percentage of LINEs located along the entire sequence, in particular between the different duplication units, suggesting their possible role in duplication events.

3.5. Clonotype Analysis

Genomic information of all the TRB genes and their organization allowed us to evaluate the characteristics of the V-D-J rearrangement through the CDR3 analysis of the horse beta chain transcripts available in public databases. Since CDR3 comprises the region of juxtaposition between the rearranged TRBV, TRBD and TRBJ genes, our analysis also provided information on the diversity of the horse beta chain repertoire.
Essentially, we queried a transcriptome dataset derived from splenic tissue of a healthy adult horse using the sequences of each previously annotated horse TRBJ germline gene. Transcript sequences of 120 bp in length were recovered and all were translated and screened for the presence of an open reading frame and a recognizable CDR3 sequence, with in frame TRBJ and TRBC sequences.
212 different clonotypes were selected. They are reported in Figure S3, grouped based on the TRBJ genes. All the germline TRBJs, except TRBJ1-3, were found in the transcripts and, in all cases, they perfectly matched the corresponding germline genes. However, the number of transcripts for each TRBJ gene varies considerably, from four reads for the TRBJ1-4 and TRBJ1-5 genes to 42 for the TRBJ2-1 gene. This difference could be related to the level of participation of each TRGJ genes in the rearrangement. If so, the TRBJ2 gene cluster seems to be preferentially used (148/212 clonotypes, approximately 70%) suggesting that it is relevant for the production of horse beta chain transcript (Table 2).
In addition, a slight increase in the use of TRBJ2-1 (42/148 clonotypes, 28.3%) and TRBJ2-4 (37/148 clonotypes, 25%) can be observed.
With our experimental approach (see Material and Methods section), a TRBD gene was identified in 134 out of 212 clonotypes, of which 53 belonging to the TRBD1 and 81 to the TRBD2 gene. 78 sequences do not have a recognizable TRBD gene. Intra-cluster D-J rearrangements represent a consistent portion of the repertoire (109/134 clonotypes, 81,3%), with 32 TRBD1-TRBJ1 and 77 TRBD2-TRBJ2 rearrangements, while 21 clonotypes (15,6%) can be interpreted as direct 5’-to- 3’ joining across clusters (inter-cluster rearrangements) (in red in Figure S3). Interestingly, we also observed four TRBD2-TRBJ1 joining (in blue in Figure S3). Since the D-J-C cluster 2 is located downstream the D-J-C cluster 1 within the TRB locus, these junctions may be explained by chromosomal inversion, or with more probability, by trans-rearrangement occurring during TRB locus recombination as already described [28,32].
In the clonotypes, only the last portion of TRBV genes, involved in the second step of somatic recombination, is available to recognize and classify them. This fact, together with the often high sequence homology between some TRBV genes and the replacement of deleted TRBV ends with non-templated bases has made it impossible to assign a single unique TRBV gene to each clonotype. We were unable to assign a TRBV gene in 51 out of 212 clonotypes. For the remaining 161 sequences, in 93 clonotypes the V portion was unambiguously assigned to the corresponding TRBV member genes, while in 68 clonotypes we could only establish its membership to a subgroup (Table 3).
A substantial portion of the 161 clonotypes is represented by the TRBV20 (34 reads), TRBV5 (26 reads), TRBV21 (21 reads), TRBV28 (17 reads), TRBV14 (14 reads) and TRBV12 (11 reads) subgroups and, in particular, within the TRBV20 subgroup, the TRBV20-8 gene is the most abundant, with 26 clonotypes. Among the 161 mRNA clones, we also found two members of the TRBV8 subgroup, TRBV8-3 and TRBV8-5 genes, and the TRBV5-4 and TRBV20-8 genes, all identified in the assembly as non-functional (Table S1, Figure 1). It is possible that these clonotypes represent the transcription of an initial non-productive rearrangement. Alternatively, one can hypothesize that functional alleles of these genes exist or, more likely, that there are sequencing errors in the genomic assembly. Further analysis will be necessary to resolve these ambiguities.
Conversely, among the functional TRBV subgroups we did not find genes of the TRBV1, TRBV10, TRBV13 and TRBV16 subgroups.
A close inspection of the CDR3 sequence (underlined in Figure S3) reveals that it is heterogeneous in amino acid composition. The mean length of the CDR3 loop was approximately 12.60 AA (range 9-18) with no differences among TRBJ genes (Table 2). For comparison, the human, dog and pig peripheral blood CDR3β loop is approximately 12.7, 12,9 and 12,2 residues long, respectively [12,28,33].

4. Discussion

In modern times, interest in the species Equus caballus continues to promote genetic studies on this species and, undoubtedly, the generation of the reference genome assembly holds the promise to further improve our knowledge of it.
Horse genome analysis is indeed a very active area of research, aimed at identifying the genes responsible for various hereditary traits associated with fertility, athletic performance, disease resistance, etc., and at delineating the genetic makeup of individual horse breeds and populations [1,2,3,4]. The investigation also extends to the equine immune response, and, in this context, it begins to identify specific situations in which the horse may provide a unique immunological model for human diseases [1,2,3,4].
The present study, by defining the organization of the horse TRB locus, contributes to a better understanding of the repertoire of horse TRB genes and their evolution.
As expected, the general genomic organization of the horse TRB locus is similar to that of most other mammalian species in which it has been defined, with a V-cluster positioned upstream of two tandem-aligned TRBD-J-C clusters, although a substantial difference is its extent, making it the largest TRB locus identified to date. Notably, the same feature was found in the analysis of the previously annotated horse TRG locus [34]. Much of the large horse TRB area (900 KB) is occupied by the V-cluster (135 TRBV genes), while the two TRBD-J-C clusters span approximately 6.5 Kb each. The size of the V-cluster can be related to the extent and complexity of gene duplications that have occurred in this region which led to the emergence of numerous multi-member TRBV subgroups. In fact, only five of the 29 TRBV subgroups are represent by a single member gene. In comparison, in human the majority of the TRBV subgroups consists of a single member gene. It is noteworthy that within large subgroups, such as the TRBV5 subgroup, there is greater diversification among some member genes (nucleotide identity is less than 75%), which would indicate the need for evolution to find new functions. These genes have nevertheless been assigned to their own subgroup by phylogenetic analysis. A similar situation was found in the sheep TRD locus among the TRDV1 genes whose subgroup is represented by over 40 member genes [35].
Since our phylogenetic analysis revealed the clustering of each horse subgroup with a corresponding human one, except for the TRBV9 subgroup, which is missing in the horse, we can establish that gene duplication within each subgroup rather than the emergence of distinct subgroups is the major mode of evolution of the horse TRBV genes.
It is noteworthy that gene duplications generated a horse TRBV germline repertoire consisting of a higher percentage of pseudogenes (66,4%) than the human one (26.5%). However, the total number of functional genes is identical (47), although differences in the profile of the functional genes can be observed, such as the absence of functional TRBV1 and TRBV21 genes in humans.
Dot-plot analyses of the TRBV region reinforce the conclusion that the V-cluster arose through a series of complex duplications and suggest that these duplication events exhibit different patterns, with genes duplicating individually or genes duplicating together giving rise to extensive duplication units. The overall view of the matrix highlights how each large gene unit has duplicated itself along the entire cluster V, interspersing itself with the others.
In another mammalian species in which the architecture of the TRB locus has been analysed, duplications have generally involved one or a few portions (usually at the 5') of the V-cluster and the gene units were mostly tandemly duplicated [12,14,28,29].
It is possible that these duplication events were mediated by repetitive sequences. Within the horse TRB locus the percentage of repetitive elements is 30.35%, with LINEs being predominant over SINEs (19.77% versus 1.66%). The percentage of LINEs is the highest as well as that of SINEs is the lowest found among various previously analysed TRB loci. [12,14,28,29]. For instance, in the human TRB, LINEs are 16.86% and SINE are 6.62%; in dog, 11.98% of repeat sequence are LINEs and 7.19% are SINEs; in pig and rabbit TRB loci, LINEs are 14.62% and 10.81%, respectively, even if the most abundant repeat elements are SINEs (15.65% and 14.18 %, respectively).
Therefore, LINEs may have played a key role in the evolution of the horse TRB locus. Indeed, if we look closely at the pip of Figure S2, we can observe that LINEs are distributed along the entire locus and are particularly localized between duplicated blocks, which strongly suggests their contribution to the architecture of the locus.
To explore the functional implication of the genomic characteristics of the horse TRB locus, we analysed the V-D and D-J junctions, including CDR3, of transcripts retrieved from a public splenic RNA library. Although the number of unique clones analysed was not very high and referred to a single tissue of a single adult animal, and although not in all clones TRBV or TRBD genes could be identified, some considerations can be made. With the exception of TRBV1, TRBV10, TRBV13, and TRBV16, all TRBV subgroups containing functional genes were found in the clonotype collection, and the TRBV usage ranged from 0.006% of TRBV29 to 21.1% of TRBV20 or 16.1% of TRBV,5 considering only the subset of clonotypes where TRBV subgroup assignment was unambiguous. TRBV21 (13.0%), and TRBV28 (10.5%) subgroup genes were also frequently found.
For comparison TRBV20-1, TRBV5-1, TRBV29 and TRBV28 represent the top four most expressed TRBV genes in human peripheral blood leukocytes collected from 550 individuals [36].
By CDR3 analysis, we also determined that 39.5% of recognizable TRBD clonotypes are TRBD1 and 60.5% are TRBD2. The preferential usage of TRBD2 results from intra-cluster rearrangements but also from an inter-cluster rearrangements and trans-rearrangements. This latter type of rearrangenment was also found in dogs and sheep [28,32]. For comparison, an almost identical use of the two TRBD genes was observed in human peripheral blood leukocytes with a slight prevalence for TRBD2 (50.1%) compared to TRBD1 (49.9%) [ref]. Conversely, in dog peripheral blood leukocytes, the TRBD1 gene appears more represented (71.4%) than TRBD2 [nostra ref dog]. However, variations in the TRBD usage may also be due to the difficulty in recognizing these genes in the transcripts.
Finally, CDR3 analysis revealed that the TRBJ2 cluster appears to be preferentially used (about 70%). It is possible that the preferential usage of the TRBJ2 set may depend on the number of J genes concentrated in a small genomic region, if multiple 12-RSs are important to increase the local recruitment of the RAG proteins [37]. In this regard, it is notable that the TRBJ1 gene set of all the species [IMGT, http://www.imgt.org; 28, 29], including the horse, is located in approximately 2.1 Kb, while the TRBJ2 genes are grouped in approximately 1 Kb. Therefore, the TRBJ2s seem to be crucial for the production of the beta chain transcripts. Alternatively, the frequency variation may depend on the tissue analysed. However, regardless of the genes involved in somatic recombination, the conservation of CDR3 length across species [12,28,33] indicates that it is a TR beta chain feature essential for T cell function.

5. Conclusions

The annotation of the horse TRB locus is an important achievement that follows that made for the TRG locus [34]. Taken together, these findings show that both the horse TRB and TRG locus are characterized by a large size with a concomitant extensive TRV gene expansion that determine the germline TRB and TRG repertoire, suggesting that a strong evolutionary pressure has driven the enlargement of the TR regions to produce a large, potential TR diversity.
The expansion of the TRBV genes is certainly related to the complex pattern of gene duplications that led to the birth of a horse-specific germline repertoire, albeit through the emergence of a large numbers of non-functional TRBV genes. In fact, despite the large number of pseudogenes, the expression profile is broad, diversified and similar to that of humans.
Overall, these results provide insights into the horse immune system and offer many avenues for future investigation.

Supplementary Materials

The following supporting information can be downloaded at the website of this paper posted on Preprints.org, Figure S1: (A) Structure of the horse TRBV genes based on the IMGT Protein display. The deduced amino acid sequences of the TRBV genes were manually aligned according to IMGT unique numbering for the V-REGION [27] to maximize homology. Only the functional genes, ORFs and the in-frame pseudogene are shown. All sequences exhibited the typical framework regions (FR) and complementarity determining regions (CDR) and the four amino acids (depicted and indicated in bold): cysteine 23 (1st-CYS) in FR1-IMGT, tryptophan 41 (CONSERVED-TRP) in FR2-IMGT, hydrophobic (here L, I and F) 89, and cysteine 104 (2nd-CYS) in FR3-IMGT, with the exception of the TRBV12-1 ORF that lacked the 1st-CYS, the TRBV10-3, TRBV12-4 and TRBV22-1 pseudogenes as well as the TRBV22-2 ORF that lack the CONSERVED-TRP, and the TRBV5-1, TRBV18-6, TRBV22-1, TRBV24 pseudogenes as well as the TRBV22-2 ORF lacking the 2nd-CYS. Conversely, CDR-IMGT varied in amino acid composition and length. In particular, the CDR1-IMGT was five or six amino acid lengths (AA) long. The CDR2-IMGT is six or seven AA long and the germline CDR3-IMGT was two, three, four or five AA long. On the contrary, the FR1-IMGT and FR2-IMGT are always 26 and 17 amino acid long, respectively; while the FR3-IMGT is 37 or 38 AA long except for the TRBV5-4 ORF whose FR3-IMGT is 30 AA long, with a deletion of seven AA within the E strand. The description of the strands and loops and the FR-IMGT and CDR-IMGT was according to the IMGT unique numbering for V-REGION [27]. The amino acid length of the CDR-IMGT is also indicated in square brackets. (B, C) Nucleotide and deduced amino acid sequences of the horse TRBD and TRBJ genes. The consensus sequence of the heptamer and nonamer is provided at the top of the figure and is underlined. The numbering adopted for the gene classification is reported on the left of each gene. The inferred amino acid sequence of the TRBD genes in the three coding frames are reported. The donor splice site for each TRBJ is shown. The canonical FGXG amino acid J-motif is underlined. The functionality (Fct) is also indicated. (D), Structure of the horse TRBC genes based on the IMGT Protein display. The descriptions of the strands and loops were collected according to the IMGT unique numbering for the C-DOMAIN [38]. The functionality (Fct) is indicated. The extracellular region (C domain) is shown with black letters, the connecting region is in orange, the transmembrane region is in purple, and the cytoplasmic region is in pink. 1st-CYS C23, CONSERVED-TRP W41, and hydrophobic AA L89 and 2nd-CYS C104 are coloured (IMGT colour menu and in bold. The AA changes between TRBC1 and TRBC2 are highlighted in green; Figure S2: Pip of the horse sequence versus itself. The masked horse sequence was aligned with itself using the PipMaker program, and the alignment was expressed as a percentage identity plot (pip). The presence in the pip of superimposed lines indicates the occurrence of redundant matches along the entire region. The position and orientation of all the genes and repetitive sequences are indicated. The horizontal lines represent the ungapped alignments at the percentage similarity corresponding to the scale on the right; Figure S3: The TRB clonotypes recovered from the RNA-seq dataset grouped based on the different TRBJ genes. The NCBI ID number and the predicted amino acid sequences are reported. The classification of the TRBD and TRBV genes of each clone, when recognizable, are listed on the right together with the CDR3 length. The CDR3-IMGT sequence, defined as the region starting at the codon after the last cysteine of the TRBV gene and ending at the amino acid before the phenylalanine in the conserved motif FGXG of TRBJ genes, according to the unique numbering [27] is underline. Amino acids attributed to the V regions are indicated in bold black as subgroup or single members, those attributed to the D region are in red; green colour indicates amino acids of the J region, while blue colour the C region. Amino acids that cannot be attributed to the V or J regions are indicated in plain black. The clonotypes derived from an inter cluster rearrangement are indicate in red, those derived from a trans-rearrangement are in bold blue. The sign ND indicates absence of the corresponding region; Table S1: Description of the TRB genes in the Equus caballus chromosome 4 genome assembly (NCBI Reference Sequence NC_009147). The position of all genes and their classification and functionality are reported. The position and functionality of the TRY genes is also reported; Table S2: Output file of the program RepeatMasker. Summary of the repeat content of horse TRBV-cluster is shown. The GC levels are also indicated.

Author Contributions

Conceptualization, R.A., F.G. and S.M.; methodology, F.G.; R.M and A.C.J.; data curation, A.P.; writing—original draft preparation, R.A. and S.M.; writing—review and editing, R.A. and S.M. All authors have read and agreed to the published version of the manuscript.

Funding

This research received no external funding.

Informed Consent Statement

Not applicable.

Acknowledgments

We thank Michele Pazienza for his laboratory support. The financial support of the University of Bari and of the University of Salento is gratefully acknowledged.

Conflicts of Interest

The authors declare no conflicts of interest.

References

  1. Casal, M.; Haskins, M. Large animal models and gene therapy. Eur J Hum Genet 2006, 14, 266–272. [Google Scholar] [CrossRef] [PubMed]
  2. Walther, S.; Rusitzka, T.V.; Diesterbeck, U.S.; Czerny, C.P. Equine immunoglobulins and organization of immunoglobulin genes. Developmental and comparative immunology 2015, 53, 303–319. [Google Scholar] [CrossRef] [PubMed]
  3. Ludwig, E.K.; Brandon Wiese, R.; Graham, M.R.; Tyler, A.J.; Settlage, J.M.; Werre, S.R.; Petersson-Wolfe, C.S.; Kanevsky-Mullarky, I.; Dahlgren, L.A. Serum and synovial fluid serum amyloid A response in equine models of synovitis and septic arthritis. Veterinary Surgery 2016, 45, 859–867. [Google Scholar] [CrossRef] [PubMed]
  4. Witkowski, L.; Cywinska, A.; Paschalis-Trela, K.; Crisman, M.; Kita, J. Multiple etiologies of equine recurrent uveitis—a natural model for human autoimmune uveitis: a brief review. Comp Immunol Microbiol Infect Dis 2016, 44, 14–20. [Google Scholar] [CrossRef] [PubMed]
  5. Nei, M.; Gu, X.; Sitnikova, T. Evolution by the birth-and-death process in multigene families of the vertebrate immune system. Proc. Natl. Acad. Sci. USA 1997, 94, 7799–7806. [Google Scholar]
  6. Antonacci, R.; Massari, S.; Linguiti, G.; Caputi Jambrenghi, A.; Giannico, F.; Lefranc, M.P.; Ciccarese, S. Evolution of the T-Cell Receptor (TR) Loci in the Adaptive Immune Response: The Tale of the TRG Locus in Mammals. Genes 2020, 11, 624. [Google Scholar] [CrossRef] [PubMed]
  7. Lefranc, M.-P.; Lefranc, G. The T Cell Receptor FactsBook; Academic Press Harcourt Science and Technology Company: San Diego, CA, USA, 2001. [Google Scholar]
  8. Flajnik, M.F.; Kasahara, M. Origin and evolution of the adaptive immune system: genetic events and selective pressures. Nature reviews. Genetics 2010, 11, 47–59. [Google Scholar] [CrossRef]
  9. Pégorier, P.; Bertignac, M.; Chentli, I.; Nguefack Ngoune, V.; Folch, G.; Jabado-Michaloud, J.; Hadi Saljoqi, S.; Giudicelli, V.; Duroux, P.; Lefranc, M.P.; Kossida, S. IMGT® Biocuration and Comparative Study of the T Cell Receptor Beta Locus of Veterinary Species Based on Homo sapiens TRB. Front Immunol 2020, 11, 821. [Google Scholar] [CrossRef]
  10. Antonacci, R.; Di Tommaso, S.; Lanave, C.; Cribiu, E.P.; Ciccarese, S.; Massari, S. Organization, structure and evolution of 41kb of genomic DNA spanning the D-J-C region of the sheep TRB locus. Mol Immunol 2008, 45, 493–509. [Google Scholar] [CrossRef]
  11. Antonacci, R.; Bellini, M.; Pala, A.; Mineccia, M.; Hassanane, M.S.; Ciccarese, S.; et al. The occurrence of three D-J-C clusters within the dromedary TRB locus highlights a shared evolution in Tylopoda, Ruminantia and Suina. Dev Compar Immunol 2017, 76, 105–119. [Google Scholar] [CrossRef]
  12. Massari, S.; Bellini, M.; Ciccarese, S.; Antonacci, R. Overview of the Germline and Expressed Repertoires of the TRB Genes in Sus scrofa. Frontiers in Immunology 2018, 9, 2526. [Google Scholar] [CrossRef] [PubMed]
  13. Antonacci, R.; Bellini, M.; Linguiti, G.; Ciccarese, S.; Massari, S. Comparative Analysis of the TRB Locus in the Camelus Genus. Frontiers in Genetics 2019, 10, 482. [Google Scholar] [CrossRef] [PubMed]
  14. Giannico, F.; Massari, S.; Jambrenghi, A.C.; Soriano, A.; Pala, A.; Linguiti, G.; Ciccarese, S.; Antonacci, R. The expansion of the TRB and TRG genes in domestic goats (Capra hircus) is characteristic of the ruminant species. BMC Genomics 2020, 21, 623. [Google Scholar] [CrossRef] [PubMed]
  15. Linguiti, G.; Kossida, S.; Pierri, C.L.; Jabado-Michaloud, J.; Folch, G.; Massari, S.; Lefranc, M.P.; Ciccarese, S.; Antonacci, R. The T Cell Receptor (TRB) Locus in Tursiops truncatus: From Sequence to Structure of the Alpha/Beta Heterodimer in the Human/Dolphin Comparison. Genes 2021, 12, 571. [Google Scholar] [CrossRef] [PubMed]
  16. Schwartz, S.; Zhang, Z.; Frazer, K.A.; Smit, A.; Riemer, C.; Bouck, J.; Gibbs, R.; Hardison, R.; Miller, W. PipMaker – a web server for aligning two genomic DNA sequences. Genome Res 2020, 10, 577–586. [Google Scholar] [CrossRef] [PubMed]
  17. Lefranc, MP. Immunoglobulin and T cell receptor genes: IMGT ® and the birth and rise of immunoinformatics. Front Immunol 2014, 5, 22. [Google Scholar] [CrossRef] [PubMed]
  18. Madeira, F.; Madhusoodanan, N.; Lee, J.; Eusebi, A.; Niewielska, A.; Tivey, A.R.N.; Lopez, R.; Butcher, S. The EMBL-EBI Job Dispatcher sequence analysis tools framework in 2024. Nucleic Acids Res 2024, 52, W521–W525. [Google Scholar] [CrossRef] [PubMed]
  19. Lefranc, M.-P.; Forster, A.; Baer, R.; Stinson, M.A.; Rabbitts, TH. Diversity and rearrangement of the human T cell rearranging gamma genes: nine germline variable genes belonging to two subgroups. Cell 1986, 45, 237–46. [Google Scholar] [CrossRef]
  20. Lefranc, M.-P. Correspondence between Homo sapiens and Mus musculus TRBV 107 subgroups nomenclature (IMGT-NC) Report. 2023. Available at: https://www.researchgate.net.
  21. Giudicelli, V.; Chaume, D.; Lefranc, M.P. IMGT/GENE-DB: a comprehensive database for human and mouse immunoglobulin and T cell receptor genes. Nucleic Acids Res 2005, 93, D256–261. [Google Scholar] [CrossRef]
  22. Edgar, RC. MUSCLE: A multiple sequence alignment method with reduced time and space complexity. BMC Bioinform 2004, 5. [Google Scholar] [CrossRef]
  23. Kumar, S.; Stecher, G.; Li, M.; Knynar, C.; Tamura, K. MEGAX: Molecular Evolutionary Genetics Analysis across Computing Platforms. Mol Biol Evol 2018, 35, 1547–1549. [Google Scholar] [CrossRef] [PubMed]
  24. Stecher, G.; Tamura, K.; Kumar, S. Molecular Evolutionary Genetics Analysis (MEGA) for macOS. Mol Biol Evol 2020, 37, 1237–1239. [Google Scholar] [CrossRef]
  25. Saitou, N.; Nei, M. The neighbor-joining method: A new method for reconstructingphylogenetic trees. Mol Biol Evol 1987, 4, 406–425. [Google Scholar] [PubMed]
  26. Tamura, K.; Nei, M.; Kumar, S. Prospects for inferring very large phylogenies by using the neighbor-joining method. Proc Natl Acad Sci USA 2004, 101, 11030–11035. [Google Scholar] [CrossRef] [PubMed]
  27. Lefranc, M.P.; Pommié, C.; Ruiz, M.; Giudicelli, V.; Foulquier, E.; Truong, L.; Thouvenin-Contet, V.; Lefranc, G. IMGT unique numbering for immunoglobulin and T cell receptor variable domains and Ig superfamily V-like domains. Dev Comp Immunol 2003, 27, 55–77. [Google Scholar] [CrossRef] [PubMed]
  28. Mineccia, M.; Massari, S.; Linguiti, G.; Ceci, L.; Ciccarese, S.; Antonacci, R. New insight into the genomic structure of dog T cell receptor beta (TRB) locus inferred from expression analysis. Dev Compar Immunol 2012, 37, 279–93. [Google Scholar] [CrossRef] [PubMed]
  29. Antonacci, R.; Giannico, F.; Ciccarese, S.; Massari, S. Genomic characteristics of the T cell receptor (TRB) locus in the rabbit (Oryctolagus cuniculus) revealed by comparative and phylogenetic analyses. Immunogenetics 2014, 66, 255–266. [Google Scholar] [CrossRef] [PubMed]
  30. Giudicelli, V.; Chaume, D.; Lefranc, M.P. IMGT/GENE-DB: a comprehensive database for human and mouse immunoglobulin and T cell receptor genes. Nucleic Acids Res 2005, 93, D256–261. [Google Scholar] [CrossRef] [PubMed]
  31. Lefranc, M.P.; Giudicelli, V.; Duroux, P.; Jabado-Michaloud, J.; Folch, G.; Aouinti, S.; Carillon, E.; Duvergey, H.; Houles, A.; Paysan-Lafosse, T.; Hadi-Saljoqi, S.; Sasorith, S.; Lefranc, G.; Kossida, S. IMGT®, the international ImMunoGeneTics information system® 25 years on. Nucleic acids research 2015, 43, D413–D422. [Google Scholar] [CrossRef]
  32. Di Tommaso, S.; Antonacci, R.; Ciccarese, S.; Massari, S. Extensive analysis of D-JC arrangements allows the identification of different mechanisms enhancing the diversity in sheep T cell receptor beta-chain repertoire. BMC Genomics 2010, 11, 3. [Google Scholar] [CrossRef]
  33. Hall, M.A.; Lanchbury, J.S. Healthy human T-cell receptor beta chain repertoire. Quantitative analysis and evidence for J beta-related effects on CDR3 structure and diversity. Hum Immunol 1995, 43, 207–218. [Google Scholar] [CrossRef] [PubMed]
  34. Massari, S.; Giannico, F.; Paolillo, N.V.; Pala, A.; Jambrenghi, A.C.; Antonacci, R. Genomic and Comparative Analysis of the T Cell Receptor Gamma chain Locus in the Equus Genus. Front Immunol 2023, 14. [Google Scholar] [CrossRef] [PubMed]
  35. Piccinni, B.; Massari, S.; Jambrenghi, A.C.; Giannico, F.; Lefranc, M.P.; Ciccarese, S.; Antonacci, R. Sheep (Ovis aries) T cell receptor alpha (TRA) and delta (TRD) genes and genomic organization of the TRA/TRD locus. BMC Genomics 2015, 16, 709. [Google Scholar] [CrossRef] [PubMed]
  36. Freeman, J.D.; Warren, R.L.; Webb, J.R.; Nelson, B.H.; Holt, R.A. Profiling the T-cell receptor beta-chain repertoire by massively parallel sequencing. Genome Res 2009, 19, 1817–1824. [Google Scholar] [CrossRef] [PubMed]
  37. Curry, J.D.; Geier, J.K.; Schlissel, M.S. Single-strand recombination signal sequence nicks in vivo: evidence for a capture model of synapsis. Nat Immunol 2005, 6, 1272–1279. [Google Scholar] [CrossRef]
  38. Lefranc, M.-P.; Pommié, C.; Kaas, Q.; Duprat, E.; Bosc, N.; Guiraudou, D.; et al. IMGT unique numbering for immunoglobulin and T cell receptor constant domains and Ig superfamily c-like domains. Dev Comp Immunol 2005, 29, 185–203. [Google Scholar] [CrossRef]
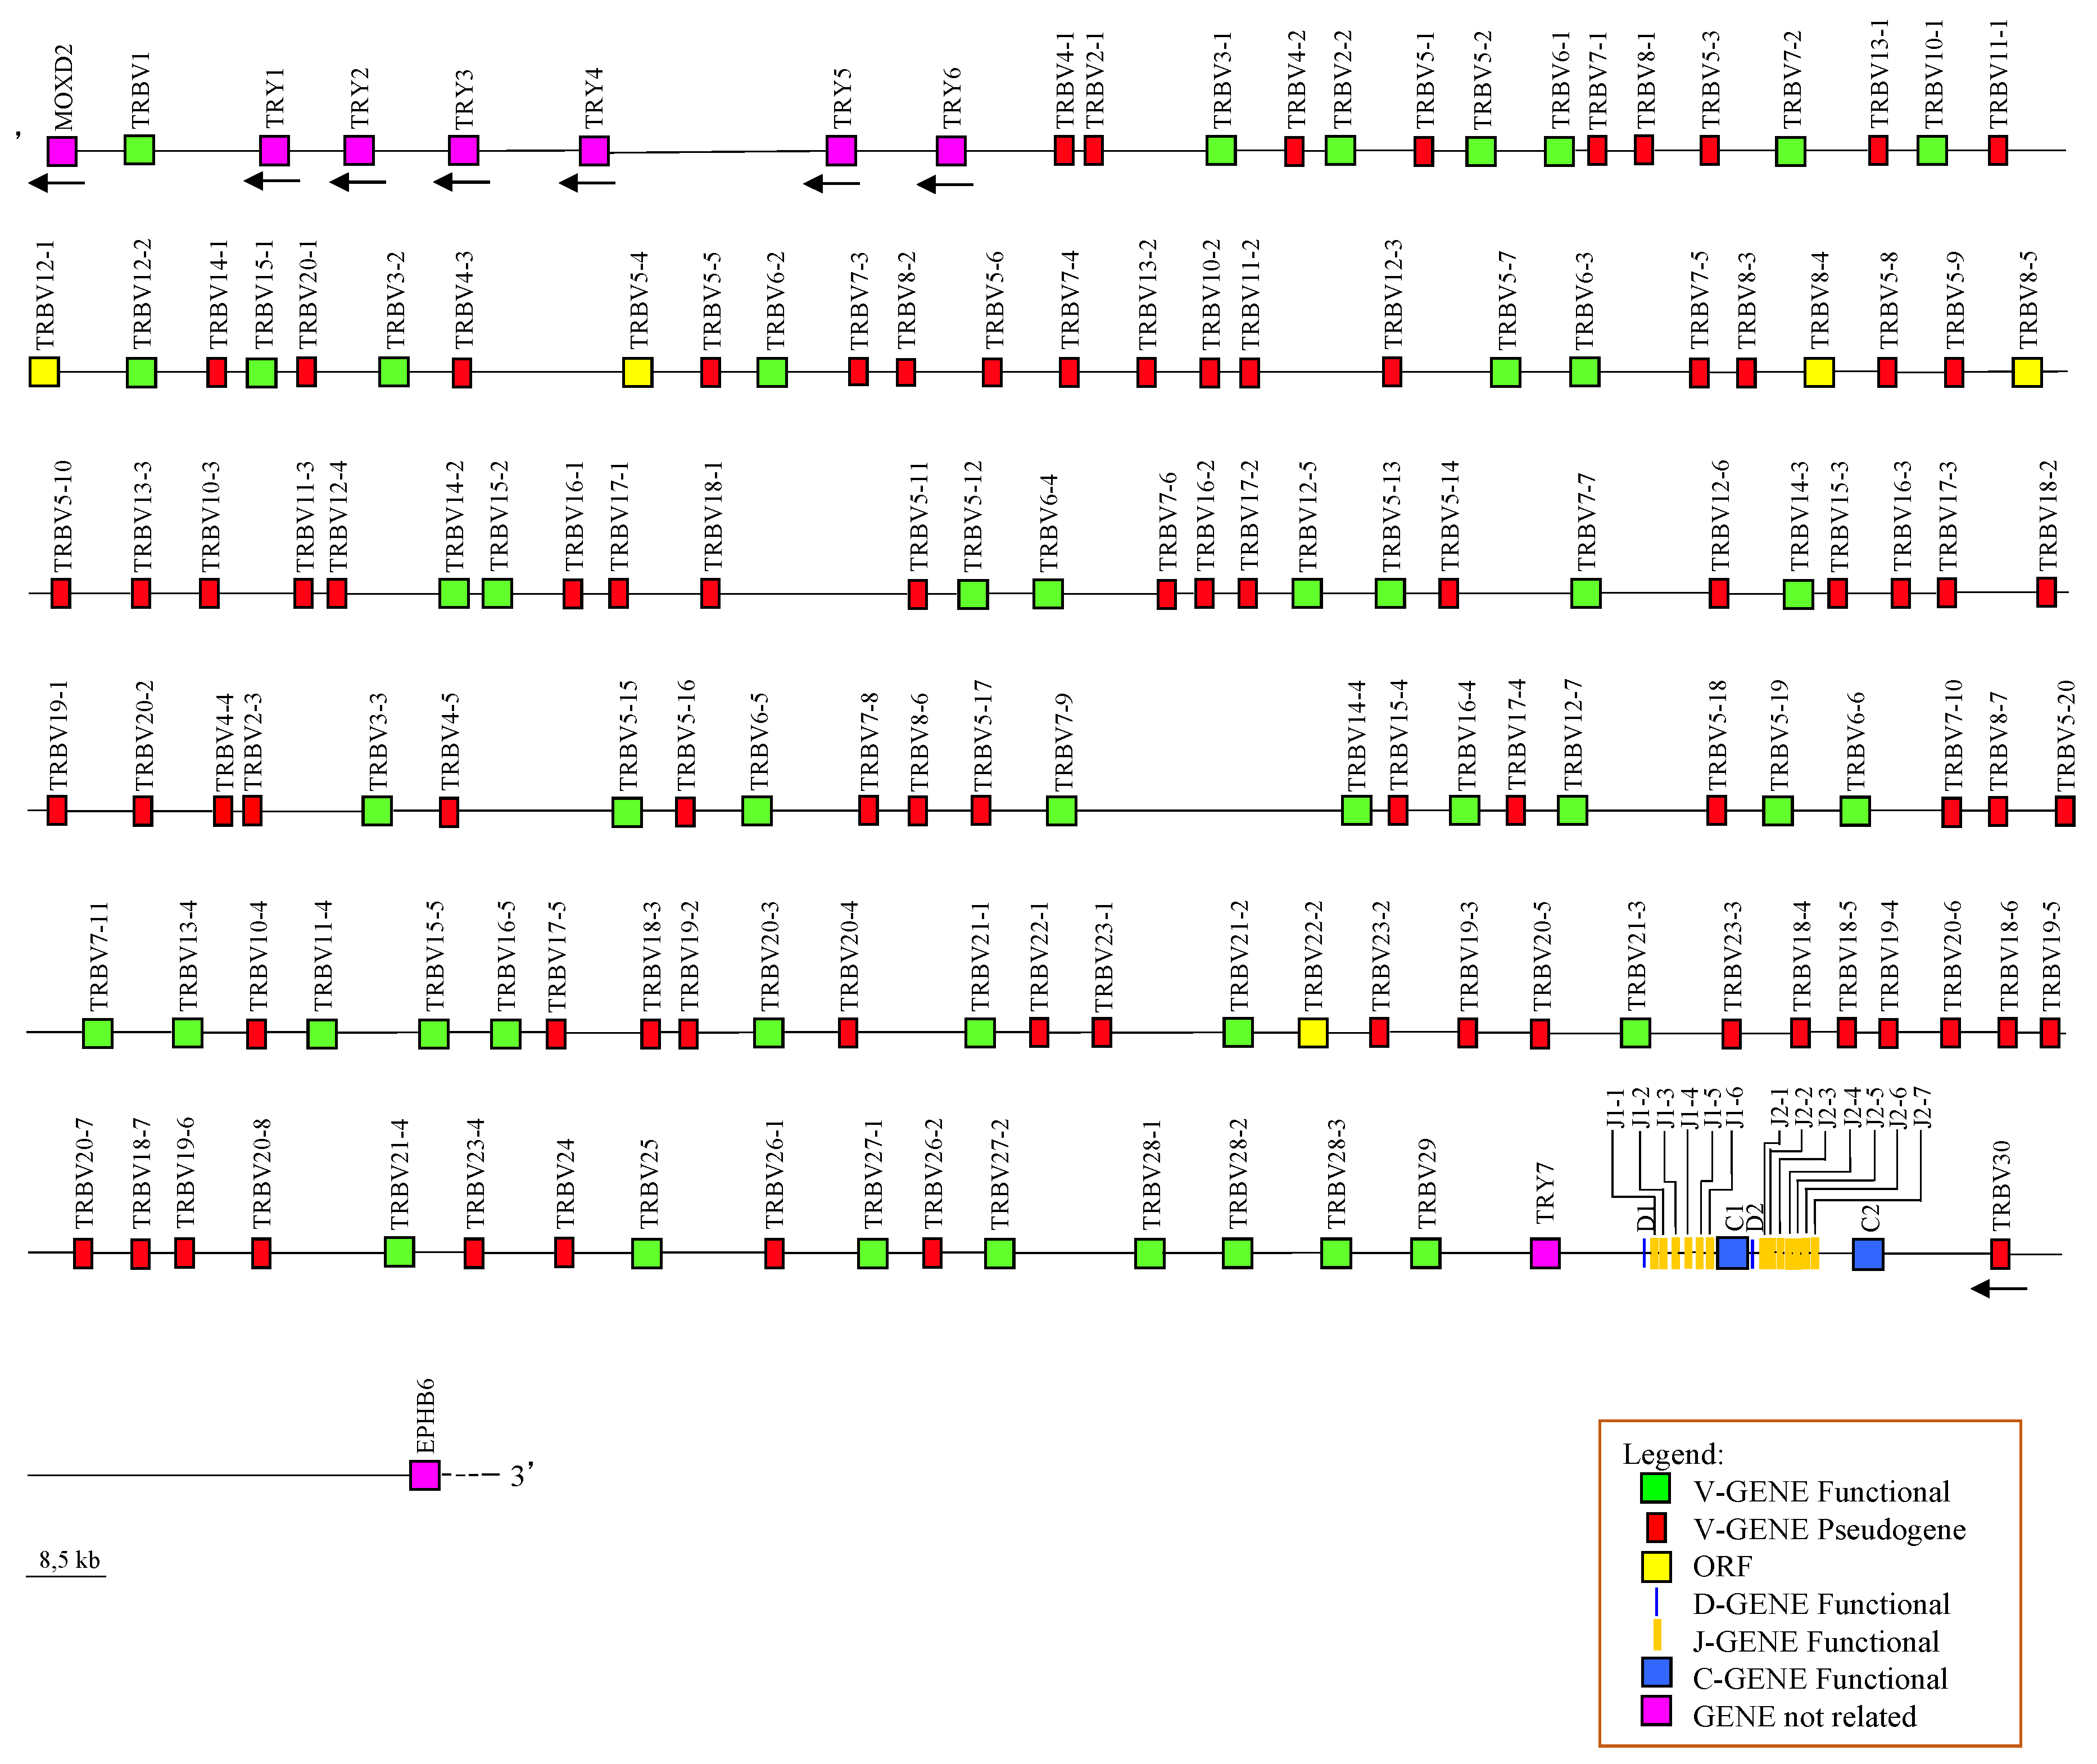
Figure 1. Schematic representation of the genomic organization of the horse TRB locus deduced from the EquCab3.0 genome assembly. The diagram shows the position of all related and unrelated TRB genes according to nomenclature. The boxes representing the genes are not to scale. The exons are not shown. The arrows indicate the transcriptional orientation of the genes.
Preprints 114605 g001
Figure 2. The neighbor-joining (NJ) tree inferred from the horse and human TRBV gene sequences. The evolutionary analyses were conducted in MEGA X [23,24]. The optimal tree is shown. The tree is drawn to scale, with branch lengths in the same units as those of the evolutionary distances used to infer the phylogenetic tree. The evolutionary distances were computed using the Maximum Composite Likelihood method [26] and are in the units of the number of base substitutions per site. This analysis involved 200 nucleotide sequences. Codon positions included were 1st+2nd+3rd+Noncoding. All ambiguous positions were removed for each sequence pair (pairwise deletion option). There was a total of 400 positions in the final dataset.
Preprints 114605 g002
Figure 3. Dot-plot of the horse TRBV cluster sequence against itself. With the exception of the main diagonal line for the match of each base with itself, dots and diagonal lines indicate internal homology units in the sequence. The matrix is tripled to show duplicated gene blocks derived from three distinct units (see text), each identified with a different color. The green boxes indicate the parallel lines of the duplications involving the TRBV21-TRBV22-TRBV23 and the TRBV26-TRBV27 gene units, and the TRBV28 genes.
Preprints 114605 g003
Table 1. Correspondence between horse and human TRB genes as inferred from sequence analysis. The number of genes within each TRBV subgroup and the functionality are reported.
Horse TRB Human TRB
Subgroups No. of genes P F ORF No. of genes P F ORF
TRBV1 1 1 1 1
TRBV2 3 2 1 1 1
TRBV3 3 3 2 1 1
TRBV4 5 5 3 3
TRBV5 20 13 6 1 8 1 5 2
TRBV6 6 6 8 7 1
TRBV7 11 7 4 9 1 7 1
TRBV8 7 5 2 2 2
TRBV9 - 1 1
TRBV10 4 3 1 3 3
TRBV11 4 3 1 3 3
TRBV12 7 3 3 1 5 2 3
TRBV13 4 3 1 1 1
TRBV14 4 1 3 1 1
TRBV15 5 2 3 1 1
TRBV16 5 3 2 1 1
TRBV17 5 5 1 1
TRBV18 7 7 1 1
TRBV19 6 6 1 1
TRBV20 8 7 1 1 1
TRBV21 4 4 1 1
TRBV22 2 1 1 1 1
TRBV23 4 4 1 1
TRBV24 1 1 1 1
TRBV25 1 1 1 1
TRBV26 2 2 1 1
TRBV27 2 2 1 1
TRBV28 3 3 1 1
TRBV29 1 1 1 1
TRBV30 1 1 1 1
Total 136 84 47 5 64 11 47 6
Table 2. Summary of the clonotypes based on TRBJ genes.
TRBJgene N° of Clonotype TRBD1 gene TRBD2 gene TRBD gene (ND) Mean CDR3 length(AA)
TRBJ1-1 12 6 - 6 12.25 (range 9-16)
TRBJ1-2 25 14 2 9 12.04 (range 9-16)
TRBJ1-3 - - - - -
TRBJ1-4 4 2 - 2 12.75 (range 11-14)
TRBJ1-5 4 1 1 2 12.00 (range 11-13)
TRBJ1-6 19 9 1 9 12.57 (range 10-17)
TOTAL (Cluster1) 64 32 4 28 12,28 (range 9-17)
TRBJ2-1 42 9 22 11 12,69 (range 9-18)
TRBJ2-2 5 - 1 4 12,40 (range 10-14)
TRBJ2-3 21 6 7 8 12.90 (range 10-16)
TRBJ2-4 37 4 22 11 12.76 (range 10-16)
TRBJ2-5 12 1 8 3 12.17 (range 10-16)
TRBJ2-6 9 1 4 4 13.89 (range 12-17)
TRBJ2-7 22 - 13 9 12.54 (range 10-15)
TOTAL (Cluster2) 148 21 77 50 12,73 (range 9-18)
TOTAL(Cluster1 + Cluster2) 212 53 81 78 12.60 (range 9-18)
ND = Not Determined.
Table 3. Summary of the clonotypes based on TRBV genes. The total value of the analysis is highlighted in bold. The TRBV genes defined as non-functional in the genomic assembly are in italics.
Subgroups N° of clonotype Resolved*
TRBV1
TRBV2 2 V2-2 (2)
TRBV3 9 V3-3 (5)
TRBV4
TRBV5 26 V5-2(1) V5-4(1) V5-7(4) V5-12(3) V5-13(4) V5-15(6) V5-19(1)
TRBV6 2 V6-6(1)
TRBV7 7 V7-7(4)
TRBV8 3 V8-3(2) V8-5(1)
TRBV9
TRBV10
TRBV11 1 V11-4(1)
TRBV12 11 V12-2(10) V12-7(1)
TRBV13
TRBV14 14 V14-3(5) V14-4(2)
TRBV15 6 V15-2(2) V15-5(3)
TRBV16
TRBV17
TRBV18
TRBV19
TRBV20 34 V20-3(3) V20-8(26)
TRBV21 21
TRBV22
TRBV23
TRBV24
TRBV25 3
TRBV26
TRBV27 4 V27-1(1)
TRBV28 17
TRBV29 1
TRBV30
TOTAL 161 93
* Indicates the number of sequences for which a germline TRBV members has been conclusively assigned.
Disclaimer/Publisher’s Note: The statements, opinions and data contained in all publications are solely those of the individual author(s) and contributor(s) and not of MDPI and/or the editor(s). MDPI and/or the editor(s) disclaim responsibility for any injury to people or property resulting from any ideas, methods, instructions or products referred to in the content.
Copyright: This open access article is published under a Creative Commons CC BY 4.0 license, which permit the free download, distribution, and reuse, provided that the author and preprint are cited in any reuse.
Prerpints.org logo

Preprints.org is a free preprint server supported by MDPI in Basel, Switzerland.

Subscribe

© 2024 MDPI (Basel, Switzerland) unless otherwise stated