Preprint
Article

Design and Optimization of CO2 Recovery Process of Fire-Flooding Exhaust Based on Membrane Separation Method

Altmetrics

Downloads

83

Views

20

Comments

0

This version is not peer-reviewed

Submitted:

08 August 2024

Posted:

09 August 2024

You are already at the latest version

Alerts
Abstract
In order to achieve the dual carbon goal and simplify the decarbonization process, a CO2 recovery process of the fire-flooding exhaust was designed. The process adopted the two-stage membrane separation method to recover CO2 and obtain high purity CO2 rich flow, and then through the mixed refrigerant liquefaction and rectification column, food grade liquid CO2 was obtained. HYSYS process simulation shows that for the fire-flooding exhaust with a flow rate of 1000 kg/h and a given composition, the process can achieve a CO2 recovery of 69.02%, total product sales S=2086.8 yuan/h, and specific power consumption of 2.818 kW∙h/kg. On this basis, a hybrid simulation platform of HYSYS & Matlab was established. Taking the specific power consumption of the product as the objective function, sequential quadratic programming (SQP) algorithm was adopted to optimize the process, and the optimized specific power consumption was reduced by 18.8%. Finally, by adjusting N2/CO2 components, the adaptability of the optimization condition was analyzed.
Keywords: 
Subject: Engineering  -   Chemical Engineering
Flue Gas from Fire Drive is a byproduct of the Fire Drive oil recovery technology, which mainly consists of N2 and CO2, and contains trace amounts of alkanes, H2S, and O2[1]. Its components have a certain singularity, generally not directly discharged into the atmosphere, can be used to re-injection oil reservoir or collection and transportation after desulfurization discharge[2,3]. Because the exhaust gas after desulfurization contains abundant CO2 resources, it is obviously not in line with the purpose of national energy conservation and emission reduction. In order to achieve the dual-carbon goal and reduce carbon emissions, oil and gas enterprises need to recycle the exhaust gas of fire drive, so it is necessary to carry out carbon recovery before the exhaust gas desulfurization[4]. For this type of natural gas, the combined decarburization process of membrane separation and alcohol amine is generally adopted in China, but this process has some disadvantages such as high renewable energy consumption and large loss of chemical reagents[5]. For the purpose of reducing carbon emissions, it is not necessary to completely remove CO2, but only to enrich CO2 to meet the requirements of energy conservation and emission reduction of fire-flooding exhaust.
Capture of CO2 from flue gases produced by the combustion of fossil fuels and biomass in air is referred to as post-combustion capture[6]. Scholes et al. [7] considers the potential for either H2- or CO2-selective membranes in an integrated gasification combined cycle (IGCC) process. Xu et al. [8] explored a multicomponent gas separation process using spiral-wound membrane modules to optimize its membrane area and energy consumption. Zhao et al. [9] describes a detailed parametric study for multi-stage membrane systems used in a coal-fired power plant. Zhang et al. [10] applied a systematic method that integrates process simulation, capture cost estimation, and exergy analysis to evaluate a gas separation membrane process for post-combustion carbon capture in a coal power plant. Bounaceur et al. [11] perform a systematic analysis of the separation performances and associated energy cost of a single-stage membrane module. Hussain et al. [12] evaluate the viability of a two-stage process using combined nitrogen (N2)-selective and carbon dioxide (CO2)-selective membranes for post-combustion CO2 capture. Li et al. [13] first focus on the requirements for CO2 separation membrane, and then outline the existing competitive materials, promising preparation methods and process to achieve desirable CO2 selectivity and permeability. In this study, Ren et al. [14] considered both CO2-selective and N2-selective membranes and relevant issues regarding the CO2-selective membrane, such as pressure ratio, attainability, and multistage configuration, are studied and extended to the N2-selective membrane. Gkotsis et al. [15] presented the state of the art of membrane-based technologies for CO2 capture from flue gases. Lee et al. [16] proposed and evaluated two alternative CO2 liquefaction processes. These alternative processes use multistage expansion and multistream heat exchangers to lower the input stream temperature for the compressor. Mehrpooya et al. [17] proposed a novel integrated process of liquefied natural gas production, oxy-fuel electrical power generation cycle and cryogenic carbon dioxide capture and liquefaction and investigated by chemical process simulators. a novel purification and liquefaction integrated structure includes a biogas upgrading process by cryogenic separation and amine scrubbing methods and a biomethane liquefaction cycle based on the mixed fluid cascade[18]. Xin et al. [19] proposed a new process scheme of compressed liquefaction of CO2 in the CCUS project by using liquid natural gas (LNG) cold energy through CO2 pipeline transportation to save energy and reduce consumption. For liquid carbon dioxide energy storage (LCES) technology, CO2 is stored as liquid phase in both HP and LP sides of the system, which has high energy storage density and strong operation stability[20]. Yang et al. [21] do Energy and cost analysis of the preprocessing for carbon capture and storage transportation such as supercritical compression and liquefaction using chemical simulation model.
Therefore, CO2 can be captured by membrane separation method, and the captured CO2 can be liquefied by mixed coolant liquefaction and rectification process to obtain food-grade liquid carbon dioxide[22]. Based on the above analysis, this paper adopts a relatively mature mixed refrigerant liquefaction process and introduces a membrane separation process to design a CO2 recovery process for fire-flooding exhaust[23], and obtains food-grade liquid CO2 that meets the purity requirements. At the same time, the HYSYS and MATLAB hybrid simulation platform was established to simulate and optimize the process.

1. Design of CO2 Recovery Process of Fire-Flooding Exhaust

The components of fire-flooding exhaust are shown in Table 1.
As shown in Figure 1, the recycling process consists of three parts:
(1)
Secondary membrane separation
Membrane separation method has the advantages of no phase change, high separation efficiency, compact equipment and high reliability, which greatly simplifies the decarbonization process[24]. The method has been widely used at home and abroad, and the membrane separation of acetate fiber membrane is the most widely used and economical. As shown in Figure 2, the feed gas was pressurized to 2-3 MPa to enter the primary membrane separation unit, and CO2 was enriched on the permeable side through the polymer membrane. The retained gas is mainly N2, which re-enters the secondary membrane separation unit, and a small amount of CO2 is enriched on the permeable side. The permeable side CO2 rich flow is introduced into the cold box for pre-cooling liquefaction.
(2)
Mixed refrigerant refrigeration cycle
After the mixed refrigerant is compressed at three stages and cooled by water cooler, it is throttled by throttle valve and the CO2 rich flow is liquefied in the cold box. The low pressure refrigerant after gasification returns to the entrance of the primary compressor and continues to cycle refrigeration.
(3)
CO2 distillation and purification
The liquefied CO2 rich flow is introduced into the rectification column, and the content of oxygen and hydrogen sulfide at the bottom of the column is controlled to obtain high purity food-grade liquid CO2, which is entered into the CO2 finished product storage tank. The temperature of the top of the tower is controlled to avoid the ice blockage of CO2, and a small amount of tail gas mixture generated at the top of the tower is discharged.
According to the above process, the CO2 recovery process shown in Figure 1 was established based on HYSYS software. However, Aspen HYSYS does not have a built-in gas penetration unit module. For this purpose, a "Membrane" membrane separation expansion module is used. This module has been used by foreign scholars to separate CO2 from CH4/CO2 mixture and flue gas[25,26,27].

2. Analysis of Parameters of Liquefaction Process

2.1. Initial Parameter Setting and Product Requirements

Table 1 components are applied, and other parameters are set in Table 2.

2.2. Process Parameters and Performance Specifications

The main indicators to measure the performance of the process are specific power consumption and recovery rate. This article defines the specific power consumption of the process:
w = W M R , C + W E G , C + W T o w e r M C O 2 ( kW h / kg )
CO2 recovery rate:
x r e c , C O 2 = ( 1 M C O 2   o f   v e n t i n g M C O 2   o f   E G ) × 100 %
where, WMR,C, WEG,C are the refrigerant compression work, and the compression work before fire-flooding exhaust film separation, kW respectively; WTower is the heat consumption of rectification tower, kW; MEG is the mass flow rate of fire exhaust gas, kg/h; MCO2 of EG is the mass flow of CO2 in the exhaust gas of fire flooding, kg/h; MCO2 of Venting is the mass flow of CO2 in the vented air, kg/h; MCO2 is the mass flow rate of liquid CO2, kg/h; w is the specific power consumption, kW∙h/kg.
According to Chapter 1 and 2, Table 3 gives the simulation results of key parameters of the process under basic cases.
At this time, the minimum heat transfer temperature difference of LNG-100 in the process is 3.446 ℃, the specific power consumption of the process is 2.818 kW∙h/kg, and the CO2 recovery rate is 69.02%.

3. Process Optimization

3.1. Objective Functions and Constraints

The specific power consumption of the process is taken as the objective function, the minimum heat exchange temperature difference of the heat exchanger is not less than 3 ° C, the gas phase fraction of the low-pressure refrigerant returned to the primary compressor is equal to 1[34], the pressure ratio is not greater than 3, and the purity of liquid CO2 meets Table 1 as the constraint conditions, and the optimization variables include the refrigerant flow rate, the outlet pressure of the refrigerant compressor and the temperature after throttling. In order to improve optimization efficiency and reduce the number of optimization variables, only the three-stage compression outlet pressure of mixed refrigerant χ is considered as the optimization variable of the compressor outlet pressure (refrigerant high pressure), while the outlet pressure of other stages is not regarded as an independent optimization variable, which is calculated by χ according to the optimal theory of proportional compression [35]. The final objective function and constraints are shown in Equation (7) and (8).
min   f X = W M R , C + W E G , C + W T o w e r M C O 2 kW h k g 1 X = q C 1 q C 2 q C 3 q N 2 χ   μ
m i n . a p p r o a c h L N G 100 3 0 p M R 1 p M R C o m , p M R 3 p M R 2 , p M R 5 p M R 4 1,3
where, X is the independent variable matrix. Combined with the liquefaction process, it includes refrigerant CH4 flow rate qC1, refrigerant C2H6 flow rate qC2, refrigerant C3H8 flow rate qC3, refrigerant N2 flow rate qN2, three-stage compression outlet pressure of mixed refrigerant χ, and temperature μ after throttling of mixed refrigerant.

3.2. Optimization Process

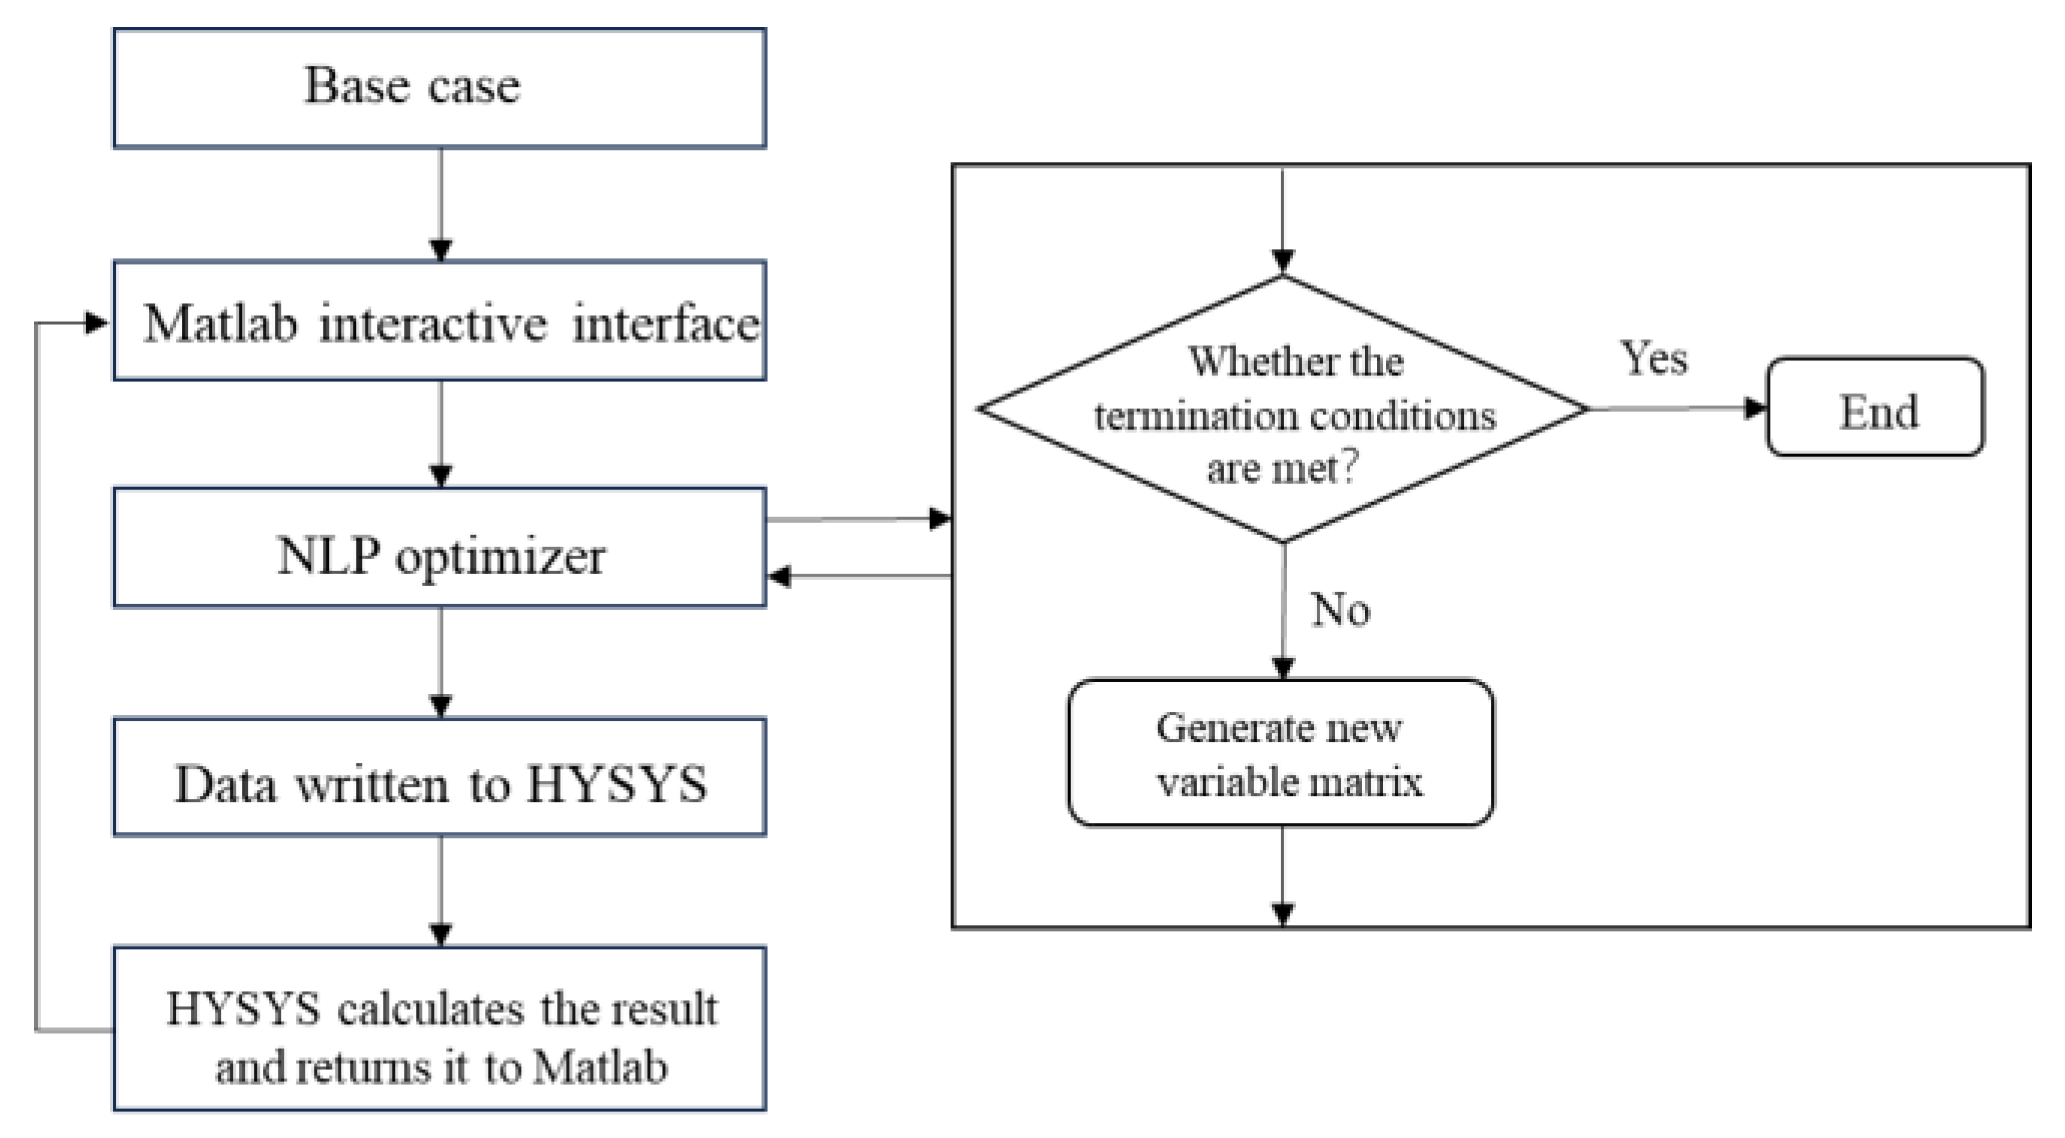
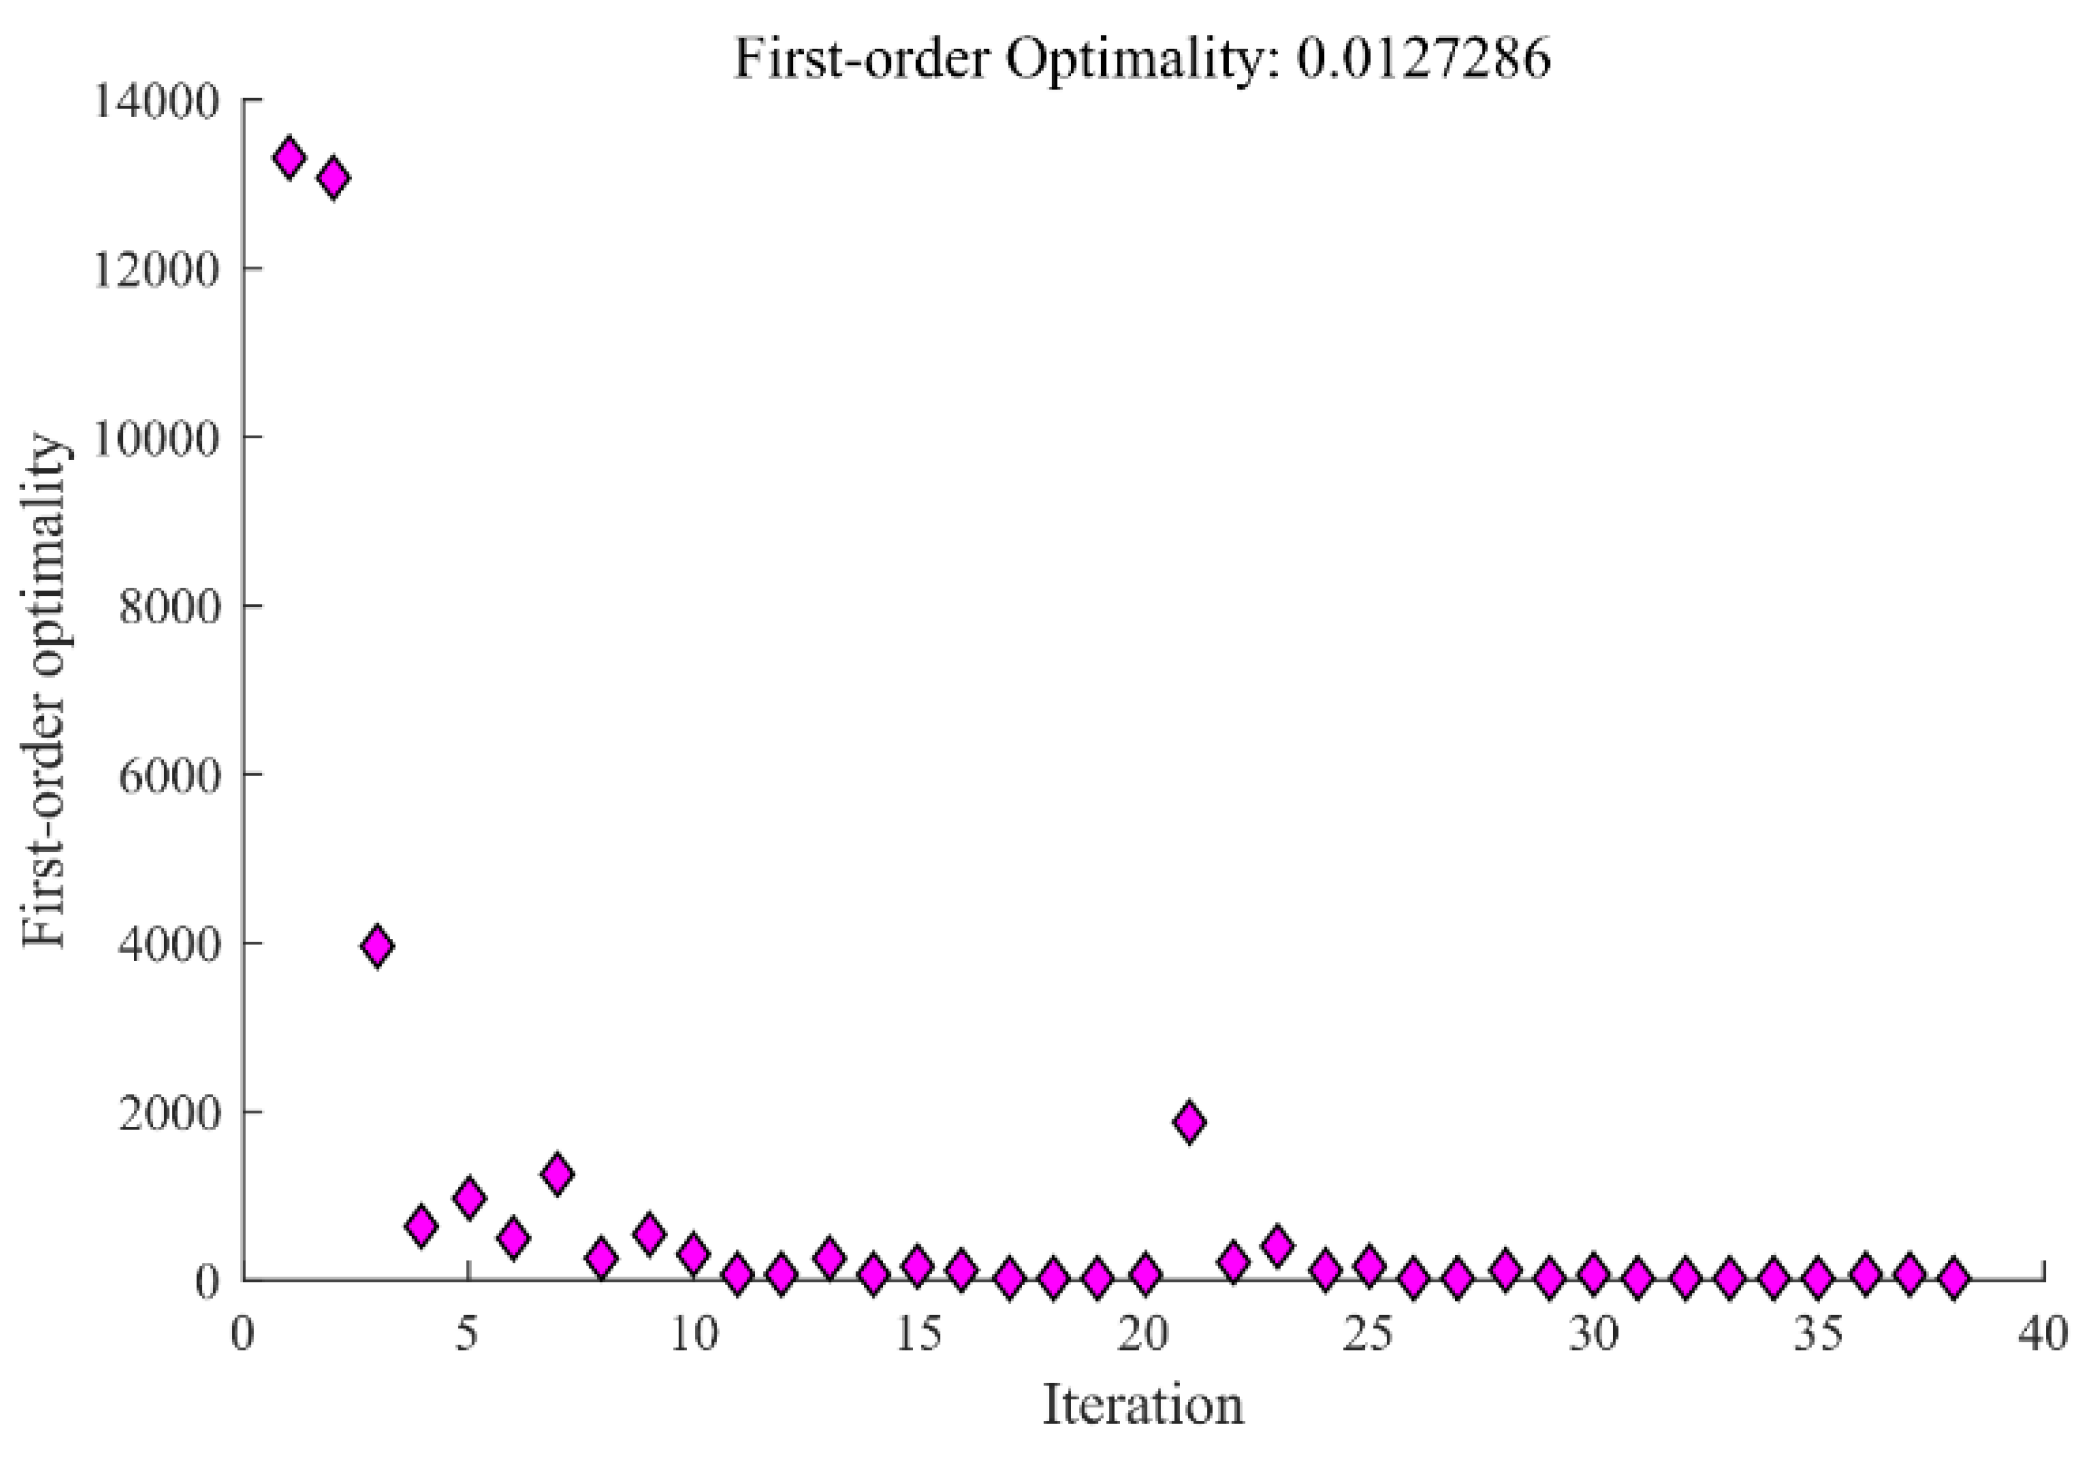
The steady-state optimizer of HYSYS can optimize the process, but for the process with more variables, the optimization results often do not meet the constraints, so the optimization process is transferred to MATLAB[36]. By creating ActiveXcom server, the effective information exchange between HYSYS and Matlab programs can be realized. There are two advantages to using MATLAB for process optimization: on the one hand, it can easily satisfy constraints and allow custom optimization routines; On the other hand, detailed output can be displayed during the optimization process. In this study, sequential quadratic programming algorithm (SQP) is used to solve min f(X) and determine the optimal solution of variables. The detailed optimization process is shown in Figure 3, and the iterative process of SQP algorithm is shown in Figure 4.

3.3. Results and Analysis

On the basis of MATLAB & HYSYS hybrid simulation platform, SQP optimization algorithm is used to optimize the specific power consumption of the liquefaction process, and the optimal solutions of its objective function and variables are shown in Table 4. The specific power consumption is reduced to 2.287 kW∙h/kg, which is 18.8% lower than before optimization.

4. Process Adaptability Analysis

According to the current market situation, the price of food-grade liquid CO2 is about 12 yuan/kg, then the total sales of the whole process product S is:
S = 12 M C O 2   y u a n h 1
According to the calculation, corresponding to 1000 kg/h of feed gas, the total sales of products under optimized conditions is S=2086.8 yuan/h. Based on the initial component and ignoring other trace components, the N2 / CO2 component ratio in the fire-flooding exhaust is changed under the condition that the minimum heat exchange temperature difference of the heat exchanger is 2-4 ℃ (to ensure a high heat exchange efficiency) to analyze the adaptability of optimization conditions. The results show that under the condition of constant raw gas flow, with the increase of CO2 content in fire-flooding exhaust, the total sales of the product increases, the specific power consumption of the process decreases, and the CO2 recovery rate increases, which means that the ability of the process to recover CO2 is getting higher and higher.

5. Conclusions

In this paper, a process flow of CO2 recovery from fire-flooding exhaust is designed, and HYSYS software is used to simulate the process. Meanwhile, HYSYS & MATLAB hybrid simulation platform is established, and SQP algorithm is used to optimize the process. Finally, the adaptability of optimization conditions is analyzed, and the following conclusions are drawn:
(1)
The designed CO2 recovery process of fire-flooding exhaust can achieve the preparation of food-grade liquid CO2. HYSYS process simulation shows that the CO2 recovery rate is 69.02% under the basic case condition. After the optimization, the specific power consumption of the liquefaction process is reduced to 2.287 kW∙h/kg, which is 18.8% lower than before the optimization.
(2)
For a flow rate of 1000 kg/h, the total sales of products under optimized conditions under the components in Table 1 is S=2086.8 yuan/h. Under the conditions of N2 / CO2 components in Table 6, with the increase of CO2 content in the exhaust gas, the total sales volume of the product increases, the specific power consumption of the process decreases, and the CO2 recovery rate increases, that is, the ability of the process to recover CO2 becomes higher and higher.
(3)
The process adopts membrane separation and enrichment of CO2, avoids complex chemical decarbonization process, reduces the initial investment of equipment and long-term operating costs, makes full use of carbon resources in fire-flooding exhaust, and achieves the dual carbon goal of energy saving and emission reduction.

References

  1. Wang Y, Chang M, Chen L, et al. Evaluation of prediction models for the physical properties in fire-flooding exhaust reinjection process[J]. Energies, 2022, 15(2): 562.
  2. ZHANG Minglong, LI Yuying, ZHOU Xian, et al. Feasibility study of fire flooding exhaust gas reinjection EOR and storage [J]. World Petroleum Industry, 2022,29(02):61-68.
  3. QIN Hongyan. Research and application of fire flooding exhaust emission system[J]. Environmental protection of oil & gas fields,2018,28(02):24-26+61.
  4. Pan S Y , Chang E E , Chiang P C .CO2 Capture by Accelerated Carbonation of Alkaline Wastes: A Review on Its Principles and Applications[J].Aerosol and Air Quality Research, 2016, 12(5):770-791.
  5. MU Zhonghua, ZHANG Ping, BAI Jianfeng, et al. Research on CO2 Capture and Liquefaction Technology in Oilfield Associated Gas [J]. Field surface engineering,2023,42(07):1-5.
  6. Zhao L, Riensche E, Menzer R, et al. A parametric study of CO2/N2 gas separation membrane processes for post-combustion capture[J]. Journal of membrane science, 2008, 325(1): 284-294.
  7. Scholes C A, Smith K H, Kentish S E, et al. CO2 capture from pre-combustion processes—Strategies for membrane gas separation[J]. International Journal of Greenhouse Gas Control, 2010, 4(5): 739-755.
  8. Xu J, Wang Z, Qiao Z, et al. Post-combustion CO2 capture with membrane process: Practical membrane performance and appropriate pressure[J]. Journal of membrane science, 2019, 581: 195-213.
  9. Zhao L, Riensche E, Blum L, et al. Multi-stage gas separation membrane processes used in post-combustion capture: Energetic and economic analyses[J]. Journal of membrane science, 2010, 359(1-2): 160-172.
  10. Zhang X, He X, Gundersen T. Post-combustion carbon capture with a gas separation membrane: parametric study, capture cost, and exergy analysis[J]. Energy & Fuels, 2013, 27(8): 4137-4149. [CrossRef]
  11. Bounaceur R, Lape N, Roizard D, et al. Membrane processes for post-combustion carbon dioxide capture: a parametric study[J]. Energy, 2006, 31(14): 2556-2570.
  12. Hussain A, Farrukh S, Minhas F T. Two-stage membrane system for post-combustion CO2 capture application[J]. Energy & Fuels, 2015, 29(10): 6664-6669.
  13. Li M, Jiang X, He G. Application of membrane separation technology in postcombustion carbon dioxide capture process[J]. Frontiers of Chemical Science and Engineering, 2014, 8: 233-239.
  14. Ren L X, Chang F L, Kang D Y, et al. Hybrid membrane process for post-combustion CO2 capture from coal-fired power plant[J]. Journal of membrane science, 2020, 603: 118001.
  15. Gkotsis P, Peleka E, Zouboulis A. Membrane-Based Technologies for Post-Combustion CO2 Capture from Flue Gases: Recent Progress in Commonly Employed Membrane Materials[J]. Membranes, 2023, 13(12): 898.
  16. Lee U, Yang S, Jeong Y S, et al. Carbon dioxide liquefaction process for ship transportation[J]. Industrial & engineering chemistry research, 2012, 51(46): 15122-15131.
  17. Mehrpooya M, Ghorbani B. Introducing a hybrid oxy-fuel power generation and natural gas/carbon dioxide liquefaction process with thermodynamic and economic analysis[J]. Journal of cleaner production, 2018, 204: 1016-1033.
  18. Ghorbani B, Ebrahimi A, Ziabasharhagh M. Thermodynamic and economic evaluation of biomethane and carbon dioxide liquefaction process in a hybridized system of biogas upgrading process and mixed fluid cascade liquefaction cycle[J]. Process Safety and Environmental Protection, 2021, 151: 222-243.
  19. Xin Y, Zhang Y, Xue P, et al. The optimization and thermodynamic and economic estimation analysis for CO2 compression-liquefaction process of CCUS system using LNG cold energy[J]. Energy, 2021, 236: 121376.
  20. ZHENG Pingyang, HAO Jiahao, CHANG Hong, et al. Research progress of liquid carbon dioxide energy storage system based on different liquefaction methods [J]. Southern energy construction, 2024, 11(2): 102-111.
  21. Yang S, Lee U, Lim Y, et al. Process design and cost estimation of carbon dioxide compression and liquefaction for transportation[J]. Korean Chemical Engineering Research, 2012, 50(6): 988-993.
  22. LI Zibo, ZHANG Yong, WANG Yanjun, et al. Design and Analysis of CO2 Capture Process Based on Cryogenic Liquefaction Technology [J]. Oil and gas and new energy,2024,36(02):58-65.
  23. Sun H, Geng J, Na F, et al. Performance evaluation and comparison of commonly used optimization algorithms for natural gas liquefaction processes[J]. Energy Reports, 2022, 8: 4787-4800.
  24. SHI Huijie, XU Hong, PU Peng, et al. Pilot Scale Test on Biogas Purification Using Membrane Separation Technology [J]. China Biogas, 2015, 33(1):36-40.
  25. Ahsan M, Sweeney OM, Hussain A. Development of user-defined extension for the simulation of membrane process in Aspen HYSYS[J]. SIGMA Sigma Journal of Engineering and Natural Sciences Sigma Mühendislik ve Fen Bilimleri Dergisi, 2017, 35 (1), 35-45.
  26. HOORFAR M, ALCHEIKHHAMDON Y, CHEN B. A Novel Tool for the Modeling, Simulation and Costing of Membrane based Gas Separation Processes using Aspen HYSYS: Optimization of the CO2/CH4, Separation Process[J]. Computers & Chemical Engineering, 2018:S0098135418301509.
  27. AHMAD F, LAU K K, LOCK S S M, et al. Hollow fiber membrane model for gas separation: Process simulation, experimental validation and module characteristics study[J]. Journal of Industrial and Engineering Chemistry, 2015, 21:1246-1257.
  28. YUAN Z M, CUI M M, SONG R, et al. Evaluation of prediction models for the physical parameters in natural gas liquefaction processes[J]. Journal of Natural Gas Science and Engineering, 2015,27: 876-886.
  29. GONG Keqin, WANG Zhuozhi, JIA Yongying. Generalization of Thermodynamic Research of LNG and Other Mixtures Storage and Transportation Process [J]. Science Technology and Engineering, 2013(35):10549-10559.
  30. GAO T, LIN W S, GU A Z. Mixed refrigerant cycle liquefaction process for coalbed methane with high nitrogen content[J]. Journal of the Energy Institute, 2016, 84(4):185-191.
  31. SONG R, CUI M M, LIU J J. Single and multiple objective optimization of a natural gas liquefaction process[J]. Energy, 2017, 124:19-28.
  32. National Health and Family Planning Commission, People's Republic of China. Food safety National standard for food additives Carbon dioxide: GB 1886.228-2016[S]. Beijing: Standards Press of China, 2016.
  33. GEORGE G , BHORIA N , ALHALLAQ S , et al. Polymer Membranes for Acid Gas Removal from Natural Gas[J]. Separation and Purification Technology, 2016, 158:333-356.
  34. Khan MS, Lee M. Design optimization of single mixed refrigerant natural gas liquefaction process using the particle swarm paradigm with nonlinear constraints[J]. Energy, 2013, 49:146-155.
  35. Ji Zhongli, Deng Zhian, ZHAO Huijun. Pumps and Compressors [M]. Beijing: Petroleum Industry Press, 2015.
  36. Khan M S, Lee S, Lee M. Optimization of single mixed refrigerant natural gas liquefaction plant with nonlinear programming[J]. Asia-Pacific Journal of Chemical Engineering, 2012, 7: S62-S70.
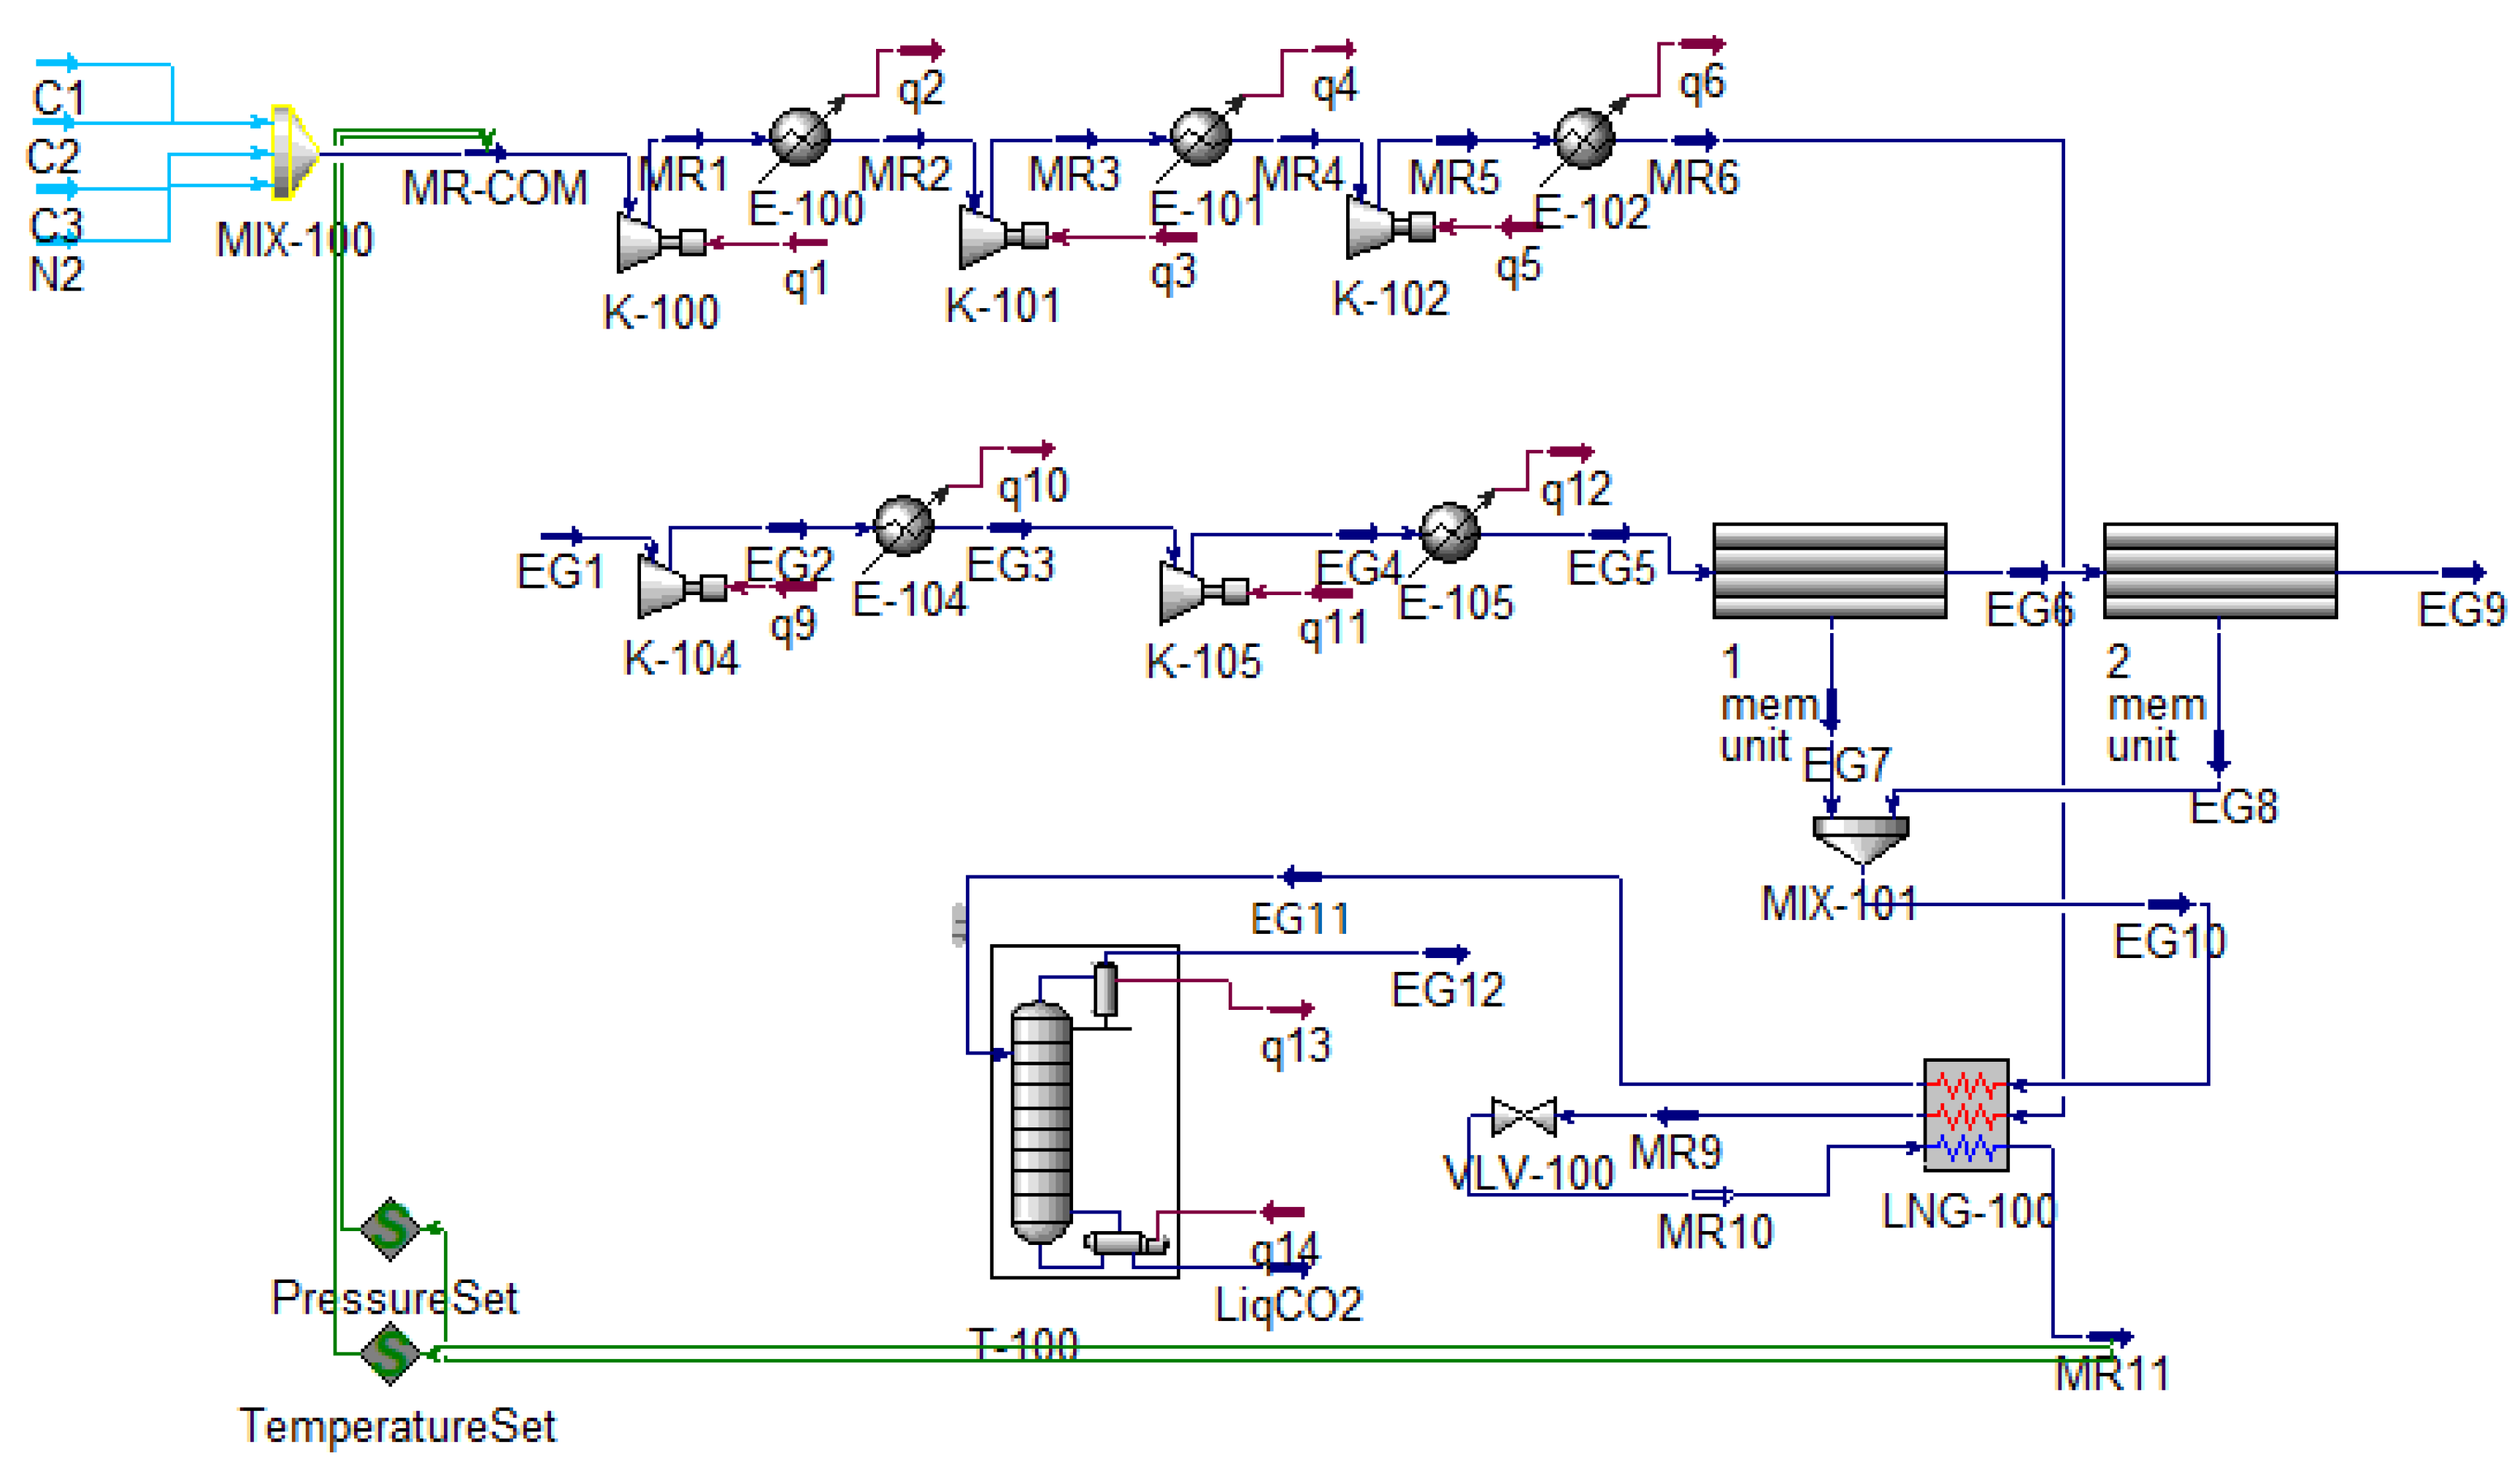
Figure 1. Process flow of CO2 recovery from fire-flooding exhaust.
Preprints 114661 g001
Figure 2. Process of secondary membrane separation of tail gas from fire flooding.
Preprints 114661 g002
Figure 3. Process optimization of SQP algorithm.
Preprints 114661 g003
Figure 4. SQP algorithm iteration process.
Preprints 114661 g004
Table 1. Components of fire-flooding exhaust.
Components CH4 C2H6 C3H8 C4+ N2 CO2 O2 H2S
mol% 1.9 0.14 0.07 0.08 78.13 17.59 2.07 0.02
Table 2. Initial parameter setting and product requirements.
Parameters Value Remarks
Feed temperature 30 ℃
Feed pressure 500 kPa
Feed flow 1000 kg∙h-1
Physical properties simulation fluid package GERG-2008 [28,29]
Water cooler cooling temperature 30 ℃ [30,31]
Water cooler/heat exchanger pressure drop 10 kPa
Minimum heat transfer temperature difference 3 ℃
Compressor adiabatic efficiency 85%
Pressure ratio <3
refrigerant CH4, C2H6, C3H8 and N2
Liquid CO2 purity >99.95% [32]
Acetate membrane PCO2=2.43 Barrer, αCO2/CH4=22.1 [33]
Number of units = 1,
Area per unit = 10 m2
Table 3. Simulation results of key flow parameters.
Variable MR_Com MR5 EG1 EG8 LiqCO2
T / ℃ 16.49 86.16 30 30 -11.96
P / MPa 190 2.5 500 2500 2490
F / kgmole∙h-1 193.9 193.9 32.54 1.659 3.953
CH4 / mole frac 0.2558 0.2558 0.019 0 0.0003
CO2 / mole frac 0 0 0.1758 0.8938 0.9996
C2H6 / mole frac 0.1331 0.1331 0.0007 0 0
C3H8 / mole frac 0.5467 0.5467 0.0017 0 0
N2 / mole frac 0.0645 0.0645 0.7811 0 0
O2 / mole frac 0 0 0.0207 0.1052 0
H2S / mole frac 0 0 0 0 0.0001
Table 4. Optimization results of SQP algorithm.
目标函数及变量
Objective function and variable
优化前
Before optimization
优化后
After optimization
单位
Unit
w 2.818 2.287 kW∙h/kg
qC1 49.6 39.7 kgmole/h
qC2 25.8 20.64 kgmole/h
qC3 106 85.0 kgmole/h
qN2 12.5 10.0 kgmole/h
χ 2.5 2.3 MPa
μ -140 -141
Table 5. Optimization results of overall performance of heat exchanger.
Performance parameter Optimization result
Overall heat transfer coefficient 1.731e+05 kJ∙℃-1∙h-1
Logarithmic mean temperature difference 23.68 ℃
Minimum heat transfer temperature difference
Table 6. N2 / CO2 component.
Sample Name MoleFrac N2/ CO2
Sample 1 0.90 / 0.10
Sample 2 0.80 / 0.20
Sample 3 0.70 / 0.30
Sample 4 0.60 / 0.40
Sample 5 0.50 / 0.50
Table 7. Changes in product sales, specific power consumption, and CO2 recovery with N2 / CO2 components.
Sample Name S/yuan w/ kW∙h/kg xrec,CO2
Sample 1 925.5 5.183 0.5189
Sample 2 2112 2.27 0.6241
Sample 3 3302 1.452 0.6839
Sample 4 4504 1.065 0.7337
Sample 5 5725 0.8396 0.7808
Disclaimer/Publisher’s Note: The statements, opinions and data contained in all publications are solely those of the individual author(s) and contributor(s) and not of MDPI and/or the editor(s). MDPI and/or the editor(s) disclaim responsibility for any injury to people or property resulting from any ideas, methods, instructions or products referred to in the content.
Copyright: This open access article is published under a Creative Commons CC BY 4.0 license, which permit the free download, distribution, and reuse, provided that the author and preprint are cited in any reuse.
Prerpints.org logo

Preprints.org is a free preprint server supported by MDPI in Basel, Switzerland.

Subscribe

© 2024 MDPI (Basel, Switzerland) unless otherwise stated