1. Introduction
Polymer materials such as polypropylene, which was originally introduced in 1951 [
1], are widely used in many industries. They require good strength properties, resistance to aging, dimensional stability throughout the product life cycle, high resistance to cracking, and importantly, the ability to be used in mass production processes such as extrusion or injection molding [
2,
3,
4,
5].
Table 1.
Basic mechanical properties for Polypropylene [
6].
Table 1.
Basic mechanical properties for Polypropylene [
6].
| Density |
|
| Young’s modulus |
|
| Poisson ration |
|
| Yield strength in RT |
|
| Shore hardness |
|
| Melting point |
|
Due to the above advantages, Polypropylene has found wide application in the automotive industry, where it is used not only to manufacture components contained within the car’s interior, but also to produce parts exposed to mechanical factors and responsible for human safety [
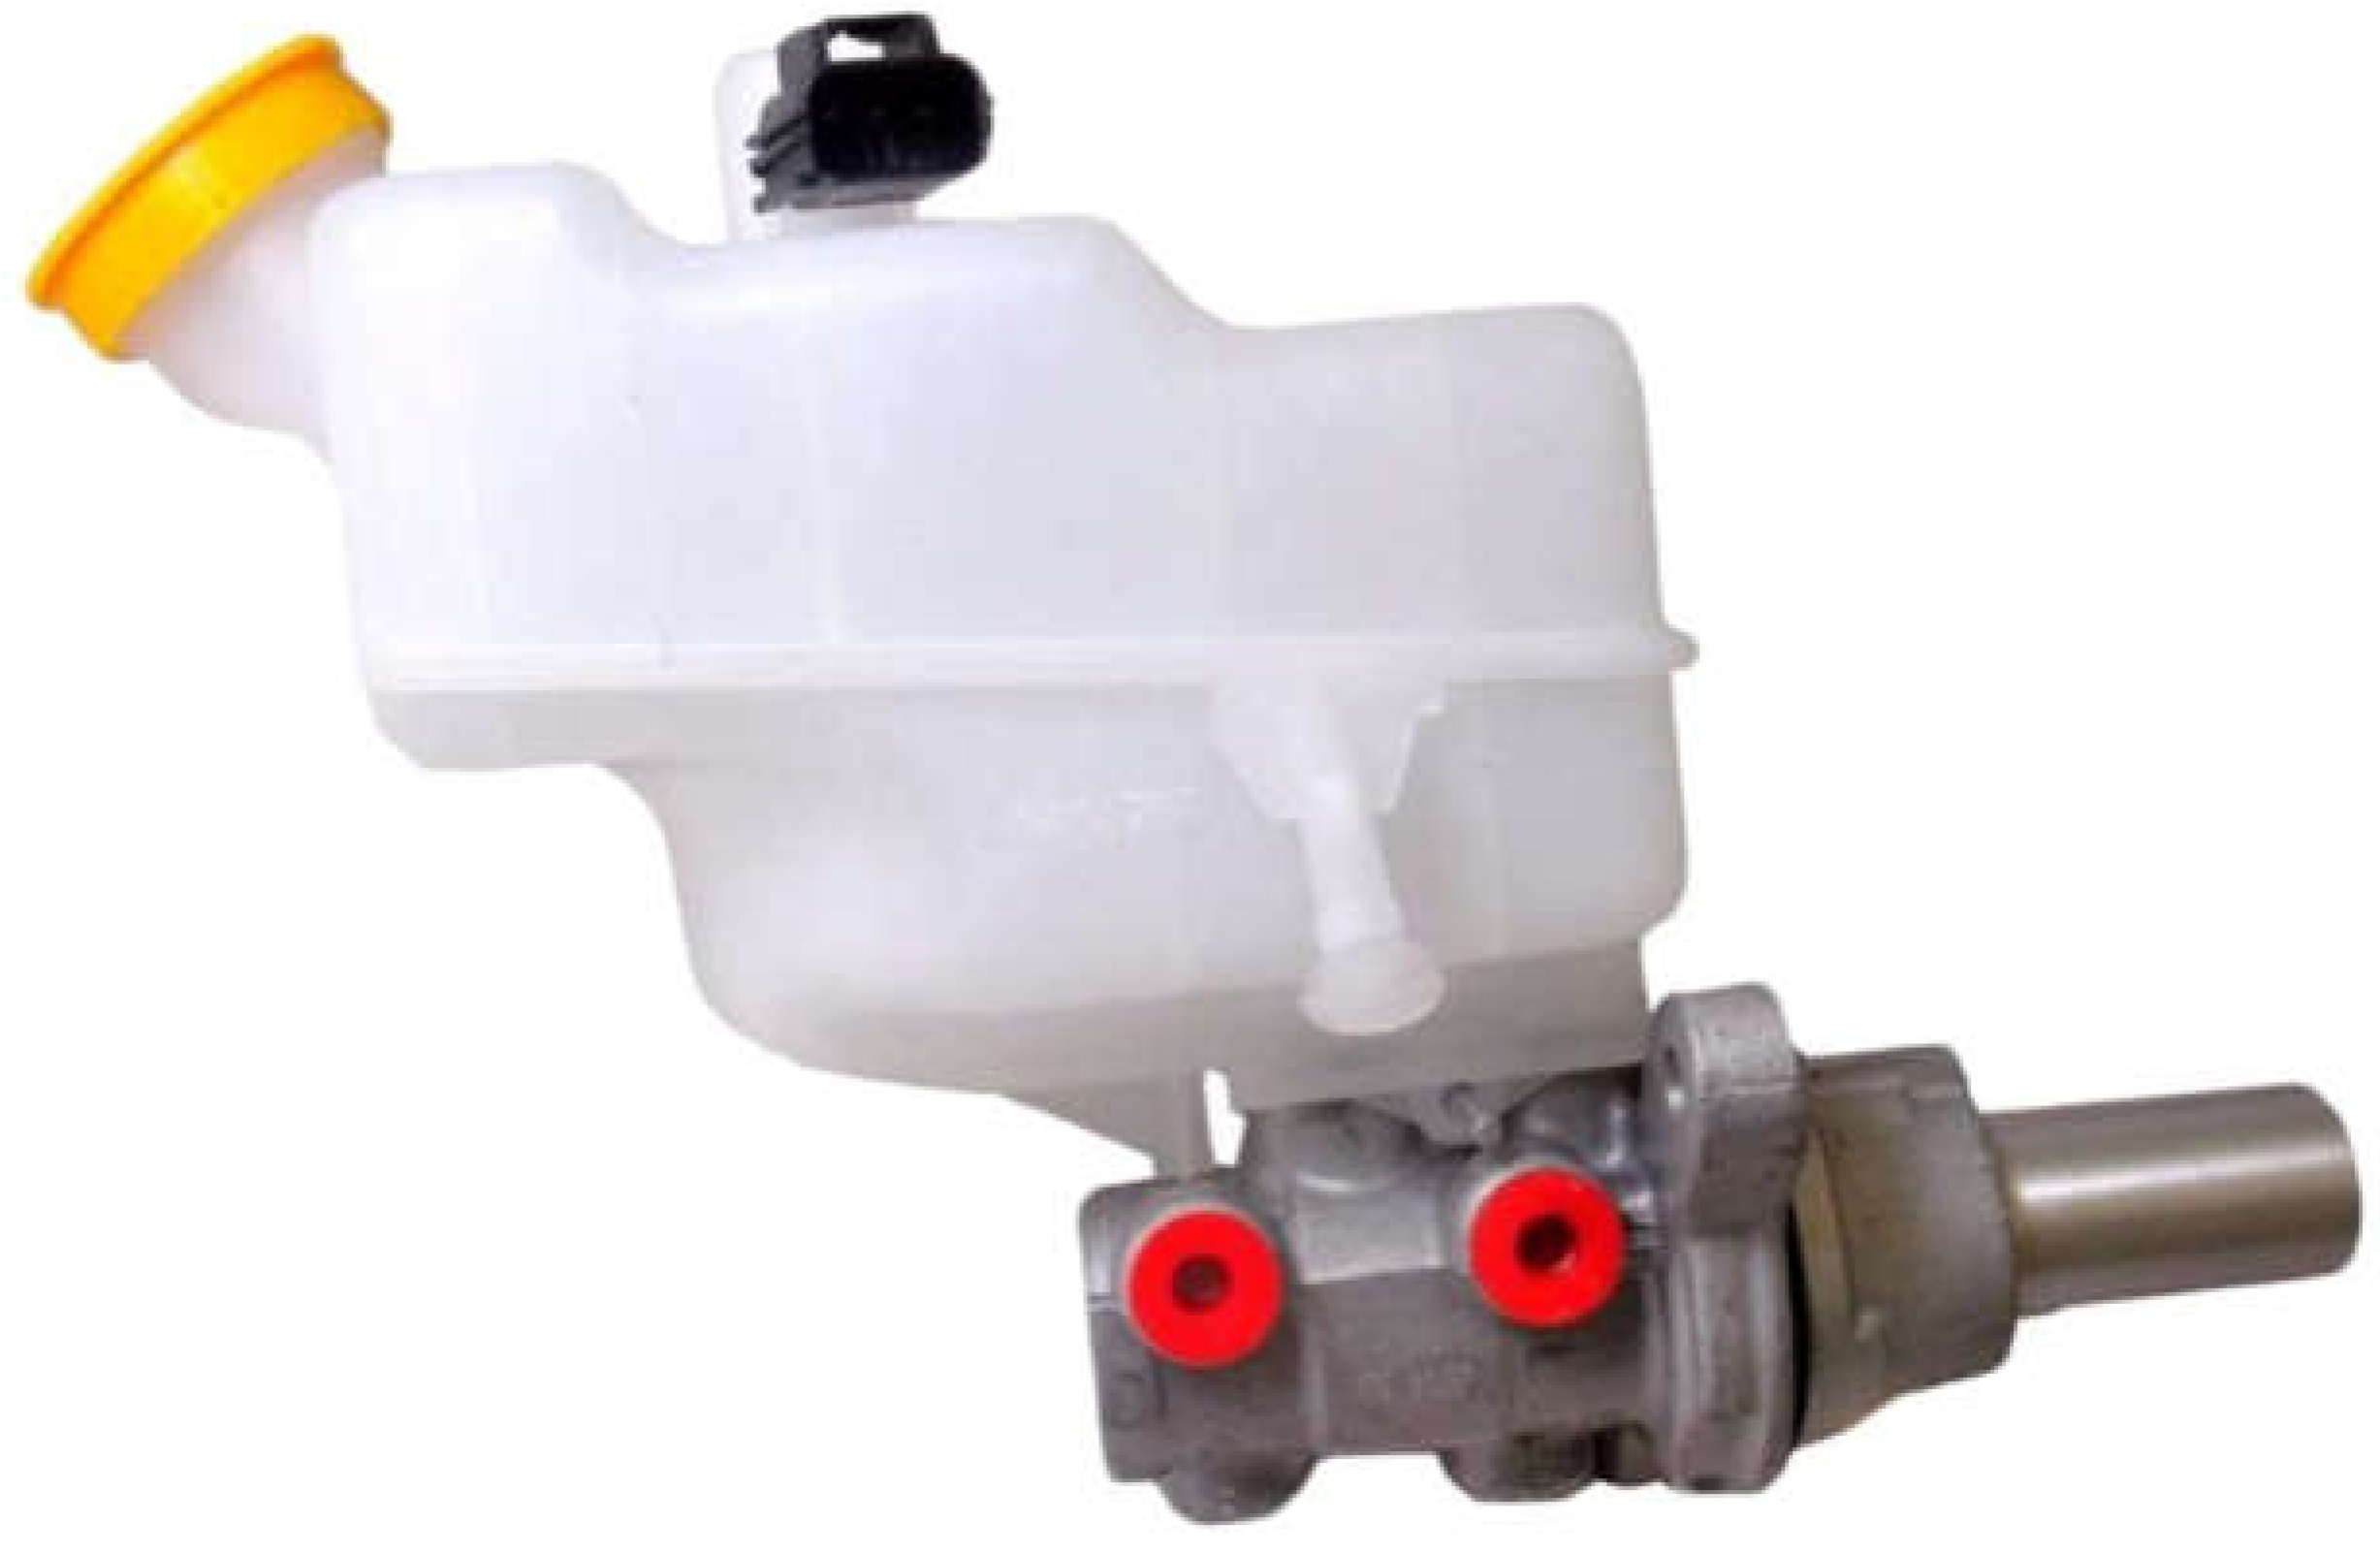
7]. An example of such a solution is a brake fluid reservoir that is part of the braking systems of passenger cars. In the entire product life cycle, critical mechanical stress occurs once during the factory process of first filling, when a special filling head exerts significant load on the filler neck simultaneously in many directions.
Figure 1.
Example of brake fluid reservoir mounted on brake system’s pump. Rys. 1. Przykład zbiornika na płyn hamulcowy, zamontowanego na pompie układu hamulcowego
Figure 1.
Example of brake fluid reservoir mounted on brake system’s pump. Rys. 1. Przykład zbiornika na płyn hamulcowy, zamontowanego na pompie układu hamulcowego
Because of the ongoing topological optimization of the above component, it is crucial to examine and validate the tank’s strength before production. For many years, numerical testing methods based on the Finite Element Method (FEM) have been leading in such solutions due to their advantages, such as speed or accuracy of the results obtained. However, to fully base the validation of the structure on numerical methods, it is necessary to apply the most accurate material model of the simulated object.
2. Cowper-Symonds Model
Due to the nature of the applied force, i.e., the occurrence of loads at a relatively small but variable speed of their application, it is necessary to examine the basic properties of the material used, such as flow stress depending on the strain rate. One of the proposed constitutive models, which is able to reflect that change of parameter, is the Cowper-Symonds model [
8], which is typically used for metallic materials and their wide spectrum of strain rates during tension or compression tests [
9,
10,
11].
The Cowper-Symonds model parameterizes the dynamic flow stress using equation:
where
represents the dynamic and static yield strength obtained from, among others, tensile tests.
is a strain rate and
are the constant parameters of the model. Because of the form of equation (1), the Cowper-Symonds model is characterized by a non-linear, in practice close to logarithmic, dependence of flow stress
on strain rate
.
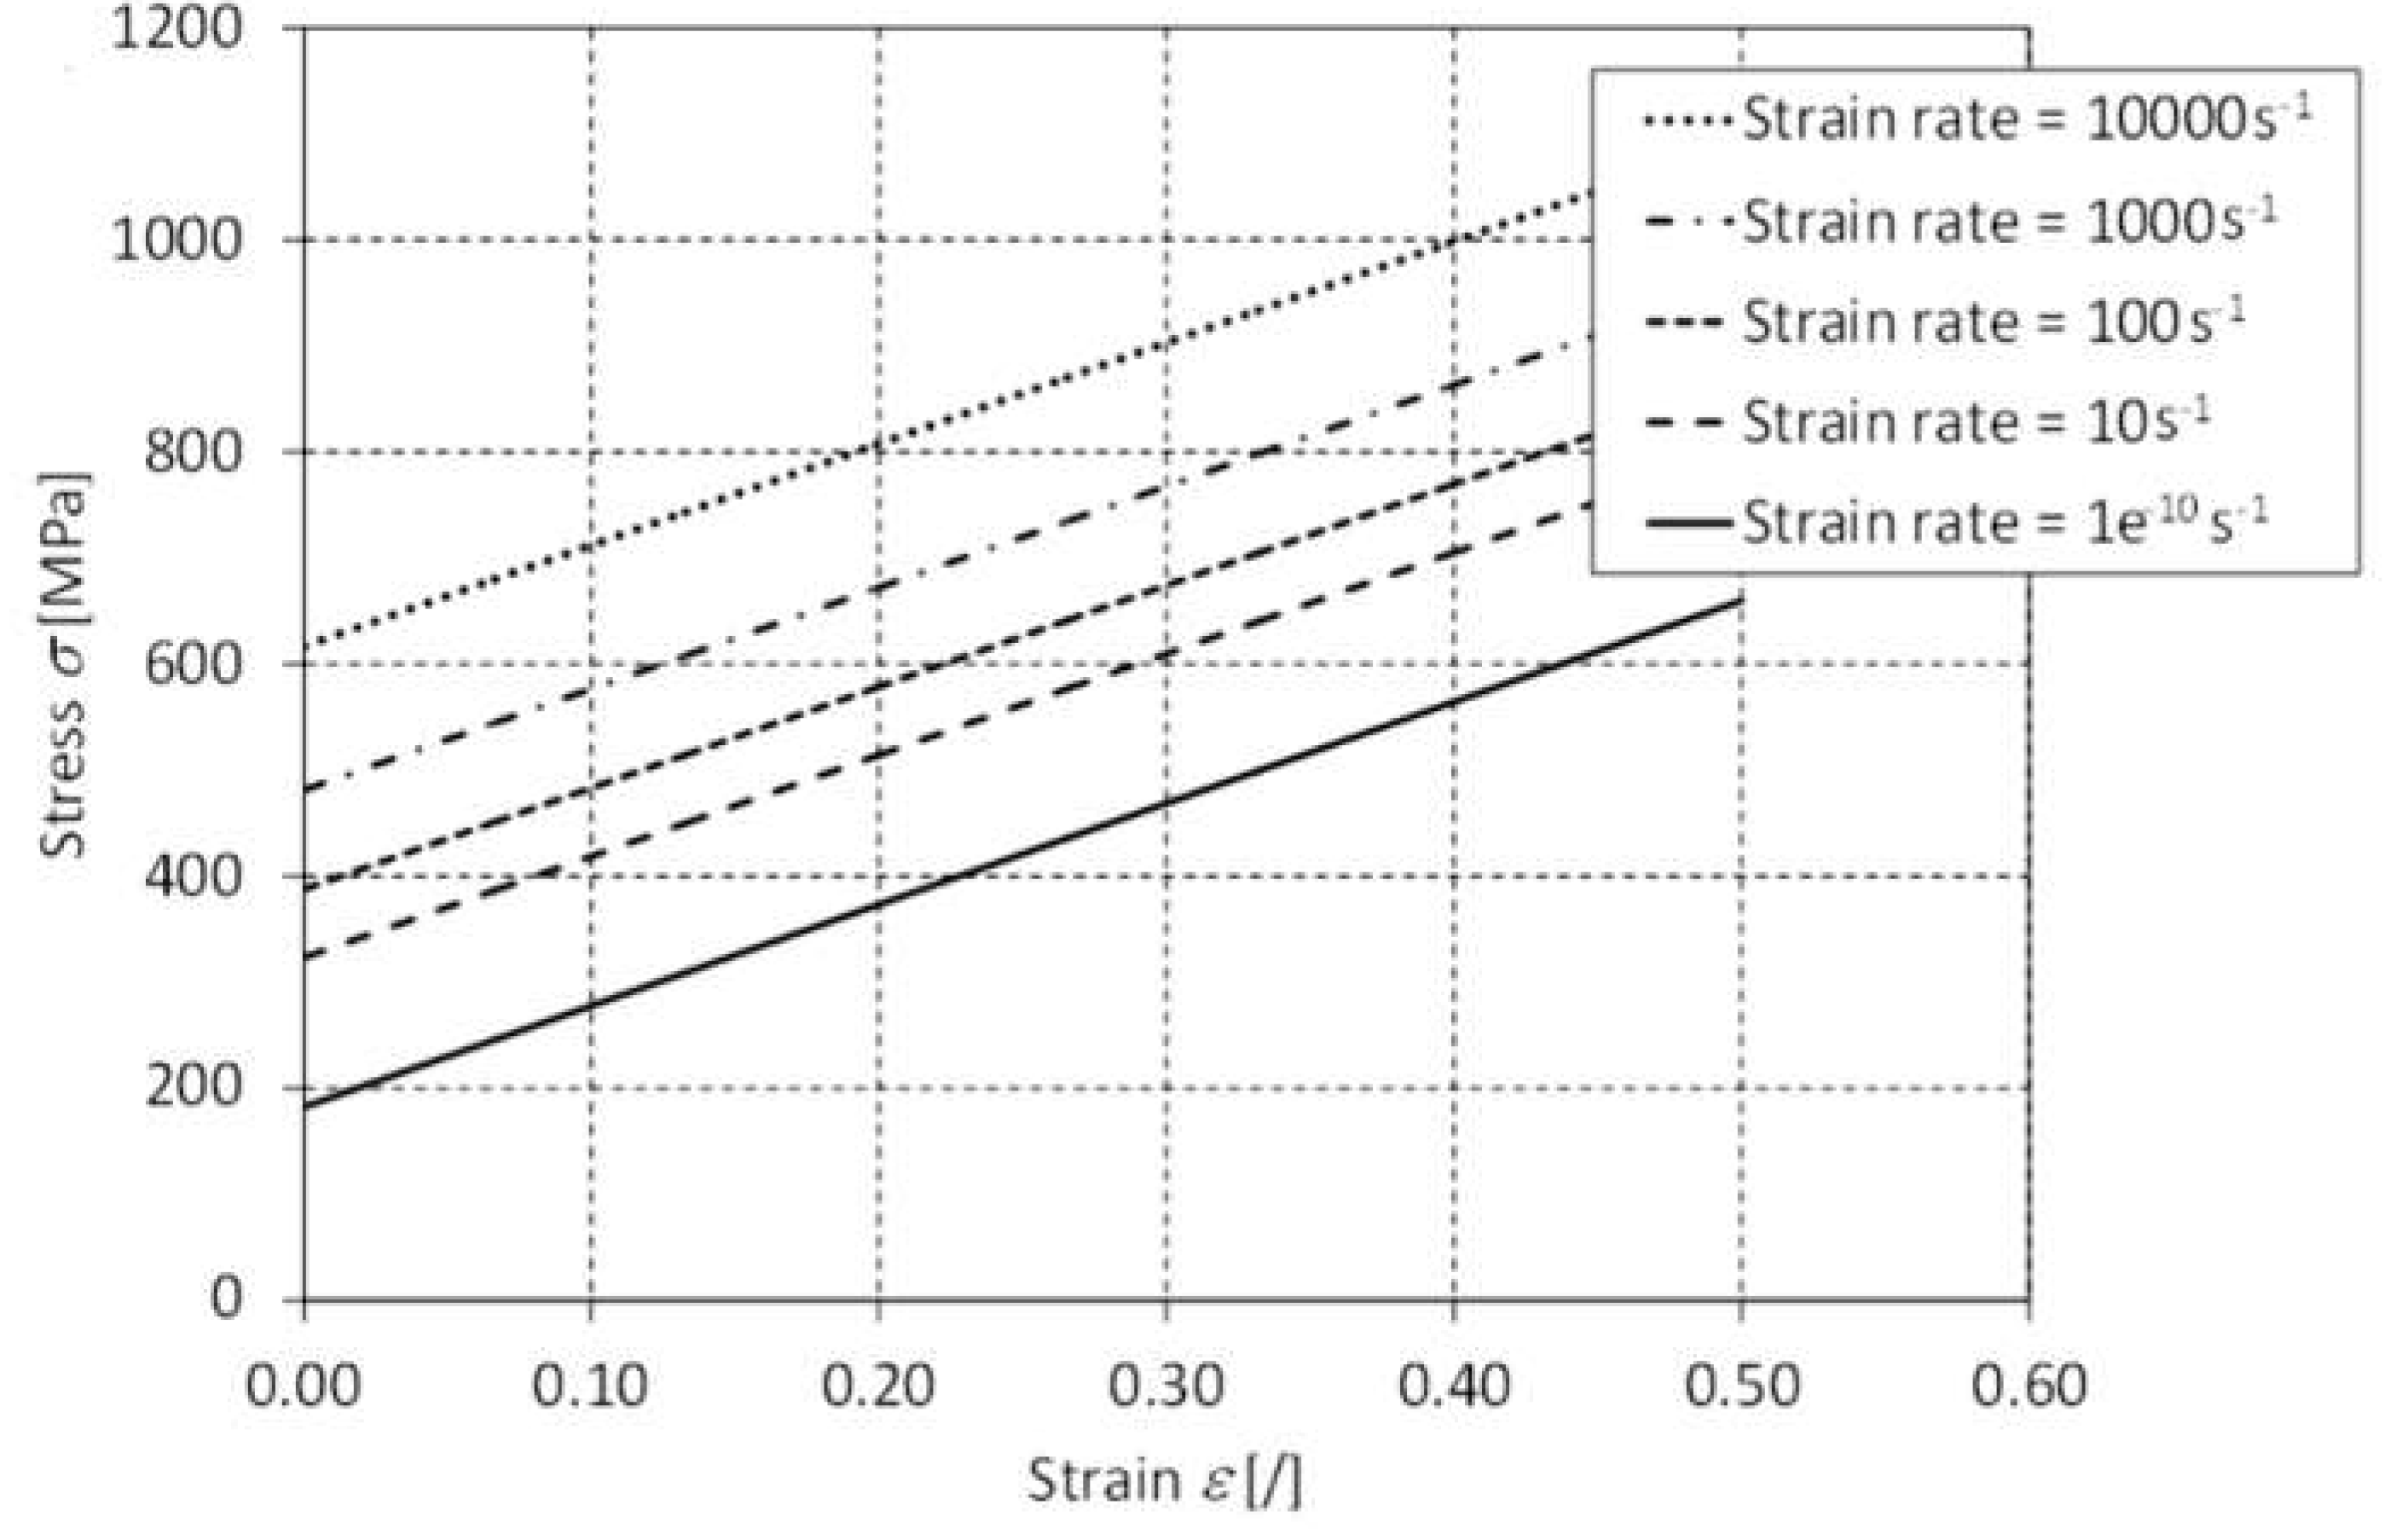
Figure 2.
Example of flow stress curve for different strain rates using Cowper-Symonds model [
11]. Rys. 2. Przykład krzywej wytrzymałości plastycznej dla różnych wartości prędkości odkształcenia używając modelu Compera-Simondsa [
11].
Figure 2.
Example of flow stress curve for different strain rates using Cowper-Symonds model [
11]. Rys. 2. Przykład krzywej wytrzymałości plastycznej dla różnych wartości prędkości odkształcenia używając modelu Compera-Simondsa [
11].
It is worthy to mention that we could expect that for tension and compression test, the parameter will be different [
8,
9].
3. Material, Samples and Experimental Techniques
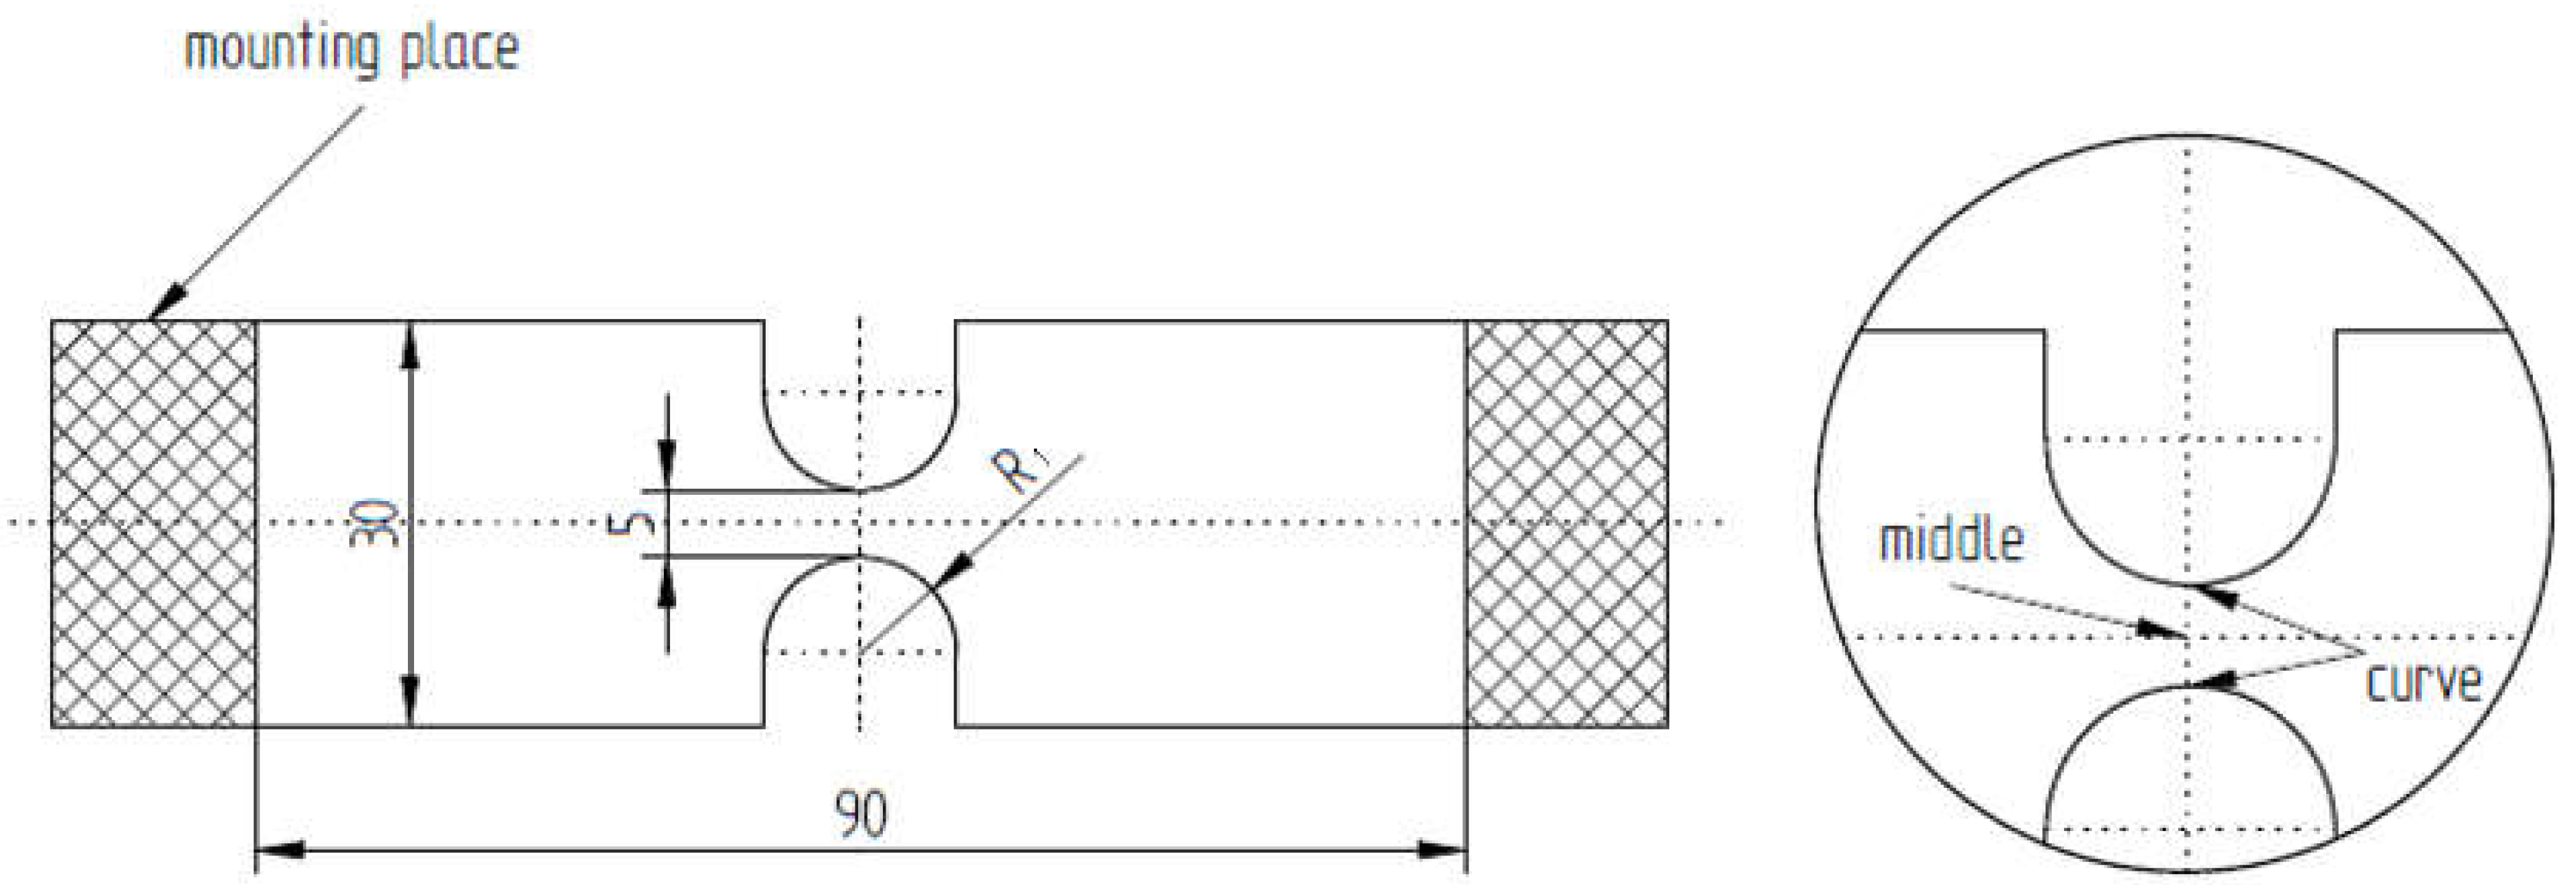
The material subjected to analysis on a Zwick type universal testing machine was Polypropylene with the trade name Sabic 83MF10, obtained in the form of flat plates with a thickness of . The samples were machine cut to obtain different values of the rounding radius , which allowed for a wider range of strain rates , with a limited number of speed settings for the travel head of the strength machine . This also allows for the assessment of the impact of other parameters, including the state of material strain, i.e., triaxiality on the results obtained. The characteristic points, whose behavior is reflected in the stress-travel curves studied in the further part of the study, have been marked in the figure below.
Figure 3.
Characteristic dimension (in ) of samples for tension test. Rys. 3. Wymiary charakterystyczne (w ) próbek do badań na rozciąganie.
Figure 3.
Characteristic dimension (in ) of samples for tension test. Rys. 3. Wymiary charakterystyczne (w ) próbek do badań na rozciąganie.
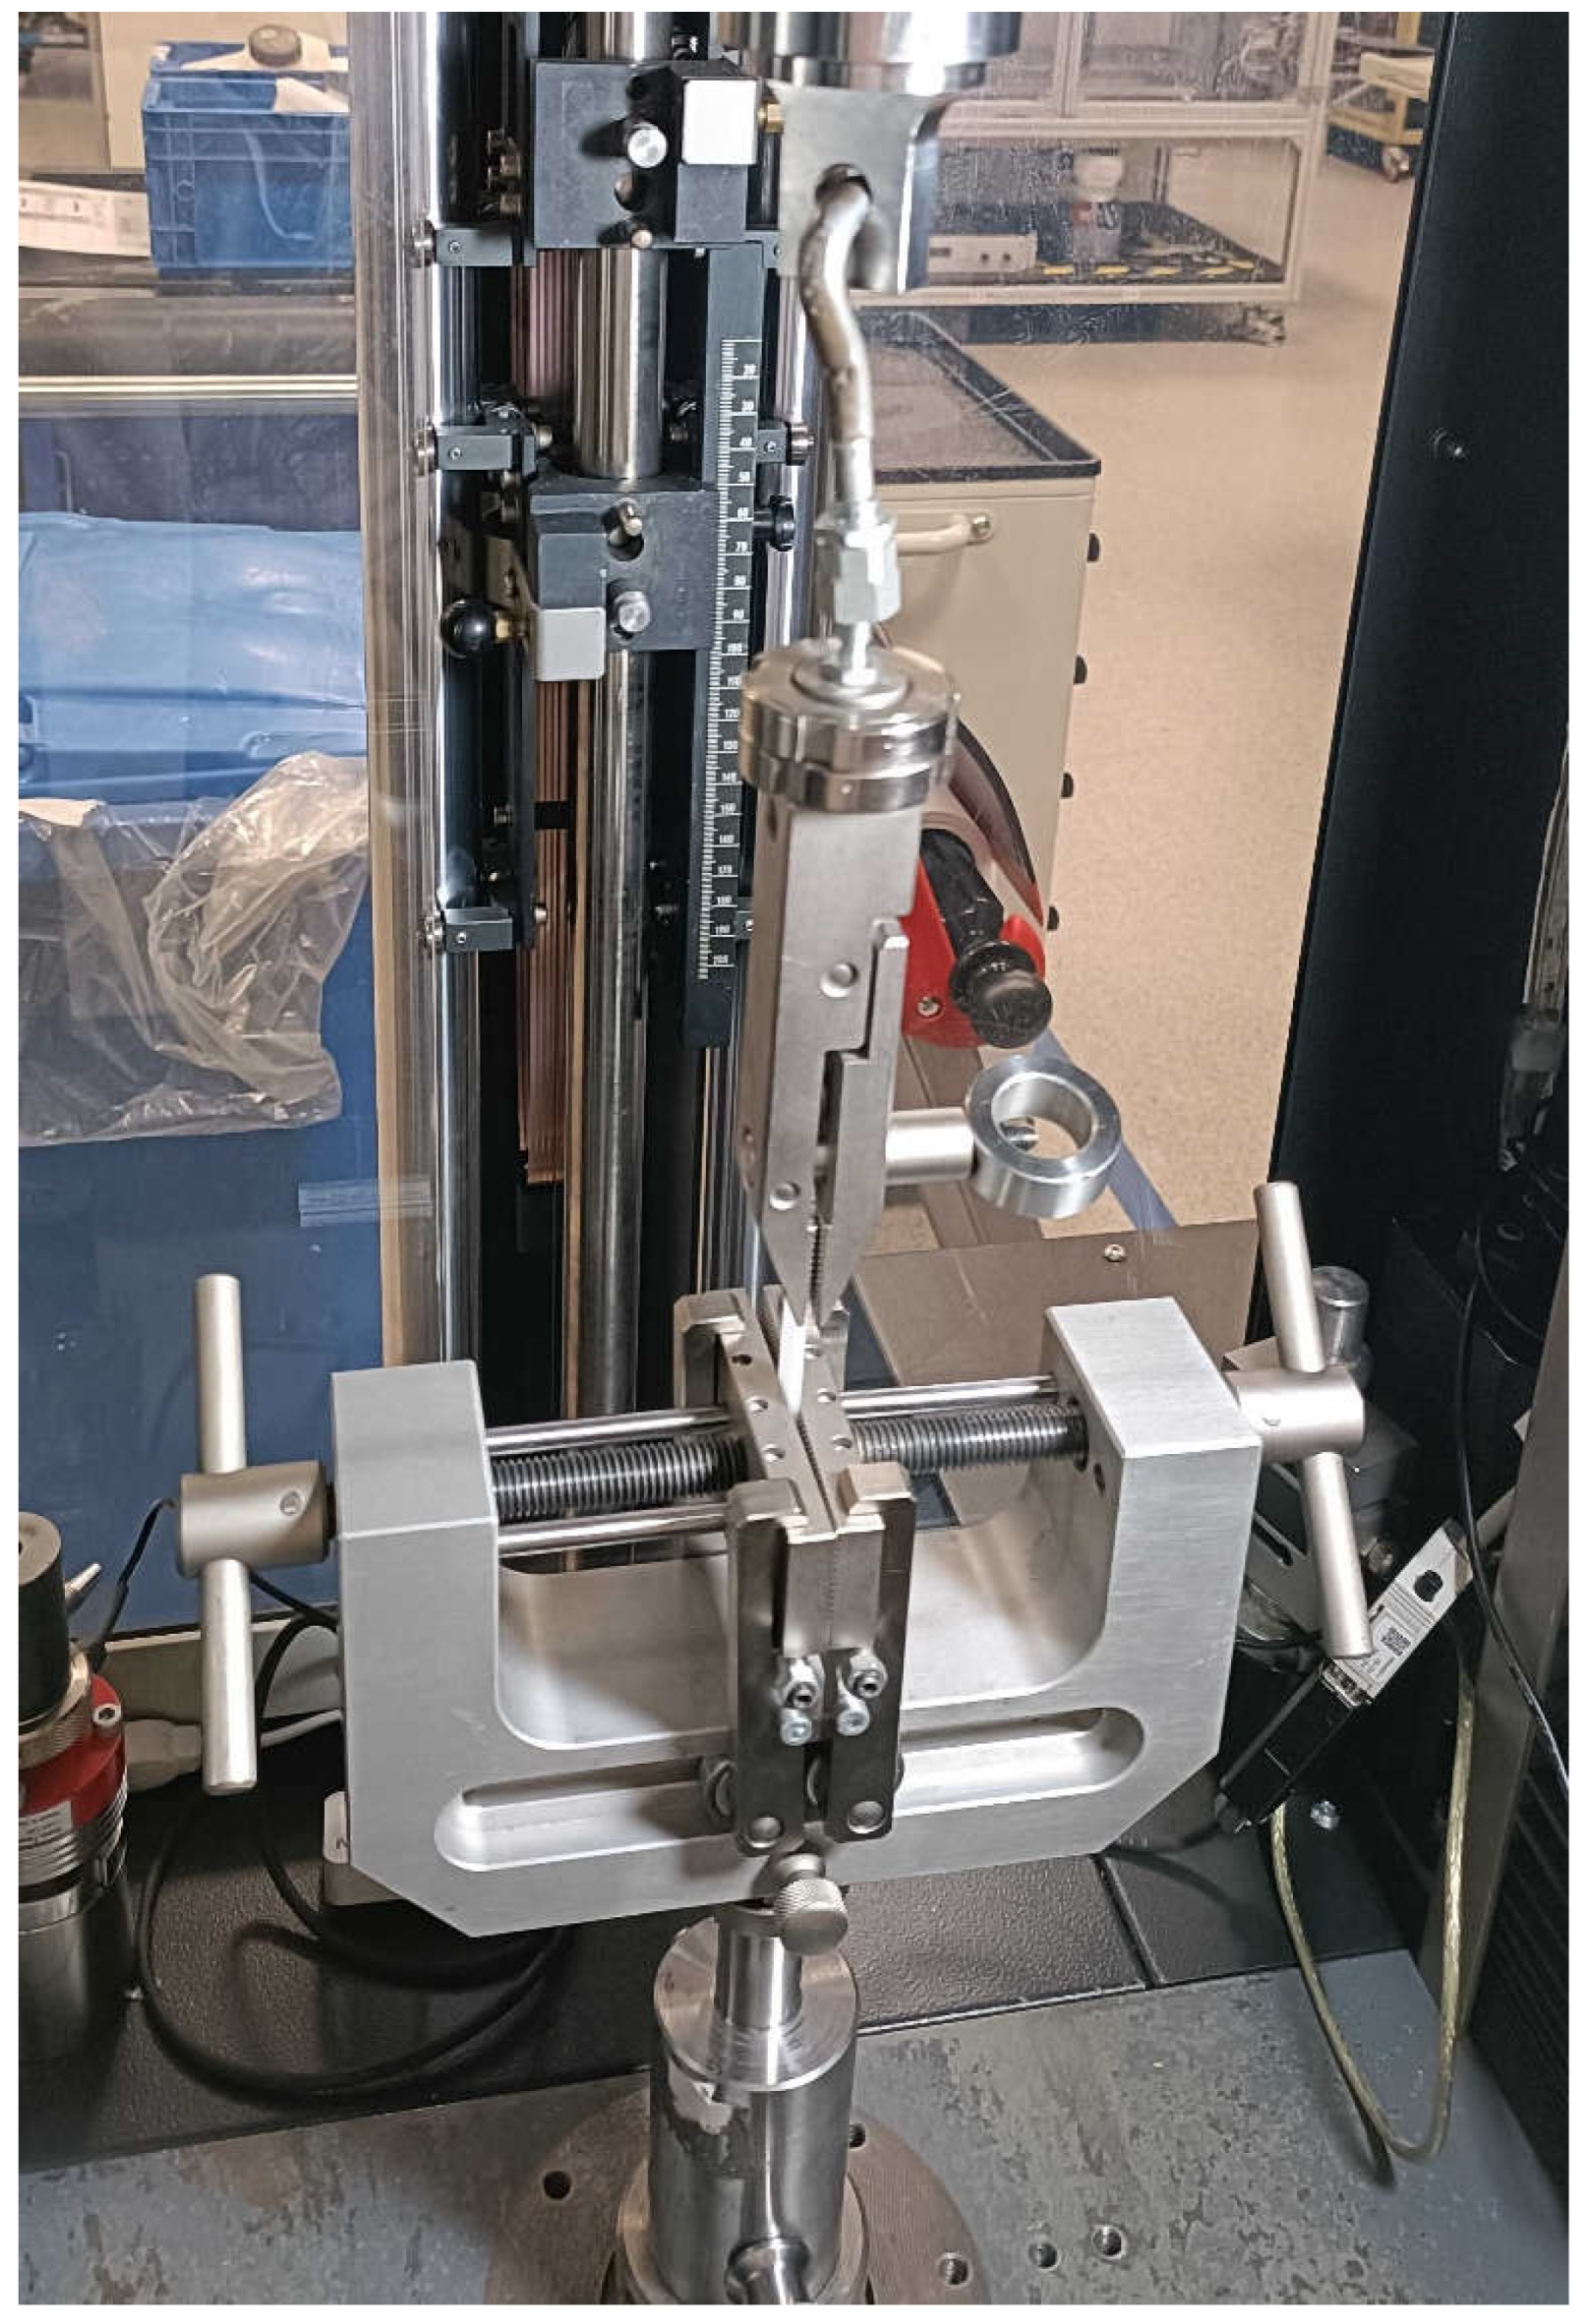
The twelve prepared samples were tension until the upper limit of plasticity was reached using a strength machine with a controllable head movement speed, using a swivel mounting system.
Figure 4.
Mounting set for samples on universal testing machine. Rys. 4. System mocujący próbki na maszynie wytrzymałościowej.
Figure 4.
Mounting set for samples on universal testing machine. Rys. 4. System mocujący próbki na maszynie wytrzymałościowej.
In order to read the values of triaxiality and strain rate , a dynamic explicit FEM simulation was carried out simultaneously using a linear-elastic material model with Young’s modulus and Poisson’s ratio . The lack of consideration of material hardening does not have a significant impact on the result due to the limited scope of the study, i.e., observations until the appearance of significant plastic deformations.
4. Experimental Data Processing and Result
A series of twelve tests was conducted according to the combination below. The input values and already calculated output results for each sample were presented simultaneously.
Table 2.
Tension test parameter scheme.
Table 2.
Tension test parameter scheme.
| Input data |
Output data |
| No |
|
|
|
|
|
|
|
|
|
|
|
|
|
|
|
|
|
|
|
|
|
|
|
|
|
|
|
|
|
|
|
|
|
|
|
|
|
|
|
|
|
|
|
|
|
|
|
|
|
|
|
|
|
|
|
|
|
|
|
|
|
|
|
|
|
|
|
|
|
|
|
|
|
|
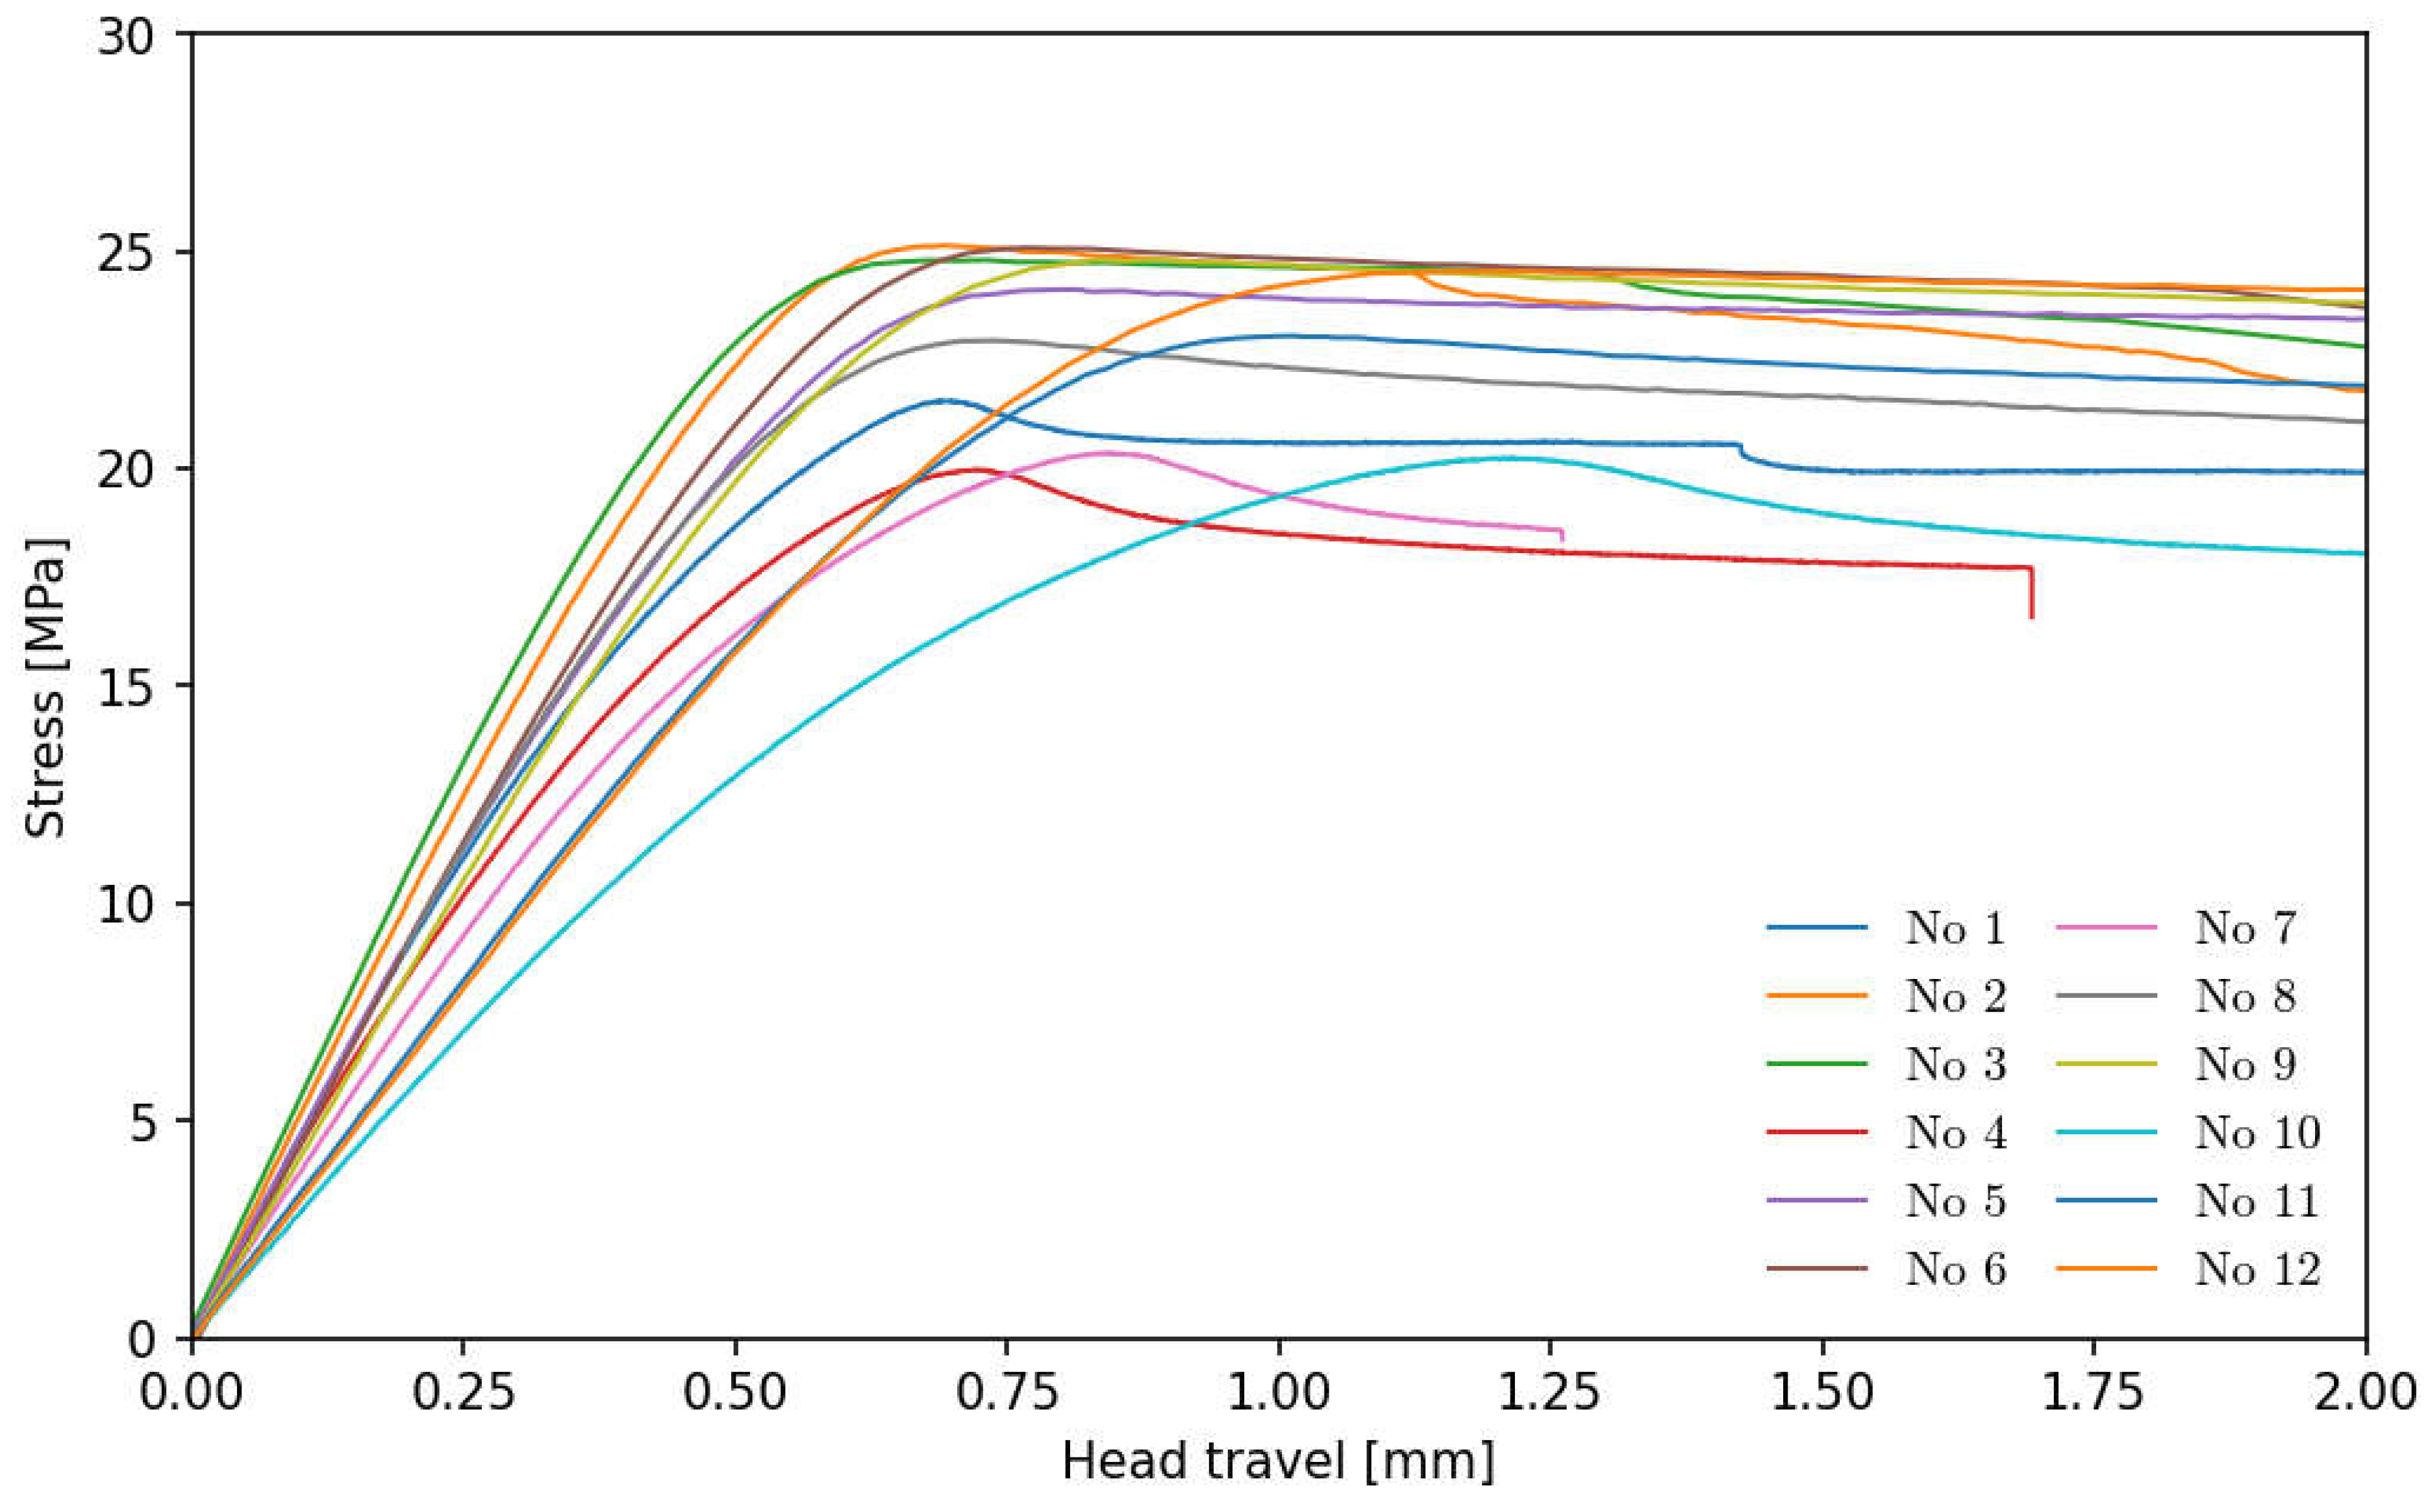
The values of the conventional yield strength
, the upper yield strength
and the below engineering stress curve as a function of head travel (presented on
Figure 5) were determined according to the relationship:
where the current force
read from the tensometric sensor was divided by the original cross-sectional area
. The strain rate
was obtained thanks to the knowledge of the change in the value of logarithmic elastic deformation
at the smallest possible time increment
, which reached values in the range from
to
:
Figure 5.
Engineering stress-head travel curves. Rys. 5. Krzywe naprężeń w funkcji drogi głowicy.
Figure 5.
Engineering stress-head travel curves. Rys. 5. Krzywe naprężeń w funkcji drogi głowicy.
The values of triaxiality
and strain rate
were read at the location marked as a curve in
Figure 3 at the moment of reaching the conventional yield strength
.
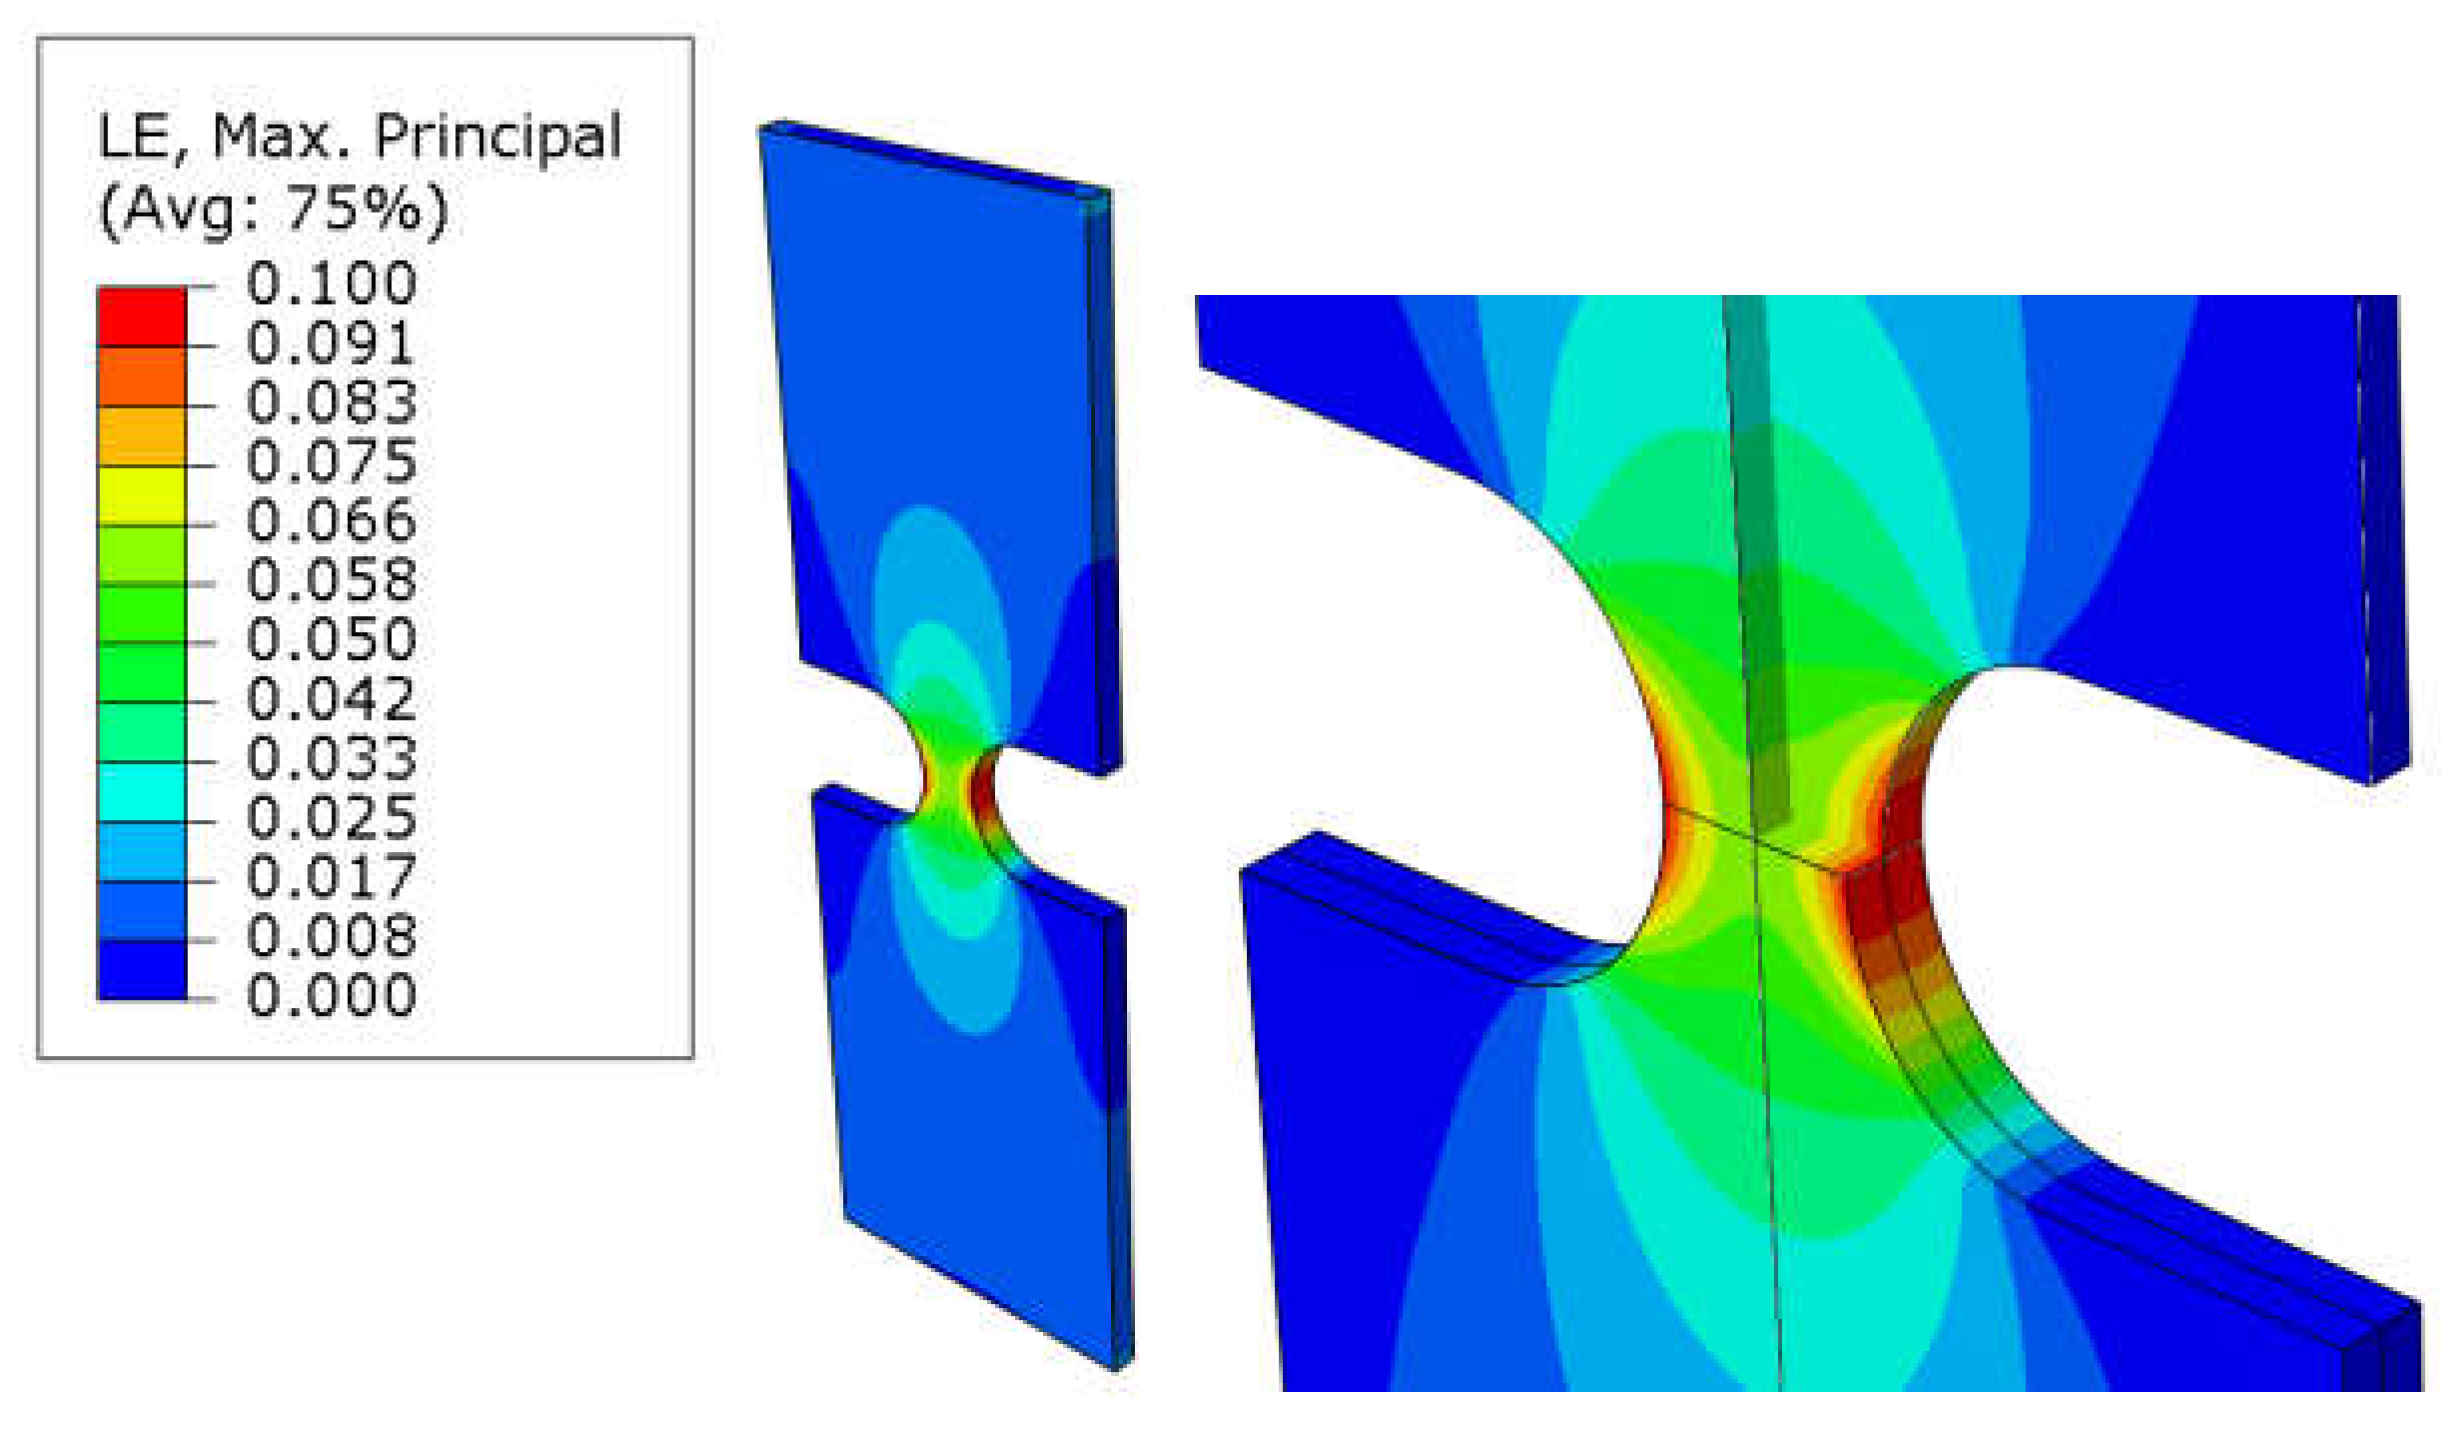
Figure 6.
Distribution of logarithmic elastic strains in the critical cross-section for sample no 6. Rys. 6. Rozkład logarytmicznych odkształceń elastycznych w krytycznym przekroju dla próbki nr 6.
Figure 6.
Distribution of logarithmic elastic strains in the critical cross-section for sample no 6. Rys. 6. Rozkład logarytmicznych odkształceń elastycznych w krytycznym przekroju dla próbki nr 6.
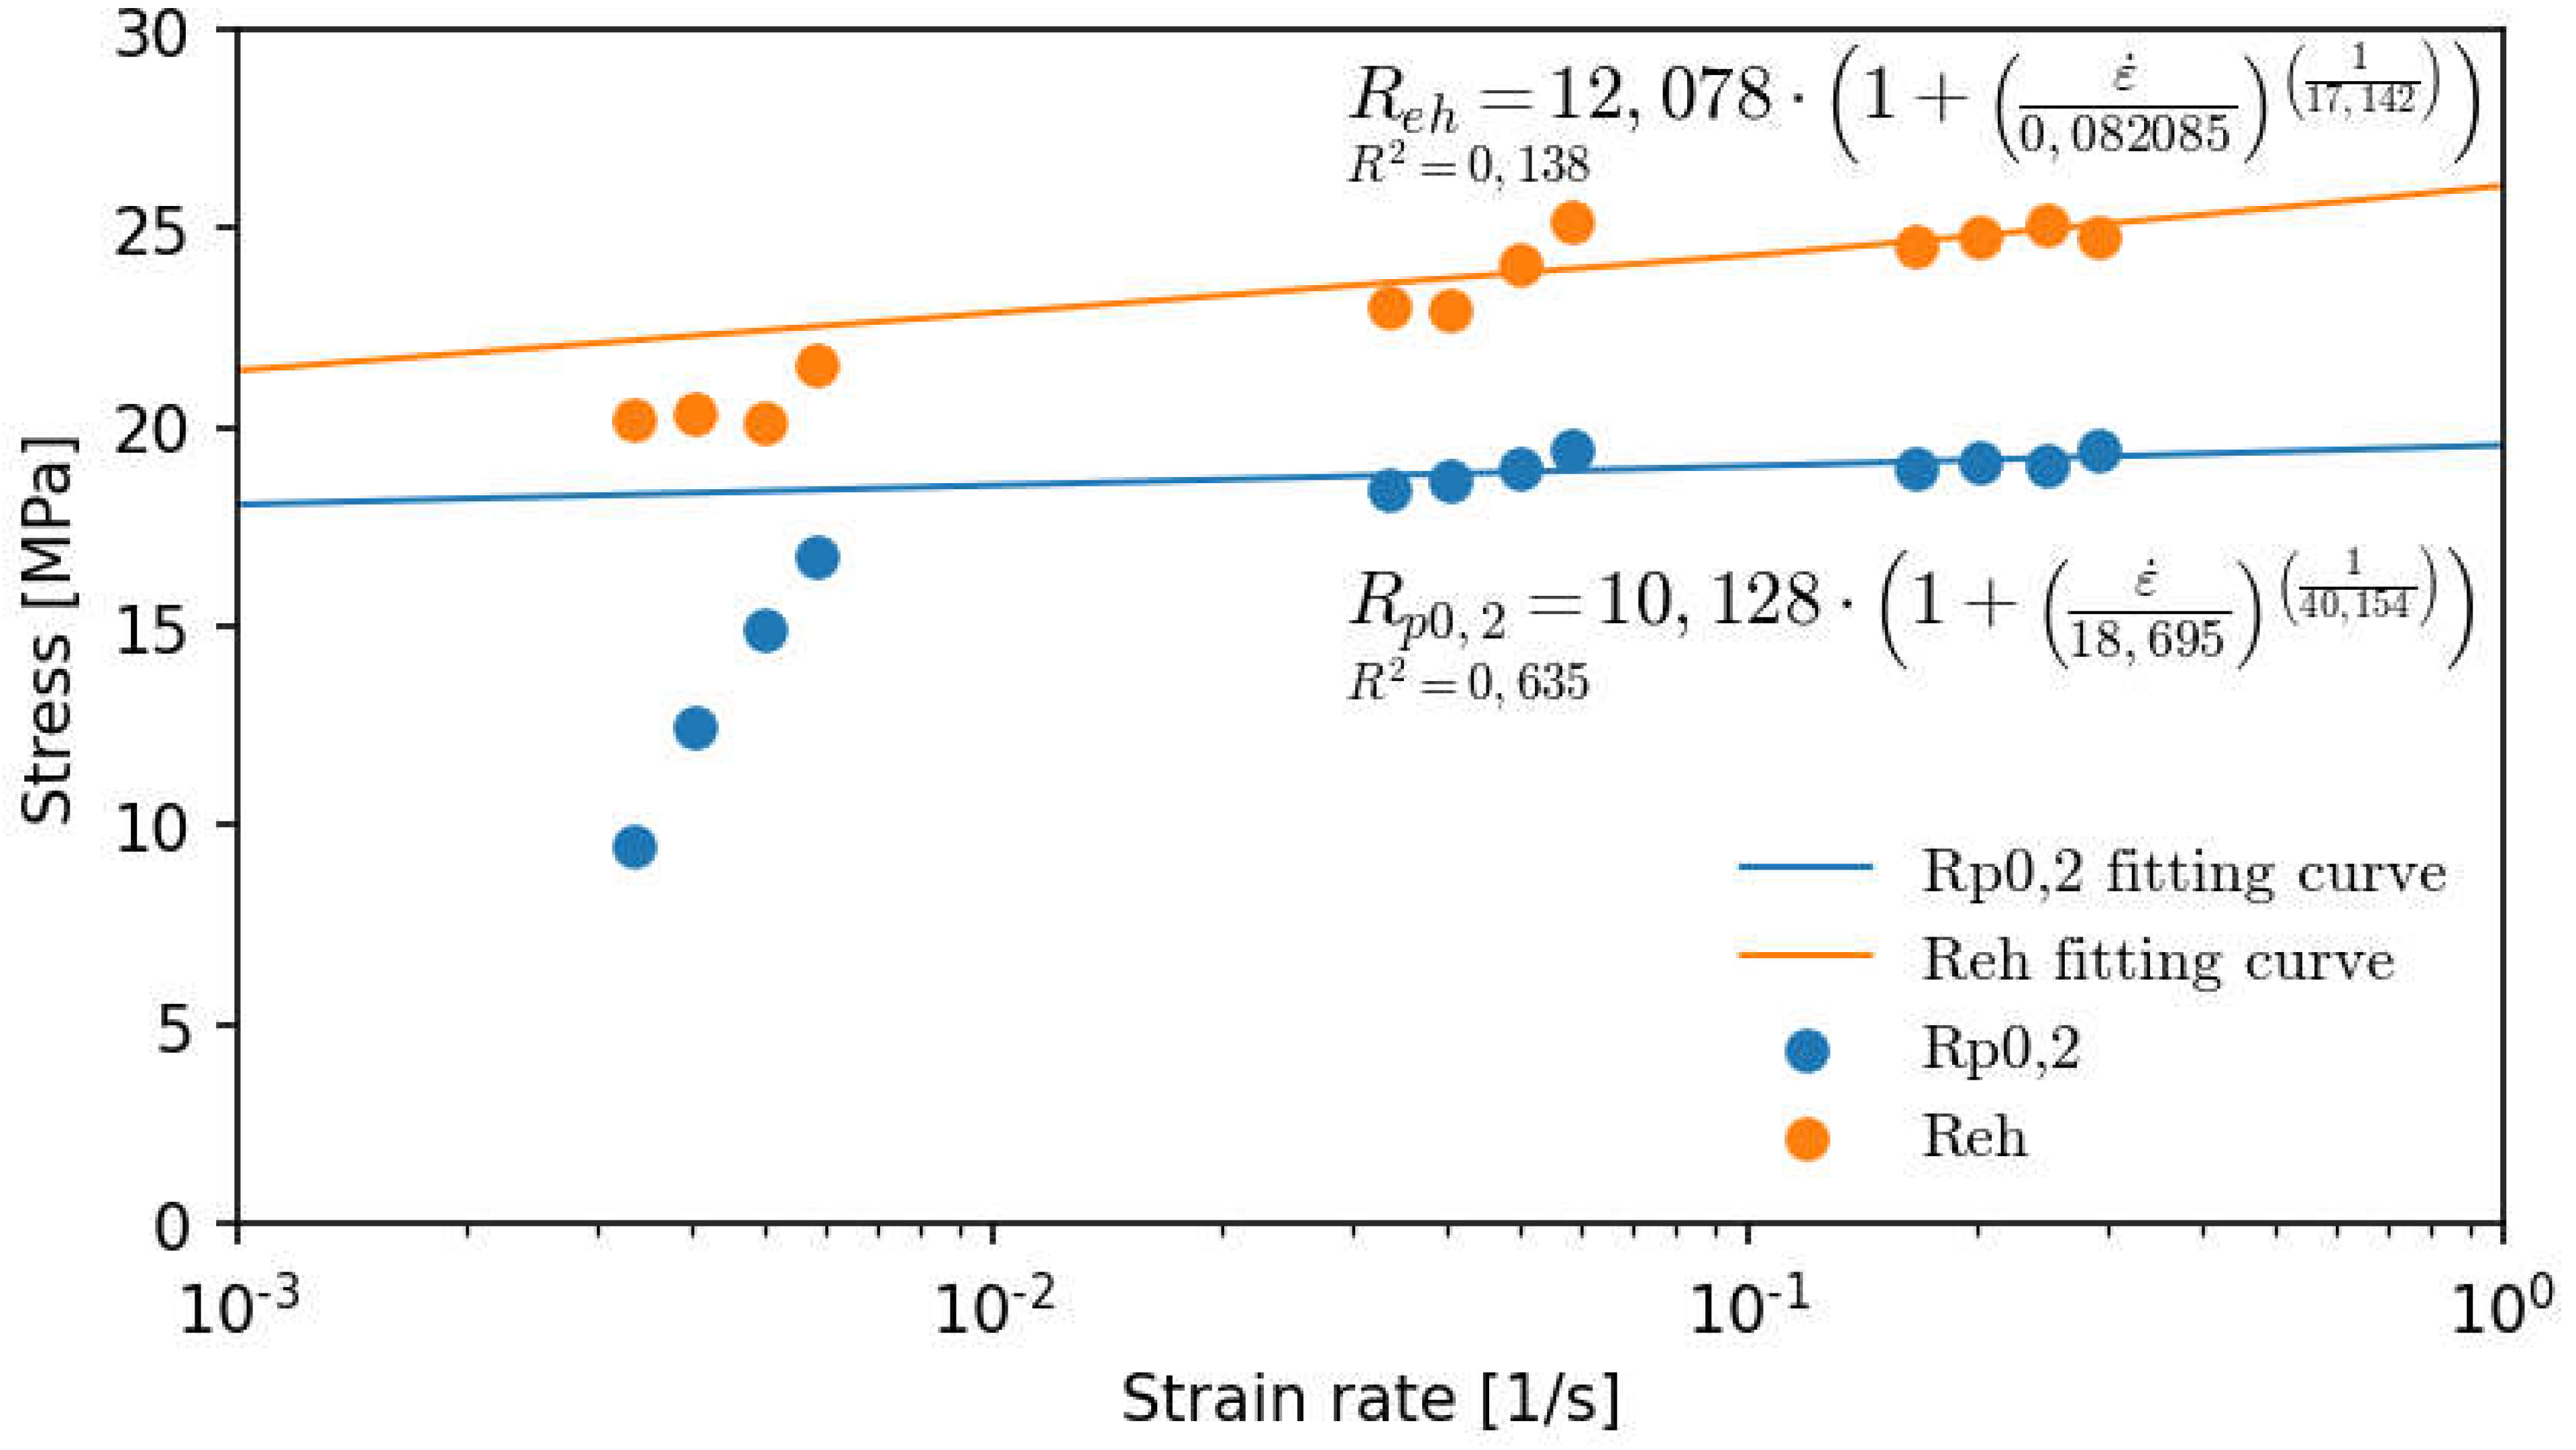
The base values obtained in this way were used to construct a graph of the dependence of the conventional yield strength and the upper yield strength as a function of strain rate .
Figure 7.
and data as a function of elastic stress strain rate . Rys. 7. Wartości i oraz w funkcji prędkości odkształcenia elastycznego .
Figure 7.
and data as a function of elastic stress strain rate . Rys. 7. Wartości i oraz w funkcji prędkości odkształcenia elastycznego .
Thanks to presenting the results on a logarithmic axis, it was possible at a later stage to justify the exclusion of results for the four lowest strain rate
values from the regression curves. Their task is to propose the values of coefficients
and
according to relation
based on optimization by the least squares method (LSM). Due to the nature of the Cowper-Symonds model, it is possible to adopt flow stress
based on the conventional yield strength
while maintaining a satisfactory value of the coefficient of determination
, according to the following relationship:
5. Summary, Conclusions and Limitations
The strain rate sensitive hardening of the Polypropylene Sabic 83MF10 under dynamic tension loads were discusses in this article. Based on presented investigation it is possible to highlight that:
- -
A noticeable non-linear increase in the values of the conventional yield strength
and the upper yield strength
is shaped according to the Cowper-Symonds model for elastic strain rate
values ranging from
to
. For a lower range, a drastic drop in both values is observed, especially the conventional yield strength
, which suggests a significant influence of the creep and relaxation phenomena. To define them, it is necessary to conduct further research for material models that include, among others, viscoelastic properties [
12,
13,
14]. For further research, larger values of elastic strain rate
, are suggested, which would allow for additional validation of the proposed model [
15].
- -
Among samples with a similar elastic strain rate
, those with a smaller rounding radius obtain disproportionately higher values of the conventional yield strength
and the upper yield strength
. This highlights the existence of a dependency of both these values and flow stress
on triaxiality
. This suggests a high value of further research on the Drucker-Prager model for the aforementioned material [
16].
- -
The proposed hybrid approach, which includes classical calculations and numerical reading of values, despite its advantages in the form of simplified procedures, introduces a noticeable error in reading, among others, the values of current stresses. In order to construct a full true stress-strain curve, it is possible to proceed, among others, in accordance with the Bridgman procedure [
17].
- -
For further research, it is suggested to consider a wider range of examined input parameters. This includes, for example, following the Johnson-Cook model [
18,
19] and comparing the proposed model for stretched samples with the results of a compression test [
20].
References
- Stinson, Stephen (1987). “Discoverers of Polypropylene Share Prize”. Chemical & Engineering News. 65 (10): 30. [CrossRef]
- INEOS. (n.d.). Polypropylene Processing Guide. INEOS. Retrieved from https://www.ineos.com. 23.04.2024.
- Maddah, H. A. (2016). Polypropylene as a Promising Plastic: A Review. American Journal of Polymer Science, 6(1), 1-11. [CrossRef]
- Hossain, M. T., Shahid, M. A., Mahmud, N., Habib, A., Rana, M. M., Khan, S. A., & Hossain, M. D. (2024). Research and application of polypropylene: a review. Nano, 19(2). [CrossRef]
- Karger-Kocsis, J., & Bárány, T. (2019). Polypropylene Handbook: Morphology, Blends and Composites. SpringerLink. [CrossRef]
- MatWeb. (n.d.). Material Property Data Sheet. Retrieved from https://www.matweb.com/search/DataSheet.aspx?MatGUID=08fb0f47ef7e454fbf7092517b2264b2&ckck=1. 23.04.2024.
- Maier, C., & Calafut, T. (1998). Applications. In C. Maier & T. Calafut (Eds.), Polypropylene (pp. 87-107). William Andrew Publishing. ISBN: 9781884207587.
- Cowper G.J., Symonds P.S., Report, Brown University, Division of Applied Mathematics, 1957.
- Cadoni, E., Forni, D., Gieleta, R. et al. Tensile and compressive behaviour of S355 mild steel in a wide range of strain rates. Eur. Phys. J. Spec. Top. 227, 29–43 (2018). [CrossRef]
- Knobloch, M.; Pauli, J.; Fontana, M. (2013). Influence of the strain-rate on the mechanical properties of mild carbon steel at elevated temperatures. Materials & Design. 49: 553-565. [CrossRef]
- Škrlec A., Klemenc J., Strojniški vestnik - Journal of Mechanical Engineering 62(2016)4, 220-230. [CrossRef]
- Zhou, X., Yu, D., & Barrera, O. (2023). Chapter Three - Mechanics constitutive models for viscoelastic solid materials: Development and a critical review. In S.P.A. Bordas (Ed.), Advances in Applied Mechanics, Volume 56 (pp. 189-321). Elsevier. ISBN 9780323992480. [CrossRef]
- Kraus, M.A., Schuster, M., Kuntsche, J. et al. Parameter identification methods for visco- and hyperelastic material models. Glass Struct Eng 2, 147–167 (2017). [CrossRef]
- Findley, W.N., Lai, J.S., & Onaran, K. (1989). Viscoelasticity of Engineering Materials. Chapman and Hall. pp. 1-20. [CrossRef]
- Mulliken, A. D., & Boyce, M. C. (2006). Mechanics of the rate-dependent elastic–plastic deformation of glassy polymers from low to high strain rates. International Journal of Solids and Structures, 43(5), 1331-1356. [CrossRef]
- Seltzer, R., Cisilino, A. P., Frontini, P. M., & Mai, Y.-W. (2011). Determination of the Drucker–Prager parameters of polymers exhibiting pressure-sensitive plastic behaviour by depth-sensing indentation. International Journal of Mechanical Sciences, 53(6), 471-478. [CrossRef]
- Bridgman, P. W. (1952). Studies in Large Plastic Flow and Fracture: With Special Emphasis on the Effects of Hydrostatic Pressure. Harvard University Press. [CrossRef]
- Chandra Sekher Yerramalli, S., Sumant, C., Kumar Prusty, R., & Chandra Ray, B. (2022). Finite element modelling and experimentation of plain weave glass/epoxy composites under high strain-rate compression loading for estimation of Johnson-Cook model parameters. International Journal of Impact Engineering, 167, 104262. [CrossRef]
- Yang, M., Li, W., Dong, P., Ma, Y., He, Y., Zhao, Z., & Chen, L. (2022). Temperature and strain rate sensitivity of yield strength of amorphous polymers: Characterization and modeling. Polymer, 251, 124936. [CrossRef]
- Donato, G. H. B., & Bianchi, M. (2012). Pressure Dependent Yield Criteria Applied for Improving Design Practices and Integrity Assessments against Yielding of Engineering Polymers. Journal of Materials Research and Technology, 1(1), 2-7. [CrossRef]
|
Disclaimer/Publisher’s Note: The statements, opinions and data contained in all publications are solely those of the individual author(s) and contributor(s) and not of MDPI and/or the editor(s). MDPI and/or the editor(s) disclaim responsibility for any injury to people or property resulting from any ideas, methods, instructions or products referred to in the content. |
© 2024 by the authors. Licensee MDPI, Basel, Switzerland. This article is an open access article distributed under the terms and conditions of the Creative Commons Attribution (CC BY) license (http://creativecommons.org/licenses/by/4.0/).
