1. Introduction
Over half of the world’s potentially arable lands are comprised of acid soils, posing numerous challenges to plant performance, primarily in the form of aluminum (Al) toxicity and inorganic phosphorus (Pi) deficiency, which are the two largest abiotic stress in acid soil [
1]. Al toxicity and Pi deficiency often coexist in acid soil, with phosphorus (P) fixation in Al-P precipitates significantly contributing to low P availability [
2]. Al toxicity inhibits root development and directly interferes with plant P metabolism and Pi signaling, diminishing the plant’s ability to acquire Pi from soils [
3]. Therefore, crops grown in acid soil are confront with a dilemma: simultaneously increase the uptake of primary macronutrient Pi while reducing the absorption of toxic Al
3+. For example, the great challenge for plants in balancing the absorption of Pi and Al is changing the root system morphology and architecture. Al toxicity inhibits root cell expansion and elongation, along with later cell division, causing the root system to become swollen to reduce Al
3+ entry into root cells [
3]. The strategy of Pi uptake by plants is to enlarge the contact area between the roots and the soil by increasing the lateral roots and root hairs to improve Pi acquisition efficiency [
4].
Plants have developed defense mechanisms to simultaneously navigate the challenges Al and LP pose in acid soils encompassing external and internal forms [
5]. Plants regulate Al uptake, translocation, and distribution to avoid Al toxicity and efficiently take up Pi from the soil by orchestrating a set of transport mechanisms [
6]. A well-documented external tolerance mechanism involves the secretion of organic acid (OAs) from root apices, crucial components in Al detoxification and Pi acquisition [
7]. The malate transporter aluminum activated malate transporter 1 (ALMT1) and its positive transcriptional regulator sensitive to proton rhizotoxicity 1 (STOP1) play an essential role in tolerance to Al toxicity [
8] and Pi deficiency [
9]. In addition, two ABC transporters sensitive to Al rhizotoxicity 1/aluminum sensitive 3 (STAR1/ALS3) [
10,
11] and wall-associated kinases (WAKs) [
12,
13] are involved in cell wall-mediated responses to Al toxicity and P deficiency. The internal mechanisms include isolating excess Al
3+ into vacuoles and recycling P from vacuoles, increasing the activity of antioxidant enzymes, and common or specific physiological metabolic reactions [
7]. In addition, plant hormones and some transcription factors (TFs) such as WRKY, MYB, bHLH, NAC, and ERF/AP2 are the common determinants of Al tolerance and Pi efficiency [
14].
Previous studies have investigated physiological metabolites and the changes involved in P starvation and Al tolerance response. Flavonoids are an important class of secondary metabolites widely found in plants, contributing to plant growth and development [
15]. Similar to organic acids, secondary metabolites produced from the phenylpropanoid biosynthesis pathway, such as phenylpropanoids and flavonoids, play a crucial role in scavenging reactive oxygen species (ROS), delaying microbial degradation of OAs, and enhancing mobilization of rhizosphere Pi [
16,
17]. Carbohydrate metabolism plays a vital role in resistance to abiotic stress in plants, such as providing energy and raw materials, regulating cellular osmotic pressure and ion homeostasis, and enhancing stress resistance [
18]. Plants could provide glycolytically yielded energy (ATP) by upregulating the glycolysis, starch, and sucrose synthesis genes to crop with Al toxicity [
19] and Pi deficiency [
20] and maintain basic respiration.
Although Al toxicity and Pi deficiency exist simultaneously, most previous studies were independent, and few studies have focused on the commonalities and specificities in the effects of these two stresses on the regulation of secondary metabolism in plants. This study integrated transcriptome and metabolome analysis to reveal the specificity and commonality in the toxicity and tolerance mechanisms of flavonoids and carbohydrate metabolism in wheat under Al and LP stresses, providing a new perspective on the molecular network of plants responding to multiple stresses in acid soil and further discovering candidate genes for wheat Al and LP tolerance, providing genetic resources.
3. Discussion
Due to the coexistence of Al toxicity and P deficiency in acid soils, researchers have been motivated to study the interaction between Al toxicity and P deficiency in plant adaptations to acid soils [
7]. Previous studies have consistently reported a positive correlation between P efficiency and Al tolerance in various plant species. For example, Al-tolerant buckwheat plants exhibit high P contents or efficient P acquisition and translocation to shoots [
21]. Correspondingly, P-efficient genotypes tend to display greater Al tolerance than P-inefficient lines in
Stylosanthes [
22]. Understanding how plants adapt to multiple simultaneous presence of limiting factors in acid soils is vital for elucidating their survival under such conditions. However, the commonalities and specificities in synthesizing secondary metabolites in roots under Al and LP stress still need to be clarified. This study used two wheat lines, Fielder (Al-tolerant and P-efficient) and Ardito (Al-intolerant and P-inefficient), revealing their flavonoids and carbohydrates profiles and investigating the synthesis mechanisms in two genotypes by integrating transcriptomic and metabolite analyses.
Secondary metabolites, such as phenylpropanoids and flavonoids, play a crucial role in plant growth and development [
15]. Flavonoids are involved in plant resistance to Al by forming Al-chelating complexes or scavenging free radicals through their Al-binding affinity [
17]. Flavonoids facilitate P solubilization and cooperate with beneficial microorganisms in the rhizosphere, contributing to P acquisition and utilization [
16,
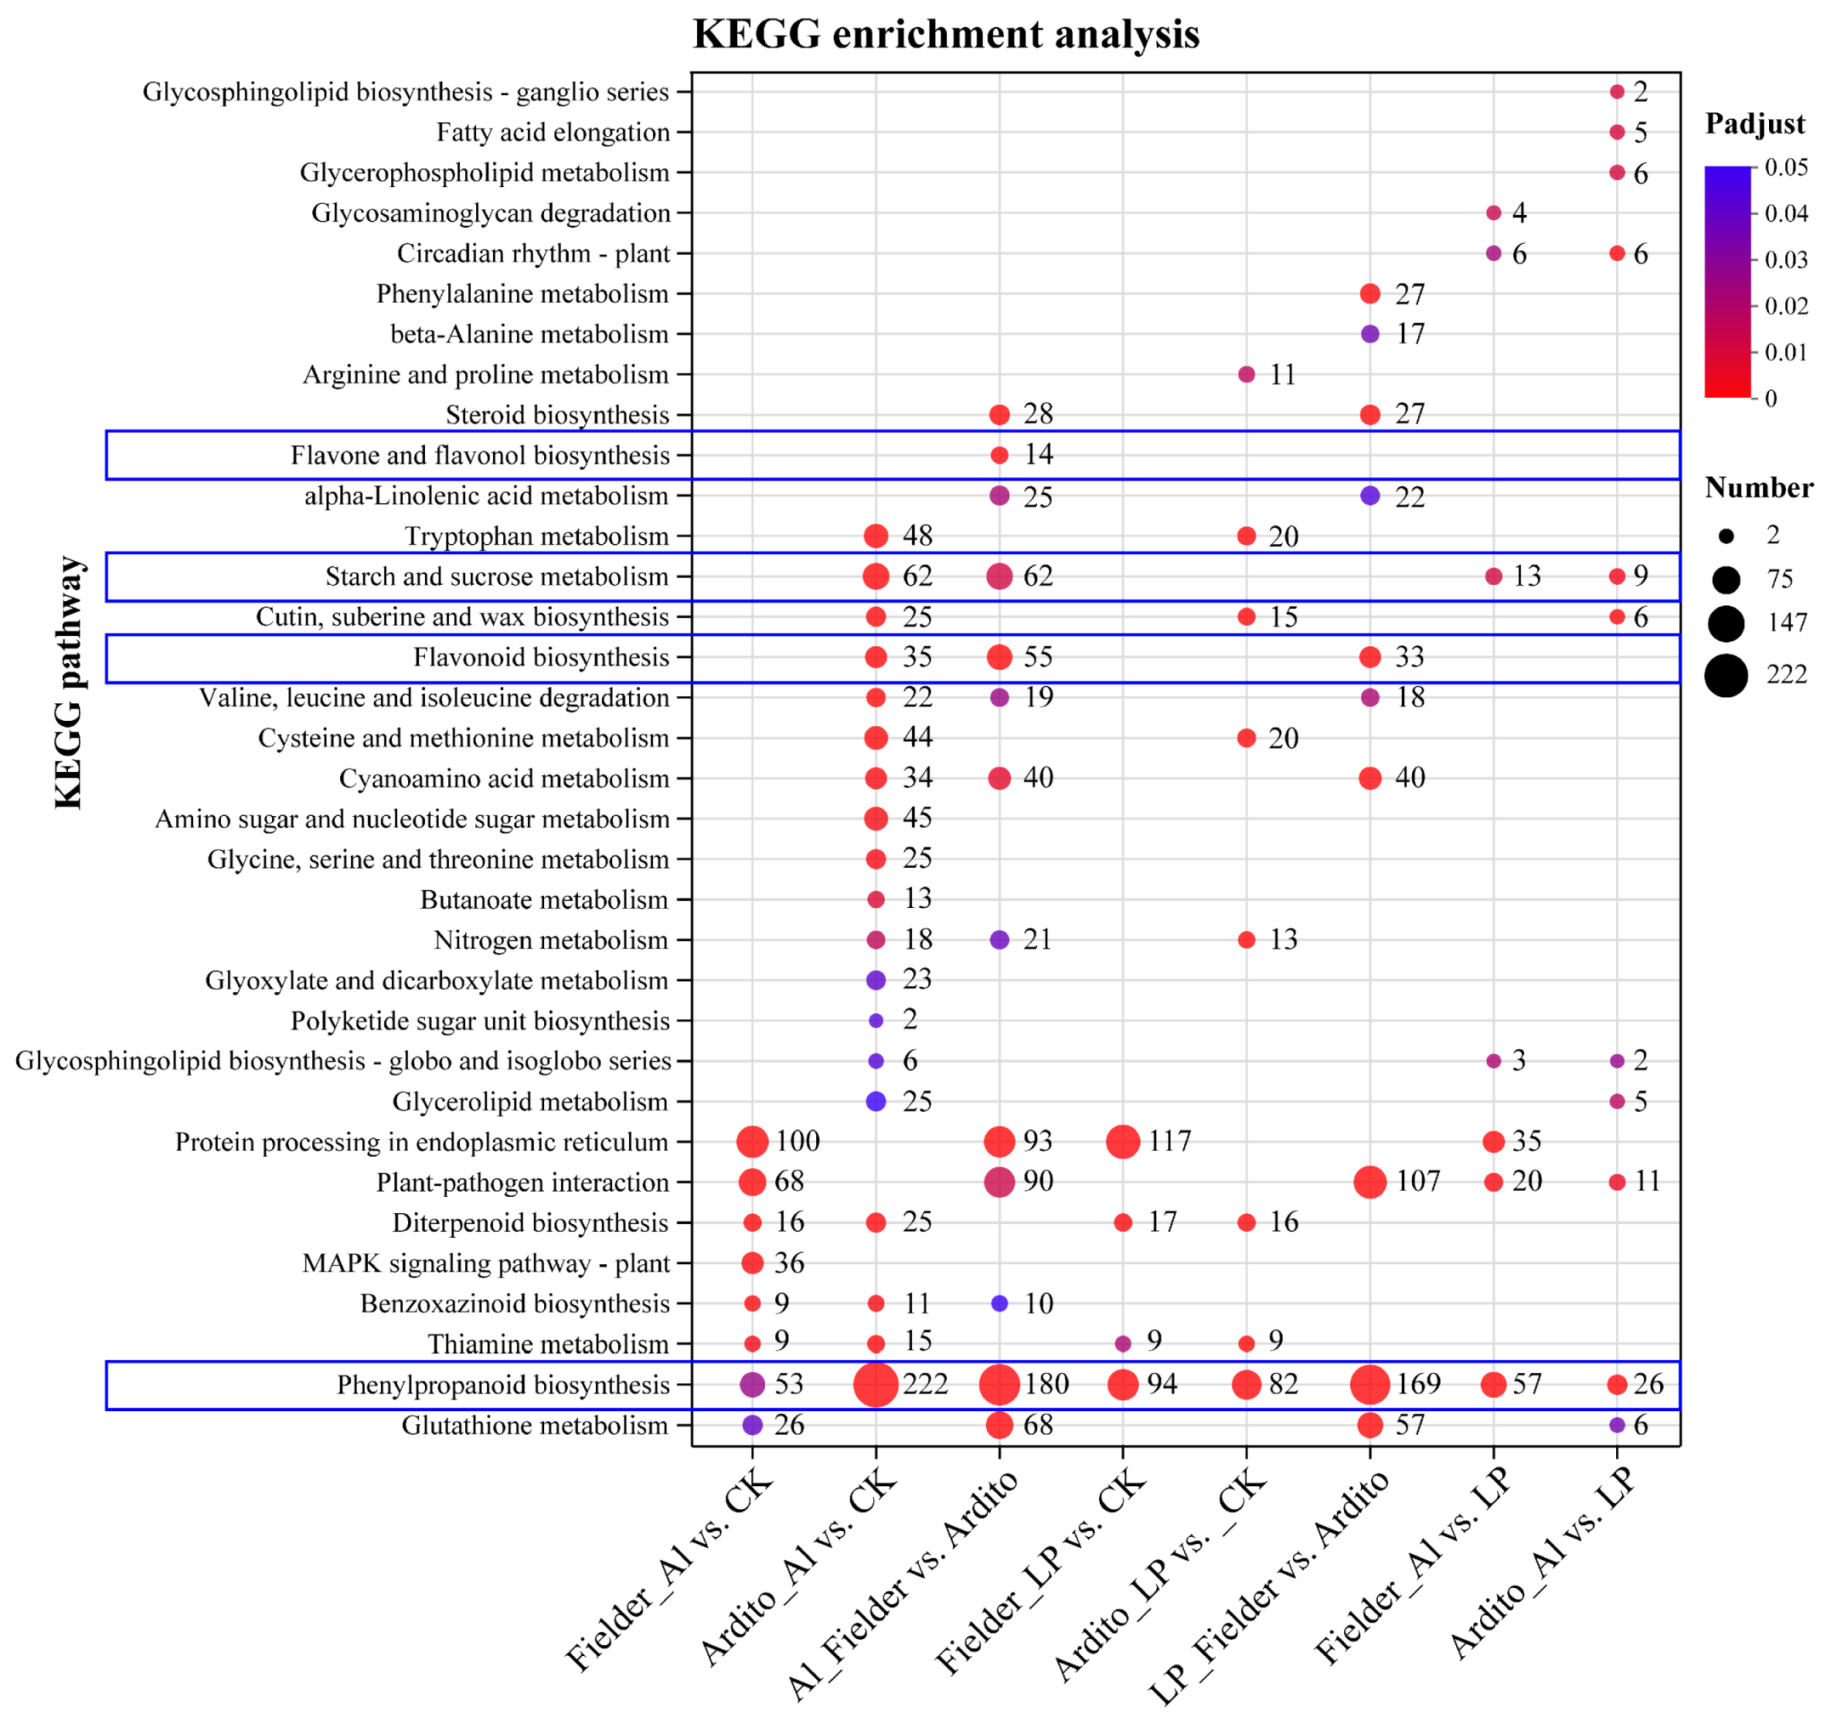
23]. However, the commonalities and differences in the content of flavonoids and the molecular mechanisms of flavonoid biosynthesis in wheat roots under Al and LP are still unclear. The KEGG enrichment analysis results showed that several DEGs were enriched in the phenylpropanoid, flavonoid, and flavone and flavonol biosynthesis pathways under Al and LP stresses in the two wheat genotypes (
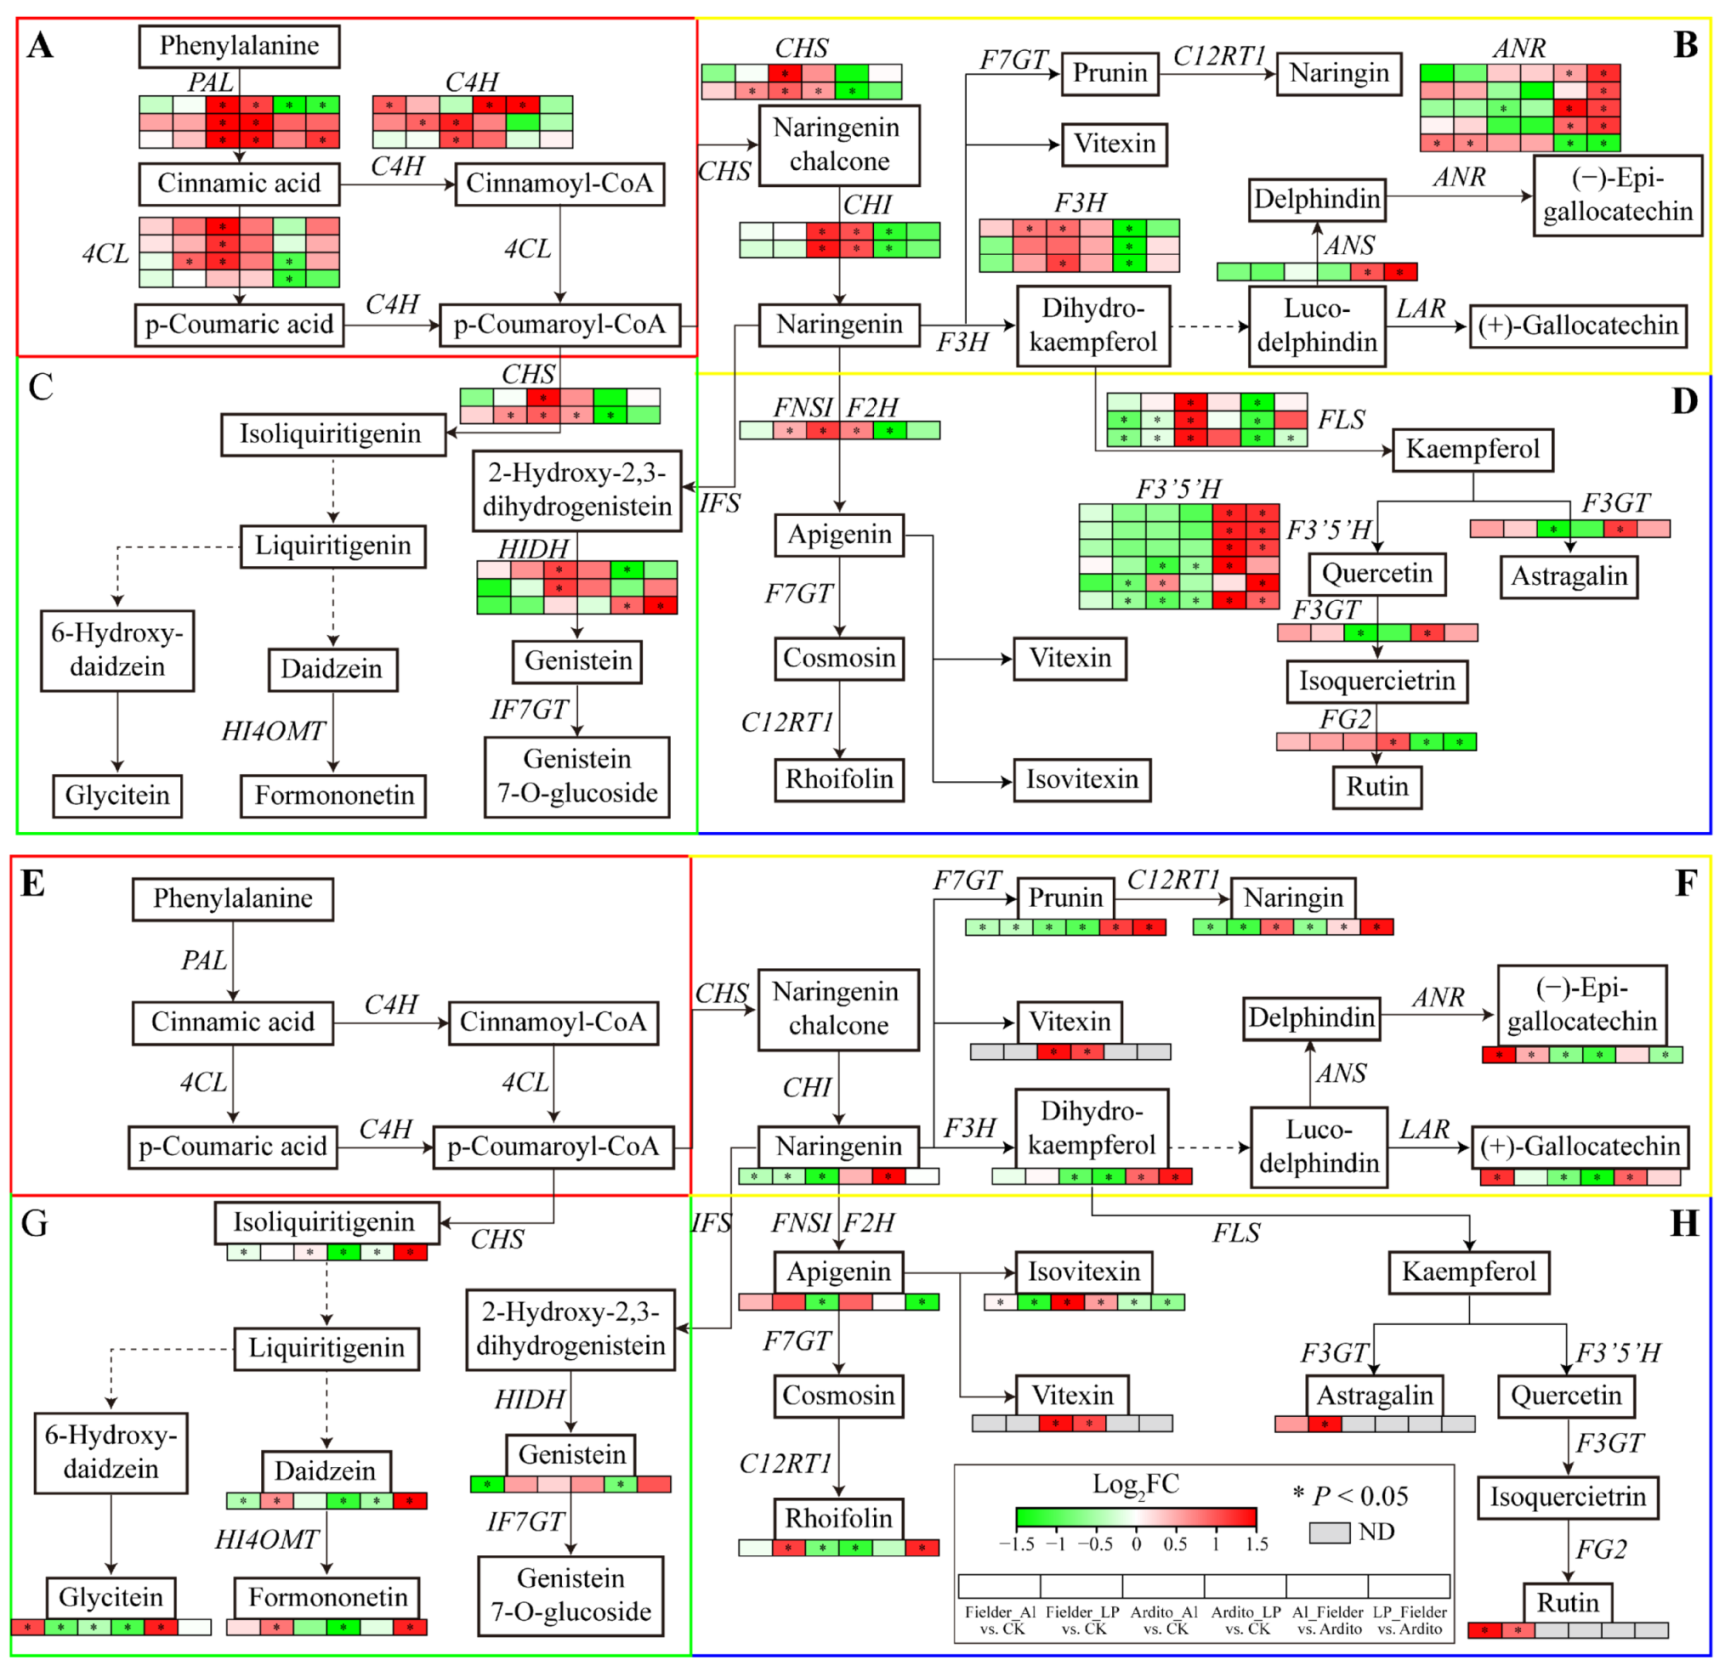
Figure 3). However, the response of secondary metabolism-related genes in Al and LP differs. For instance, the genes encoding 4CL, CHS, F3H, and FNSI were upregulated under LP but not significantly under Al in Fielder. The genes encoding 4CL, CHS, F3H, FLS, and HIDH were significantly upregulated, and the genes encoding ANR and F3GT were downregulated under Al but not significantly under LP in Ardito. The flavonoid-targeted metabolomics results showed that 19 differential flavonoid metabolites significantly influenced two wheat roots (
Table S8). The (−)-epigallocatechin and rutin contents were increased under Al and LP; the (+)-gallocatechin, astragalin, rhoifolin, daidzein, and formononetin contents were increased under LP but not significantly under Al in Fielder. The vitexin and isovitexin contents were increased under Al and LP; the naringin and isoliquiritigenin contents were increased under Al but not significantly under LP in Ardito. Due to the inability to balance the absorption of Al and P by altering the root structure, plants have developed internal and external mechanisms to resist Al toxicity and P deficiency [
7]. Like organic acids, flavonoids participate in internal and external Al detoxification by forming solid complexes with toxic Al ions [
17,
24]. The accumulation of flavonoids in roots can alter the structure of plant roots (internal mechanism) and release them to dissolve soil P (external mechanism), thereby obtaining more Pi [
25,
26]. Transcriptome and metabolomics consistently indicate that flavonoid metabolism in roots significantly impacted in both wheat genotypes, but the difference between the Al and LP stress. The flavonoid genes and metabolites respond more to LP than Al in Fielder, suggesting that the increased synthesis of flavonoids in roots mainly contributes to secretion outside of the wheat roots (external mechanism), which facilitates the acquisition of Pi and can also bind to Al outside the roots to prevent it from entering root cells. While, in Ardito, the increased synthesis of flavonoids in the roots may play a more significant role within the roots (internal mechanism), as they respond more actively to Al stress and bind with Al entering the cells, leading to a decrease in P absorption. These results suggest that the difference in response of flavonoids in Al and LP is the reason for the difference in tolerance between the two wheat genotypes. In addition, the content of some flavonoids, including (−)-epigallocatechin, rutin, vitexin, and isovitexin increases under both Al and LP stress in two wheat genotypes, play a joint role in clearing ROS caused by Al and LP stress [
7,
27].
Carbohydrate metabolism comprises sugar, glycolysis, TCA cycle, and organic acids metabolism. Sucrose is the end product of photosynthesis and is responsible for energy metabolism and the synthesis of complex carbohydrates. ATP in plant cells is mainly generated by the TCA cycle in the mitochondria [
18,
28]. The transcriptome data showed that several DEGs were enriched in starch and sucrose metabolism, glycolysis/gluconeogenesis, and the TCA cycle pathways (
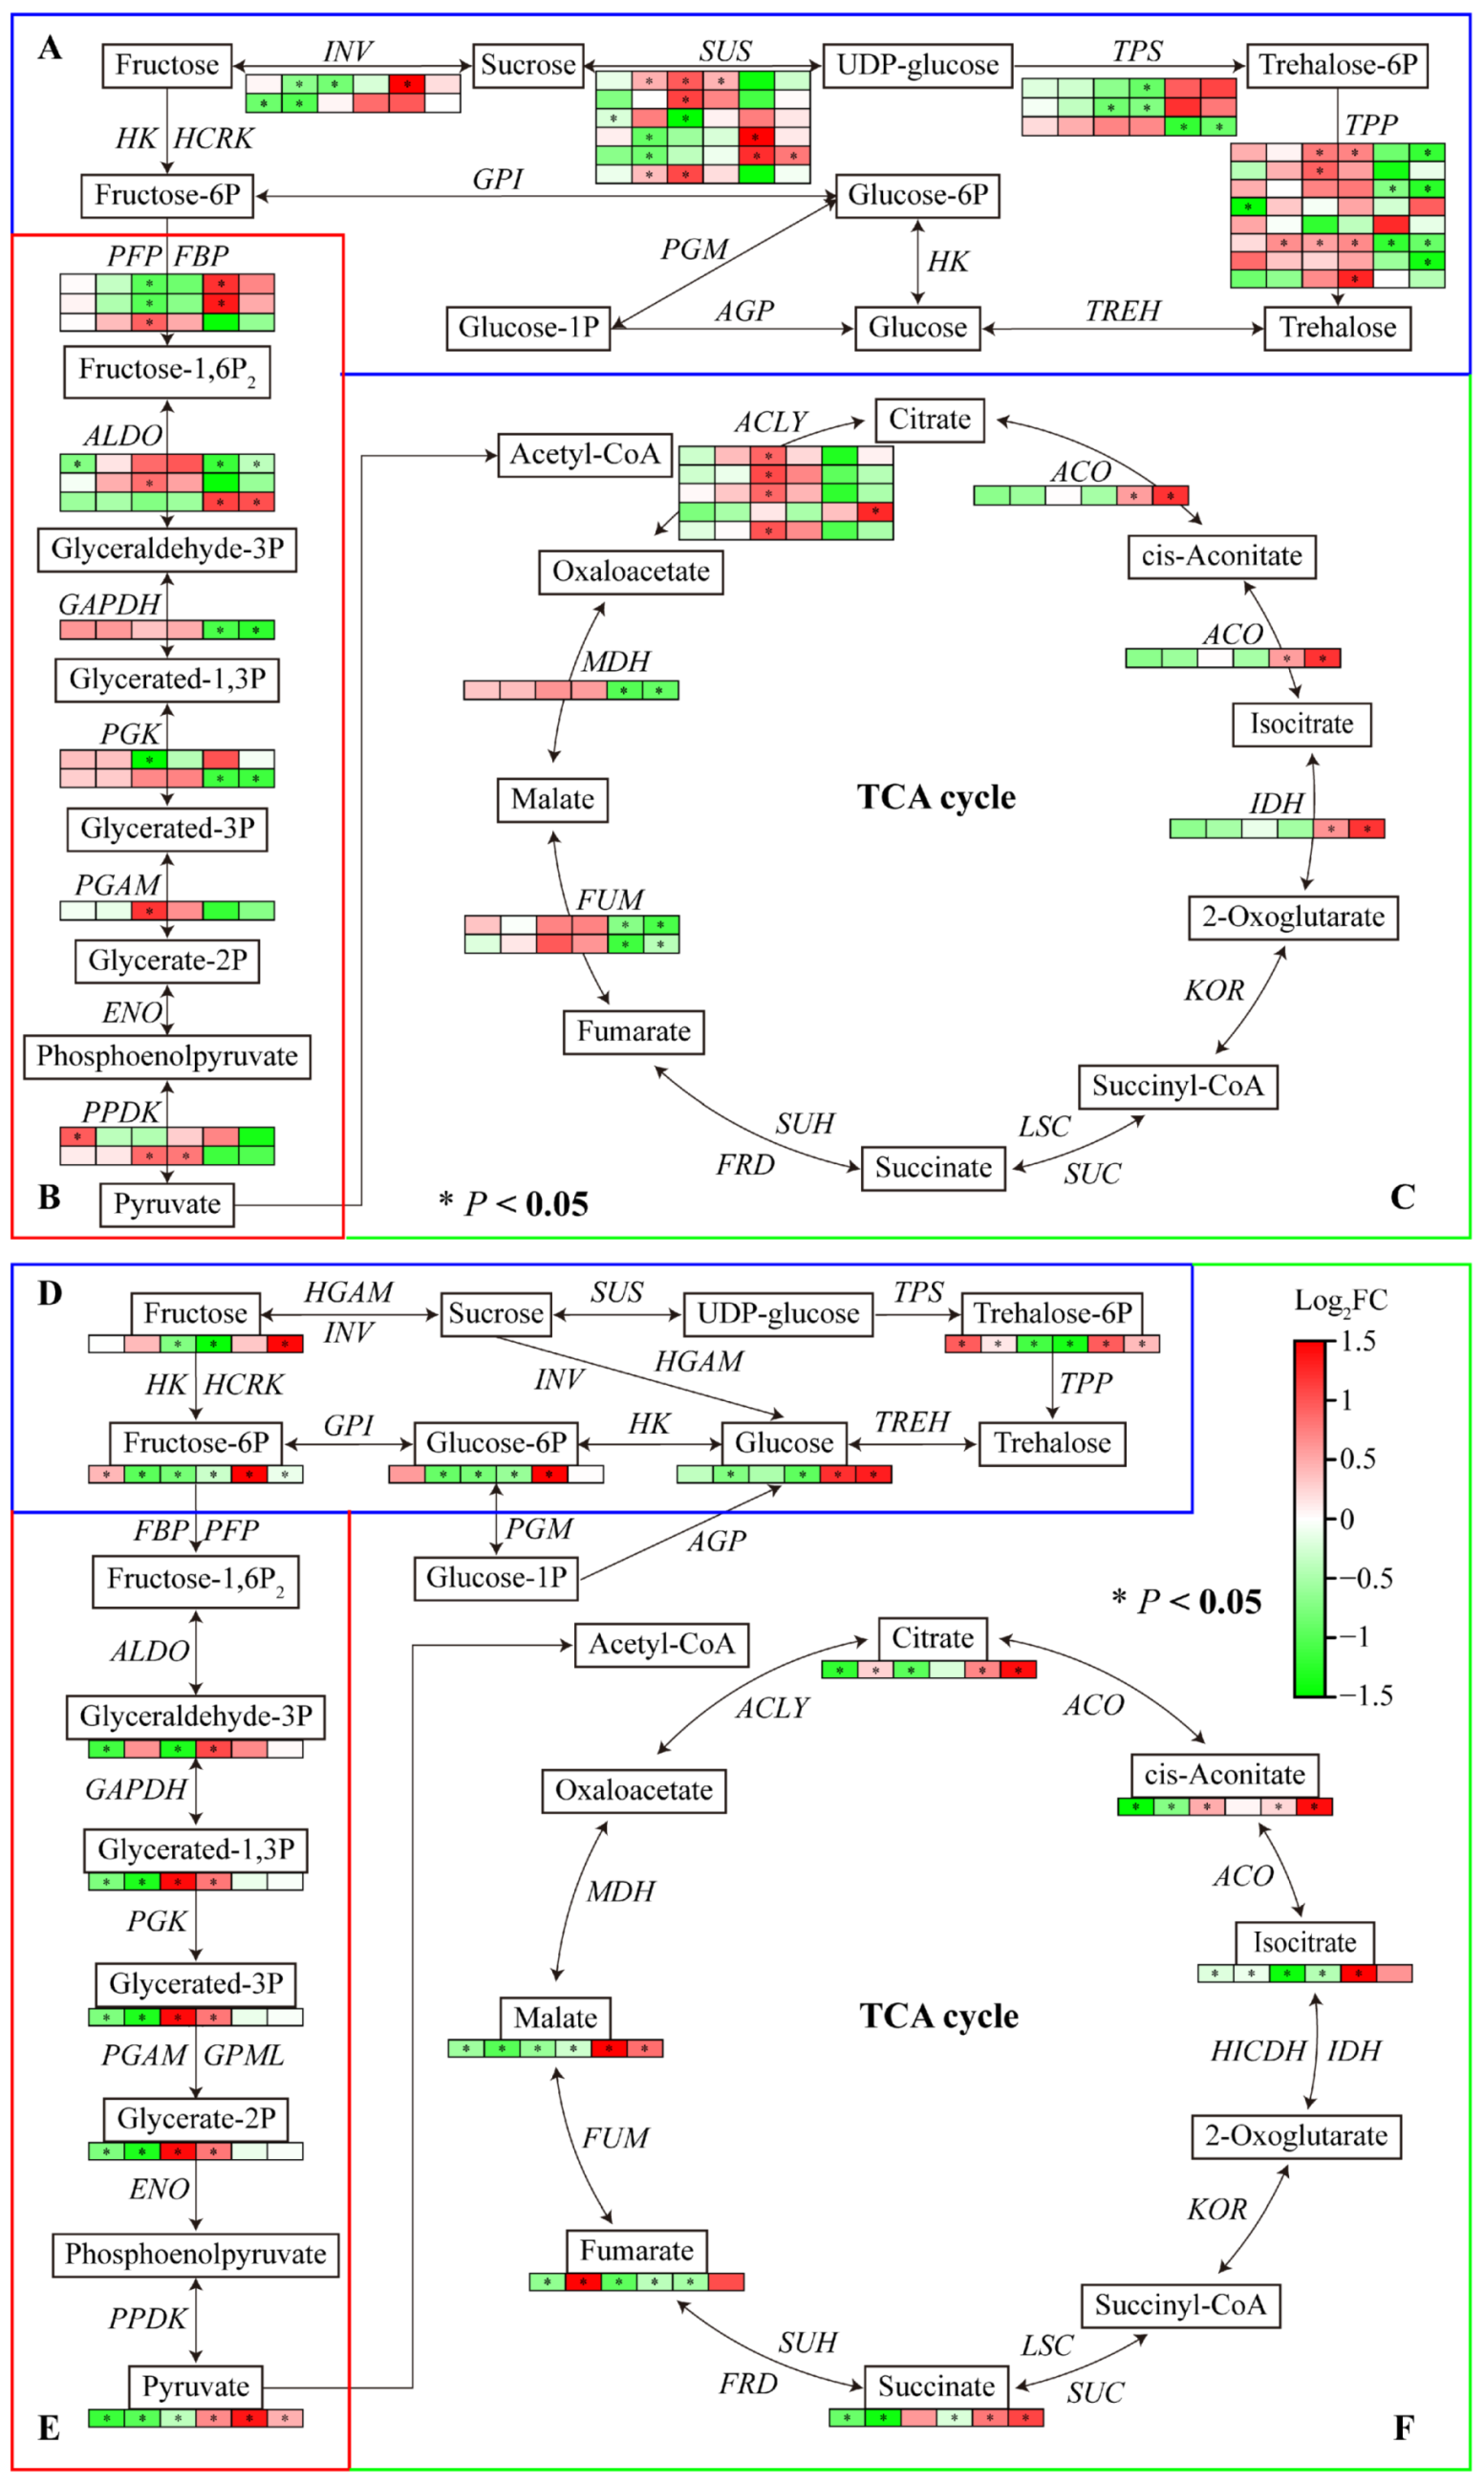
Figure 4). Al and LP reduced the carbohydrate genes and metabolites in two wheat genotypes but showed an upregulation compared to Fielder and Ardito (
Figure 7). Al-toxicity reduced energy (ATP) production and accumulation in rice roots, and nonstructural carbohydrates can directly provide energy for plant growth [
29]. Pi-deficiency increases carbohydrate translocation via the phloem to roots to favor root growth for better acquisition of Pi from soil [
30]. In the previous study, the root and shoot glucose, fructose, sucrose, and starch contents in P-tolerant genotype cotton Jimain169 were increased than P-intolerant genotype one DES926 [
28]. The P-efficient genotype had a more remarkable ability to maintain phosphorylated sugars (i.e., glucose-6-P and fructose-6P) by upregulating the genes involved in glycolysis, starch, and sucrose synthesis that are important for glycolysis as well as the biosynthesis of sugars and starch in rice and cotton [
20,
31]. The Al-tolerant rice cultivar [
19] and Citrus species [
32,
33] could provide more glycolytically yielded energy (ATP) by enhancing the glycolytic pathway in Al-stressed roots. The genes encoding INV, SUS, PFP, ALDO, ACLY, ACO, and IDH were significantly upregulated compared to Fielder and Ardito under Al and LP. Consistent with the transcriptome results, the carbohydrate-targeted metabolomics results showed that the glucose, glucose-6P, fructose, fructose-6P, trehalose-6P, pyruvate, citrate, cis-aconitate, isocitrate, and succinate contents were significantly higher in Fielder than in Ardito (
Figure 7). The accumulation of the carbohydrate metabolites in the roots showed that the injury level under Al and LP in Fielder was lower than in Ardito. The transcriptome and metabolome consistently suggested that Al and LP stress significantly impact on the carbohydrate metabolism of roots. The difference between the genotypes suggested that carbohydrate metabolism is critical to improving the tolerance against Al toxicity and P deficiency.
Transcription factors (TFs) proteins play crucial roles in regulatory and signaling networks to respond to Al and LP conditions [
7]. AtSTOP1 and OsART1 are two related members of the Cys
2His
2-type zinc-finger (C
2H
2) protein family TF that confer Al resistance functions in
Arabidopsis and rice [
34]. Phosphate starvation response (PHR) transcription factors, such as AtPHR1 in
Arabidopsis and OsPHR2 in rice, serve as central regulators of systemic Pi signaling. AtPHR1/OsPHR2 activates the expression of a large set of low-Pi responsive genes by binding to PHR1 binding site (P1BS) elements [
3]. TFs may offer the best option for pleiotropic control of multiple abiotic stress genes due to their small and often multiple binding sequences in the genome. TFs such as C
2H
2, MYB, WRKY, ERFs, NAC, and bHLH may be critical determinants for a plant’s ability to tolerate Al toxicity and P deficiency and withstand drought conditions in acid soil [
14]. Promising connections may also exist between plant adaptation to Al toxicity and P deficiency through the regulation of TFs [
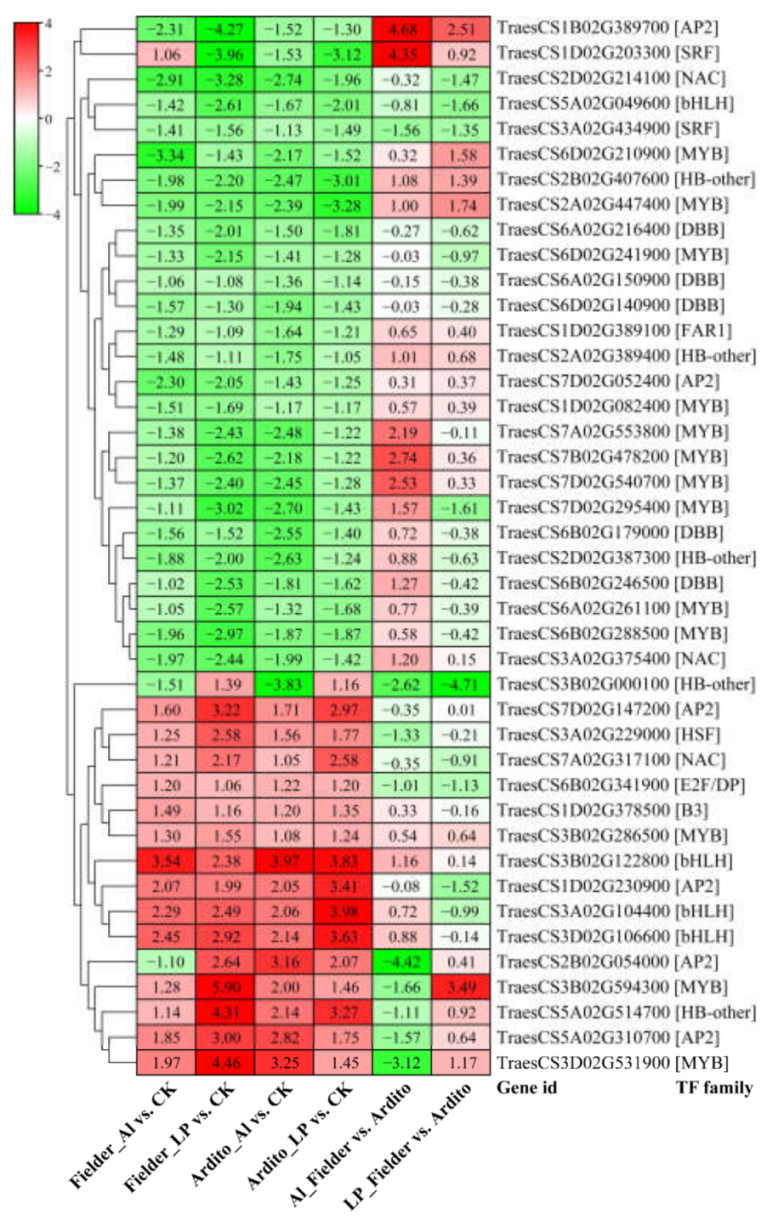
14]. The transcriptome results showed that 42 TFs, including MYB, bHLH, NAC, and AP2/ERF, were differentially expressed simultaneously under Al and LP stresses. Importantly, their expression changes after Al and LP treatments are similar, indicating that these TFs were associated with response to Al toxicity and P deficiency. Several TFs have been identified as hub genes involved in flavonoid, carbohydrate, and P metabolism [
28]. MsMYB741 transcriptionally activates
MsPAL1 and
MsCHI expression to increase flavonoid accumulation in roots and secretion from root tips, leading to increased resistance of alfalfa to Al stress [
17]. MhMYB15 actively responds to
Bacillus B2, regulating the accumulation of flavonoids and phosphorus uptake, thereby influencing plant growth and development [
35]. MYB-related transcription factor PHR1 is involved in carbohydrate metabolism. The knockout mutant has an altered phosphate (Pi) allocation between root and shoot and accumulates less anthocyanins, sugars, and starch than P-starved WT [
36]. Thirteen common MYB TFs were identified, suggesting that MYB TFs may be involved in flavonoid and carbohydrate metabolism; regulating targeting these TFs is a valuable approach for molecular breeding of plants towards regulating tolerance to Al and LP.
4. Materials and Methods
4.1. Plant Materials and Treatment
Based on the morphological performance in preliminary experiments, two wheat genotypes, Fielder (Al-tolerant and P-efficient) and Ardito (Al-sensitive and P-inefficient) were used in this study. Healthy seeds were surface-sterilized in a solution of 0.5% NaClO (v/v) for 30 minutes and then rinsed thoroughly with deionized water. These sterilized seeds were then placed on wet paper in a petri dish for 4 days at 4°C for germinating. Uniform seedlings were selected and transferred to a 10 L barrel with continuously aerated 1/5 Hoagland nutrient solution (pH 4.2) for a 2-day acclimation to low pH. Subsequently, the seedlings were subjected to stress by replacing fresh 1/5 Hoagland nutrient solution with an addition of 50 µM KAl(SO4)2 (for Al stress), a reduced NaH2PO4 (2 µM, for LP stress), and normal Pi levels (200 µM, for control). The growth chamber environments were 14/10 h of light/dark period, 60-80% relative humidity, 23°C, and 400 μmol m−2·s−1 illumination level. Each treatment was replicated three times (3 barrels), and the pH of the solution was maintained at 4.2 by adding 0.5 mM HCl. After 4 d of treatments, about 1 cm in length wheat root apices were harvested separately in triple biological repeats, immersed immediately in liquid nitrogen, and stored at −80°C until transcriptomic and metabolomic analyses were conducted. All chemicals used were of analytical grade and were purchased from Sigma-Aldrich (St. Louis, MO, USA).
4.2. RNA Extraction, Library Preparation, Sequencing, and Read Mapping
The total RNA was separately extracted from the collected 1-cm root apices using TRIzol reagent (Invitrogen Co., Carlsbad, CA, USA) following the manufacturer’s instructions. Subsequently, the Plant RNA Purification Reagent (Invitrogen) was employed to purify the RNA samples. The quality, quantification, and integrity were determined using a 5300 Bioanalyser (Agilent Co., Santa Clara, CA, USA) and ND-2000 (Thermo Fisher NanoDrop, Waltham, MA, USA), respectively. RNA samples meeting the integrity number values above 7.5, the total amount of ≥ 1 ug, and 28S: 18S ≥ 1.0 were utilized to construct the transcriptome libraries for sequencing, following the manufacturer’s protocols (Illumina, San Diego, CA, USA) at Majorbio Bio-pharm Biotechnology Co., Ltd. (Shanghai, China). In brief, mRNA was isolated from the total RNA by the polyA selection method using oligo (dT) beads, followed by fragmentation into short fragments. Subsequently, cDNA was synthesized using a Superscript double-stranded cDNA synthesis kit (Invitrogen) with random hexamer primers. The synthesized cDNA was subjected to decoration according to Illumina’s library construction protocol. The cDNA target fragments of 300 bp were PCR amplified using Phusion DNA polymerase (NEB, Ipswich, MA, USA). After quantification with Qubit 4.0, the paired-end RNA-seq library was sequenced using the NovaSeq 6000 sequencer with a 2 × 150 bp read length.
Finally, 18 RNA-seq transcriptome libraries (2 genotypes × 3 treatments × 3 biological replicates) were constructed and sequenced. The raw paired-end reads were trimmed and quality controlled by FASTP [
37] with default parameters, resulting in high-quality sequencing data (clean data). Then, the clean reads were separately aligned to the wheat genome with orientation mode using HISAT2 software Ver. 2.2.1 [
38]. The mapped reads of each sample were assembled by StringTie Ver. 1.3.6 [
39] in a reference-based approach for subsequent transcript assembly and expression calculation. The assembled genes were annotated against public databases of NCBI non-redundant protein sequences (NR), Protein family (Pfam), Clusters of Orthologous Groups of Proteins (COG), Swiss-Prot, Kyoto Encyclopedia of Genes and Genomes (KEGG) and Gene Ontology (GO) libraries. The RAN-seq data were uploaded to the Comprehensive Gene Expression Database with the accession number PRJNA1033153.
4.3. Differential Expression and Functional Enrichment Analysis
The expression levels of each transcript were calculated using the Fragments Per Kilobase per Million reads (FPKM) method to identify differential expression genes (DEGs) between two different samples. The gene abundances were quantified using RSEM software [
40]. DESeq2 was used to identify DEGs based on the criteria of |log
2FC| ≥ 1 and FDR ≤ 0.05 [
41]. Cluster heat diagrams were generated using Toolkit for Biologists (TB) tools Ver. 2.042 with default settings [
42]. The Plant TFDB database was employed for transcription factors (TFs) prediction and analysis, while TFs were identified by BLAST and then subjected to functional annotation and enrichment analysis. The GO annotation information and functional classification of DEGs were performed using Blast2GO based on the GO database [
43]. KOBAS 2.0 was utilized to determine the KEGG enrichment pathways at Bonferroni-corrected
P-value ≤ 0.05, which were compared with the whole transcriptome background [
44].
4.4. Quantitative Real-Time PCR (qRT-PCR) Validation
Ten differentially expressed genes involved in phenylpropanoid and flavonoid biosynthetic pathways were selected from the RNA-seq data to validate the transcriptome results. The identical RNA/cDNAs for RNA-seq were used as templates to determine their transcript levels via the qRT-PCR method. The first-strand cDNA was synthesized using the PrimeScript™ RT Master Mix (Takara Standard Co., Osaka, Japan). The gene-specific primers were designed by Primer3 web v4.1.0 (
https://primer3.ut.ee/) and listed in
Table S1. A total of 10 μL PCR reaction mixture contained TB Green
®Premix Ex Taq™ II (Takara Standard Co., Osaka, Japan) 5 μL, 10 μM primers each 0.4 μL, cDNA template 1 μL, and ddH
2O 3.2 μL. The mixture was amplified using the LightCycler 480 machine (Roche, Basel, Switzerland) with a two-step thermal cycling method (95°C for 30 s, followed by 40 cycles of 95°C for 5 s and 60°C for 30 s). TaActin (accession number: XM_044554036.1) served as an internal control for calculating relative gene transcript levels using the 2
−ΔΔCT method [
45]. Four technical replicates were performed for qRT-PCR, and a representative result from at least three biological replicates was shown for each gene.
4.5. Targeted Metabolite Extraction and Profiling
The frozen wheat root apices were dispatched to Shanghai Majorbio Biopharmaceutical Biotechnology Co., Ltd. (Shanghai, China) for targeted metabolite extraction and analysis. Precision weighing was conducted on 0.1 g root tip samples and metabolite extraction was performed in a low-temperature environment. The supernatant was filtered through a 0.2 μm membrane and then transferred to the injection vial for analysis. Flavonoids and carbohydrates standard solutions were prepared with concentration gradients. LC-ESI-MS/MS (UHPLC-Qtrap) was used to qualitatively and quantitatively detect the target substances in the sample. The chromatographic apparatus was the ExionLCTM CAD system (AB Sciex, Los Angeles, CA, USA). The Mass spectrometry was the SCIEX QTRAP 6500+ (AB Sciex, Los Angeles, CA, USA).
The specific conditions and parameters for flavonoid determination were as follows: Agilent Poroshell 120EC-C18 (3 × 100 mm, 1.9 μm, Agilent Co., Santa Clara, CA, USA) liquid chromatography column; column temperature, 40℃; injection volume, 1 μL; Mobile phase A, 0.1% formic acid water; mobile phase B, 0.1% formic acid methanol; Negative mode detection; Curtain Gas, 35 psi; Collision Gas, Medium; IonSpray Voltage, −4500 V; Temperature, 350°C; Ion Source Gas1, 55 psi; Ion Source Gas2, 55 psi.
The specific conditions and parameters for carbohydrates determination were as follows: Waters HSS T3 (2.1 × 150 mm, 1.8 μm, Waters, Milford, MA, USA) liquid chromatography column; column temperature, 40℃, injection volume, 2 μL. Mobile phase A, 0.03% formic water; mobile phase B, 0.03% formic methanol; Positive/negative mode detection; Curtain Gas, 35 psi; Collision Gas, Medium; IonSpray Voltage, +4500/−4500 V; Temperature, 550°C; Ion Source Gas1, 55 psi; Ion Source Gas2, 55 psi.
4.6. Statistical Analysis
All data were subjected to statistical analysis using SPSS 20.0. Analysis of variance was performed on the datasets. Data are presented as the mean ± standard deviation (SD) of three independent biological experiments. The significant differences between treatments and control were determined with one-way ANOVA followed by the Dunnett post hoc test compared to the control.
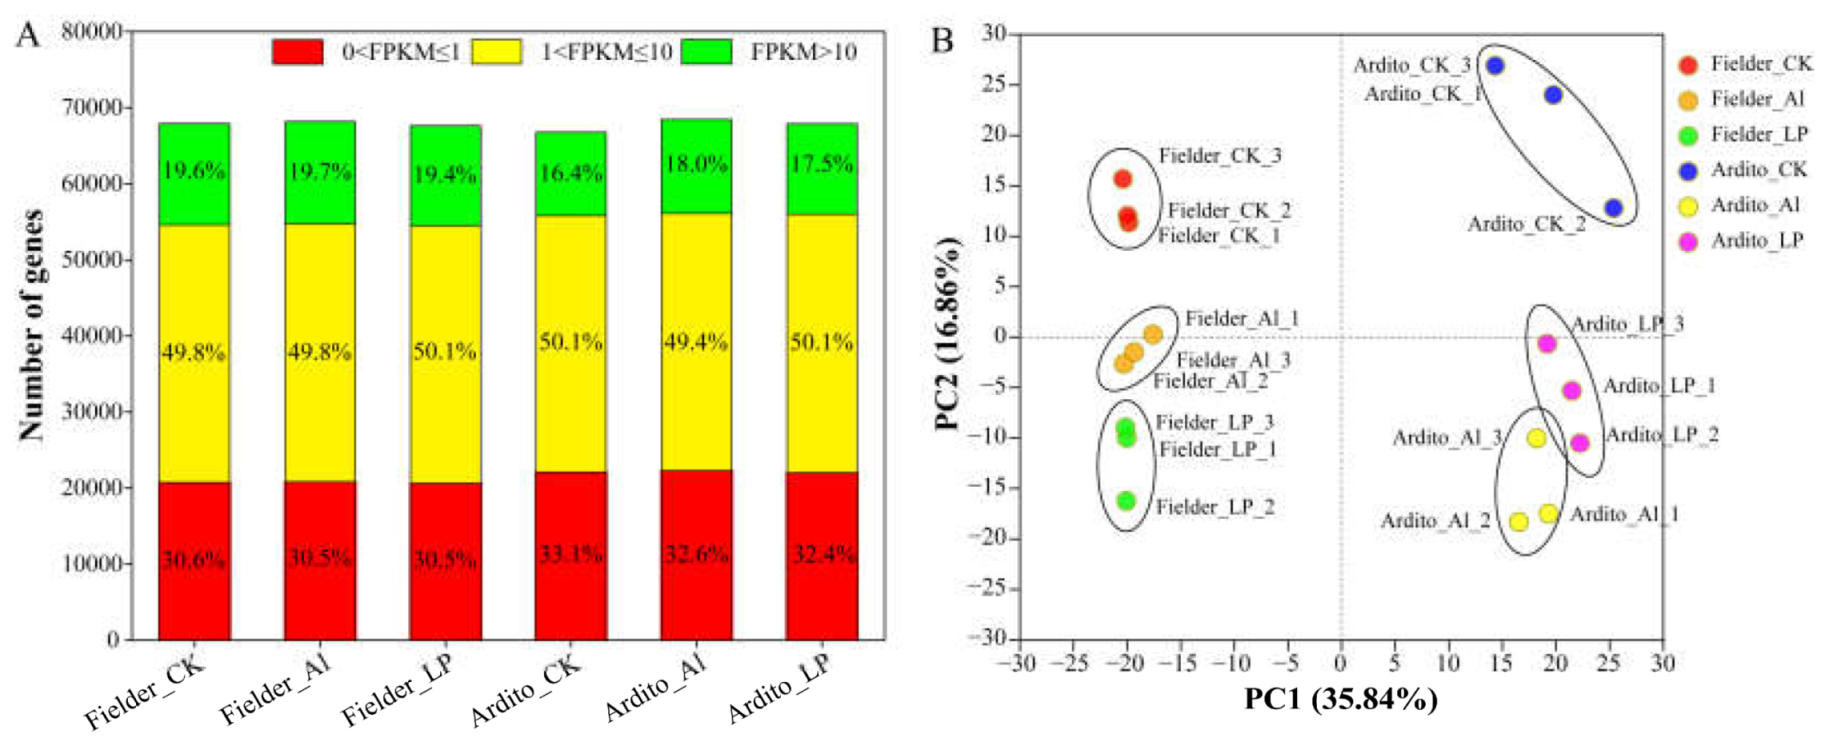
Figure 1.
Gene expression profiling in each sample. (A) Numbers of detected genes in each sample. (B) Principal component analysis (PCA) of the RNA-Seq data of each sample.
Figure 1.
Gene expression profiling in each sample. (A) Numbers of detected genes in each sample. (B) Principal component analysis (PCA) of the RNA-Seq data of each sample.
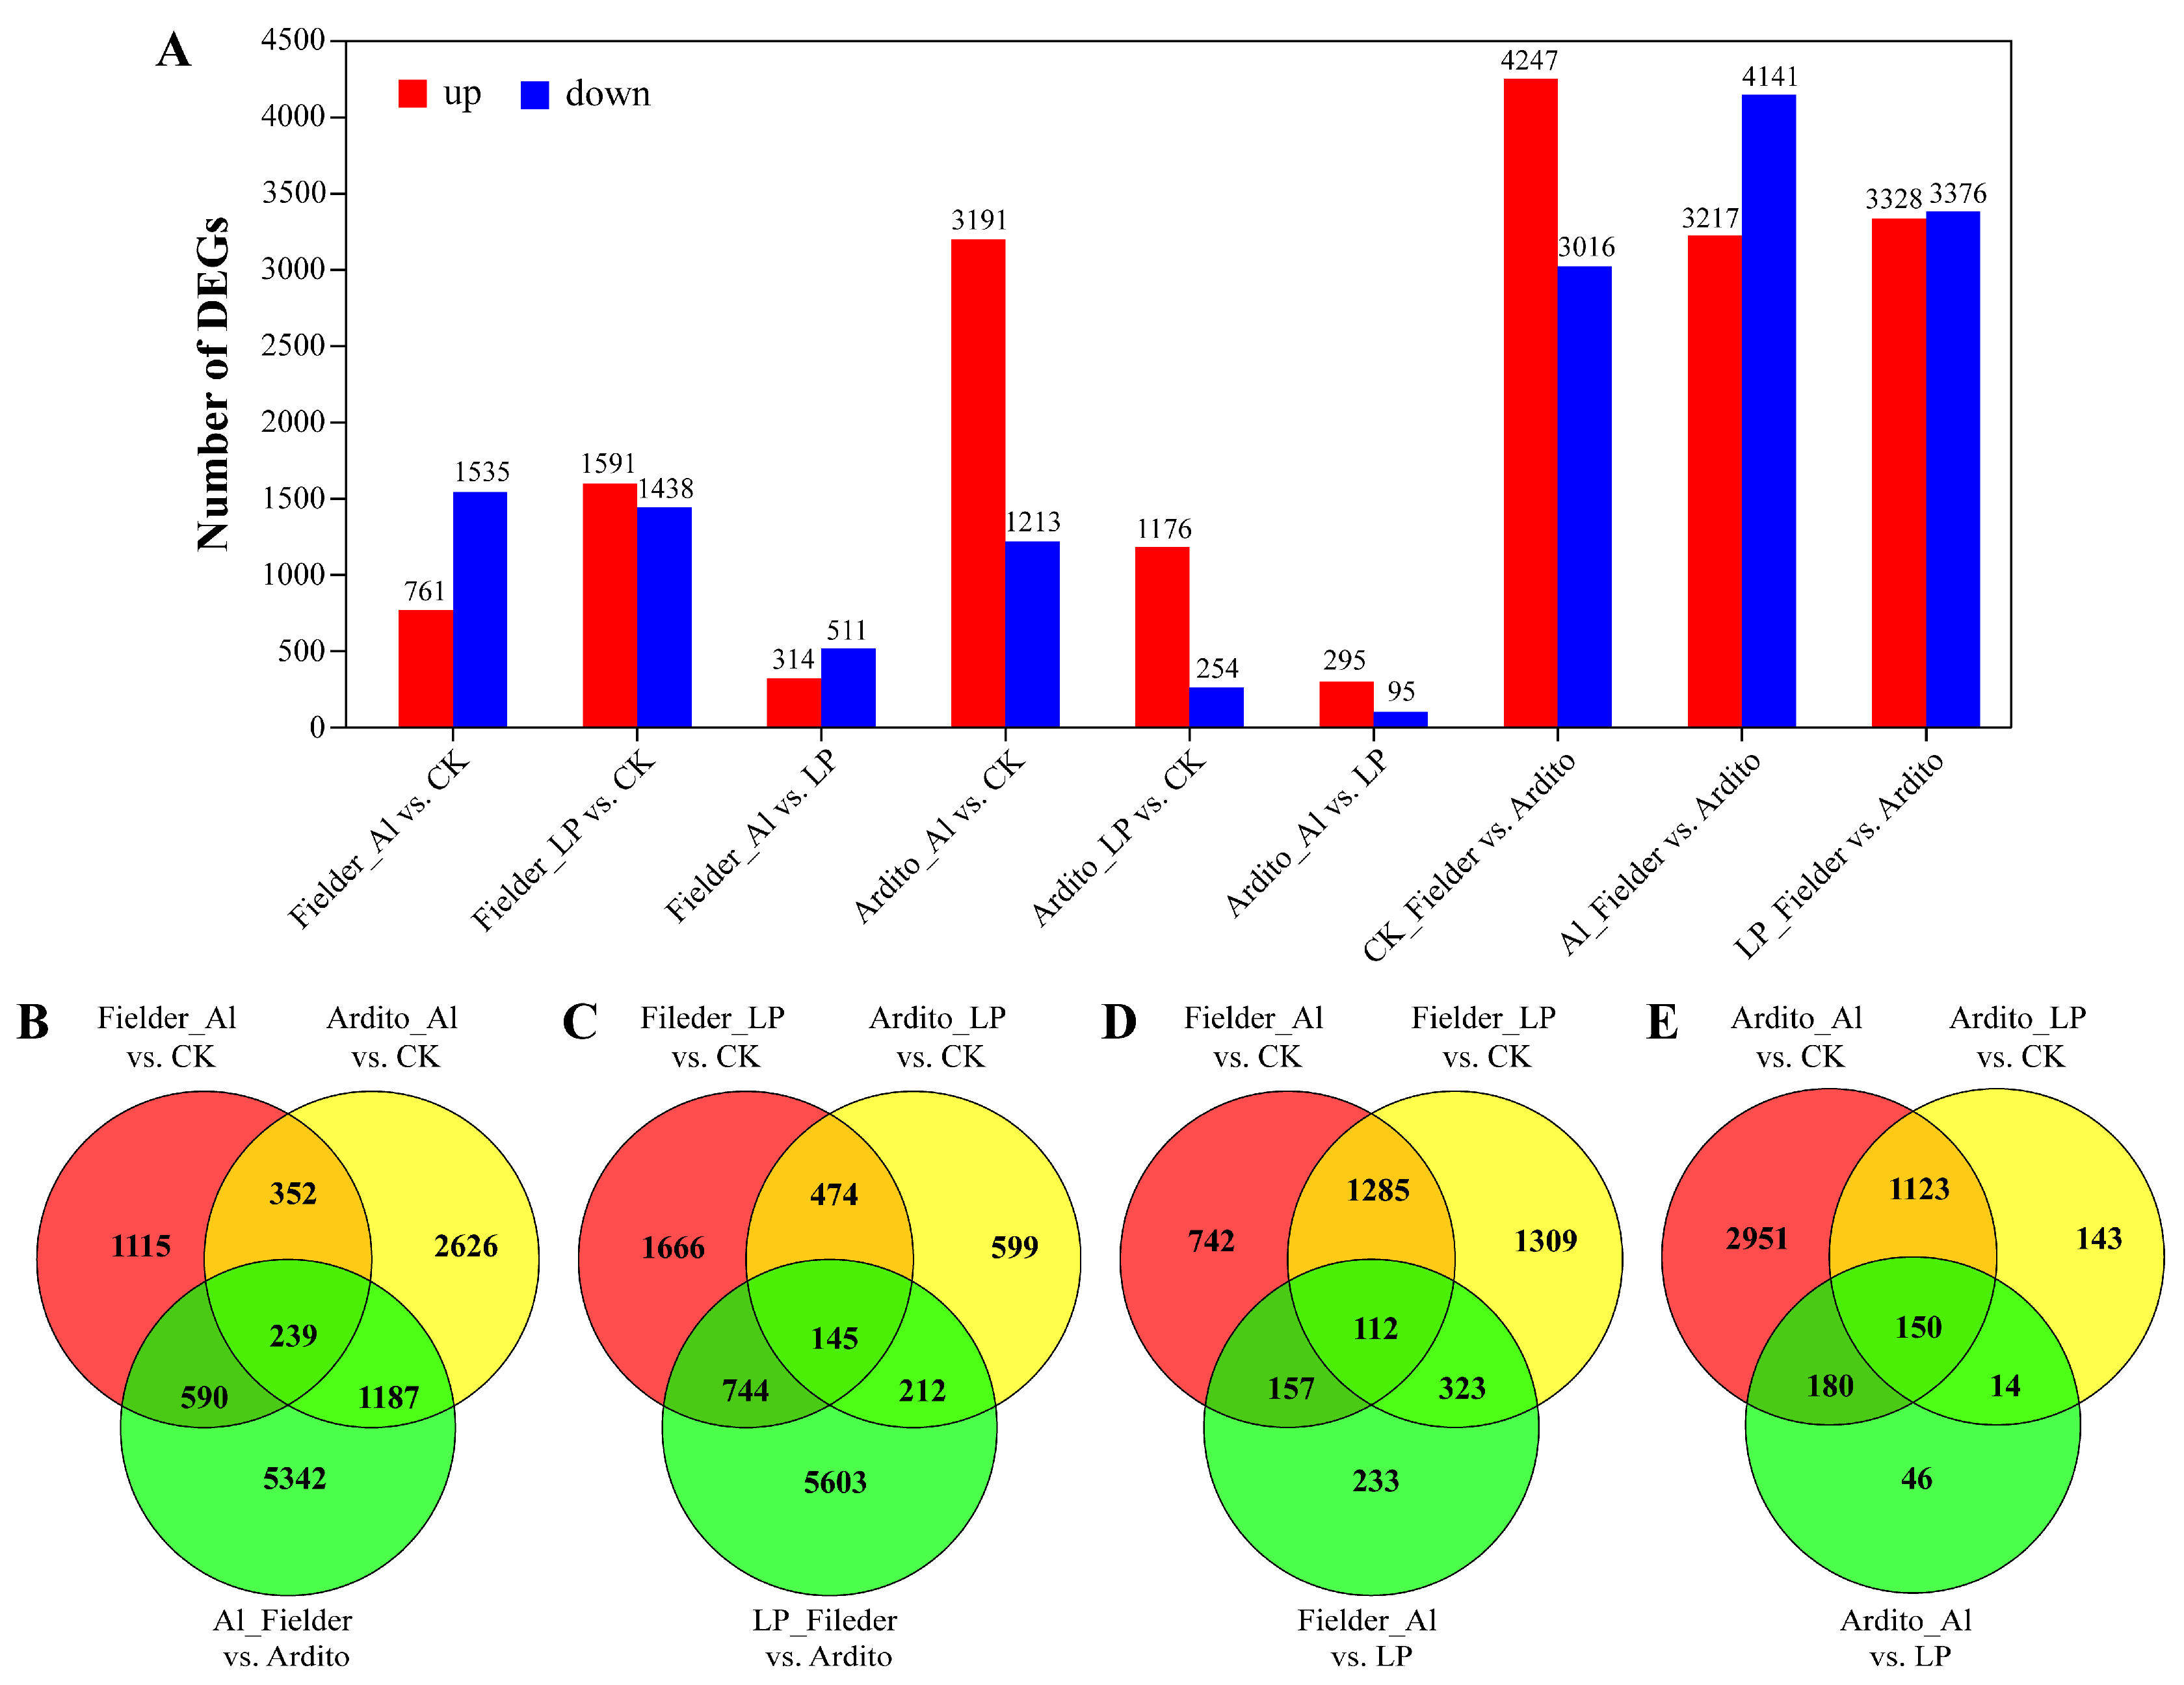
Figure 2.
Al and LP responsive gene expression profiles. (A) The number of differentially expressed genes (DEGs) in each comparison. (B-E) The Venn diagram displays the relationship between differentially expressed genes (DEGs) of various treatments Al (B) and LP (C), and varieties Fielder (D) and Ardito (E).
Figure 3.
KEGG enrichment analysis for eight DEGs under Al and LP stresses. The bubble size indicates the number of genes involved in the terms and pathways.
Figure 3.
KEGG enrichment analysis for eight DEGs under Al and LP stresses. The bubble size indicates the number of genes involved in the terms and pathways.
Figure 4.
The changes in expression of common significantly differentially expressed TFs during Al and LP stresses in the two wheat genotypes.
Figure 4.
The changes in expression of common significantly differentially expressed TFs during Al and LP stresses in the two wheat genotypes.
Figure 5.
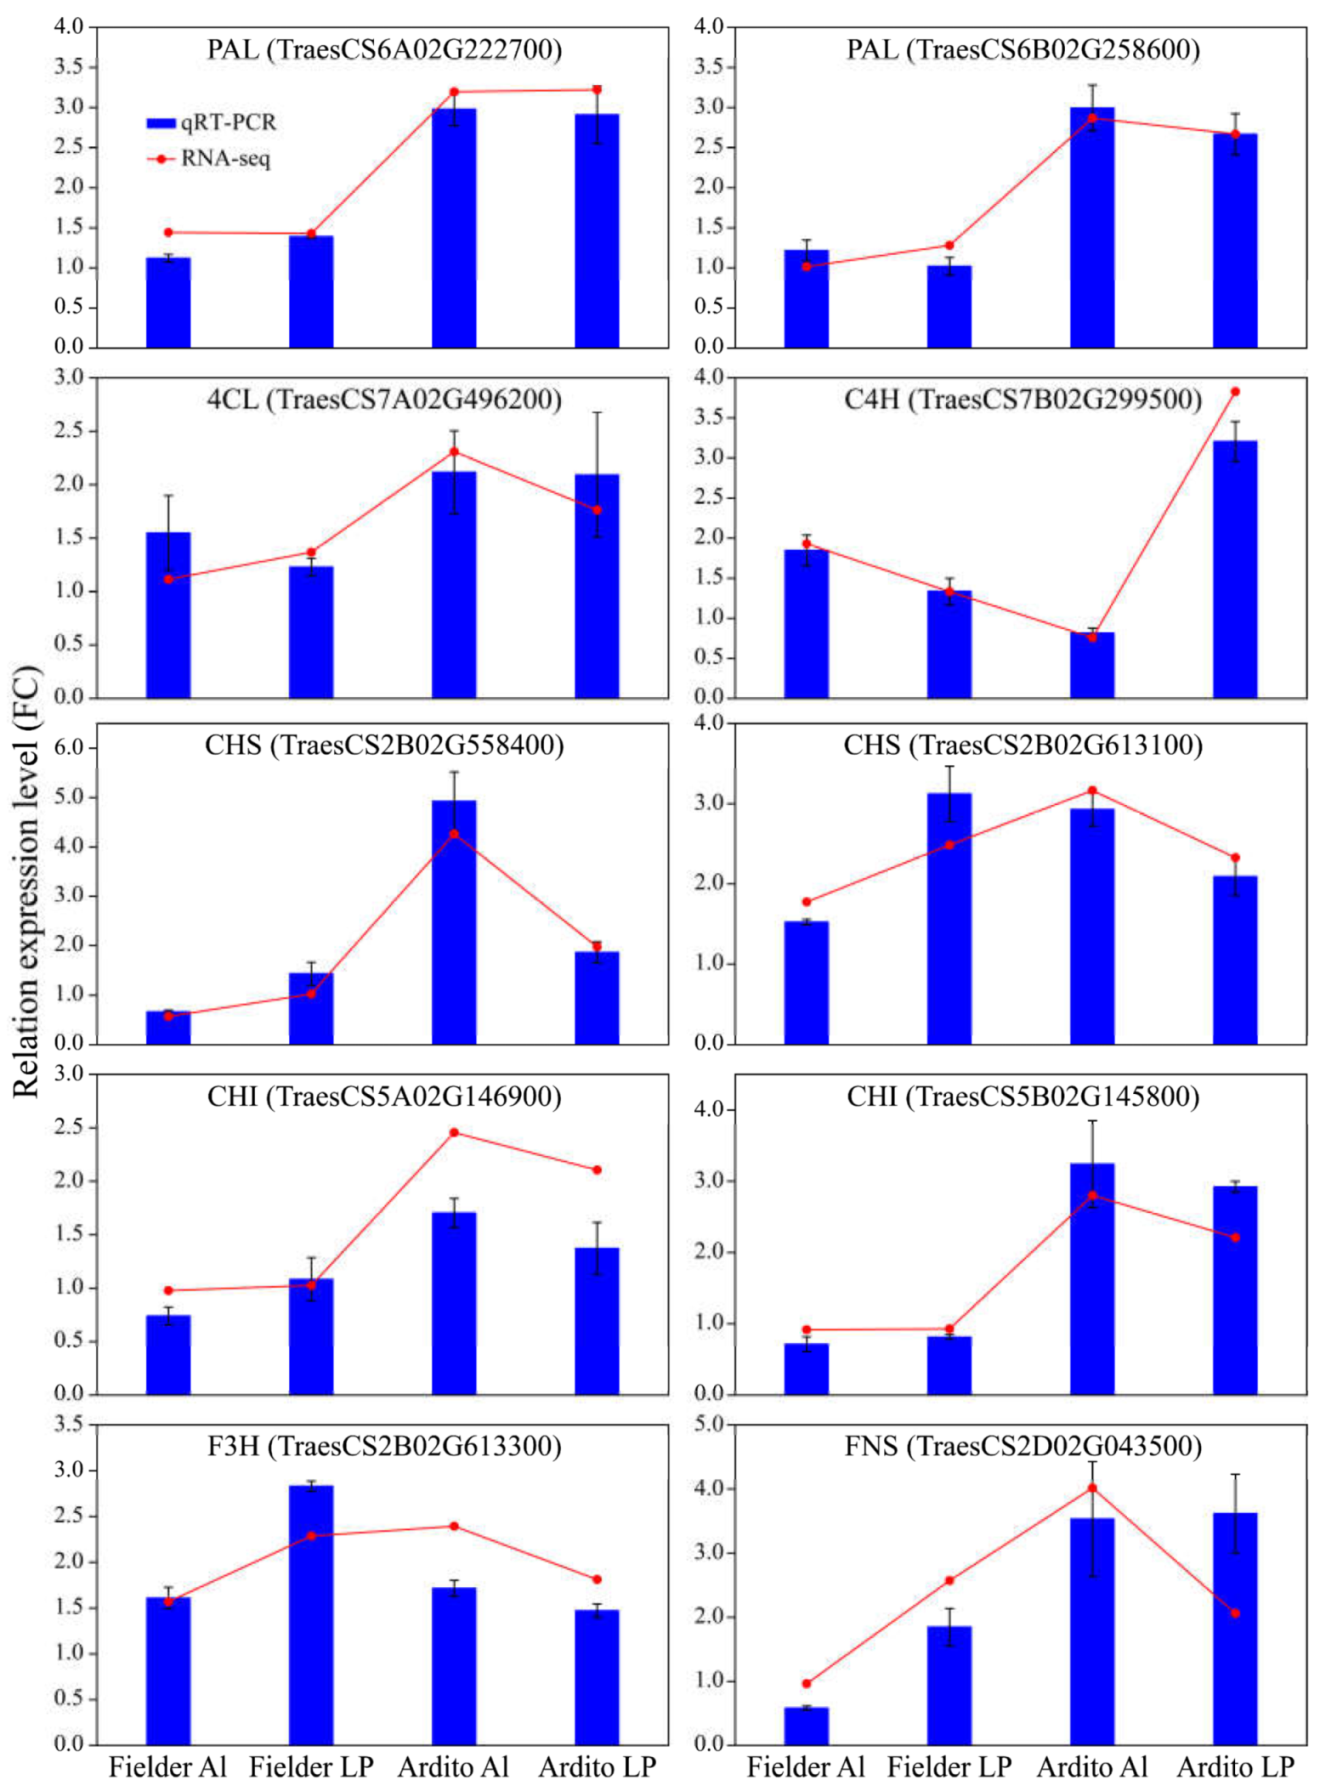
The relative expression levels detected by qRT-PCR using the 2−ΔΔCT method are shown by the blue bars, while the red line graph represents the FPKM ratio, indicating transcript abundance in the RNA-Seq data. TaActin was used as an internal control. Values are means ± SD; n = 4. PAL: Phenylalanine ammonia-lyase; 4CL: 4-coumarate-CoA ligase; C4H: Cinnamic acid 4-hydroxylase; CHS: Chalcone synthase; CHI: Chalcone isomerase; F3H: Flavanone 3-hydroxylase; FNSI: flavone synthase.
Figure 6.
Joint analysis of flavonoid metabolism genes and metabolites. The changes in expression of DEGs (A-D) and metabolites (E-H) related to the pathways of (A, E) general phenylpropanoid, (B, F) flavonoid, (C, G) isoflavonoid, and (D, H) flavone and flavonol biosynthesis under Al and LP stress in the two wheat genotypes. ND: not detected. ANS: Anthocyanidin synthase, ANR: Anthocyanidin reductase; F3’5’H: Flavonoid 3’,5’-hydroxylase; F3GT: Flavonol 3-O-glucosyltransferase; FG2: Anthocyanidin-3-O-glucoside rhamnosyltransferase; HIDH: 2-hydroxyisoflavanone dehydratase.
Figure 7.
Joint analysis of carbohydrate metabolism genes and metabolites. The changes in expression of DEGs (A-C) and metabolites (D-F) related to the pathways of (A, D) starch and sucrose metabolism, (B, E) glycolysis/gluconeogenesis, and (C, F) TCA cycle under Al and LP stress in the two wheat genotypes. TPP: Trehalose-phosphatase; TPS: Alpha, alpha-trehalose-phosphate synthase; SUS: Sucrose synthase; INV: β-fructofuranosidase; ALDO: Fructose-bisphosphate aldolase; GAPDH: Glyceraldehyde-3-phosphate dehydrogenase; PGK: Phosphoglycerate kinase; PGAM: Phosphoglycerate mutase, PFP: Phosphofructokinase; FBP: Fructose-1-6-bisphosphatase, PPDK: Pyruvate, phosphate dikinase; ACLY: ATP-citrate synthase; IDH: Isocitrate dehydrogenase; ACO: Aconitate hydratase; MDH: Malate dehydrogenase; SDH: Succinate dehydrogenase; FUM: Fumarate hydratase.
