Preprint
Article

Metalloproteomics Reveals Multi-Level Stress Response in Escherichia Coli When Exposed to Arsenite

Altmetrics

Downloads

106

Views

45

Comments

0

A peer-reviewed article of this preprint also exists.

Submitted:

08 August 2024

Posted:

09 August 2024

You are already at the latest version

Alerts
Abstract
The arsRBC operon encodes a 3-protein arsenic resistance system. ArsR regulates the transcription of the operon, while ArsB and ArsC are involved in exporting trivalent arsenic and reducing pentavalent arsenic respectively. Previous research in Agrobacterium tumefaciens 5A demonstrated ArsR has regulatory control over a wide range of metal related proteins and metabolic pathways. We hypothesized that ArsR has broad regulatory control in other Gram-negative bacteria and set out to test this. Here, we use differential proteomics to investigate changes caused by the presence of the arsR gene in human microbiome-relevant Escherichia coli during arsenite (AsIII) exposure. We show that ArsR has broad-ranging impacts such as the expression of TCA cycle enzymes during AsIII stress. Additionally, we found that the Isc [Fe-S] cluster and molybdenum cofactor assembly proteins are upregulated regardless of the presence of ArsR under these same conditions. An important finding from this differential proteomics analysis was the identification of response mechanisms that were strain, ArsR, and arsenic specific, providing new clarity to this complex regulon. Given the widespread occurrence of the arsRBC operon, these findings should have broad applicability across microbial genera, including sensitive environments such as the human gastrointestinal tract.
Keywords: 
Subject: Biology and Life Sciences  -   Biochemistry and Molecular Biology

Introduction

Arsenic is a toxic carcinogen that is ubiquitous in the environment [1]. Environmental arsenic is most commonly found in one of two inorganic forms; trivalent (arsenite, AsIII) and pentavalent (arsenate, Asv) species. While both AsIII, and AsV are toxic to organisms, AsIII is generally the more toxic form [2,3]. Despite the known toxicity, millions of people across the world consume drinking water above the WHO-recommended concentration of 5 ppb, emphasizing that arsenic remains a global health concern [4].
Due to its pervasiveness in the environment, organisms have developed resistance and detoxification mechanisms against AsIII and AsV [5,6,7,8]. The proteins responsible for this in prokaryotes are encoded by genes arranged on ars operons [9]. In Escherichia coli, it is a single arsRBC operon that encodes for ArsR, a transcriptional repressor, ArsB, an arsenite efflux pump, and ArsC, an arsenate reductase [8,10]. AsIII competitively binds to ArsR, causing a conformational change that results in ArsR releasing from the ars promoter, and increasing transcription of the operon. ArsC reduces AsV to the more toxic AsIII. This counterintuitive transformation is believed to be advantageous because AsIII can be actively exported from the cell by ArsB. E. coli strains harboring the arsRBC operon have increased resistance to arsenic toxcicity [11].
Recent reports have shown that ArsR is involved in regulation beyond that of the ars operon. Agrobacterium tumefaciens 5A has an intricate relationship with arsenic. This organism has an arsenite oxidation system that can produce energy under low phosphate conditions [12,13]. In addition, it has two arsenic detoxication loci that contain arsRBC-like genes encoding for a total of four ArsR proteins (ArsR1-4) [12]. Differential transcriptomics of individual arsR knockouts showed that these ArsR proteins have wide-scale regulatory influences across all physiological processes [14]. Furthermore, the ArsR proteins displayed a regulatory hierarchy of each other’s transcription. All of these arsR genes were shown to regulate metal homeostasis proteins.
We have previously investigated the effects that the presence/absence of the arsRBC operon has on the global native metalloproteome in E. coli strains under AsIII and AsV stressing conditions [15]. In this study, we used size-exclusion chromatography coupled with an inductively-coupled mass spectrometer (SEC-ICPMS) to analyze the metalloproteins (proteins that bind metal) in their native state. Changes to the magnesium, iron, zinc, and nickel metalloproteome were detected upon arsenic treatment. The changes differed depending on the presence of the arsRBC operon. Furthermore, protein cofactors and metal uptake were influenced by the arsRBC operon under arsenic stress.
We also used a differential proteomics approach to identify metalloproteins affected by the presence of ArsR under high AsIII stress using E. coli containing arsRBC, arsR, or a deletion mutant lacking the arsRBC locus. We elucidate a common AsIII stress response in all strains regardless of the presence of the arsR. Additionally we identify proteins whose expression is affected by the presence of ArsR under high AsIII stress. This work provides new information about biological stress responses to AsIII and the regulatory effects of ArsR.

Methods

arsR Plasmid Construction

The complete arsR coding region along with its native promoter from K-12 wild-type strain W3110 was PCR-cloned with primers ArsR-F (AAATTAATTAATATTACCTTCCTCTGCACTTAC) and ArsR-R (AAACCTAGGTTAACTGCAAATGTTCTTACTGT) using a pCR2.1 TOPO TA Cloning kit (Invitrogen™). The resulting pCR2.1-p-arsR plasmid was transformed into E. coli AW3110 following the cloning kit manual instructions. Successful transformation was confirmed using GENEWIZ’s Sanger sequencing service (Azenta Life Sciences). We refer to this complemented strain as AW3110 (p-arsR) to indicate the presence of the arsR gene under the control of its native promoter carried on the pCR2.1 plasmid.

Culturing Conditions

All E. coli cultures were grown in 200 mL of LB broth as batch cultures at 37 °C. The K-12 MG1655 (wild type) and AW3110 (chloramphenicol cassette marked ΔarsRBC mutant) cell lines were a gift from Dr. Barry Rosen and are described in the original publication [11]. Cultures were inoculated with 2 mL of an overnight culture and tested under seven conditions (n=3). To elicit a similar stress level in K-12 and AW3110 and based upon previous research [15], we chose to use 1 mM AsIII for K-12 and 100 µM AsIII for AW3110 and the arsR-complement. In addition, K-12 was also given 100 µM AsIII as a control for AsIII concentrations between K-12 and AW3110 strains. AsIII was administered 2 hrs post-inoculation and growth was recorded via OD600 measurements every hour. Two hrs after the addition of AsIII, 50 mL of each culture was removed. Cells were pelleted by centrifugation (4000 x g, 10 min, 4 °C) and stored at -80 °C until further analyses. AW3110 and the arsR-complement were grown under chloramphenicol and kanamycin selection, respectively.

Protein Extraction

Cell pellets were washed three times with 5 mL of lysis solution (200 mM ammonium acetate, pH 7) by gentle shaking. After each wash, cells were pelleted by centrifugation (1500 x g, 5 min, 4 °C). Cells were then resuspended in 800 µL for lysis using Matrix E (MPBio) on a FastPrep-24 5G bead beater (MPbio) at a speed of 6.0 m/s for 30 s. Cell debris and matrix were pelleted at 18,000 x g for 20 min at 4 °C and the soluble fractions were collected for further analyses. Protein concentrations were determined using a Bradford assay.

Shotgun Proteomics

Protein samples were concentration-matched, reduced, alkylated, and cleaned by chloroform/methanol extraction prior to digestion with sequencing grade modified porcine trypsin (Promega) at the IDeA National Resource for Quantitative Proteomics at the University of Arkansas Little Rock. Tryptic peptides were then separated by reverse phase XSelect CSH C18 2.5 um resin (Waters) on an in-line 150 × 0.075 mm column using an UltiMate 3000 RSLCnano system (Thermo). Peptides were eluted using a 60 min gradient from 98:2 to 65:35 solution A:B ratio. Eluted peptides were ionized by electrospray (2.4 kV) followed by mass spectrometric analysis on an Orbitrap Eclipse Tribrid mass spectrometer (Thermo). MS data were acquired using the FTMS analyzer in profile mode at a resolution of 120,000 over a range of 375 to 1200 m/z. Following HCD activation, MS/MS data were acquired using the ion trap analyzer in centroid mode and normal mass range with a normalized collision energy of 30%. Peptides fragmented during the acquisition were used for the basis of identification. Proteins were identified by database search using MaxQuant (Max Planck Institute) with a parent ion tolerance of 3 ppm and a fragment ion tolerance of 0.5 Da. Scaffold Q+S (Proteome Software) was used to verify MS/MS based peptide and protein identifications. Protein identifications were accepted if they could be established with less than 1.0% false discovery and contained at least 2 identified peptides. Protein probabilities were assigned by the Protein Prophet algorithm [16].

Curation of Metalloproteome from Identified Proteins

To generate the metal-containing protein list, the identified proteins were submitted to the online functional annotation tool on the Database for Annotation, Visualization and Integrated Discovery (DAVID) [17,18].. The results from DAVID were manually searched against metal keywords to determine if a protein was a metalloprotein. Search terms were; “zinc,” “zn,” “iron,” “4fe,” “ferredoxin,” “ferrous,” “ferric,” “siderophore,” “heme,” “2fe,” “nickel,” “magnesium,” “mg,” “cobalt,” “cobalamin,” “arsenic,” “arsen,” “ars,” “sodium,” “na+,” “na2+,” “manganese,” “mn,” “copper,” “cupric,” “molybdenum,” “molybdopterin,” “potassium,” “calcium,” and “metal.”

Statistical Analysis of the Metalloproteome

The identified metalloproteins were input into the Metaboanalyst online software suite [19]. Upon input, data were normalized by sum, mean-centered, divided by the standard deviation of each variable for scaling, and log10 transformed. A one-way ANOVA with an FDR of 0.001 and a post hoc implemented Tukey’s HSD with a threshold value of 0.001 was used to identify significantly different proteins of interest based upon comparisons between normalized, relative protein abundances. Individual box plots of normalized proteins of interest were generated from the ANOVA analysis. Principal component analyses were performed using all sample groups and on only the sample groups that exhibited high AsIII stress. Hierarchal clustering analysis was performed using Euclidian distances with a Ward clustering method of an applied ANOVA analysis to generate the top 30 features heatmaps. The statistical analysis was repeated using non-metal TCA cycle enzymes.

Total Metal Analysis of Soluble Fractions

Proteomes collected 2-hrs post arsenic dosing (soluble lysate) were diluted to a protein concentration of 4 mg/mL. 800 µg of protein from each sample was digested in 20% wt/v optima grade HNO3 (Fisher) at 99 °C for 30 min. Precipitate was pelleted via centrifugation and 150 µL of the supernatant was diluted to 3 mL for metal analysis with 2% HNO3, 0.5% HCl solution. Samples were analyzed on an Agilent 7800 ICP-MS with an Agilent SPS4 autosampler. Metal concentrations were determined using standard curves generated from serial dilution of a commercially available environmental calibration standard (CPI International). An internal standard mix (Agilent) was added to the samples using a T-junction immediately before the nebulizer. The ICP-MS parameters were auto-tuned using an ICP-MS tuning solution (Agilent).

Results

arsR Confers Arsenic Resistance

To investigate the changes to the metalloproteome under a sublethal, yet significant degree of AsIII stress, AW3110 and the arsR-complement were exposed to 100 µM AsIII. Growth of treated cells was reduced compared to the control cells but cells continued growing (Figure 1a). Interestingly, AsIII had less of an effect on the arsR-complement than AW3110, despite lacking the AsIII efflux pump gene, arsB. As expected, the wild-type strain K-12 required elevated concentrations of AsIII to achieve a similar reduction in growth (Figure 1b). Based upon the levels of AsIII required to induce significant decreases in growth rate across strains, we designated the K-12 samples given 1 mM AsIII, and the AW3110 and arsR-complement samples treated with 100 µM AsIII as the “high AsIII samples/groups.” We designated the control samples and the K-12 samples that received the 100 µM AsIII treatment as the “low/no AsIII stress samples/groups.”

Changes to the Metalloproteome during AsIII stress

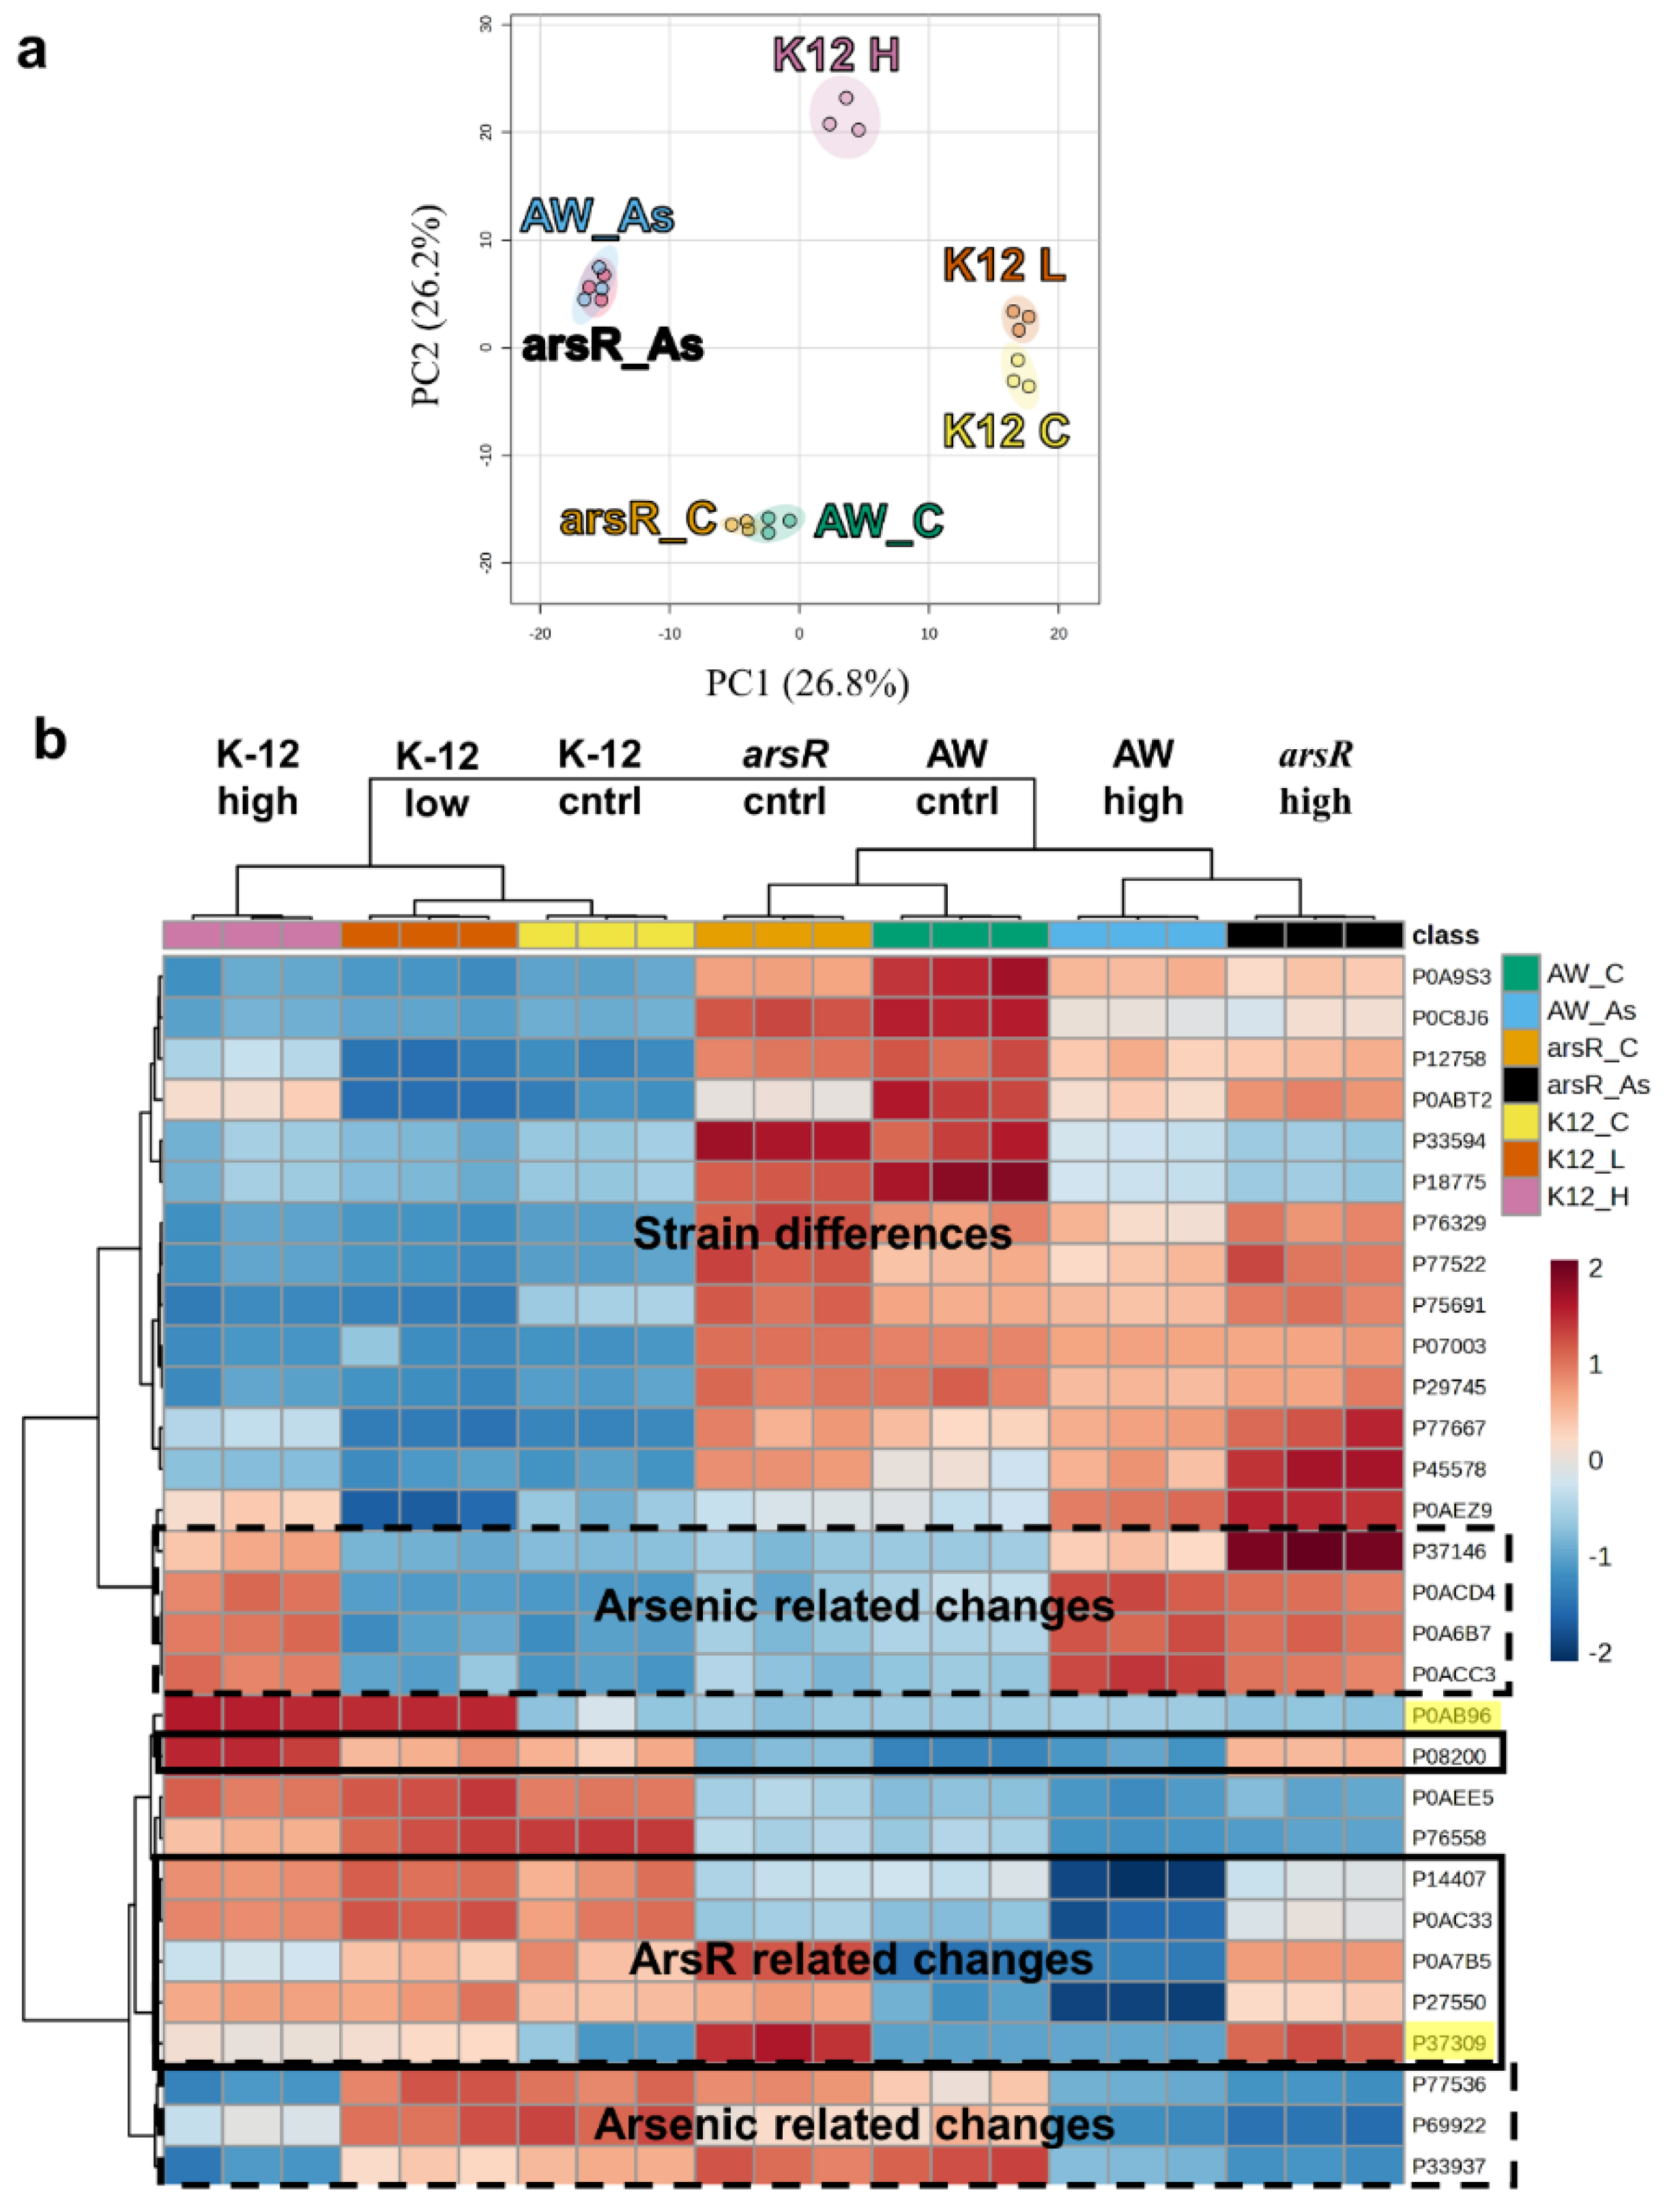
We speculated that protein expression will be altered due AsIII stress and by the presence of ArsR. To investigate this, we employed shotgun proteomics to determine the relative abundance of proteins expressed by each strain under the different growth conditions. We identified 1840 proteins from the 4328 predicted protein-coding genes in K-12 MG1655 and 4243 predicted protein-coding genes in the AW3110 substrain (Supplemental Data Table S1) [20,21]. We choose to focus our analysis on metalloproteins since the arsRBC operon has been shown to differentially affect the global native metalloproteome under AsIII stress [15]. To do this, we filtered the identified proteins using the DAVID functional analysis (see methods) (Supplemental Data Table S2). From the identified protein pool, 619 (33.6%) were categorized as metalloproteins. Principal component analysis based on relative abundance revealed that AW3110 and arsR control samples grouped closely together and the AsIII treated samples grouped close together (Figure 2a). The K-12 control and K-12 low AsIII stress grouped close together, while the high AsIII stress samples were well separated from the other K-12 groups along both axes. Replicates in every treatment were tightly clustered with each other. A one-way ANOVA with a false discover rate cutoff of 0.001 revealed 363 metalloproteins significantly changed between all groups (Supplemental Figure S1). This data suggests that large changes in the metalloproteome occurred between sample groups that we interpret as deriving from on AsIII stress and strain genotypes.
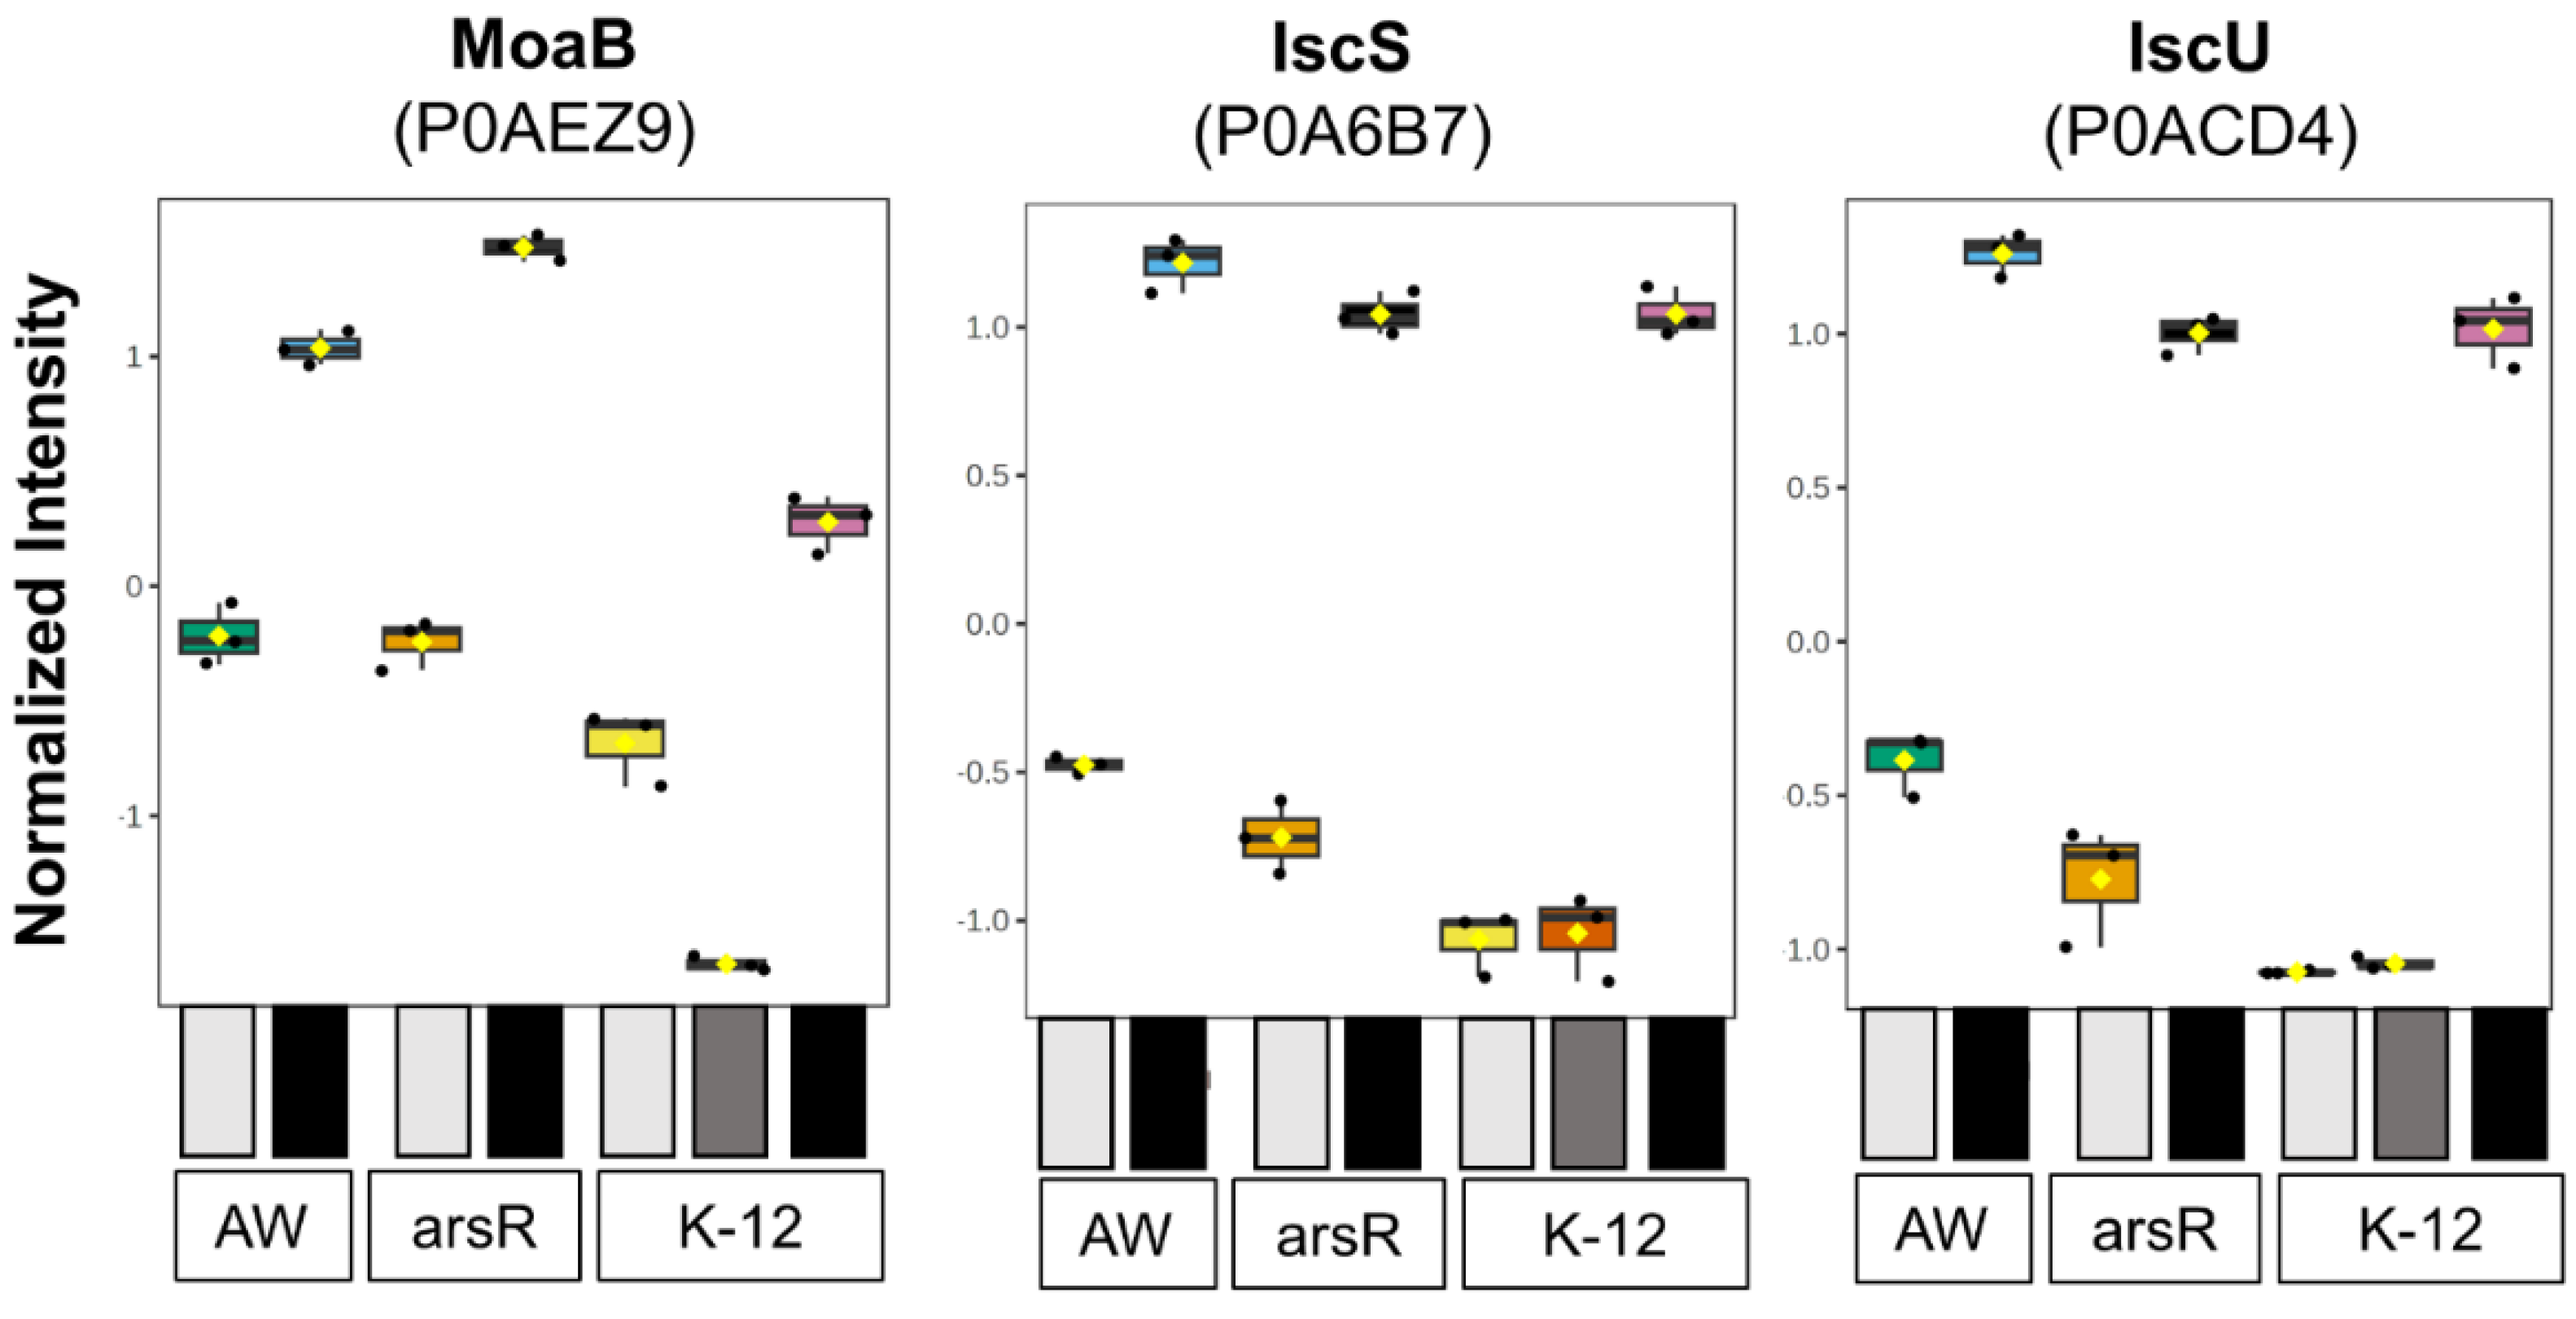
These results were mirrored when the data was assessed with a hierarchical clustering analysis of the top 30 dysregulated proteins (Figure 2b). This analysis clustered K-12 samples apart from the AW3110 and arsR-complement samples. Within those clusters, high AsIII stress samples clustered with each other and the low/no AsIII stress samples clustered together. Clustering based on changes in protein abundance highlighted strain differences, AsIII stress, and the presence of ArsR (Figure 2b). As expected, ArsR (Uniprot accession number P37309) was present in arsR-complement and arsenic-treated K-12 samples while ArsC was present only in AsIII-treated K-12 samples. Within the strain difference protein cluster, several galactitol metabolism-related proteins were identified. In AW3110 and the arsR-complement, galactitol-1-phosphate dehydrogenase, GatD (P0A9S3), and tagatose-1,6-bisphosphate aldolase, GatY (P0C8J6) were more abundant than in K-12. High AsIII stress stimulated the expression of several metal-cofactor biosynthesis proteins. These were molybdenum cofactor biosynthesis protein B (MoaB, P0AEZ9), cysteine desulfurase (IscS, P0A6B7), and [Fe-S] cluster assembly scaffold protein (IscU, P0ACD4) (Figure 3). Six proteins seemed to be influenced by the presence of ArsR including proteins that were differentially expressed between AW3110 and the arsR high AsIII samples (Figure 2b). Several of these proteins were part of the TCA cycle. These proteins were acetyl-coenzyme A synthetase (P27550), isocitrate dehydrogenase (P08200), fumarase A (P0AC33) and fumarase B (P14407). These results suggest that E. coli responds to AsIII by increasing metallocofactor biosynthesis proteins and that TCA cycle proteins appear to be affected by presence of ArsR.
Having seen that molybdenum cofactor B, IscS and IscU were affected by the AsIII treatment, we searched our data for proteins involved in these cofactor synthesis pathways. All of the Isc [Fe-S] cluster assembly proteins including the chaperone and accessory proteins, HscA, HscB, and ferredoxin, were present and increased in intensity under high AsIII stress (Supplemental Figure S2). We did not detect IscX in any of our samples. In all groups, the Isc proteins increased in abundance upon high AsIII stress. We also identified all of the Suf [Fe-S] cluster assembly proteins (Supplemental Figure S3). Out of the six Suf proteins, only SufA and SufS increased upon AsIII stress (Supplemental Figure S3). The others decreased or did not change in abundance. All of the molybdenum cofactor assembly proteins, except for MoaA, increased in abundance in the high AsII stress groups (Supplemental Figure S4). This data shows that all Isc [Fe-S] cluster synthesis, two Suf [Fe-S] synthesis proteins, and the majority of the molybdenum cofactor synthesis proteins are more highly expressed when E. coli is under high AsIII stress.
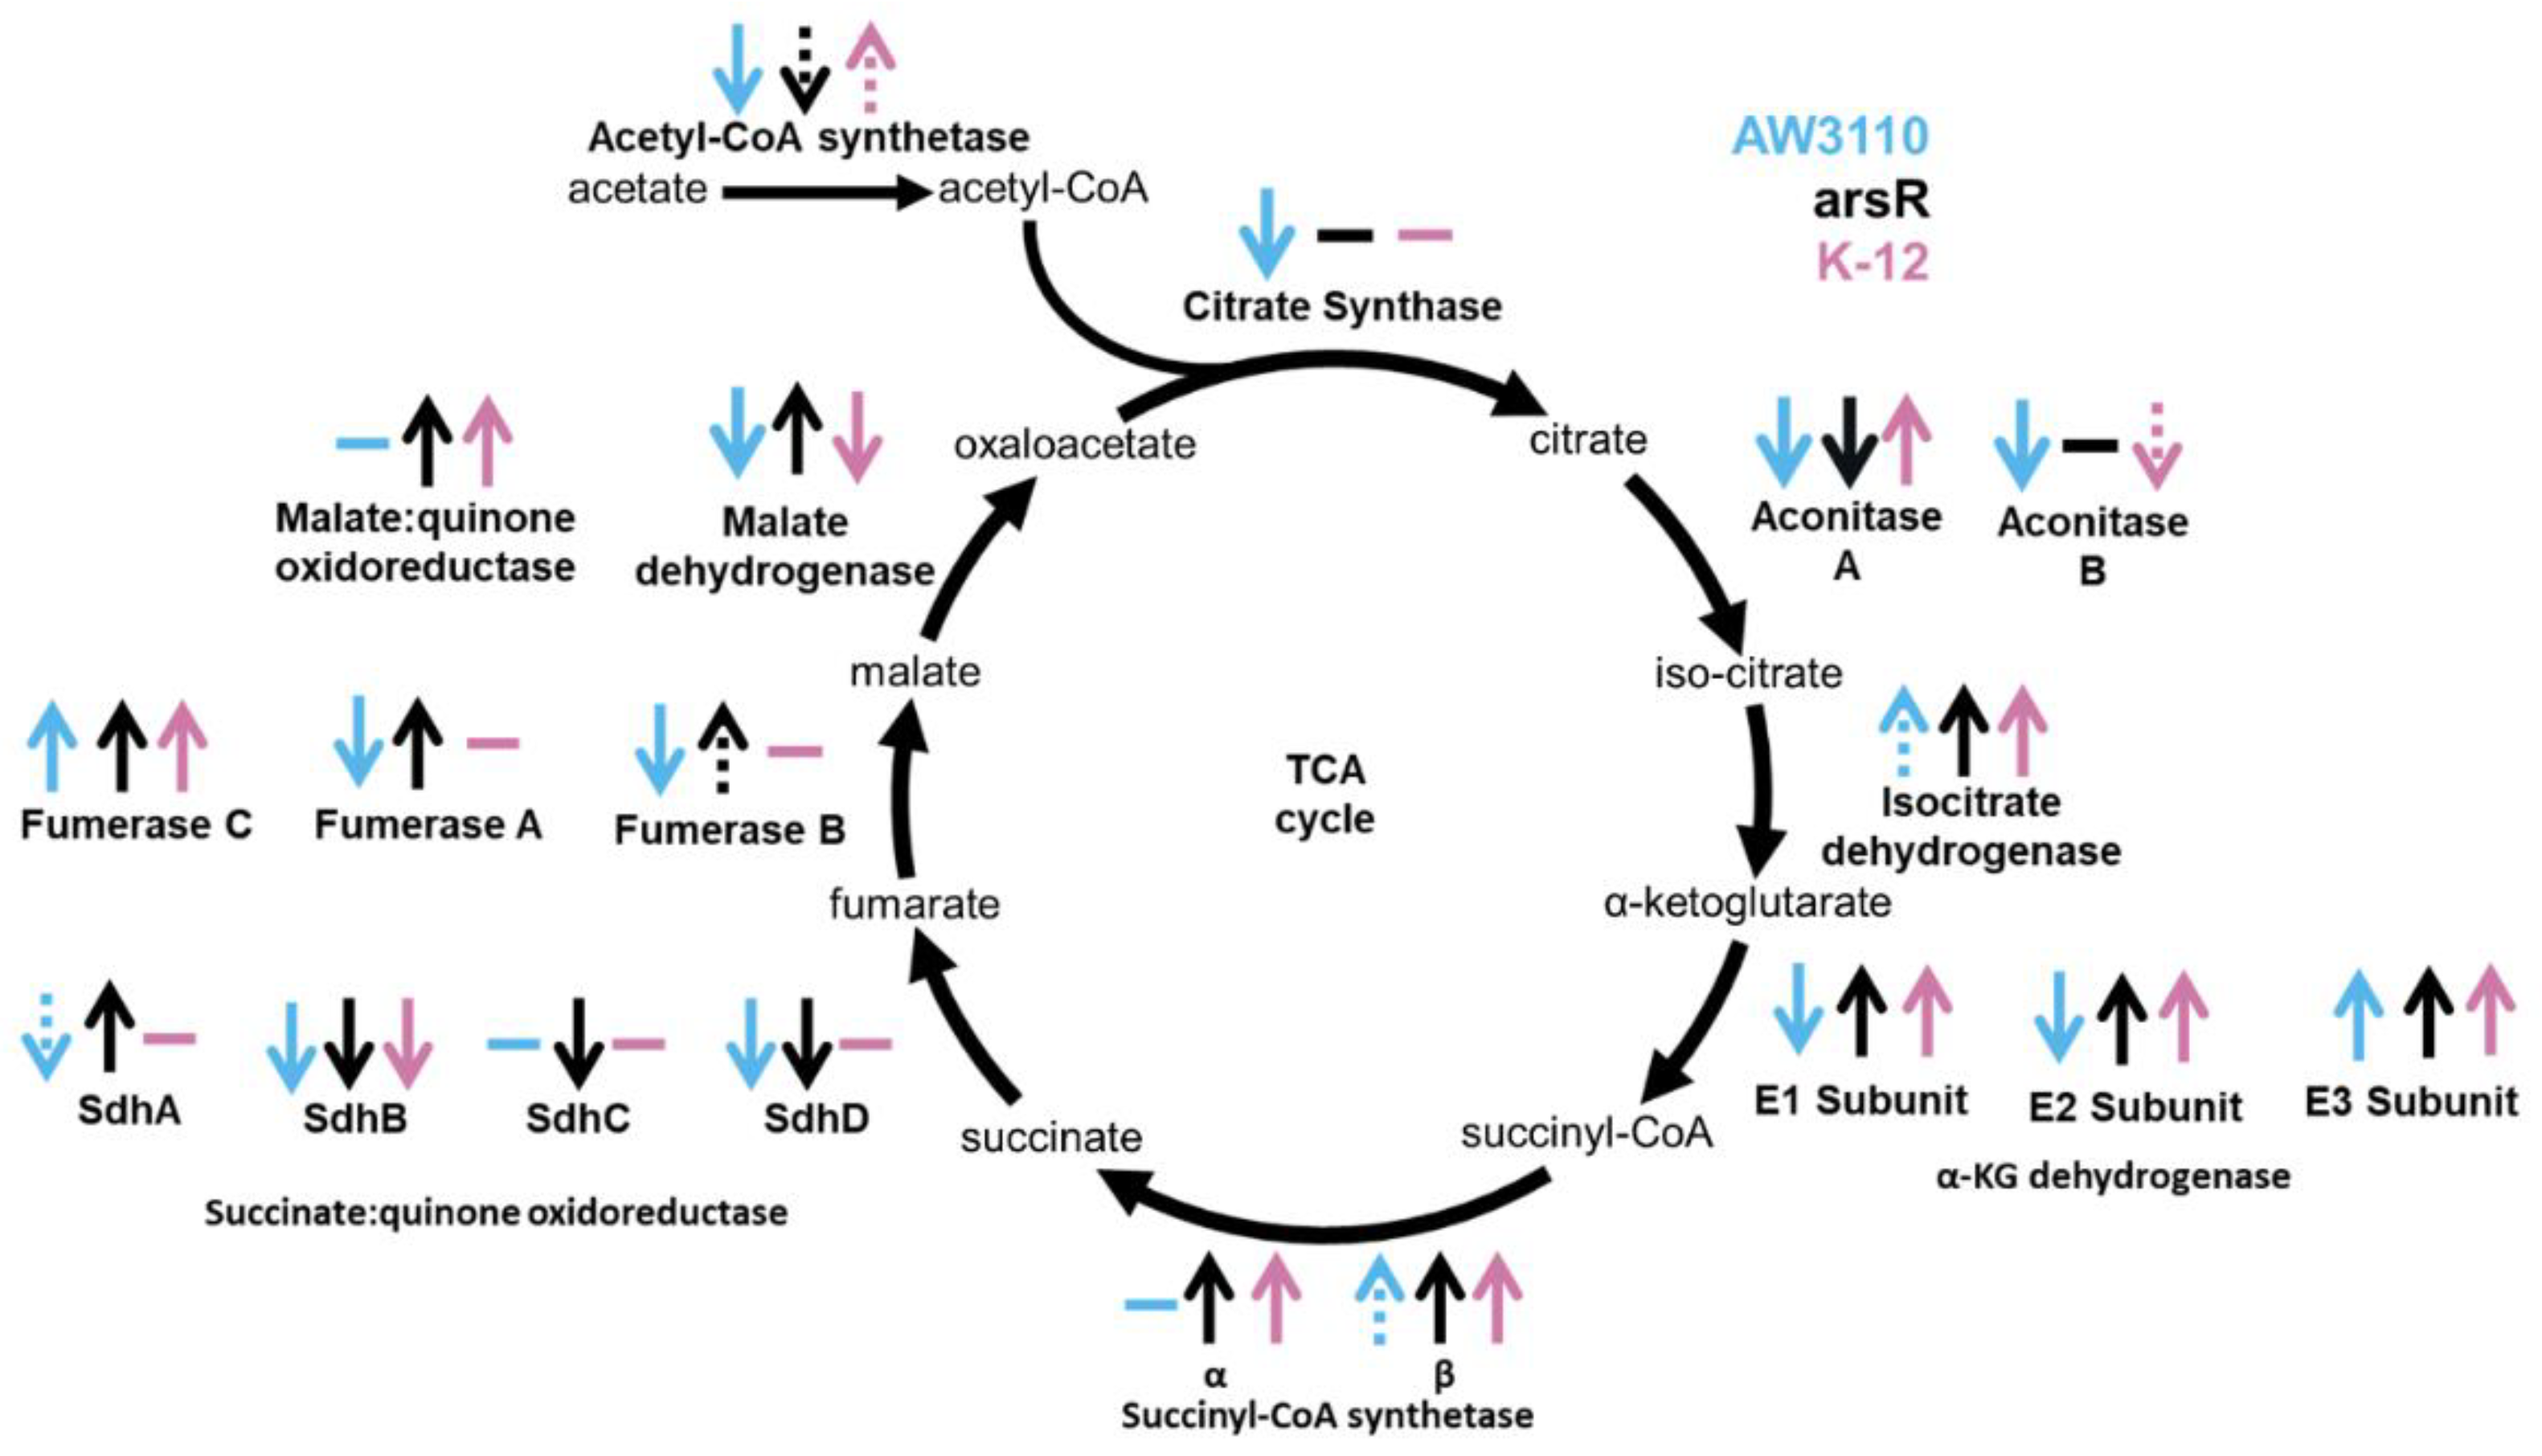
To decipher the effects caused by AsIII on TCA protein expression as well as the role of ArsR, we examined the change in expression of the TCA associated metalloenzymes between the control and high AsIII stress groups (Supplemental Figure S5). For every enzymatic step of the TCA cycle containing a metalloprotein the change in expression between control and high AsIII stress was different for AW3110 and the arsR-complement. This trend was also observed when the statistical analysis included non-metal-containing TCA cycle enzymes (Figure 4). Therefore, ArsR impacts the abundance of TCA enzymes under high AsIII stress.

Changes to Intracellular Metals

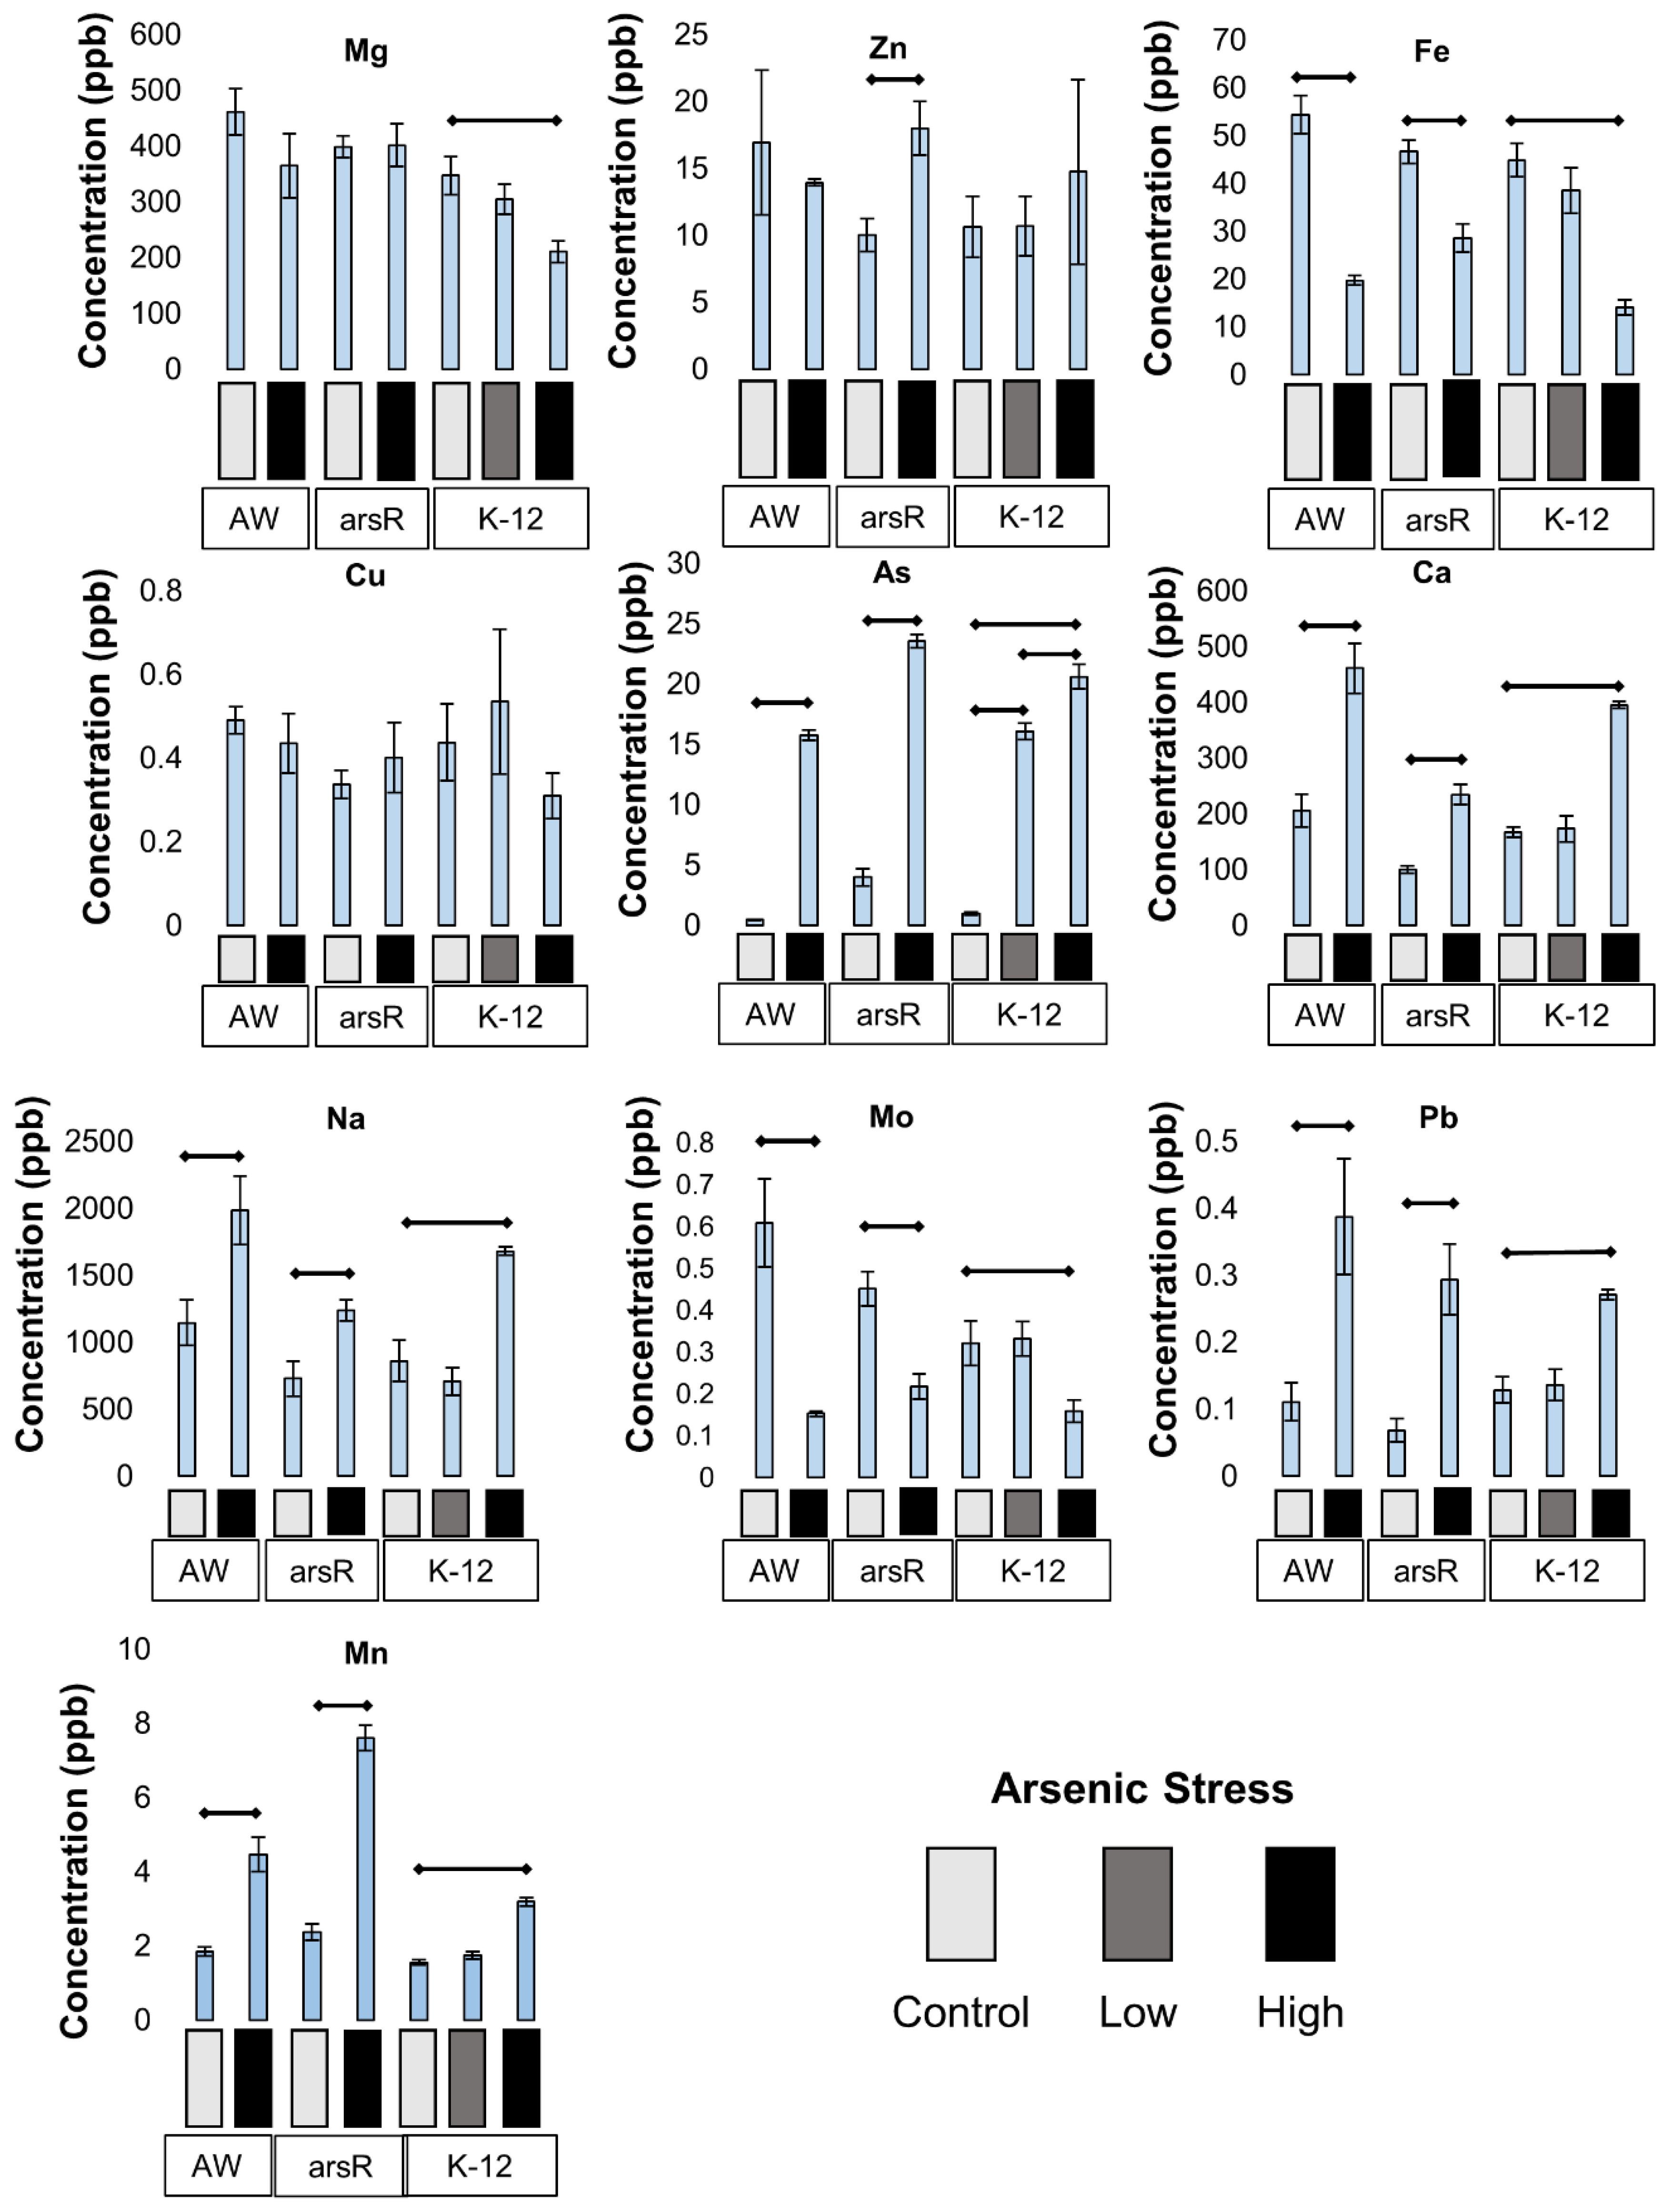
We hypothesized that the presence of arsRBC operon and ArsR would impact intracellular metal concentration [22], challenging us to quantify intracellular metal concentrations (cytosolic metal and protein-bound metal). As expected, arsenic concentrations inside the cells increased with AsIII stress levels (Figure 5). Interestingly, the arsR-complement strain had a higher concentration of arsenic than the K-12 and AW3110. The low AsIII stress K-12 samples and the high AsIII stress AW3110 samples resulted in the same intracellular arsenic concentrations and high AsIII-stressed arsR-complement resulted in the highest concentration across sample groups. In all strains, high AsIII stress led to a significant increase (p < 0.05) in Ca, Na, Mo, Pb, Mn, and a significant decrease in Fe, and Mo. Copper was unaffected by the presence of AsIII. Magnesium concentrations decreased under high AsIII stress only in K-12 with no change in AW3110 or the arsR-complement. Similarly, zinc only changed in the arsR-complement, where it increased with higher levels of AsIII. Additionally, copper, manganese, and calcium concentrations were significantly different (p < 0.05) between AW3110 and the arsR-complement controls. Sodium and iron concentrations were also different but to a lesser extent (p-value of 0.05, and 0.08 respectively). These results show that high AsIII stress impacts intracellular metal concentrations and that the presence of the arsR gene plays a role in metal homeostasis both in the presence and absence of AsIII.

Discussion

The goal of this work was two-fold: 1) Identify metalloproteins affected by AsIII and 2) characterize ArsR regulatory influences that extend beyond the ars operon. The near-isogenic E. coli strains [23,24]. used in this study differed primarily based on the presence or absence of specific ars genes and their encoded AsIII resistance functions. K-12 has the complete arsRBC operon and thus should display maximal AsIII resistance, whereas AW3110 lacks the arsRBC operon and thus is more sensitive. The use of the AW3110 carrying the arsR gene under control of the native promoter allowed us to selectively examine the function of this transcription factor, uncoupled from ArsB and ArsC, to assess if its regulatory bandwidth extends beyond the ars operon as we recently demonstrated with Agrobacterium tumefaciens [14].
The differential proteomics workflow showed these E. coli cells clustered based on their arsRBC and arsR differences (Figure 2), indicating that the presences and absence of the arsRBC genes were quite important with regards to the cellular metalloproteomics profiles in response to AsIII stress. However, all three strains had a common response to AsIII stress that involved activation of two metallocofactor biosynthetic pathways (Figure 3 and Supplemental Figures S2 and S4). This included proteins encoded by the moaABCDE gene cluster, although upregulation of MoaA in response to AsIII was only observed in the arsR-complement strain. Moa proteins are involved in the biosynthesis of the molybdenum cofactor (Moco), a molybdopterin found in molybdeoenzymes. [25]. Molybdoenzymes catalyze versatile and essential redox reactions in carbon nitrogen, and sulfur cycles. [26]. Similarly [Fe-S] clusters catalyze a wide range of redox reactions in virtually every cellular process [27]. Even the Moco synthesis pathway requires a [4Fe-4S] cluster to catalyze the initial step in Moco synthesis [28]. The Isc [Fe-S] cluster synthesis proteins are all upregulated upon high AsIII stress (Figure 3 and Supplemental Figure S2), but only SufA and SufS are upregulated in the Suf [Fe-S] cluster synthesis pathway (Supplemental Figure S3). In E. coli, the Isc pathway is regarded as the housekeeping [Fe-S] pathway for cluster synthesis, whereas the Suf pathway for [Fe-S] cluster synthesis responds to oxidative stress. [29,30,31]. Since, AsIII is a well-known inducer of oxidative stress; [32,33,34,35]. these results were not expected. AsIII has a high affinity for thiols and reacts with reduced cysteines in proteins, which can alter protein structure and impair catalysis [36,37,38], both of which contribute to AsIII toxicity [36]. IscR, the first gene product of the isc operon, is a potential target for AsIII interactions as it possesses three cysteine residues critical for Fe-s cluster ligation. IscR regulates over 40 genes and is a transcriptional regulator that plays both an activating as well as a repressing role depending on its cofactor status [39]. In its holo [2Fe-2S] containing form, IscR represses isc transcription, while the apo form represses Suf expression [39,40]. AsIII may disrupt [2Fe-2S] cluster incorporation, leading to expression of the Isc proteins. Our data supports this since the increased abundance of IscR did not correlate to a decreased abundance of other Isc proteins (Supplemental Figure S2). In addition to IscR, the suf operon is under the regulatory control of two other transcription factors harboring potential AsIII-reactive thiols. The ferric uptake regulator (Fur) represses Suf exclusively when it is coordinating iron [41]. Similarly, the transcription factor OxyR stimulates Suf expression, but only when the cysteines of OxyR are in a certain disulfide bridge configuration [42,43]. Isc and Suf expression is under complex regulatory control and is likely affected by disruption of protein function through high-affinity AsIII-cysteine interactions.
Recently it has been demonstrated that arsR has widespread effects that extend beyond the known arsR-regulated operon and arsenic resistance [14,15,44]. To isolate changes specific to the presence of ArsR in E. coli, we compared AW3110 with AW3110 complemented with arsR, finding that ArsR influences metal homeostasis, and thus corroborating its role in A. tumefaciens wherein the ArsR’s control metal homeostasis, particularly related to iron, copper, and nickel. [14]. Importantly, complementing arsR in AW3110 enhanced growth rate in the presence of AsIII (Figure 1) despite significantly greater As bioaccumulation in the arsR-complemented AW3110 (Figure 5). We attribute this to ArsR acting to effectively absorb AsIII and thereby reduce free AsIII in the cell that would otherwise damage numerous enzymes and growth. This phenomenon has also previously been suggested [45].
In the presence of ArsR, the E. coli metalloproteome displayed a response to high AsIII stress (Figure 2b) exhibiting conferred AsIII resistance (Figure 1) which was associated with TCA cycle protein expression. At least one protein in every enzymatic step of the TCA cycle had altered expression due to the presence of ArsR (Figure 4). AsIII exposure has been linked to the inhibition of α-ketoglutarate dehydrogenase enzymes in Agrobacterium tumefaciens 5A, shunting metabolites away from the TCA cycle [46]. When ArsR was present the subunits of α-ketoglutarate dehydrogenase increased in expression under high AsIII stress which can be attributed to maintaining TCA cycle function. Conservation of energy, however, is a common stress response in E. coli [47]. yet AsIII exposure to cells containing arsR appears to upregulate the TCA cycle which can reasonably be inferred as increasing electron flow to electron transport activity and thus increasing cellular energy. This phenomenon can be attributed to increasing the abundance of TCA cycle intermediates, which been proposed to play an active role in the chelation of toxic under metal-induced stress [48]. Indeed, several of these TCA metabolites have been shown to aid in alleviating toxicity caused by zinc, copper, and aluminum. Citrate, malate, and succinate have all been shown to neutralize these species toxic metals through chelation while aluminum and zinc toxicity has been diminished with increased production of oxaloacetate derivatives. TCA enzymes may be upregulated in the presence of ArsR to provide metabolites that can chelate AsIII. ArsR influences the expression of the majority of TCA-cycle enzymes and is presumably linked to the increased AsIII resistance in the arsR-complement.

Conclusions

In all three strains, the molybdenum cofactor and Isc [Fe-S] cluster assembly increased in expression under high AsIII stress indicating a conserved response to AsIII stress. Under oxidative stress, [Fe-S] cluster synthesis is expected to be mediated by Suf proteins, not Isc. We suspect that AsIII may be impairing regulatory proteins causing Isc expression. In addition, we show a stress response unique to strains containing the arsR gene. The presence of ArsR has regulatory role on the expression of TCA cycle proteins under high AsIII stress. ArsR also conferred AsIII resistance compared to the AW3110 parent strain. This may be connected to the expression of TCA cycle enzymes but remains only hypothetical.
This work provides important evidence that expands upon hypotheses regarding the bacterial arsenic stress response and the role(s) of ArsR as a transcriptional regulator. Prior RNASeq-based work on this topic concerned the soil bacterium A. tumefaciens [14], whereas the current effort focused on E. coli, which is a common member of the gut microbiome. As such, this has significant relevance to understanding the full impact of arsenic exposure and toxicity to roughly 200 million humans worldwide consuming arsenic contaminated drinking water [49,50]. The human gastrointestinal tract microbiome constitutes the first response to ingested arsenic, which is governed to a large degree by ArsR [51]. Consequently, fully appreciating the regulatory bandwidth of this arsenic-sensitive regulator is critical towards appreciating how and why the human gut microbiome responds to arsenic exposure, and how that can influence host health and welfare.

Supplementary Materials

The following supporting information can be downloaded at: Preprints.org.

Acknowledgments

This work was supported by the IDeA National Resource for Quantitative Proteomics at University of Arkansas School for Medical Science through their National Institute of General Medical Sciences grant (R24GM137786). Additional support for this work was provided by the Division of Chemical Sciences, Geosciences, and Biosciences, Office of Basic Energy Sciences of the U.S. Department of Energy through Grant DE-SC0020246 to B.B., from the National Science Foundation (MCB 1714556) to V.C. B.B., and T.R.M. T.R.M also acknowledges support from the University of North Carolina’s Superfund Program (grant P42ES031007) and Montana Agricultural Experiment Station (923310). We would also like to thank Don Smith, Jesse Thomas, and Laura Dobeck of the Montana State University Core Facility, for their help with ICP-MS. Funding for the Montana State Mass Spectrometry Facility used in this publication was made possible in part by the MJ Murdock Charitable Trust, the National Institute of General Medical Sciences of the National Institutes of Health under Award Numbers P20GM103474 and S10OD28650, and the MSU Office of Research and Economic Development.

References

  1. Ng, J. C.; Wang, J.; Shraim, A. A Global Health Problem Caused by Arsenic from Natural Sources. Chemosphere 2003, 52, 1353–1359. [Google Scholar] [CrossRef] [PubMed]
  2. Kuivenhoven, M.; Mason, K. Arsenic Toxicity. StatPearls 2023. [Google Scholar]
  3. Styblo, M.; Del Razo, L. M.; Vega, L.; Germolec, D. R.; LeCluyse, E. L.; Hamilton, G. A.; Reed, W.; Wang, C.; Cullen, W. R.; Thomas, D. J. Comparative Toxicity of Trivalent and Pentavalent Inorganic and Methylated Arsenicals in Rat and Human Cells. Arch Toxicol 2000, 74, 289–299. [Google Scholar] [CrossRef] [PubMed]
  4. WHO. Guidelines for Drinking-Water Quality, 4th Edition, Incorporating the 1st Addendum. 2017.
  5. De Francisco, P.; Martín-González, A.; Rodriguez-Martín, D.; Díaz, S. Interactions with Arsenic: Mechanisms of Toxicity and Cellular Resistance in Eukaryotic Microorganisms. Int J Environ Res Public Health 2021, 18, 12226. [Google Scholar] [CrossRef] [PubMed]
  6. Rosen, B. P. Biochemistry of Arsenic Detoxification. FEBS Lett 2002, 529, 86–92. [Google Scholar] [CrossRef] [PubMed]
  7. Páez-Espino, D.; Tamames, J.; De Lorenzo, V.; Cánovas, D. Microbial Responses to Environmental Arsenic. BioMetals 2009, 22, 117–130. [Google Scholar] [CrossRef]
  8. Garbinski, L. D.; Rosen, B. P.; Chen, J. Pathways of Arsenic Uptake and Efflux. Environ Int 2019, 126, 585–597. [Google Scholar] [CrossRef] [PubMed]
  9. Fekih, I. Ben; Zhang, C.; Li, Y. P.; Zhao, Y.; Alwathnani, H. A.; Saquib, Q.; Rensing, C.; Cervantes, C. Distribution of Arsenic Resistance Genes in Prokaryotes. Front Microbiol 2018, 9, 407801. [Google Scholar] [CrossRef]
  10. Saltikov, C. W.; Olson, B. H. Homology of Escherichia Coli R773 ArsA, ArsB, and ArsC Genes in Arsenic-Resistant Bacteria Isolated from Raw Sewage and Arsenic-Enriched Creek Waters. Appl Environ Microbiol 2002, 68, 280. [Google Scholar] [CrossRef]
  11. Carlin, A.; Shi, W.; Dey, S.; Rosen, B. P. The Ars Operon of Escherichia Coli Confers Arsenical and Antimonial Resistance. J Bacteriol 1995, 177, 981. [Google Scholar] [CrossRef]
  12. Rawle, R. A.; Kang, Y. S.; Bothner, B.; Wang, G.; McDermott, T. R. Transcriptomics Analysis Defines Global Cellular Response of Agrobacterium Tumefaciens 5A to Arsenite Exposure Regulated through the Histidine Kinases PhoR and AioS. Environ Microbiol 2019, 21, 2659–2676. [Google Scholar] [CrossRef] [PubMed]
  13. Kashyap, D. R.; Botero, L. M.; Franck, W. L.; Hassett, D. J.; McDermott, T. R. Complex Regulation of Arsenite Oxidation in Agrobacterium Tumefaciens. J Bacteriol 2006, 188, 1081–1088. [Google Scholar] [CrossRef]
  14. Rawle, R.; Saley, T. C.; Kang, Y. S.; Wang, Q.; Walk, S.; Bothner, B.; McDermott, T. R. Introducing the ArsR-Regulated Arsenic Stimulon. Front Microbiol 2021, 12, 162. [Google Scholar] [CrossRef] [PubMed]
  15. Larson, J.; Tokmina-Lukaszewska, M.; Fausset, H.; Spurzem, S.; Cox, S.; Cooper, G.; Copié, V.; Bothner, B. Arsenic Exposure Causes Global Changes in the Metalloproteome of Escherichia Coli. Microorganisms 2023, 11, 382. [Google Scholar] [CrossRef] [PubMed]
  16. Nesvizhskii, A. I.; Keller, A.; Kolker, E.; Aebersold, R. A Statistical Model for Identifying Proteins by Tandem Mass Spectrometry. Anal Chem 2003, 75, 4646–4658. [Google Scholar] [CrossRef] [PubMed]
  17. Huang, D. W.; Sherman, B. T.; Lempicki, R. A. Bioinformatics Enrichment Tools: Paths toward the Comprehensive Functional Analysis of Large Gene Lists. Nucleic Acids Res 2009, 37, 1–13. [Google Scholar] [CrossRef] [PubMed]
  18. Huang, D. W.; Sherman, B. T.; Lempicki, R. A. Systematic and Integrative Analysis of Large Gene Lists Using DAVID Bioinformatics Resources. Nat Protoc 2009, 4, 44–57. [Google Scholar] [CrossRef] [PubMed]
  19. Pang, Z.; Zhou, G.; Ewald, J.; Chang, L.; Hacariz, O.; Basu, N.; Xia, J. Using MetaboAnalyst 5.0 for LC-HRMS Spectra Processing, Multi-Omics Integration and Covariate Adjustment of Global Metabolomics Data. [CrossRef]
  20. Keseler, I. M.; Gama-Castro, S.; Mackie, A.; Billington, R.; Bonavides-Martínez, C.; Caspi, R.; Kothari, A.; Krummenacker, M.; Midford, P. E.; Muñiz-Rascado, L.; Ong, W. K.; Paley, S.; Santos-Zavaleta, A.; Subhraveti, P.; Tierrafría, V. H.; Wolfe, A. J.; Collado-Vides, J.; Paulsen, I. T.; Karp, P. D. The EcoCyc Database in 2021. Front Microbiol 2021, 12, 711077. [Google Scholar] [CrossRef] [PubMed]
  21. Karp, P. D.; Ouzounis, C. A.; Moore-Kochlacs, C.; Goldovsky, L.; Kaipa, P.; Ahrén, D.; Tsoka, S.; Darzentas, N.; Kunin, V.; López-Bigas, N. Expansion of the BioCyc Collection of Pathway/Genome Databases to 160 Genomes. Nucleic Acids Res 2005, 33, 6083–6089. [Google Scholar] [CrossRef]
  22. Xu, Z.; Wang, P.; Wang, H.; HangYu, Z.; Au-Yeung, H. Y.; Hirayama, T.; Sun, H.; Yan, A. Zinc Excess Increases Cellular Demand for Iron and Decreases Tolerance to Copper in Escherichia Coli. Journal of Biological Chemistry 2019, 294, 16978–16991. [Google Scholar] [CrossRef]
  23. Riley, M.; Abe, T.; Arnaud, M. B.; Berlyn, M. K. B.; Blattner, F. R.; Chaudhuri, R. R.; Glasner, J. D.; Horiuchi, T.; Keseler, I. M.; Kosuge, T.; Mori, H.; Perna, N. T.; Plunkett, G.; Rudd, K. E.; Serres, M. H.; Thomas, G. H.; Thomson, N. R.; Wishart, D.; Wanner, B. L. Escherichia Coli K-12: A Cooperatively Developed Annotation Snapshot—2005. Nucleic Acids Res 2006, 34, 1–9. [Google Scholar] [CrossRef]
  24. Hayashi, K.; Morooka, N.; Yamamoto, Y.; Fujita, K.; Isono, K.; Choi, S.; Ohtsubo, E.; Baba, T.; Wanner, B. L.; Mori, H.; Horiuchi, T. Highly Accurate Genome Sequences of Escherichia Coli K-12 Strains MG1655 and W3110. Mol Syst Biol 2006, 2. [Google Scholar] [CrossRef] [PubMed]
  25. Rajagopalan, K. V. The Pterin Molybdenum Cofactor. Article in Journal of Biological Chemistry 1992. [Google Scholar] [CrossRef]
  26. Miralles-Robledillo, J. M.; Torregrosa-Crespo, J.; Martínez-Espinosa, R. M.; Pire, C. DMSO Reductase Family: Phylogenetics and Applications of Extremophiles. Int J Mol Sci 2019, 20. [Google Scholar] [CrossRef] [PubMed]
  27. Lénon, M.; Arias-Cartín, R.; Barras, F. The Fe–S Proteome of Escherichia Coli: Prediction, Function, and Fate. Metallomics 2022, 14, 22. [Google Scholar] [CrossRef]
  28. Yokoyama, K.; Leimkühler, S. The Role of FeS Clusters for Molybdenum Cofactor Biosynthesis and Molybdoenzymes in Bacteria. Biochim Biophys Acta 2015, 1853, 1335. [Google Scholar] [CrossRef]
  29. Outten, F. W.; Djaman, O.; Storz, G. A Suf Operon Requirement for Fe–S Cluster Assembly during Iron Starvation in Escherichia Coli. Mol Microbiol 2004, 52, 861–872. [Google Scholar] [CrossRef]
  30. Lee, -H; Yeo, W. -S.; Roe, J.-H.; Lee, J.-H.; Yeo, W.-S.; Roe, J.-H. Induction of the SufA Operon Encoding Fe-S Assembly Proteins by Superoxide Generators and Hydrogen Peroxide: Involvement of OxyR, IHF and an Unidentified Oxidant-Responsive Factor. Mol Microbiol 2004, 51, 1745–1755. [Google Scholar] [CrossRef] [PubMed]
  31. Boyd, E. S.; Thomas, K. M.; Dai, Y.; Boyd, J. M.; Outten, F. W. Interplay between Oxygen and Fe–S Cluster Biogenesis: Insights from the Suf Pathway. Biochemistry 2014, 53, 5834. [Google Scholar] [CrossRef] [PubMed]
  32. Flora, S. J. S. Arsenic-Induced Oxidative Stress and Its Reversibility. Free Radic Biol Med 2011, 51, 257–281. [Google Scholar] [CrossRef]
  33. Kitchin, K. T.; Ahmad, S. Oxidative Stress as a Possible Mode of Action for Arsenic Carcinogenesis. Toxicol Lett 2003, 137, (1–2). [Google Scholar] [CrossRef] [PubMed]
  34. Gupta, D. K.; Inouhe, M.; Rodríguez-Serrano, M.; Romero-Puertas, M. C.; Sandalio, L. M. Oxidative Stress and Arsenic Toxicity: Role of NADPH Oxidases. Chemosphere 2013, 90, 1987–1996. [Google Scholar] [CrossRef] [PubMed]
  35. Li, M.; Cai, J. F.; Chiu, J. F. Arsenic Induces Oxidative Stress and Activates Stress Gene Expressions in Cultured Lung Epithelial Cells. J Cell Biochem 2002, 87, 29–38. [Google Scholar] [CrossRef] [PubMed]
  36. Shen, S.; Li, X. F.; Cullen, W. R.; Weinfeld, M.; Le, X. C. Arsenic Binding to Proteins. Chem Rev 2013, 113, 7769. [Google Scholar] [CrossRef] [PubMed]
  37. Lu, M.; Wang, H.; Wang, Z.; Li, X. F.; Le, X. C. Identification of Reactive Cysteines in a Protein Using Arsenic Labeling and Collision-Induced Dissociation Tandem Mass Spectrometry. J Proteome Res 2008, 7, 3080–3090. [Google Scholar] [CrossRef] [PubMed]
  38. Cline, D. J.; Thorpe, C.; Schneider, J. P. Effects of As(III) Binding on α-Helical Structure. J Am Chem Soc 2003, 125, 2923–2929. [Google Scholar] [CrossRef] [PubMed]
  39. Esquilin-Lebron, K.; Dubrac, S.; Barras, F.; Boyd, J. M. Bacterial Approaches for Assembling Iron-Sulfur Proteins. mBio 2021, 12. [Google Scholar] [CrossRef]
  40. McHugh, J. P.; Rodríguez-Quiñones, F.; Abdul-Tehrani, H.; Svistunenko, D. A.; Poole, R. K.; Cooper, C. E.; Andrews, S. C. Global Iron-Dependent Gene Regulation in Escherichia Coli: A NEW MECHANISM FOR IRON HOMEOSTASIS. Journal of Biological Chemistry 2003, 278, 29478–29486. [Google Scholar] [CrossRef]
  41. Semsey, S.; Andersson, A. M. C.; Krishna, S.; Jensen, M. H.; Massé, E.; Sneppen, K. Genetic Regulation of Fluxes: Iron Homeostasis of Escherichia Coli. Nucleic Acids Res 2006, 34, 4960. [Google Scholar] [CrossRef]
  42. Lee, K.-C.; Yeo, W.-S.; Roe, J.-H. Oxidant-Responsive Induction of the Suf Operon, Encoding a Fe-S Assembly System, through Fur and IscR in Escherichia Coli. J Bacteriol 2008, 190, 8244–8247. [Google Scholar] [CrossRef]
  43. Lee, C.; Lee, S. M.; Mukhopadhyay, P.; Kim, S. J.; Lee, S. C.; Ahn, W. S.; Yu, M. H.; Storz, G.; Ryu, S. E. Redox Regulation of OxyR Requires Specific Disulfide Bond Formation Involving a Rapid Kinetic Reaction Path. Nat Struct Mol Biol 2004, 11, 1179–1185. [Google Scholar] [CrossRef] [PubMed]
  44. Kang, Y. S.; Brame, K.; Jetter, J.; Bothner, B. B.; Wang, G.; Thiyagarajan, S.; McDermott, T. R. Regulatory Activities of Four ArsR Proteins in Agrobacterium Tumefaciens 5A. Appl Environ Microbiol 2016, 82, 3471–3480. [Google Scholar] [CrossRef] [PubMed]
  45. Ke, C.; Zhao, C.; Rensing, C.; Yang, S.; Zhang, Y. Characterization of Recombinant E. Coli Expressing ArsR from Rhodopseudomonas Palustris CGA009 That Displays Highly Selective Arsenic Adsorption. Appl Microbiol Biotechnol 2018, 102, 6247–6255. [Google Scholar] [CrossRef] [PubMed]
  46. Tokmina-Lukaszewska, M.; Shi, Z.; Tripet, B.; McDermott, T. R.; Copié, V.; Bothner, B.; Wang, G. Metabolic Response of Agrobacterium Tumefaciens 5A to Arsenite. Environ Microbiol 2017, 19, 710–721. [Google Scholar] [CrossRef] [PubMed]
  47. Jozefczuk, S.; Klie, S.; Catchpole, G.; Szymanski, J.; Cuadros-Inostroza, A.; Steinhauser, D.; Selbig, J.; Willmitzer, L. Metabolomic and Transcriptomic Stress Response of Escherichia Coli. Mol Syst Biol 2010, 6, 364. [Google Scholar] [CrossRef] [PubMed]
  48. MacLean, A.; Legendre, F.; Appanna, V. D. The Tricarboxylic Acid (TCA) Cycle: A Malleable Metabolic Network to Counter Cellular Stress. Crit Rev Biochem Mol Biol 2023, 58, 81–97. [Google Scholar] [CrossRef] [PubMed]
  49. Naujokas, M. F.; Anderson, B.; Ahsan, H.; Vasken Aposhian, H.; Graziano, J. H.; Thompson, C.; Suk, W. A. The Broad Scope of Health Effects from Chronic Arsenic Exposure: Update on a Worldwide Public Health Problem. Environ Health Perspect 2013, 121, 295. [Google Scholar] [CrossRef] [PubMed]
  50. Bhattacharjee, P.; Chatterjee, D.; Singh, K. K.; Giri, A. K. Systems Biology Approaches to Evaluate Arsenic Toxicity and Carcinogenicity: An Overview. Int J Hyg Environ Health 2013, 216, 574–586. [Google Scholar] [CrossRef]
  51. McDermott, T. R.; Stolz, J. F.; Oremland, R. S. Arsenic and the Gastrointestinal Tract Microbiome. Environ Microbiol Rep 2020, 12, 136–159. [Google Scholar] [CrossRef]
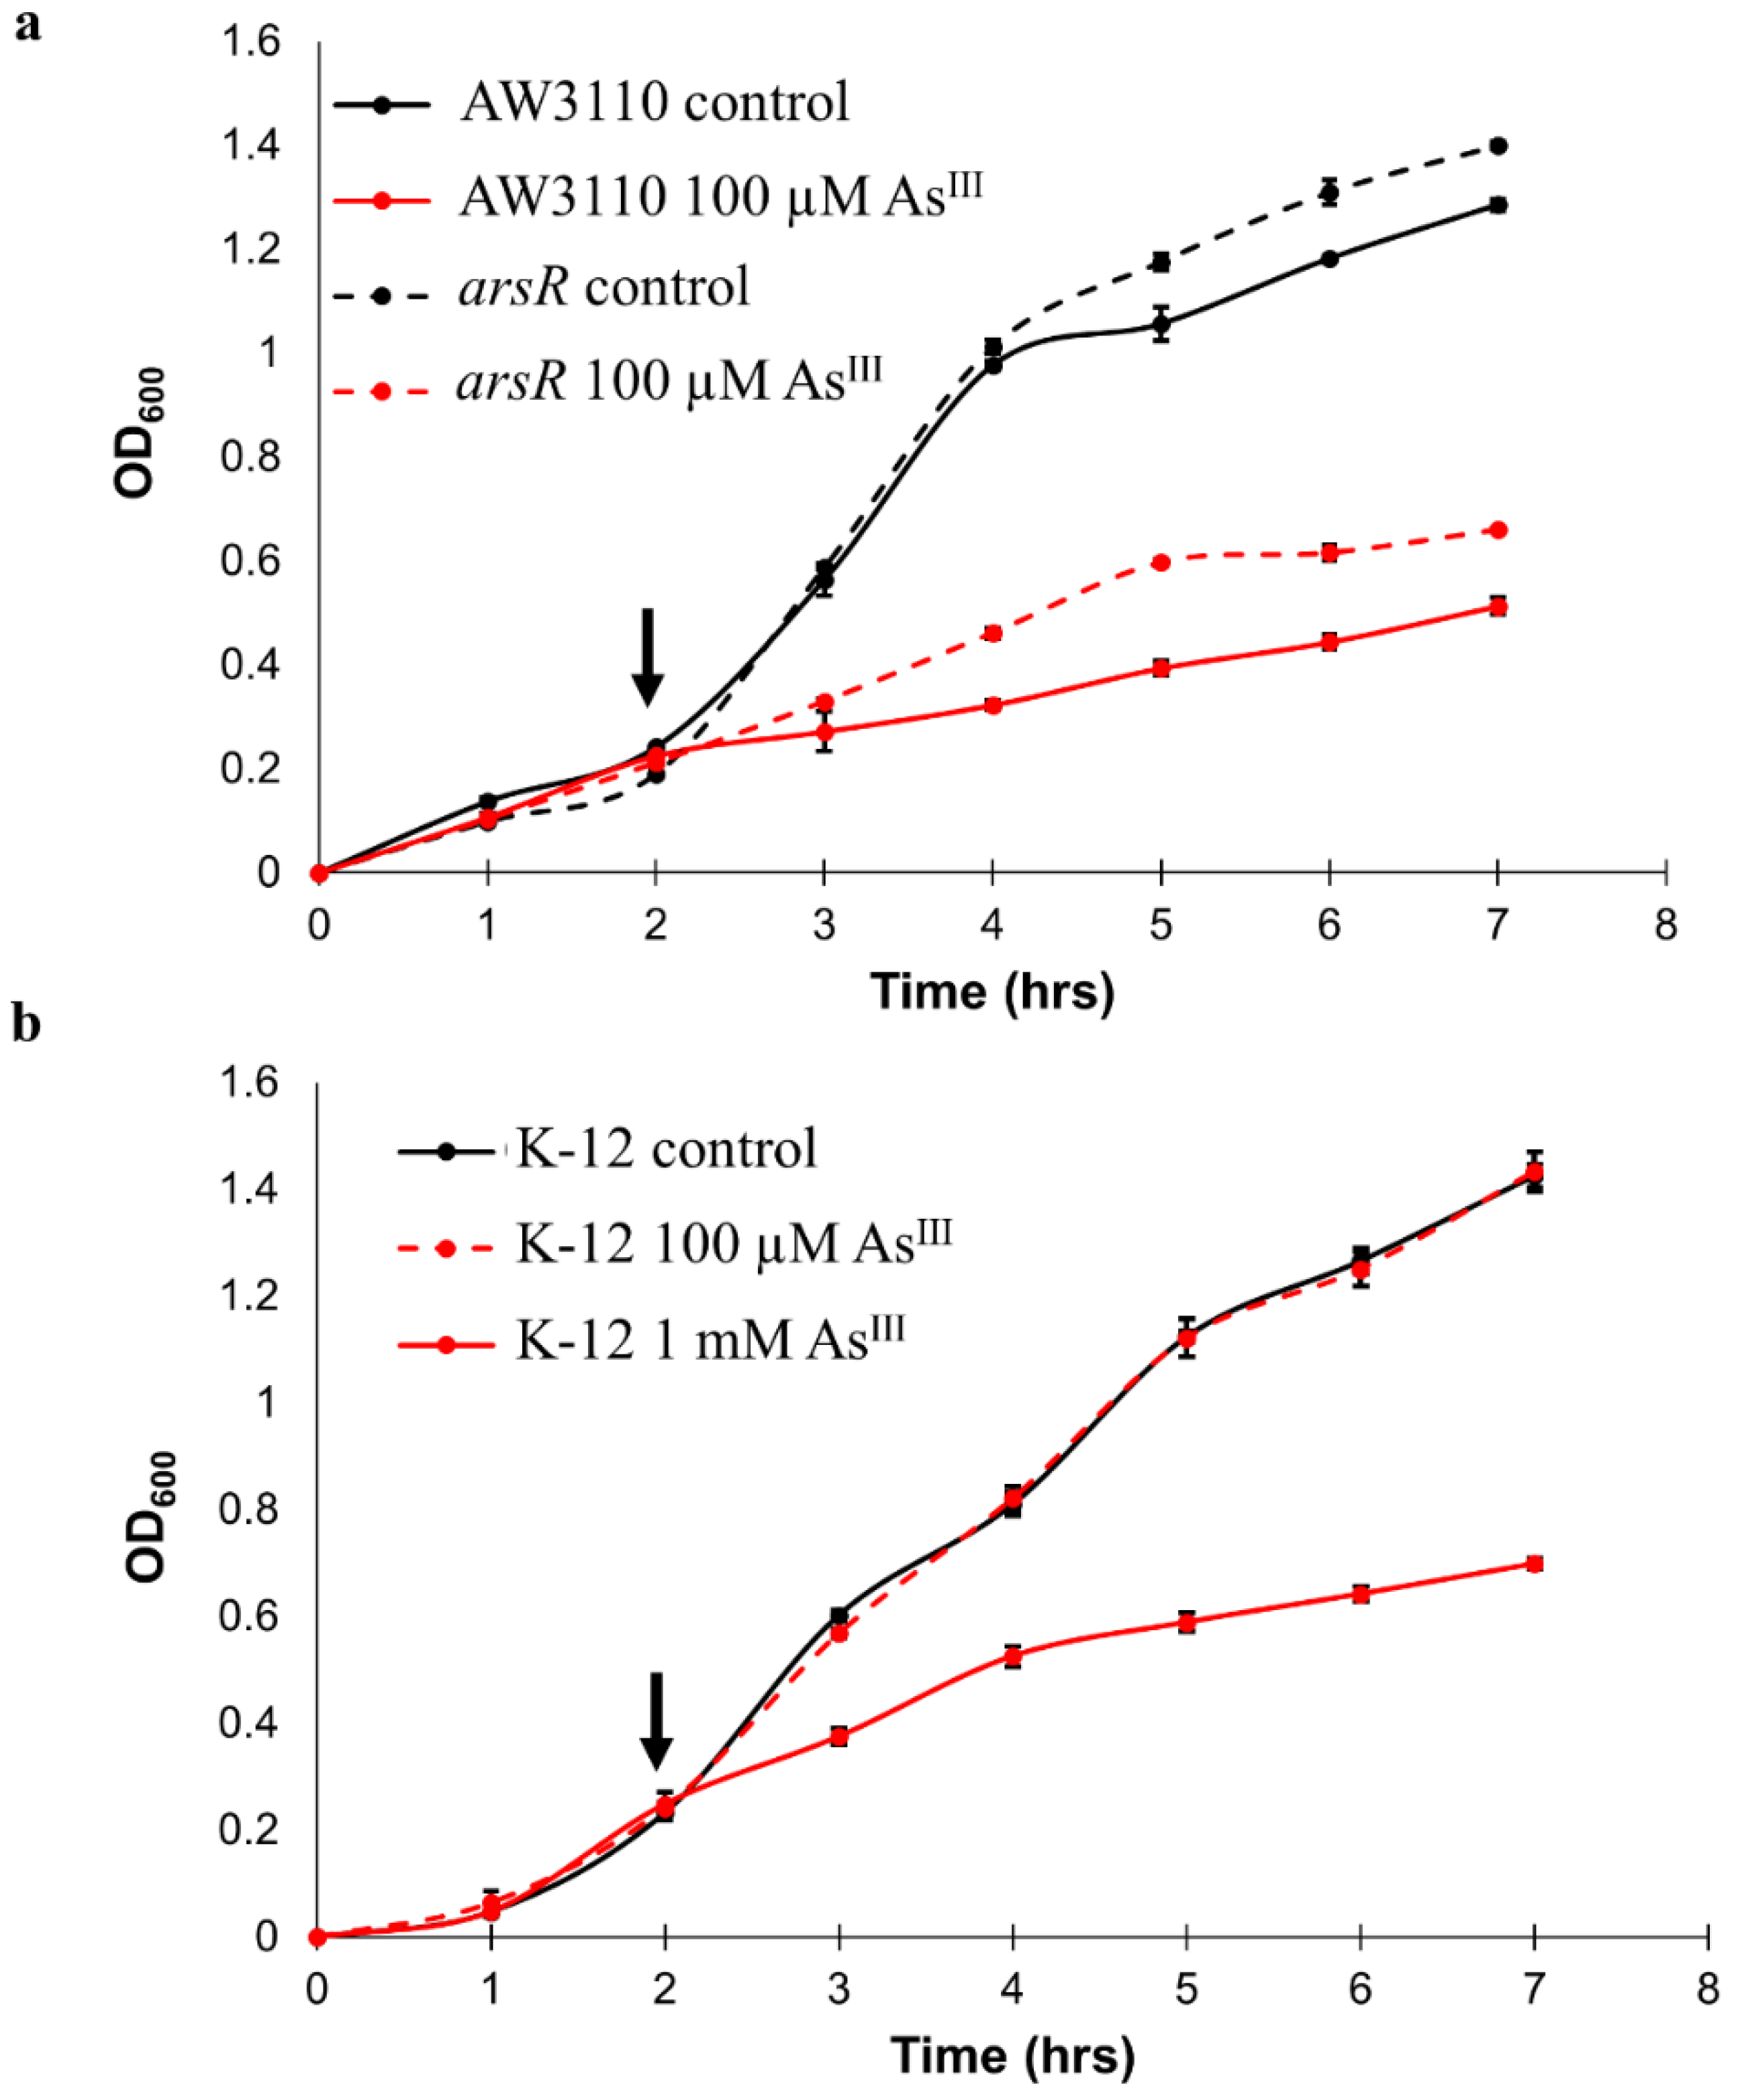
Figure 1. ArsR confers AsIII resistance. a. Growth of AW3110 and arsR-complemented AW3110. Cultures were grown in triplicate (n=3) in the presence (red) and absence of arsenic (black) for AW3110 (solid line) and arsR-complement (dashed). 100 µM AsIII treatment was given at 2 hours post-inoculation. b. Growth of K-12. Cultures were grown in triplicate (n=3) in the presence (red) and absence of arsenic (black). The arsenic concentrations were 100 µM (dashed) or 1 mM AsIII (solid). Arsenite was added 2 hours post-inoculation, indicated by the arrow. Samples were collected 2 hours later for proteomics analysis. Error bars are ± 1 standard deviation.
Preprints 114724 g001
Figure 2. Statistical analysis of the metal-related proteome. a. PCA analysis of E. coli strains K-12, AW3110, and the arsR-complement with and without AsIII stress. b. Hierarchal clustering based on the top 30 features of a one-way ANOVA. Proteins cluster based on strain differences, high arsenite stress, and the presence of ArsR. Proteins are given as their Uniprot accession numbers. Proteins whose expression was altered based upon the presence of ArsR are outlined with solid boxes, proteins clustered due to high AsIII stress are outlined with dashed boxes, and clusters due to strain differences aren’t outlined. The ArsR (P37309) and ArsC (P0AB96) proteins and highlighted.
Preprints 114724 g002
Figure 3. Metallocofactor proteins affected by high AsIII stress. Based on a one-way ANOVA, these proteins increased in abundance in all strains under high AsIII stress and were in the top 30 metalloproteins. Increasing darkness indicates the severity of AsIII stress. The no AsIII control for each strain is white, low AsIII stress is grey, and high AsIII stress is black.
Preprints 114724 g003
Figure 4. ArsR regulates expression of TCA cycle protein expression under AsIII stress. The expression of TCA cycle proteins under high AsIII stress compared to the no AsIII controls are indicated by arrows and are color coordinated. AW3110 is indicated in blue, the arsR-complement is in black, and K-12 is in pink. An up arrow indicates an increase in expression. A down arrow indicates a decrease in expression. No arrow means the expression was unchanged. Dashed arrows indicate a marginal change in expression.
Preprints 114724 g004
Figure 5. Soluble intra-cellular metal concentrations. The soluble cellular metal concentrations from each condition (n=3) were measured with ICP-MS. Bars denote significant differences at p-value < 0.05. Only significance intragroup is displayed.
Preprints 114724 g005
Disclaimer/Publisher’s Note: The statements, opinions and data contained in all publications are solely those of the individual author(s) and contributor(s) and not of MDPI and/or the editor(s). MDPI and/or the editor(s) disclaim responsibility for any injury to people or property resulting from any ideas, methods, instructions or products referred to in the content.
Copyright: This open access article is published under a Creative Commons CC BY 4.0 license, which permit the free download, distribution, and reuse, provided that the author and preprint are cited in any reuse.
Prerpints.org logo

Preprints.org is a free preprint server supported by MDPI in Basel, Switzerland.

Subscribe

© 2024 MDPI (Basel, Switzerland) unless otherwise stated