1. Introduction
In recent years, the quality of indoor air has become a matter of growing concern due to its significant impact on public health. Indoor air quality (IAQ) is influenced by various factors such as building materials, ventilation systems, human activities, and outdoor air pollution. Poor IAQ has been associated with a wide range of health issues including respiratory diseases, cardiovascular diseases, and allergies [
1]. Therefore, assessing and improving IAQ is crucial for safeguarding human health, particularly in healthcare facilities where vulnerable populations are often present. Health centers play a critical role in providing medical care to communities, and ensuring a healthy indoor environment in such facilities is paramount. However, despite their importance, there is limited research focusing on IAQ within health centers in Nigeria, particularly in regions such as Ondo State. Understanding the IAQ in these settings is essential for identifying potential risks to both patients and healthcare workers.
The importance of indoor air quality (IAQ) in healthcare facilities cannot be overstated, as these environments directly impact the health and well-being of patients, healthcare workers, and visitors. Numerous studies have demonstrated that exposure to indoor air pollutants in healthcare settings can lead to adverse health effects, exacerbate existing medical conditions, and contribute to the spread of infectious diseases [
2]. Therefore, ensuring good IAQ in healthcare facilities is essential for providing safe and effective patient care. In addition to the health implications, poor IAQ in healthcare settings can also have financial consequences. For instance, indoor air pollution-related illnesses can result in increased healthcare costs, absenteeism among healthcare workers, and reduced productivity [
3]. Furthermore, substandard IAQ may lead to patient dissatisfaction, which can impact the reputation and viability of healthcare facilities in the community.
Despite the recognized importance of IAQ in healthcare settings, research focusing on this topic in Nigeria, particularly in regions such as Ondo State, remains limited. Existing studies have primarily been conducted in developed countries, and there is a lack of data on IAQ levels and potential pollutants in healthcare facilities in Nigeria. This knowledge gap hinders efforts to implement evidence-based interventions to improve IAQ and protect the health of patients and healthcare workers. Moreover, healthcare facilities in Nigeria face unique challenges related to IAQ, including inadequate ventilation systems, overcrowding, poor maintenance practices, and limited access to resources for monitoring and mitigating indoor air pollutants [
4]. Addressing these challenges requires a thorough understanding of the specific factors contributing to poor IAQ in Nigerian healthcare facilities and the development of contextually appropriate strategies for improvement.
Therefore, there is a critical need for research that systematically evaluates IAQ in healthcare facilities across Nigeria, including regions like Ondo State. By conducting comprehensive assessments of IAQ and identifying potential sources of indoor air pollutants, researchers can inform policymakers, healthcare administrators, and other stakeholders about the urgency of addressing IAQ issues in healthcare setting. This study aims to fill this gap by conducting a comprehensive assessment of IAQ through particle count analysis in five health centers across Ondo State. By evaluating particle concentrations, the study seeks to provide insights into the levels of indoor air pollutants present in these facilities. The findings will not only contribute to the body of knowledge on IAQ in healthcare settings but also inform policymakers and healthcare administrators about the necessity of implementing measures to improve IAQ.
Despite the critical importance of maintaining good IAQ in health centers, there is a lack of comprehensive studies addressing this issue in Ondo State. Without adequate data on IAQ levels and potential pollutants, it is challenging to implement effective strategies to mitigate risks associated with poor indoor air quality. Therefore, there is an urgent need to assess IAQ in health centers across Ondo State to identify potential problems and develop targeted interventions. The significance of this study lies in its potential to directly impact public health by identifying sources of indoor air pollution and recommending measures to improve IAQ in health centers. By addressing this gap in knowledge, the study contributes to the broader goal of promoting a healthier indoor environment, which is essential for both patients and healthcare workers. This study focuses specifically on particle count analysis as a measure of IAQ in five health centers within Ondo State. Other aspects of IAQ such as chemical pollutants and microbial contaminants are beyond the scope of this research. Additionally, the study does not assess the outdoor air quality surrounding these health centers.
Research Questions
What are the levels of particle concentration in the indoor air of health centers across Ondo State?
Are there variations in particle concentration levels among different types of health centers (e.g., primary healthcare centers, general hospitals)?
What factors contribute to elevated particle concentrations in these health centers?
The primary aim of this study is to assess IAQ through particle count analysis in five health centers across Ondo State. The specific objectives include:
To measure particle concentrations in the indoor air of selected health centers.
To compare particle concentration levels among different types of health centers.
To identify potential sources of indoor air pollutants contributing to elevated particle concentrations.
To provide recommendations for improving IAQ in health centers based on the findings.
By achieving these aims and objectives, this study endeavors to enhance our understanding of IAQ in healthcare settings and contribute to the development of effective strategies for maintaining a healthy indoor environment.
Literature Review
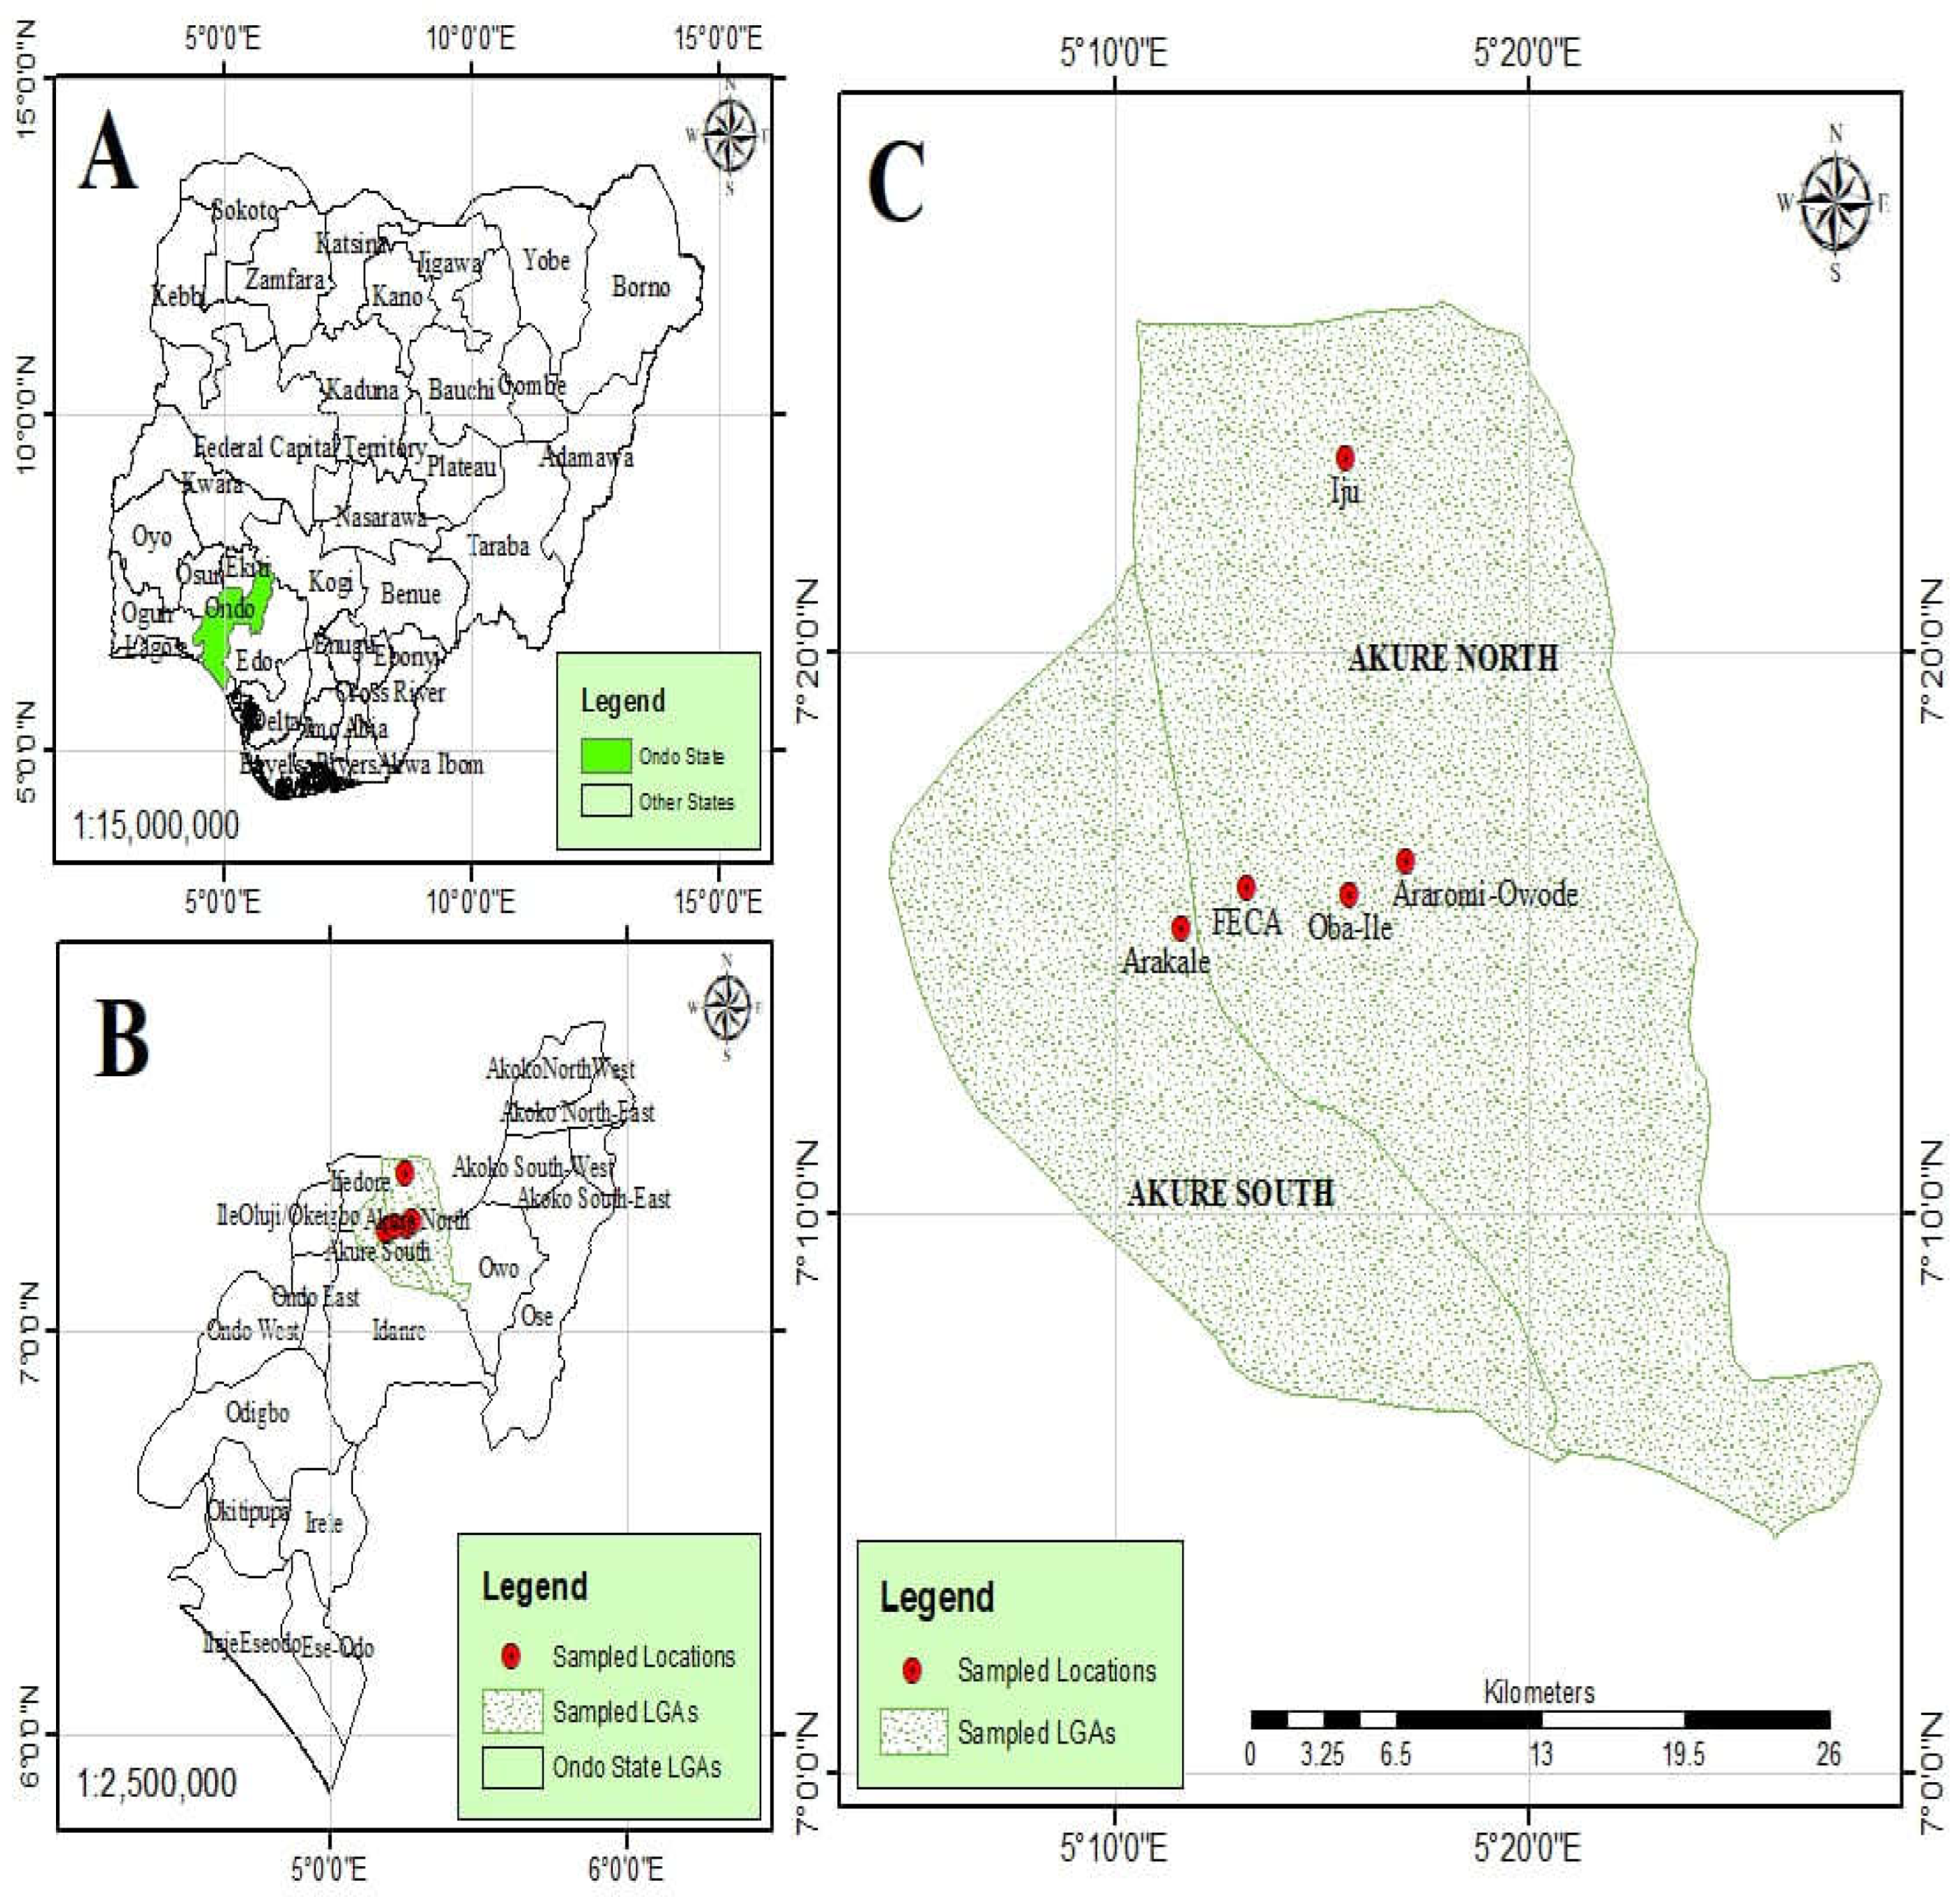
In five primary health centers (PHCs) within the Akure Local Government Areas of Nigeria—Arakale (Urban), the Federal College of Agriculture (FECA) (Urban), Iju (semi-urban), Oba-Ile (semi-urban), and Owode (Rural)—Abulude et al. [
5] presented a thorough assessment of indoor particulate matter (PM) concentrations, focusing on PM1, PM2.5, and PM10 levels. This study's main innovation is its thorough investigation of these PM fractions' potential for toxicity, which offers insightful information about the local air quality and related health hazards. The toxicity potential (TP), relative risk (RR), excess risk (ER), and attributable fractions (Afs) for lung cancer and cardiopulmonary mortality are computed in this study to evaluate the health implications. Arakale exhibits a small elevation in all-cause mortality (RR: 1.061), suggesting possible health hazards. The data show various RR values for all-cause mortality. The cardiovascular mortality ER values range from 14.728 ± 7.25 to 19.04 ± 0.38, indicating a significant extra risk linked to prolonged exposure to PM2.5. Afs for cardiopulmonary mortality are also found in the study, and they range from 11.03 ± 0.31 to 19.22 ± 0.04; this indicates that PM significantly increases the risks associated with respiratory and cardiovascular health. Comparably, the Afs for lung cancer mortality show a strong correlation between PM2.5 exposure and lung cancer risk, ranging from 10.03 ± 0.012 to 17.13 ± 0.10. These results highlight the critical need for focused air quality management plans and public health initiatives in the areas under study in order to lessen the increased health risks attributed to particulate matter pollution. The determined RR, ER, and AF values provide important information about the intricate connection between PM exposure and unfavorable health outcomes. This information serves as a basis for future research projects and well-informed decision-making.
Taushiba et al. [
6] assessed the levels of heavy metals, microbiological contaminants, PM2.5, sub-micron particles (PM>2.5, PM1.0–2.5, PM0.50 –1.0, PM0.25–0.50, and PM<0.25), and indoor and outdoor air quality in three different Lucknow City hospitals. The study was carried out in hospitals located in the city's commercial, residential, and industrial districts between February and April of 2022. The study's observations of the interior particulate matter concentration trend indicated that the hospital, which is located in an industrial neighborhood, had the majority of the highest concentrations. Hospital C, located in the industrial belt, has the highest indoor and outdoor values for PM1.0–2.5, PM0.50–1.0, PM0.25–0.50, and PM<0.25 measured, which are 40.44 µg/m
3, 56.08 µg/m
3, 67.20 µg/m3, 74.50 µg/m
3, 61.9 µg/m3, 79.3 µg/m
3, 82.0 µg/m
3, and 93.9 µg/m
3, respectively. However, hospital B, which is located in the city's residential belt, had the highest indoor concentration of PM>2.5, measuring 30.7 µg/m
3. Hospital A and Hospital C recorded the highest indoor and outdoor concentrations of PM
2.5, which are 149.41 µg/m
3 and 227.45 µg/m
3, respectively. The current investigation also found that hospital B had the highest bacterial load, measuring 1389.21 CFU/m
3, while hospital C had the highest fungal load, measuring 786.34 CFU/m
3. As a result, the current study provides comprehensive information on the different air pollutants in an important indoor environment, which will help researchers in the area identify and mitigate the same with more precision. The amount of air pollution indoors is rising. However, hospitals often only monitor the indoor air quality of their radiology, intensive care, and surgery rooms. Therefore, their goals were to assess the indoor air quality of an outpatient otorhinolaryngology clinic and to compare hospital areas' air quality indices. Using air quality sensors at several hospital locations, they prospectively monitored the indoor air quality between February 1, 2019, and January 31, 2020. The concentrations of carbon dioxide (CO
2), total volatile organic compounds (VOCs), nitrogen dioxide, and particulate matter with a diameter of less than 2.5 μm (PM
2.5) were measured in the orthopedic clinic, reception area, and otorhinolaryngology clinic. The effectiveness of the intervention was evaluated in otorhinolaryngology clinics using air cleaners against those that did not. In comparison to the orthopedic clinic or reception area, the otorhinolaryngology clinic had noticeably higher total concentrations of CO
2, VOCs, and PM
2.5. Wintertime brought with it the lowest indoor air quality. Only in PM
2.5 concentrations in otorhinolaryngology clinics using air cleaners was the intervention effect seen.
For a month, Adamu et al. [
7] monitored the following parameters in a laboratory at the Bamidele Olomilua University of Education, Science, and Technology in Ikere-Ekiti: temperature, relative humidity (RH), particulate matter (PM
1.0, PM
2.5, and PM
10), carbon dioxide (CO
2), nitrogen dioxide (NO
2), ozone (O
3), and low-cost, easily-managed sensor system. We compared the resultant values with other standards and WHO guidelines. The National Institute for Occupational Safety and Health (NIOSH): 70 ppb; the National Ambient Air Quality Standards (NAAQS): 100 ppb; the National Environmental Standards and Regulations Enforcement Agency (NESREA): 120 ppb; and the World Health Organization (WHO): 25 ppb did not match the NO
2 levels (144.00–303.00 ppb), which may indicate an indoor contaminant source. Additionally, it was noted that there were significant daily variations in both temperature and humidity, which had an effect on the residents' ventilation and thermal comfort. The results of the principal component analysis (PCA) show that the main causes of variation in the air quality data are particulate matter, weather, photochemical reactions, and combustion activities. These components can affect the environment and human health in different ways depending on their quantity and interactions. In addition to helping to identify and minimize indoor airborne pollutant sources and improve indoor air quality (IAQ), our monitoring device can provide instant information and warnings. This work demonstrates that it is both feasible and advantageous to deploy a low-cost sensor system for IAQ measurement in developing countries, where such data are scarce and often erroneous.
Omeokachie et al. [
8] measured the environmental conditions found in a few shopping malls and used microbiological characterization to evaluate the quality of the interior environment. Three Ibadan shopping centers that were chosen using a convenience sample technique were the sites of investigations. Environmental factors included temperature, relative humidity, noise level, PM
2.5, total volatile organic compound (TVOC), and number of microorganisms were measured. Temperature and relative humidity—two microclimatic parameters—were measured with a 4-in-1 Precision Gold N09AQ multi-tester. The settle plate method was used to gather cultivable airborne microorganisms. Thermo Scientific MIE pDR-1500 PM monitor and sf200-TVOC meter were used to measure the levels of TVOCs and PM
2.5, respectively. Five fungal species and two bacterial species were isolated from the malls. The dB range for the noise levels was 61.27 to 81.20. The average temperature (peaking at 33.44 ± 1.42 °C), PM
2.5 concentration (peaking at 114.06 ± 25.64 μg/m
3), and TVOC concentration (peaking at 55.21 ± 8.28 ppm) exceeded the WHO guidelines' permitted limits as well as the NESREA standard limits in every mall that was chosen. Particulate matter and TVOC were shown to be positively correlated (r = 0.174, p = 0.004). With a mean of 1965.33 ± 368.56 CFU/m
3, the total count of bacteria was generally high, whereas the total count of fungi was generally low, with a mean of 579.82 ± 51.55 CFU/m
3. All sample locations throughout the three malls showed consistent levels of Bacillus and Candida species. Since the identified bacteria are Gram-positive and linked to human skin, indoor pollution from people may be a major problem. In conclusion, this study has shown how important it is to keep an eye on mall indoor air quality and noise levels. Government regulations and enforcement are also necessary to improve indoor air quality, particularly in retail centers.
In Nigeria's Akwa Ibom State, schools' indoor air quality (IAQ) was evaluated by Ite et al. [
9] in both the rainy (June–July) and dry (November–December) seasons of 2018. IAQ parameters were looked at in a single environment (naturally ventilated classrooms) to evaluate the pollutant levels in schools in Akwa Ibom State. The schools were chosen at random from two zones: zone 1, which is the "urban sector" and is situated within the Capital City (Uyo metropolis); zone 2, which is the "industrial sector" and is located in the southern part of the state near the oil and gas industrial region. Particulate matter (PM
1, PM
2, PM
5, and PM
10), carbon monoxide (CO), carbon dioxide (CO
2) levels, temperature, and relative humidity were all measured concurrently over the course of fourteen (14) sampling days for the indoor air investigation using the Fluke 985 Particle Counter and Fluke 975 AirMeter. To compare IAQ values and look for significant changes between the zones (urban vs. industrial) and annual seasonal variations, multiple statistical analytic techniques were applied. The concentrations of particulate matter (PM) in the naturally ventilated classroom in industrial zone during the rainy season ranged from 5152 – 5984 μg/m
3 for PM
1; 2744 – 3207 μg/m
3 for PM
2; 137 – 149 μg/m
3 for PM
5; 38 – 46 μg/m
3 for PM
10 and in urban zone, the concentrations of PM ranged from 1978 – 2491 μg/m
3 for PM
1; 1010 – 1311 μg/m
3 for PM
2; 38 – 56 μg/m
3 for PM
5; 15 – 24 μg/m
3 for PM
10. During the dry season, the concentrations of PM in the naturally ventilated classroom in industrial zone ranged from 6138 – 6999 μg/m
3 for PM
1; 2984 – 3980 μg/m
3 for PM
2; 146 – 159 μg/m
3 for PM
5; 47 – 59 μg/m
3 for PM
10 and in urban zone, the concentrations of PM ranged from 2556 – 3972 μg/m
3 for PM
1; 1911 – 2311 μg/m
3 for PM
2; 51 – 66 μg/m
3 for PM
5; 18 – 34 μg/m
3 for PM
10. The findings of this investigation have demonstrated that during both the rainy and dry seasons, the levels of PM
1, PM
2, PM
5, and PM
10 detected in the naturally ventilated classroom located in the industrial zone were considerably (p < 0.001) greater than those recorded in the urban zone. The current study's measured PM10 concentrations were found to be significantly lower than the ambient maximum contaminant level for airborne PM
10 standard set by the World Health Organization (WHO) and the United States Environmental Protection Agency (US-EPA), which are 50 μg/m
3 daily average and 50 μg/m
3 annual average and 150 μg/m
3 daily average, respectively. In addition to the re-suspension of airborne particles, human activities in the industrial zone had a substantial impact on the PM concentrations that were recorded, as opposed to those in the urban zone. Furthermore, the lower CO and CO
2 concentrations observed throughout the sampling period suggested that there was sufficient air exchange in the naturally ventilated classrooms at the time of the assessment. The outcomes show significant advancements in our knowledge of the patterns of airborne PM distribution, and the data at hand can be utilized to inform public health initiatives.
Kanee et al. [
10] state that there is a serious environmental risk to human health as a result of the recent degradation of urban air quality in emerging nations like Nigeria. A 10 μg/m
3 increase in ambient particulate matter (PM
10) has been demonstrated to shorten life expectancy by 0.64 years. The study's demonstration of the Air Quality Index (AQI) reveals the relative cleanliness or pollution of the boundary layer environment at any given place. The purpose of the study was to determine the levels of suspended particulate matter (PM
2.5 and PM
10) in Abuja during the dry and rainy seasons, as well as to calculate the prevalent air quality index at specific places that may have health effects. Handheld aerosol particulate sampler was used to measure suspended particulate matter (PM
2.5 and PM
10). For the eleven (11) sites that were sampled and watched over, the US Oak Ridge National AQI was used. The study's findings demonstrated that the chosen Abuja neighborhoods had generally good and healthy air quality. PM
2.5 and PM
10 evaluations during the dry season ranged from 15 to 95 μg/m
3 and 12 to 80 μg/m
3, respectively. During the rainy season, PM
2.5 and PM
10 readings were 09–75 μg/m
3 and 07–65 μg/m
3, respectively. On the other hand, Jebi Central Motor Park experienced mild air pollution, with an AQI of 42 during the dry season and 31 during the wet season. The AQI was < 11 in other areas, indicating clean air. It is discovered that the wet season is when pure air is typically found. When comparing the study's findings to those of other Nigerian cities, it appears that particulate matter pollution poses no health risks to Abuja's citizens. The WHO-recommended threshold of 0.5 to 0.8 was not met by the high range of PM
2.5 and PM
10 (fine and coarse particles) ratios examined, i.e., 1.06 - 1.79. For vulnerable residents, such as expectant mothers and their fetus and young children under five, whose respiratory airways are known to have large surface surfaces and a high capacity for absorbing fine particulate matter, this ratio continues to be a health risk. The urban areas of Abuja should be covered with vegetation that is known to absorb dispersed particulate matter, and air quality monitoring stations should be placed in key locations to allow for ongoing assessment and monitoring.
The mass concentration of particulate matter (PM) in Kano and Abuja was examined by Meseke et al. [
11]. PM
1.0, PM
2.5, and PM
10.0 were all measured using a purple air sensor, and some meteorological parameters, such as temperature and relative humidity, were also assessed. Monitoring was done in Kano and Abuja from January to December of 2021. The two areas' monthly PM exceeds the WHO 24-hour guideline, according to the results. In both locations, the mean value of PM
2.5 indicates that the air quality is dangerous for sensitive individuals, such as those with respiratory ailments, when the standard limit of the Air Quality Index (AQI) is taken into account. In contrast, the mean value of PM
10.0 indicates that the air quality was moderate for both sensitive and non-sensitive individuals. The study's findings recommend that the government of Nigeria tighten up on its current air quality laws and place new air quality monitors in strategic places so that more research may be conducted in these areas. According to the findings of a Pearson correlation analysis, there is a significant negative association between PMs and relative humidity, meaning that when relative humidity increases in either location, PM mass concentration will likewise decrease. For both locations, there was a comparatively large link between temperature and PMs.
3. Results
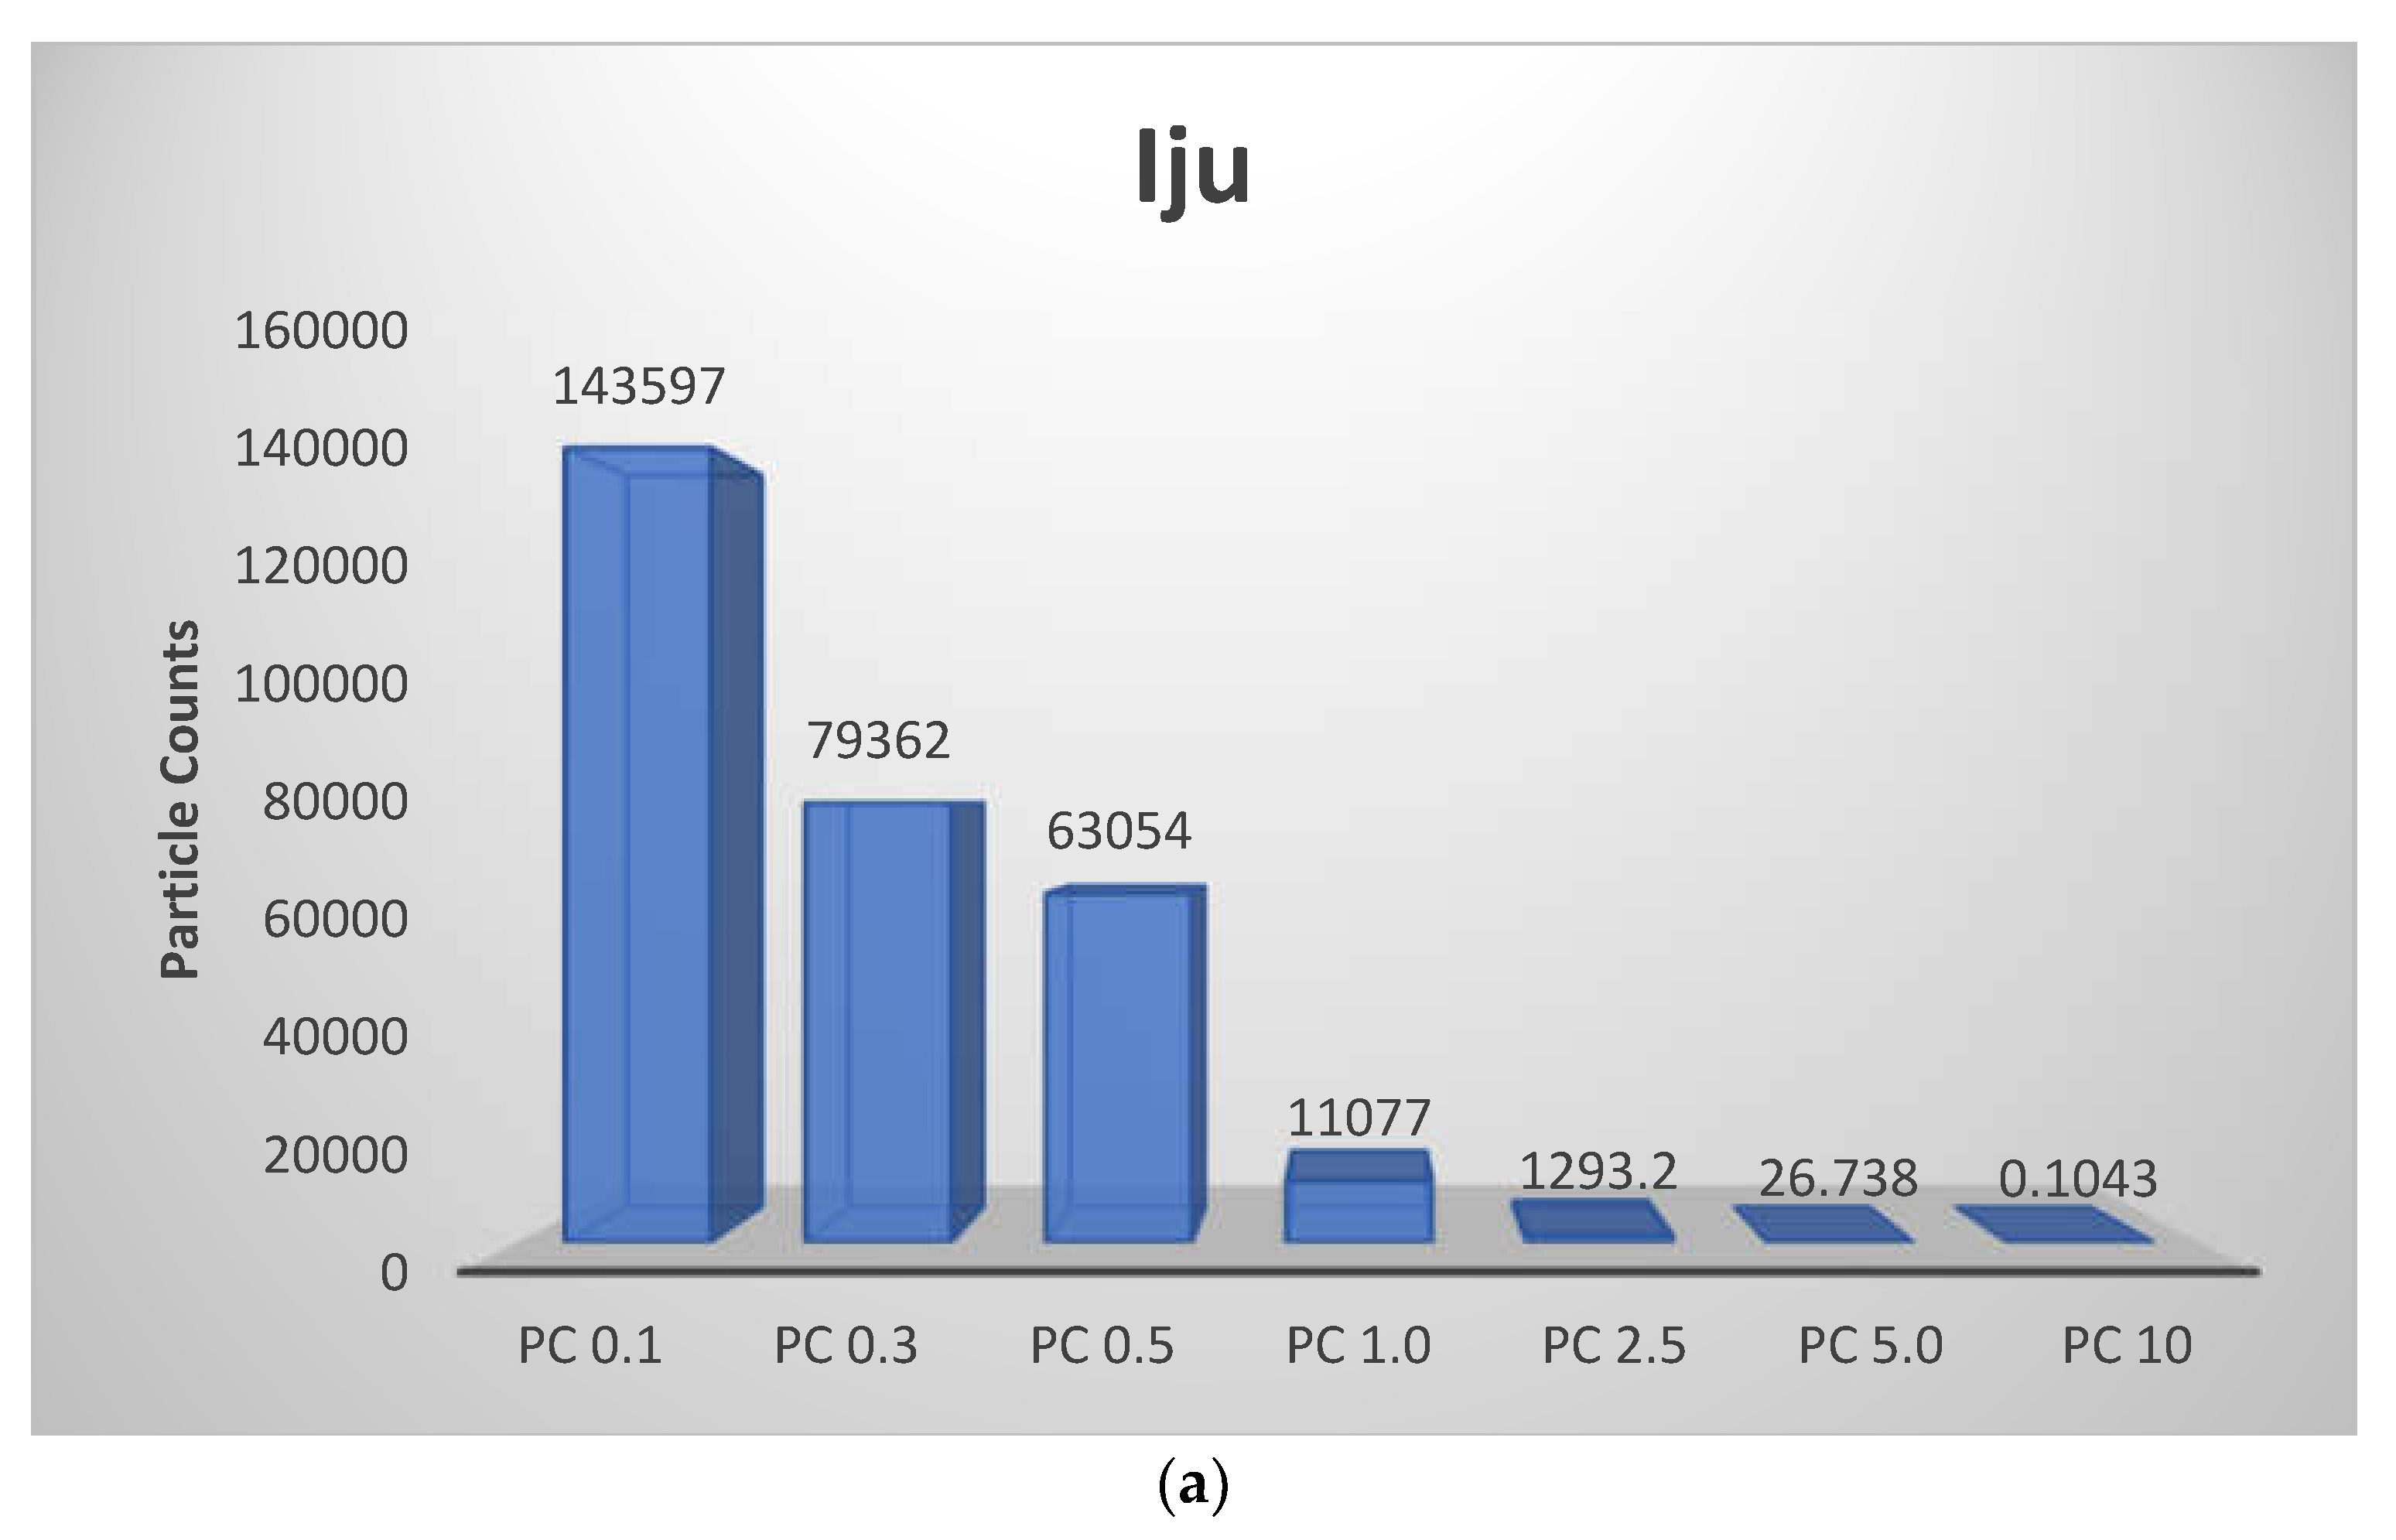
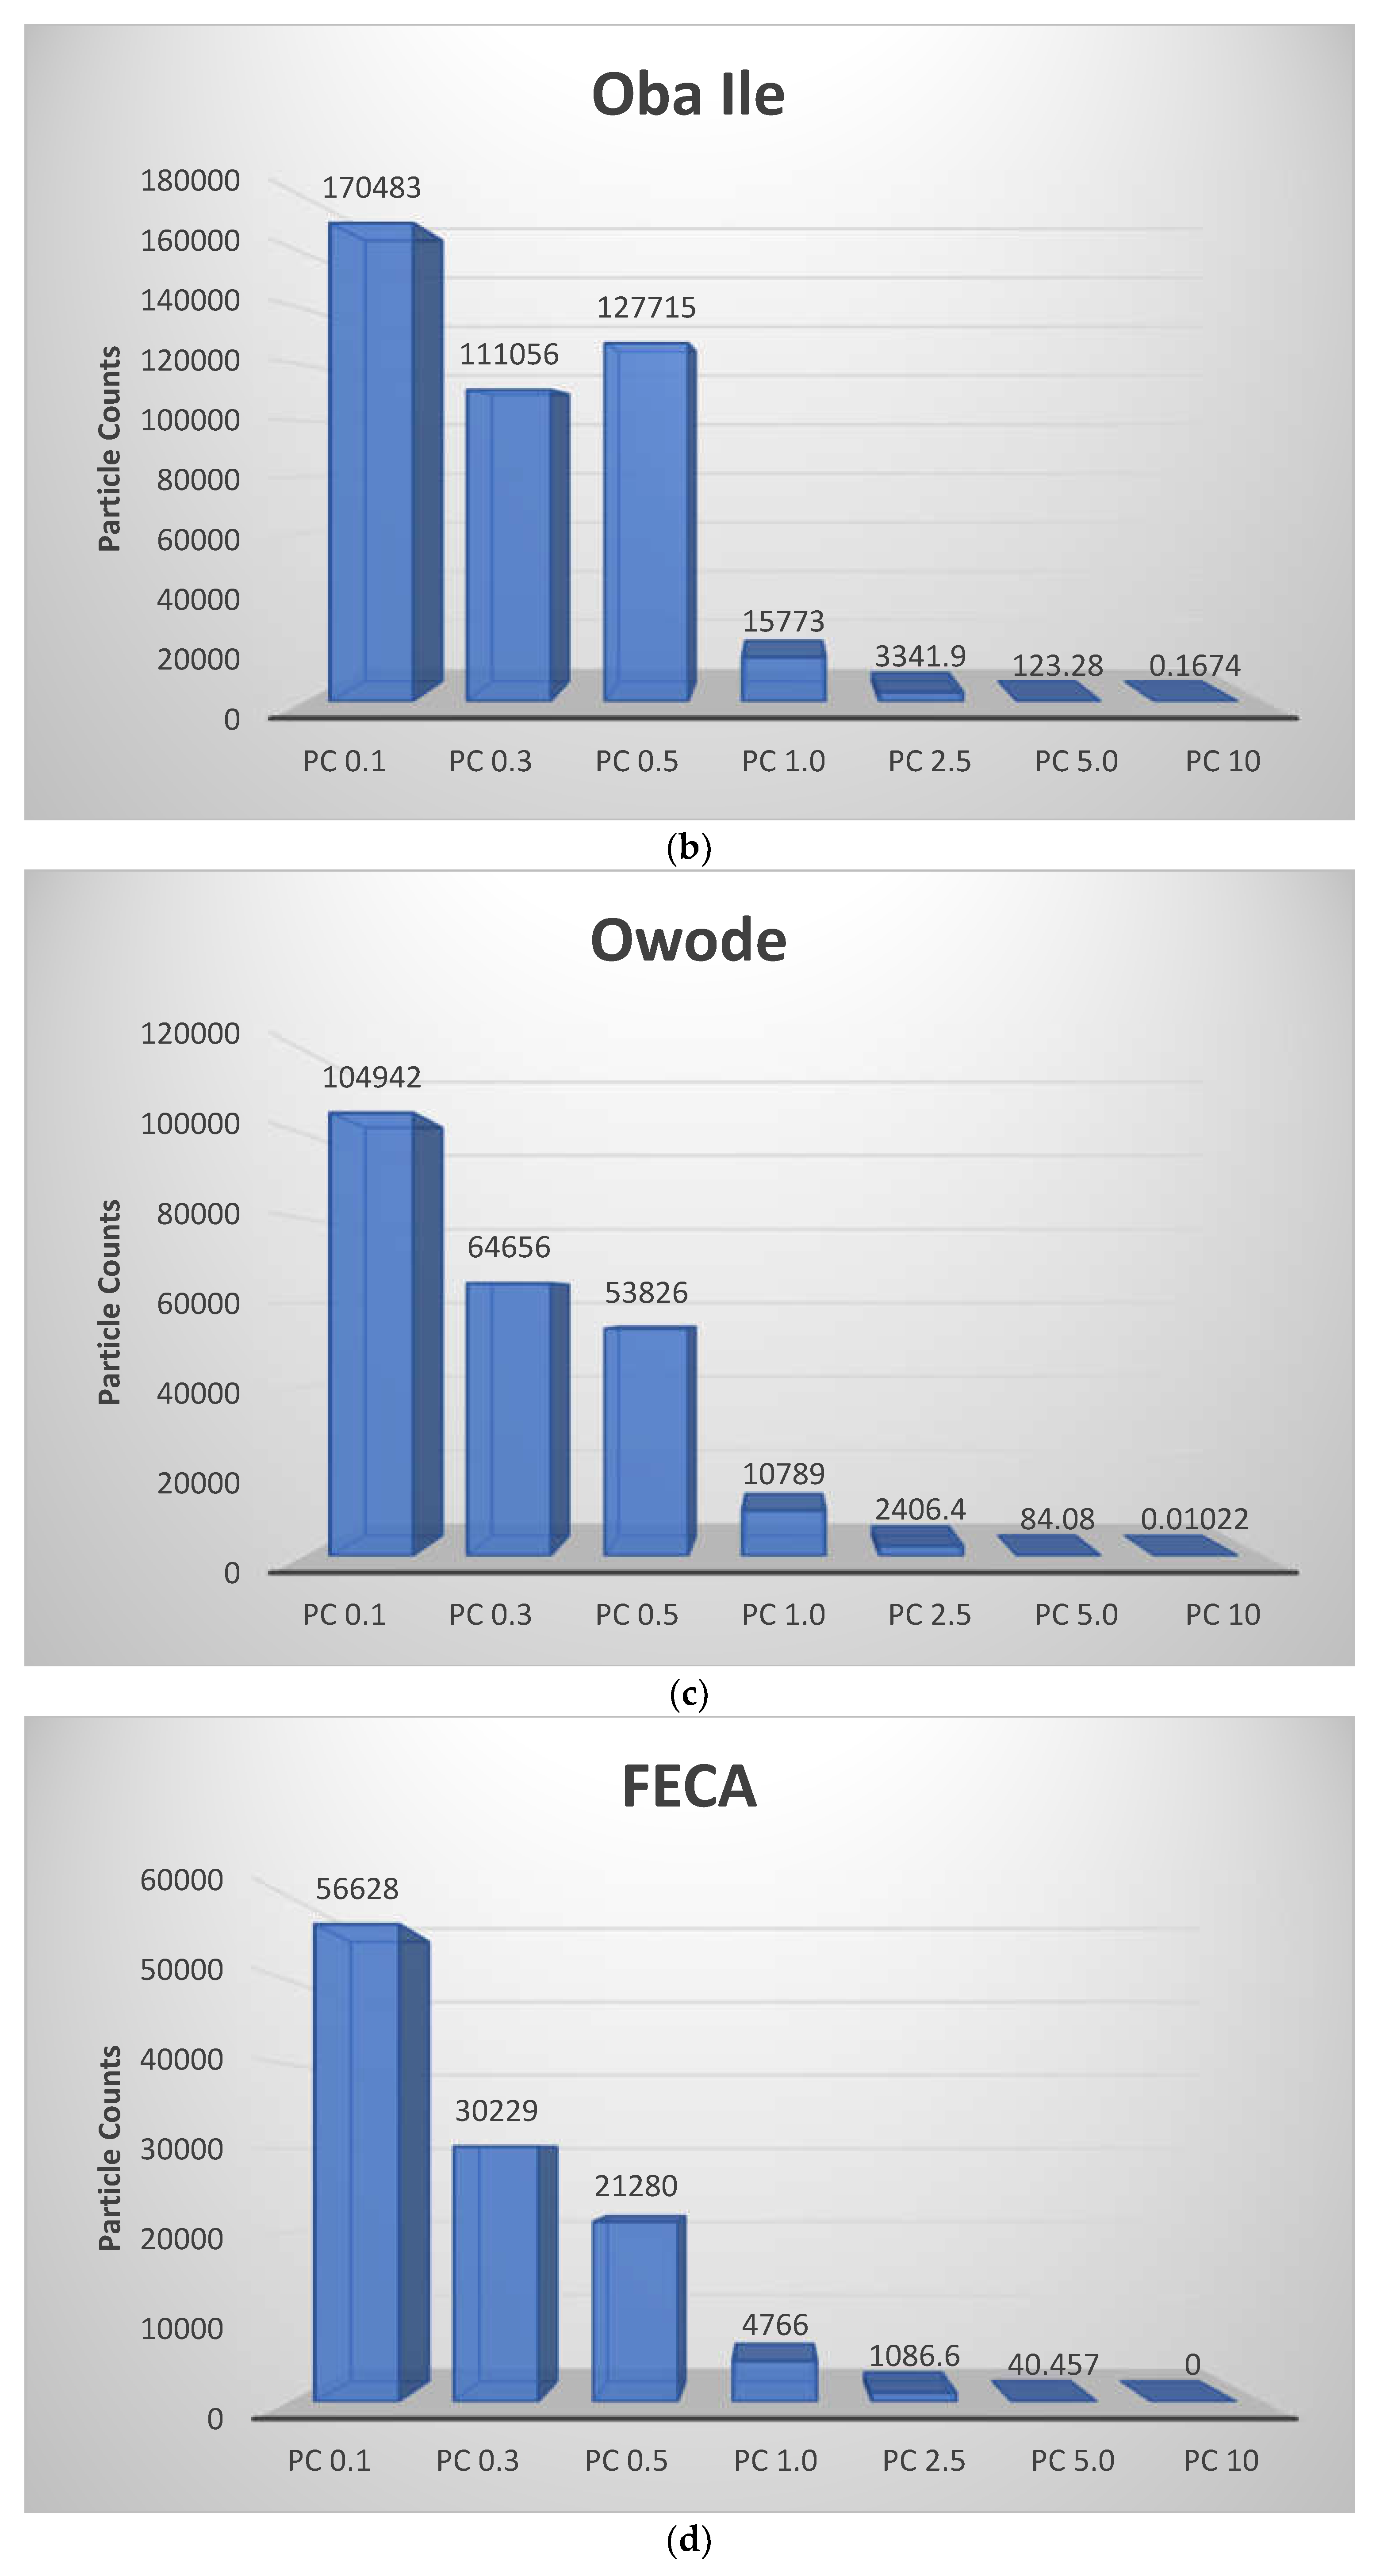
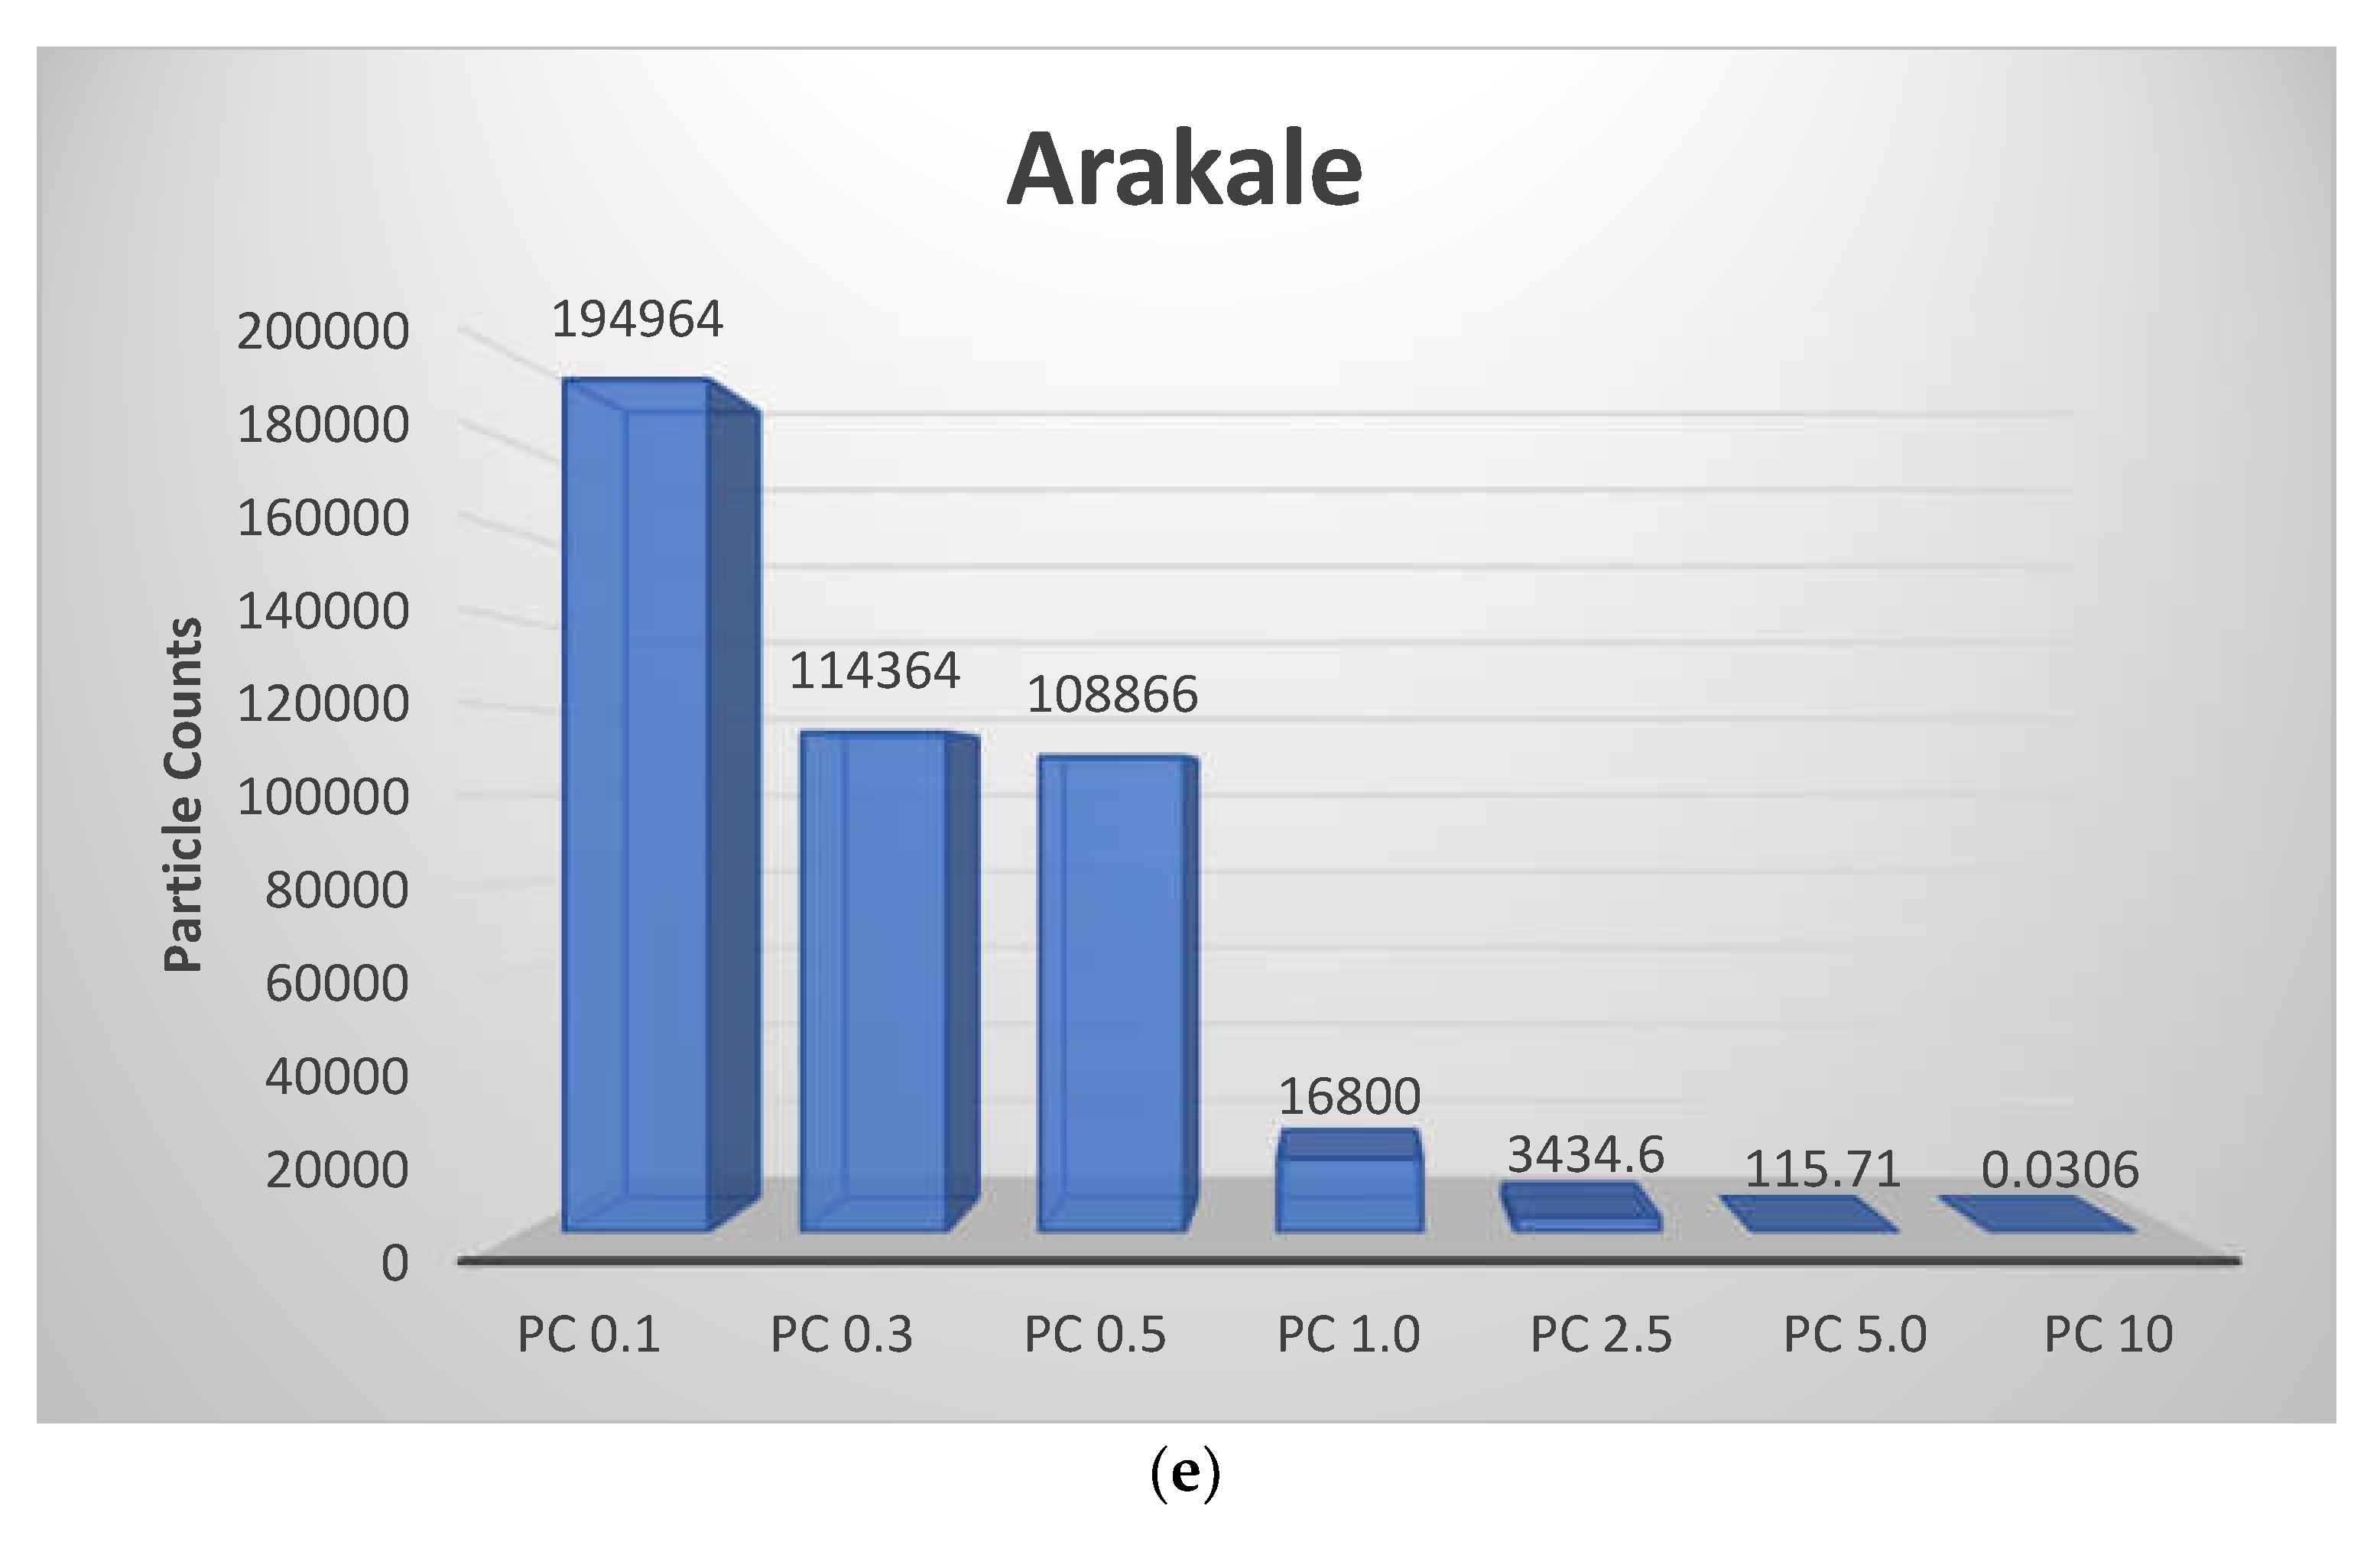
Table 1 presents particle count data for indoor air pollution in different health center locations (Iju, Oba Ile, Owode, FECA, Arakale) across various particle sizes (0.1, 0.3, 0.5, 1.0, 2.5, 5.0, and 10 micrometers). The mean particle counts (
Figure 1 (a-e)) vary across locations and particle sizes, indicating differences in pollution levels. Locations like Oba Ile and Arakale generally exhibit higher mean particle counts compared to others. The standard deviation and CV provide insights into the dispersion of data points around the mean. Higher standard deviations and CVs suggest greater variability in particle counts, indicating fluctuations in air pollution levels. The range between the minimum and maximum values reflects the variability in particle counts within each location and particle size. Locations such as Owode show wider ranges, indicating significant fluctuations in air pollution levels indicating that Owode exhibit higher variability in particle counts, showing potentially poorer air quality compared to other locations. Locations with higher variability in particle counts may experience inconsistent air quality, potentially due to varying pollution sources or environmental conditions. Understanding these variations is crucial for implementing targeted air quality interventions and monitoring strategies. Consistent trends across different particle sizes within a location may indicate common pollution sources or similar indoor air quality conditions [
13]. Discrepancies in particle counts between sizes could suggest varying sources or behaviors of particles in indoor environments [
14,
15].
Figure 2.
(a-e): The mean particle count data for indoor air pollution in different health center locations (a)Iju, (b) Oba Ile, (c) Owode, (d) FECA, (e) Arakale).
Figure 2.
(a-e): The mean particle count data for indoor air pollution in different health center locations (a)Iju, (b) Oba Ile, (c) Owode, (d) FECA, (e) Arakale).
Table 2.
Basic Description of the Particle Counts from the Health Center Locations.
Table 2.
Basic Description of the Particle Counts from the Health Center Locations.
| Variables |
Mean |
Std Dev. |
CV (%) |
Minimum |
Q1 |
Q3 |
Maximum |
| |
|
|
Iju |
|
|
|
|
| PC 0.1 |
143597 |
37647 |
26.22 |
46900 |
118139 |
171914 |
277082 |
| PC 0.3 |
79362 |
22472 |
28.32 |
24817 |
63384 |
96356 |
157911 |
| PC 0.5 |
63054 |
26479 |
41.99 |
17259 |
39989 |
85499 |
145282 |
| PC 1.0 |
11077 |
3155 |
28.48 |
4074 |
9488 |
12584 |
51930 |
| PC 2.5 |
1293.2 |
678.6 |
52.47 |
312.0 |
927.0 |
1544.5 |
12904.0 |
| PC 5.0 |
26.738 |
20.489 |
76.63 |
7.00 |
18.000 |
33.000 |
536.000 |
| PC 10 |
0.1043 |
2.5063 |
2402.46 |
0.0000 |
0.0000 |
0.0000 |
74.0000 |
| |
|
|
Oba Ile |
|
|
|
|
| PC 0.1 |
170483 |
63527 |
37.26 |
9050 |
159834 |
191229 |
433630 |
| PC 0.3 |
111056 |
43372 |
39.05 |
4986 |
101676 |
133884 |
298475 |
| PC 0.5 |
127715 |
67596 |
52.93 |
1942 |
80299 |
170034 |
534151 |
| PC 1.0 |
15773 |
7888 |
50.01 |
726 |
12083 |
19183 |
83568 |
| PC 2.5 |
3341.9 |
1609.4 |
48.16 |
286.0 |
2662.0 |
4036.0 |
18627.0 |
| PC 5.0 |
123.28 |
53.90 |
43.72 |
14.00 |
96.00 |
147.00 |
584.00 |
| PC 10 |
0.1674 |
3.2779 |
3.3779 |
0.0000 |
0.0000 |
0.0000 |
75.0000 |
| |
|
|
Owode |
|
|
|
|
| PC 0.1 |
104942 |
72233 |
68.83 |
19430 |
53922 |
141847 |
535791 |
| PC 0.3 |
64656 |
50560 |
78.20 |
10702 |
30042 |
88994 |
375551 |
| PC 0.5 |
53826 |
73014 |
135.65 |
47743 |
15000 |
64376 |
573388 |
| PC 1.0 |
10789 |
13578 |
125.86 |
2135 |
4873 |
12367 |
139013 |
| PC 2.5 |
2406.4 |
3011.1 |
125.13 |
614.0 |
1240.8 |
2567.3 |
32862.0 |
| PC 5.0 |
84.08 |
75.93 |
90.30 |
27.00 |
53.00 |
91.00 |
852.00 |
| PC 10 |
0.01022 |
0.10061 |
984.52 |
0.0000 |
0.0000 |
0.0000 |
1.0000 |
| |
|
|
FECA |
|
|
|
|
| PC 0.1 |
56628 |
25749 |
45.47 |
25920 |
36858 |
71205 |
168159 |
| PC 0.3 |
30229 |
14192 |
46.95 |
13888 |
19627 |
38402 |
94898 |
| PC 0.5 |
21280 |
11346 |
53.32 |
8158 |
13419 |
28355 |
75028 |
| PC 1.0 |
4766 |
2377 |
49.87 |
1847 |
3101 |
6099 |
16930 |
| PC 2.5 |
1086.6 |
486.1 |
44.74 |
481.0 |
768.0 |
1360.0 |
3709.0 |
| PC 5.0 |
40.457 |
13.502 |
33.37 |
19.000 |
31.000 |
49.000 |
105.000 |
| PC 10 |
0.0000 |
0.0000 |
0.0000 |
0.0000 |
0.0000 |
0.0000 |
0.0000 |
| |
|
|
Arakale |
|
|
|
|
| PC 0.1 |
194964 |
56757 |
29.11 |
26268 |
179182 |
226138 |
456359 |
| PC 0.3 |
114364 |
35630 |
31.15 |
13278 |
103654 |
133758 |
290865 |
| PC 0.5 |
108866 |
45399 |
41.70 |
7150 |
86667 |
132728 |
403001 |
| PC 1.0 |
16800 |
6225 |
37.06 |
1630 |
14750 |
19239 |
68889 |
| PC 2.5 |
3434.6 |
1334.1 |
38.84 |
379.0 |
2936.0 |
3973.0 |
15090.0 |
| PC 5.0 |
115.71 |
49.46 |
42.74 |
4.00 |
87.00 |
140.00 |
504.00 |
| PC 10 |
0.0306 |
1.2375 |
1.2375 |
0.0000 |
0.0000 |
0.0000 |
52.0000 |
Elevated particle counts, especially for smaller sizes like 2.5 and 1.0 micrometers, can pose health risks, including respiratory issues and cardiovascular problems. Higher particle counts in indoor environments like Owode suggest inadequate ventilation or indoor pollution sources, warranting further investigation and remediation. Regular monitoring of particle counts is essential for assessing indoor air quality and implementing effective mitigation strategies to reduce health risks associated with air pollution exposure [
16].
Table 3(a-e) show the comparison of the PCA results for indoor air pollution particle counts in the five health centers. All locations showed a positive influence of (PC 0.1, 0.3, 0.5) on PC1, suggesting a common factor affecting these finer particles. This likely points towards combustion sources like generators, cooking stoves, or other processes releasing fine particles indoors. A very high positive loading of PC 10 on PC2 was observed in all locations except Iju. This indicates a strong influence by a distinct factor on this largest size, with outdoor air intrusion or resuspension of coarse particles settled on surfaces [
17]. Compared to other locations, Iju exhibited a more complex pattern with distinct influences on PC 1.0 (high loading on PC4) and PC 5.0 (high loading on PC6). This suggests potential sources or contributing factors unique to Iju that require further investigation. Similar to Iju, FECA showed a more intricate pattern with negative loadings on several components for PC 0.5, PC 2.5, and PC 5.0. These opposing influences indicate factors potentially mitigating or reducing the presence of these particle sizes, alongside possible sources contributing to them. Oba Ile displayed a high negative loading on PC5, which might be related to factors reducing larger particles (PC 5.0) like ventilation or filtration. This suggests a potential difference in control strategies compared to other locations.
Table 3.
(a-e): The Principal Components Analysis of the Results obtained from the Locations.
Table 3.
(a-e): The Principal Components Analysis of the Results obtained from the Locations.
| Eigenvectors |
|---|
| Variable |
PC1 |
PC2 |
PC3 |
PC4 |
PC5 |
PC6 |
PC7 |
| PC0.1 |
0.431 |
-0.200 |
0.291 |
0.355 |
-0.279 |
-0.010 |
0.696 |
| PC0.3 |
0.428 |
-0.201 |
0.341 |
0.270 |
-0.276 |
0.001 |
-0.714 |
| PC0.5 |
0.422 |
-0.173 |
0.302 |
-0.780 |
0.245 |
-0.171 |
0.057 |
| PC1.0 |
0.434 |
-0.104 |
-0.374 |
0.357 |
0.724 |
-0.087 |
-0.035 |
| PC2.5 |
0.389 |
0.050 |
-0.727 |
-0.219 |
-0.507 |
-0.108 |
-0.015 |
| PC5.0 |
0.312 |
0.570 |
0.074 |
-0.073 |
0.061 |
0.751 |
0.012 |
| PC10 |
0.126 |
0.743 |
0.181 |
0.108 |
-0.004 |
-0.623 |
-0.006 |
| (a) Iju |
| Eigenvectors |
| Variable |
PC1 |
PC2 |
PC3 |
PC4 |
PC5 |
PC6 |
PC7 |
| PC0.1 |
0.406 |
-0.089 |
0.529 |
-0.306 |
0.079 |
0.047 |
0.667 |
| PC0.3 |
0.409 |
-0.090 |
0.487 |
-0.192 |
0.034 |
0.022 |
-0.741 |
| PC0.5 |
0.406 |
-0.087 |
0.090 |
0.892 |
0.022 |
0.135 |
0.067 |
| PC1.0 |
0.414 |
-0.056 |
-0.338 |
-0.046 |
0.261 |
-0.800 |
0.013 |
| PC2.5 |
0.408 |
0.021 |
-0.522 |
-0.227 |
0.416 |
0.579 |
-0.025 |
| PC5.0 |
0.404 |
0.210 |
-0.255 |
-0.124 |
-0.843 |
0.035 |
0.024 |
| PC10 |
0.040 |
0.964 |
0.149 |
0.063 |
0.202 |
-0.048 |
-0.005 |
| (b) Oba Ile |
| Eigenvectors |
| Variable |
PC1 |
PC2 |
PC3 |
PC4 |
PC5 |
PC6 |
PC7 |
| PC0.1 |
0.407 |
-0.033 |
-0.520 |
-0.092 |
0.344 |
0.056 |
0.658 |
| PC0.3 |
0.409 |
-0.032 |
-0.477 |
0.025 |
0.218 |
0.030 |
-0.745 |
| PC0.5 |
0.409 |
-0.030 |
-0.070 |
0.635 |
-0.639 |
0.066 |
0.108 |
| PC1.0 |
0.413 |
-0.024 |
0.153 |
-0.454 |
-0.276 |
-0.723 |
0.006 |
| PC2.5 |
0.411 |
0.002 |
0.325 |
-0.482 |
-0.186 |
0.677 |
-0.026 |
| PC5.0 |
0.399 |
0.092 |
0.601 |
0.385 |
0.559 |
-0.103 |
0.003 |
| PC10 |
0.011 |
0.994 |
-0.087 |
-0.028 |
-0.059 |
-0.004 |
0.001 |
| (c) Owode |
| Eigenvectors |
| Variable |
PC1 |
PC2 |
PC3 |
PC4 |
PC5 |
PC6 |
PC7 |
| PC0.1 |
0.413 |
-0.010 |
0.305 |
0.424 |
0.284 |
0.199 |
0.660 |
| PC0.3 |
0.414 |
-0.015 |
0.298 |
0.426 |
0.191 |
-0.235 |
-0.683 |
| PC0.5 |
0.412 |
-0.030 |
0.228 |
-0.082 |
-0.865 |
-0.117 |
0.097 |
| PC1.0 |
0.418 |
0.004 |
0.046 |
-0.491 |
0.134 |
0.711 |
-0.240 |
| PC2.5 |
0.416 |
0.005 |
-0.091 |
-0.545 |
0.329 |
-0.618 |
0.177 |
| PC5.0 |
0.373 |
-0.008 |
-0.869 |
0.305 |
-0.089 |
0.061 |
-0.009 |
| PC10 |
0.022 |
0.999 |
0.008 |
0.015 |
-0.023 |
-0.005 |
-0.001 |
| (d) FECA |
| Eigenvectors |
| Variable |
PC1 |
PC2 |
PC3 |
PC4 |
PC5 |
PC6 |
PC7 |
| PC0.1 |
0.407 |
-0.033 |
-0.520 |
-0.092 |
0.344 |
0.056 |
0.658 |
| PC0.3 |
0.409 |
-0.032 |
-0.477 |
0.025 |
0.218 |
0.030 |
-0.745 |
| PC0.5 |
0.409 |
-0.030 |
-0.070 |
0.635 |
-0.639 |
0.066 |
0.108 |
| PC1.0 |
0.413 |
-0.024 |
0.153 |
-0.454 |
-0.276 |
-0.723 |
0.006 |
| PC2.5 |
0.411 |
0.002 |
0.325 |
-0.482 |
-0.186 |
0.677 |
-0.026 |
| PC5.0 |
0.399 |
0.092 |
0.601 |
0.385 |
0.559 |
-0.103 |
0.003 |
| PC10 |
0.011 |
0.994 |
-0.087 |
-0.028 |
-0.059 |
-0.004 |
0.001 |
| (e) Arakale |
To conclude, combustion sources (Generators, cooking stoves, smoking indoors, fireplaces) are likely significant contributors to indoor air pollution across all health centers, particularly affecting finer particles. Outdoor air intrusion (Lack of proper ventilation, pollutants entering through leaks or windows) or resuspension of settled particles might be a concern for larger particles, especially in locations without a high loading on PC2 (e.g., Iju). Iju and FECA might have additional, location-specific factors influencing indoor air quality that require further investigation. Oba Ile suggests potential benefits from existing ventilation or filtration strategies that reduce larger particles. In all the locations, chemical emissions from cleaning agents or disinfectants might have contributed to the indoor problems. By comparing the PCA results and considering these potential sources, health authorities can prioritize interventions to improve indoor air quality in each location [
18]. This will lead to healthier and safer environments for patients, staff, and visitors at these health centers.
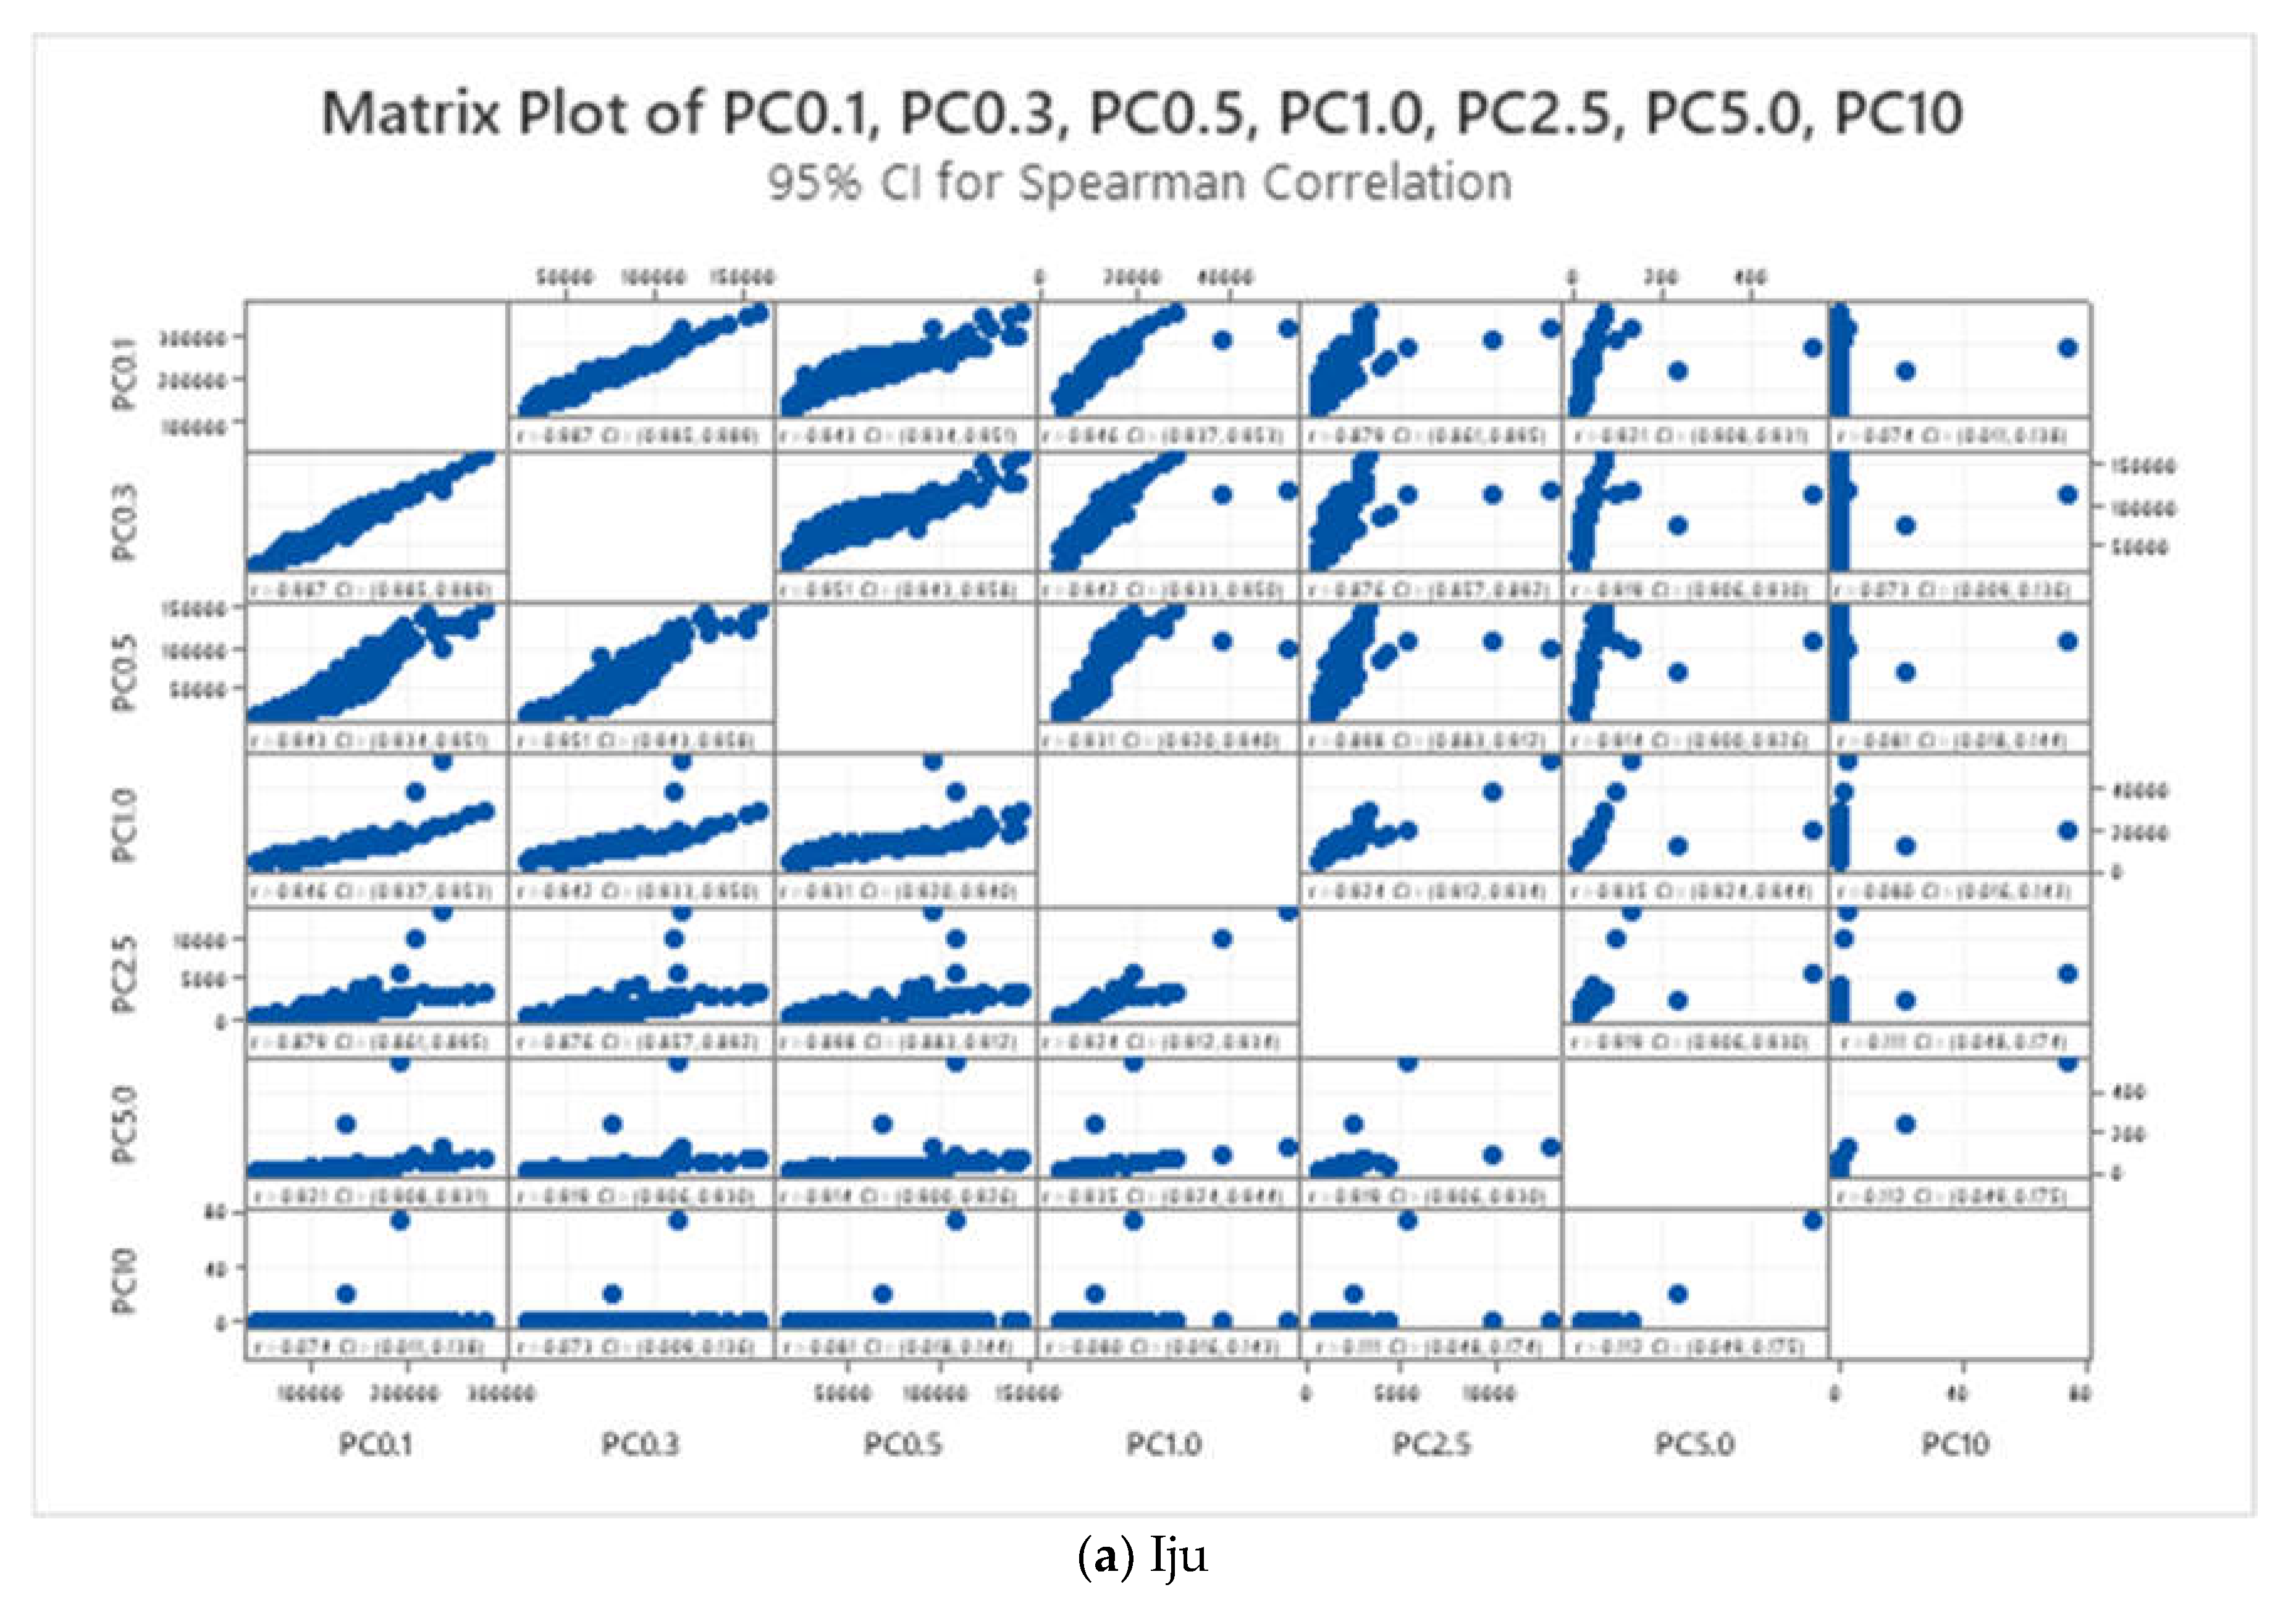
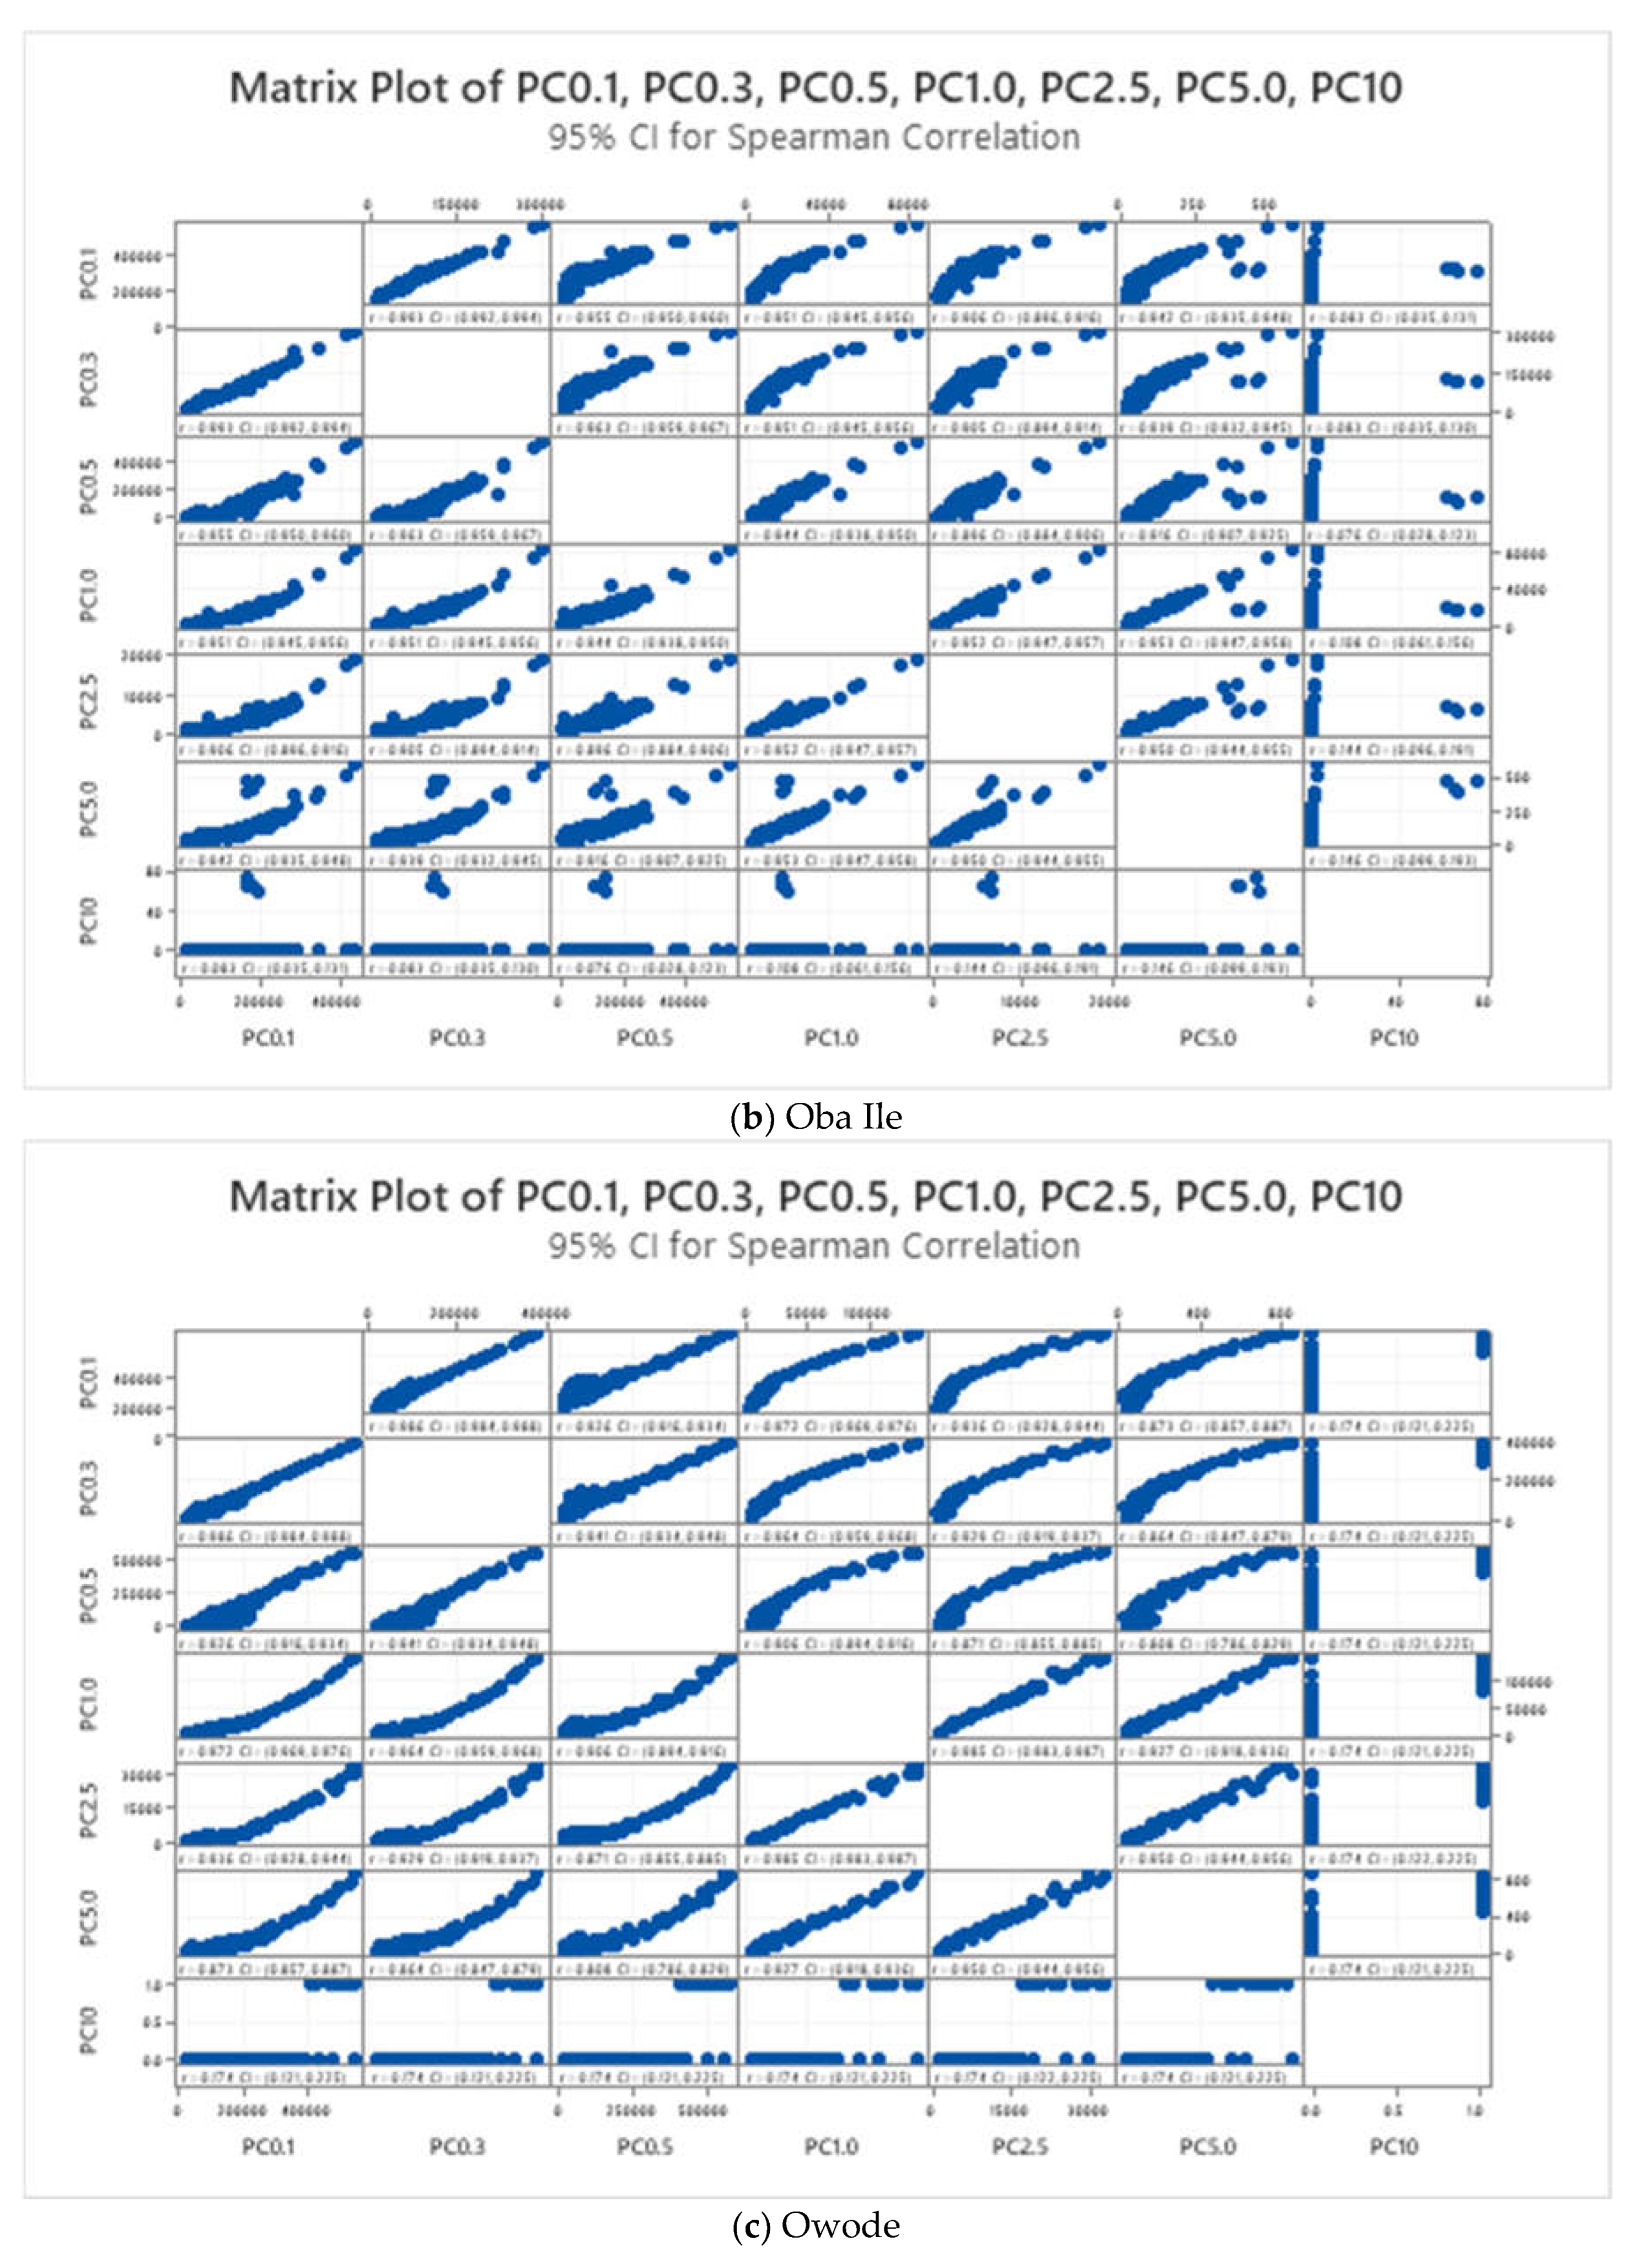
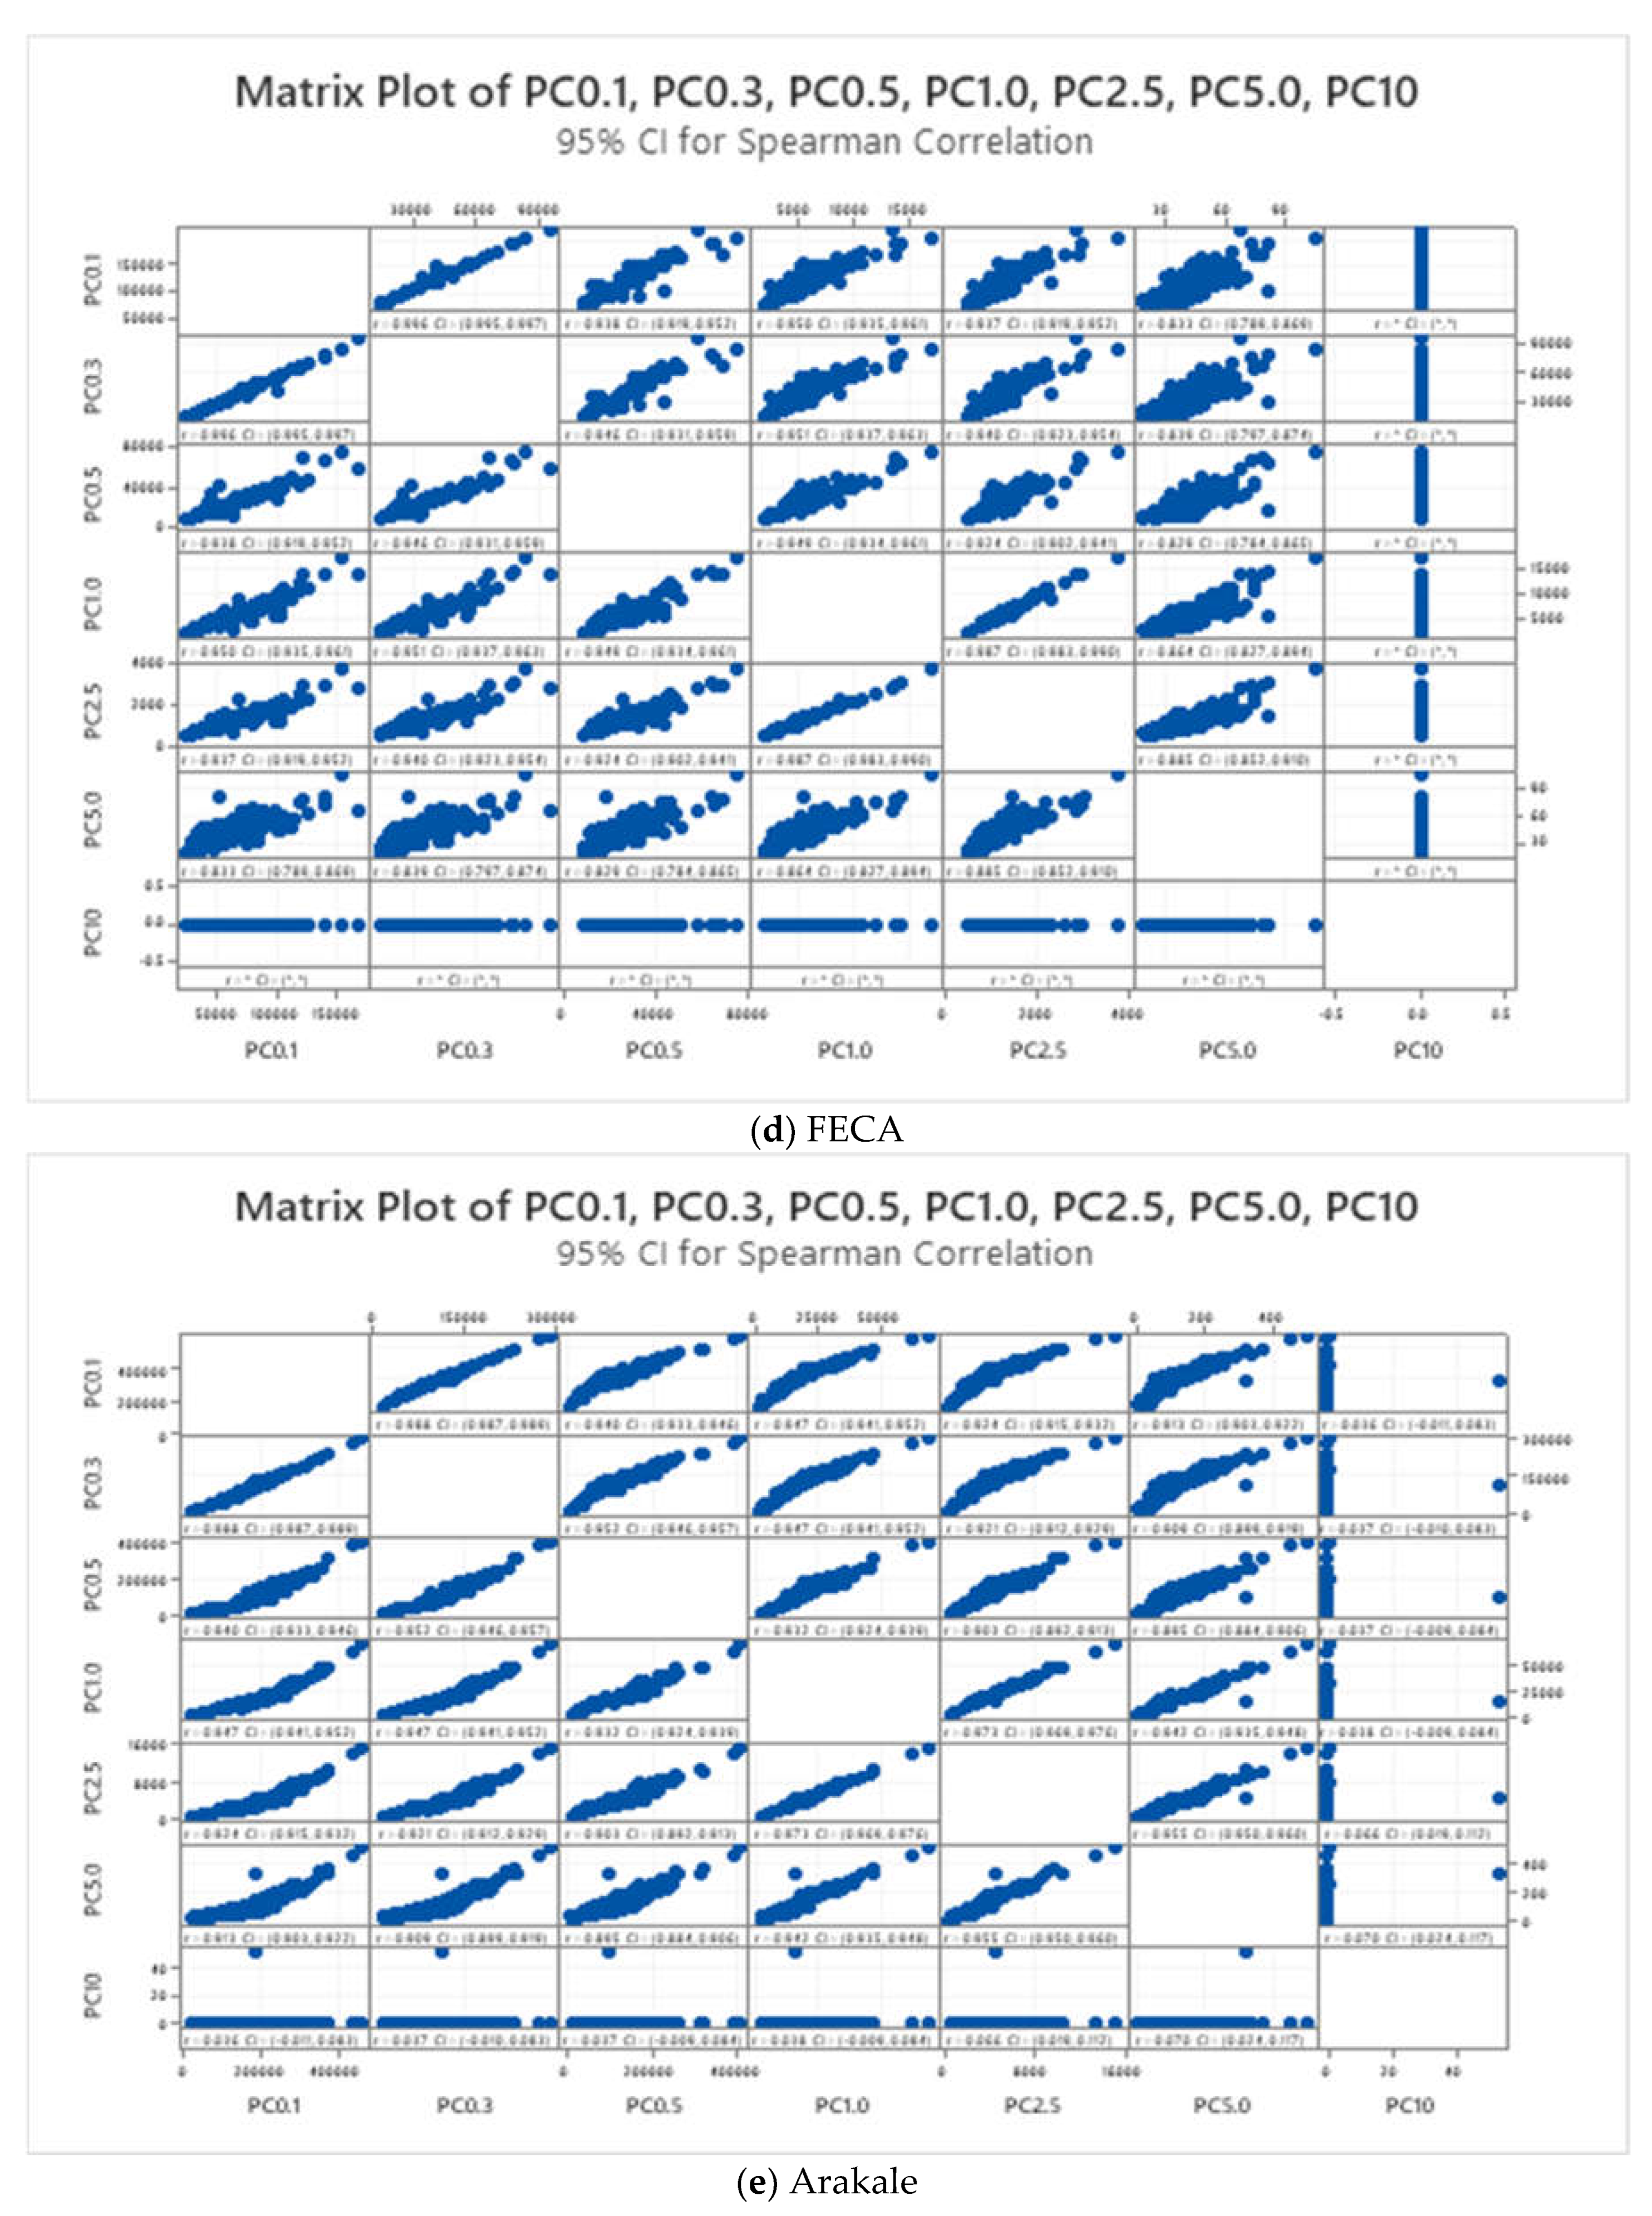
The correlation results between particle counts (PC) at various size ranges provide valuable insights into the relationship between different types of airborne particles in the studied locations (
Figure 3(a-e). In Iju health center strong positive correlations are observed between particle counts at different size ranges (e.g., PC0.3:PC0.1=0.987, PC0.5:PC0.3=0.951), indicating consistency in the levels of particles of various sizes. These results suggest that the presence of smaller particles (PC0.1) is highly indicative of the concentrations of larger particles (PC0.3, PC0.5), implying a uniform distribution of particles across different size ranges in the air. Such correlations indicate a potential common source or behavior of particles in the indoor environment, which could be attributed to factors such as indoor activities, building materials, or outdoor air pollution sources. Similar to Iju, strong positive correlations between particle counts at different size ranges are observed (e.g., PC0.3:PC0.1=0.993, PC0.5:PC0.3=0.963) in Oba Ile health center, indicating consistent patterns in particle concentrations. These results suggest that the presence of smaller particles (PC0.1) serves as a reliable indicator of the levels of larger particles (PC0.3, PC0.5), reflecting uniformity in particle distribution across size ranges. The high correlations imply that factors influencing particle emissions or behaviors are consistent across the studied locations, which could include common indoor activities, building characteristics, or outdoor pollution sources.
Figure 3.
(a-e): The Correlation Coefficient of the Results obtained from the Locations.
Figure 3.
(a-e): The Correlation Coefficient of the Results obtained from the Locations.
Also, Owode health center recorded strong positive correlations are observed between particle counts at different size ranges (e.g., PC0.3:PC0.1=0.986, PC0.5:PC0.3=0.941), indicating consistent relationships between particles of varying sizes. These results suggest that the presence of smaller particles (PC0.1) is indicative of the concentrations of larger particles (PC0.3, PC0.5), implying uniformity in particle distribution across size ranges. The findings highlight the importance of understanding the common sources or behaviors of particles in indoor environments, which could inform strategies for mitigating indoor air pollution in healthcare facilities [
19]. Likewise FECA health strong positive correlations are between particle counts at different size ranges are observed (e.g., PC0.3:PC0.1=0.996, PC0.5:PC0.3=0.946), indicating consistent relationships between particles of varying sizes. These results suggest that the presence of smaller particles (PC0.1) serves as a reliable indicator of the levels of larger particles (PC0.3, PC0.5), reflecting uniformity in particle distribution across size ranges. The high correlations underscore the importance of addressing common sources or behaviors of particles to improve indoor air quality in healthcare facilities [
20].
Lastly, strong positive correlations are observed between particle counts at different size ranges (e.g., PC0.3:PC0.1=0.988, PC0.5:PC0.3=0.952) in Arakale, indicating consistent patterns in particle concentrations. These results suggest that the presence of smaller particles (PC0.1) is highly indicative of the concentrations of larger particles (PC0.3, PC0.5), implying uniformity in particle distribution across size ranges. The findings highlight the need to identify and address common sources or behaviors of particles to mitigate indoor air pollution and protect the health of occupants in healthcare facilities. The strong positive correlations between particle counts at different size ranges across the studied locations indicate consistent relationships between particles of varying sizes, suggesting common sources or behaviors of indoor air pollutants. Understanding these correlations is essential for developing targeted interventions to improve indoor air quality and protect the health of occupants in healthcare facilities.
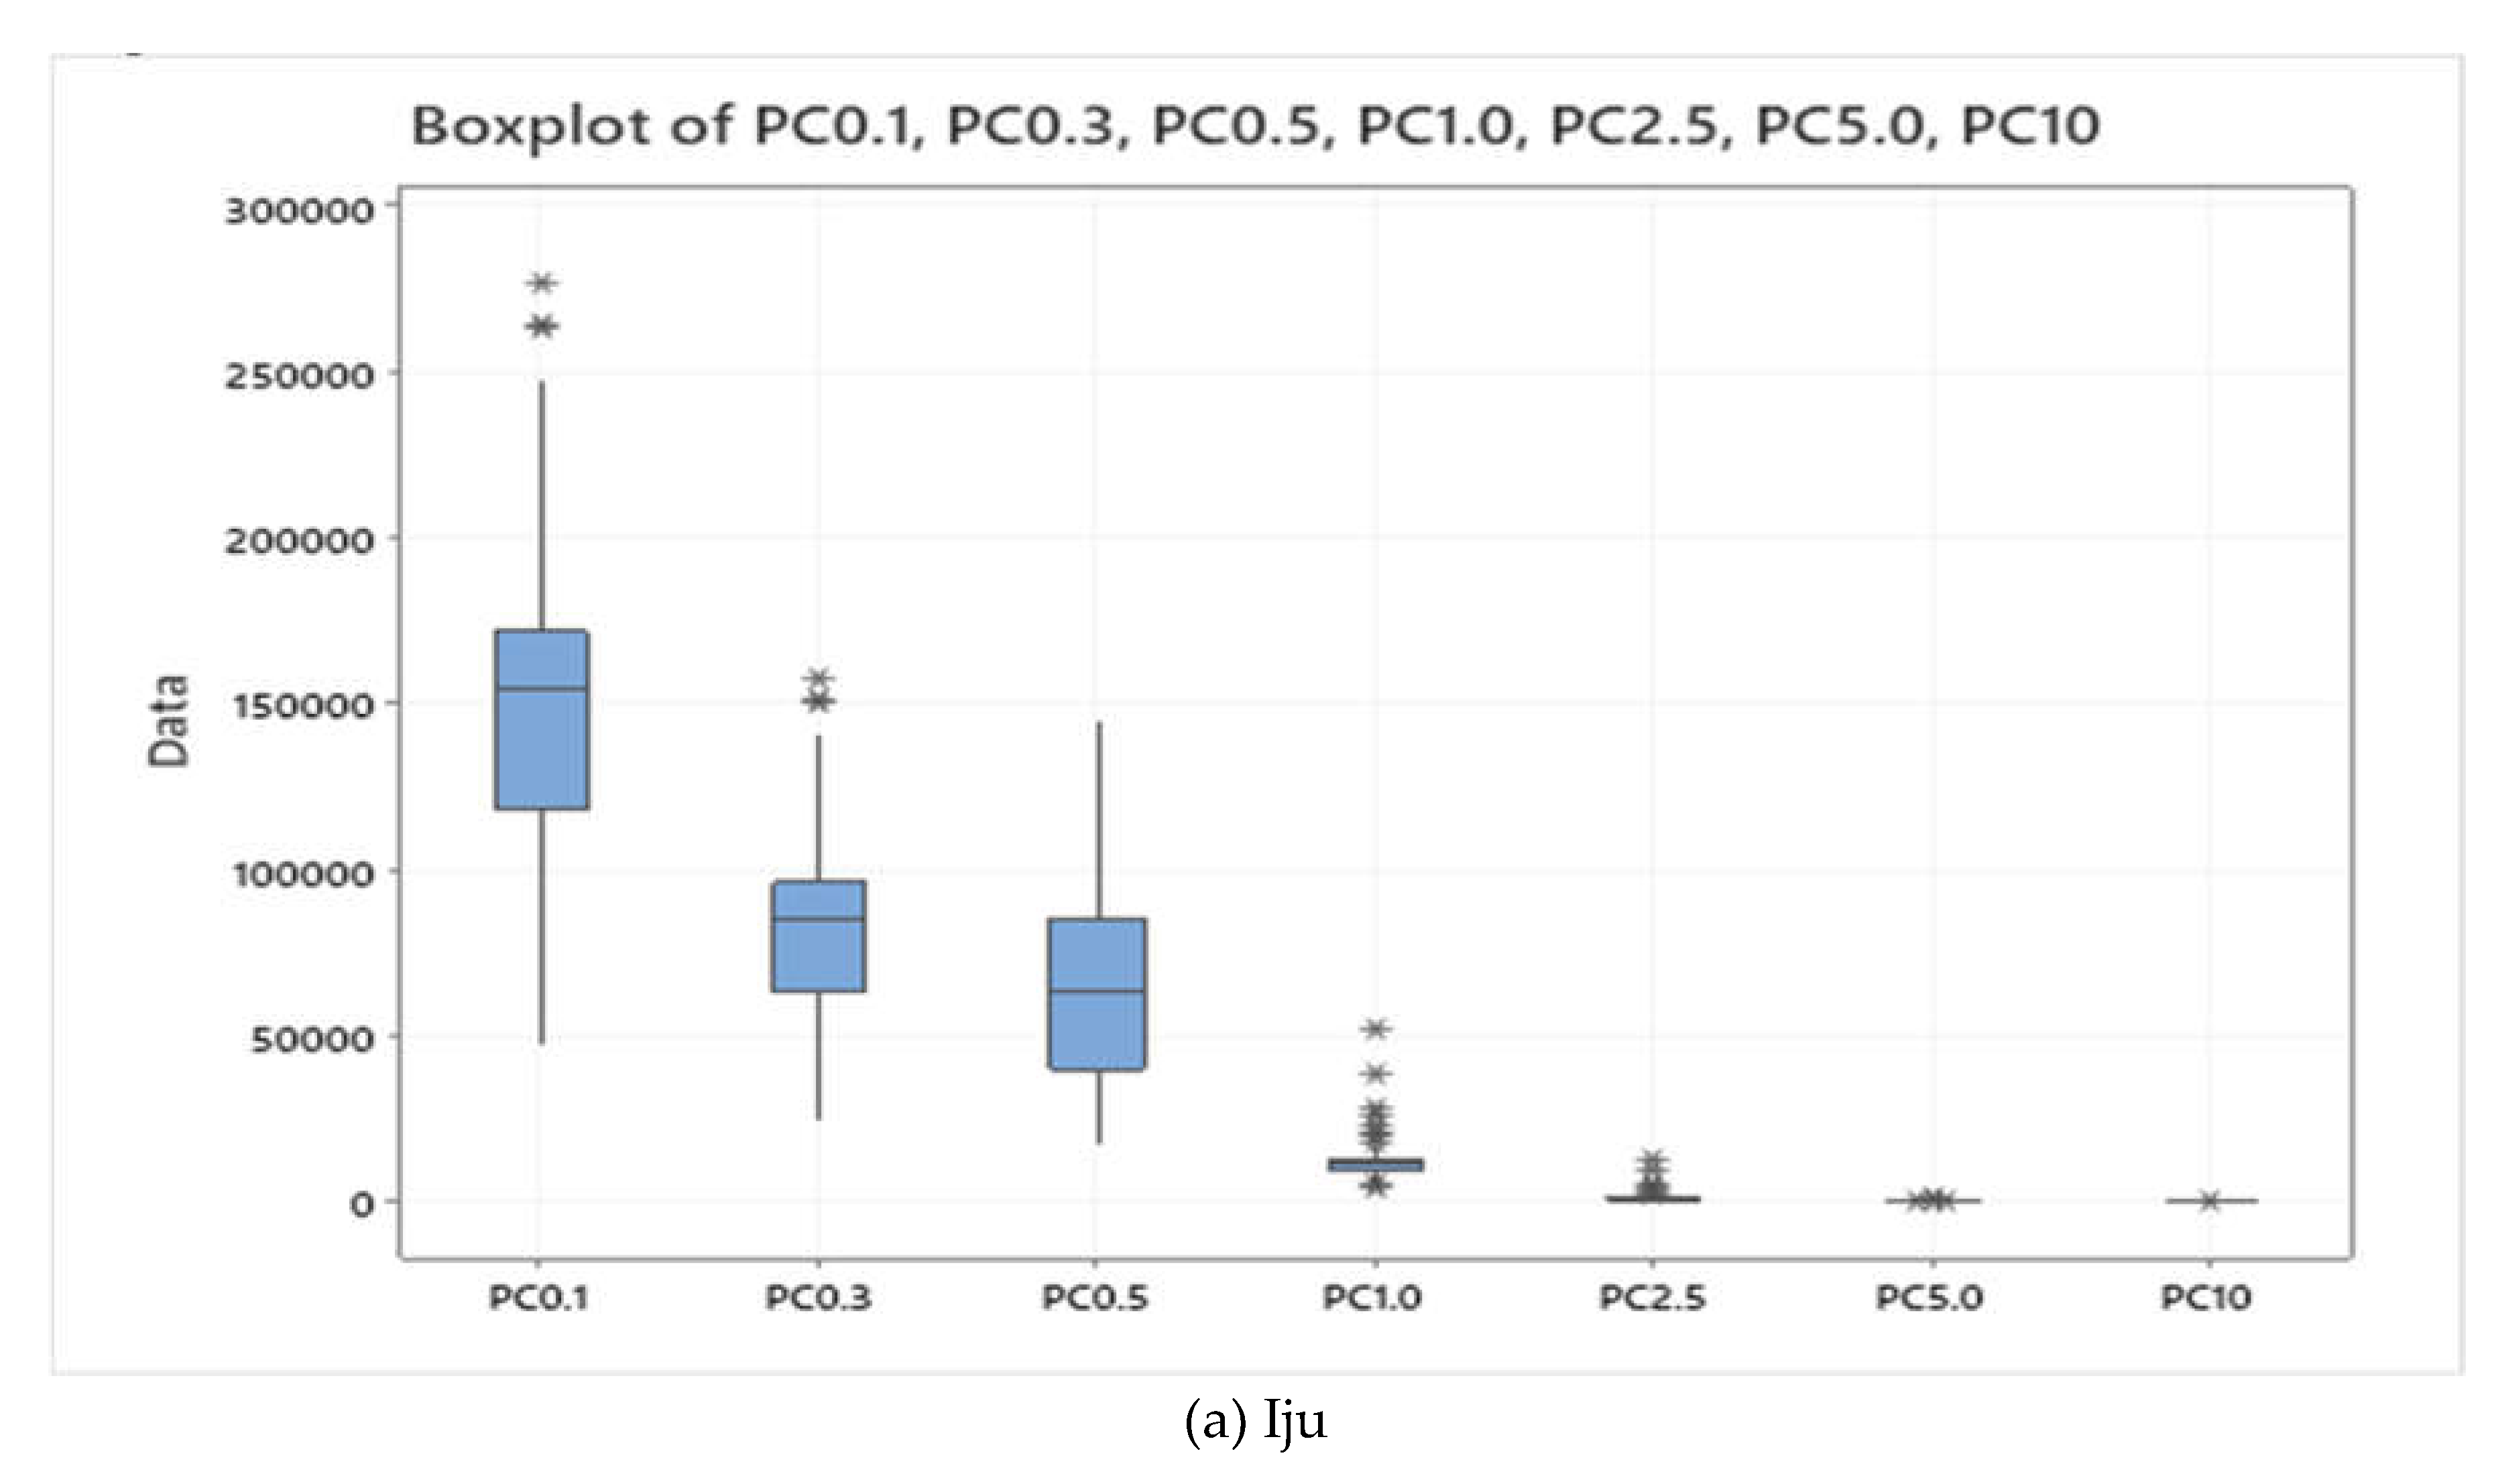
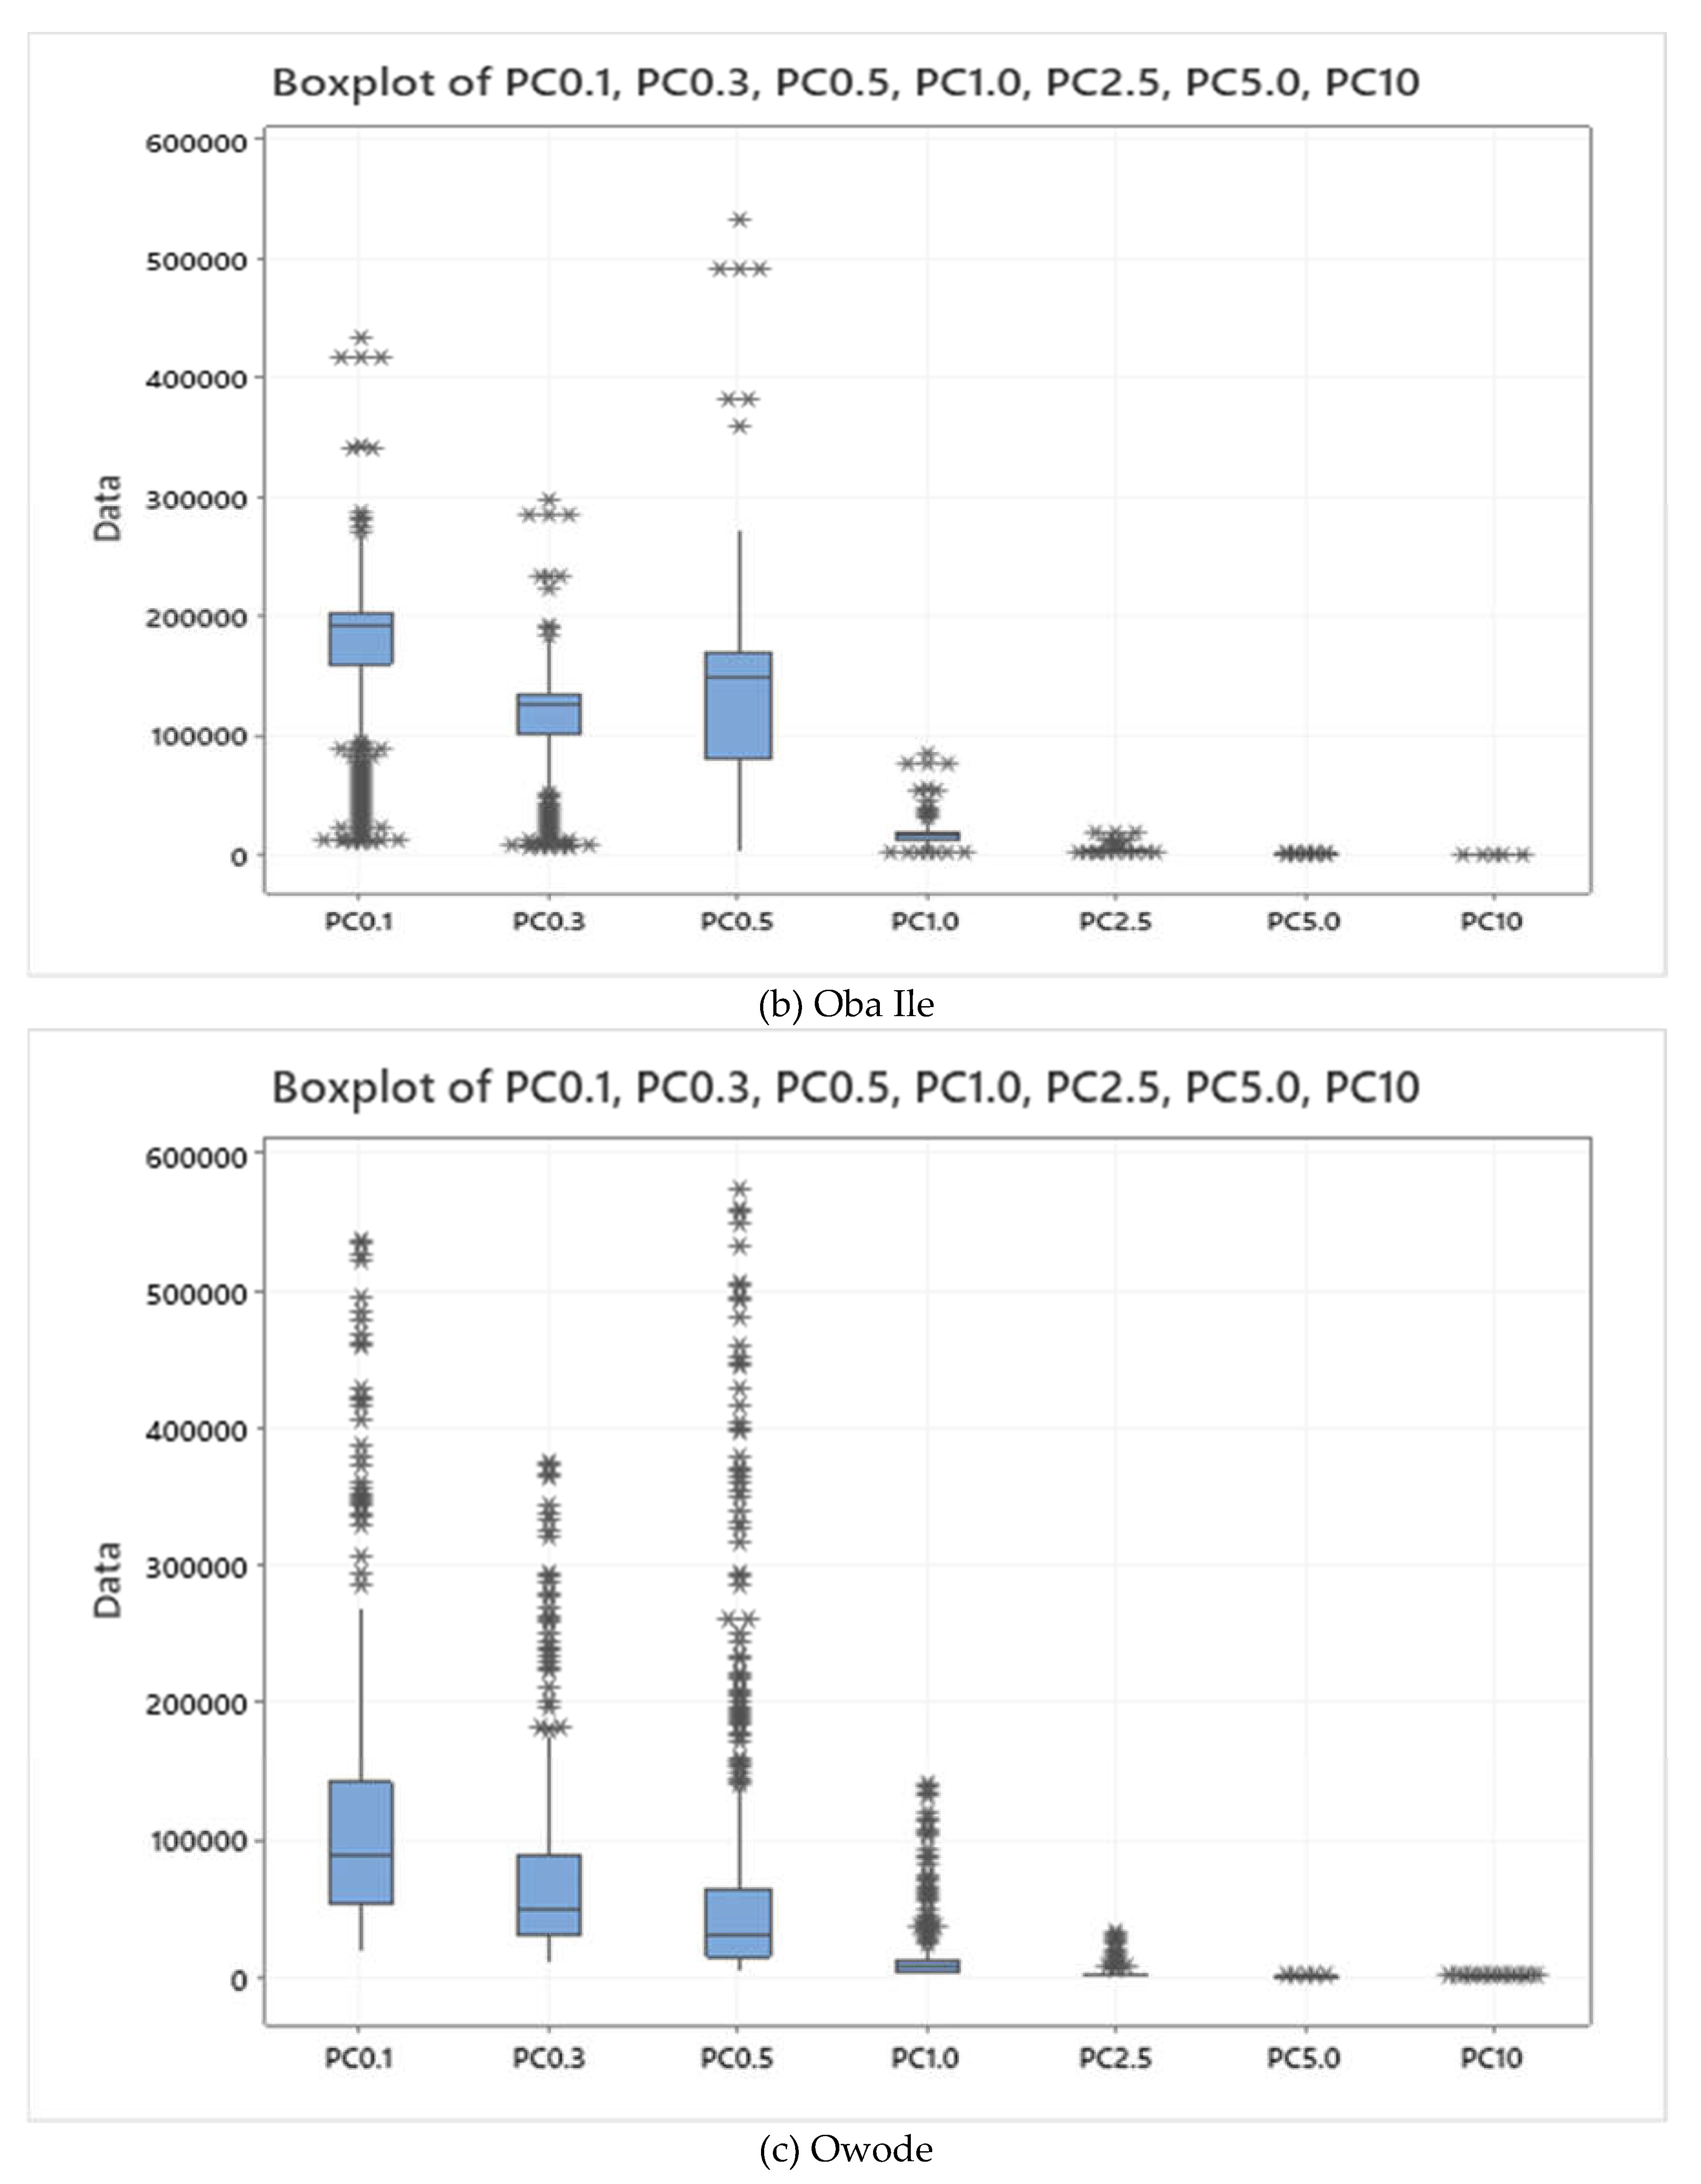
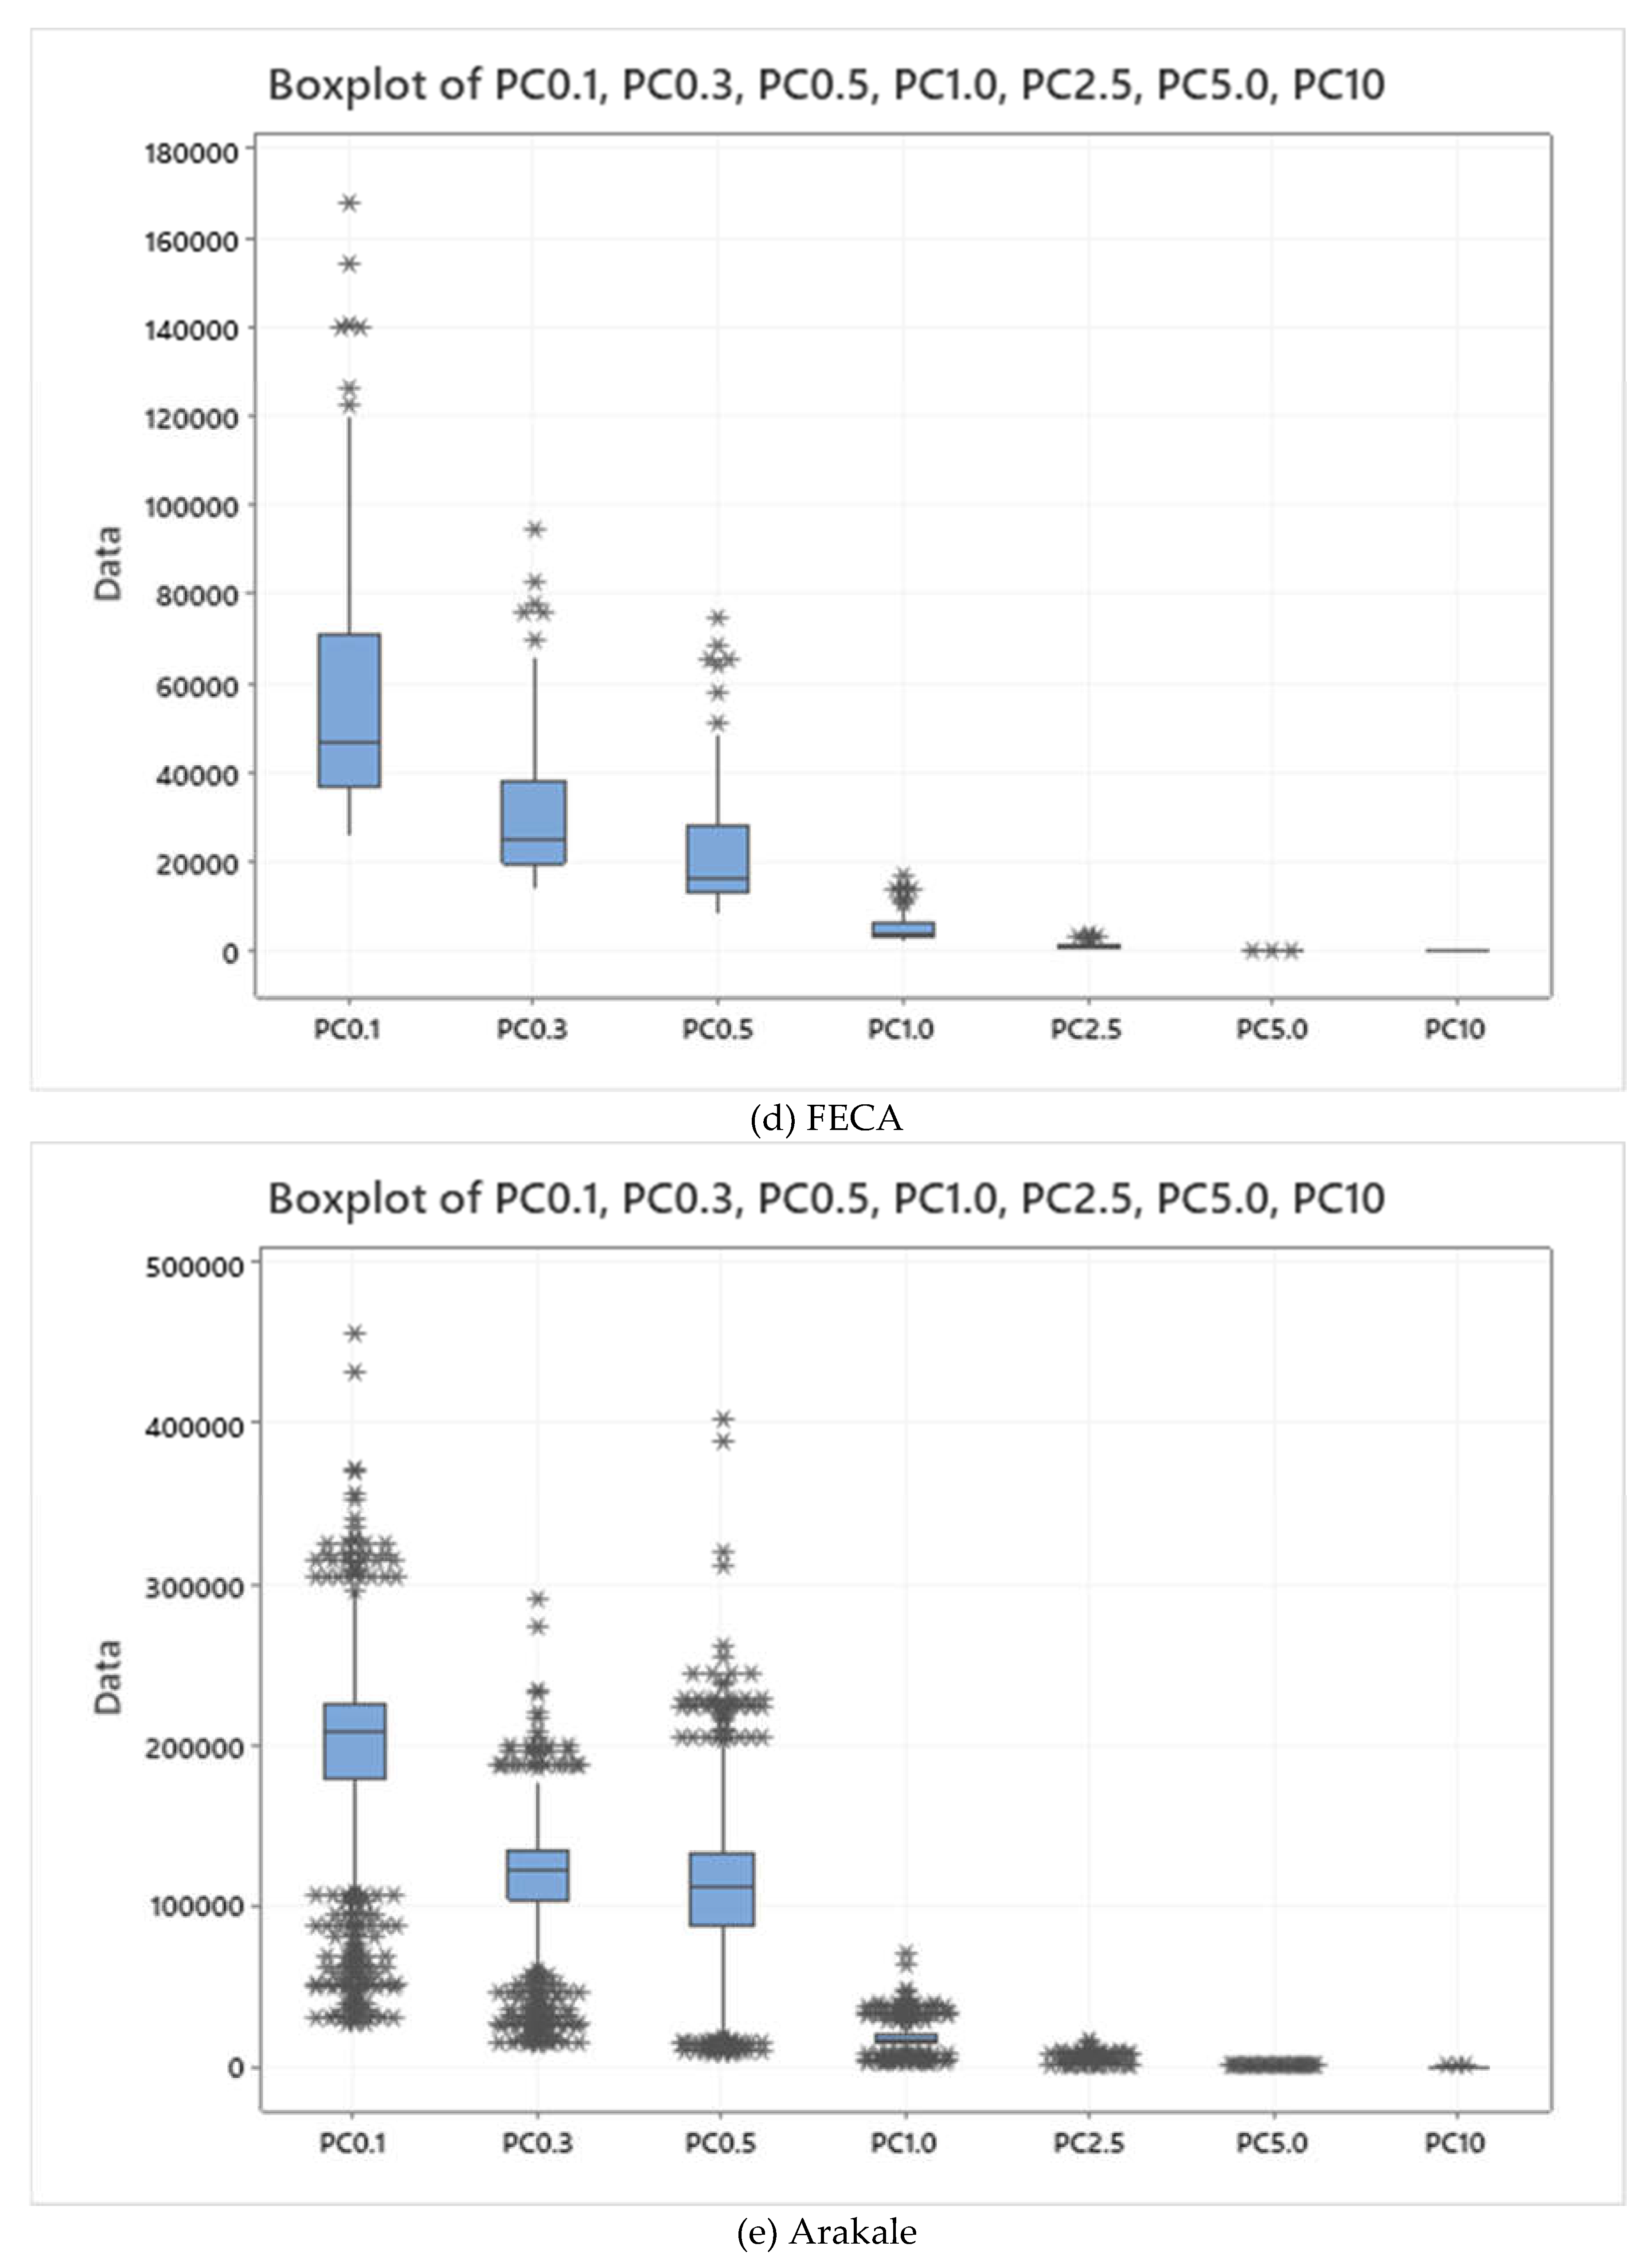
The boxplot shown in
Figure 4(a-e) depicts the distribution of indoor air pollution particle counts measured at seven different sizes (PC 0.1, PC 0.3, PC 0.5, PC 1.0, PC 2.5, PC 5.0, and PC 10 micrometers) inside the PHCs. Based on the boxplots provided in the figure for each location (Arakale, Iju, Owode, FECA, and Oba Ile), some comparisons are drawn about indoor air pollution levels and the potential implications for these health centers. For the particle size distribution, all five locations show a positive skew in the distribution of particle counts across the seven measured sizes (PC 0.1, 0.3, 0.5, 1.0, 2.5, 5.0, and 10 micrometers). This means there are generally more readings below the median than above, indicating a tendency towards lower pollution levels but with occasional spikes. The dominant particle size for the locations shows that the median particle count is highest for PC 2.5, which corresponds to fine particles with diameters between 2.5 and 0.1 micrometers. These fine particles are particularly hazardous as they can penetrate deep into the lungs [
21]. The interquartile range (IQR) appears to be relatively similar across all locations for all particle sizes. This suggests that the variability in the data (spread of the middle 50% of the readings) is comparable between the health centers.
Figure 4.
(a-e): The Boxplot of the Particle Counts from the Different Locations.
Figure 4.
(a-e): The Boxplot of the Particle Counts from the Different Locations.
For the overall Pollution Levels, it is difficult to definitively determine which health center has the highest overall pollution levels without seeing the data on the y-axis of the boxplots. However, by comparing the medians across the seven particle sizes in each boxplot, we can get a sense of the relative ranking. The frequency of spikes shows that the degree of skewness vary between locations. A more pronounced skew suggests more frequent occurrences of higher pollution levels. The potential health risks in this study depicts the presence of indoor air pollution, particularly fine particles (PC2.5), which poses a health risk to patients, staff, and visitors at all five health centers. Exposure to these pollutants can exacerbate respiratory problems like asthma and increase the risk of cardiovascular diseases [
22,
23]. There is the need for improved ventilation given the positive skew in all locations, there's a possibility that ventilation systems are inadequate in handling occasional spikes in pollution. Improved ventilation strategies are likely necessary in all health centers.
Recommendations
Based on the findings of the study on indoor air quality (IAQ) in health centers, the following recommendations are proposed to enhance IAQ and promote a healthier environment for patients, healthcare workers, and visitors: To guarantee effective operation and ideal air circulation, a thorough maintenance schedule must be established for heating, ventilation, and air conditioning (HVAC) systems. IAQ will be improved by routine cleaning, filter replacement, and inspection to help get rid of microbiological pollutants, dust, and debris buildup. In order to reduce indoor air pollution and stop the accumulation of dangerous materials, you need also raise ventilation rates and make sure that ventilation is designed properly. To effectively exchange air between interior and outdoor spaces while consuming the least amount of energy possible, think about installing energy recovery ventilation (ERV) systems.
It is necessary to determine and reduce the presence of indoor air pollution sources, such as formaldehyde from building materials, volatile organic compounds (VOCs) from cleaning products, and biological contaminants from mold and moisture. To lower pollution levels, use low-emission building materials, adopt green cleaning techniques, and keep interior humidity levels at ideal levels.
Strict no-smoking regulations must be implemented in health facilities, and initiatives to help people quit smoking must be supported. Tobacco smoke is a major indoor air contaminant that has been related to cardiovascular and respiratory disorders. Installing high-efficiency particulate air (HEPA) filters or other cutting-edge filtering technologies in HVAC systems can improve indoor air quality (IAQ) and lower the risk of respiratory diseases by efficiently capturing airborne particles, such as germs, viruses, and allergens.
Healthcare personnel and patients must receive instruction and training on the value of indoor air quality (IAQ) and best practices for preserving a healthy indoor environment. Stress the need of good ventilation, hygiene, and pollution control practices in lowering indoor air pollution exposure. Creation of an extensive indoor air quality (IAQ) monitoring program to measure indoor pollution levels on a regular basis, spot new problems, and monitor how well remedies work. To quickly identify changes in air quality and take necessary corrective action, make use of IAQ sensors and real-time monitoring systems. Working together with indoor air quality specialists, environmental health experts, and other specialists to create customized intervention plans, carry out comprehensive IAQ assessments, and guarantee adherence to legal requirements.
