Preprint
Article

Heavy Metal Contamination Potential in Agricultural Soils under Dynamic Cropping Systems in Large-Scale Farms in Western Kenya

Altmetrics

Downloads

85

Views

46

Comments

0

Submitted:

08 August 2024

Posted:

09 August 2024

You are already at the latest version

Alerts
Abstract
Sustainable soil quality management is one of the most important approaches in ensuring high agricultural productivity and safe quality produce. With the current rising application of inorganic fertilizers and chemical pesticides, degradation of agricultural soils is becoming a global phenomenon, attracting attention of many researchers. The present study hypothesized that with the increasing chemical pesticide and fertilizer application under various cropping systems, there is potential for increased toxicity of heavy metals residues above background concentrations and their associated complexes and intermedia transfer between environmental compartments in large-scale farms in Kenya. Using standard methods, 204 soil samples collected from five distinct cropping systems were analyzed for PH, Electrical Conductivity, exchangeable base cations (Na+, Mg2+, K+, Ca2+), Cu, Pb, Zn, Cd, Fe, Cr, Total Organic Carbon and Total N and data analyzed using Genstart, version 23.1. The concentrations of Zn, Cu, Pb and Fe were lower than the globally acceptable levels hence less soil pollution threat (NPI<1). However, Cd concentration exceeded permitted levels (NPI>1). Among the cropping systems considered, Maize and sugarcane cropping systems were the most susceptible to heavy metal pollution. In conclusion, the rank order of the pollution potential associated with heavy metal contamination in the study area is Cd>Zn>Pb>Cu>Cr>Fe.
Keywords: 
Subject: Environmental and Earth Sciences  -   Environmental Science

1. Introduction

Soil quality and characteristics play an important role in determining the performance of agricultural farms [1,2]. However, soil pollution through heavy metal deposition and accumulation in agricultural landscapes has become a global environmental concern [3,4,5,6,7,8,9,10], endangering nature [11]. Even though soil pollution has become a widespread problem as a result of increased intensification and modernization of agricultural activities from the second half of the 20th century [12], it remains a hidden danger as it is a phenomenon that cannot be directly assessed nor visually perceived. The effects of soil pollution do not only hamper the soil ecosystem health but can also extend to other associated ecosystems such as water, air and human health due to transfer of chemical residues through food chains and other trophic structures [1]. Due to increasing human population that has raised the demand for food supplies [13,14,15,16] and emergence of various types of crop pests and diseases, the use of mineral fertilizers and pesticides has become a popular practice among farmers in both developed and the developing world. While pesticides help in controlling crop pests and diseases [17,18,19,20,21], mineral fertilizers are believed to provide essential nutrients required by crops thus boosting the yields [22,23,24].
Despite the increased quantity and quality of produce, the continued use of these inputs has been associated with a number of negative environmental externalities at various scales [1] including heavy metal deposition [25]. Heavy metals (elements having specific densities of more than 5.5 g/cm3) such as lead (Pb), Chromium (Cr), Arsenic (As), Zinc (Zn), Cadmium (Cd), copper (Cu), mercury (Hg), nickel (Ni) and Manganese (Mn) are naturally present in ecosystems at background concentrations from natural sources including volcanic eruptions and pedogenesis of parental rocks [3,26,27]. Pollution risks of heavy metals is enhanced by the fact that besides anthropogenic activities (agriculture, industrial, mining, transportation, fossil fuel combustion and waste disposal), there are other natural processes that release heavy metal in the environment such as natural degradation of metal complexes, tectonic movements, volcanic processes and weathering of rocks [4,28,29,30,31,32,33].
Although of these elements are considered non-essential for plant growth, some such as cobalt (Co), copper (Cu), chromium (Cr), manganese (Mn) and zinc (Zn) are metabolically important as micronutrients, though in low concentrations [6]. Others including cadmium (Cd), lead (Pb) and mercury (Hg) are generally considered non-essential elements to plant health. Despite the adaptive enzymatic antioxidative defense mechanisms evolved by the plants to fight phytotoxic effects associated with heavy metals [6], high accumulation of these elements in tissues is toxic to the plants. Their phytotoxic effects include oxidative damage, anomalous genetic change, abnormal reproductive responses and signaling in biosynthetic pathways. However, agricultural activities remain the major source of soil heavy metal pollution [34,35] particularly in the rural and non-industrial regions like Western Kenya. This is due to the high usage of pesticides and inorganic fertilizers by farmers who cultivate maize crop in large scale. Most pesticides (herbicides, insecticides and fungicides) contain varying concentrations of Pb, Cd, Cu, Zn, and As, based on their sources [3,4]. Moreover, it has been repeatedly observed that application of phosphate-based fertilizers results in elevated levels of Cd, Cr, Cu, As, Pb, Mn, Ni and Hg while biosolids and manures are also rich in Zn, Cu, Ni, Pb,Cd, Cr, As, and Hg [4,6,16,25,36].
Within the soil, these elements are non-biodegradable, persistent and highly toxic to plants and other soil biota posing high threats to soil biota [3,4,9,10,16,37]. This can be inferred from altered soil ecosystem processes such as anomalous nitrogen transformation, modified microbial loops and carbon mineralization and reduced soil fertility [6] which in the long run affects crop performance. Whether they occur in the soil, in elemental form or combined with other compounds, these elements are highly toxic and hazardous [38]. However, their concentrations may exhibit spatial variations in agricultural soils, based on soil physicochemical properties such as the nature of parent rock and PH that influence the transformation of metal species through precipitation/dissolution, adsorption, sorption, methylation/demethylation, reduction/oxidation and formation of metal complexes [3,39]. Due to the interconnectedness between agricultural lands and aquatic ecosystems, there is high possibility of downward leaching of elemental heavy metals, in cationic forms or in complexes which can contaminate groundwater resources. Surface water resources like rivers and streams are also vulnerable to heavy metal pollution through surface run offs. This can be accelerated by the high rainfall received in western Kenya, where this study was done, and the high ubiquity and solubility of heavy metal species in aquatic ecosystems [38].
Following their continued accumulation, certain food crops can absorb these metal species from the contaminated soils, compromising the quality and safety of food crops grown in contaminated soils and subsequently posing substantial health risks to humans and other animals that depend on the food crops [6,40,41]. Soil-based organisms are exposed to these heavy metals through gastrointestinal, dermal and respiratory pathways. Absorbed heavy metal cations and their complexes apart from being stable, have high bioaccumulation and biomagnification potentials hence ease of transfer to other organisms with increasing toxicity. Some faunal species that have mechanisms for copying with and concentrating heavy metals in their body tissues form part of food webs that also comprise organisms which are food sources to humans and domestic animals. This makes man more exposed to heavy metal pollution. In humans, continued exposure to heavy metals cause various health problems [42] ranging from malfunctioning of the central nervous system, damage to vital organs such as lungs, liver and kidneys, gastrointestinal malfunction, vascular damage, endocrine and reproductive disruption, birth defects and carcinogenicity [33,43].
In Kenya, previous studies have reported occurrence of heavy metal residues in various environmental compartments [7,41,44,45,46] and horticultural crops harvested from contaminated sites. Western Kenya, particularly Trans Nzoia County is well known for large-scale maize production, with an annual production of at least five million bags. In the large-scale farms, there is frequent application of various pesticide classes and mineral fertilizers [47]. The present study therefore hypothesized that high prevalence of mineral fertilizer and pesticide usage in the region could contribute to elevated anthropogenic build up in heavy metal concentrations in the study area. It was thus designed to analyze soil heavy metal pollution potential under five distinct cropping systems in large scale farms in Western Kenya.

2. Materials and Methods

2.1. Area of Study

This study was conducted in Trans-Nzoia County covering a total area of 2495.6 Km2 lying between latitudes 00° 52’ and 10° 18´ north of the equator and longitudes 034° 38´ and 035° 23´ east of the great Meridian in Western Kenya [Figure 1], with a total population of 818,757 [48]. Administratively, the county is divided into five sub-counties namely Kiminini, Saboti, Kwanza, Cheranganyi and Endebes. In relation to climate, the County has mean maximum temperatures ranging between 23.4-28.4°C and mean minimum temperatures ranging between 11.0°C -13.5°C recorded in February and January respectively. It receives an annual rainfall ranging between 1000 mm to 1700 mm with the highest being received in the Western parts of Endebess, Saboti and Kiminini Sub-Counties and North Western parts of Cherang’any Sub County.
Because Western Kenya regions have almost similar agroecological characteristics, Trans-Nzoia County was chosen as the study area to represent the entire region. Moreover, the County is the largest maize grain producer in Kenya under the prevailing favourable climatic patterns and most of the farms are large scale with clearly defined agronomic practices, usually monocultures [47]. The study therefore assumed that the county is a good representative of agricultural practices in Western Kenya.

2.2. Sampling Design

Sampling was conducted from purposively selected large-scale farms in the study area. Five major cropping systems considered included Maize farms (MF), Orchard farms (OF), Sugarcane farms (SF), Coffee farms (CF), Pasture lands (PL) and non-farmed shrub lands that acted as control sites (CS). Within each farm selected per cropping system, a diagonal transect was set along which 80 m by 80 m quadrats were demarcated. Within each quadrat, soil blocks measuring 1 m x 1 m were marked. Three replicate soil samples were taken from every block using a soil auger at a depth of 0-20 cm below the surface. Based on distinctiveness of agronomic and cropping systems, composite soil samples under similar cropping systems from the same sub-counties were established. The samples were labeled and transported to the laboratory for analysis at Jaramogi Oginga Odinga University of Science and Technology and University of Kabianga (Kenya).

2.3. Laboratory Analysis of Soil Samples

2.3.1. Measurement of Soil PH and Electrical Conductivity

Soil sample PH was measured on 2.5:1 soil to water suspension as described in [49] with slight modifications. To achieve this, 20 g of air dried soil sample was measured and crushed using a mortar and pestle. The sample powder was sieved through a 2 mm sieve and transferred into a beaker. 50 ml of deionised water was added to the beaker containing the sample and the mixture shaken for 10 minutes. The solution was allowed to stand for 30 minutes and stirred again for 2 minutes. PH values of the soil suspensions were measured using microprocessor PH meter, PHS-550, previously calibrated using pH 4 and pH 7 buffers. The EC of the extracts was read after 24 hours.

2.3.2. Determination of Base Cations

Base cations (Na+, Mg2+, K+ and Ca2+) were analyzed according to [49]. The samples were extracted with ammonium acetate solution to ensure maximum exchange between ammonium ions (NH4+) and the base cations. For every soil sample, 2.5g of air dried soil was weighed into a clean stoppered plastic bottle. 50 ml of 1M NH4OAc (pH 7) solution was added, content shaken using a mechanical shaker and filtered through No. 42 Whatman paper. This soil extract was used for determination of Na+, K+, Mg2+ and Ca2+ in Mg/Kg. K+, Na+ and Ca2+ were determined using a dilution factor of 10 while Mg2+ using a dilution factor of 25. Atomic absorption spectrophotometry, was undertaken using AAS model AI1200 in which Method Detection Limit (MDL) was determined using Bernd Kraft certified reference material. The lamp current (mA) used for analysis of Na+, K+, Ca2+ and Mg2+ were 12.0, 10 and 10 respectively with Air-C2H2 flame of detection limit (ppm) of 0.006, 0.012, 0.07 and 0.003 respectively.

2.3.3. Determination of Heavy Metals

The study analysed soil levels of Copper (Cu), Lead (Pb), Cromium III (Cr), Cadmium (Cd), Zinc (Zn) and Iron (Fe). These elements were determined according to the standard methods as outlined by [49].

Quality Control

To ensure reliability of the results and avoid contamination during sample processing and instrumental readings, key quality assurance procedures were considered. For example, all the glassware used in the analysis were thoroughly washed in alkaline detergent, socked in nitric acid solution for 48 hours and rinsed with deionized water. All the chemical reagents used in the analyses were of analytical grade obtained from Twiga Chemicals and all solutions were made using deionized water as the solvent. Standard calibration curves, with R2 values greater than 0.99 were developed that were applied in quantifying the concentration of each of the heavy metals analyzed. In order to safeguard any effect of contamination during instrumental reading, two blank samples were run.

Sample Preparation and Analysis

5.0 g air-dried soil sample was weighed and finely ground in a porcelain mortar using a pestle and sieved through 2 mm sieves. 2.5 g of the powder was accurately weighed in to 100 ml beakers to which 20 ml of mixture of HCL and HNO3 was added in the ratio of 3:1. The resulting mixture was digested on a hot plate and cooled. After cooling, the solution was diluted to 50 ml using deionized water. Concentrations of Copper (Cu), Lead (Pb), Cromium III (Cr), Cadmium (Cd), Zinc (Zn) and Iron (Fe) were determined from this solution according to the standard methods as outlined by [49]. Atomic absorption spectrophotometry, was undertaken using AAS model AI1200 in which Method Detection Limit (MDL) was determined using Bernd Kraft certified reference material.Cu, Pb, Cr,Cd, Zn and Fe were analysed using Air-C2H2 flame with detection limit (ppm) of 0.04, 0.111, 0.089, 0.087, 0.008 and 0.076 respectively with calibration range (ppm) of 0.1-0.6 and integration time of five seconds.

2.4. Data Analysis

Statistical data analyses were done using Stata, Version 15.0. Descriptive statistics were computed on the concentrations of the heavy metals, base cations, pH and EC under various cropping systems. Test for normality of the data was determined using Shapiro-Wilk test. Multivariate analysis (MANOVA) was conducted to check significant differences among the heavy metal levels at various cropping systems. Correlations among the concentrations of the analyzed was done using Spearman Rank Order Correlations.

2.4.1. Pollution Index Analysis

For each of the heavy metal analyzed, Namerow’s pollution Index/Row’s Pollution Index (NPI) was also calculated according to [50] using the formula;
N P I = C n S n
Where;
Cn; The concentration of the analyzed heavy metal in the sample;
Sn; The prescribed/standard concentration of the heavy metal in the soil
Sites with NPI ≥ 1 had surplus amount of the analyzed heavy metal, thus less pollution potential while those with NPI ≤ 1 had less chances of pollution.

3. Results

3.1. Heavy Metal Concentrations under Various Cropping Systems

The various cropping systems considered in the study area recorded different levels of physicochemical parameters analyzed as shown in Table 1. Skewness test showed normal distribution in the data (p-value of Skewness > 0.05). MANOVA showed significant differences in the means of the various analyzed parameters in various cropping systems (F= 4.472; p<0.05).

3.1.1. Variation in PH and Electrical Conductivity

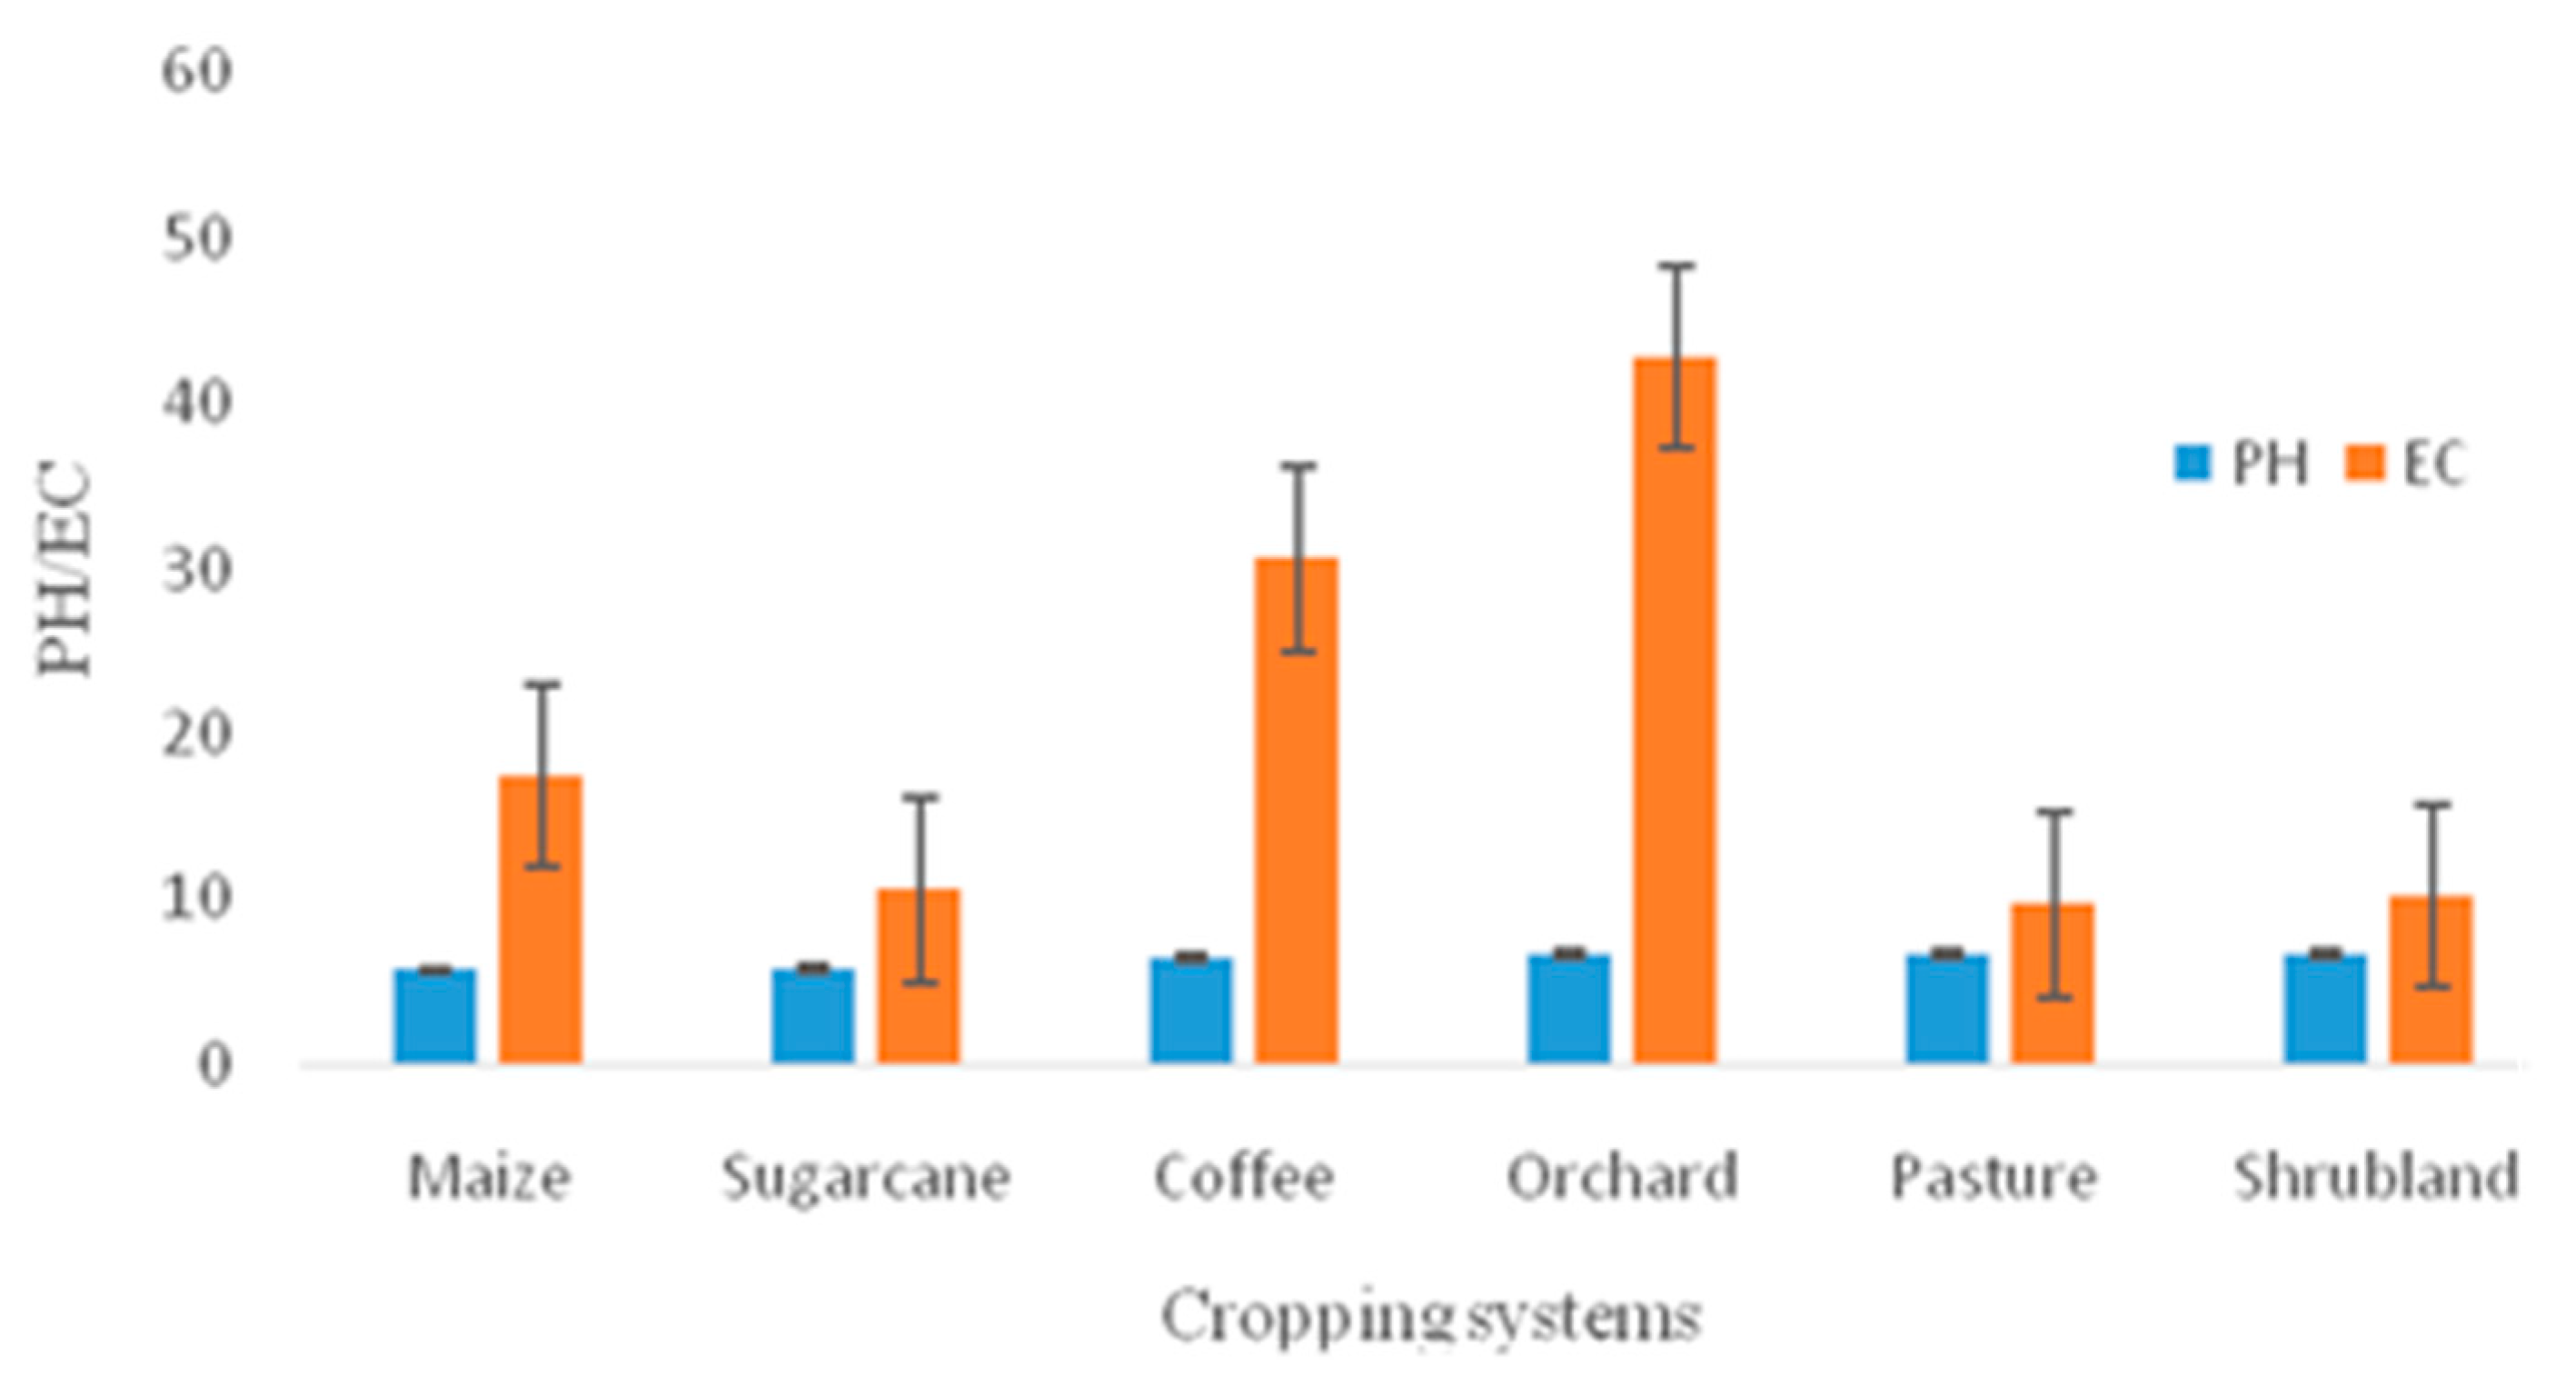
The lowest mean PH (5.699±0.390) was recorded under maize plantation while the highest was reported under coffee plantation (Figure 2). There was a significant difference in the pH levels of soils sampled from the various cropping systems (F=39.02; p≤0.05). The highest mean EC was recorded at the sugar cane plantation while the lowest was registered at the shrub land and pasturelands (Figure 2). Differences in the means of EC at the various cropping systems were statistically significant (F=36.05; p≤0.05).
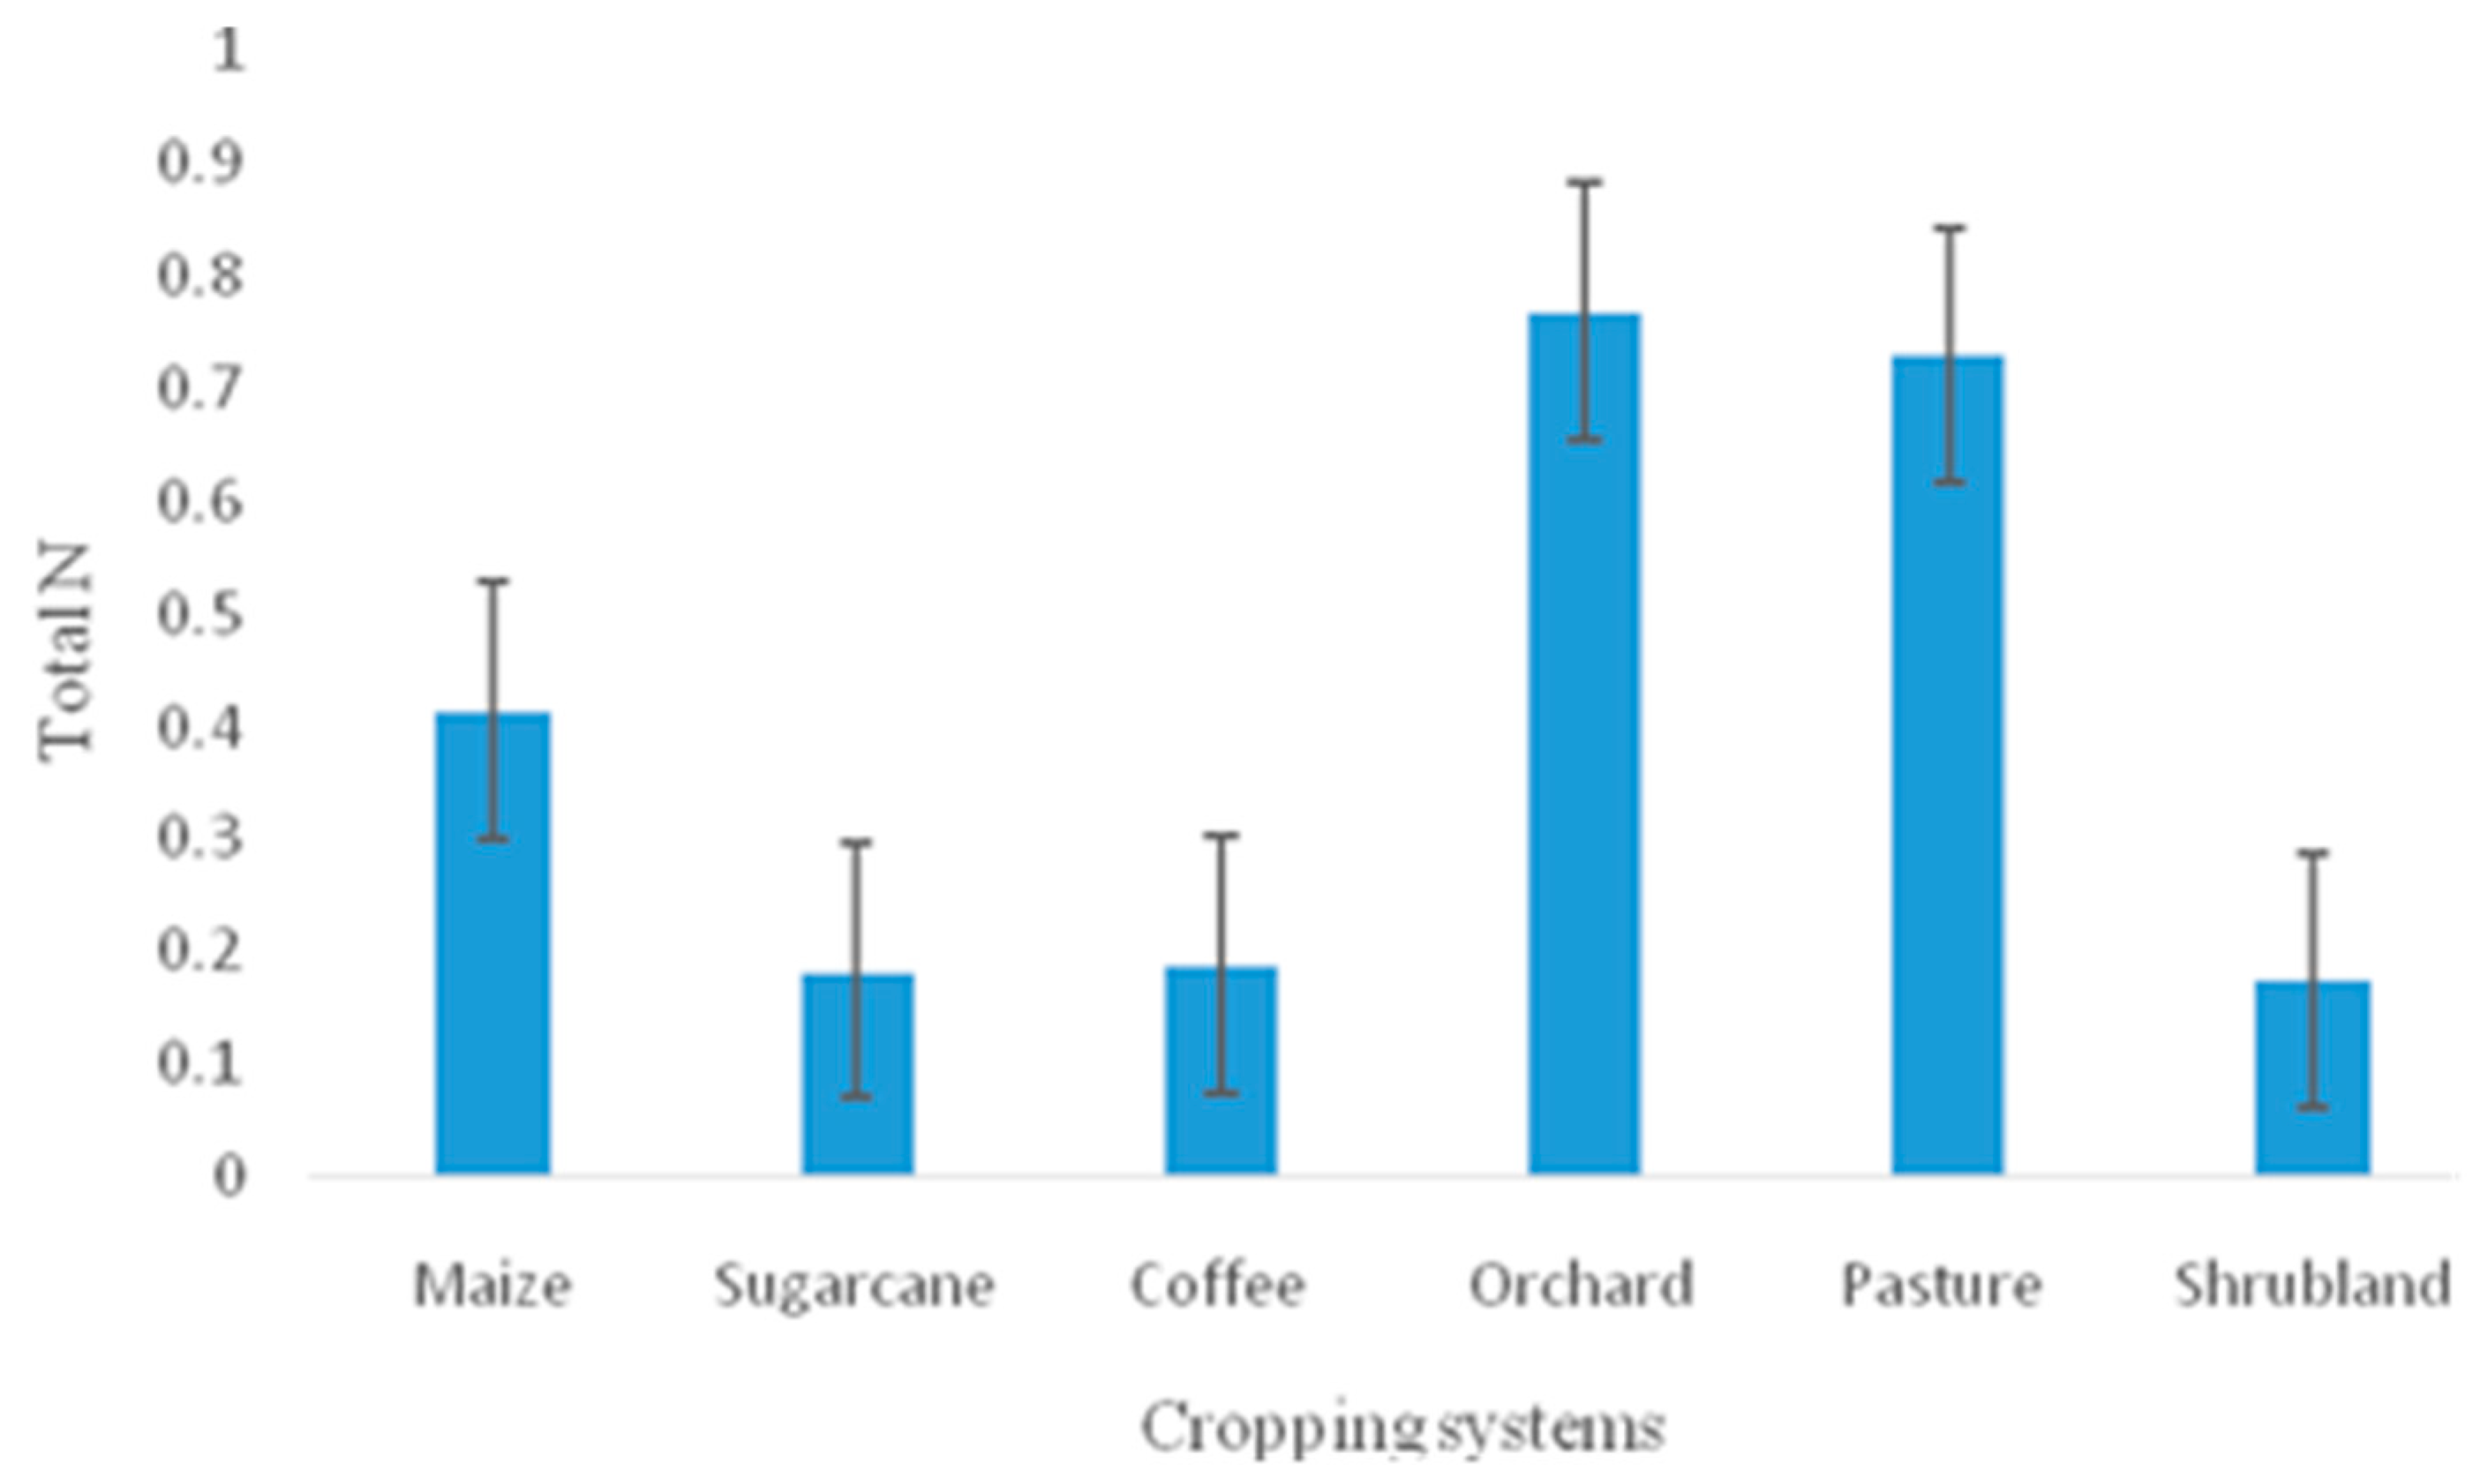
The highest concentration of total nitrogen occurred at the maize plantation while the lowest mean was reported from the soils sampled under sugar cane plantation and the shrub land (Figure 3). Moreover the mean concentrations of total nitrogen under the various cropping systems were significantly different (F=36.678; p≤0.05).
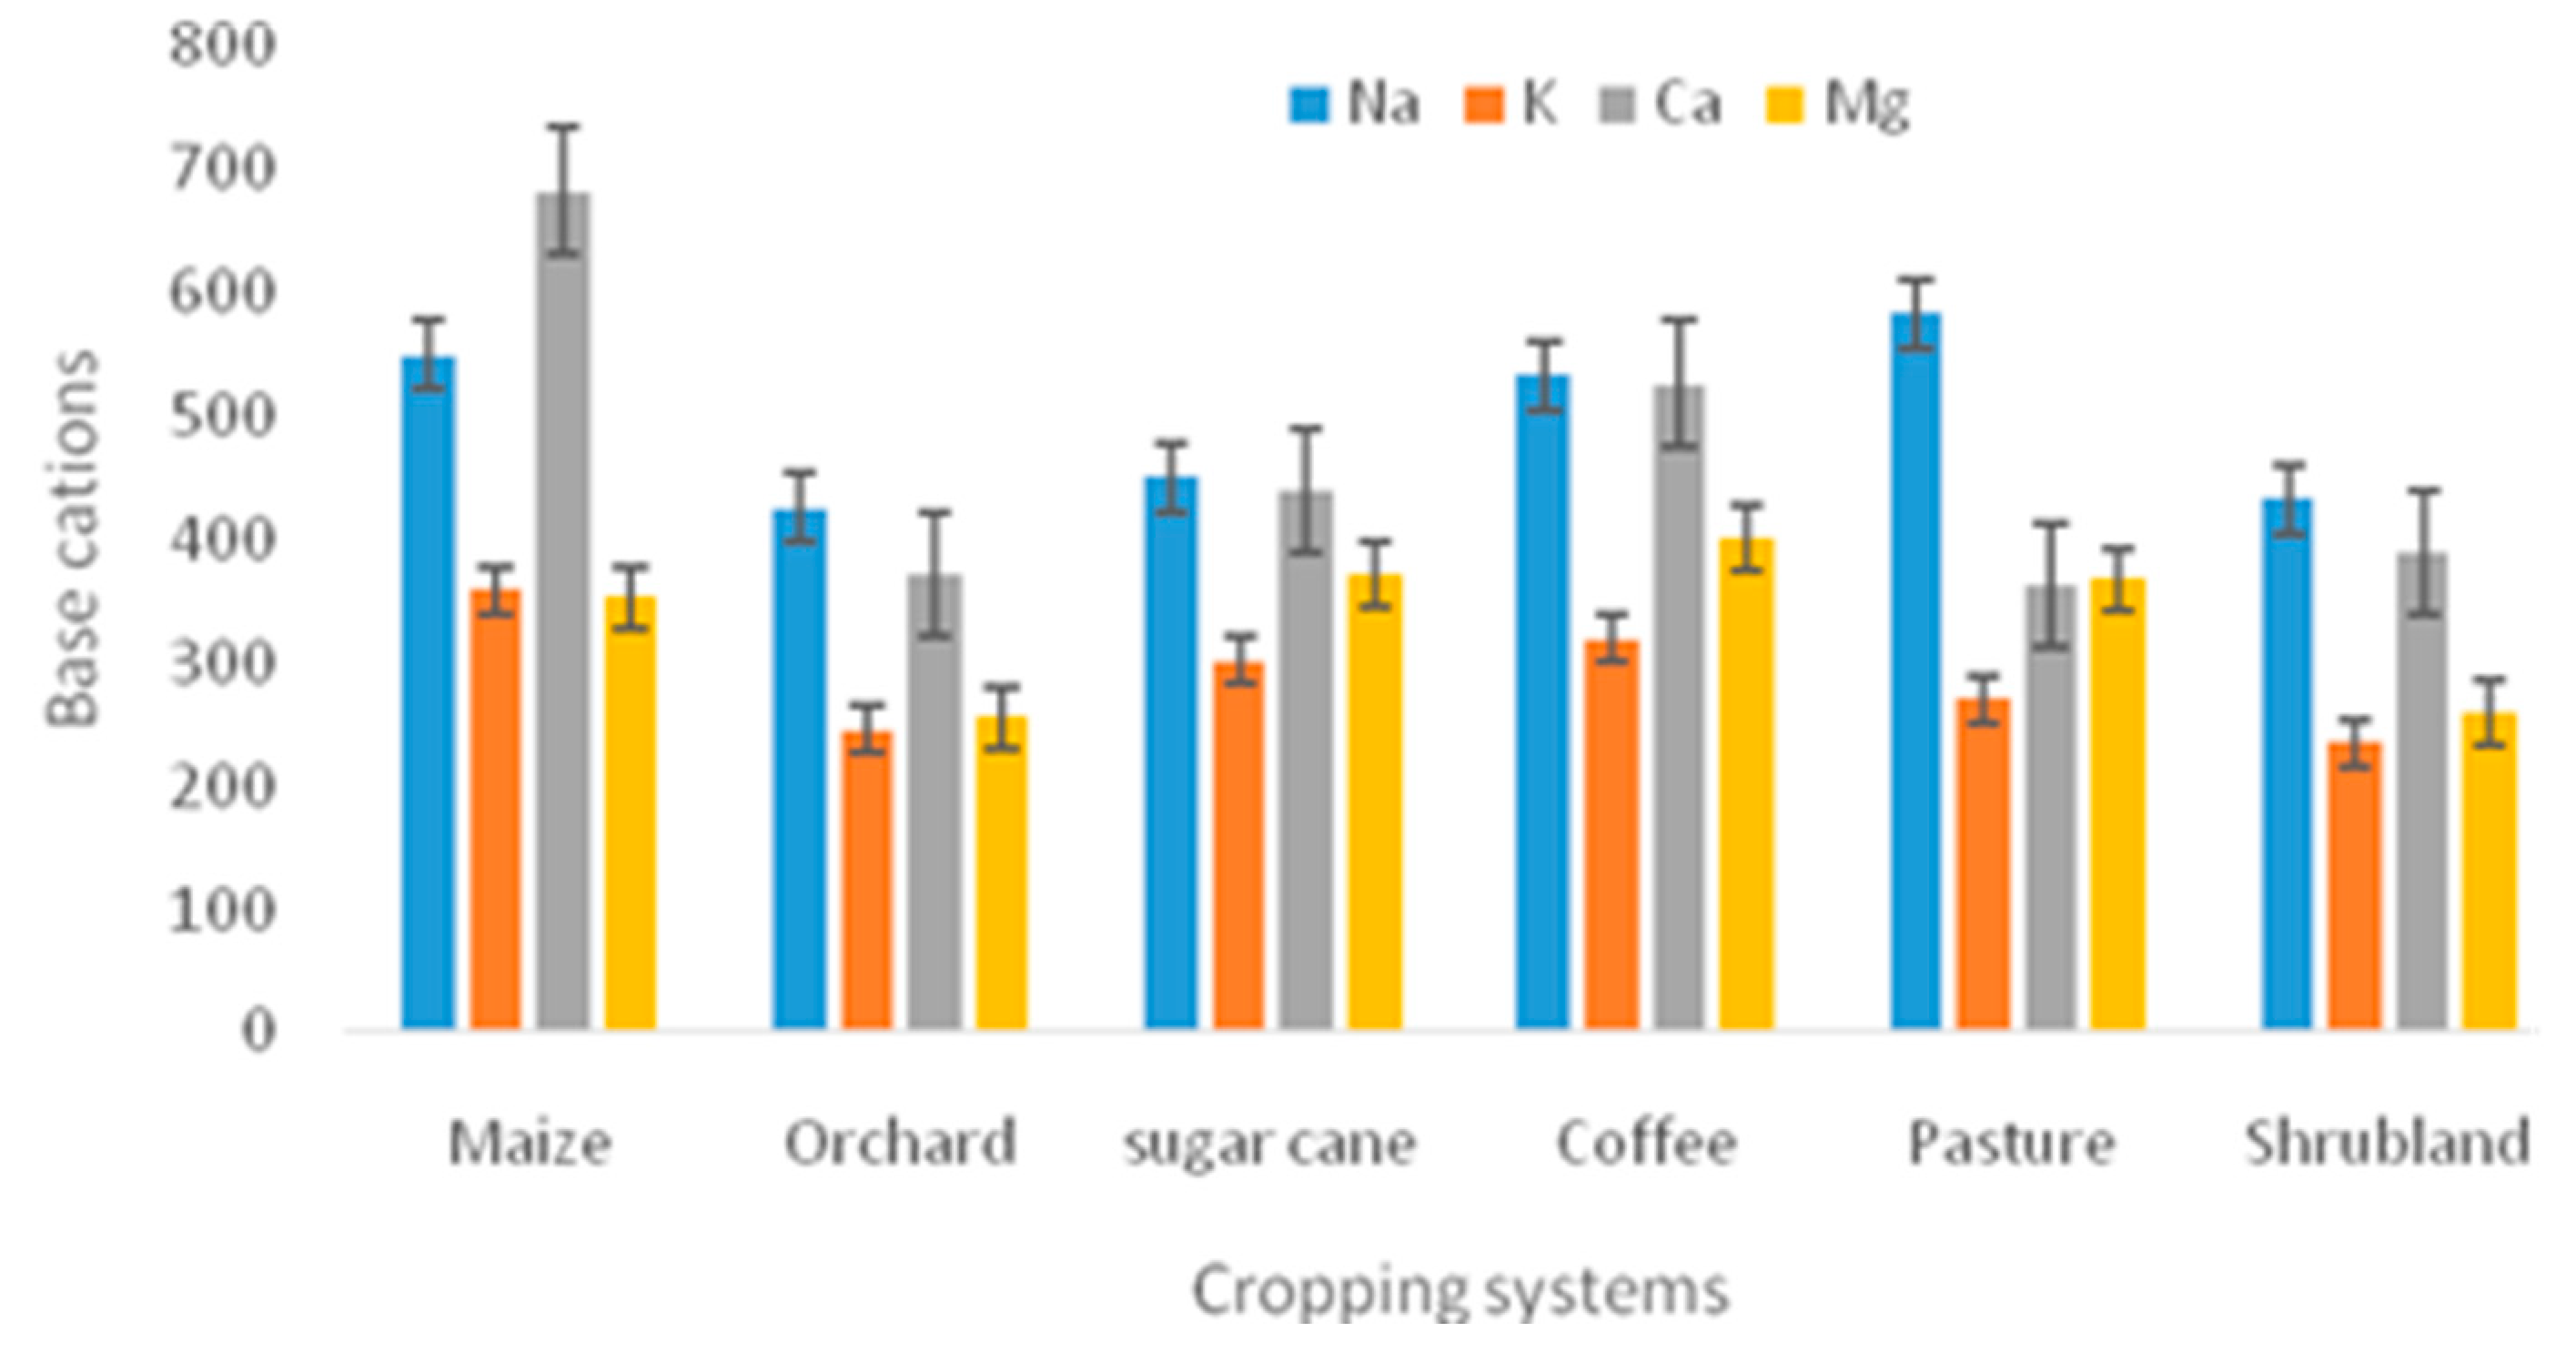
The major cations analyzed in the study, Na+, Mg2+, K+ and Ca2+, also varied with changes in cropping systems (Figure 4). Among the four cations considered, calcium and sodium recorded highest mean values compared to potassium and magnesium. Apart from sodium, mean values of potassium, calcium and magnesium recorded from the various cropping systems in the study area were significantly different (p≤0.05).
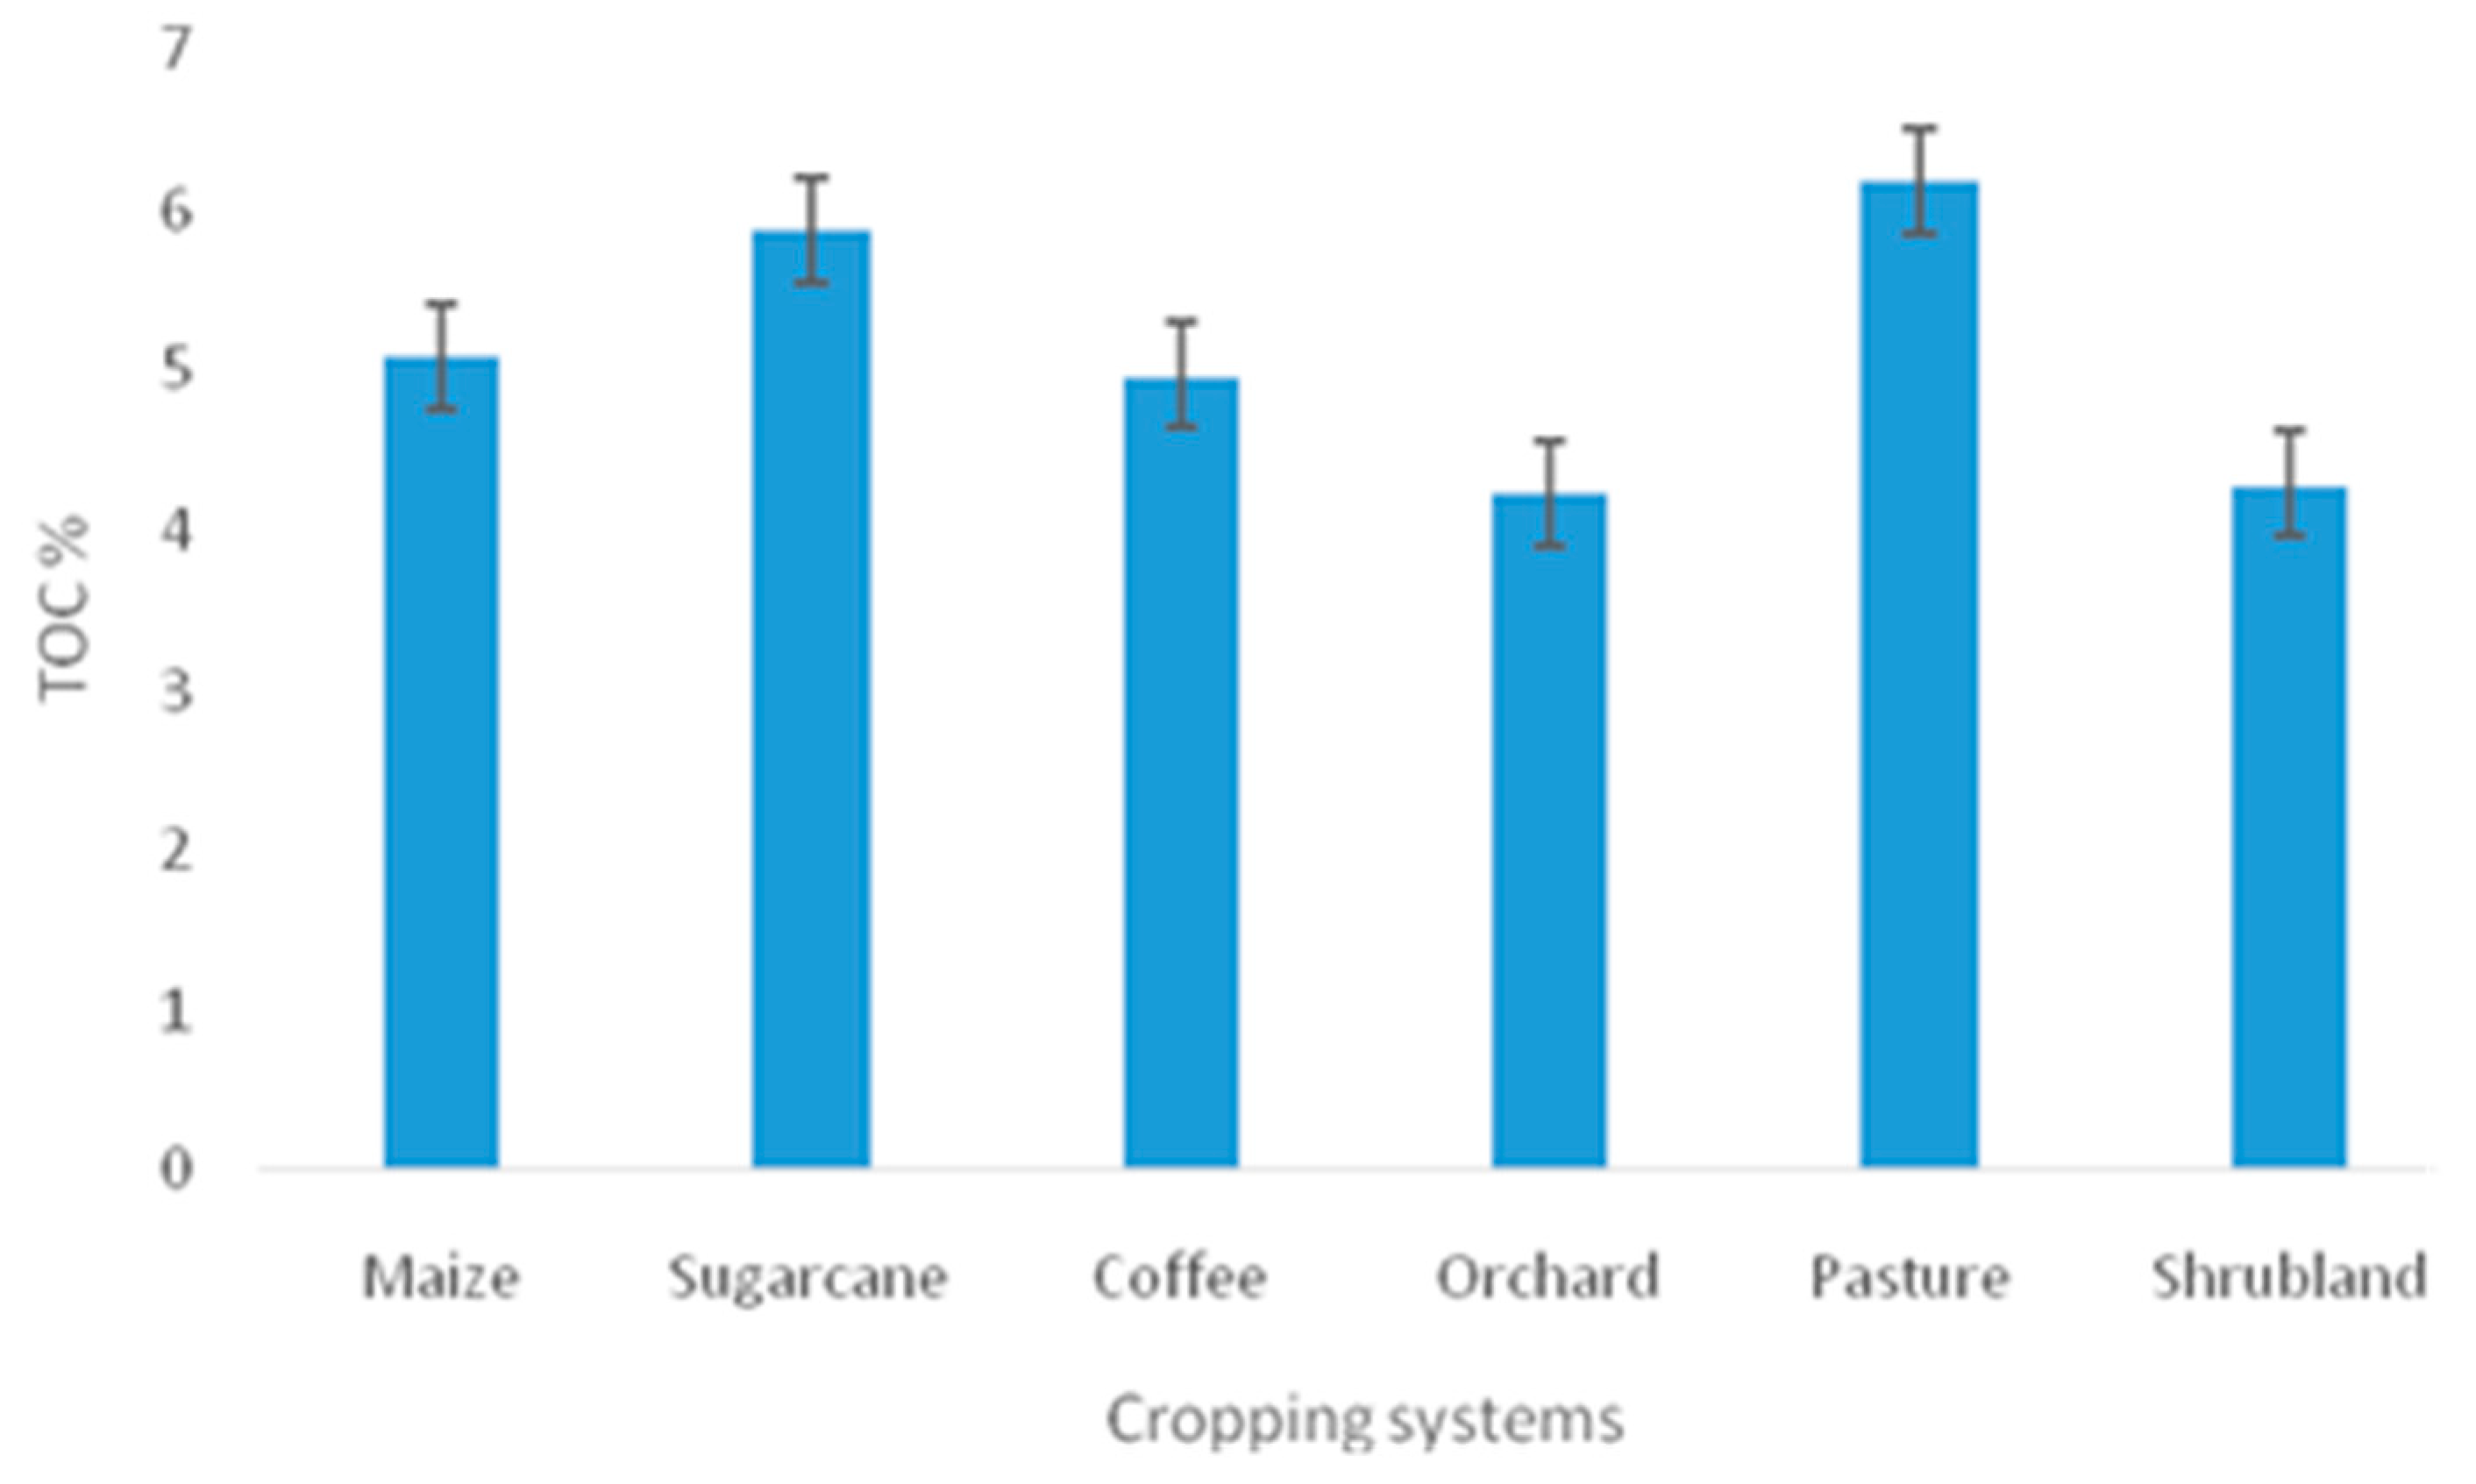
The Total Organic Carbon (TOC) also varied with cropping systems (Figure 5). The highest mean of TOC was observed at the pastureland and sugarcane plantations. The orchard and shrub land recorded the lowest TOC.

3.1.2. Heavy Metal Concentrations under Various Cropping Systems

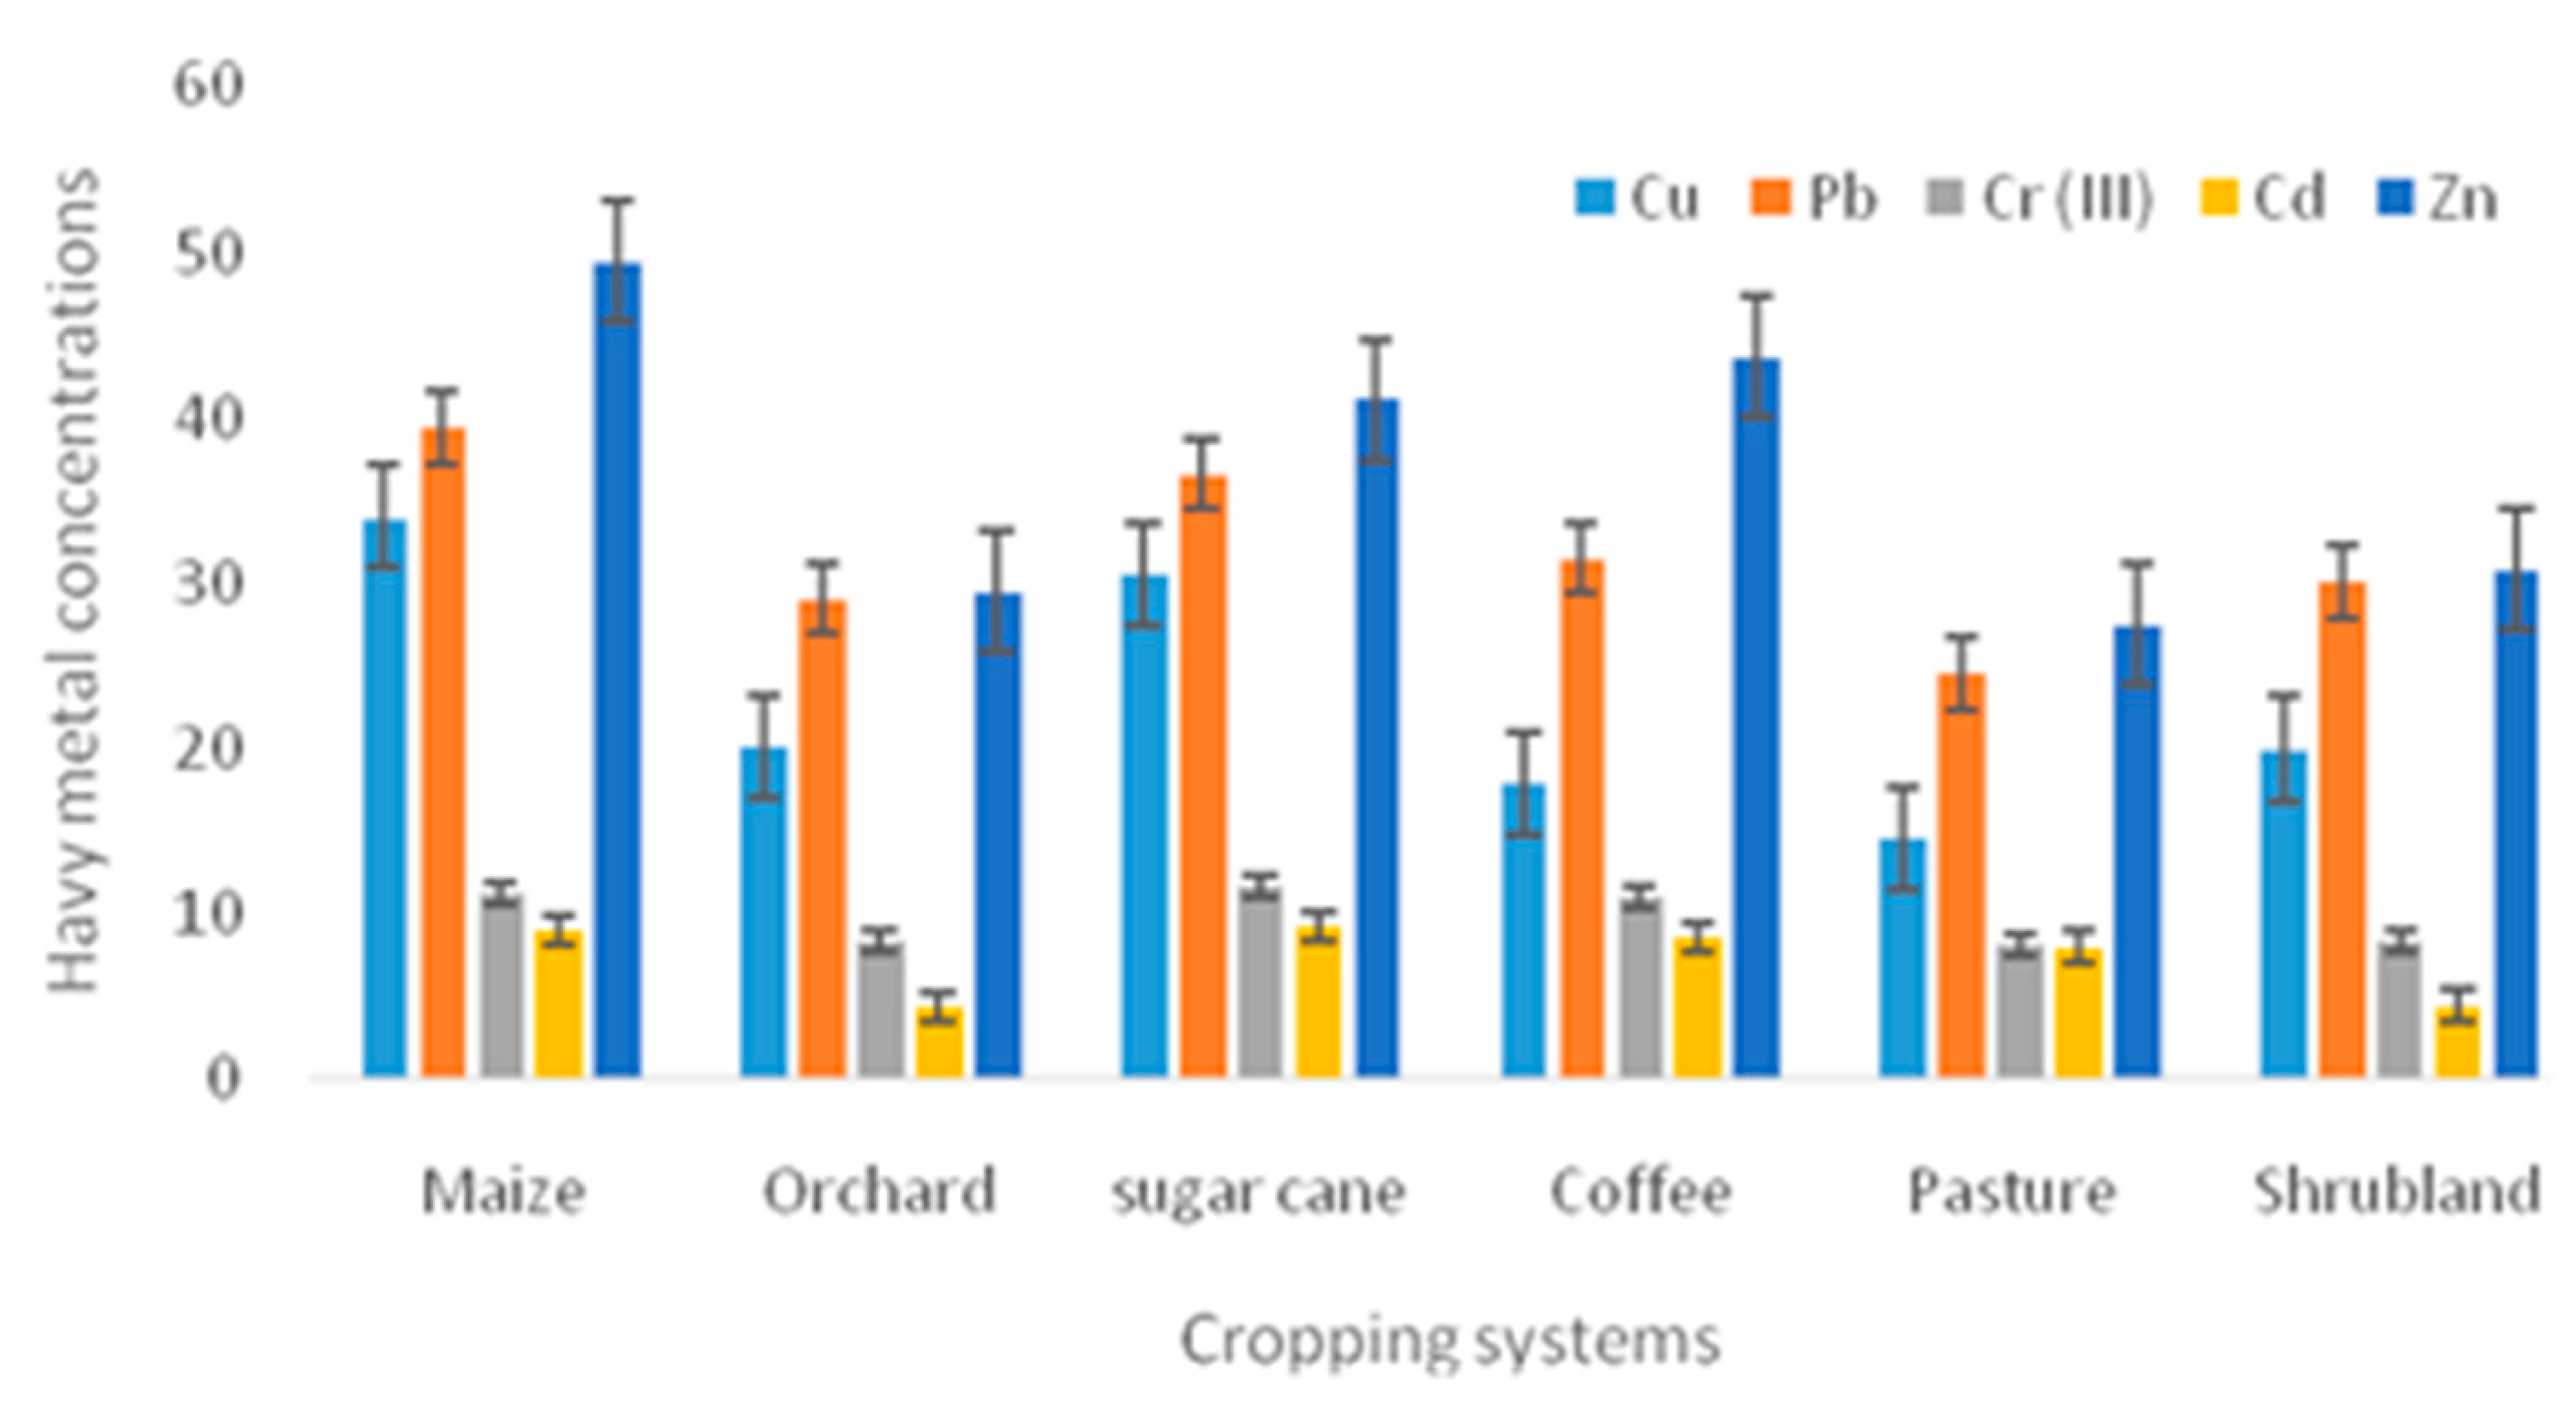
The heavy metals analyzed during the study showed various concentrations at various cropping systems (Figure 6). Maize, sugarcane and coffee plantations recorded the highest concentrations of Zinc and Copper compared to the other cropping systems. The concentration of Cu, Pb, Zn and Cr were lower than the acceptable maximum limits of 36 mg/Kg, 85 mg/Kg, 50 mg/Kg and 100 mg/Kg respectively in agricultural soils (Table 3). Chromium and Cadmium levels were relatively lower compared to other heavy metals in all the cropping systems considered. However, of all the heavy metals considered, in all cropping systems, Cd recorded levels much higher than the permitted global levels of 0.8 mg/Kg in agricultural soils. ANOVA showed that the means of Copper, Zinc, Lead, Cadmium and Chromium at the various cropping systems were significantly different (p>0.05).
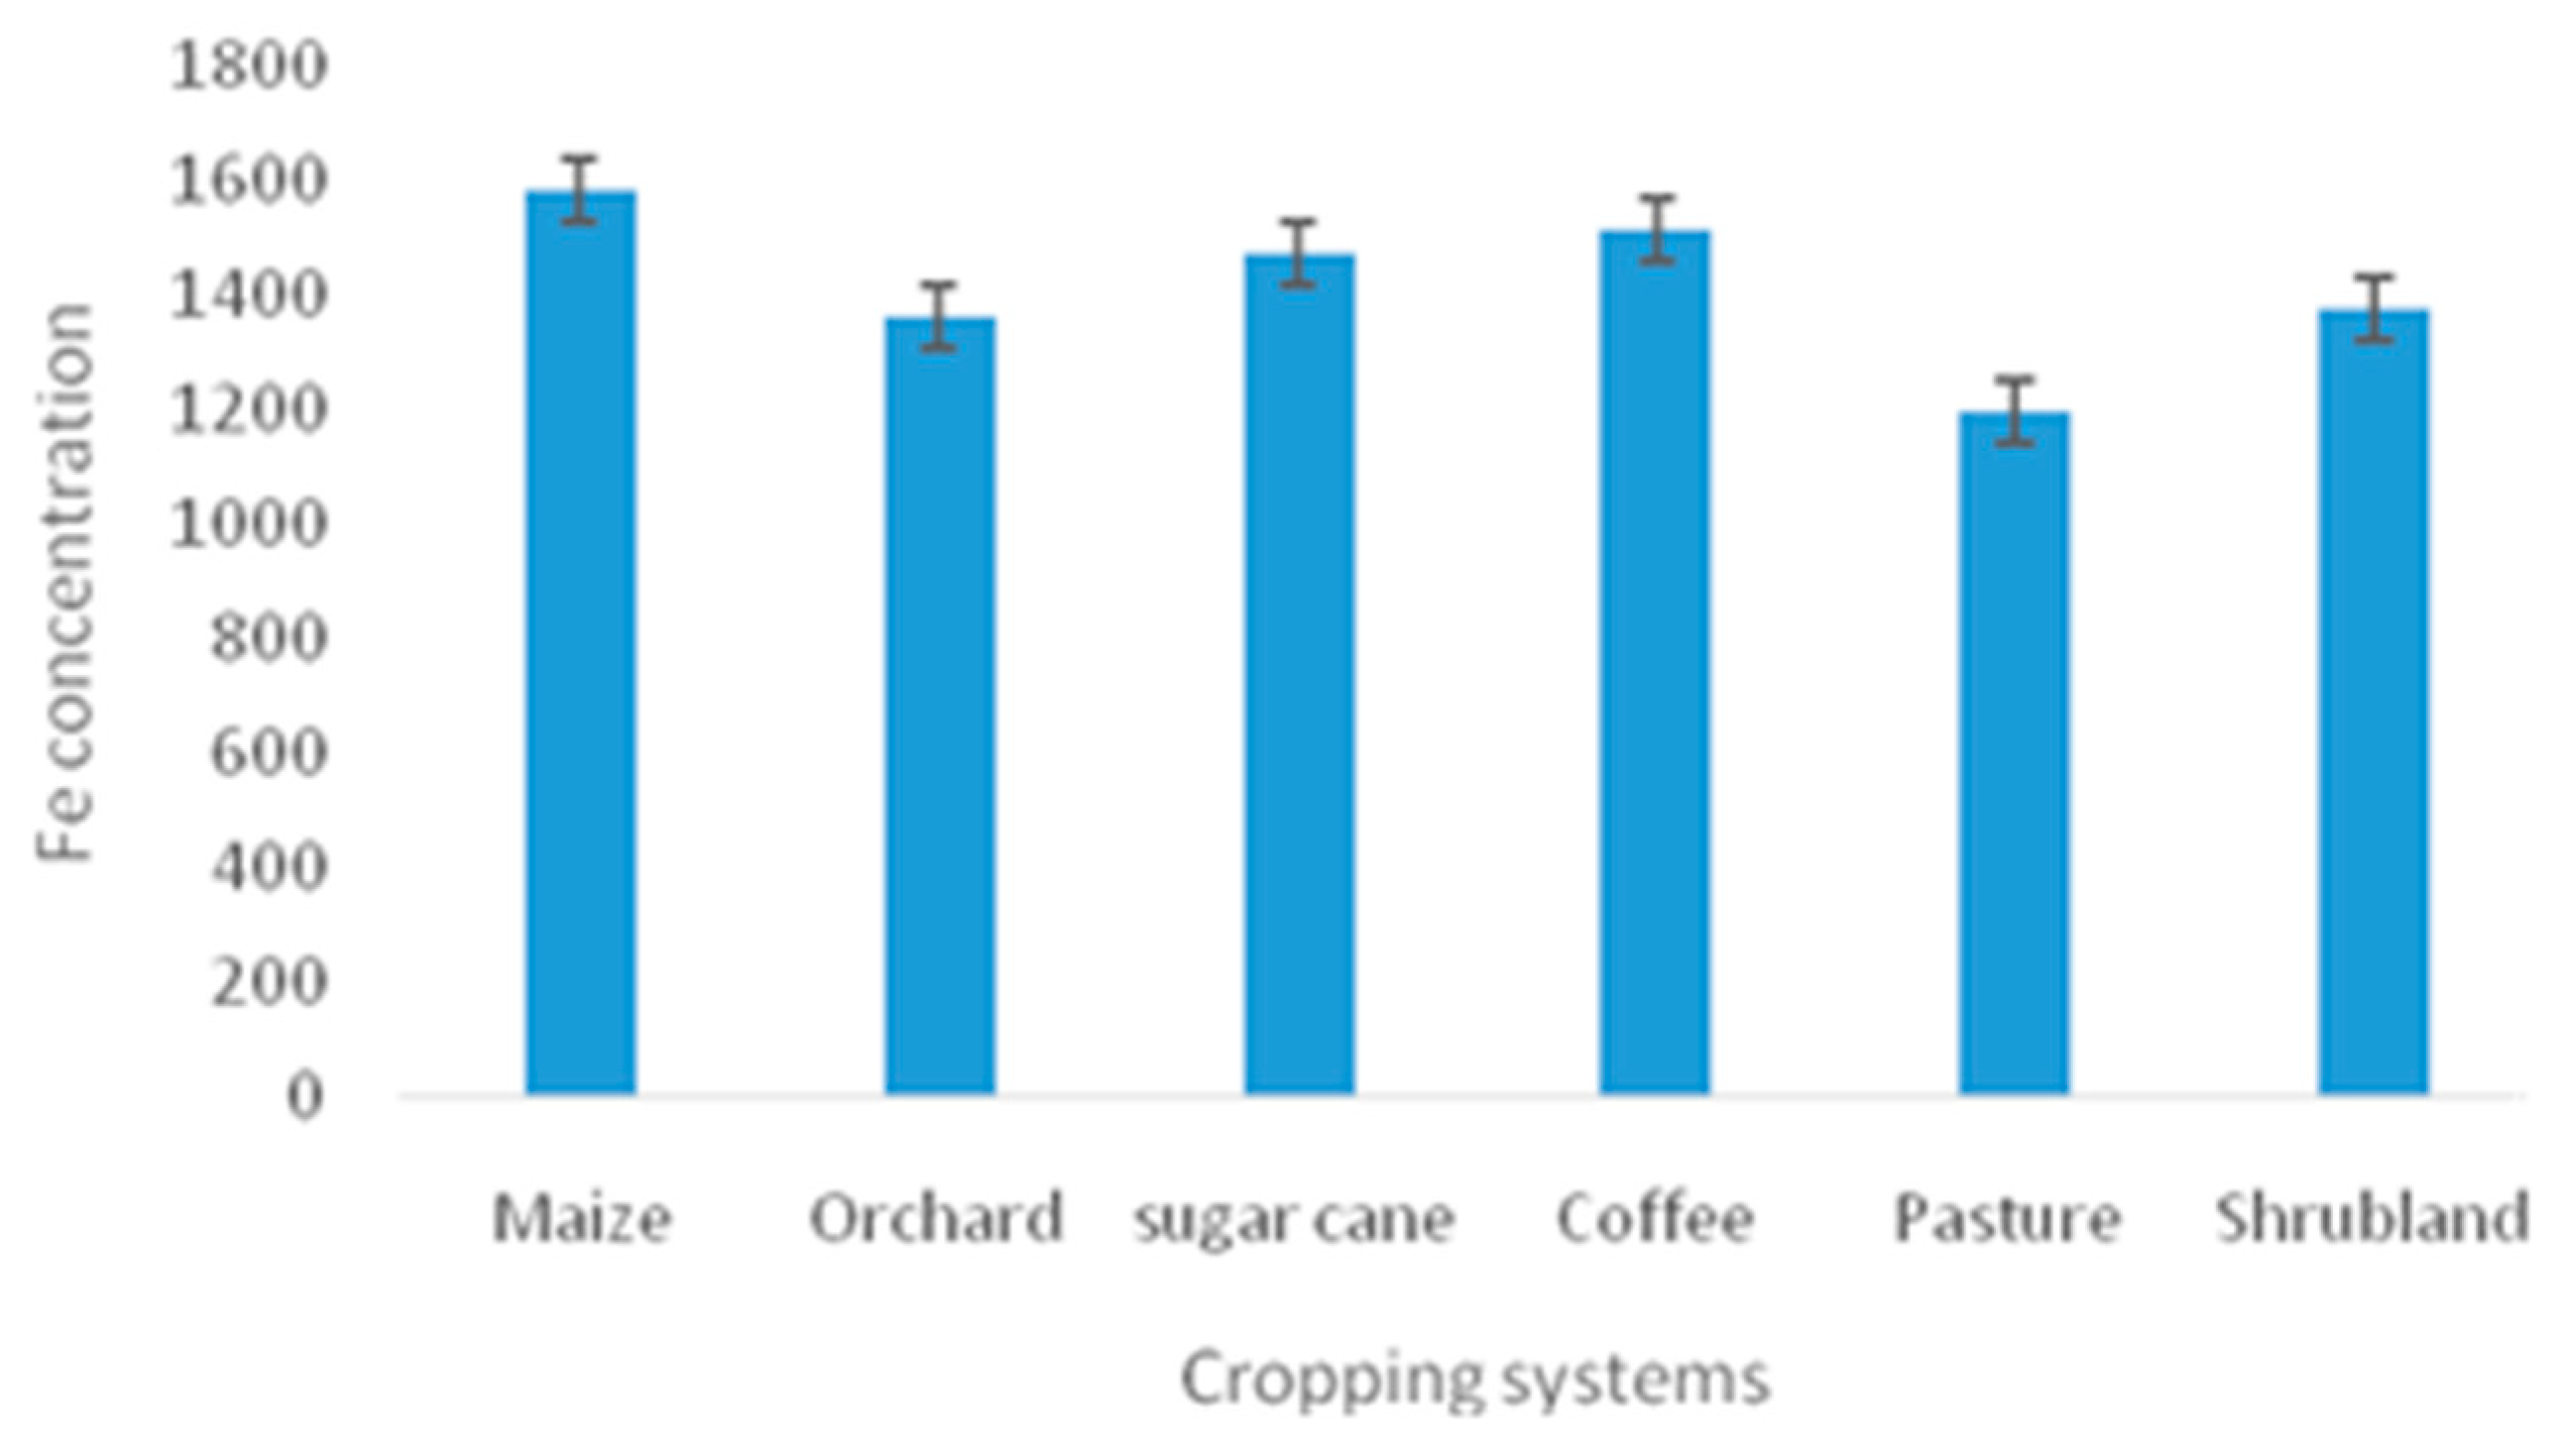
Of all the six heavy metals analyzed, Fe showed the highest concentration. However, the concentration of Fe at the various cropping systems were much lower than the permitted Fe levels of 500 mg/Kg in agricultural soils. The lowest Fe concentration was recorded at the pasture land (Figure 7). Despite the little variations observed, there were no statistically significant differences in Fe concentration at different cropping systems (F = 1.604; p>0.05).

3.1.3. Namerow’s Pollution Index/Row’s Pollution Index (NPI) per Cropping System

The Pollution Index/Row’s Pollution Index (NPI) of the analyzed heavy metals per cropping system was as shown in Table 2. With the exception of Cadmium, the concentrations of the analyzed heavy metals at each cropping systems were lower than the permitted global levels of these elements in agricultural soils (Table 2).NPI analysis showed that in all cropping systems except coffee and pasture land, Cu concentrations tended towards pollution with NPI values approaching 1. Zn concentration was tending towards pollution under all the cropping systems. Pb and Cr, however recorded lower NPI values that indicated less chances of pollution (NPI ≤1). Similarly, Fe concentration showed less chances of pollution wit NPI less than 0.5 except at the sugar cane plantations were the concentrations tended towards pollution. Of all the heavy metals analyzed, Cadmium concentrations showed NPI>1 at all cropping systems, indicating surplus levels, thus soil pollution. However, the highest NPI for Cd concentration was recorded under maize, sugar cane, coffee and pasture cropping systems while the lowest values were recorded at the shrubland. Contrary to the expected, soil samples collected from the shrub land which in this study, was designated as undisturbed and pristine, also recorded higher concentrations of the heavy metals except Cadmium, above the allowable limits in agricultural soils.

3.1.4. Correlation between the Analyzed Physicochemical Parameters

Spearman Rank Order showed a number of positive and negative correlations among the analyzed soil parameters (Table 3). All correlations were significant at p < 0.05.EC was significantly positively correlated with total N (r =0.256; p<0.05), Na (r =0.204; p<0.05), Cu (r =0.150; p<0.05), Pb (r =0.326; p<0.05), Cr (r =0.280; p<0.05), Cd (r =0.200; p< 0.05), Zn (r =0.347; p<0.05), Fe (r =0.159; p < 0.05) and TOC (r =0.160; p<0.05). Soil pH was negatively correlated with most of the parameters including EC (r =-0.510; p<0.05), Cu (r =-0.542; p<0.05), Pb (r =-0.414; p<0.05), Cr (r =-0.316; p<0.05), Cd (r =-0.284; p<0.05) and Zn (r =-0.310; p<0.05). The concentrations of the base cations analyzed showed positive correlations with one another, where there was significance (p < 0.05).
The concentrations of the heavy metals were positively correlated with each other (p<0.05) and the base cations except for Magnesium that showed significant negative correlation with Cu (r =--0.145; p<0.05) and Pb (r =--0.178; p < 0.05). Total N showed significant negative correlation with K+ (r =--0.161; p<0.05) and Mg2+ (r =--0.191; p<0.05).
Table 3. Spearman Rank Order Correlation among the analyzed soil parameters (Fields marked *show correlation significant at p <0.05).
Parameters PH EC Total N Na K Ca Mg Cu Pb Cr (III) Cd Zn Fe TOC
PH 1.00
EC -0.510
0.000*
1.00
Total N +0.03
0.967
+0.256*
0.000
1.00
Na -0.149
0.033
+0.204*
0.000
+0.118
0.094
1.00
K -0.096
0.180
+0.066
0.340
-0.161*
0.022
0.034
0.626
1.00
Ca -0.066
0.370
+0.059
0.403
-0.089
0.210
0.005
0.938
+0.512*
0.000
1.00
Mg +0.119
0.090
-0.098
0.165
-0.191*
0.010
-0.054
0.447
+0.354*
0.000
+0.446*
0.000
1.00
Cu -0.542**
0.000
+0.150*
0.030
-0.091
0.199
+0.013
0.849
+0.066
0.351
+0.033
0.638
-0.145*
0.039
1.00
Pb -0.414**
0.000
+0.326*
0.000
0.012
0.870
+0.007
0.917
+0.060
0.093
+0.141*
0.046
-0.178*
0.011
+0.528*
0.000
1.00
Cr (III) -0.316**
0.000
+0.280*
0.000
-0.059
0.401
-0.013
0.853
+0.232*
0.000
+0.301*
0.000
+0.157*
0.000
+0.398*
0.000
0.335**
0.000
1.00
Cd -0.284*
0.000
+0.200*
0.000
0.109
0.120
+0.081
0.251
+0.255*
0.000
+0.221*
0.000
+0.243*
0.000
+0.321*
0.000
0.292**
0.000
0.427**
0.000
1.00
Zn -0.310*
0.000
+0.347*
0.000
-0.043
0.544
+0.019
0.787
+0.375*
0.000
+0.645*
0.000
+0.234*
0.001
+0.257*
0.000
0.458
0.000
0.561**
0.000
0.345**
0.000
1.00
Fe -0.091
0.190
+0.159*
0.023
0.076
0.283
+0.027
0.702
+0.040
0.570
+0.153
0.030
+0.030
0.666
+0.068
0.335
0.142
0.044
0.000
0.055
0.090
0.020
0.181**
0.010
1.00
TOC -0.103
0.143
+0.160*
0.022
0.347**
0.000
+0.072
0.307
-0.094
0.182
-0.031
0.665
-0.040
0.569
+0.106
0.132
0.185
0.080
0.146*
0.037
0.402**
0.000
0.124
0.079
0.016
0.816
1.00

4. Discussion

Agriculture remains one of the major economic activities sustaining many economies in all parts of the world with cultivated land being a key resources for the agricultural society [51], without which, no agronomic practices can be actualized. Globally, a lot of environmental damage in the past few decades has been associated with intensification of agricultural activities [52]. This has made soil to be one of the resources most vulnerable to degradation through unsustainable land use conversion that has potential impacts on the physical and chemical properties of soils [53]. Land use dynamics have the potential to influence the physical and chemical properties of the soil [53]. For example, the conversion of forests into agroecosystems has been a worldwide concern as it alters nutrient cycles within the soil and contributes towards soil quality degradation in the long run. The impact of agricultural activities on soil quality can therefore be understood by conducting regular monitoring of soil quality.

4.1. Variations in pH, EC and Base Cation Concentrations

The PH, negative log10 of the hydrogen ions present in a medium, is one of the basic soil properties that influence agricultural production [55]. Its influence on agricultural productivity is based on the fact that many other chemical and biological processes taking place within the soil ecosystems. For example, pH has been found to influence microbial activity in biodegradation of organic wastes and mobility of certain nutrients and pollutants such as heavy metal within the soil sub system. Even though different crops have different pH requirements with some performing better under acidic conditions and others under alkaline conditions, the optimum pH range for most plants is 5.5-7.5. Many plants are affected by extreme changes in PH [56]. For examples, at very low soil pH e.g. below 6, some important soil nutrients such as Mo, Ca, Mg, P, N, and K may become less available to plants while other toxic elements such as Al and Mn become available in large quantities that may negatively affect plant physiological processes [57]. At high PH above 7.5, calcium may bind phosphorus, making it unavailable for plants. Very alkaline conditions may also lead to cobalt and zinc deficiency resulting in stunted growth of plants. Soil acidity can be attributed to many variables in the environment such as high acidic rainfall, use of inorganic fertilizers and oxidative weathering. However, in agricultural landscapes such as western Kenya where this study was conducted, excess use of fertilizer can be the major contributor to low soil PH recorded.
The higher the concentrations of hydrogen ions held through the exchange of complex soil processes in relation to base cation concentration, the more acidic the soil sample becomes. For example, some inorganic nitrogenous fertilizers contain ammonium ions (NH4+) which during nitrification into NO3- is accompanied with the production of hydrogen ions released into the soil. Due to continuous farming and soil exhaustion, many large scale famers in the study have resorted to periodic application of inorganic fertilizers [47]. Therefore high application of inorganic fertilizers result in enhanced production of hydrogen ions thus low soil PH. This explains the lower soil pH values recorded under maize and sugarcane cropping systems (Figure 2). The mineralization and transfer of the hydrogen ions is accelerated by the high rainfall experienced in the study area. In the study area, there is infrequent application of inorganic fertilizers in the orchards and coffee farms. Low production of hydrogen ions thus leads to relatively higher soil PH compared to other cropping systems (Figure 2). Under maize cropping systems, there is annual land tillage which facilitates leaching of base cations to lower soil layers leaving H+ and Al3+ which are responsible for high acidity [56]. Under sugar cane cropping systems, there is regular application of inorganic fertilizers to increase yields. Fertilizer residues, coupled with high mineralization of N under cane canopies increase H+ loads hence lowered PH. Contrastingly the shrub lands in the study area that were considered pristine and less disturbed equally recorded lower PH implying acidity. Similarly the pasture land with the paddocks recorded lower PH. The acidity of soil samples from the pasture land and shrub land areas can attributed to the presence of large deposits of organic matter/litter from plan leaves, decomposition and mineralization of which is accompanied with hydrogen ions production.
Soil EC is a measure of the availability of ions in a soil sample, thus convey an electric current. It is another important soil characteristic that influences plant growth. EC is associated by the concentration of dissolved ions in soil solution such as Na+, K+, Mg2+,Ca2+, Cl- , SO42−, HCO3 and CO32− [55]. The higher the concentration of dissolved ion in a solution, the higher the EC of the soil sample. However, it is important to note that Na+, K+, Mg2+ and Ca2+ cations are basic. Increase in their concentration is therefore accompanied by a rise in PH. This explains the negative correlation between soil pH and EC (r =-0.510; p<0.05) as shown in Table 3. The low EC observed in the shrub land area where there were no agricultural practices can be explained by the podological factors. Much of the hydrogen ions that lowered the PH in these locations could have been from pedologic processes as opposed to anthropogenic sources. Additionally, the pristine shrub lands where sampling was done for control purposes were not fully vegetated. The exposure of soil to the heavy rainfall experienced in the study are could possibly facilitate heavy leaching of the exchangeable base cations leading to lower PH. Within the coffee and grass cropping systems, the high EC could be attributed low use of inorganic fertilizers as coffee and grass do not require regular fertilizer application. The concentration of base cations at these sites are therefore relatively higher (Figure 2).
Soil Organic Carbon is a measure of the amount of carbon contained in the soil organic matter. It is an important parameter that aids understanding of soil fertility [58]. Understanding soil organic matter requires a combination of various factors such as soil type, vegetation cover and climate. This parameter has a very close relationship with land use and land cover dynamics. This has made soil quality degradation due to inappropriate cropping one of the recent developmental challenges that has attracted global attention [59]. For example, in arable lands, soil organic matter content has been found to be lower compared to forested areas or natural grasslands. This is because routine harvesting reduces deposition of organic materials. This explains the low TOC recorded under maize cropping systems (Figure 5). Continuous clearing of land exposes the soil to erosion that minimizes organic matter input and nutrient accumulation hence low soil organic matter content. Under sugar cane, coffee and grass cropping systems, the ground surfaces are covered for relative longer periods with continuous litter deposition. The high organic matter concentrations at these sites increase TOC. This further explains the TOC trend observed in Figure 5. Decreased SOM and nutrient levels have direct impacts on soil productivity, biodiversity, buffering capacity, cation exchange capacity and infiltration. Soil organic matter constitutes all decomposed, partly decomposed and undecomposed organic materials from plant and animal origin within the soil [60]. This parameter is one of the key indicators of soil quality which is central to agricultural productivity. Enhancement of soil organic matter content provides a favourable environment within the soil subsystem hence better crop yields [60]. High levels of soil organic matter content improves soil water holding capacity, reduces soil erosion while enhancing plant nutrient retention [60].

4.2. Soil Heavy Metal Pollution due to Agriculture

Soil is considered as one of the most basic resources on which the lives of plants, animal and humans depend [61]. Soil pollution, denoting the contamination of the soil medium with substances that impair the survival of soil dwelling organisms and even humans, still remains a hidden danger as it cannot be visually observed [61]. Due to the rapid industrialization and urbanization trajectories realized in the 20th century, agricultural soil contamination through heavy deposition has been a global concern in both developed and developing countries [59]. These metals and metalloids such as Mercury, Silver, Copper, Iron, Lead, and Cadmium [6] when present in the environment above the background concentrations, pose potential health problems to plants, animals and humans. Their contamination is one of the factors that restrict agricultural productivity and compromises food safety [62]. Their toxicity risks in different environmental compartments is complicated by the fact that most of them are non-biodegradable and bio cumulative within ecosystems. They therefore persist in biological systems and have the potential of being transferred along trophic levels can be toxic to plants, animals and humans [63]. This is why currently, heavy metal contamination in agricultural soils and crops has attracted worldwide attention [64].
Under normal circumstances, these metals occur naturally in the environment but at very low concentrations/background concentration [3,7,44]. However, the rate at which these elements are released naturally in the soil depends on the chemical composition of the parent rock and the prevailing climatic and biotic factors that mediate pedologic and geologic process through which associated with heavy metal exudation [65]. This explains why even non cultivated sites in the study area also recorded heavy metal residues (Table 1). It further explains the observed spatial variation in heavy metal concentrations in soils collected from control, sites in the study area. However, the observed rise in heavy metal concentration in soils under maize, sugarcane, and orchard cropping systems area can be attributed to anthropogenic influxes that include agriculture, combustion of fossil fuel and agriculture. [66] observed that soils under corn field production were slightly contaminated with lead (22–100 mg/kg), copper (31–64 mg/kg), and nickel (22–76 mg/kg) and moderately contaminated with zinc (112–635 mg/kg). Maize production cropping systems are hence more prone to soil heavy metal contamination.
Within the study area, there are low levels of industrialization, mining, transportation systems and human/industrial waste disposal. Most of the contamination is therefore attributable to agricultural sources. In many parts of the world, many empirical studies have documented heavy metal influxes in agricultural soils due to application of various classes of agrochemicals such as fertilizers and pesticides [6,67,68]. High application of inorganic fertilizers such as lime, phosphatic, nitrate and potash fertilizers has been found to contribute to elevated levels of Cromium, Cadmium, Manganese, Zinc, Copper, Lead and Nickel [6]. This explains the high mean levels of Mercury, Copper and Zinc recorded under maize and sugarcane cropping systems in the study area (Table 1). With the introduction of fertilizer subsidy under Agricultural Sector Support Programme and other county government initiatives, most farmers in the study area have embraced the use of inorganic fertilizers due to the perceived high yields [47]. This finding concurs with that of [44] who reported that top soil samples collected from Nzoia sugarcane nucleus showed 42.38 mg/Kg, 59.12 mg/Kg, 116.27 mg/Kg and 409.84 mg/Kg of Cr, Pb, Cu, Zn and Fe, respectively. The study concluded that within the sugarcane farms, the heavy metal concentrations were above the international standards. These inorganic fertilizers re applied by farmers during planting and later for top dressing to boost productivity. [33] reported that mean concentrations of Pb, Cr, Hg, As, and Se in soils sampled from cultivated areas exceeded the background values of Guizhou Province, China, by 1.12, 1.28, 2.36, 1.27, and 2.4 times, respectively.
Excess fertilizer residues remain within the soil ecosystem increasing soil acidity. This explains why relatively lower soil pH was recorded under maize and sugarcane cropping systems while grassland and control sites recorded relatively higher PH levels (Figure 2). The mineral fertilizers contain traces of heavy metals such as Pb, Zn and Cd. As fertilizer application is intensified, accumulation of heavy metals in the soil rises. This is why high NPI value of 11.303 was observed within the maize cropping system with respect to cadmium (Table 3).This finding concurs with [69] that found out that even though soils sampled from orchards did not have heavy metal pollution threats with respect to Cu, Cr, Zn, Hg and Zn, 10.0% of the soil samples collected from the orchards were under threat from cadmium pollution with PI≥1. Even though cadmium is one of the non-essential plant elements, it is quite ubiquitous in the environment with its sources associated with human activities such as disposal of urban wastes, mining, metal manufacturing and use of phosphate fertilizers. Soil contamination through cadmium saturation may have adverse effects on plant physiology and possible transference to other trophic levels [70]. Increased cadmium concentrations inhibits absorption and translocation of essential plant nutrients and water while also exposes plants to oxidative damage.
In orchards there is little routine application of fertilizers during the growing seasons compared to maize and sugarcane. Soils sampled from the orchards therefore recorded heavy metal concentrations that that are intermediate compared to maize cropping systems and the control sites. In china, empirical analysis found that even though soil heavy metal pollution in agricultural soils irrigated with sewage in Wuqing, Tianjin was mild except for Cd and Pb, PCA and PMF showed that soil parental material contributed significantly to Ca, Mg (23.46%) while agricultural activities contributed (29.97%) of Pb, Cu, and Zn pollution [71]. [69] also observed that concentration of Cr, Cu, Cd, Hg and Pb in orchard soils did not pose any soil pollution threats with NPI ≤ 1. However, 10.0% of the soil samples were under cadmium pollution. Besides the use of inorganic fertilizers, different types of pesticides including herbicides, fungicides and insecticides have also been found to contain traces of heavy metals such as Zinc, Copper, Nickel, Lead, Cadmium, Chromium, Arsenic and Mercury [68,72,73]. With repeated application of these pesticides in large scale farms in the study area, there is continued deposition of heavy metal traces in agricultural soils posing potential ecological risks [47].
Combined heavy metal residues from inorganic fertilizers and pesticides in these large scale farms therefore lead to elevated levels of the analyzed heavy metals in the soil (Table 1). This is why higher levels of heavy metals were recorded under cultivated areas compared to the grassland and control plots. In the Wanshan Mining District of China, [66] reported that soil under corn cropping system were moderately contaminated with lead (22–100 mg/kg), copper (31–64 mg/kg), and nickel (22–76 mg/kg) and moderately contaminated with zinc (112–635 mg/kg). Although the use of organic manures has been advocated for by environmentalists due to the perceived minimal environmental impacts, previous works have shown that application of biosolids and manures can lead to accumulation of Zinc, Nickel, Copper, Lead, Cadmium, Cromium and Mercury in agricultural soils [6,36].

5. Conclusions

In conclusion, variation in cropping systems impact on soil chemical properties. Maize cropping system is associated with reduced PH and lower EC. There is a close relationship between the application of inorganic mineral fertilizers and total N content in agricultural soils. Base cation concentration negatively correlate with PH. Less acidic PH are associated with orchards and coffee cropping systems. Adjacent uncultivated site surrounding the farms however may not necessary have higher PH values as expected.
There are variations in heavy metal concentrations with changes in cropping systems. However, all the heavy metals analyzed in this study were lower than the globally acceptable levels in agricultural oils except Cd.
With respect to each heavy metal, various cropping systems showed varying levels of heavy metal pollution as shown from the NPI values. In the study area, concentrations of Zn, Cu, Pb and Fe do not pose any soil pollution threat. However, the concentration of cadmium are very high which pose pollution risks and chances of transfer to other trophic levels. Among the cropping systems investigated maize and sugarcane cropping systems are the most affected by heavy metal pollution while orchards, pasture land and coffee cropping systems are less vulnerable to heavy metal pollution. Therefore, the rank order of the pollution potential associated by heavy metal contamination in the study area is Cd>Zn>Pb>Cu>Cr>Fe.

6. Recommendations

There is need to regulate the application of inorganic fertilizers in large scale farming catchments. Alternatively, if there is need to boost yields, the study recommends that farmers should be encouraged to embrace the use of organic manures. Because soil PH exerts greater influence on a number of soil physical, chemical and biochemical processes, regular monitoring of soil quality should be done in the study area and sustainable strategies for the management of soil PH devised. Due to high cadmium accumulation in the soil, care should be taken to regulate the types of crops plated in cadmium rich soils to avoid possible transfer of this toxic metal to other trophic levels.
Finally, this study recommends that in determination of heavy metal pollution indices, undisturbed sites should not be literally taken as control sites as they may also show high heavy metal concentration, above the allowable limits which may limit our understanding of the application of metal pollution indices.

Author Contributions

Conceptualization, Z.O., E.O. and J.L.; methodology, Z.O., E.O., S.O. and J.L.; software, Z.O. and S.K.; validation, Z.O., E.O. and J.L.; formal analysis, Z.O. and P.O.; writing—original draft preparation, Z.O., E.O. and J.L.; writing—review and editing, Z.O. and E.O.; visuali-zation, E.O. and J.L.; supervision, E.O. and J.L.; All authors have read and agreed to the published version of the manuscript..

Funding

This research received no external funding.

Acknowledgments

We would like to thank the Department of Agriculture in Endebes Sub-County for their guidance during soil sampling. We also appreciate chemistry laboratories at Jaramogi Oginga Odinga University of Science and Technology (JOOUST) and University of Kabianga for providing facilities for laboratory chemical analyses. Finally, we also thank the staff of the Agricultural Development Corporation (ADC), Kitale Brach, for their assistance during field sampling.

Conflicts of Interest

The authors declare no conflict of interest

Appendix A

Figure A1; Map of the study area showing the sampled large-scale farms
Figure A2; Variation in mean PH and EC across cropping systems.
Figure A3; Variation in total N across cropping systems.
Figure A4; Variation in base cation concentrations across cropping systems.
Figure A5; Variation in mean TOC across cropping systems.
Figure A6; Variation in mean heavy concentrations along cropping systems.
Figure A7; Variation in mean Fe concentrations along cropping systems.
Table A1; Mean ±SD of the concentrations of the analyzed soil chemical parameters.
Table A2; Namerow’s Pollution Index/Row’s Pollution Index (NPI)
Table A3; Spearman Rank Order Correlation among the analyzed soil parameters

References

  1. Preira, V.; Martinho, D. Exploring the Topics of Soil Pollution and Agricultural Economics: Highlighting Good Practices. Agriculture. 2020, 10, 24. [CrossRef]
  2. Liu, H.; Li, X.; Meng,W.; Liu, N.; and Wu, P. Accumulation and source apportionment of heavy metal(loid)s in agricultural soils based on GIS, SOM and PMF: A case study in superposition areas of geochemical anomalies and zinc smelting, Southwest China. Process Saf. Environ. Prot. 2022, 159: 964–977.
  3. Sidhu, G.P. Heavy metal toxicity in soils: sources, remediation technologies and challenges. Adv. Plants Agric. Res. 2016, 5:445‒446.
  4. Weissmannová, H.D.; Dolezalova, P. Indices of soil contamination by heavy metals: methodology of calculation for pollution assessment (mini review). Environ. Monit. Assess. 2017, 189: 616.
  5. Zheng, S.; Chen, B.; Qui, X.; Chen, M.; Ma, Z.; Yu, X. Distribution and risk assessment of 82 pesticides in Jiulong River and estuary. Chemosphere, 2016, 144, 1177–1192.
  6. Srivastava, V.; Sarkar, A.; Singh, S.; Singh, P.; de Araujo, A.S.; Singh, R.P. Agroecological Responses of Heavy Metal Pollution with Special Emphasis on Soil Health and Plant Performances. Front. Environ. Sci. 2017, 5: 64-71. [CrossRef]
  7. Wanjala, F.O..; Hashim, N.; Otwoma, O.D.; Nyambura, C.; Kebwaro, J.; Ndege, M.; Bartilol, S. Environmental assessment of heavy metal pollutants in soils and water from Ortum, Kenya Environ. Monit. Assess. 2020, 192:11. [CrossRef]
  8. Alengebawy, A; Abdelkhalek, S.T.; Qureshi, S.R..; Wang, M.Q..; 2021. Heavy metals and pesticides toxicity in agricultural soil and plants: Ecological risks and human health implications. Toxics, 2021, 9: 42. [CrossRef]
  9. Irfan, M.; Muhammad, M.; Muhammad, J.K.; Khadim, M.D.; Dost, M.; Ishaq, A.; Mian, W.A.; Shah, F.; Shah, S.; Zafar, H.; Taufiq, N.; Shah, A.; Khan, S.; Beenish, A.; Jan, B.; Sagher, A.; Sidra, M.; Subhan, D.; Rahu, D.; Abdallah, M.; Raf, D. Heavy metals immobilization and improvement in maize (Zea mays L.) growth amended with biochar and compost. Sci. Rep. 2021, 11:18416. [CrossRef]
  10. Chen, R.; Han, L.; Liu, Z.; Zhao, Y.; Li, R.; Xia, L.; Fan, Y.. Assessment of Soil-Heavy Metal Pollution and the Health Risks in a Mining Area from Southern Shaanxi Province, China. Toxics, 2022, 10: 385.
  11. Dong, H.; Zhao, J.; Xie, M. Heavy Metal Concentrations in Orchard Soils with Different Cultivation Durations and Their Potential Ecological Risks in Shaanxi Province, Northwest China. Sustainability, 2021.13, 4741. 741. [CrossRef]
  12. Raven, P.H.; Wgner, D.L. Agricultural intensification and climate change are rapidly decreasing insect biodiversity. PNAS, 2020, 118 No. 2. [CrossRef]
  13. Mekuria, W. The link between agricultural production and population dynamics in Ethiopia: A review. Adv. Plants Agric. Res. 2018, 8:349‒353.
  14. Food and Agriculture Organization. How to feed the world in 2050. Expert Papers, Rome, Italy, 2019, pp 1-35.
  15. Garcia, A. The environmental impacts of agricultural intensification, Technical note no. 9. CGIAR. 2020, pp 4–13.
  16. De Vries, W.; Römkens, P.F.; Kros, J.; Voogd, J.C.; Schulte-Uebbing, L.F. Impacts of nutrients and heavy metals in European agriculture: Current and critical inputs in relation to air, soil and water quality. ETC-DI, 2022, pp 72. ISBN: 978-3-200-08327-1.
  17. Nicolopoulou, S.P.; Maipas, S.; Kotampasi, C.; Stamatis, P.; Hens, L. Chemical pesticides and human health: The urgent need for a new concept in agriculture. Front. Public Health, 2016, 4, 148. [CrossRef]
  18. Jallow, M.F.A.; Dawood, G.A.; Mohammed, S.A.; Vimala, Y.D.; Binson, M.T. Pesticide Knowledge and Safety Practices among Farm Workers in Kuwait: Results of a Survey. Int. J. Environ. Res. Public Health. 2017, 14, 340. [CrossRef]
  19. Akashe, M.M.; Uday, V.P.; Ashwin, V.N.; Classification of pesticides: A review. Int. J. Res. Ayurveda Pharm. 2018, 9: 144-152. [CrossRef]
  20. Kole, R.K.; Roy, K.; Panja, B.N.; Sankarganesh, E.; Mandal, T.; Worede, R.E. Use of pesticides in agriculture and emergence of resistant pests. Indian J. Anim. Hlth. 2019, 58: 53-70. [CrossRef]
  21. Yawson, D.O. Pesticide use culture among food crop farmers: Implications for subtle exposure and management in Barbados. Agriculture, 2022, 12, 288. [CrossRef]
  22. Al-Kazafy, H.S. Synthetic fertilizers, roles and hazards. Fertil. Technol. 2015, 1: 111–133.
  23. Du Jardin, P. Plant biostimulants: Definition, concept, main categories and regulation. Sci. Hortic. 2015, 196: 3–14. [CrossRef]
  24. Minase, N.A.; Masafu, M.M.; Geda, A.E.; Wolde, A.T. Heavy metals in agricultural soils of Central Ethiopia: The contribution of land use types and organic sources to their variability. Open Sci. J. 2016, 6: 99-112. [CrossRef]
  25. Naz, S.; Fazio, F.; Habib, S.S.; Nawaz, G.; Attaullah, S.; Ullah, M.; Hayat, A.; Ahmed, I.. Incidence of Heavy Metals in the Application of Fertilizers to Crops (Wheat and Rice), a Fish (Common carp) Pond and a Human Health Risk Assessment. Sustainability, 2022, 14, 13441. [CrossRef]
  26. Wang, H.; Li, X.; Chen, Y.; Li, Z.; Chen, J. Geochemical behavior and potential health risk of heavy metals in basalt-derived agricultural soil and crops: A case study from Xuyi County, eastern China. Sci. Total Environ. 2020, 729: 139058. [CrossRef]
  27. Xia, X.; Ji, J.; Yang, Z.; Han, H.; Zhang, W. Cadmium risk in the soil-plant system caused by weathering of carbonate bedrock. Chemosphere, 2020, 254, 126799. [CrossRef]
  28. Inna, D.; Yury, M.; Evgeny, D.; Tatiana, G. Impact of drainage on heavy metal pollution of soils and land usage regulation. 16th International Scientific Conference: Engineering for Rural Development, Jelgava, Latvia, 24th-26th May, 2020. [CrossRef]
  29. Bi, C.; Zhou, Y.; Chen, Z.; Jia, J.; Bao, X. Heavy metals and lead isotopes in soils, road dust and leafy vegetables and health risks via vegetable consumption in the industrial areas of Shanghai, China. Sci. Total Environ. 2018, 620: 1349–1357. [CrossRef]
  30. Yi, K.; Fan, W.; Chen, J.; Jiang, S.; Huang, S.; Peng, L.; Zeng, Q.; Luo, S. Annual input and output fluxes of heavy metals to paddy fields in four types of contaminated areas in Hunan Province, China. Sci. Total Environ. 2018, 634: 67–76. [CrossRef]
  31. Mungai, T.M.; Jun, W. Heavy metal pollution in suburban topsoil of Nyeri, Kapsabet, Voi, Ngong and Juja towns, in Kenya. SN App. Sci. 2019, 1: 960. [CrossRef]
  32. Qin, G.; Niu, Z.; Yu, J.; Li, Z.; Ma, J.; Xiang, P. Soil heavy metal pollution and food safety in China: Effects, sources and removing technology. Chemos. 2022, 267, 129205. [CrossRef]
  33. Li, X.; Liu, N.; Meng, W.; He, J.; Wu, P. 2022. Accumulation and Health Risk Assessment of Heavy Metal(loid)s in Soil-Crop Systems from Central Guizhou, Southwest China. J. Agric. 2022, 12, 981. [CrossRef]
  34. Sayadi, M.H.; Mehri, S.; Najmeh, A. Pollution Index and Ecological Risk of Heavy Metals in the Surface Soils of Amir-Abad Area in Birjand City, Iran. Health Scope, 2015, 4:e2113.
  35. Akenga, T.; Ayabei, K.; Kerich, E.; Sudoi, V.; Kuya, C. Evaluation of levels of selected heavy metals in kales, soils and water collected from irrigated farms along River Moiben, Uasin-Gishu County, Kenya. J. Geosci. Environ. Protec. 2020, 8: 144-155. ISSN 2327-4336.
  36. Sharma, A.; Vinod, K.; Babar, S.; Mohsin, T.; Gagan, P.; Singh, S.; Neha, H.; Sukhmeen, K.; Poonam, Y.; Aditi, S.; et al. Worldwide pesticide usage and its impacts on ecosystem. App. Sci. 2019, 1, 1446. [CrossRef]
  37. Chen, P.; Yulong, R.; Shijie, W.; Xiuming, L.; Bin, L. Effects of organic mineral fertilizer on heavy metal migration and potential carbon sink in soils in a karst region. Acta Geochim, 2017, 36: 539–543. 543. [CrossRef]
  38. Kinuthia, G.K.; Ngure, V.; Dunstone, B.; Lugalia, R.; Agnes, W.; Kamau, L. Levels of heavy metals in wastewater and soil samples from open drainage channels in Nairobi, Kenya: Community health implication. Sci. Rep. 2020, 10: 8434. [CrossRef]
  39. Angelone, M.; and Bini, C. Trace element concentrations in soils and plants of Western Europe. Biogeochemistry of trace metals. CRC Press. 2017. pp. 31–72.
  40. Hu, Z.C.; Li, J.W.; Wang, H.L.; Ye, Z.Q.; Wang, X.D.; Li, Y.F.; Liu, D.; Song, Z.L. Soil Contamination with Heavy Metals and Its Impact on Food Security in China. J. Geosci. Environ. Protec. 2019, 7:168-183.
  41. Tomno, R.M.; Kitulu, L.; Nzeve, J.K.; Waswa, F.; Mailu, S.N.; Shitanda, D. Heavy Metal Concentrations in Vegetables Cultivated and Sold in MachakosMunicipality, Kenya. J. Appl. Sci. Environ. Manage. 2020, 24: 2027-2034. ISSN 1119-8362.
  42. González, H.; Ghneim-Herrera, T. Heavy Metals in Soils and the Remediation Potential of Bacteria Associated With the Plant Microbiome. Fron. Environ. Sci. 2021, 9: 604216. [CrossRef]
  43. Balali-Mood, M.; Naseri, K.; Tahergorabi, Z.; Khazdair, M.; Sadeghi, M. Toxic mechanisms of five heavy metals: mercury, lead, chromium, cadmium, and arsenic. Fron. Pharm. 2021, 12; 643972. [CrossRef]
  44. Omwoma, S.L.; Joseph, O.L.; Ongeri, D.M.; Wanyonyi, B.M. Impact of fertilizers on heavy metals loads in Nzoia nucleus estate sugarcane farms in Western Kenya. Bull. Environ. Cont. Toxicol. 2010, 85: 602-608. [CrossRef]
  45. Limo, E.; Kipkemboi, P.K.; Kipkemei A.S.; Kituyi, L. Concentration, partitioning and enrichment of heavy metals in water, soil and sediments in River Kapsabet micro-watershed scale, Kenya. Int. J. of Sci. Eng. Res. 2015, 6; 1404-1427. ISSN 2229-5518.
  46. Nyika, J.; Megersa, O.D. Heavy metal pollution in soils and vegetables from suburban regions of Nairobi, Kenya and their community health implications. Pollut. 2022, 8: 1434-1447. [CrossRef]
  47. Onyando, Z.O.; Omukunda, E.; Okoth, P.; Khatiebi, S.; Omwoma, S.; Otieno, P.; Osano, O.; Lalah, J. 2023. Screening and Prioritization of Pesticide Application for Potential Human Health and Environmental Risks in Largescale Farms in Western Kenya. Agriculture, 2023, 13, 1178. [CrossRef]
  48. Government of Kenya. Trans Nzoia County Integrated Development Plan 2018–2022 Indicator Handbook; Government Printer: Nairobi, Kenya, 2018. pp. 1–13.
  49. Okalebo, J.R.; Gathua, K.W.; Woomer, P.L. Laboratory methods for soil and plant analysis: A working manual. TSBF, Nairobi, Kenya. 2002.
  50. Kowalska, J.B.; Mazurek, R.; Gąsiorek, M. Pollution indices as useful tools for the comprehensive evaluation of the degree of soil contamination–A review. Environ Geochem Health. 2018. 40, 2395–2420. [CrossRef]
  51. Shrestha, J.; Subash, S.; Krishna, P.T.; Sudeep, S.; Meena, P.; Aakriti, S.; Sajina, S.; Mohammad, A.H. Sustainable Intensification in Agriculture: An Approach for Making Agriculture Greener and Productive. J. Nepal Agric. Res. Council, 2021. 7: 133-150.
  52. Bacar, T.S.; Cheng, Y.B.; Wang, Y.Q.; Kaboul, K.; Lopes, N.D. The Effect of Vegetation Restoration in Soil Organic Carbon Storage. Open J. Soil Sci. 2022, 12: 427-445. [CrossRef]
  53. Zajícová, K.; Chuman, T. Effect of land use on soil chemical properties after 190 years of forest to agricultural land conversion. Soil Water Res. 2019, 14: 121–131. [CrossRef]
  54. Bato, Y.; Bekele, T.; Demissew, S. Effect of different land use systems and soil depths on soil chemical properties alteration in Yerer forests and its surrounding area, at the central highland of Ethiopia. Research Square, Addis Ababa, Ethiopia, 2020.
  55. Food and Agriculture Organization of the United Nations. Standard operating procedure for soil pH determination. Rome, Italy, 2021.
  56. Läuchli, A.; Grattan, S.R. Soil PH extremes. Plant Stres. Phys. 2012, 3: 194-209. [CrossRef]
  57. Lake, B. 2000. Understanding soil PH. South wales.
  58. Shapkota, J.; Kafle, G.; Variation in Soil Organic Carbon under Different Forest Types in Shivapuri Nagarjun National Park, Nepal. Scientifica, 2021, 1382687. [CrossRef]
  59. Tesfahunegn, G.B.; Gebru, T.A. Variation in soil properties under different cropping and other land-use systems in Dura catchment, Northern Ethiopia. PLoS ONE, 2020, 15: 2. [CrossRef]
  60. Food and Agriculture Organization of the United Nations. Standard operating procedure for soil Total Carbon. Rome, Italy, 2019.
  61. Upadhyay, P.; Vaishampayan, A.; Jaiswal, S.K. Soil Pollution Caused by Agricultural Practices and Strategies to Manage It. In: Plant Responses to Soil Pollution. Singh, P., Singh, S.K., Prasad, S.M. (eds). Springer, Singapore, 2020. Pp. 119–132. [CrossRef]
  62. Ghorbani, A.; Emmaverdian, A.; Pehlivan, N.; Zargar, M.; Razavi, S.M.; Chen, M. Nano enabled agrochemicals mitigating heavy metal toxicity and enhancing crop adaptability for sustainable production. J. Nanobiotechnol. 2024, 22, 191. [CrossRef]
  63. Adriano DC. 2001. Trace Elements in Terrestrial Environments: Biogeochemistry, Bioavailability, and Risks of Metals. Springer, New York, NY, USA.
  64. Li, X.; Liu, H.; Meng,W.; Liu, N.; Wu, P. Accumulation and source apportionment of heavy metal(loid)s in agricultural soils based on GIS, SOM and PMF: A case study in superposition areas of geochemical anomalies and zinc smelting, Southwest China. Process Saf. Environ. Prot. 2022, 159: 964–977.
  65. Saha, J.K.; Selladurai, R.; Coumar, M.V.; Dotaniya, M.L.; Kundu, S.; Patra, A.K. Assessment of Heavy Metals Contamination in Soil. In: Soil Pollution-An Emerging Threat to Agriculture. Environ. Chem. Sust. World. 2017, vol 10. Springer, Singapore. [CrossRef]
  66. Wang, J.; Xinbin, F.; Christopher, W.N.; Erson, X.; Guangle, Q.; Zhengduo, B.Y.; Lihai, S. Effect of cropping systems on heavy metal distribution and mercury fractionation in the Wanshan Mining District, China: Implications for environmental management. Environ. Toxicol. Chem. 2014, 33, 2147-2155. [CrossRef]
  67. Sun, C.; Liu, J.; Wang, Y.; Sun, L.; Yu, H. Multivariate and geostatistical analyses of the spatial distribution and sources of heavy metals in agricultural soil in Dehui, Northeast China. Chemos. 2013 92: 517–523. [CrossRef]
  68. Kelepertzis, E. Accumulation of heavy metals in agricultural soils of Mediterranean: insights from Argolida Basin, Peloponnese, Greece. Geoderma, 2014, 221: 82–90. [CrossRef]
  69. Guo J.; Yue T.; Li, X.; Yuan, Y. Heavy metal levels in Kiwifruit orchard soils and trees and its potential health risk assessment in Shaanxi, China. Environ. Sci. Pollut. Res. Int. 2016, 14: 14560-14566. [CrossRef]
  70. Haider, F.U.; Liqun, C.; Coulter, J.A.; Cheema, S.A.; Wu, J.; Zhang, R.; Wenjun, M., and Farooq M. Cadmium toxicity in plants: Impacts and remediation strategies. Ecotoxicol. Environ. saf. 2021, 211: 111887. [CrossRef]
  71. Wang, J.; Danyang, Y.; Yanhong, W.; Xueli, D.; Guochen, L.; Bo, L.; Yujie, Z.; Yinghui, W.; Shuang, X. Source analysis of heavy metalpollution in agricultural soil irrigated with sewage in Wuqing, Tianjin. Sci. Rep. 2021, 11:17816. [CrossRef]
  72. Fishel, F.M. Pesticide Toxicity Profile: Copper-based Pesticides. EDIS, University of Florida, 2014. 5. 2005. [CrossRef]
  73. Tóth, G.; Hermann, T.; Da Silva, M.R.; Montanarella, L. Heavy metals in agricultural soils of the European Union with implications for food safety. Environ. Int. 2016, 88: 299–309. [CrossRef]
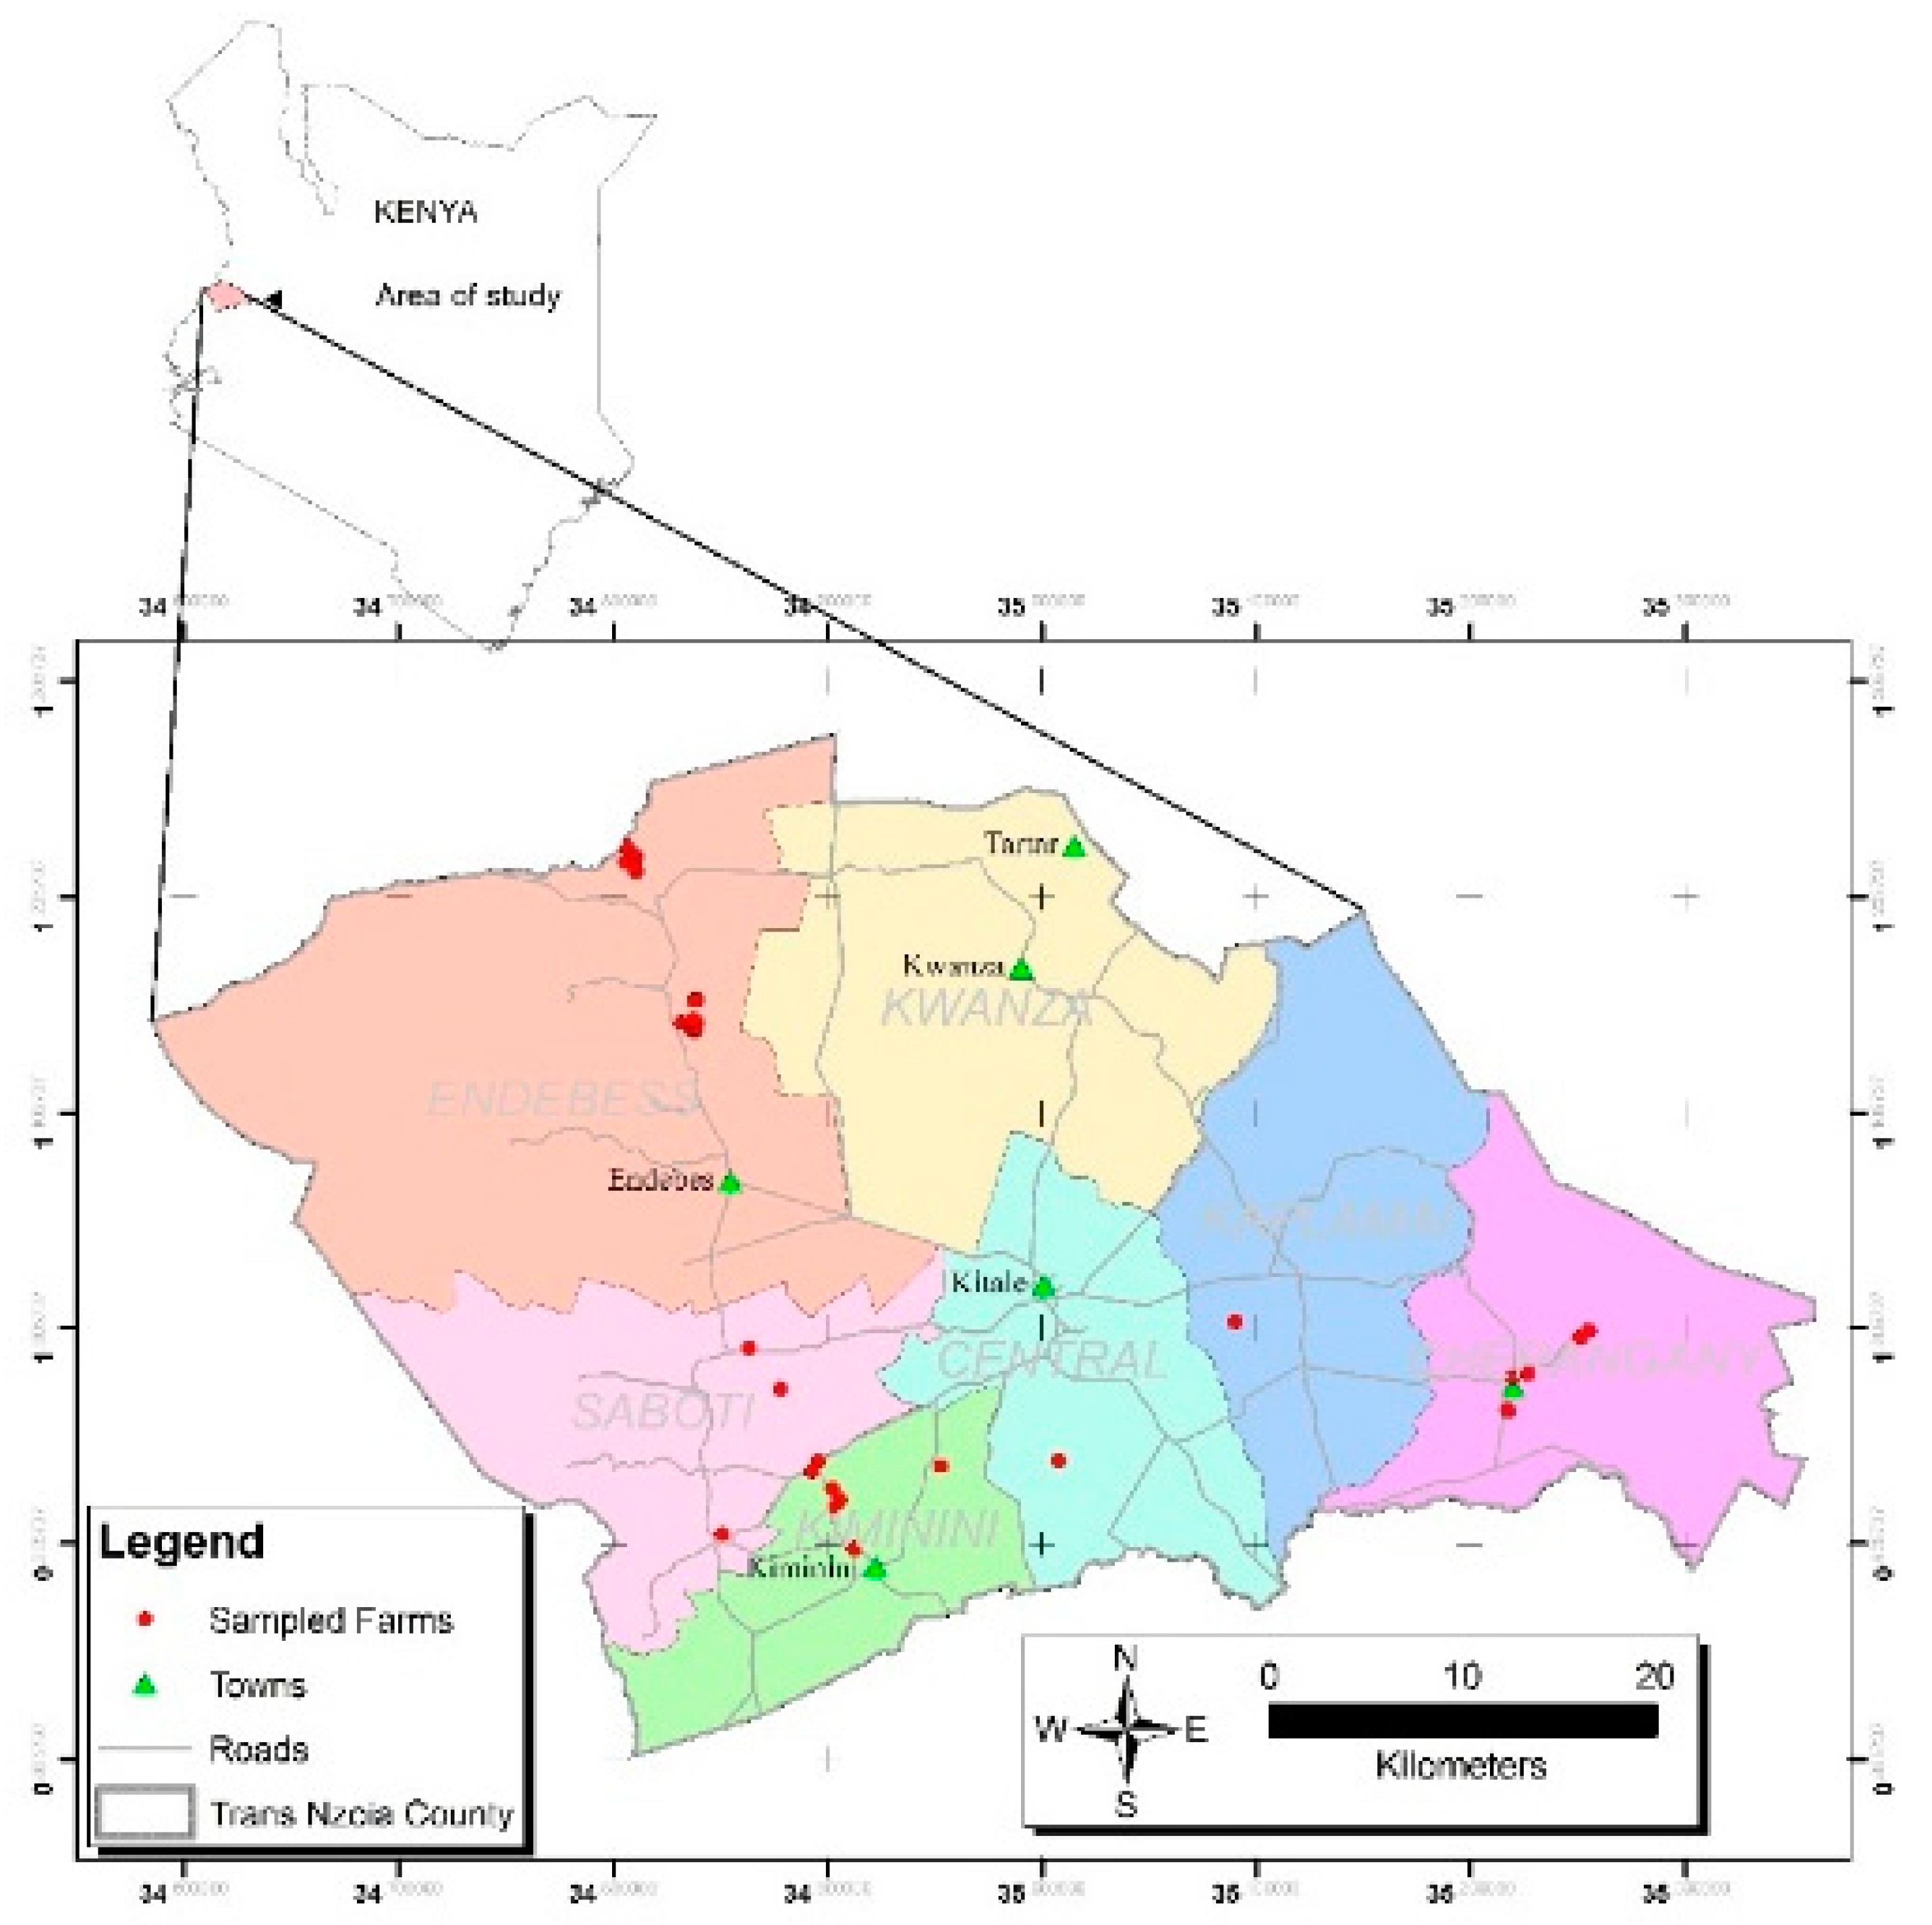
Figure 1. Map of the study area showing the sampled large-scale farms.
Preprints 114720 g001
Figure 2. Variation in mean PH and EC across cropping systems.
Preprints 114720 g002
Figure 3. Variation in total N across cropping systems.
Preprints 114720 g003
Figure 4. Variation in base cation concentrations across cropping systems.
Preprints 114720 g004
Figure 5. Variation in mean TOC across cropping systems.
Preprints 114720 g005
Figure 6. Variation in mean heavy concentrations along cropping systems.
Preprints 114720 g006
Figure 7. Variation in mean Fe concentrations along cropping systems.
Preprints 114720 g007
Table 1. Mean ±SD of the concentrations of the analyzed soil chemical parameters in various cropping systems.
Cropping systems
Parameters N Maize (MF) Orchard (OF) Sugarcane (SF) Coffee (CF) Pasture land (PL) Shrub land (CS)
PH 204 5.699±0.390 6.636±0.241 5.760±0.279 6.491±0.317 6.648±0.179 6.640±0.133
EC (µS cm-1) 204 17.467±6.610 42.766±15.210 10.533±7.401 30.645±18.170 9.700±4.864 10.187±7.600
Total N(MgL1) 204 0.415±0. 362 0.769±0.295 0.183±0.024 0.188±0. 087 0.730±0.268 0.174±0.189
Na+ (MgKg-1) 204 549.748±31.073 425.71±107.038 450.260±54.456 533.540±91.057 583.798±24.515 433.290±96.874
K+ (MgKg-1) 204 359.059±74.505 246.18±23.729 301.594±54.456 320.051±42.2458 271.069±15.411 234.941±82.533
Ca2+ (MgKg-1) 204 683.094±29.657 372.73±43.053 439.669±99.284 526.749±90.814 363.954±22.951 389.770±166.840
Mg2+ (MgKg-1) 204 353.145±22.778 255.39±44.621 371.607±67.731 401.313±84.577 367.795±367.795 259.621±47.814
Cu (MgKg-1) 204 33.985±1.731 20.152±5.0748 30.503±11.531 17.855±3.344 14.587±2.647 20.010±4.414
Pb (MgKg-1) 204 39.389±3.455 29.077±5.6342 36.634±8.528 31.544±7.604 24.532±3.902 30.105±7.298
Cr (MgKg-1) 204 11.251±0. 604 8.311±1.155 11.656±1.542 11.095±2.661 8.255±1.005 8.494±2.010
Cd (MgKg-1) 204 9.042±0.582 4.475±0.531 9.347±1.827 8.644±1.325 8.032±1.064 4.535±0.992
Zn (MgKg-1) 204 49.478±2.588 29.488±1.880 41.134±5.255 43.663±6.306 27.543±3.927 30.776±9.471
Fe (MgKg-1) 204 1583.833±77.953 1365.9±39.638 1474.104±77.142 1519.611±115.022 1201.513±70.629 1377.254±136.205
TOC (%) 204 5.089±0. 596 4.233±0.525 5.877±1.262 4.970±1.295 6.195±0.687 4.287±2.048
Table 2. Namerow’s Pollution Index/Row’s Pollution Index (NPI) at various cropping systems (NPI ≤1 less chances of pollution; 0.5≤NPI<1: Tending towards pollution; NPI ≥1: Surplus levels hence pollution).
Cropping system Metal
(Mg/Kg)
WHO permitted soil limit (Mg/Kg) Bn
(Mg/Kg)
Cn
(Mg/Kg)
NPI Pollution class interpretation
Maize Cu 36.000 20.010 33.985 0.944 Tending towards pollution
Pb 85.000 30.105 39.389 0.463 Less chances of pollution
Cr (III) 100.000 8.494 11.251 0.112 Less chances of pollution
Cd 0.800 4.535 9.042 11.303 Surplus levels hence pollution
Zn 50.000 30.776 49.478 0.990 Tending towards pollution
Fe 5000.000 1377.254 1583.833 0.317 Less chances of pollution
Orchard Cu 36.000 20.010 20.152 0.560 Tending towards pollution
Pb 85.000 30.105 29.077 0.342 Less chances of pollution
Cr (III) 100.000 8.494 8.311 0.083 Less chances of pollution
Cd 0.800 4.535 4.475 5.594 Surplus levels hence pollution
Zn 50.000 30.776 29.488 0.590 Tending towards pollution
Fe 5000.000 1377.254 1365.9 0.273 Less chances of pollution
Sugar cane Cu 36.000 20.01 30.503 0.847 Tending towards pollution
Pb 85.000 30.105 36.634 0.431 Less chances of pollution
Cr (III) 100.000 8.494 11.656 0.117 Less chances of pollution
Cd 0.800 4.535 9.347 11.684 Surplus levels hence pollution
Zn 50.000 30.776 41.134 0.823 Tending towards pollution
Fe 5000.000 1377.254 1474.104 0.295 Tending towards pollution
Coffee Cu 36.000 20.01 17.855 0.496 Less chances of pollution
Pb 85.000 30.105 31.544 0.371 Less chances of pollution
Cr (III) 100.000 8.494 11.095 0.111 Less chances of pollution
Cd 0.800 4.535 8.644 10.805 Surplus levels hence pollution
Zn 50.000 30.776 43.663 0.873 Tending towards pollution
Fe 5000.000 1377.254 1519.611 0.304 Less chances of pollution
Pastureland Cu 36.000 20.01 14.587 0.405 Less chances of pollution
Pb 85.000 30.105 24.532 0.289 Less chances of pollution
Cr (III) 100.000 8.494 8.255 0.083 Less chances of pollution
Cd 0.800 4.535 8.032 10.04 Surplus levels hence pollution
Zn 50.000 30.776 27.543 0.551 Tending towards pollution
Fe 5000.000 1377.254 1201.513 0.240 Less chances of pollution
Shrubland Cu 36.000 20.01 20.010 0.556 Tending towards pollution
Pb 85.000 30.105 30.105 0.354 Less chances of pollution
Cr (III) 100.000 8.494 8.494 0.085 Less chances of pollution
Cd 0.800 4.535 4.535 5.669 Surplus levels hence pollution
Zn 50.000 30.776 30.776 0.616 Tending towards pollution
Fe 5000.000 1377.254 1377.254 0.275 Less chances of pollution
Disclaimer/Publisher’s Note: The statements, opinions and data contained in all publications are solely those of the individual author(s) and contributor(s) and not of MDPI and/or the editor(s). MDPI and/or the editor(s) disclaim responsibility for any injury to people or property resulting from any ideas, methods, instructions or products referred to in the content.
Copyright: This open access article is published under a Creative Commons CC BY 4.0 license, which permit the free download, distribution, and reuse, provided that the author and preprint are cited in any reuse.
Prerpints.org logo

Preprints.org is a free preprint server supported by MDPI in Basel, Switzerland.

Subscribe

© 2024 MDPI (Basel, Switzerland) unless otherwise stated