Submitted:
09 August 2024
Posted:
10 August 2024
You are already at the latest version
Abstract
Keywords:
1. Introduction
2. Materials and Methods
2.1. Blends Characterization
2.2. Theoretical Combustion Process
2.3. Turbo Engine Testing Methodology
2.4. Gaseous Emissions Measurements
3. Results and Discussion
3.1. Experimental Results for the Physical-Chemical Properties of Fuel Blends
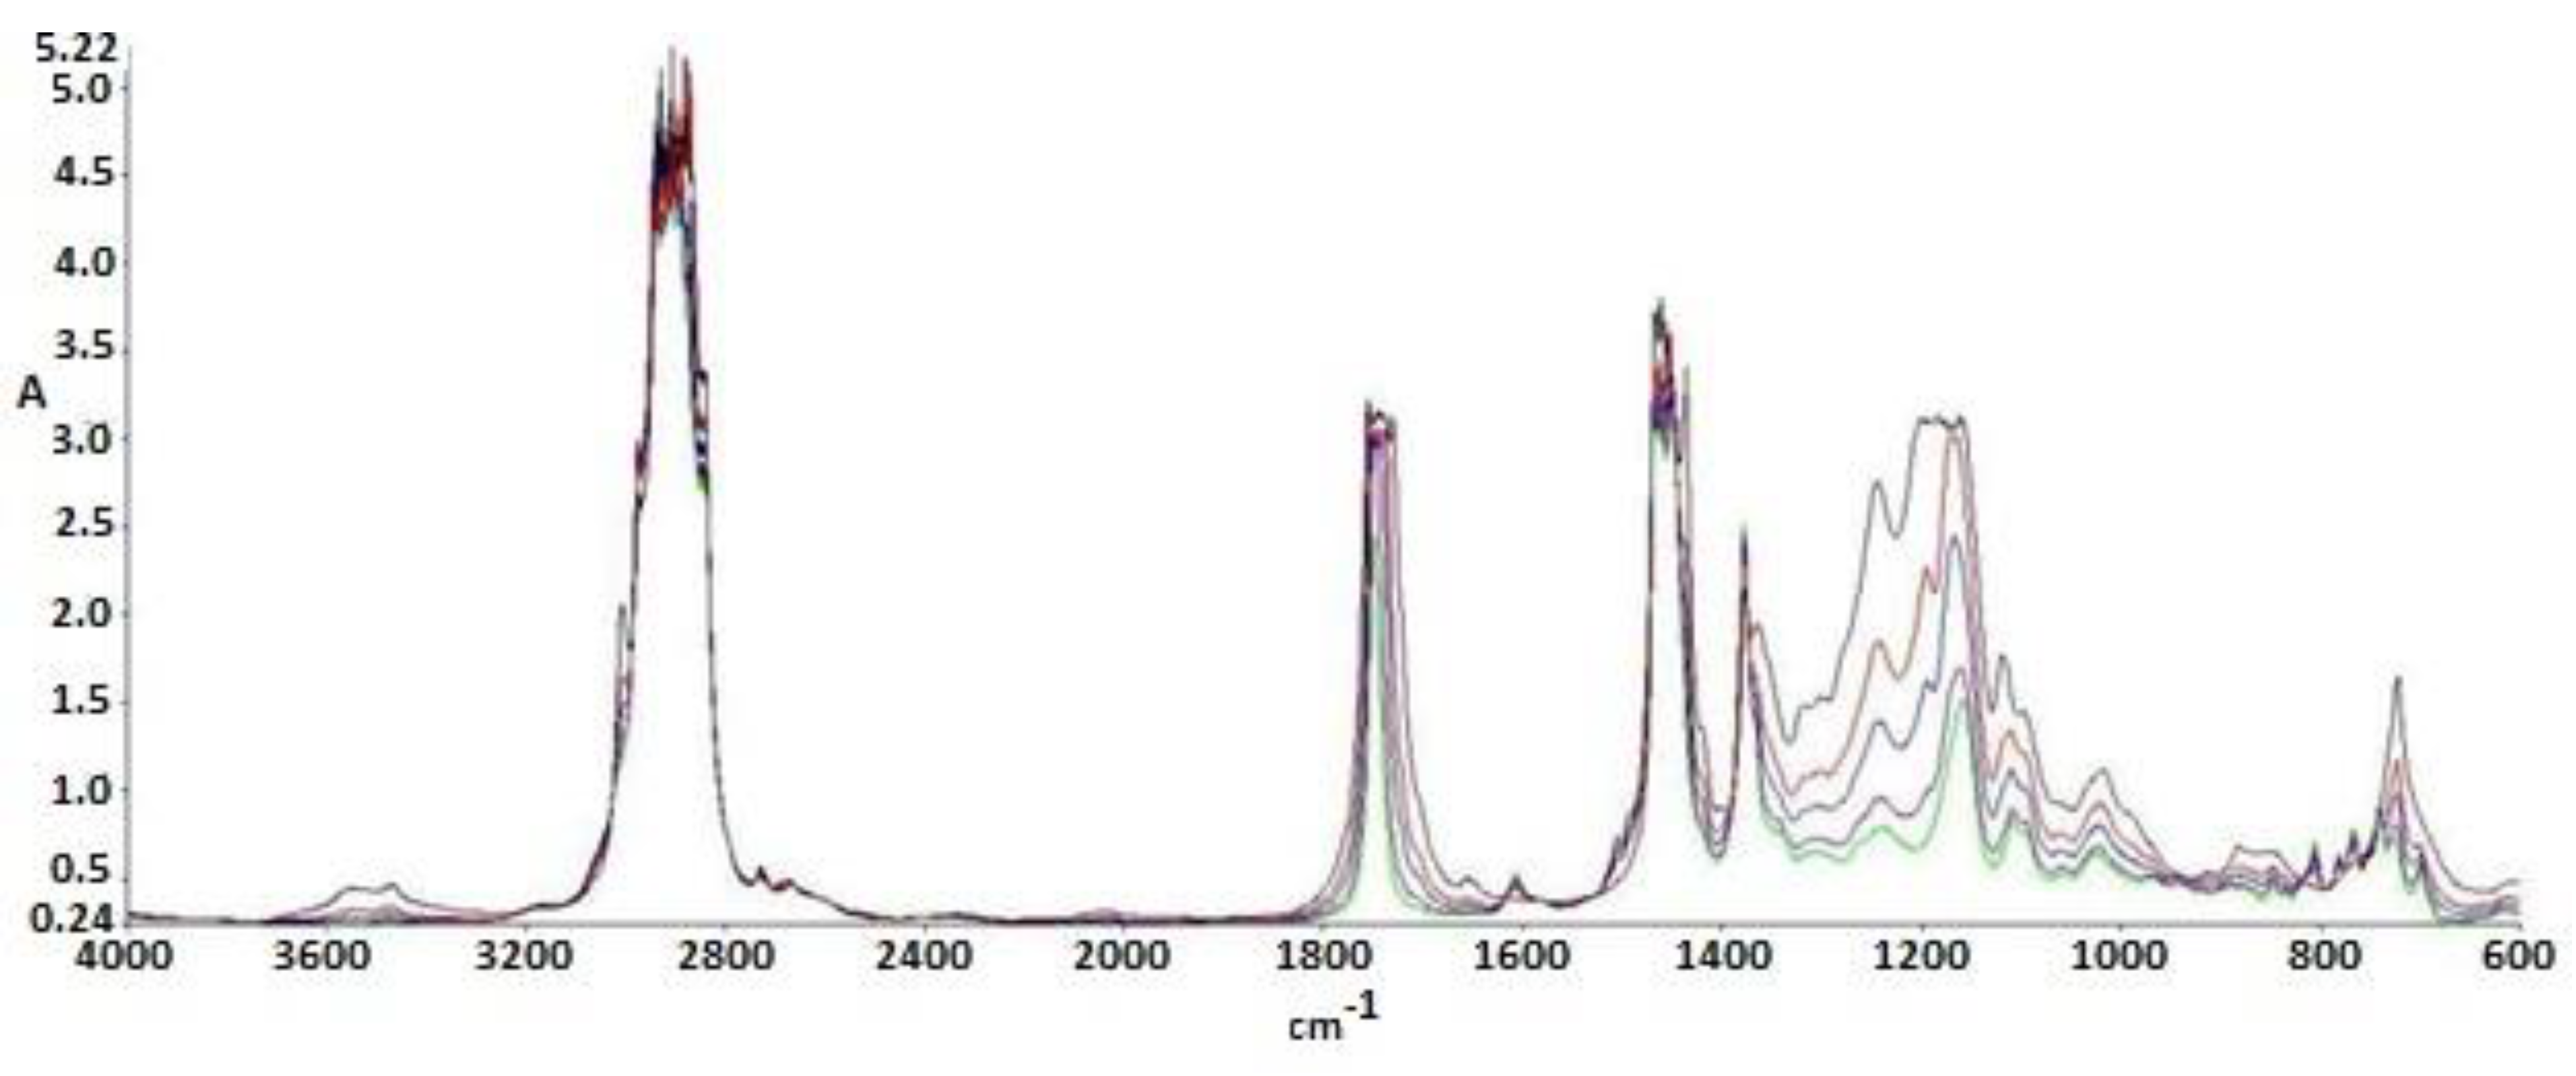
- The main differences between the spectra of conventional aviation fuel (Ke) and the blends are observed at 3200-3600 cm-1 in Figure 3, indicating the introduction of the hydroxyl group (-O-H) into the molecular structure.
- Higher alcohol concentrations result in larger peaks in the mentioned spectra.
- At 1750 cm-1, the presence of oxygen bonded to a carbon atom (C-O) is highlighted.
- Methylene groups (-CH2) at 1450 cm-1 show a slight decrease compared to the Ke spectrum.
- Radiation absorbed at 1350 cm-1 shows an increase in methyl groups (–CH3).
- At 1000 cm-1, the C-OH bond is highlighted, which increases with alcohol concentration, similar to the –OH group.
- The intensities of these features were observed to increase with alcohol concentration in each of the analyzed spectra. [32]
3.2. Combustion Reaction Analysis
3.3. Microturbojet Engine Test Stand Experiments
3.4. MicroturboJet Engine Performance Analysis
4. Conclusions
- The experimental evaluations conducted on the Jet CAT P80® micro-turbo engine demonstrate that the inclusion of n-butanol in conventional fuel does not compromise the functionality of the turbo engines.
- The calorific power of the fuel blends experiences a decrease with increasing n-butanol concentration, resulting in a corresponding rise in specific fuel consumption. The lower percentage of carbon in n-butanol, used for blending with Ke (kerosene), contributes to reduced CO2 emissions upon combustion.
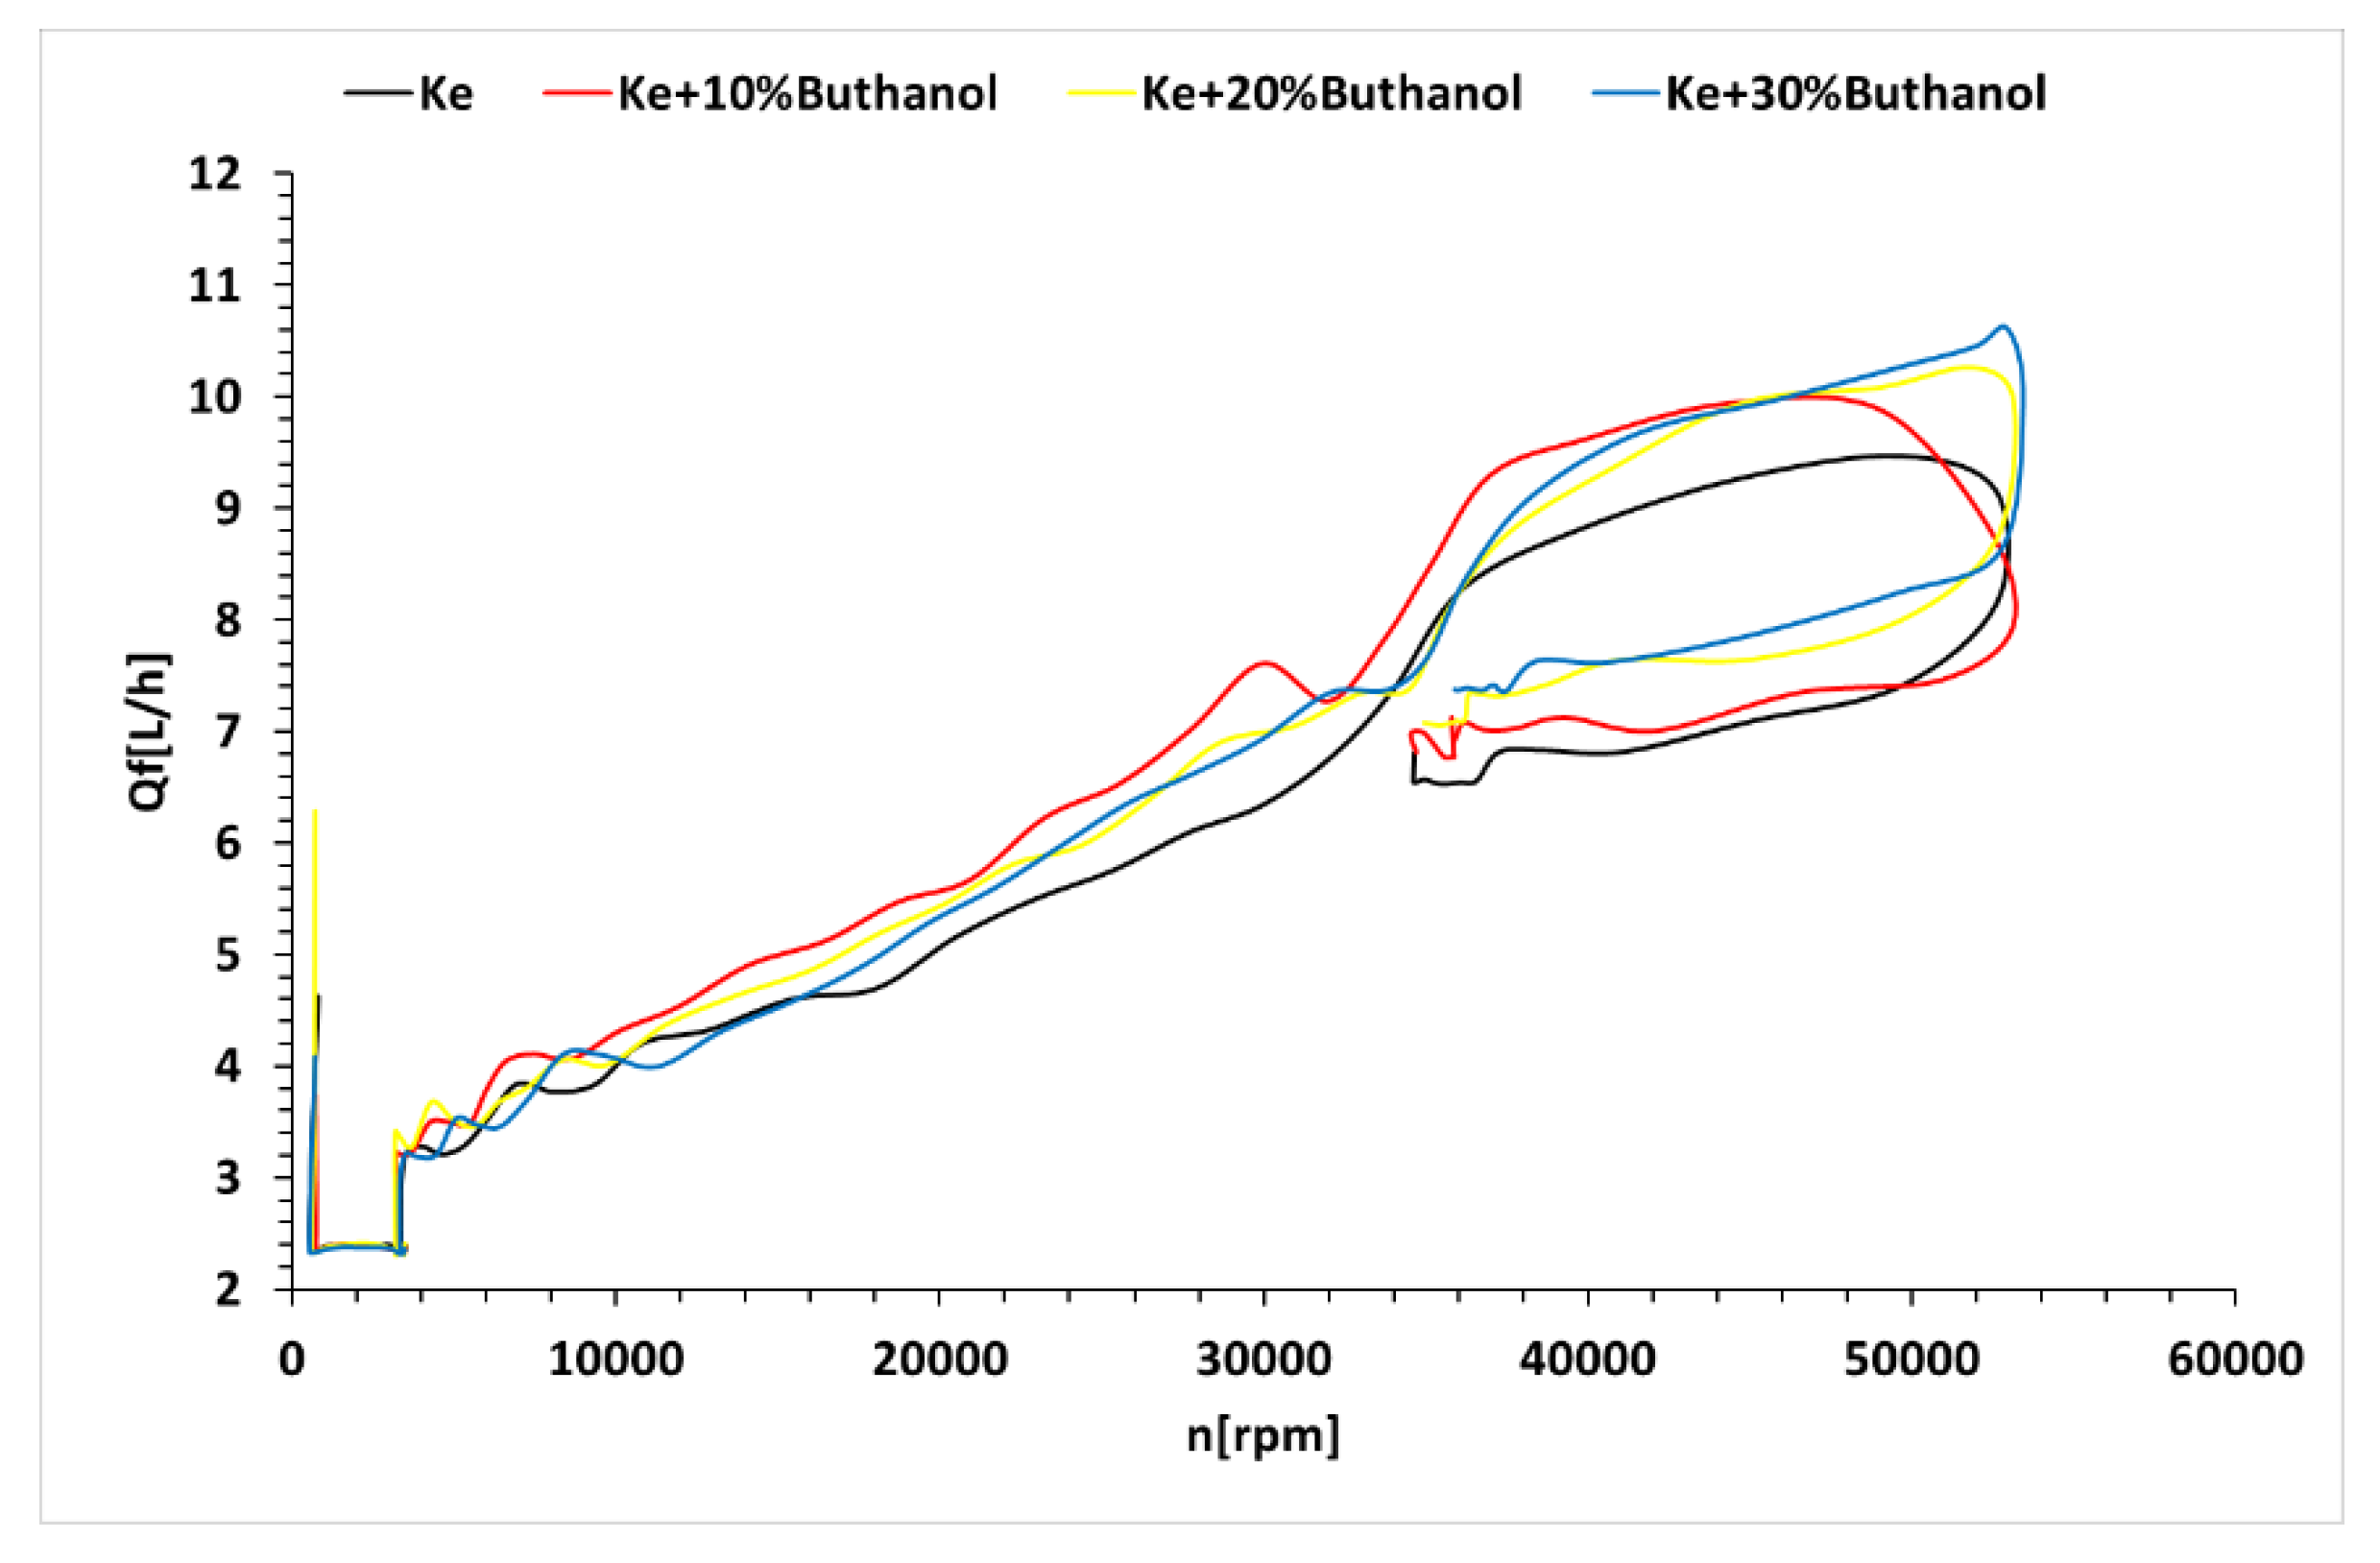
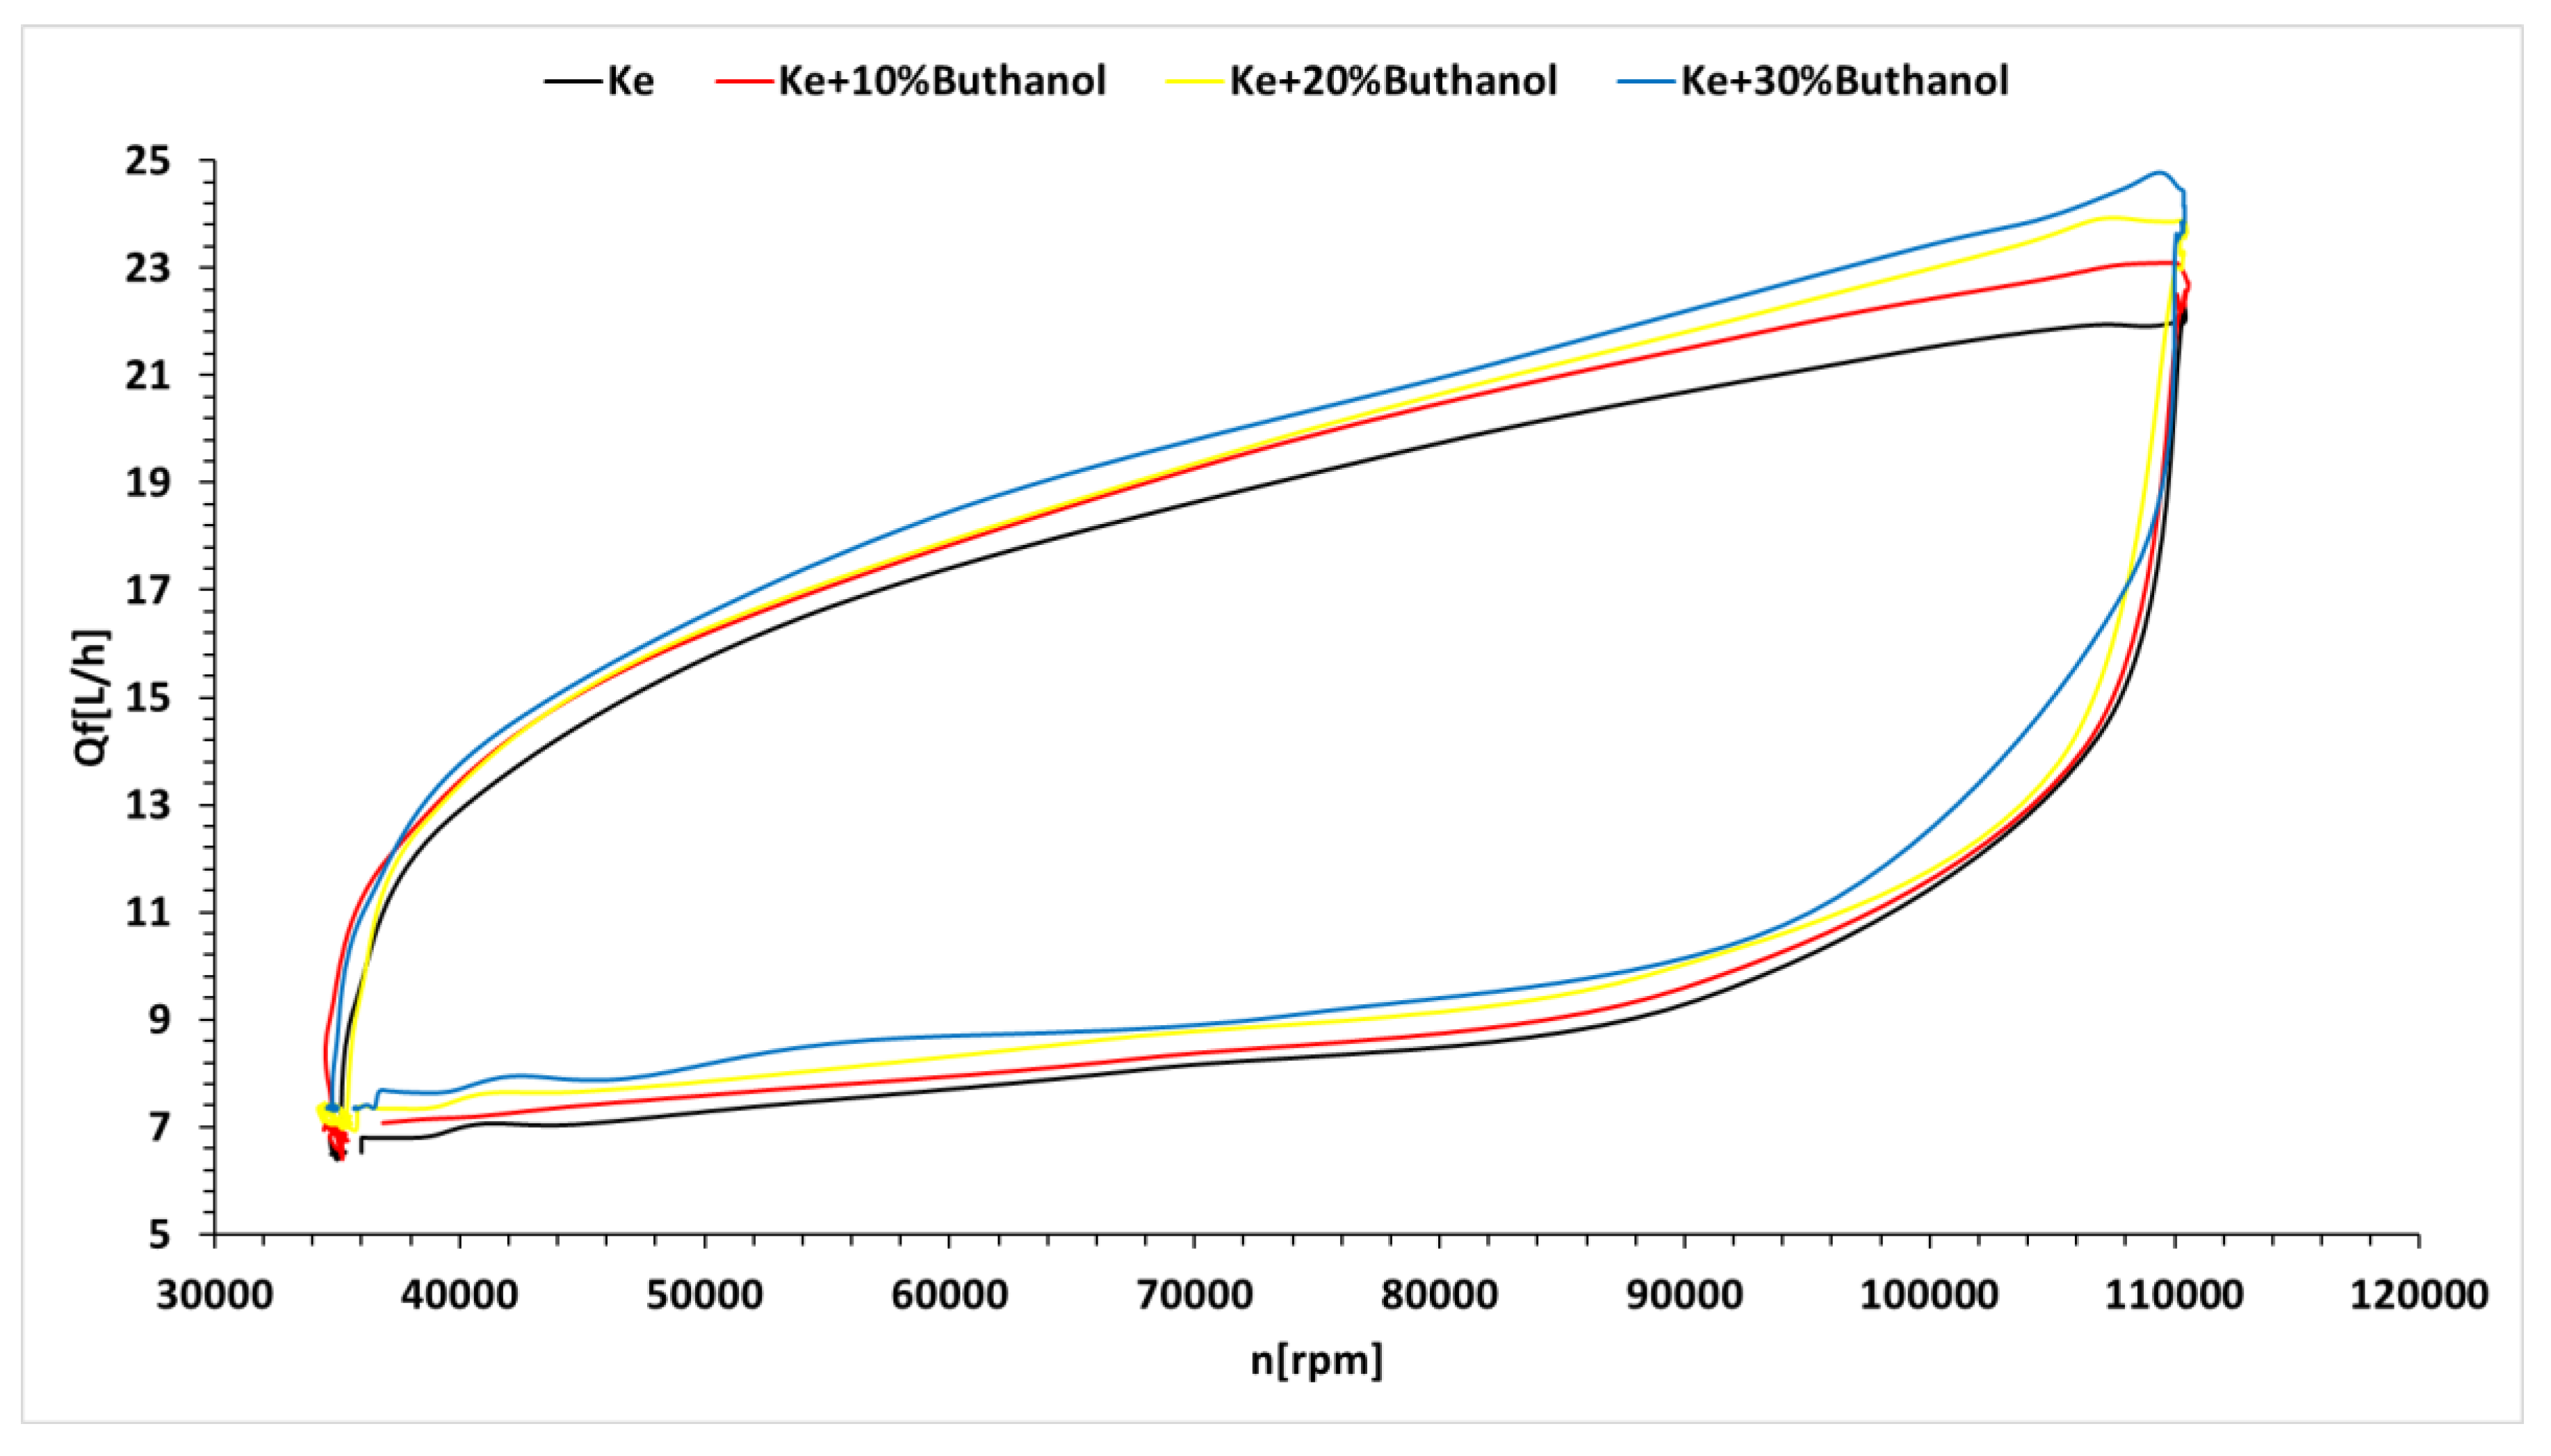
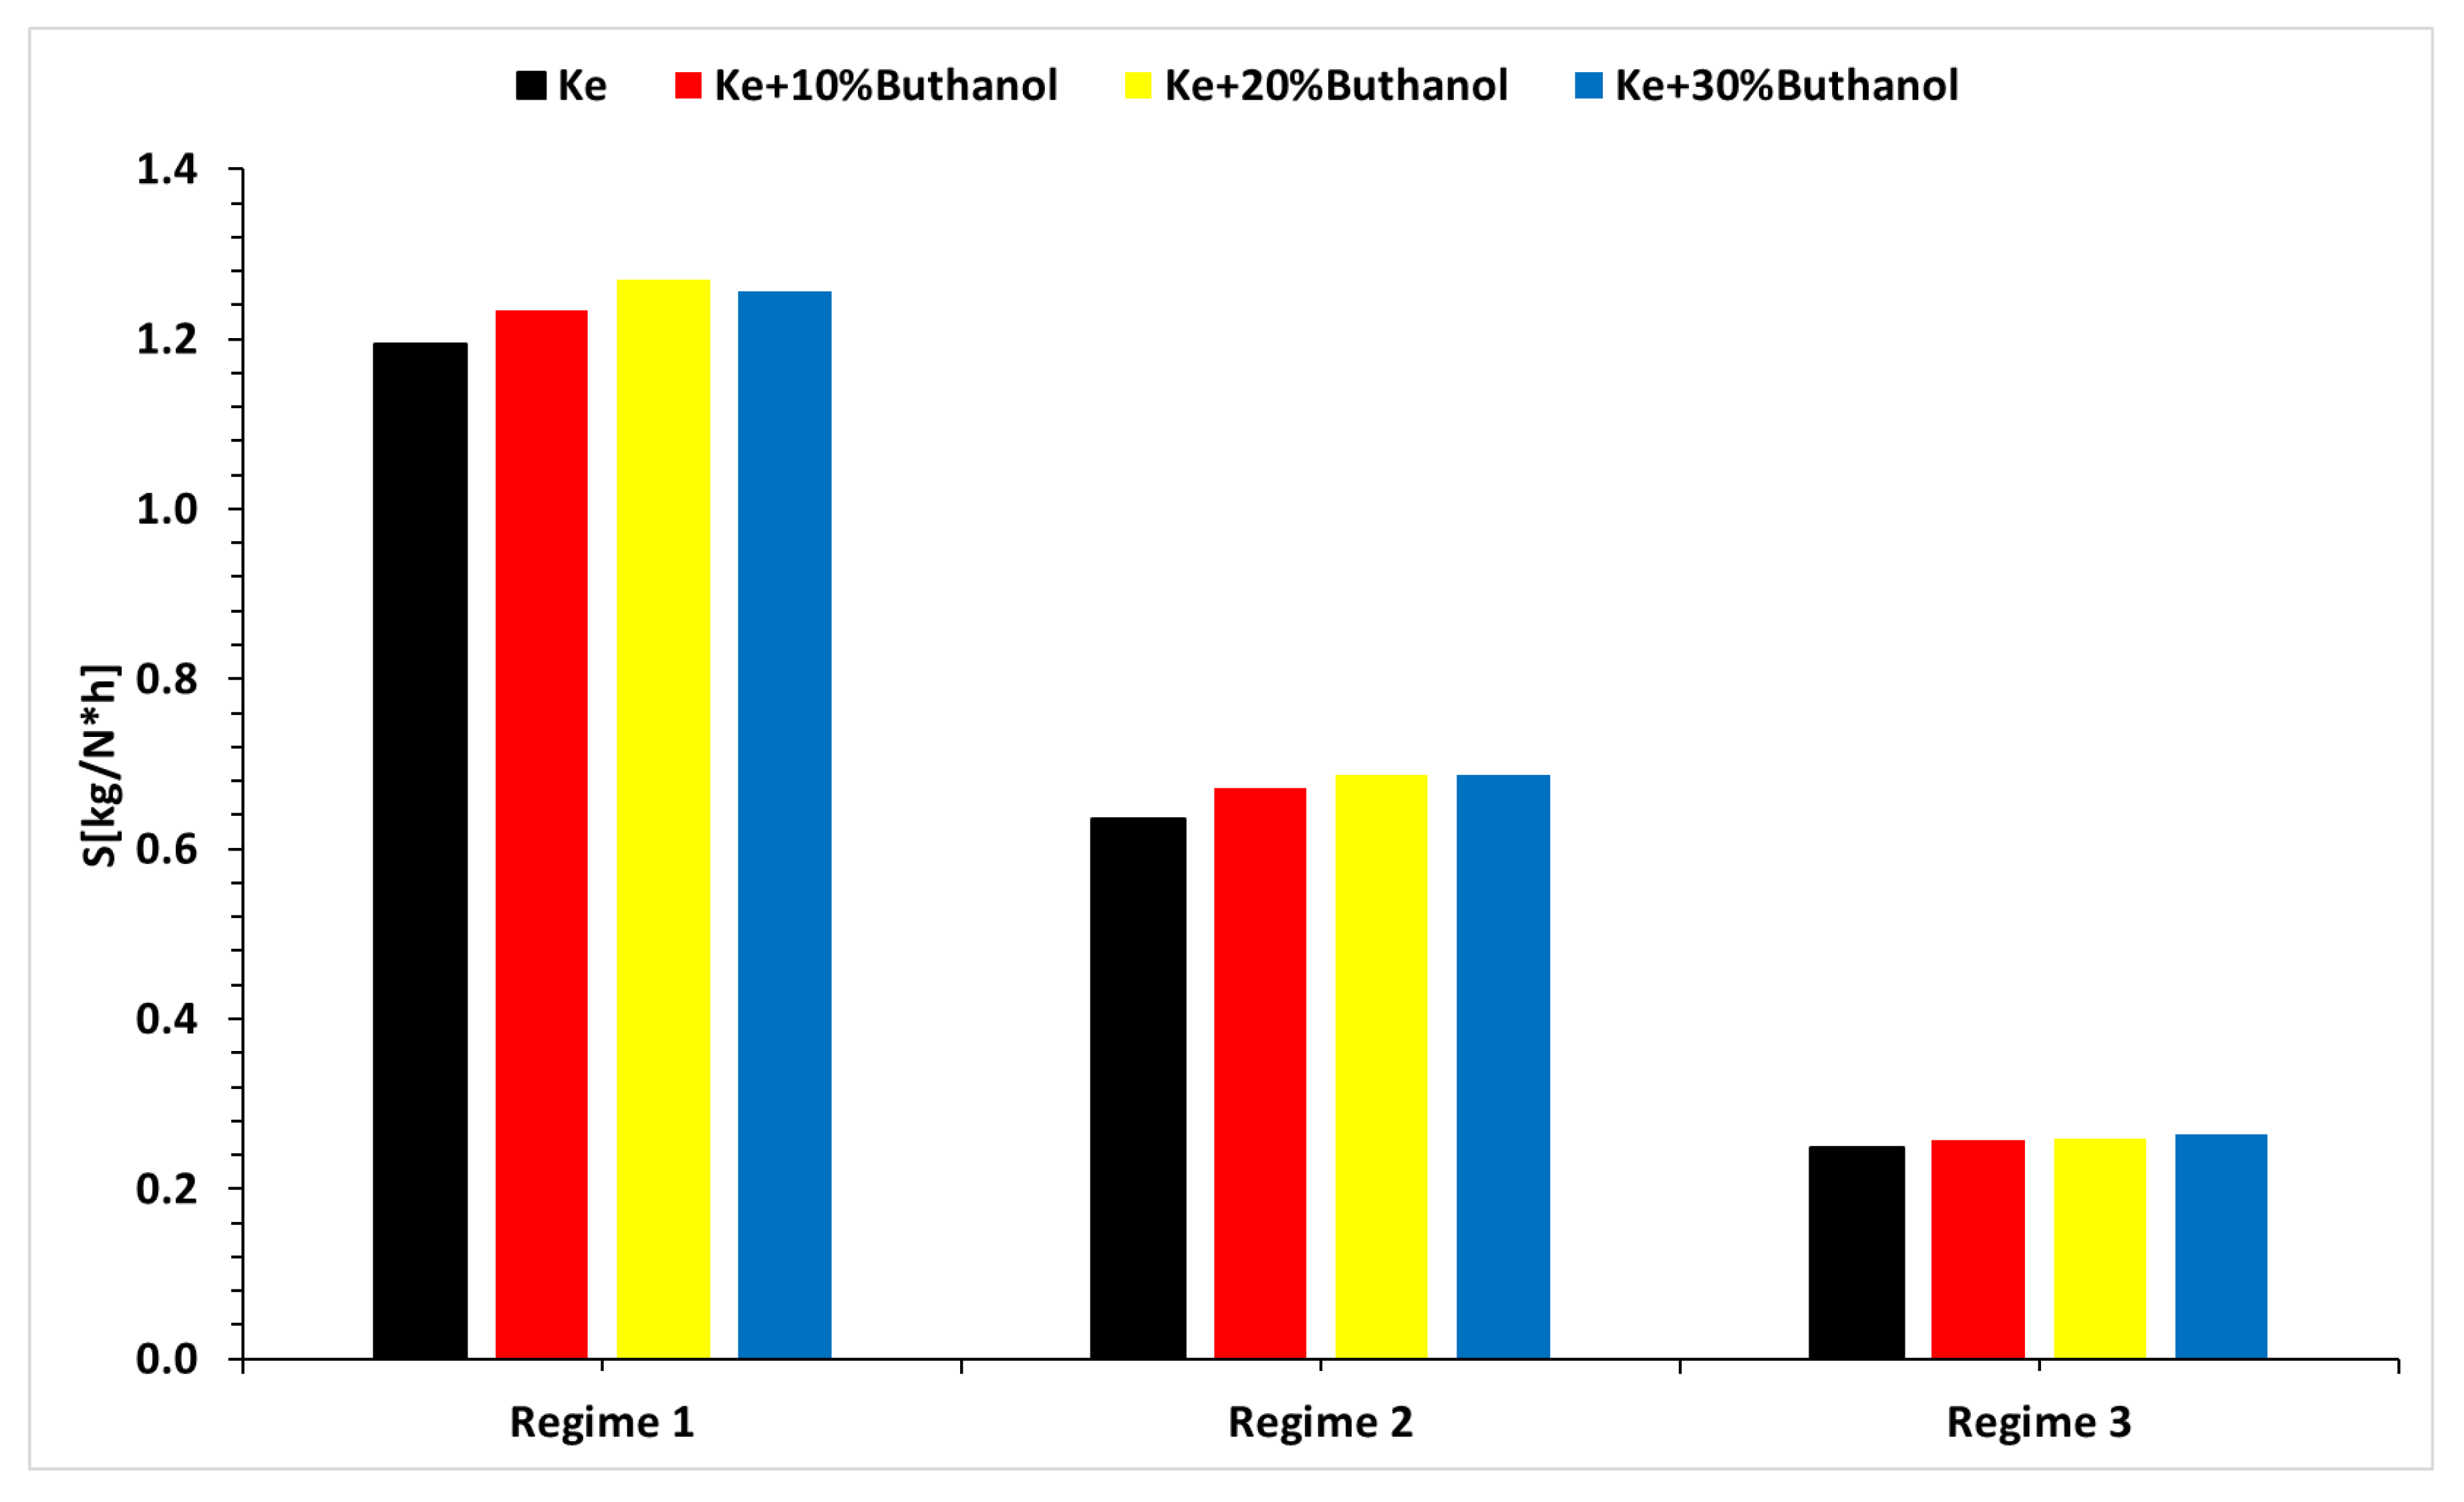
- Regarding engine performance, there is a proportional increase in specific fuel consumption with higher n-butanol percentages in the tested blends, a trend attributed to their respective calorific powers.
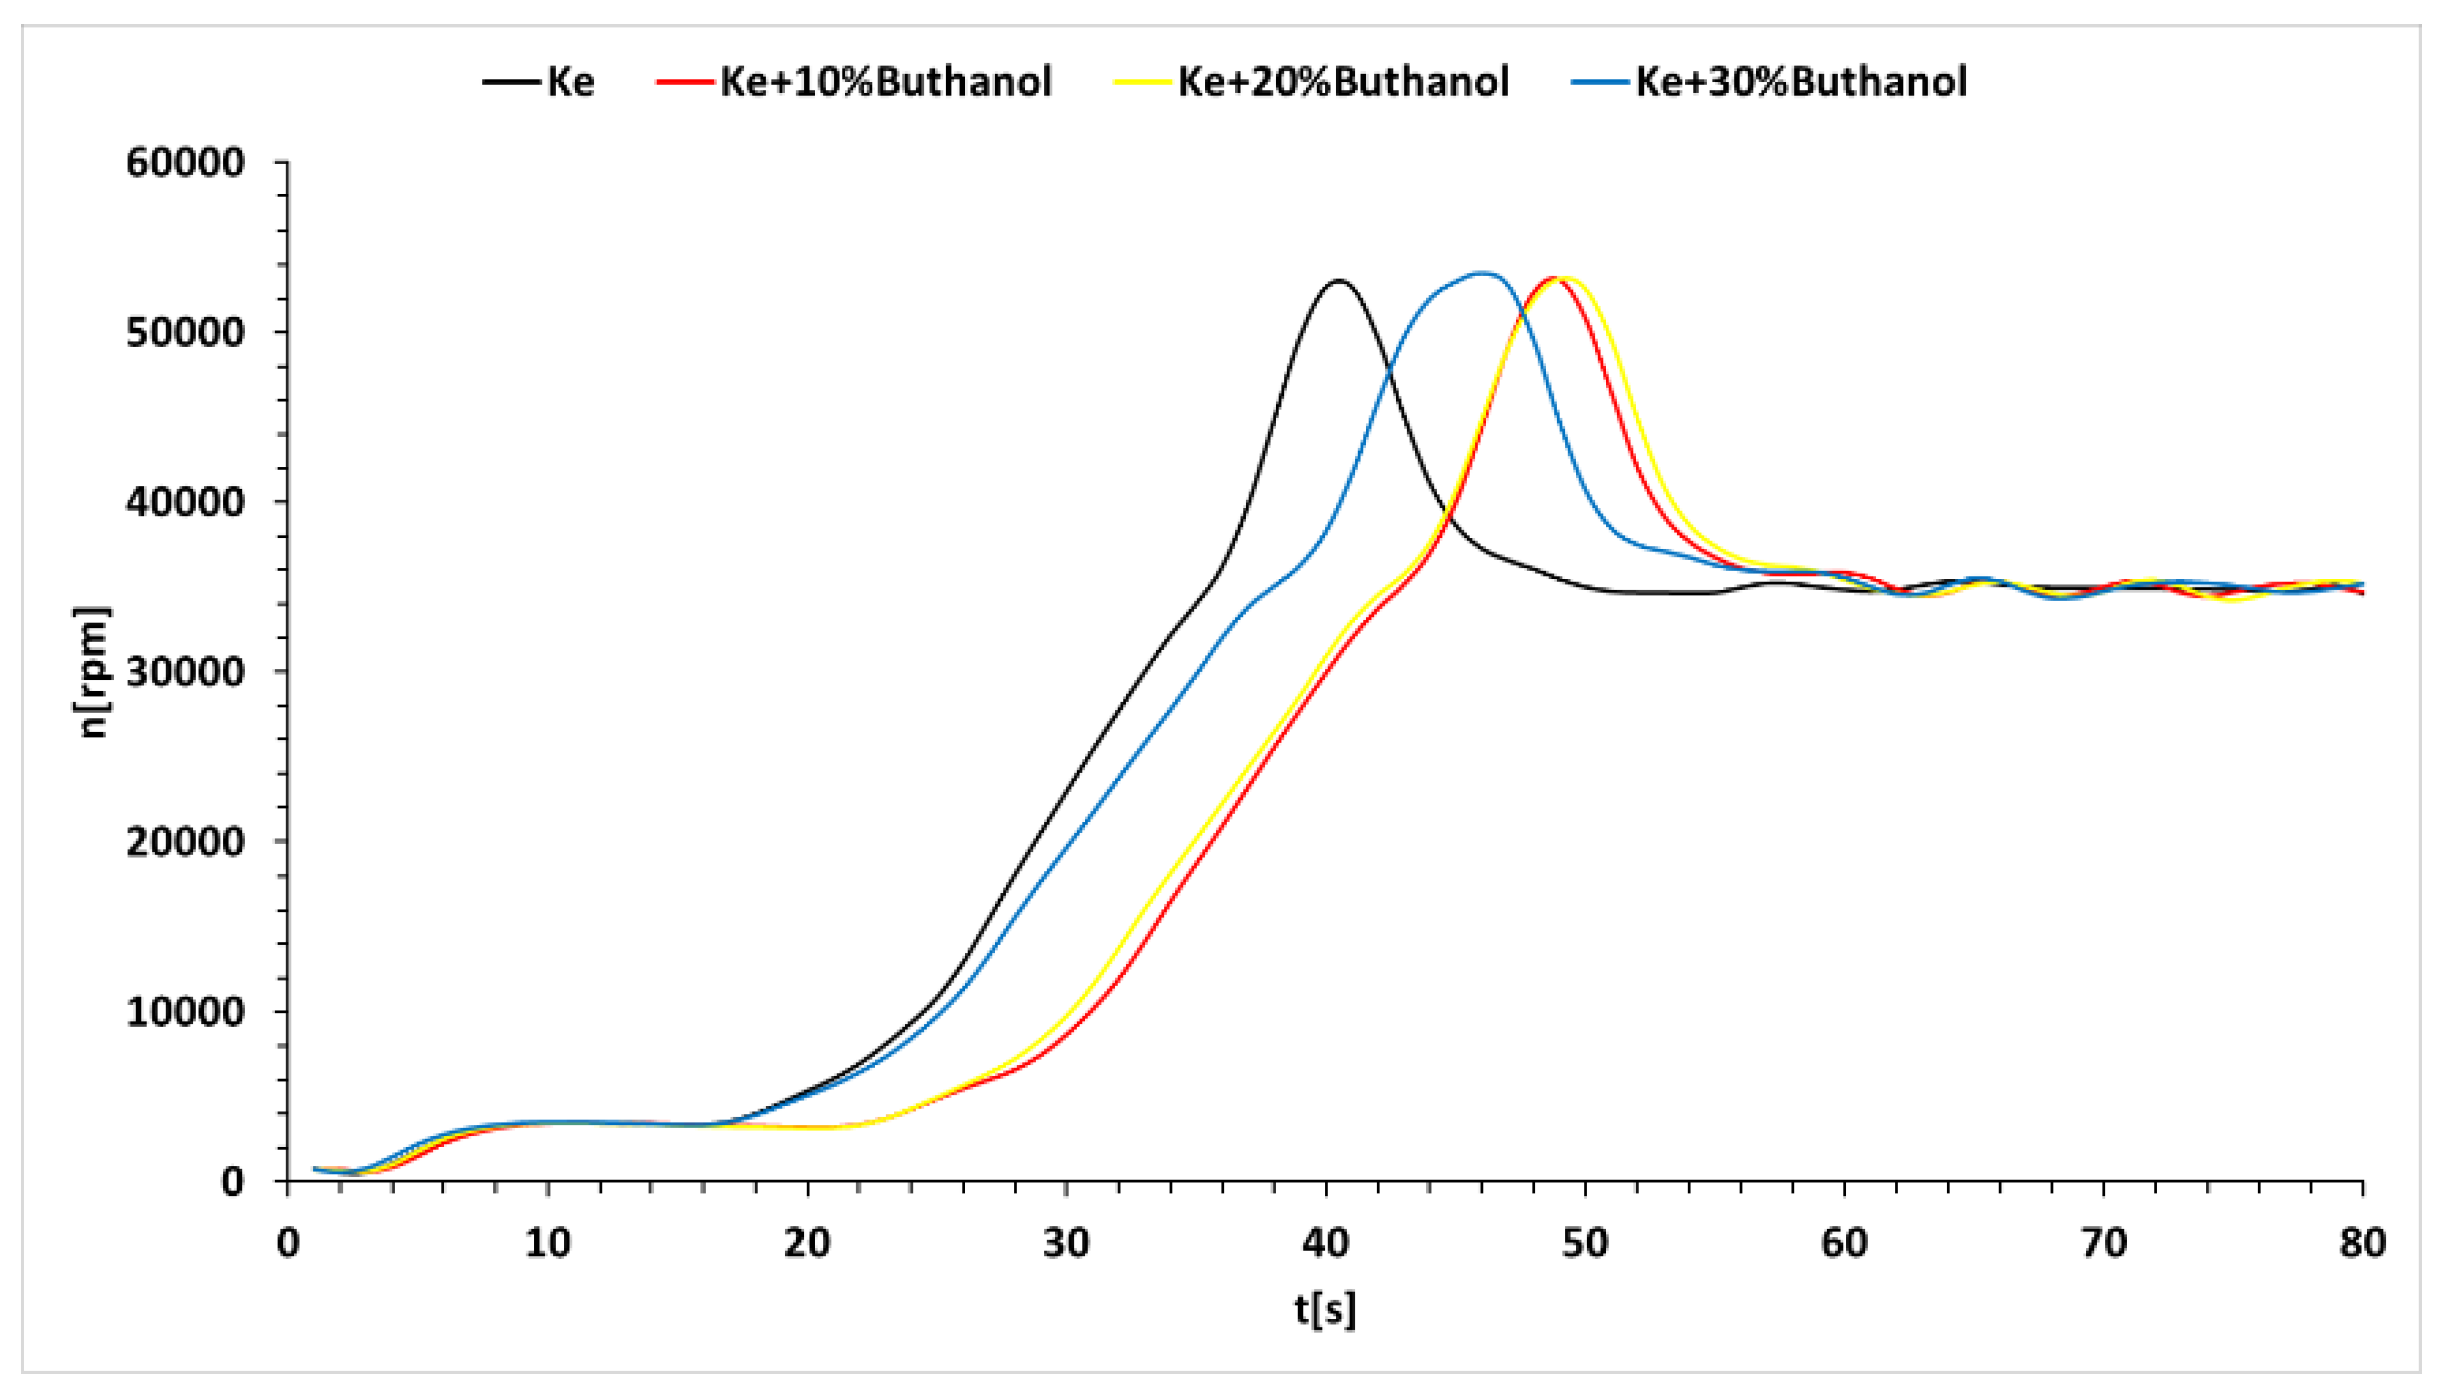
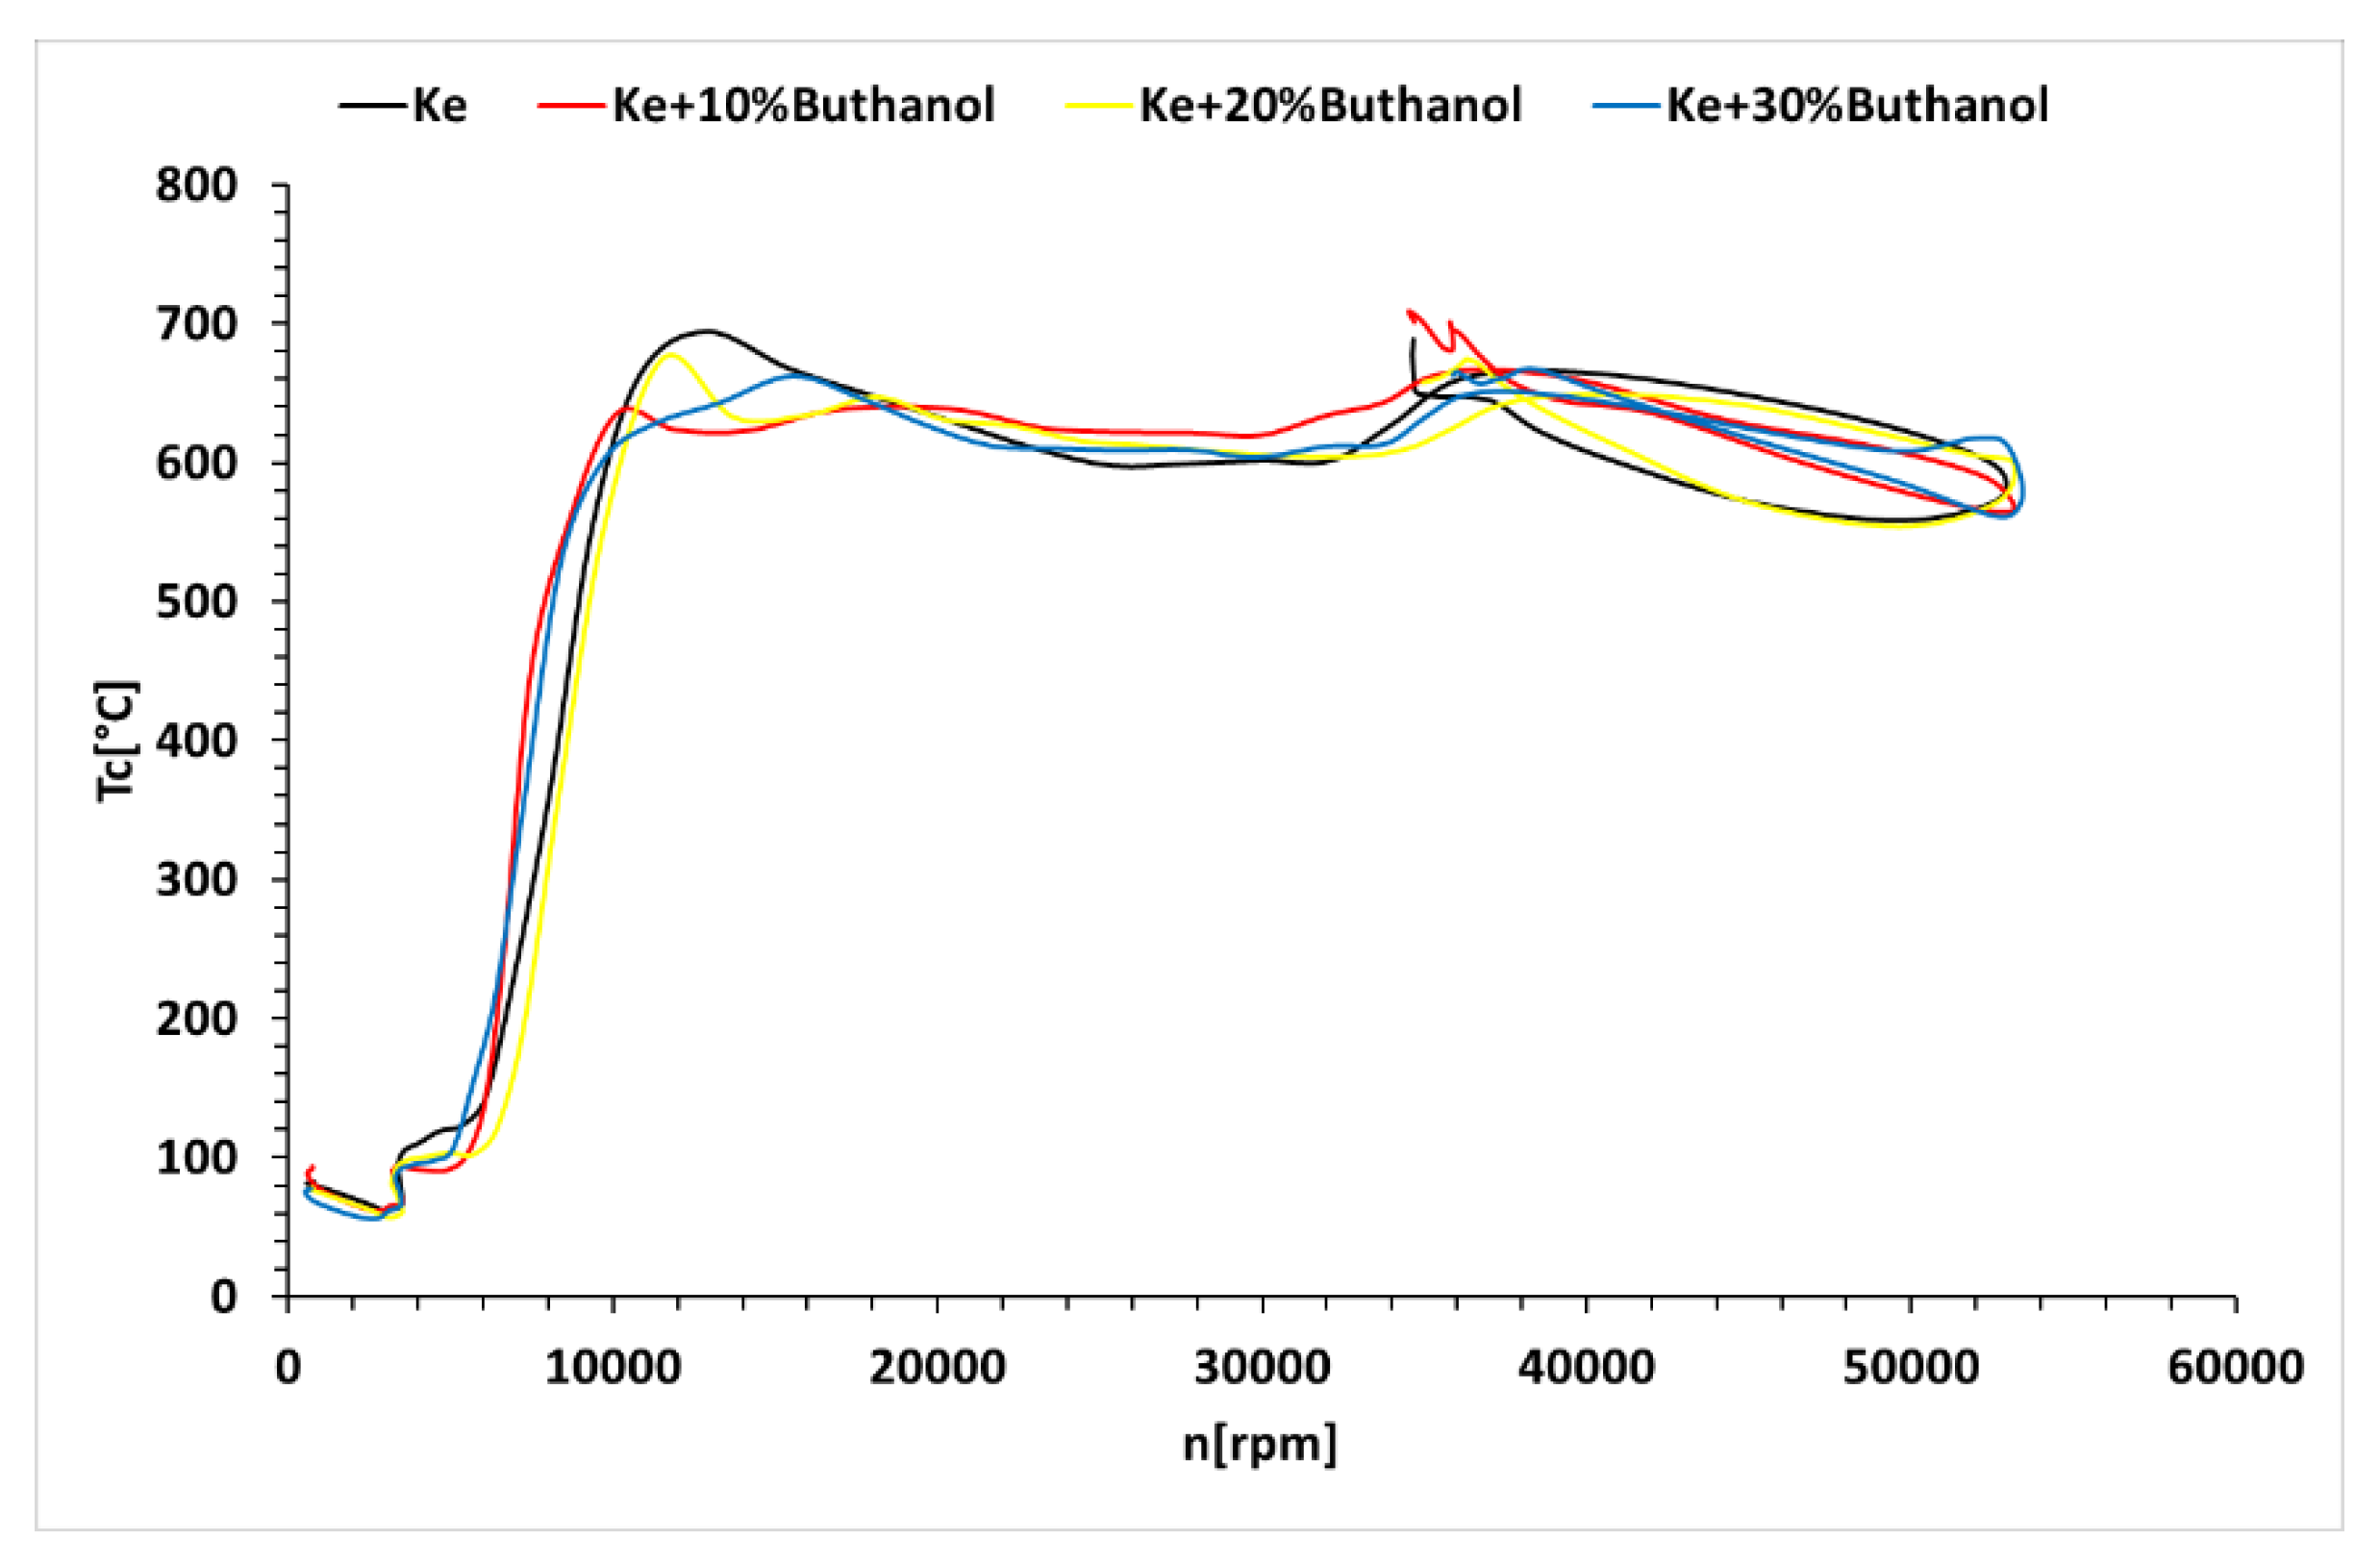
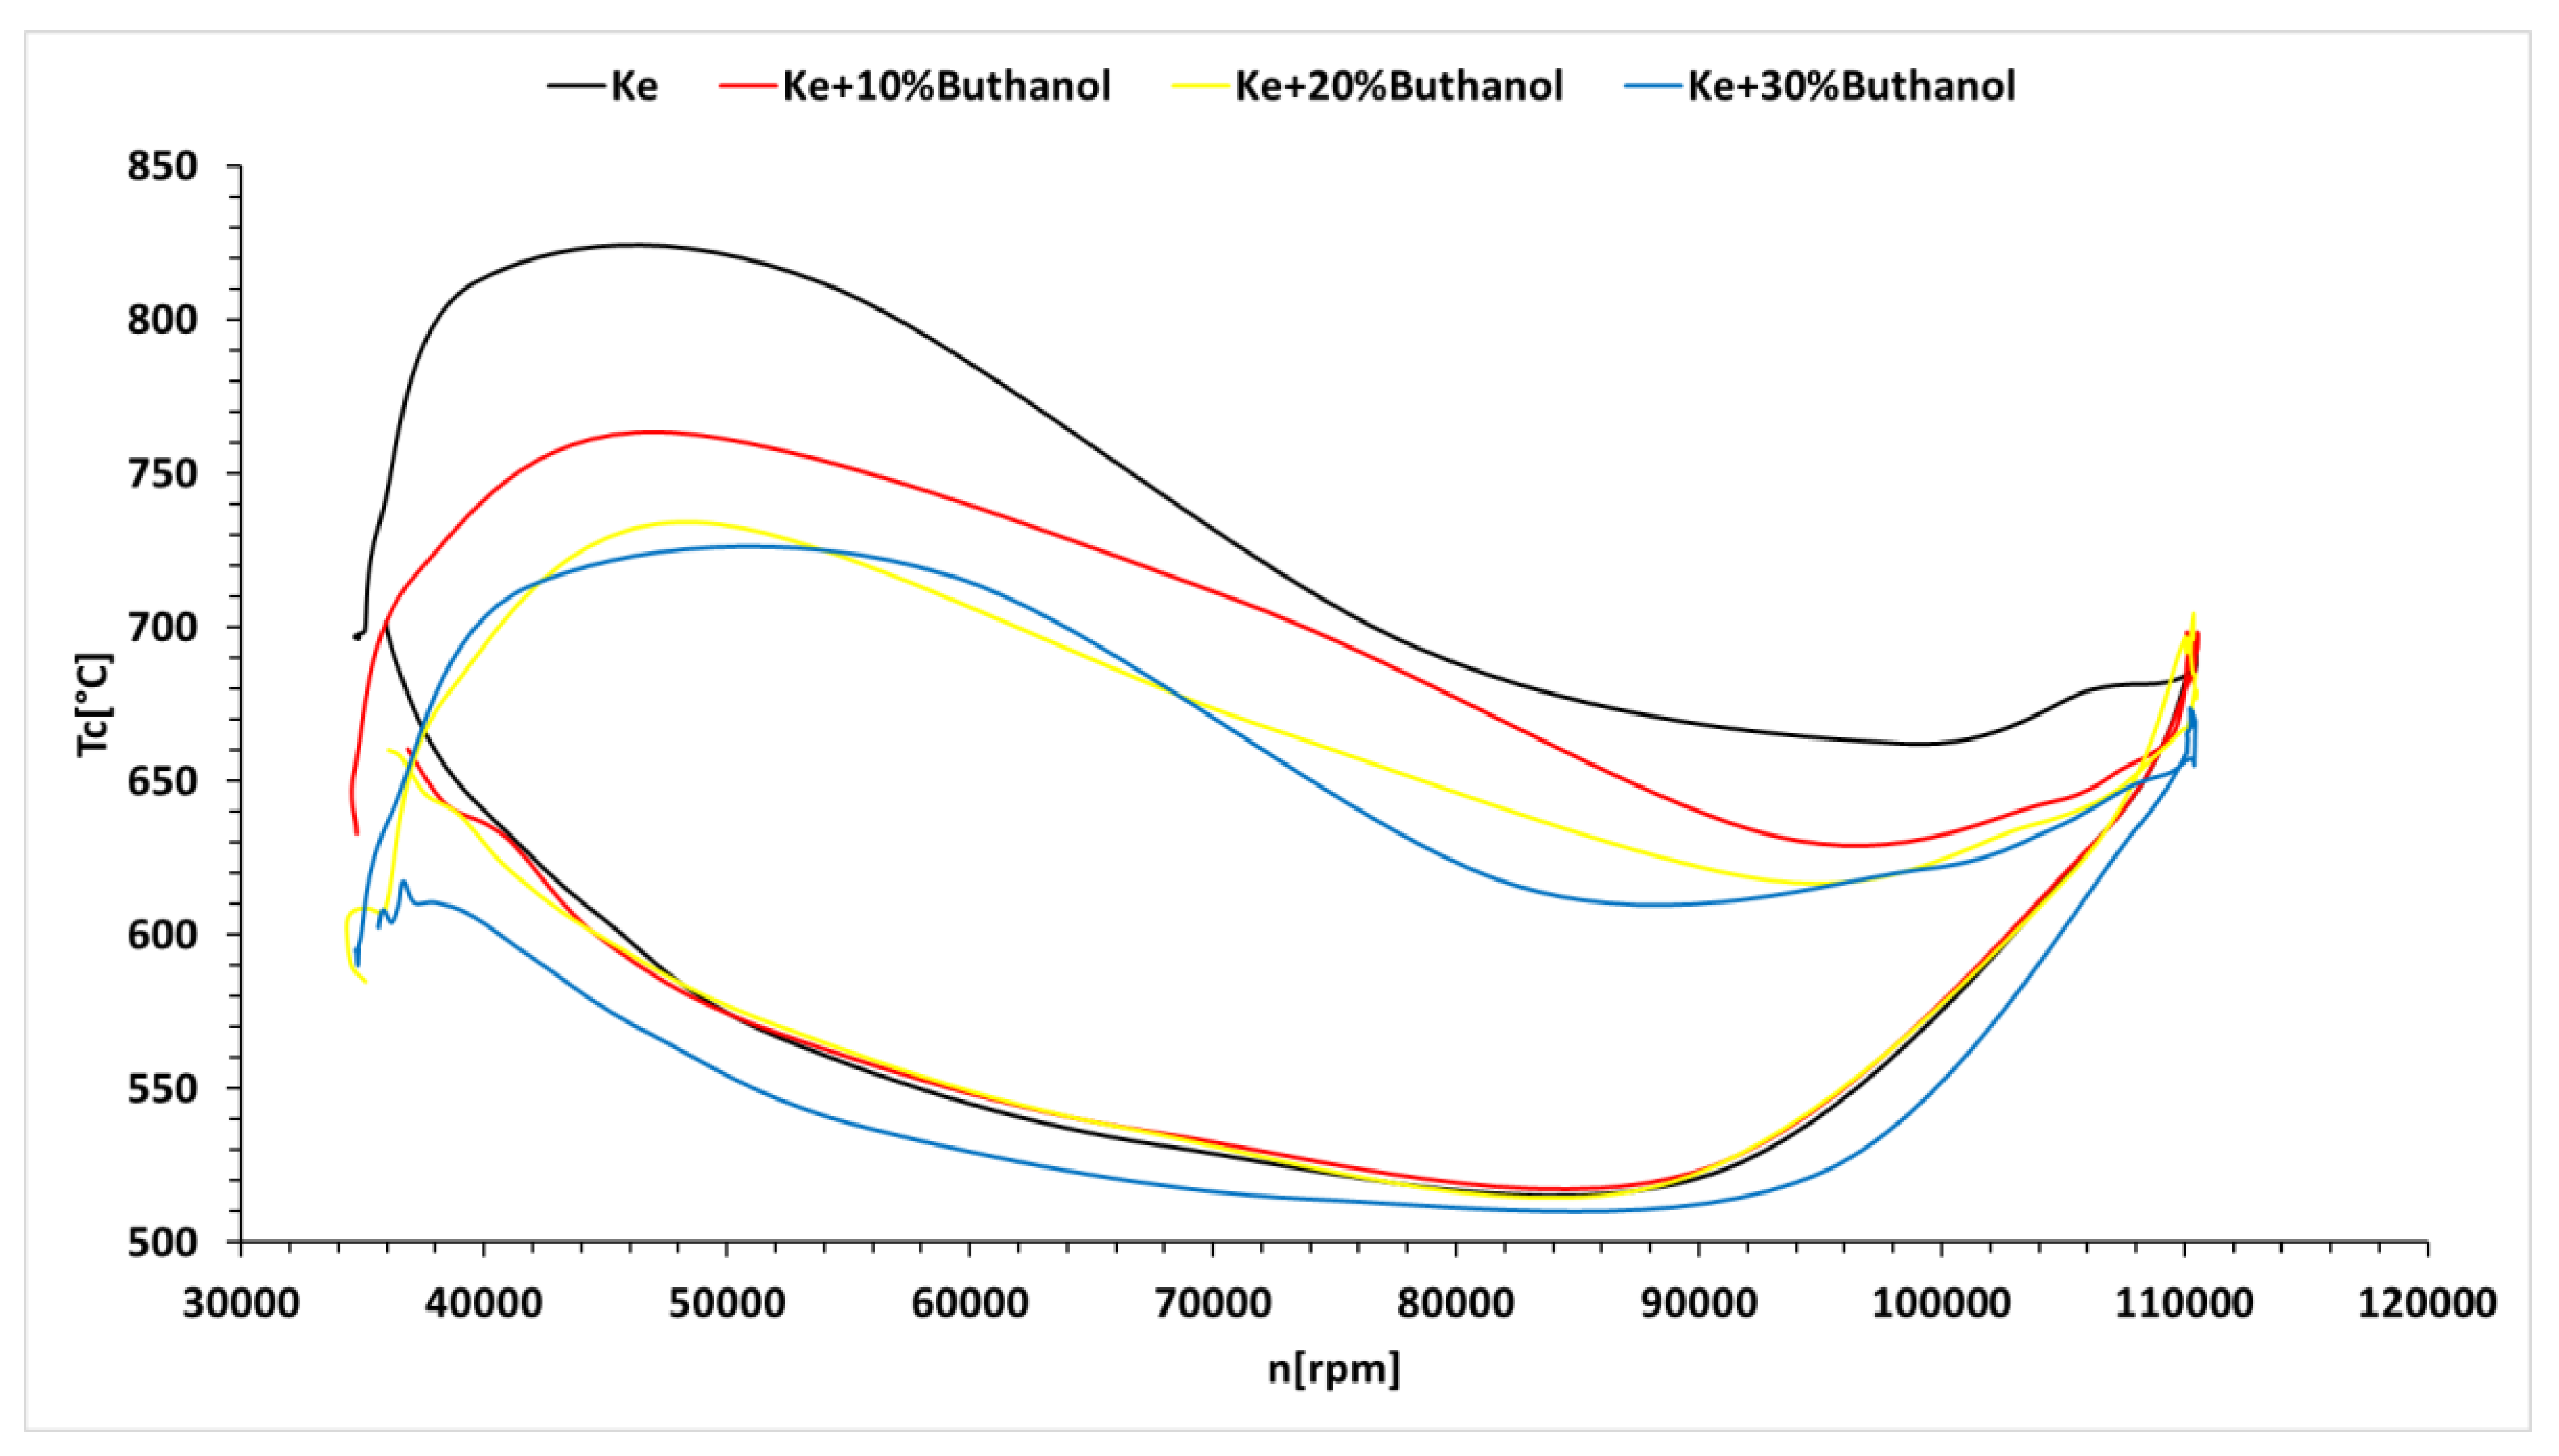
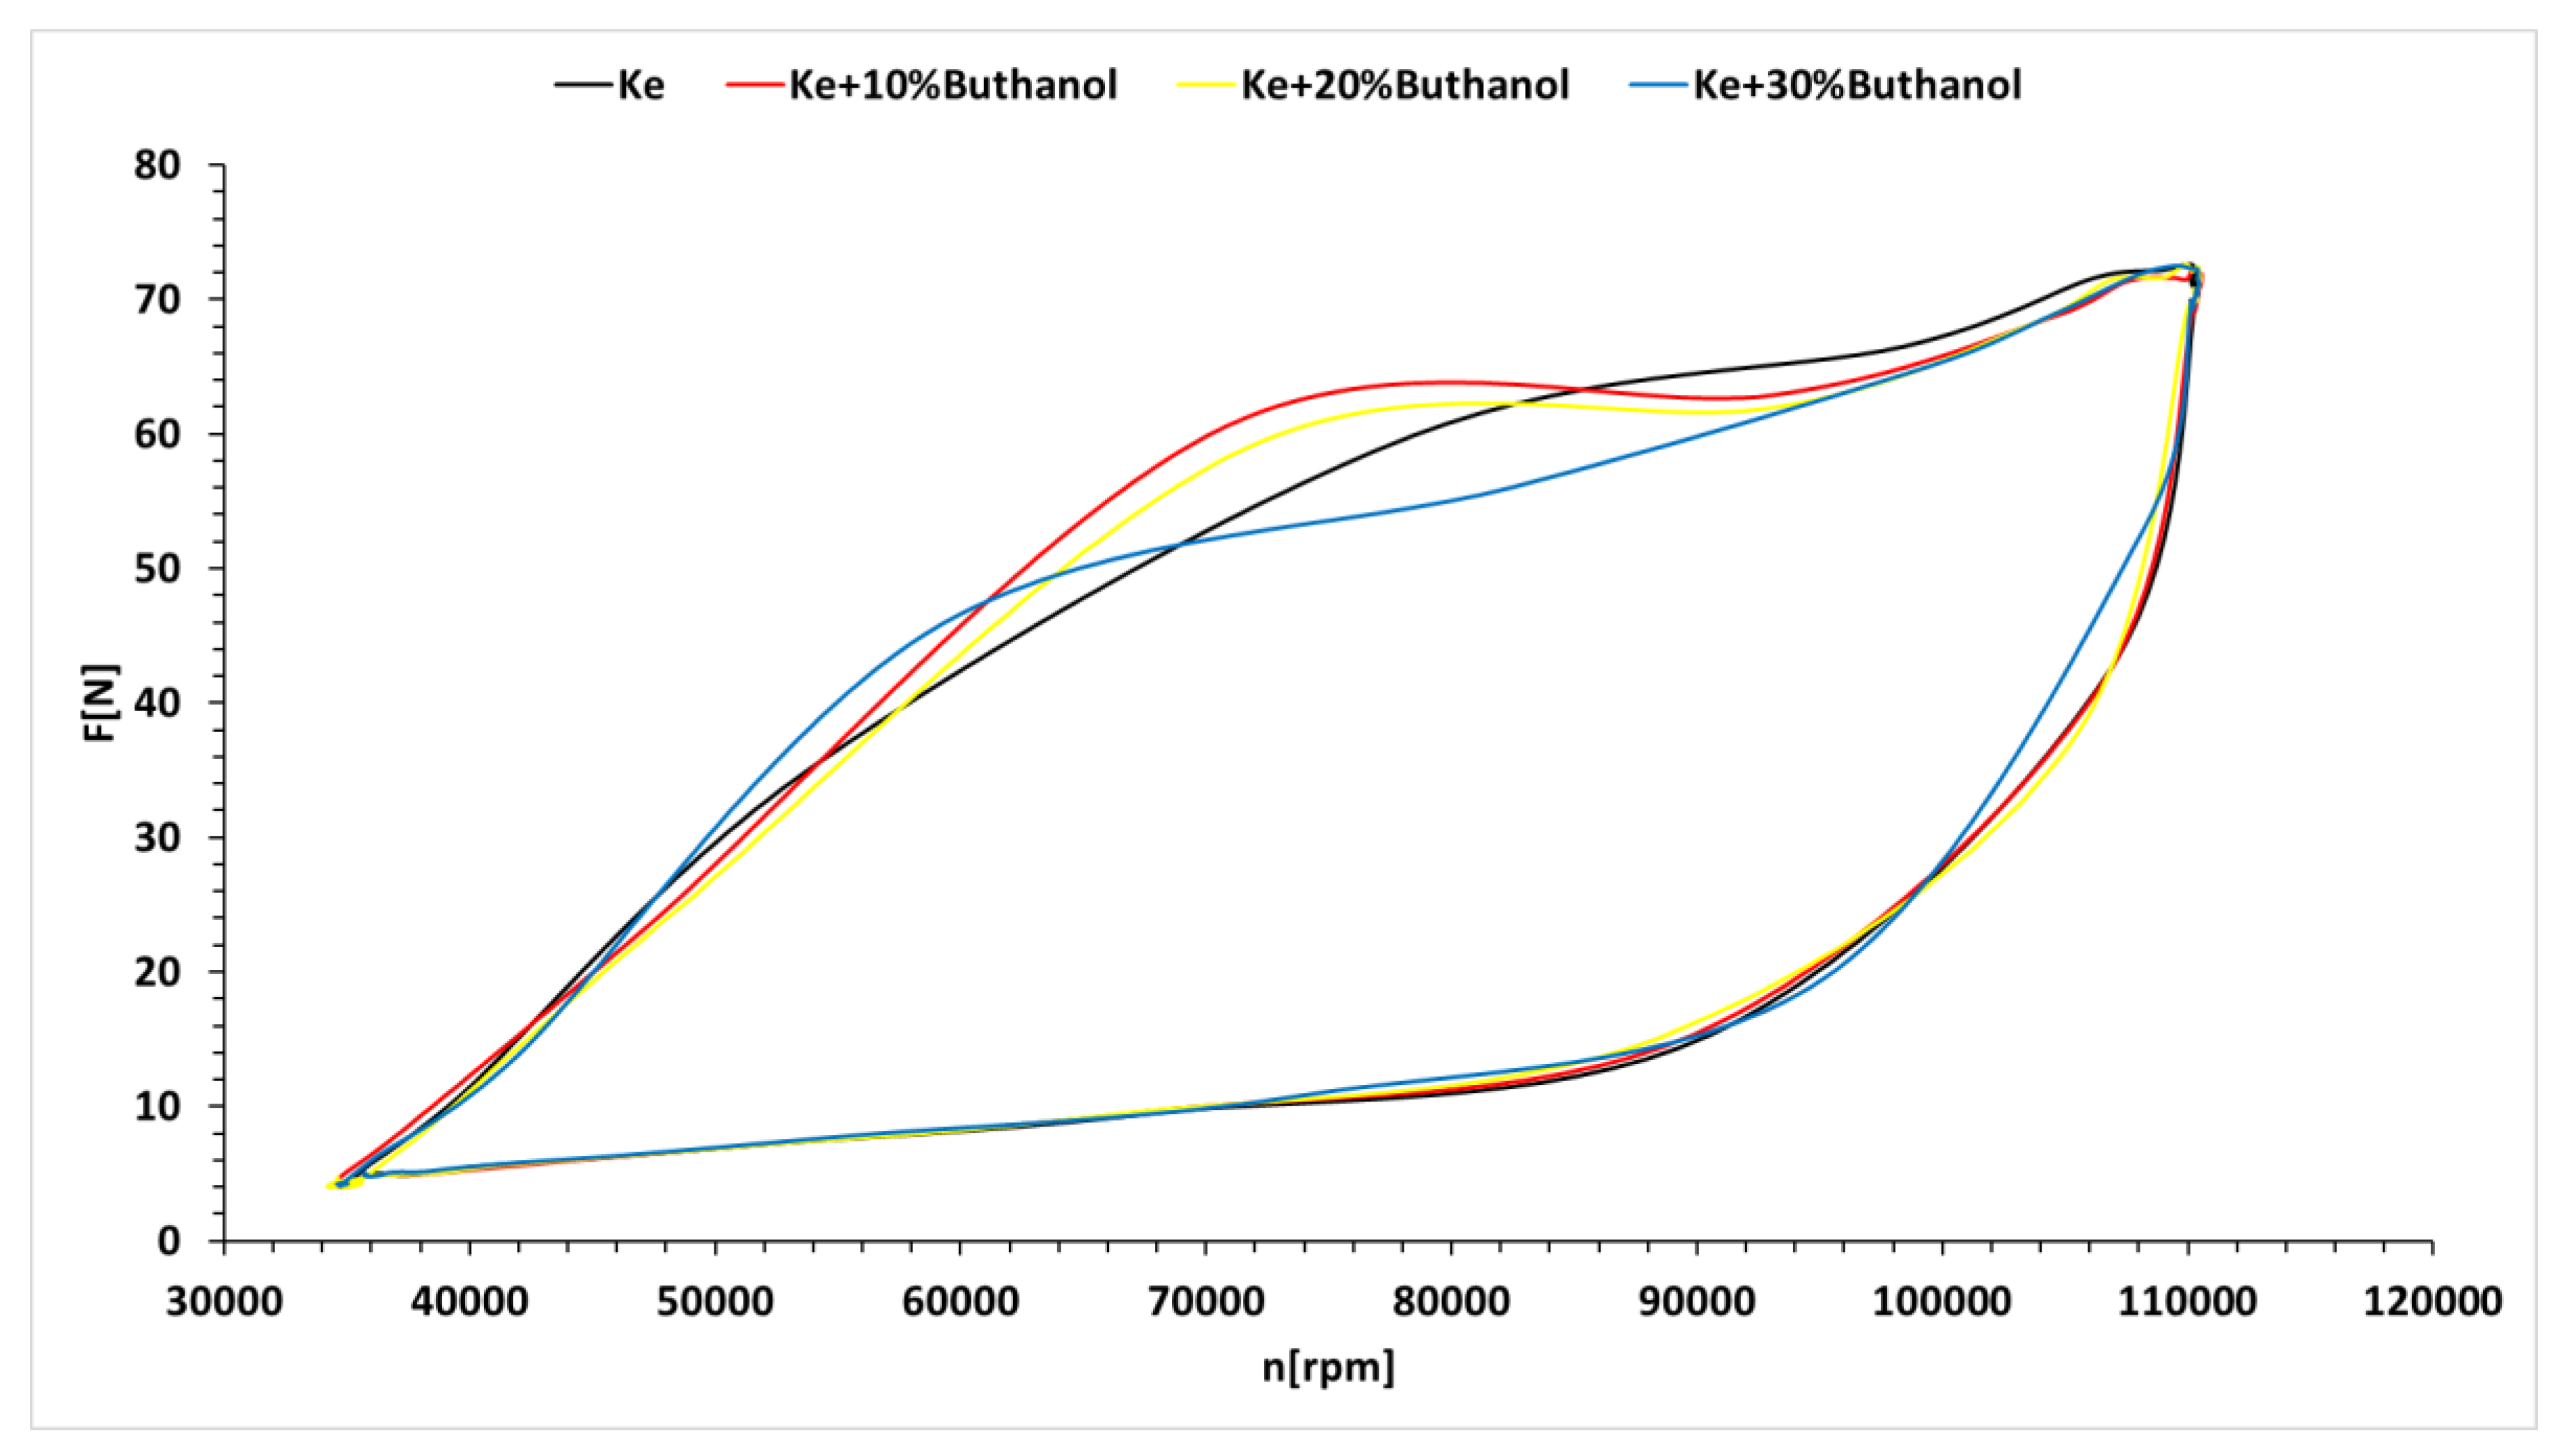
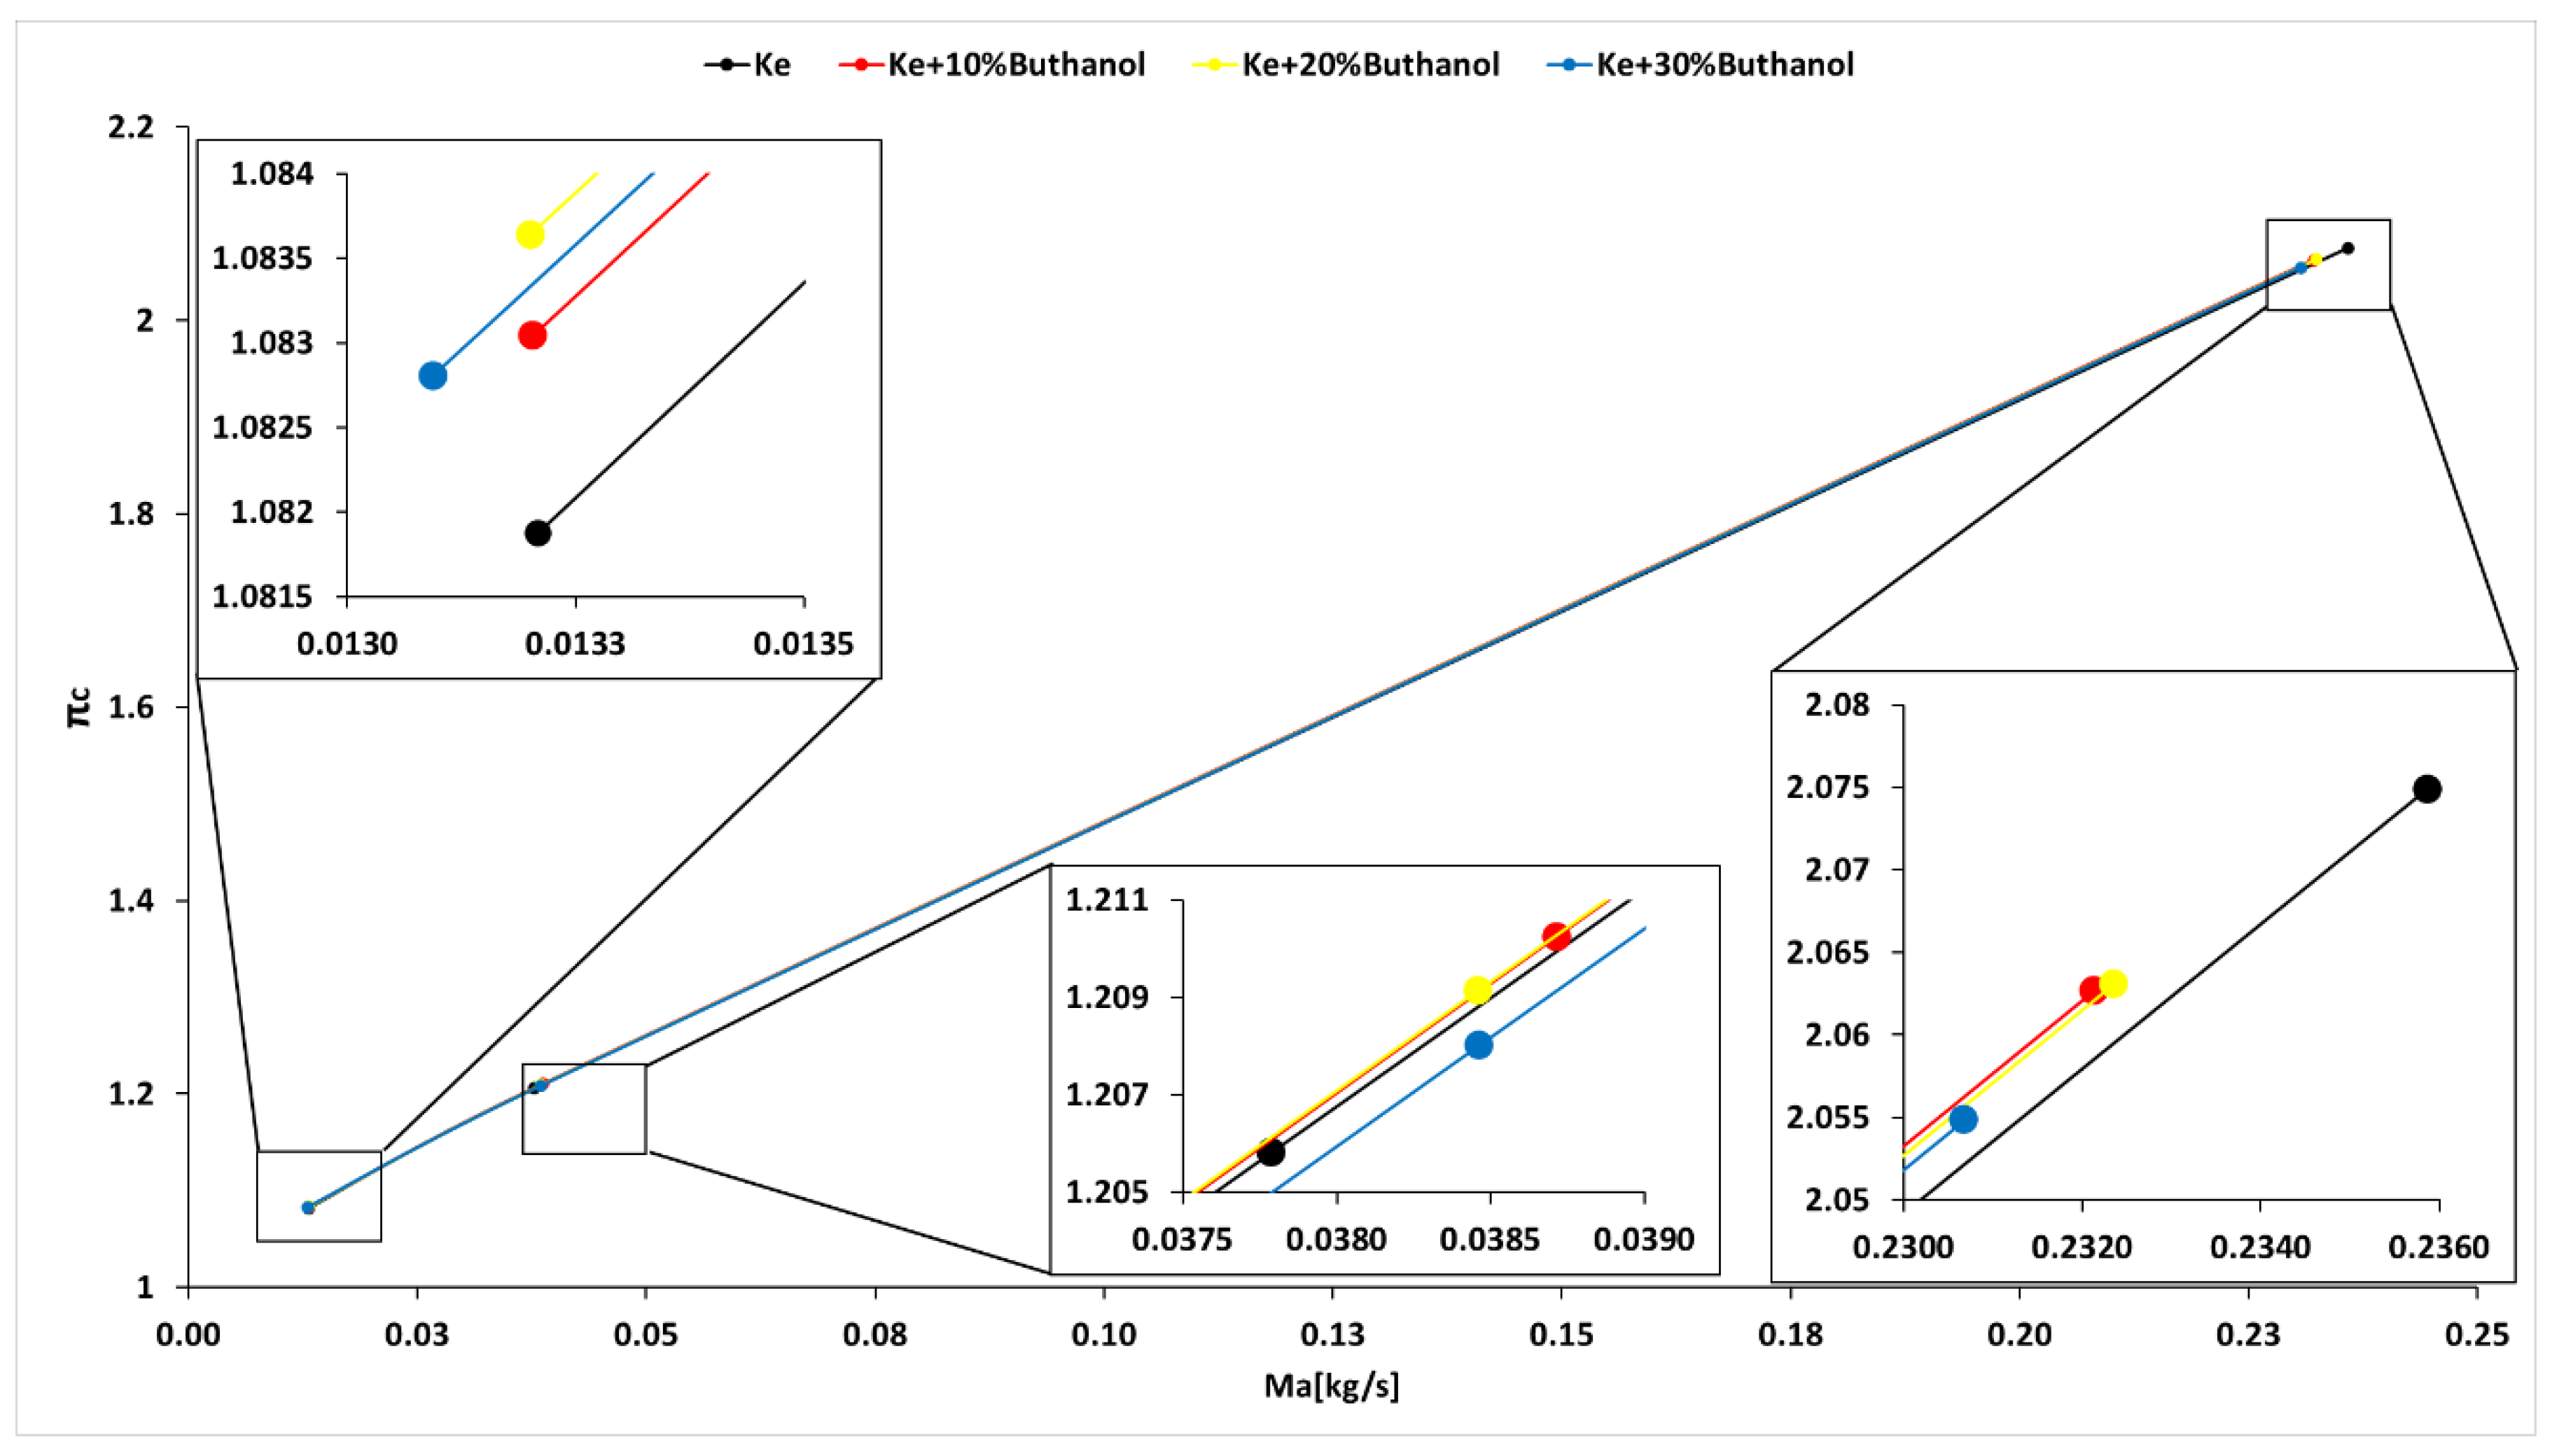
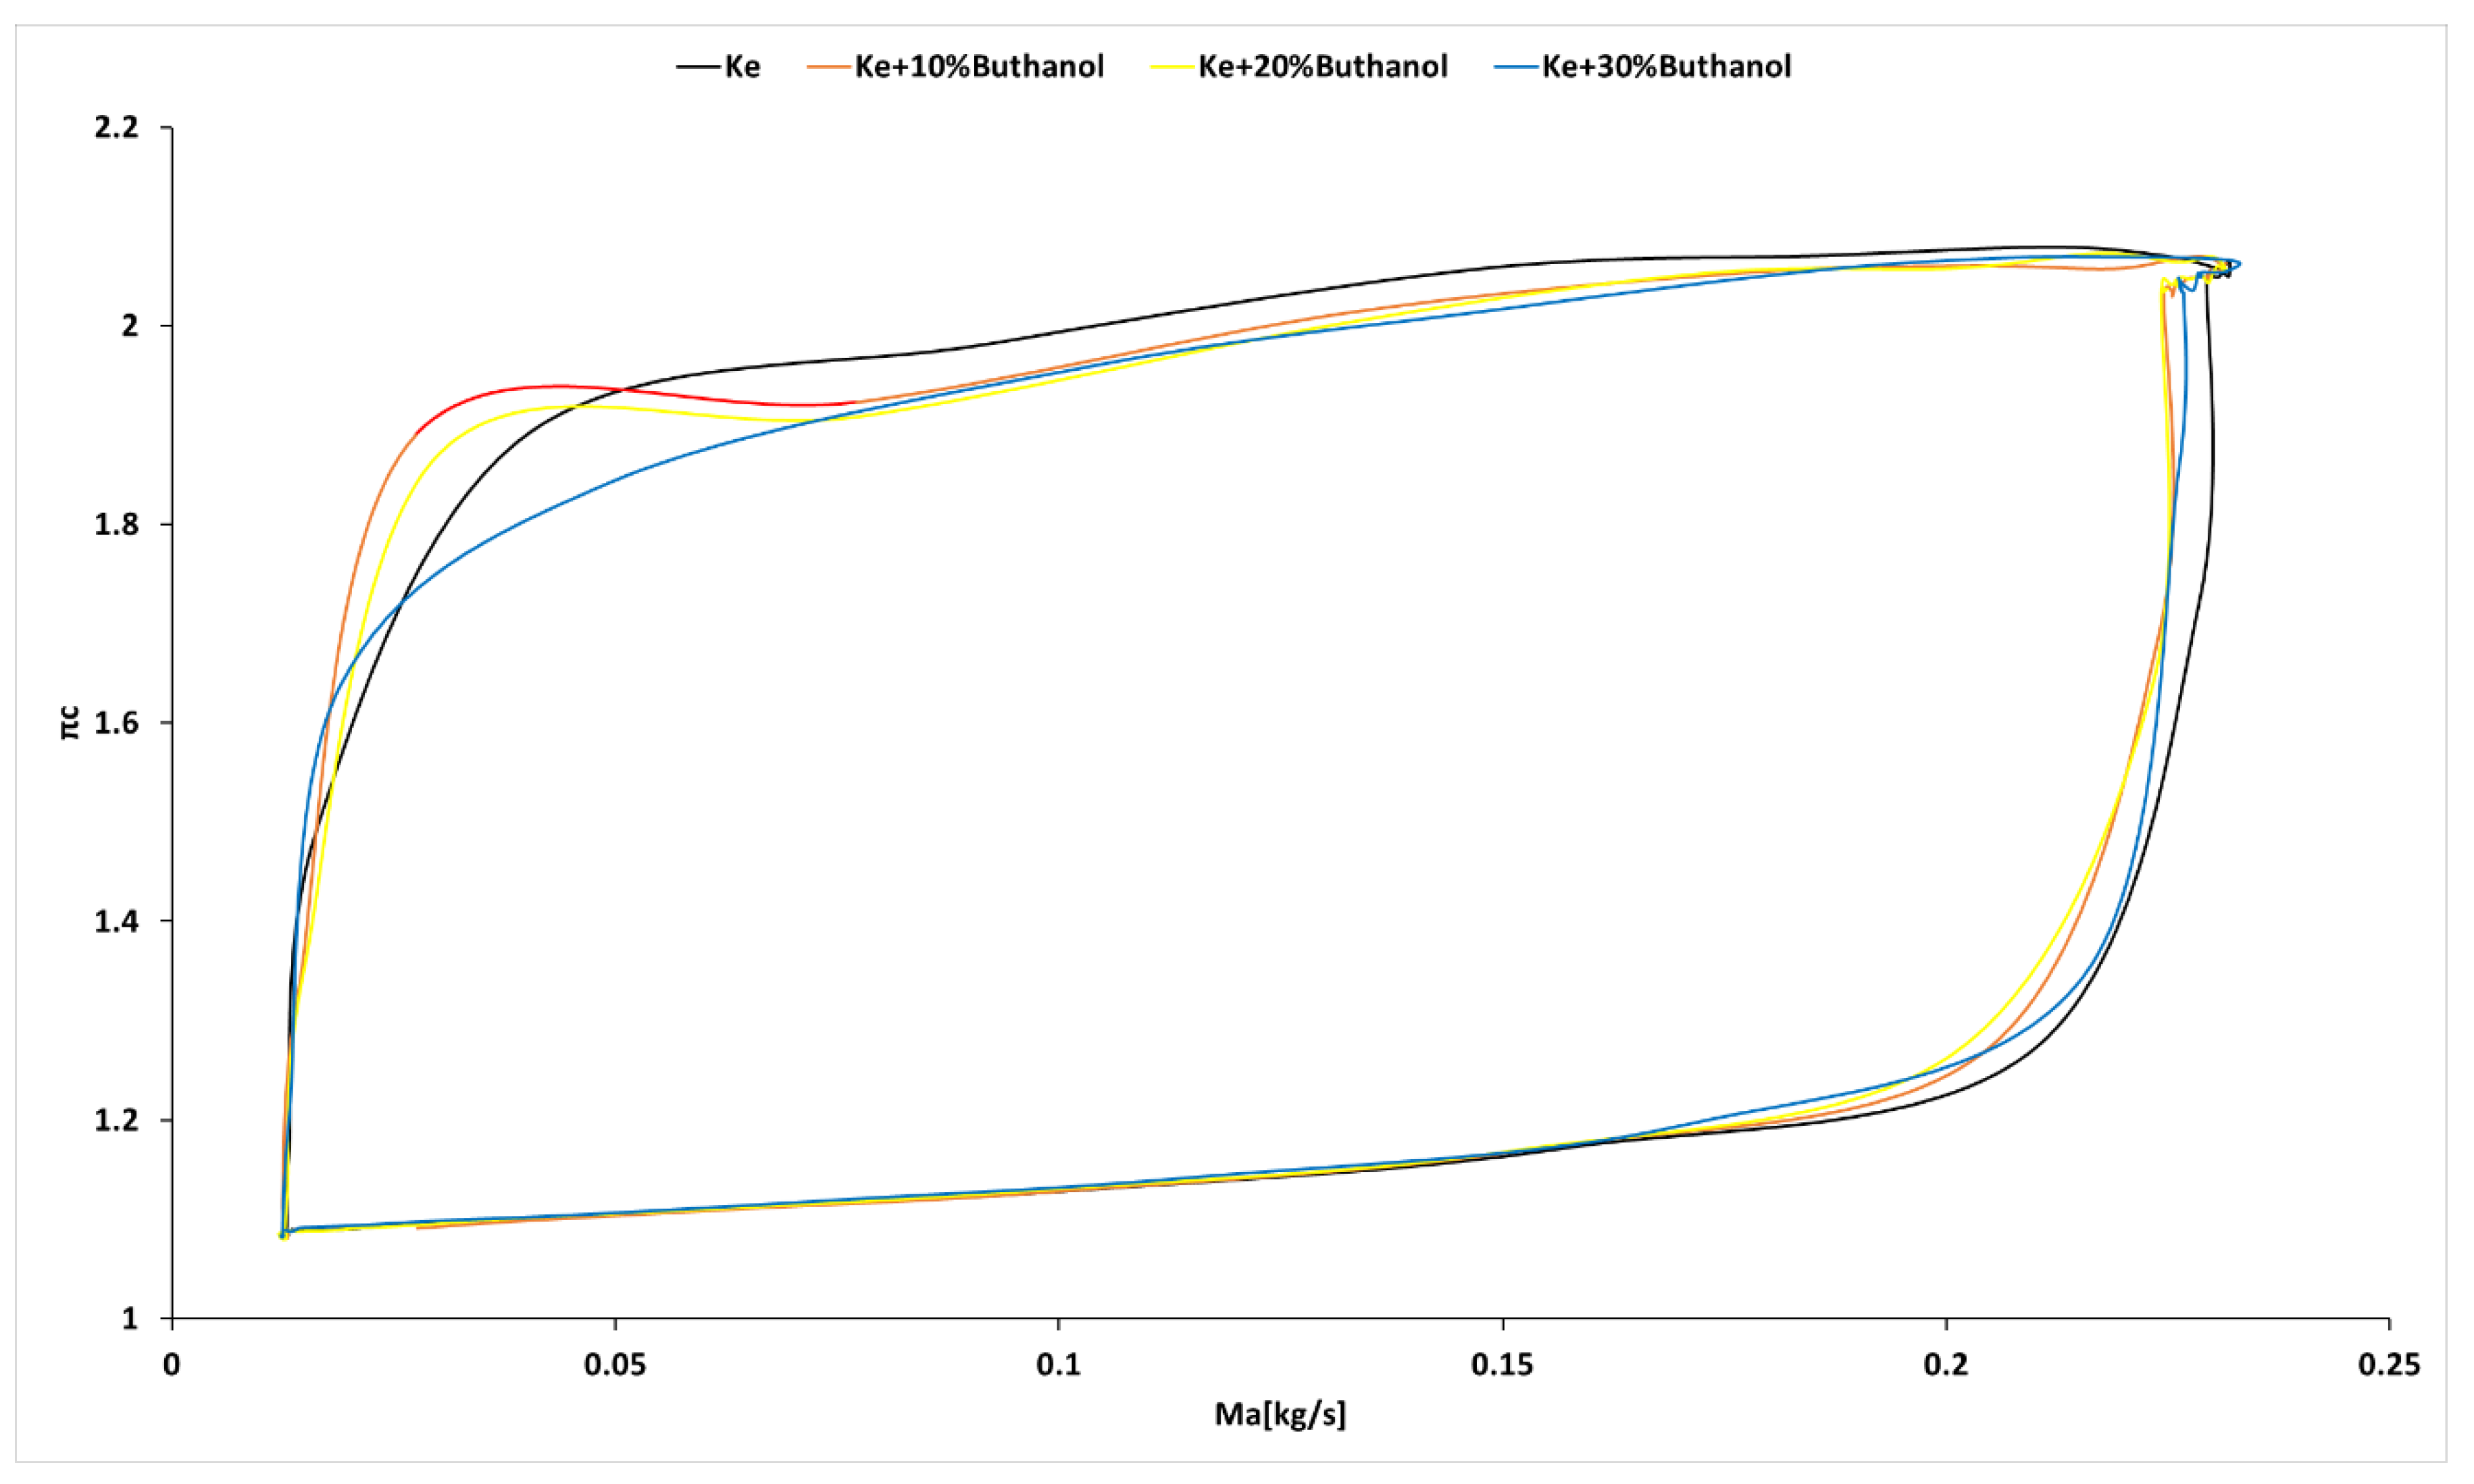
- As for transient regimes, the micro-turbo engine performed well, with deviations from the kerosene-only case being insignificant both in the starting procedure and in the sudden acceleration and deceleration procedures. The operating line of the micro-turbo engine shows no significant deviations when using kerosene and butanol blends, indicating acceptable stability in transient regimes.
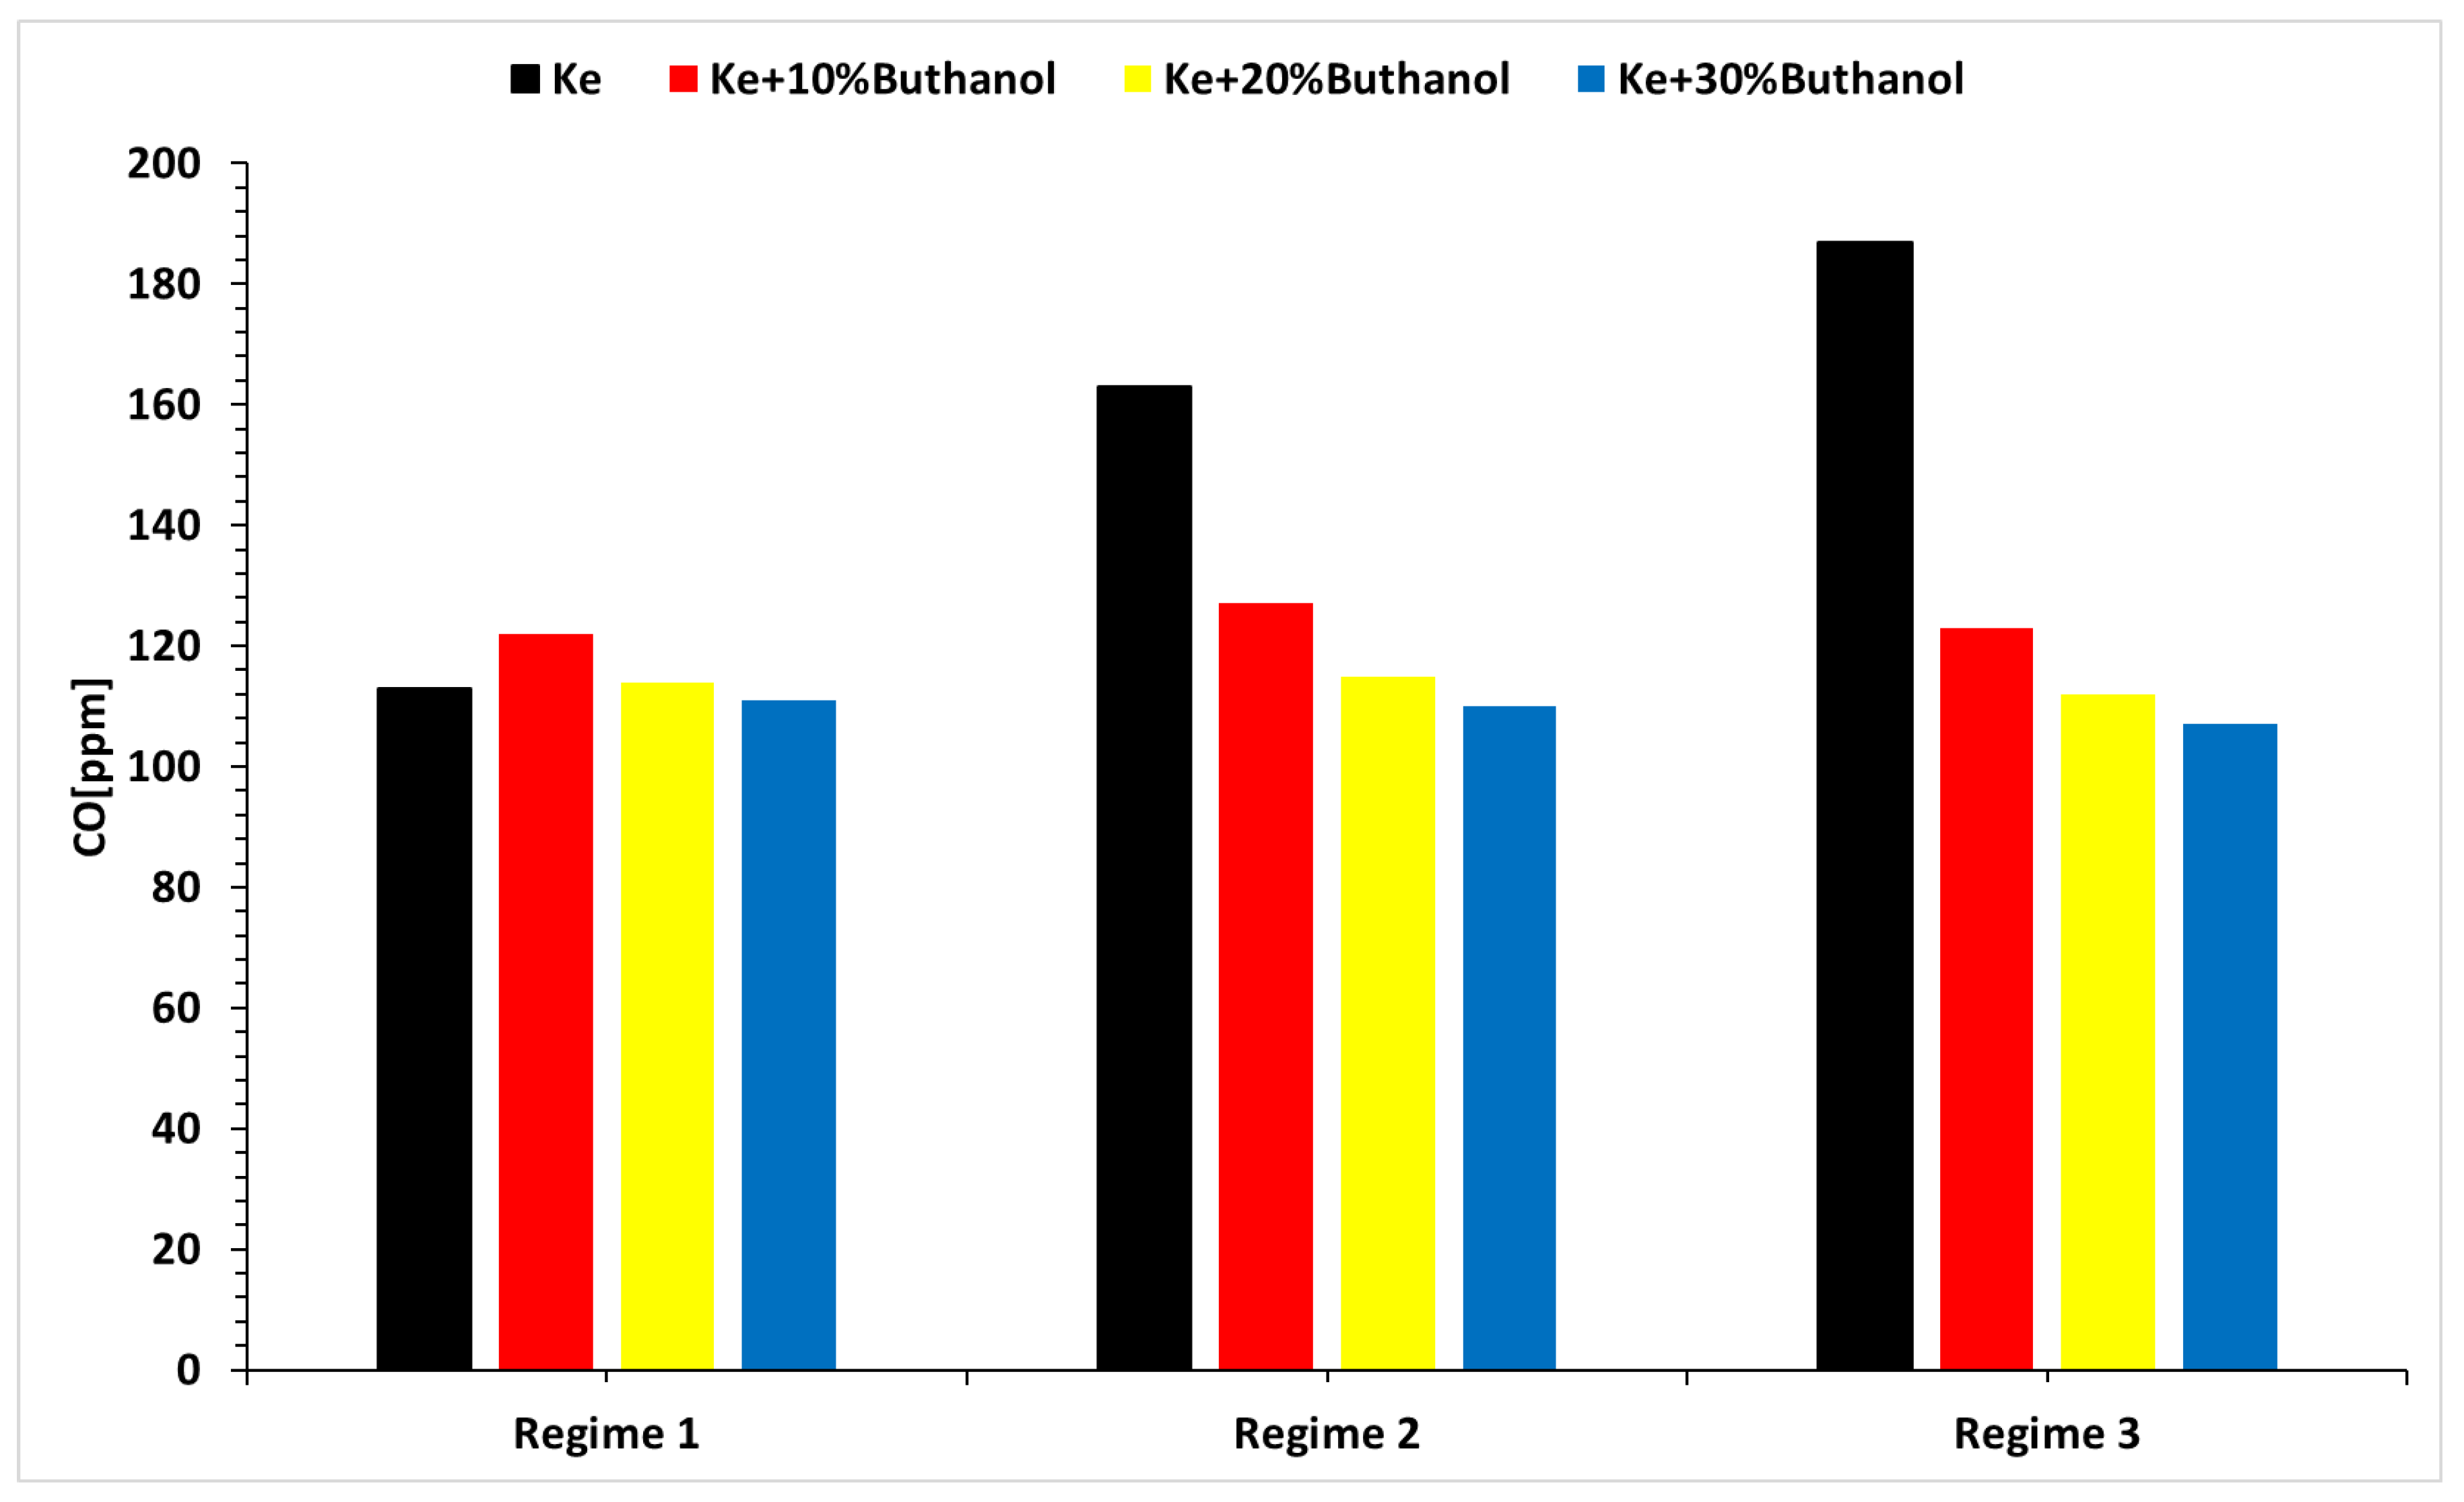
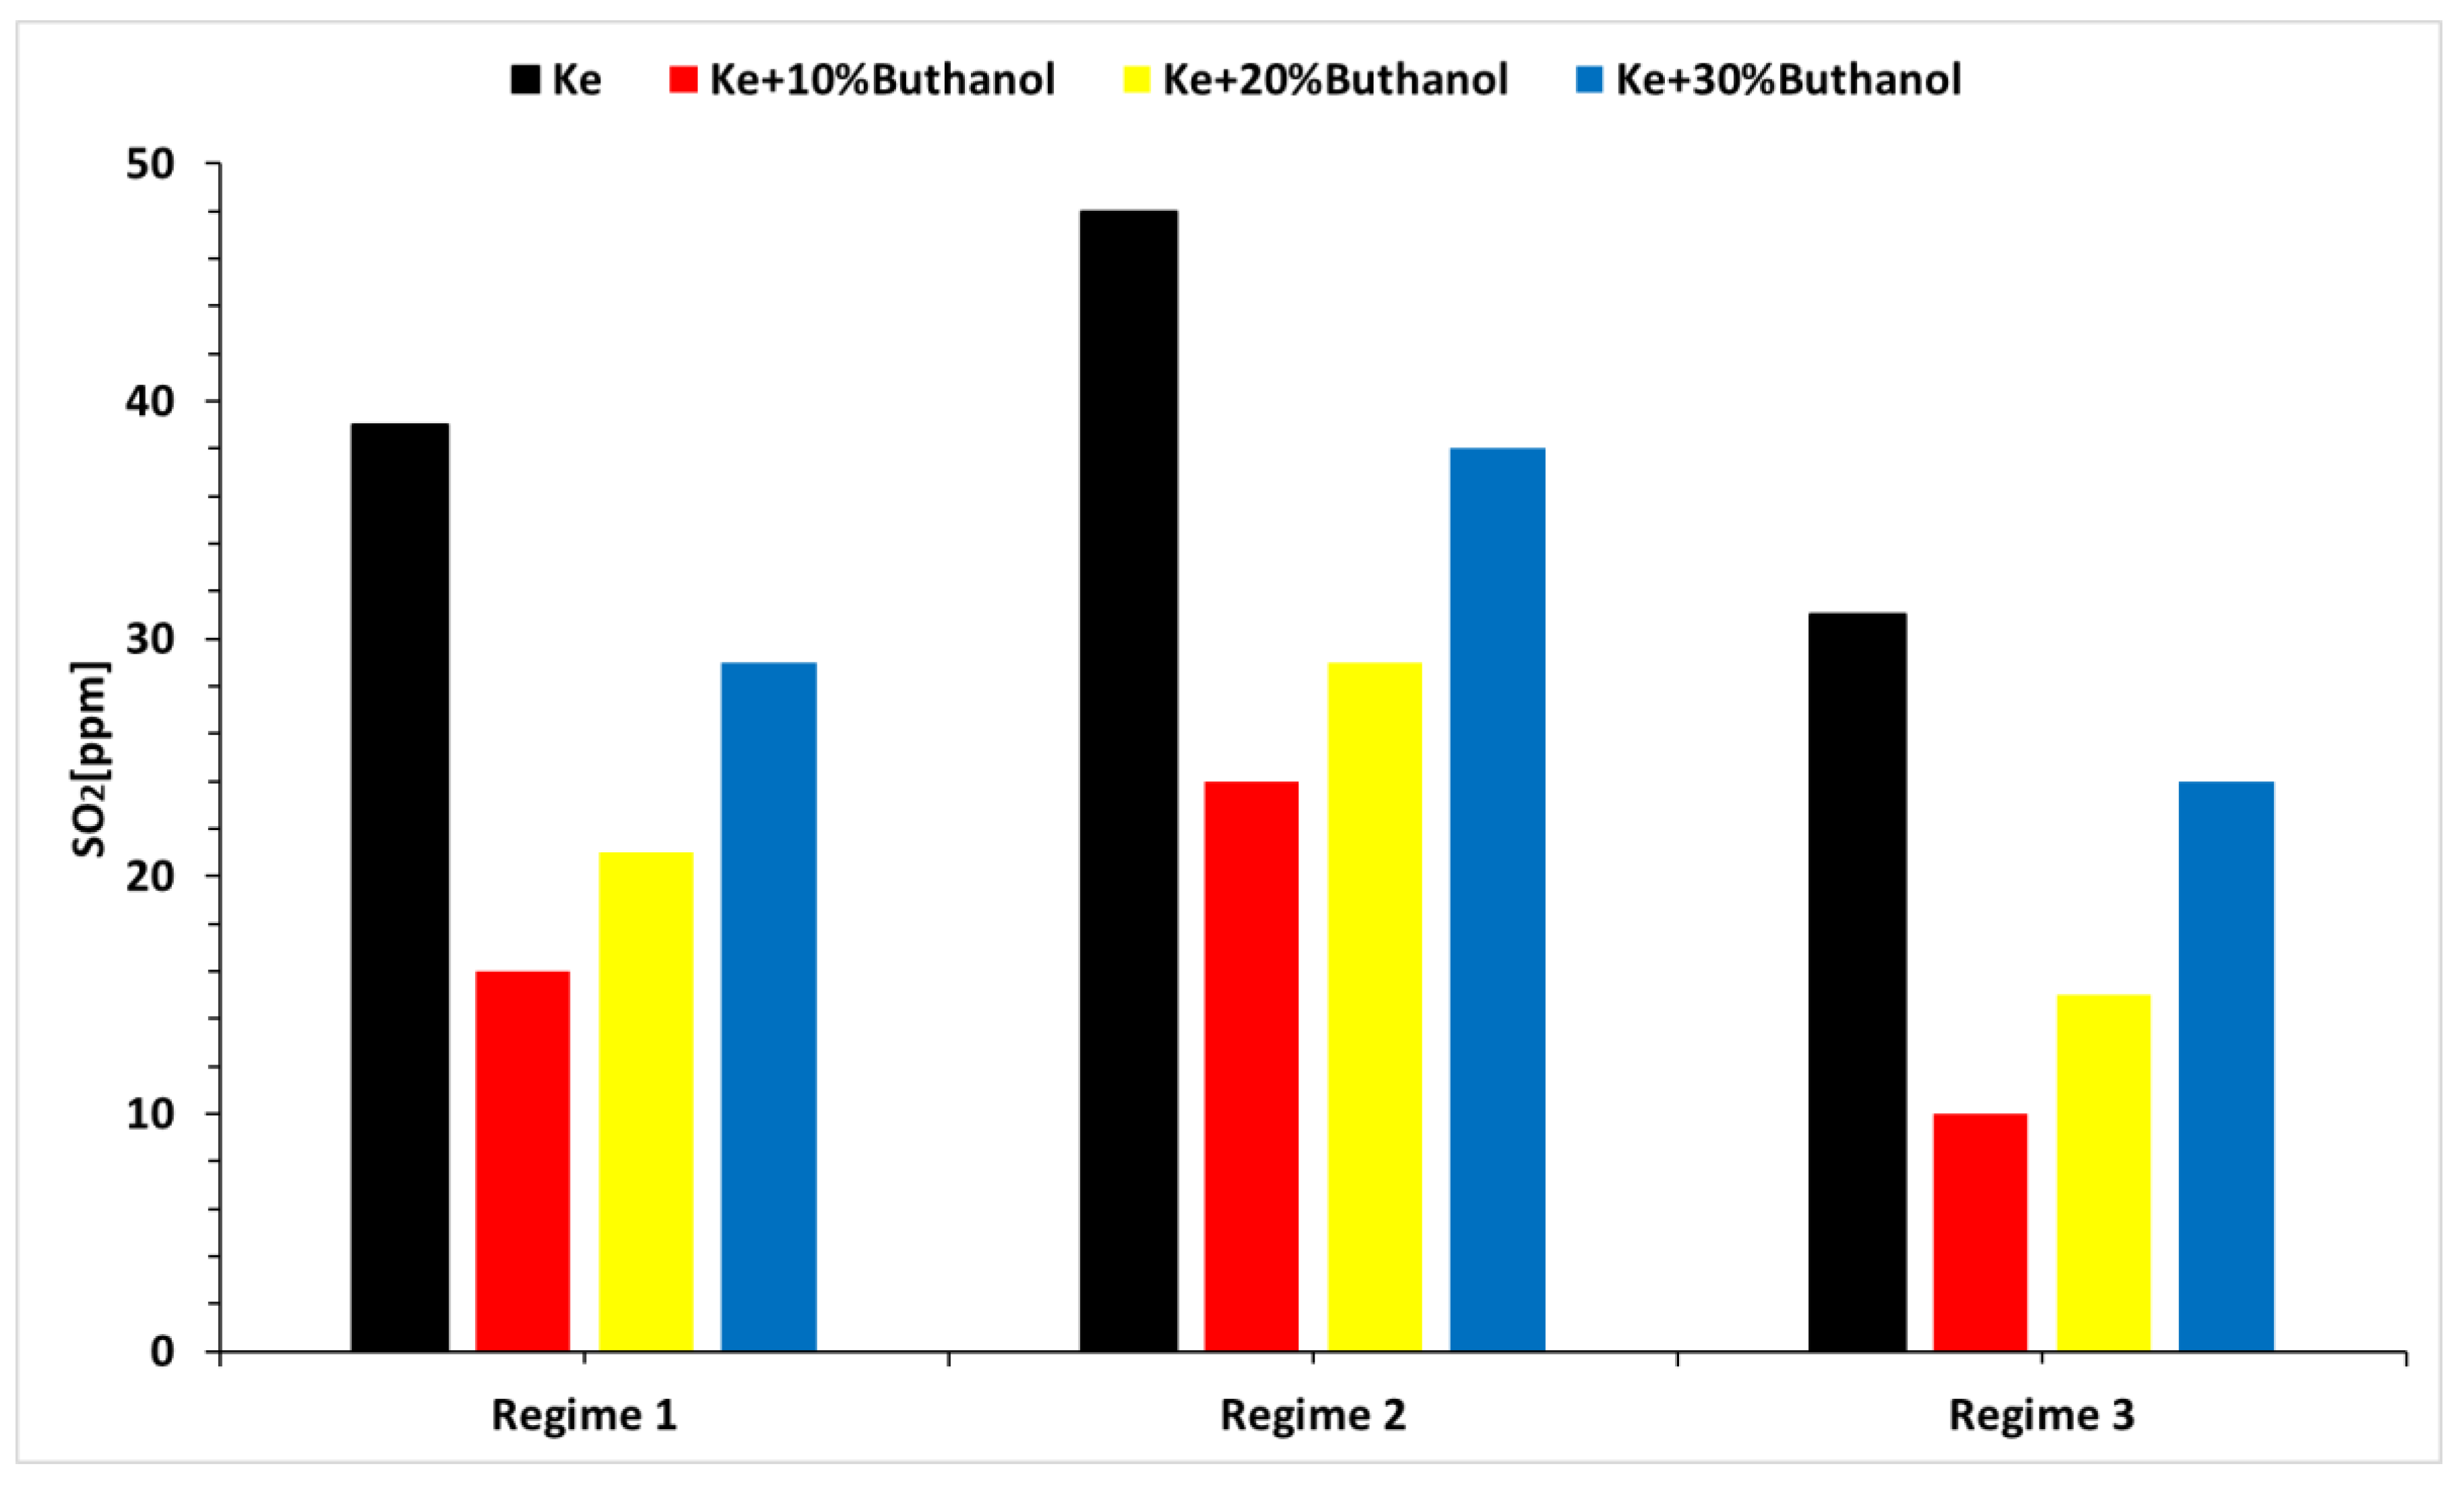
- The concentrations of CO and SO2 vary primarily with operational regimes and secondarily with alcohol concentrations.
- The main conclusion is that the tested fuel blends, namely Ke+10%B, Ke+20%B, and Ke+30%B, are considered suitable for aviation applications using micro-turbo engines. Throughout the experiments, the integrity of the engine remained intact, confirming their viability for practical use in aviation.
- Following experiments on the Jet Cat P80 microturbine engine, it was found that its integrity and functionality were not compromised.
- It can be observed that the calorific power of Jet A and n-butanol blends decreases as the alcohol concentration in the blends increases.
- The amount of CO2 produced during combustion decreases with increasing n-butanol concentration, attributable to the lower carbon content in n-butanol compared to Jet A.
- There is an increase in the specific fuel consumption of the microturbine engine attributed to the calorific power of alcohol.
- The concentration of CO and SO2 is lower when using n-butanol blends.
- As for transient regimes, the micro-turbo engine performed well, with deviations from the kerosene-only case being insignificant both in the starting procedure and in the sudden acceleration and deceleration procedures. The operating line of the micro-turbo engine shows no significant deviations when using kerosene and butanol blends, indicating acceptable stability in transient regimes.
- The primary finding is that the evaluated fuel mixtures—specifically Ke+10%B, Ke+20%B, and Ke+30%B—are deemed appropriate for aviation applications employing micro-turbo engines.
Author Contributions
Acknowledgements
Conflicts of Interest
References
- Rhiannon Cordiner, Kai Wan, Shakoor Hajat, Helen L Macintyre, Accounting for adaptation when projecting climate change impacts on health: A review of temperature-related health impacts, Environment International, Volume 188, 2024, 108761. [CrossRef]
- Wei, H.; Liu, W.; Chen, X.; Yang, Q.; Li, J.; Chen, H. Renewable bio-jet fuel production for aviation: A review. Fuel 2019, 254. [CrossRef].
- Y.Ye, W. Guo, H. H. Ngo, W. Wei, D. Cheng, X. T. Bui, N. B. Hoang, H. Zhang,.
- F. de O. Gonçalves, E. S. Lopes, M. Savioli Lopes, R. M. Filho, Thorough evaluation of the available light-duty engine technologies to reduce greenhouse gases emissions in Brazil, Journal of Cleaner Production, Volume 358, 2022, 132051. [CrossRef]
- Biofuel production for circular bioeconomy: Present scenario and future scope, Science of The Total Environment, Volume 935, 2024, 172863. [CrossRef]
- Tian, Z.; Zhen, X.;Wang, Y.; Liu, D.; Li, X. Comparative study on combustion and emission characteristics of methanol, ethanol and butanol fuel in TISI engine. Fuel 2020, 259. [CrossRef].
- S.-R. Jhang, Y.-C. Lin, K.-S. Chen, S.-L. Lin, S. Batterman, Evaluation of fuel consumption, pollutant emissions and well-to-wheel GHGs assessment from a vehicle operation fueled with bioethanol, gasoline and hydrogen, Energy, Volume 209, 2020, 118436. [CrossRef]
- Osman, S.; Sapunaru, O.V.; Sterpu, A.E.; Chis, T.V.; I.Koncsag, C. Impact of Adding Bioethanol and Dimethyl Carbonate on Gasoline Properties. Energies 2023, 16, 1940. [CrossRef]
- Iliev, S. A Comparison of Ethanol, Methanol, and Butanol Blending with Gasoline and Its Effect on Engine Performance and Emissions Using Engine Simulation. Processes 2021, 9, 1322. https:// doi.org/10.3390/pr9081322.
- Tibaquirá, J.E.; Huertas, J.I.; Ospina, S.; Quirama, L.F.; Niño, J.E. The effect of using ethanol-gasoline blends on the mechanical, energy and environmental performance of in-use vehicles. Energies 2018, 11, 221. [CrossRef].
- Turner, J.; Lewis, A.G.; Akehurst, S.; Brace, C.J.; Verhelst, S.; Vancoillie, J.; Sileghem, L.; Leach, F.; Edwards, P.P. Alcohol fuels for spark-ignition engines: Performance, efficiency and emission effects at mid to high blend rates for binary mixtures and pure components. Automob. Eng. 2018, 232, 36–56. [CrossRef].
- E. Newes, C. M. Clark, L. Vimmerstedt, S. Peterson, D. Burkholder, D. Korotney, D. Inman, Ethanol production in the United States: The roles of policy, price, and demand, Energy Policy, Volume 161, 2022, 112713. [CrossRef]
- Mirea, R.; Cican, G. Lab Scale Investigation of Gaseous Emissions, Performance and Stability of an Aviation Turbo-Engine While Running on Biodiesel Based Sustainable Aviation Fuel. Inventions 2024, 9, 16. [CrossRef]
- Cican, G.; Crunteanu, D.E.; Mirea, R.; Ceatra, L.C.; Leventiu, C. Biodiesel from Recycled Sunflower and Palm Oil—A Sustainable Fuel for Microturbo-Engines Used in Airside Applications. Sustainability 2023, 15, 2079. [CrossRef]
- Przysowa, R.; Gawron, B.; Białecki, T.; Ł ˛egowik, A.; Merkisz, J.; Jasi ´nski, R. Performance and Emissions of a Microturbine and Turbofan Powered by Alternative Fuels. Aerospace 2021, 8, 25. [CrossRef]
- Labeckas, G.; Slavinskas, S.; Laurinaitis, K. Effect of jet A-1/ethanol fuel blend on HCCI combustion and exhaust emissions. J. Energy Eng. 2018, 144. [CrossRef].
- Shauck, M.E.; Tubbs, J.; Zanin, M.G. Certification of a Carburater Aircraft Engine on Ethanol Fuel. Available online: https: //afdc.energy.gov/files/pdfs/2896.pdf (accessed on 18 May 2024).
- Litt, J.S.; Chin, J.C.; Liu, Y. Simulating the Use of Alternative Fuels in a Turbofan Engine; National Aeronautics and Space Administration, Glenn Research Center: Cleveland, OH, USA, 2013.
- Gawron, B.; Białecki, T.; Dzi˛egielewski,W.; Ka´zmierczak, U. Performance and emission characteristic of miniature turbojet engine FED Jet A-1/alcohol blend. J. KONES 2016, 23. [CrossRef].
- Mendez, C.J.; Parthasarathy, R.N.; Gollahalli, S.R. Performance and emission characteristics of butanol/Jet A blends in a gas turbine engine. Appl. Energy 2014, 118, 135–140. [CrossRef].
- Andoga, R.; F˝oz˝o, L.; Schrötter, M.; Szabo, S. The Use of Ethanol as an Alternative Fuel for Small Turbojet Engines. Sustainability 2021, 13, 2541. [CrossRef]
- Cican, G., Deaconu, M., Mirea, R., Cucuruz, A.T., Influence of Bioethanol Blends on Performances of a Micro Turbojet Engine, Rev. Chim., 71(5), 2020, 229-238. [CrossRef]
- Chen, L.; Zhang, Z.; Lu, Y.; Zhang, C.; Zhang, X.; Zhang, C.; Roskilly, A.P. Experimental study of the gaseous and particulate matter emissions from a gas turbine combustor burning butyl butyrate and ethanol blends. Appl. Energy 2017, 195, 693–701. [CrossRef].
- Cican, G.; Mirea, R.; Rimbu, G. Experimental Evaluation of Methanol/Jet-A Blends as Sustainable Aviation Fuels for Turbo-Engines: Performance and Environmental Impact Analysis. Fire 2024, 7, 155. [CrossRef]
- European Committee for Standardization. SR EN ISO 3675/2003, Crude Petroleum and Liquid Petroleum Products—Laboratory Determination of Density—Hydrometer Method; ASRO: Bucharest, Romania, 2003.
- ASTM International. ASTM D92-05a, Standard Test Method for Flash and Fire Points by Cleveland Open Cup Tester; ASTM International: West Conshohocken, PA, USA, 2009.
- European Committee for Standardization. SR EN ISO 3104/2002, Petroleum Products. Transparent and Opaque Liquids. Determination of Kinematic Viscosity and Calculation of Dynamic Viscosity; ASRO: Bucharest, Romania, 2002.
- ASTM International. ASTM D240-17, Standard Test Method for Heat of Combustion of Liquid Hydrocarbon Fuels by Bomb Calorimeter; ASTM International: West Conshohocken, PA, USA, 2017.
- ASTM D5291-16. Standard Test Methods for Instrumental Determination of Carbon, Hydrogen, and Nitrogen in Petroleum Products and Lubricants; ASTM International: West Conshohocken, PA, USA, 2016.
- Jet Cat USA. Jet Cat Instruction Manual. U.S. Patent No. 6216440, 17 April 2001.
- Lois, A.L. Biodiesel and Biokerosenes: Production, Characterization, Soot & Pah Emissions. Ph.D. Thesis, Polytechnic University of Madrid, Madrid, Spain, 2015. Oyerinde, A.Y.; Bello, E.I. Use of Fourier Transformation Infrared (FTIR) Spectroscopy for Analysis of Functional Groups in Peanut Oil Biodiesel and Its Blends. Br. J. Appl. Sci. Technol. 2016, 13, 22178.
- J.G. Speight Handbook of Industrial Hydrocarbon Processes, Gulf Professional Publishing, 2020, ISSN 978-0-12-809923-0.
- Mattingly, J. Elements of Propulsion: Gas Turbines and Rockets, 2nd ed.; American Institute of Aeronautics and Astronautics: Reston, VA, USA, 2006.
- Cican, G. Experimental Transient Process Analysis of Micro-Turbojet Aviation Engines: Comparing the Effects of Diesel and Kerosene Fuels at Different Ambient Temperatures. Energies 2024, 17, 1366. [CrossRef]

| Sample | Flash Point [°C] |
Kinematic Viscosity at 40 °C [cSt] |
Density at 22 °C [g/cm3] |
Low Calorific Power [kJ/kg] |
Elemental Analysis |
|---|---|---|---|---|---|
| Ke | 42.3 | 1.39 | 0.817 | 42.39 | C% = 85.17 H% = 13.31 N% = 0.07 O% = 1.45 |
| Ke + 10%B | 33.9 | 1,51 | 0,816 | 40.93 | C%=83,13 H% =13.33 N% =0.06 O% =3.46 |
| Ke + 20%B | 33.7 | 1,63 | 0,816 | 39.46 | C%=81,09 H% =13.35 N% =0.06 O% =5.48 |
| Ke + 30%B | 33.1 | 1,74 | 0,815 | 37,99 | C%=79,05 H% =13.36 N% =0.05 O% =7.49 |
| B | 35 | 2.573 | 0.81 | 27.7 | C%=64,76 H% =13.49 N% =0 O% =21.59 |
| Blend | MO [kg] | Mair [kg] | CO2 [kg] | H2O [kg] |
|---|---|---|---|---|
| Ke+5% Aeroshell 500 Oil | 3.32 | 14.45 | 3.12 | 1.20 |
| Ke+10%B | 3.25 | 14.13 | 3.05 | 1.20 |
| Ke+20%B | 3.18 | 13.82 | 2.97 | 1.20 |
| Ke+30%B | 3.10 | 13.49 | 2.90 | 1.20 |
| B | 2.67 | 11.60 | 2.37 | 1.21 |
| Fuel | Ke + 5% Aeroshell 500 Oil | Ke + 10% B | Ke + 20% B | Ke + 30% B |
|---|---|---|---|---|
| [%] | 5.084 | 5.149 | 5.321 | 5.423 |
Disclaimer/Publisher’s Note: The statements, opinions and data contained in all publications are solely those of the individual author(s) and contributor(s) and not of MDPI and/or the editor(s). MDPI and/or the editor(s) disclaim responsibility for any injury to people or property resulting from any ideas, methods, instructions or products referred to in the content. |
© 2024 by the authors. Licensee MDPI, Basel, Switzerland. This article is an open access article distributed under the terms and conditions of the Creative Commons Attribution (CC BY) license (http://creativecommons.org/licenses/by/4.0/).


