1. Introduction
Cold-water coral (CWC) reefs are vulnerable marine ecosystems (VMEs) renowned for their biodiversity and crucial role in deep-sea environments [
1]. These reefs are found in diverse locations, including continental slopes, seamounts, fjords, and submarine canyons [
2]. Due to their complex topography, submarine canyons and seamounts can act as refugia, shielding these ecosystems from destructive fishing practices [
4,
5].
Cold-water corals, such as
Desmophyllum pertusum (Linneus, 1758) and
Madrepora oculata (Linneaus, 1758), form intricate three-dimensional reef structures that provide essential habitats for a wide range of species, fostering higher biodiversity and benthic biomass than adjacent substrates [
5,
6]. The structural complexity of these reefs influences key ecological processes such as larval dispersal, retention, feeding efficiency, and infaunal diversity [
7,
8,
9].
Despite their ecological importance, CWC reefs face numerous threats, including bottom trawling, deep-sea mining, and climate change [
10,
11]. These threats underscore the urgent need to protect and conserve CWC reefs, which are recognized as VMEs by the United Nations General Assembly (Resolution 61/105). However, accurate identification and delineation of these ecosystems, particularly from underwater imagery, remains challenging due to the lack of precise information on coral cover and the associated structural complexity [
1].
Recent advances in computer vision techniques, particularly deep learning-based object detection and segmentation models, have offered promising solutions to these challenges. These models, trained on large labeled datasets, can automatically identify and delineate coral colonies in underwater images, thereby enabling accurate estimation of coral cover and spatial distribution [
12,
13]. Among these models, YOLOv8 has proven effective in detecting corals in various marine environments, including CWC reefs [
14].
In this study, we leveraged the power of YOLOv8 for the automated detection and segmentation of coral species in remotely operated towed vehicle (ROTV) imagery collected at two Natura 2000 sites in the Cantabrian Sea. Our objectives are threefold: (1) to develop novel methodologies for monitoring CWC VMEs, (2) to assess variability in coral cover across geographically proximate areas and among transects within each area, and (3) to characterize these CWC communities in terms of CWC coverage. By analyzing ROTV imagery, we aim to overcome the challenges associated with manual annotation and obtain accurate quantitative data for improved understanding and management of these ecosystems.
2. Materials and Methods
2.1. Study Area
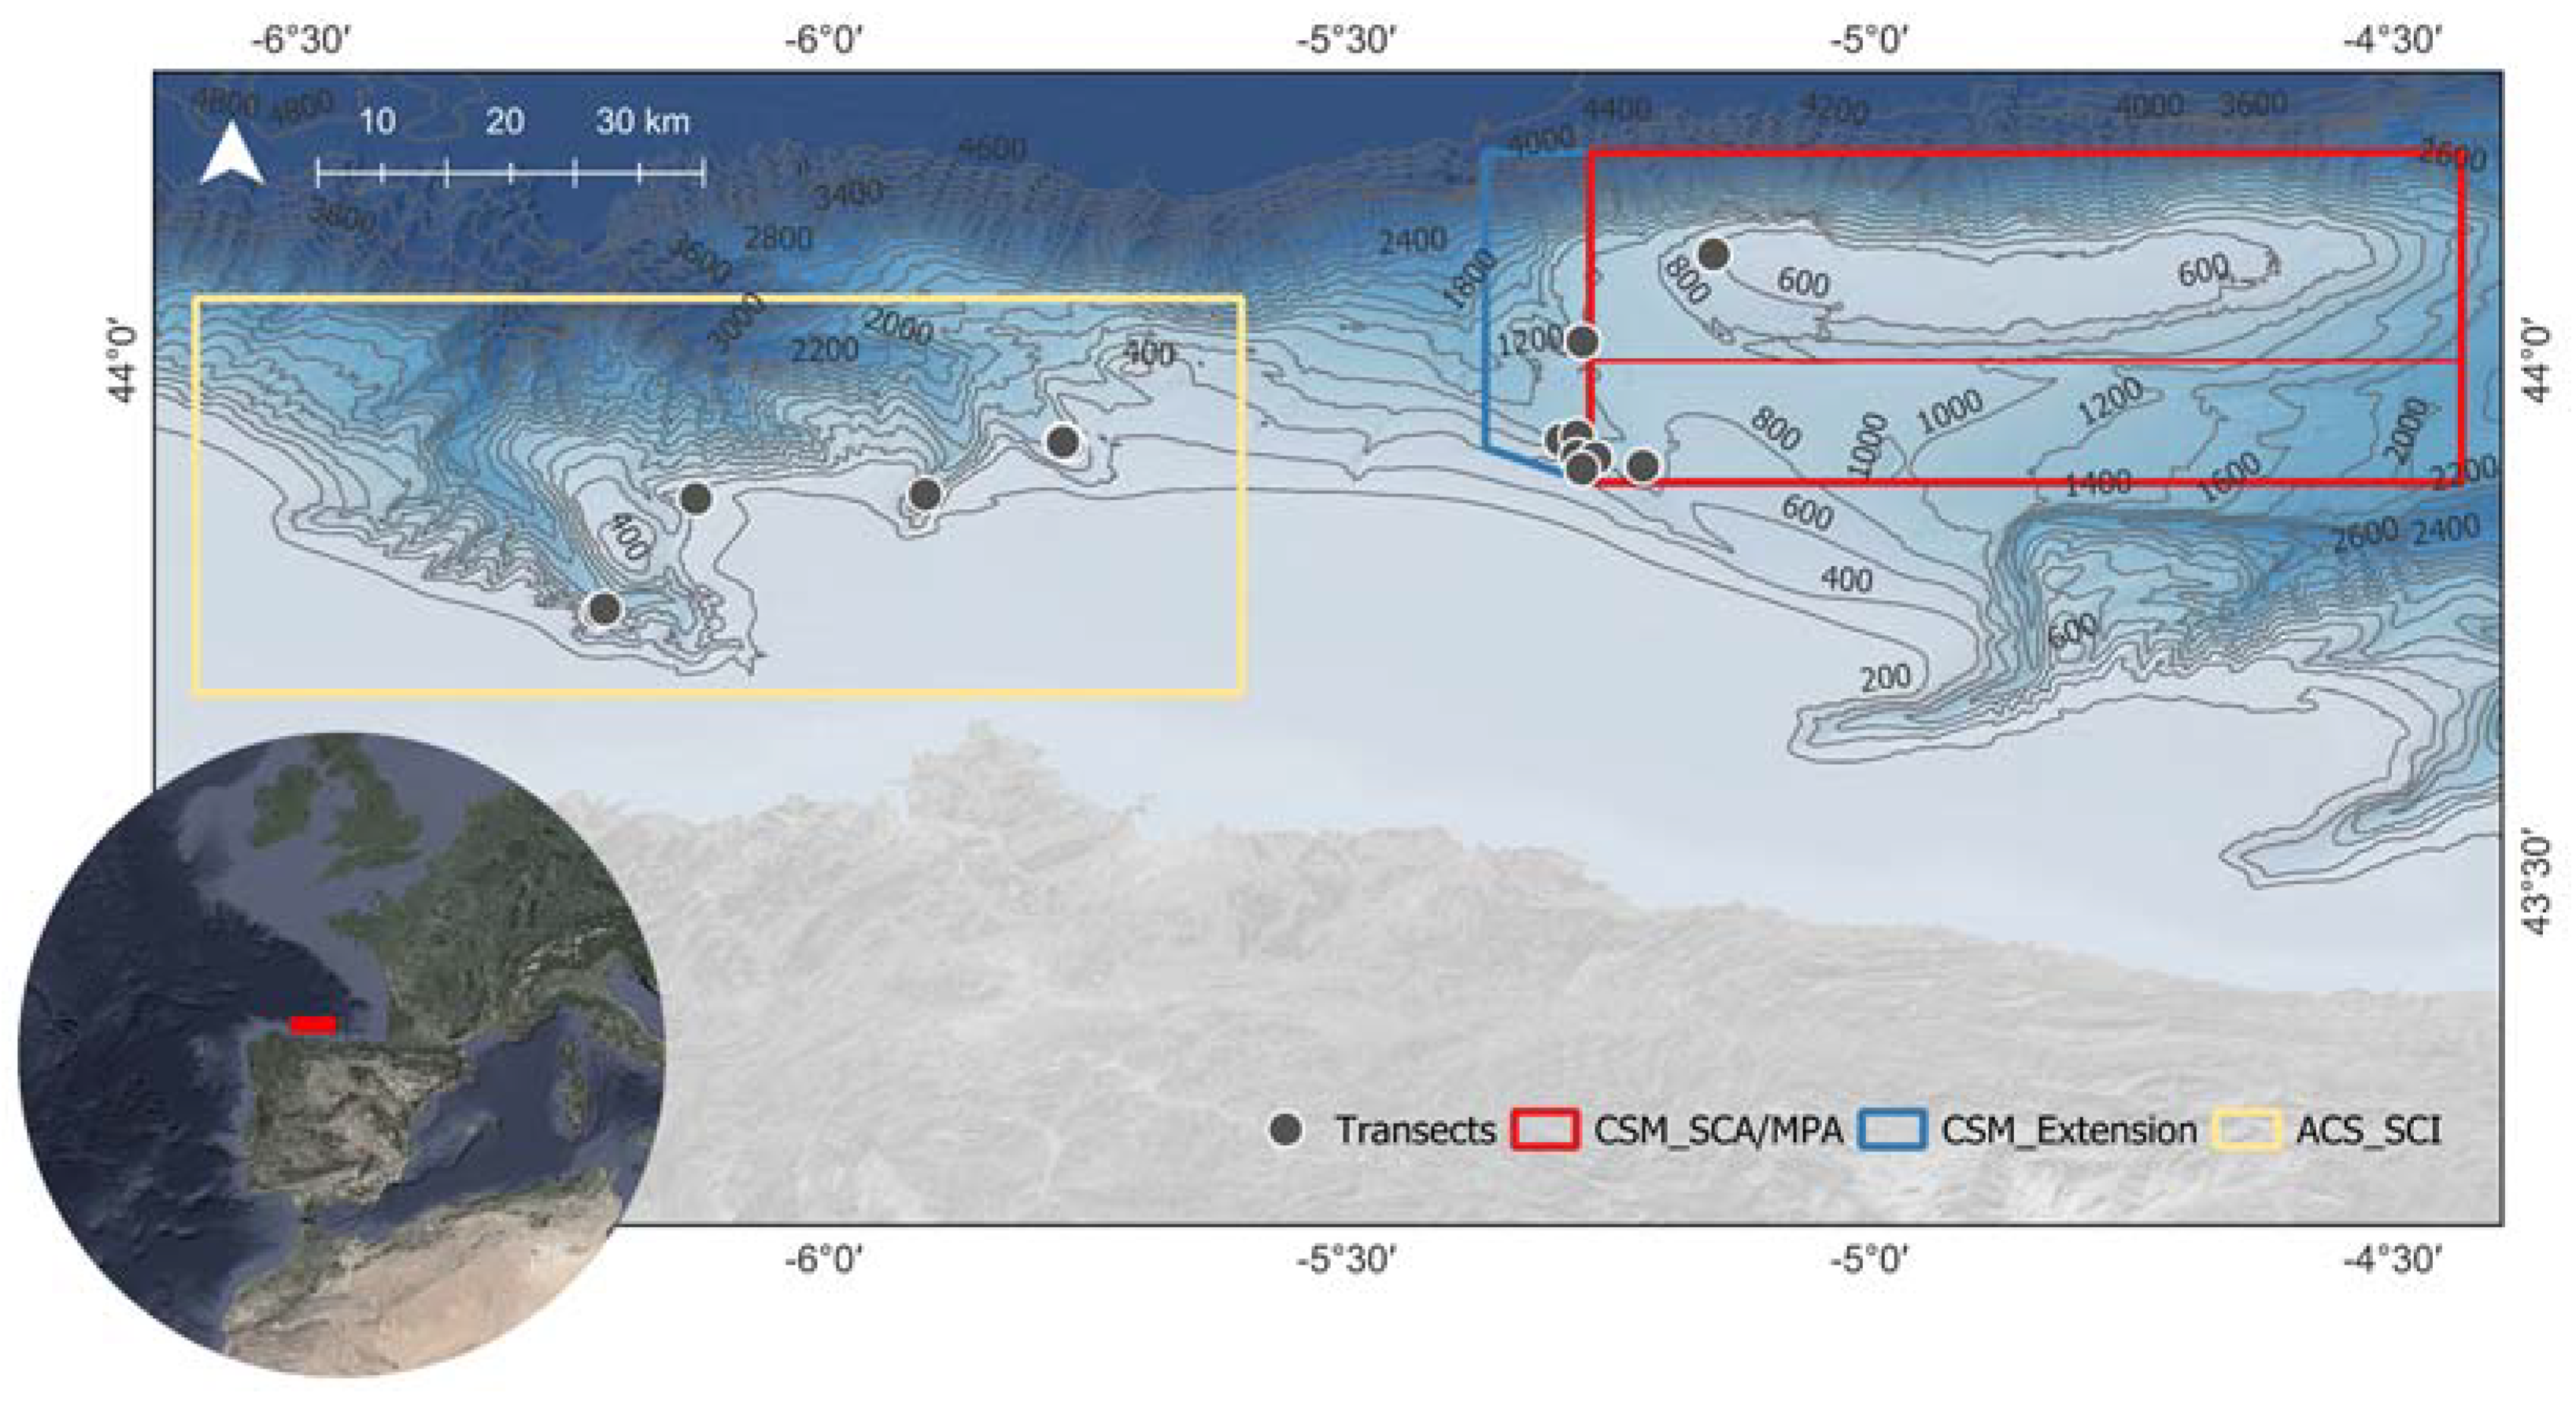
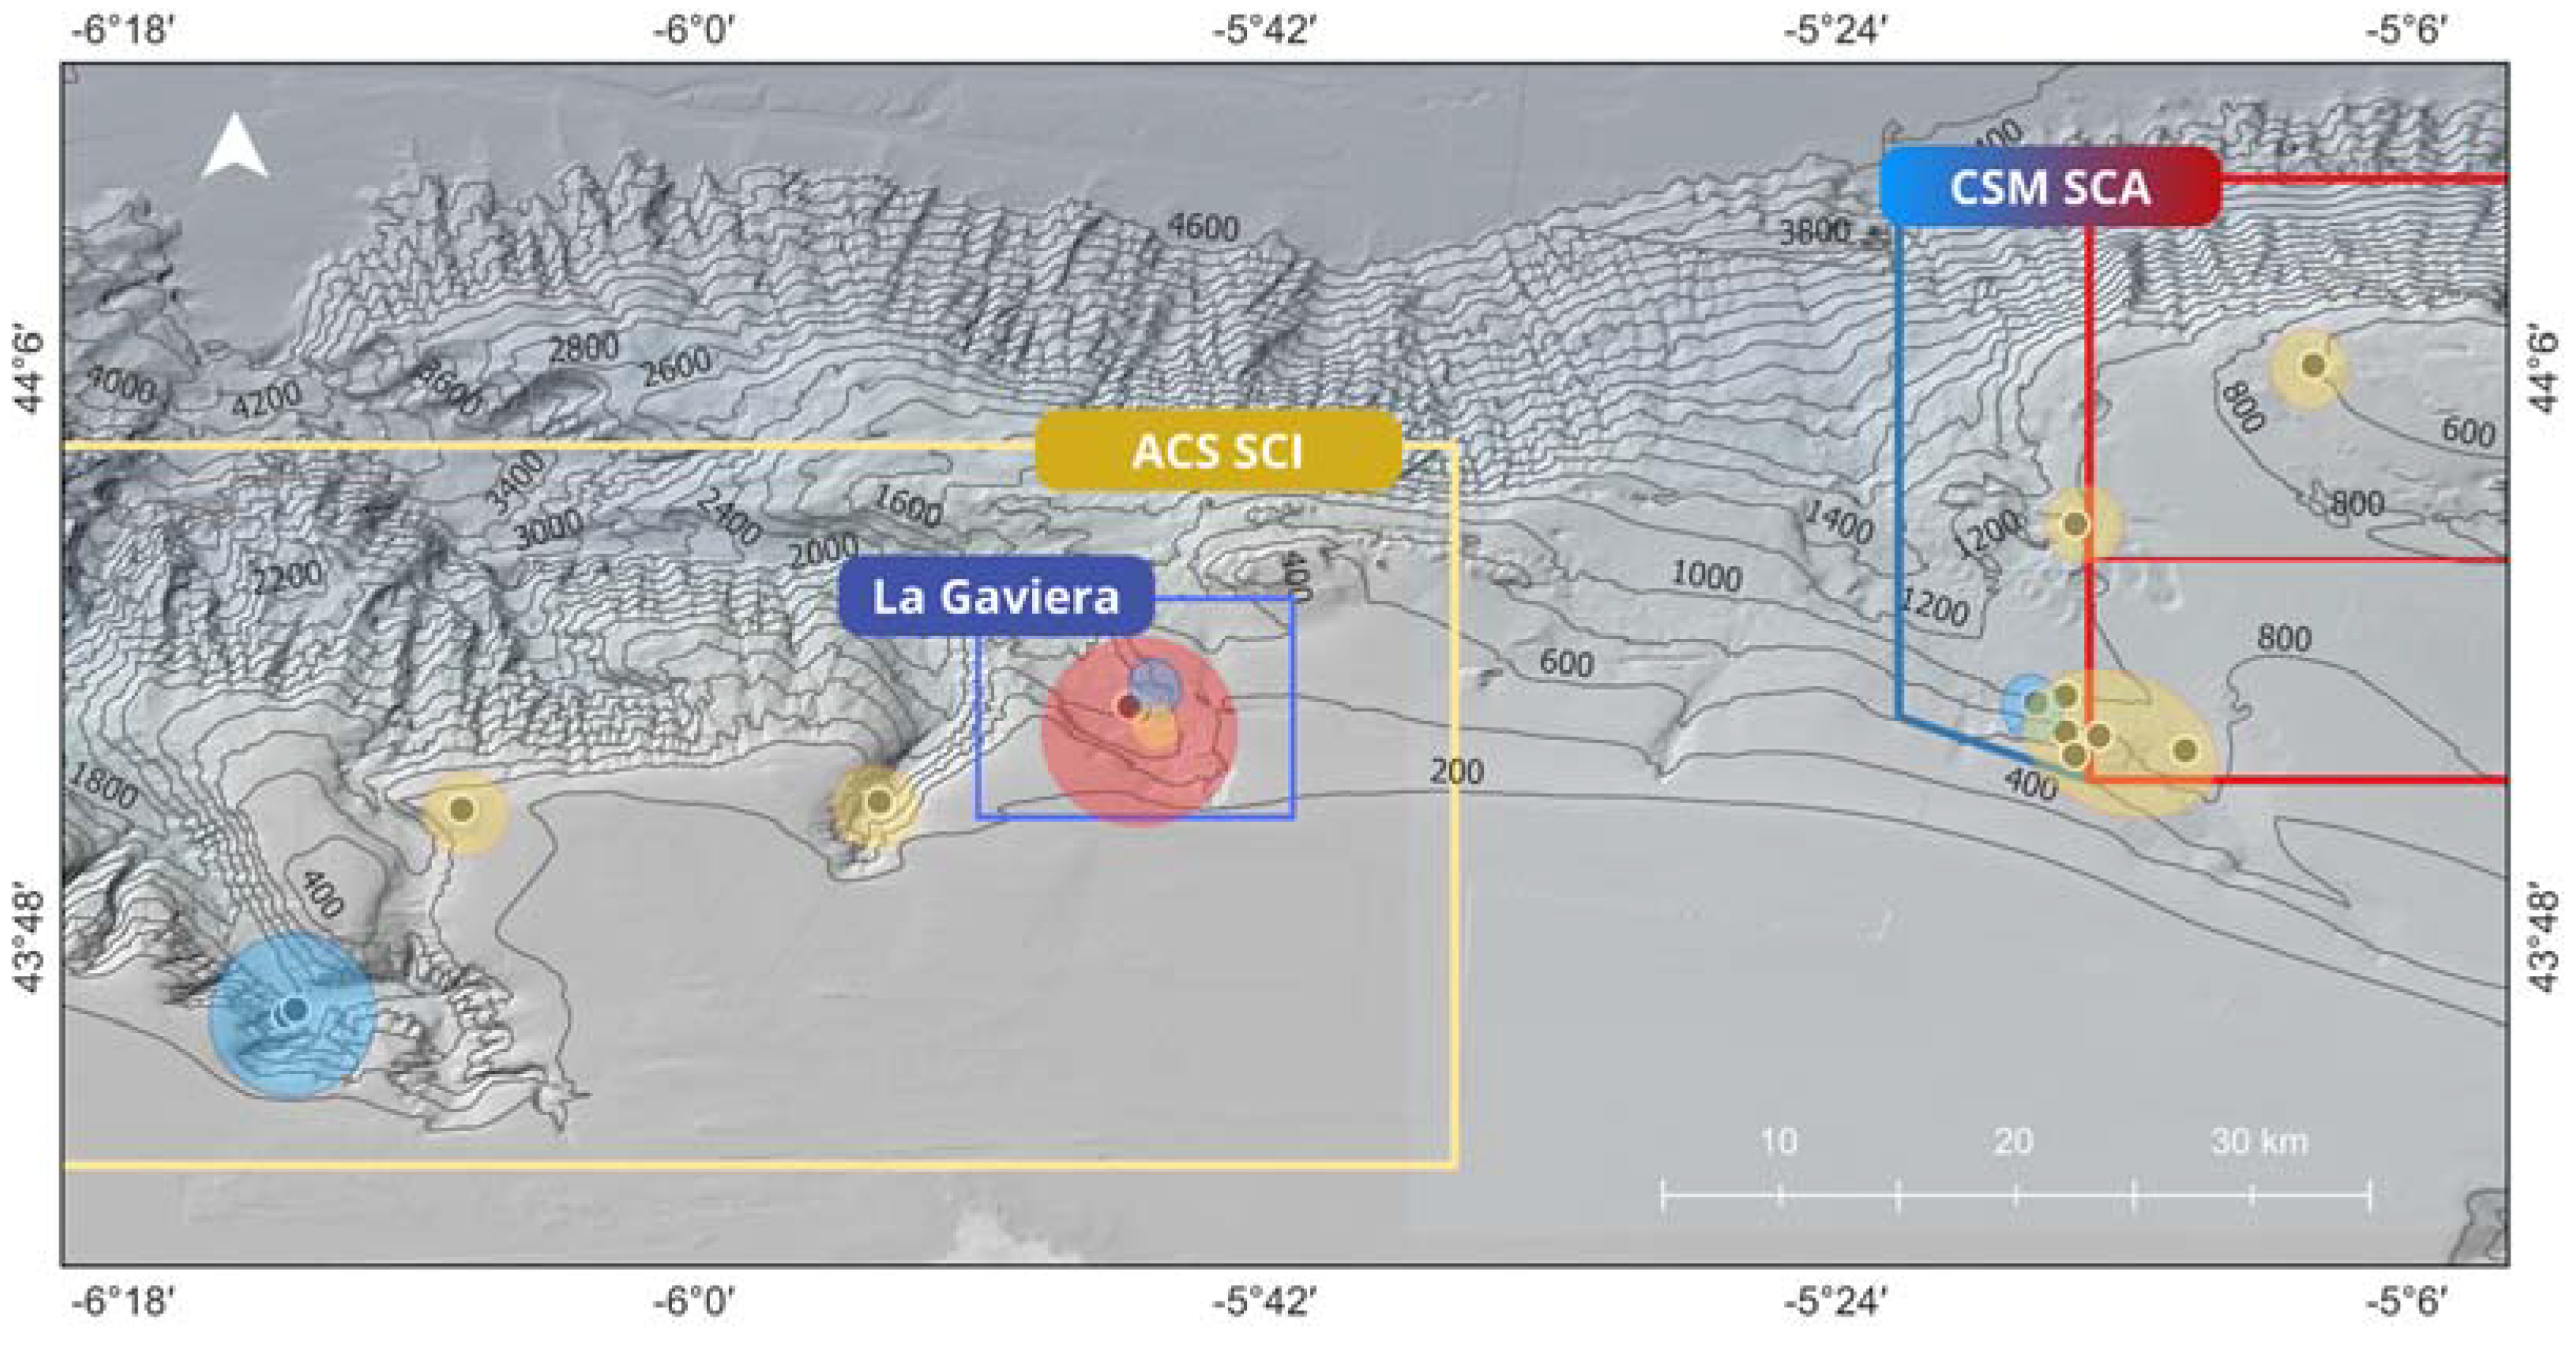
This study, framed within the INTEMARES project, focuses on two regions of the bathyal rocky outcrops in the Cantabrian Sea, south of the Bay of Biscay (
Figure 1): the Avilés Canyon System (ACS) and El Cachucho Seamount (CSM). These areas were selected due to their designation as vulnerable marine ecosystems (VMEs) and their harboring of benthic communities classified as habitat 1170 (Reefs) under the European Union Habitats Directive (92/43/EEC). Of particular interest within these communities are the cold-water coral reefs, which are a focal point of this research.
El Cachucho Seamount, designated a Marine Protected Area (MPA) and Special Area of Conservation (SAC) in 2011, is characterized by its complex geomorphology, featuring rocky outcrops and steep slopes [
15]. Its summit, known as Le Danois Bank, lies at 425 m depth and predominantly consists of rocky outcrops with sparse sediment cover, contrasting with its inner basin (800-1000 m), where sediment accumulation is higher [
4].
The ACS, a Site of Community Importance (SCI) and potential SAC within the Natura 2000 network, extends from the continental shelf to bathyal depths. It is characterized by rocky outcrops with diverse morphologies and relief, some of which exhibit tectonic activity [
16]. This complex geomorphology creates a diverse habitat that supports rich benthic biodiversity [
17,
18].
The presence of key reef-building species, such as
D. pertusum and
M. oculata, highlights their ecological importance [
19]. These white corals harbored a suite of associated fauna species such as bivalves, gastropods, echinoderms, sponges and worms and hosted breeding grounds for fished species. These species do not depend on living corals, but use the skeletal remains as a substrate for fixation or grazing on sessile invertebrates [
18] . The primary role of CWC reefs is to function as feeding grounds, refuges and as substrata for larval settlement, juvenile growth and as nursery areas. Furthermore, they contribute to the goods and services of the deep sea. Finally, the three-dimensional nature of these reefs increases the structural complexity of these ecosystems, making them particularly vulnerable and, therefore, deserving of special attention in terms of conservation [
20]. In the study area, both species co-occur at different depths.
D. pertusum, has been recorded in the Avilés Canyon System (ACS) in a bathymetric distribution range of 342–1473 m; in the NW Atlantic, this is the most abundant and widely distributed construction species.
M. oculata, in ACS, appears at 342–1660 m and is slow growing and very vulnerable to trawling; it has construction activity on the continental margins of Europe.
2.2. Data Acquisition
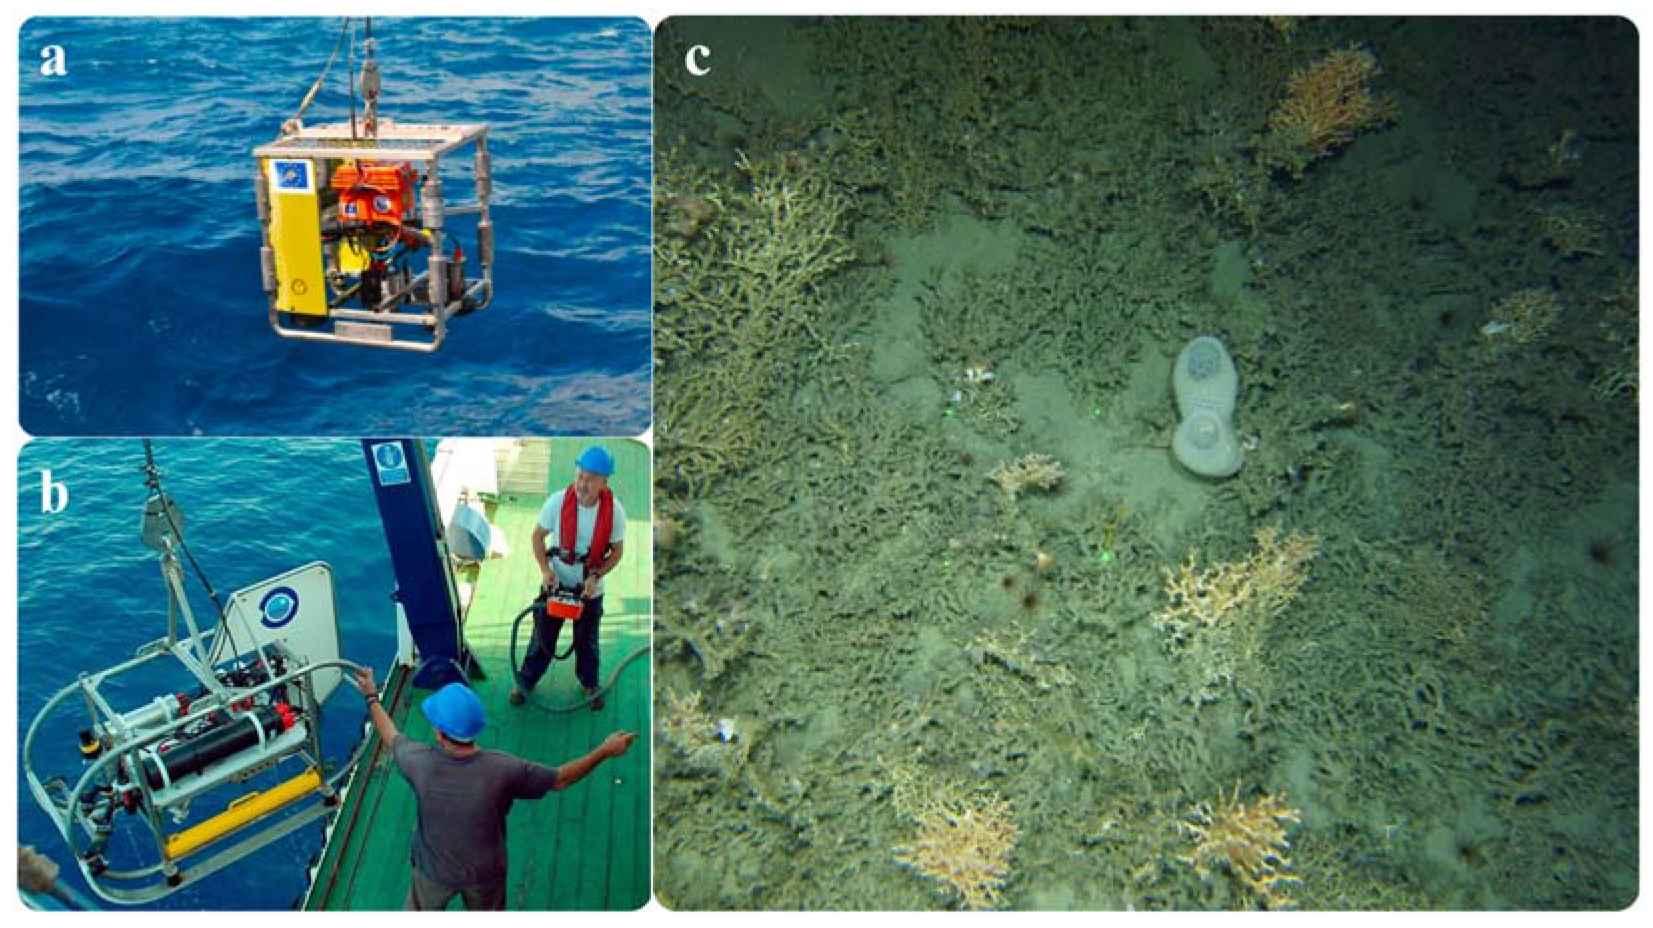
High-resolution underwater imagery was obtained using two remotely operated towed vehicles (ROTV): Politolana [
21] and TASIFE [
22]. These vehicles are capable of descending to depths of 2000 m and are equipped with a high-resolution camera, bidirectional telemetry, and an acoustic positioning system. The camera was oriented in a zenith position, capturing images of the seabed at five-second intervals, synchronized with environmental data to ensure the acquisition of comprehensive datasets during each dive.
A total of 19 transects were conducted on different dates in both study areas: 9 in the CSM and 10 in the ACS. To standardize data acquisition, the ROTV Politolana was maintained at a constant distance of 1.5 m from the seabed during all transects, each lasting 20 minutes and covering an average distance of 460 m. The samplings were conducted at depths ranging from 450 to 1200 m. The Avilés transects were associated with submarine canyon head areas, whereas most of the El Cachucho transects were located in areas adjacent to the seamount. This sampling approach provided a detailed view of the diversity of habitats and communities present in the study area, as well as an assessment of the influence of geomorphology and other environmental factors on species distribution.
2.3. Data Processing and Analysis
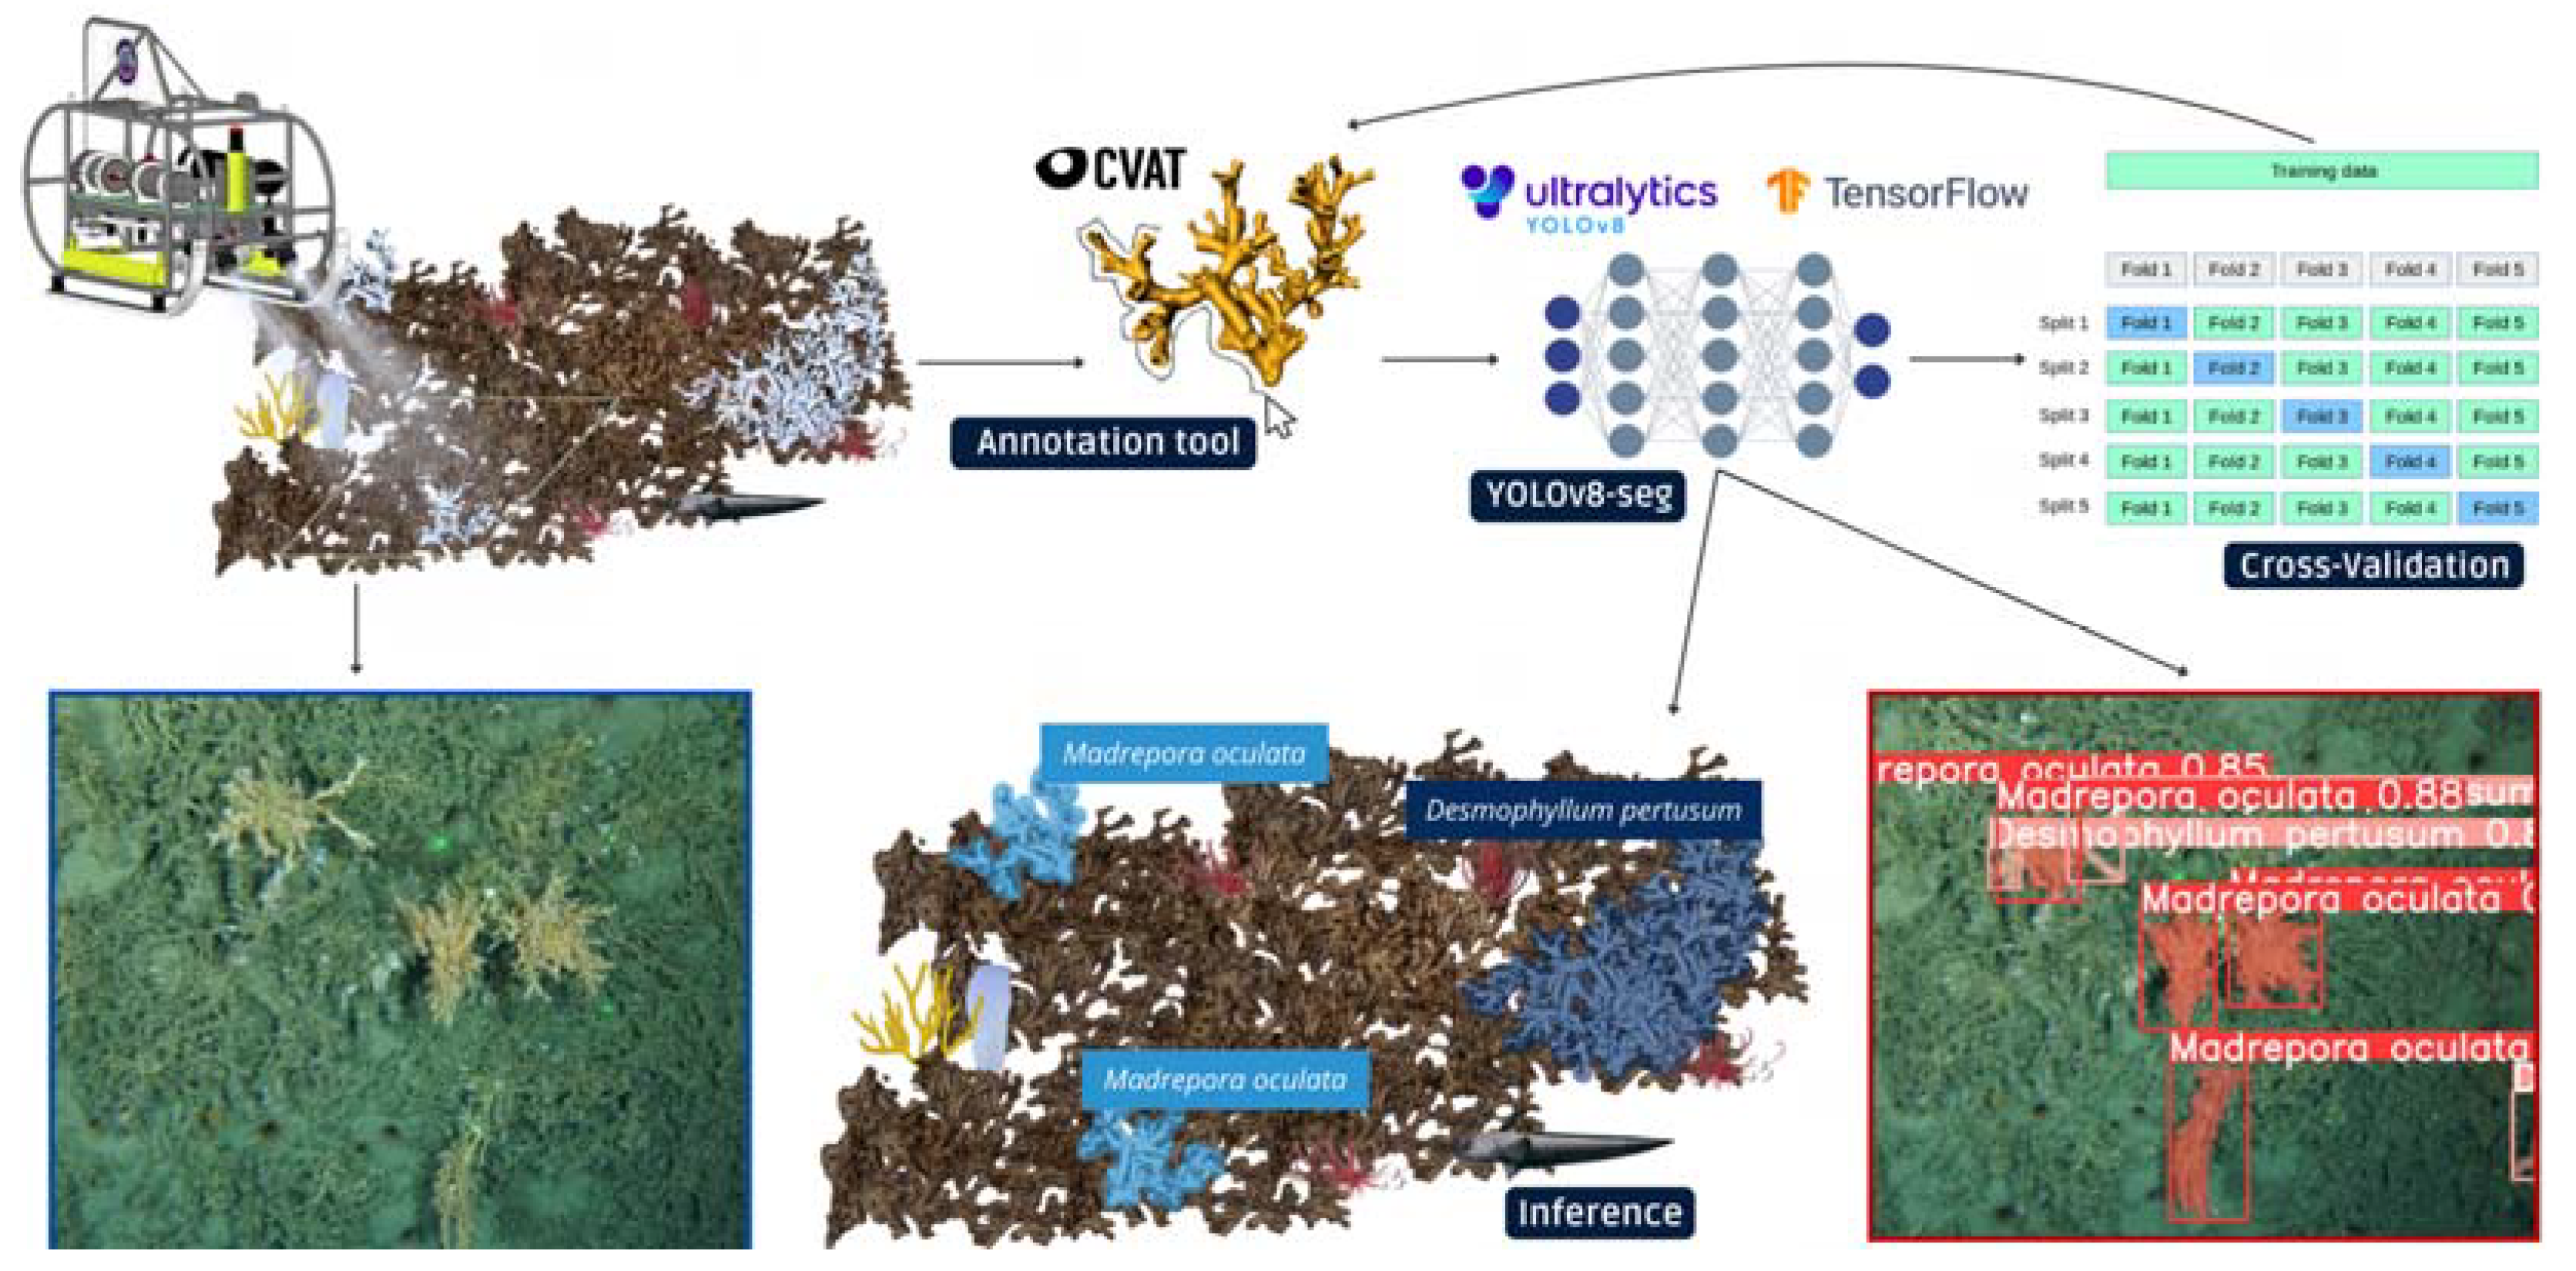
In this study, the YOLOv8l-seg model was employed for the detection and segmentation of the coral species
M. oculata and
D. pertusum (
Figure 3). YOLOv8l-seg is a state-of-the-art model characterized by its unified architecture, capable of performing both object detection and instance segmentation in a single process [
23]. This feature is crucial in the analysis of underwater imagery, where corals can exhibit complex shapes and be partially occluded by other elements in the environment. YOLOv8l-seg has demonstrated superior performance compared to previous YOLO versions and other object detection models, such as Faster R-CNN, in various computer vision applications [
24].
The YOLOv8l-seg architecture is based on a deep neural network composed of three main components:
Backbone (CSPDarknet53): This component is responsible for extracting relevant features from the input images at different scales. The CSPDarknet53 architecture has proven highly effective in feature extraction for object detection tasks.
Neck (Path Aggregation Network, PAN): This network combines the features extracted by the backbone at different scales, thereby enabling better detection of objects of various sizes. YOLOv8 utilizes a modified PAN structure to optimize this process.
Head: Perform final detection and segmentation predictions. In the case of YOLOv8l-seg, the head has two branches: one for object detection, predicting bounding boxes and object classes, and another for instance segmentation, generating accurate segmentation masks for each detected object.
The dataset used for model training and validation consisted of 670 coral images collected during various campaigns (see Acknowledgements) at Natura 2000 sites within the central Cantabrian region, representing a batch from each of the 19 transects conducted in the study areas. These images were manually labeled in YOLO format using the CVAT tool. The labeling process was optimized through an iterative approach that combined the training of an initial model with manual correction of the predictions generated by that model, utilizing the "auto_annotate" function of Ultralytics with a YOLOv8 model and SAM "mobile_sam.pt" [
25]. Annotations in COCO format were converted to YOLO PyTorch. Model training was performed for 500 epochs with an initial learning rate of 0.01, applying data augmentation techniques to enhance model generalization.
For validation, 20% of the images (128 images) were reserved as an independent validation dataset, and 5-fold cross-validation (K-Fold) was implemented. Model performance was evaluated using metrics such as precision (B, M), recall (B, M), F1 score (B, M), intersection over union (IoU), mAP50, mAP50-95, and fitness. The complete source code, weights, and example data are available at:
https://github.com/AlbertoGaya/cold-water-coral-reef/tree/main.
Using the data extracted from the YOLOv8l-seg model, a comprehensive analysis was conducted to assess coral cover and species distribution in the study areas. The mean percentage of area covered and the number of individuals per species and transect were calculated. Non-parametric statistical tests (Kruskal-Wallis and Dunn's test) were applied to compare coral cover between percentage areas and identify significant differences.
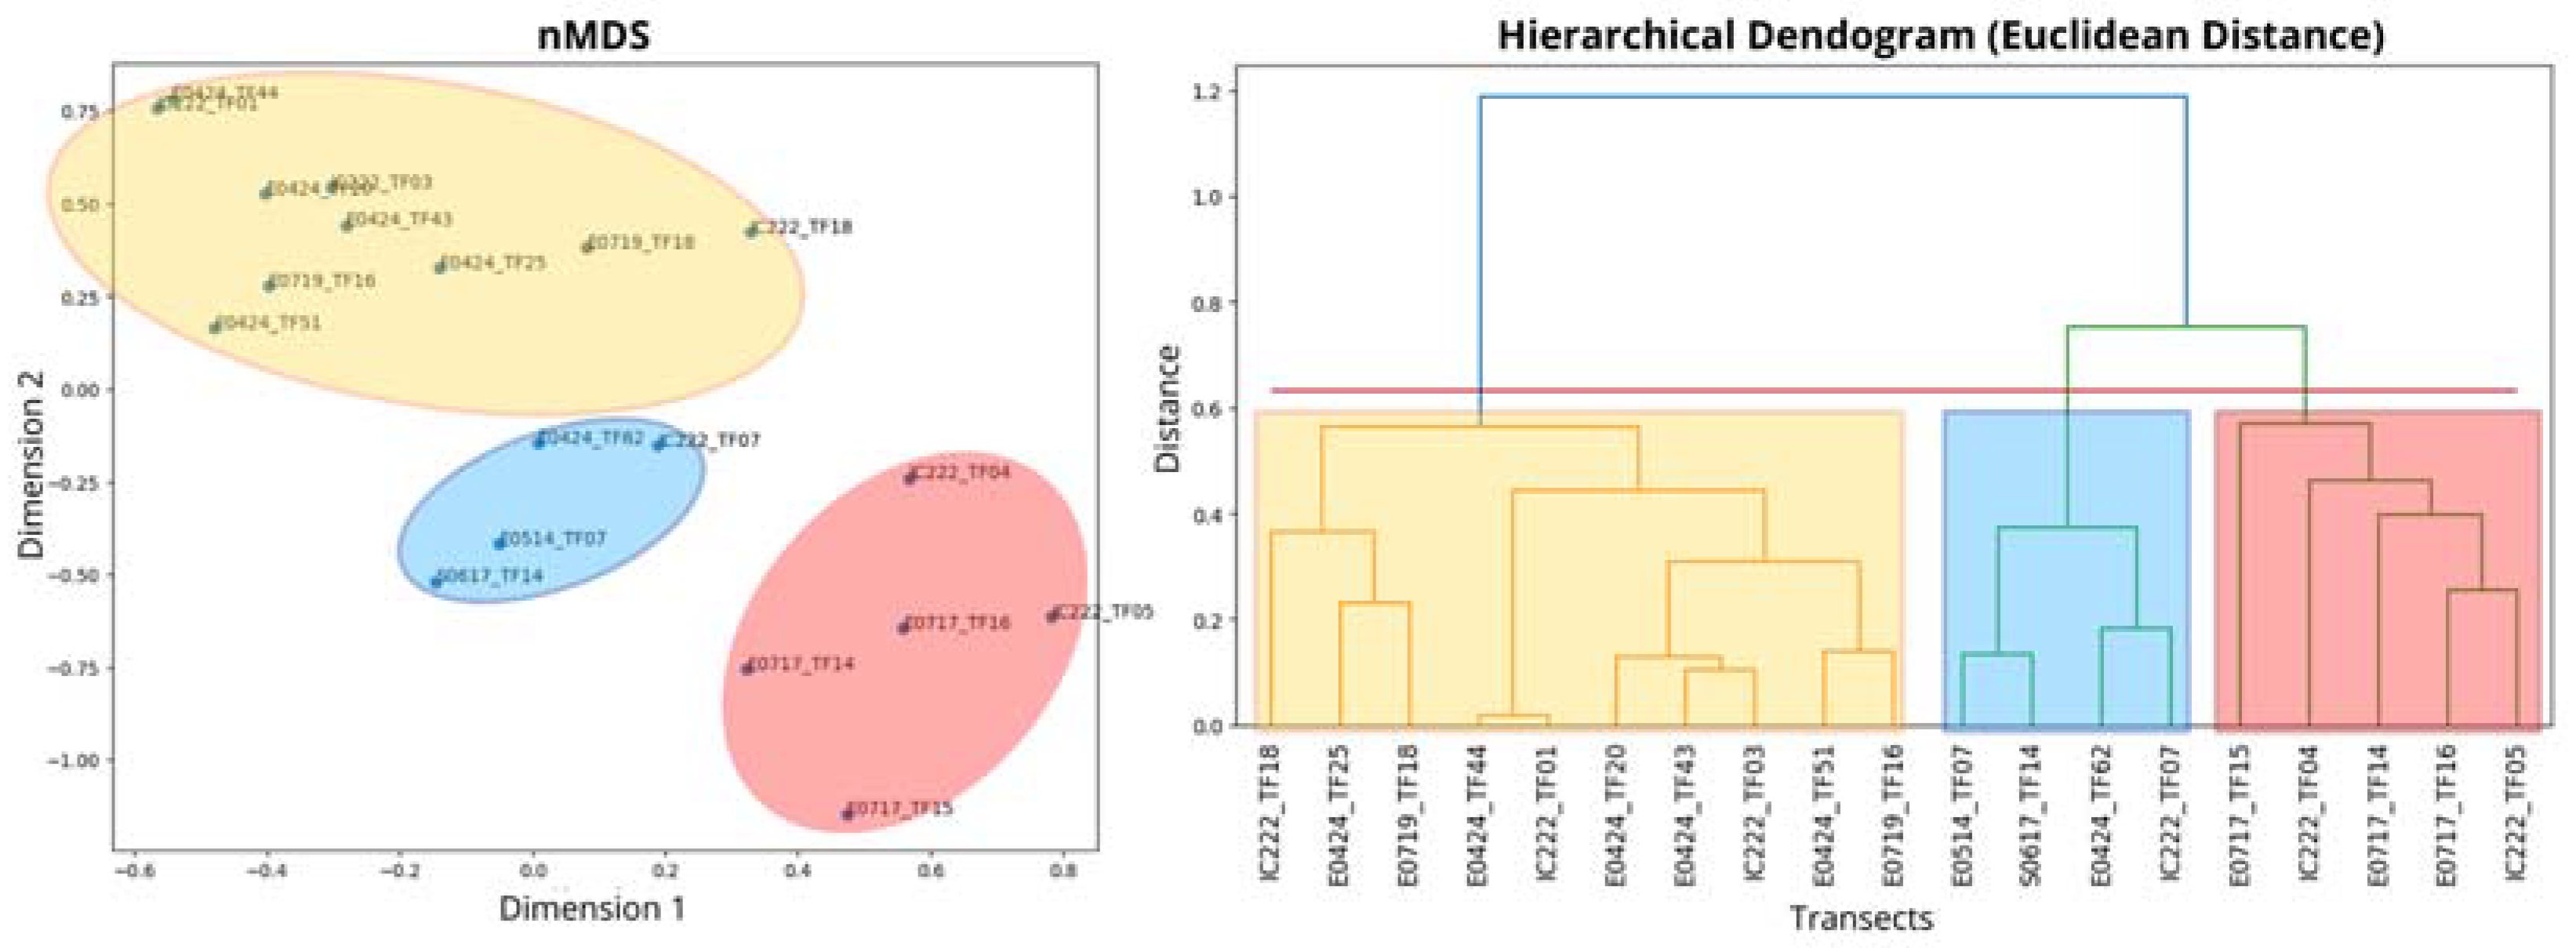
Additionally, non-metric multidimensional scaling (nMDS) was employed to visualize the similarity between transects based on coral reef composition, and hierarchical cluster analysis was used to group the most similar transects, with results presented on a map.
3. Results
3.1. Model Performance Evaluation
The YOLOv8l-seg model demonstrated robust performance in the detection and segmentation of the target coral species,
M. oculata and
D. pertusum. Validation results, both in 5-fold cross-validation and independent validation, are summarized in
Table 1.
In the independent validation, the model achieved even higher performance, highlighting its ability to generalize to unseen data. Notably, the model exhibited slightly superior performance in detecting and segmenting D. pertusum (P = 0.876, R = 0.810) compared to M. oculata (P = 0.804, R = 0.693).
Overall, the validation results support the effectiveness of the YOLOv8l-seg model in the automated detection and segmentation of cold-water corals in underwater imagery, suggesting its potential as a valuable tool for monitoring and assessing these vulnerable ecosystems.
3.2. Coral Cover Comparison Between Study Areas
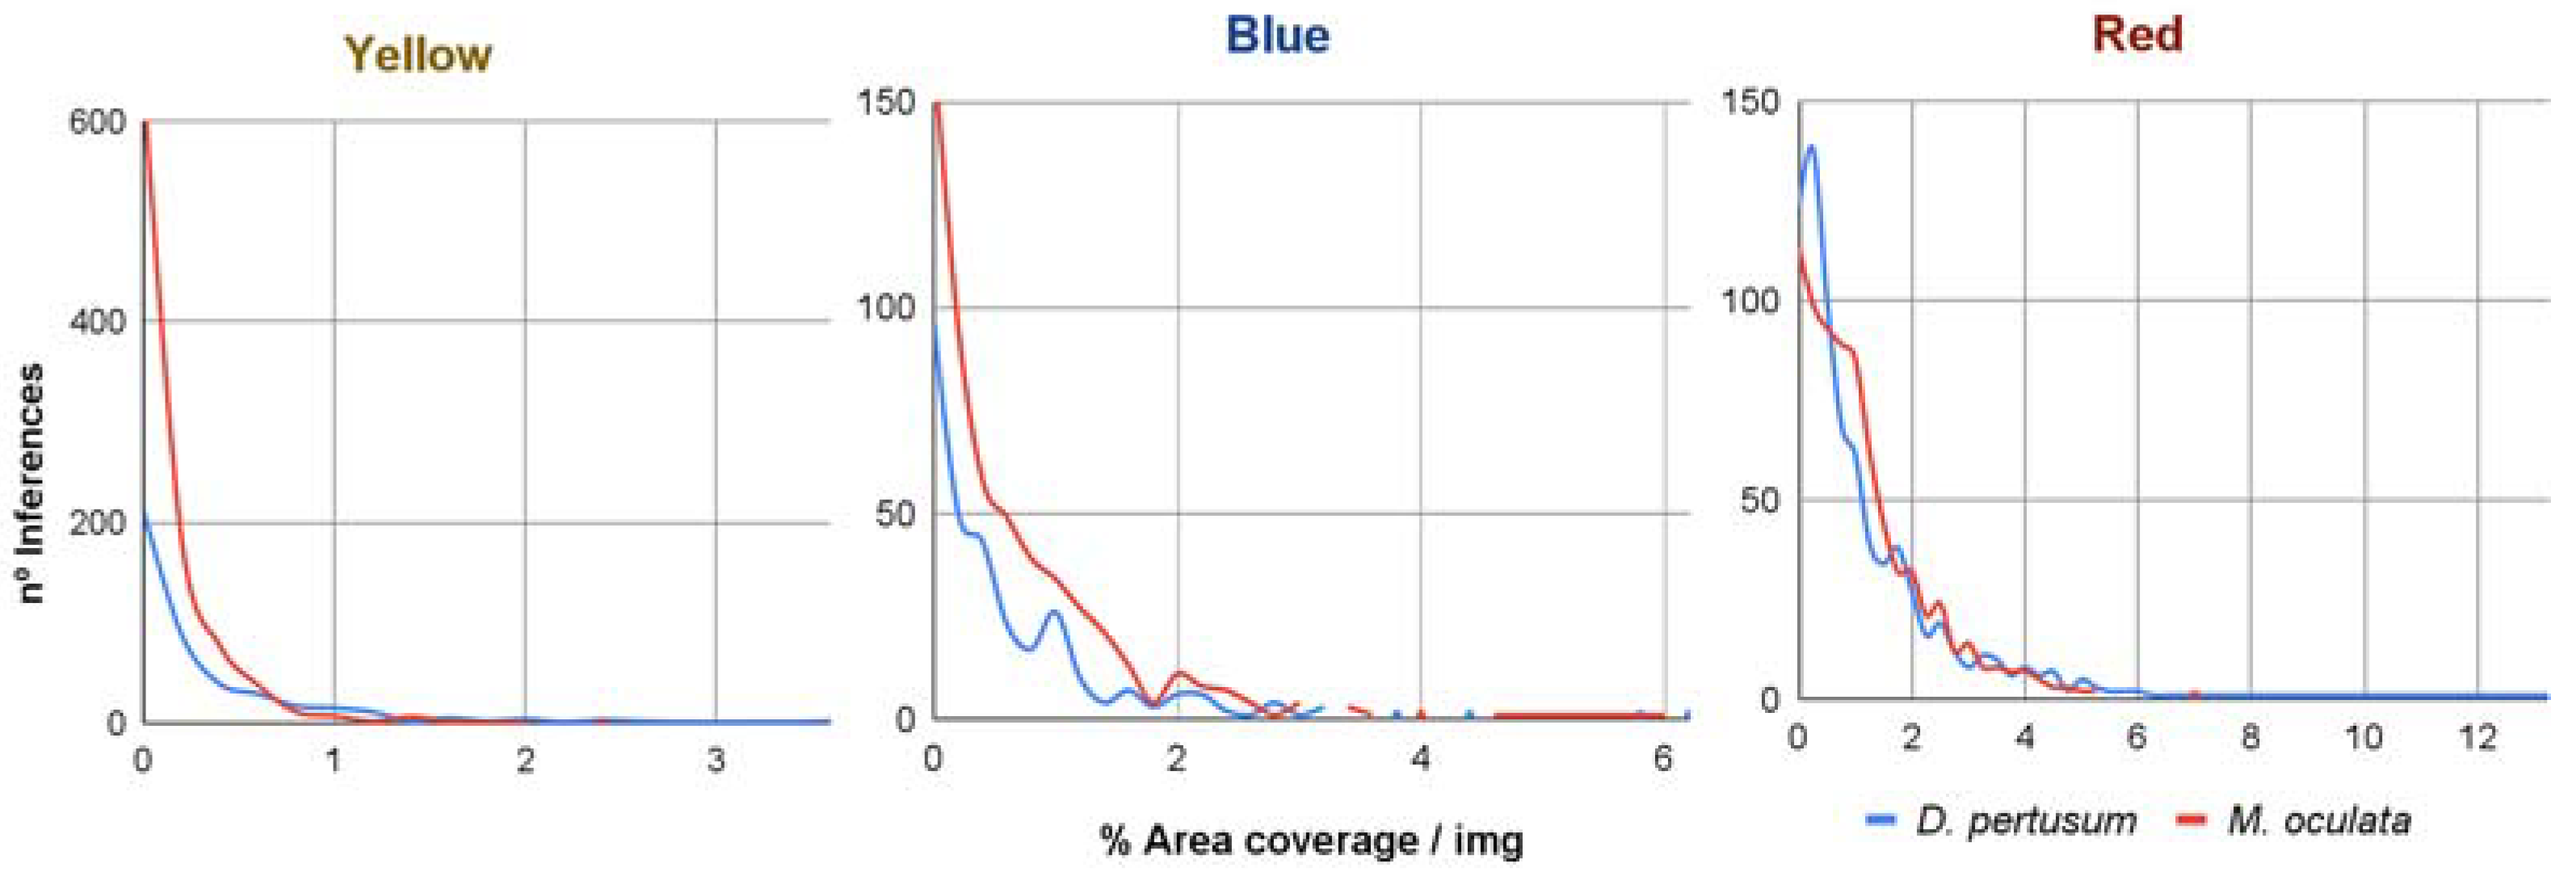
Descriptive analysis of the data revealed differences in coral cover among transects and study areas. The mean cover of D. pertusum was 0.56% ± 0.02% (range: 0-13.29%), while that of M. oculata was 0.40% ± 0.01% (range: 0-7.58%). The Kruskal-Wallis test confirmed significant differences in total coral cover both among transects (p < 0.001) and between CSM and ACS (p < 0.001), with higher cover in the latter.
Non-metric multidimensional scaling (nMDS) and hierarchical cluster analysis (
Figure 4) identified three distinct groups based on coral species composition, showing an increasing gradient of cover from group yellow to group red.
Group yellow, with the lowest coral cover (maximum 3% for
M. oculata), is mainly distributed in CSM. Group blue, with intermediate cover (maximum 6% for
D. pertusum), is found in both CSM and ACS. Group red, with the highest cover (maximum 13% for
M. oculata), is exclusively located in the La Gaviera canyon head within the ACS (
Figure 5).
4. Discussion
The results of this study demonstrate the effectiveness of deep learning models, such as YOLOv8l-seg, in the automated detection and segmentation of cold-water corals in underwater imagery. The high performance of the model in terms of precision, recall, and mAP (
Table 1) highlights its potential as a valuable tool for streamlining the monitoring and assessment of vulnerable ecosystems, overcoming the limitations of laborious manual annotation. These results are consistent with other studies that have successfully applied deep learning techniques for the automated identification of benthic fauna [
14,
24] and highlight the growing potential of these methods in marine ecological research.
Analysis of the data revealed significant variability in coral cover, not only among different transects, but also between the El Cachucho and Avilés areas. This discrepancy suggests that coral distribution is influenced by local factors, such as substrate density, curvature, and rugosity [
26], as evidenced in the La Gaviera canyon head, where particular environmental conditions appear to favor higher coral cover. The identification of three distinct groups of transects based on coral species composition (
Figure 4 and
Figure 5) supports this hypothesis, showing an increasing gradient of cover from group yellow to group red (La Gaviera).
Importantly, the observed variability in coral cover among nearby transects highlights the inherent difficulty of sampling these VMEs. Cold-water coral habitats often occur in discontinuous patches or are strongly delimited by specific conditions such as substrate type [
27], depth, slope, orientation [
28], and currents [
29]. The fragmented and localized nature of cold-water coral reefs, coupled with the technological and logistical constraints associated with deep-sea research [
30], makes it challenging to obtain a comprehensive and representative picture of the distribution and abundance of these species. In this regard, two transects conducted in La Gaviera, located in areas with conditions distinct from those of the reefs, exhibited very different coral cover values, reinforcing the notion of spatial heterogeneity in these ecosystems (
Figure 6). Interestingly, all the transects located below 650m belong to the yellow group. The red group, exclusively located in La Gaviera canyon head, has a mean depth of 773m, while the blue group ranges between 750 and 1200m. This suggests a potential depth gradient in coral cover, although the patchy nature of the transects and the limited sample size in different depth ranges requires further research to confirm this hypothesis.
The application of deep learning models like YOLOv8l-seg, along with the collection of detailed environmental and biological data, offers an opportunity to enhance our understanding and capacity to protect cold-water coral reefs. Integrating environmental data, such as temperature, salinity, and currents, into predictive models could help forecast the effects of climate change on these vulnerable ecosystems and develop adaptive management strategies.
It is important to acknowledge that this study focused on two key coral species
, D. pertusum and
M. oculata. Future studies should broaden the scope of automated detection and segmentation to include a wider range of benthic species, such as sponges and gorgonians, which also play a crucial role in the structure and function of cold-water coral ecosystems [
16].
Furthermore, integrating environmental data into the analysis of coral distribution could provide a deeper understanding of the factors driving variability in coral cover. Incorporating this data into predictive models could enhance our ability to anticipate the effects of climate change on these vulnerable ecosystems and develop adaptive management strategies.
Despite the promising results, this study has limitations, such as fluctuations in the ROTV altitude and the disparity in transect length and design. Developing tools to correct for variations in image scale and implementing more standardized sampling designs are areas for improvement in future research. Nevertheless, this study represents a significant advancement in the application of deep learning models for the study and monitoring of deep vulnerable marine ecosystems. Combining these techniques with improvements in data acquisition and processing will further enhance our understanding and protection of these valuable ecosystems.
5. Conclusions
Automated analysis of underwater imagery using YOLOv8l-seg has proven to be an effective tool for the detection and segmentation of cold-water coral species, facilitating the assessment and monitoring of these vulnerable ecosystems. Our results reveal significant variability in spatial coral cover, not only among geographically distinct areas but also between nearby transects within the same area, highlighting the inherently patchy and localized nature of these habitats. This heterogeneity underscores the challenges of sampling and monitoring cold-water coral reefs and emphasizes the need for comprehensive, high-resolution surveys to accurately assess their distribution and abundance. Additionally, the observed depth gradient in coral cover, with a potential optimum range, warrants further investigation to understand the underlying ecological drivers. Despite methodological limitations, this study provides valuable insights into the distribution of key species in Natura 2000 sites and lays the groundwork for future research integrating environmental data and expanding the range of species studied, thereby enhancing our ability to understand, manage, and conserve cold-water coral reefs.
Author Contributions
Alberto Gayá-Vilar: Conceptualization, Methodology, Software, Validation, Formal analysis, Investigation, Resources, Data curation, Writing – original draft preparation, Writing – review & editing, Visualization, Supervision, Project administration. Alberto Abad-Uribarren: Writing – review & editing, Validation, Investigation, Formal analysis, Data curation. Augusto Rodríguez-Basalo: Writing – review & editing, Visualization, Validation, Investigation, Formal analysis, Data curation. Pilar Ríos: Writing – review & editing, Validation, Investigation. Javier Cristobo: Writing – review & editing, Validation, Investigation. Elena Prado: Conceptualization, Resources, Data curation, Writing – review & editing, Supervision, Project administration, Funding acquisition.
Funding
This research was funded by the European Union's LIFE program through the LIFE IP INTEMARES project (LIFE15 IPE ES 012) and by BiodivProtect through the Biodiv_A3 project under the MTC230301 grant. The APC was funded by the LIFE IP INTEMARES project (LIFE15 IPE ES 012), specifically through its C2.1 action focused on developing new methodologies for monitoring MPAs.
Institutional Review Board Statement
Ethical review and approval were waived for this study due to the fact that it involved the analysis of remotely operated underwater vehicle (ROTV) imagery of the seabed in offshore Natura 2000 areas, and did not involve any direct interaction or manipulation of human or animal subjects.
Informed Consent Statement
Not applicable.
Data Availability Statement
Acknowledgments
The authors would like to thank the crew and scientific team aboard the R/V Ramón Margalef and Angeles Alvariño from the Spanish Institute of Oceanography, as well as the technicians of the ROTV Politolana and Tasife for their skillful execution of the challenging visual transects in the study area. This research was conducted within the framework of action C.2.1 of the INTEMARES project, which focuses on the development of new monitoring methodologies for marine protected areas. The INTEMARES project was partially funded by the European Commission LIFE + "Nature and Biodiversity" call (LIFE15 IPE ES 012). The authors also acknowledge the support from the iMagine project (funded by the European Union Horizon Europe Programme – Grant Agreement number 101058625).
Conflicts of Interest
The authors declare no conflicts of interest. The funders had no role in the design of the study; in the collection, analyses, or interpretation of data; in the writing of the manuscript; or in the decision to publish the results.
References
- Food and Agriculture Organization of the United Nations (FAO). International Guidelines for the Management of Deep-sea Fisheries in the High Seas; FAO: Rome, 2009; p. 73. [Google Scholar]
- Henry, L.-A.; Roberts, J.M. Global Biodiversity in Cold-Water Coral Reef Ecosystems. In Marine Animal Forests: The Ecology of Benthic Biodiversity Hotspots; Rossi, S., Bramanti, L., Gori, A., Orejas, C., Eds.; Springer International Publishing: Cham, 2017; pp. 235–256. [Google Scholar] [CrossRef]
- Rowden, A.A.; Schlacher, T.A.; Williams, A.; Clark, M.R.; Stewart, R.; Althaus, F.; Bowden, D.A.; Consalvey, M.; Robinson, W.; Dowdney, J. A Test of the Seamount Oasis Hypothesis: Seamounts Support Higher Epibenthic Megafaunal Biomass than Adjacent Slopes. Mar. Ecol. 2010, 31, 95–106. [Google Scholar] [CrossRef]
- Fernandez-Arcaya, U.; Ramirez-Llodra, E.; Aguzzi, J.; Allcock, A.L.; Davies, J.S.; Dissanayake, A.; Harris, P.; Howell, K.; Huvenne, V.A.I.; Macmillan-Lawler, M.; Martín, J.; Menot, L.; Nizinski, M.; Puig, P.; Rowden, A.A.; Sanchez, F.; Van den Beld, I.M.J. Ecological Role of Submarine Canyons and Need for Canyon Conservation: A Review. Front. Mar. Sci. 2017, 4. [Google Scholar] [CrossRef]
- Bourque, J.R.; Demopoulos, A.W.J. The Influence of Different Deep-Sea Coral Habitats on Sediment Macrofaunal Community Structure and Function. PeerJ 2018, 6, e5276. [Google Scholar] [CrossRef] [PubMed]
- Oevelen, D.; Duineveld, G.; Lavaleye, M.; Mienis, F.; Soetaert, K.; Heip, C. The Cold-Water Coral Community as Hotspot of Carbon Cycling on Continental Margins: A Food-Web Analysis from Rockall Bank (Northeast Atlantic). Limnol. Oceanogr. 2009, 54, 1829–1844. [Google Scholar] [CrossRef]
- Buhl-Mortensen, L.; Vanreusel, A.; Gooday, A.J.; Levin, L.A.; Priede, I.G.; Buhl-Mortensen, P.; Gheerardyn, H.; King, N.J.; Raes, M. Biological Structures as a Source of Habitat Heterogeneity and Biodiversity on the Deep Ocean Margins. Mar. Ecol. 2010, 31, 21–50. [Google Scholar] [CrossRef]
- Orejas, C.; Gori, A.; Rad-Menéndez, C.; Last, K.S.; Davies, A.J.; Beveridge, C.M.; Sadd, D.; Kiriakoulakis, K.; Witte, U.; Roberts, J.M. The Effect of Flow Speed and Food Size on the Capture Efficiency and Feeding Behaviour of the Cold-Water Coral Lophelia Pertusa. J. Exp. Mar. Biol. Ecol. 2016, 481, 34–40. [Google Scholar] [CrossRef]
- Cordes, E.E.; Demopoulos, A.W.J.; Davies, A.J.; Gasbarro, R.; Rhoads, A.C.; Lobecker, E.; Sowers, D.; Chaytor, J.D.; Morrison, C.L.; Weinnig, A.M.; Brooke, S.; Lunden, J.J.; Mienis, F.; Joye, S.B.; Quattrini, A.M.; Sutton, T.T.; McFadden, C.S.; Bourque, J.R.; McClain-Counts, J.P.; Andrews, B.D.; Betters, M.J.; Etnoyer, P.J.; Wolff, G.A.; Bernard, B.B.; Brooks, J.M.; Rasser, M.K.; Adams, C. Expanding Our View of the Cold-Water Coral Niche and Accounting of the Ecosystem Services of the Reef Habitat. Sci. Rep. 2023, 13, 19482. [Google Scholar] [CrossRef] [PubMed]
- Pinheiro, M.; Martins, I.; Raimundo, J.; Caetano, M.; Neuparth, T.; Santos, M.M. Stressors of Emerging Concern in Deep-Sea Environments: Microplastics, Pharmaceuticals, Personal Care Products and Deep-Sea Mining. Sci. Total Environ. 2023, 876, 162557. [Google Scholar] [CrossRef] [PubMed]
- Morato, T.; González-Irusta, J.-M.; Dominguez-Carrió, C.; Wei, C.-L.; Davies, A.; Sweetman, A.K.; Taranto, G.H.; Beazley, L.; García-Alegre, A.; Grehan, A.; Laffargue, P.; Murillo, F.J.; Sacau, M.; Vaz, S.; Kenchington, E.; Arnaud-Haond, S.; Callery, O.; Chimienti, G.; Cordes, E.; Egilsdottir, H.; Freiwald, A.; Gasbarro, R.; Gutiérrez-Zárate, C.; Gianni, M.; Gilkinson, K.; Wareham Hayes, V.E.; Hebbeln, D.; Hedges, K.; Henry, L.-A.; Johnson, D.; Koen-Alonso, M.; Lirette, C.; Mastrototaro, F.; Menot, L.; Molodtsova, T.; Durán Muñoz, P.; Orejas, C.; Pennino, M.G.; Puerta, P.; Ragnarsson, S.Á.; Ramiro-Sánchez, B.; Rice, J.; Rivera, J.; Roberts, J.M.; Ross, S.W.; Rueda, J.L.; Sampaio, Í.; Snelgrove, P.; Stirling, D.; Treble, M.A.; Urra, J.; Vad, J.; van Oevelen, D.; Watling, L.; Walkusz, W.; Wienberg, C.; Woillez, M.; Levin, L.A.; Carreiro-Silva, M. Climate-Induced Changes in the Suitable Habitat of Cold-Water Corals and Commercially Important Deep-Sea Fishes in the North Atlantic. Glob. Change Biol. 2020, 26, 2181–2202. [Google Scholar] [CrossRef] [PubMed]
- Nawarathne, M.; Kumari, H.M.L.S.; Herath Mudiyanselage, N. Comparative Analysis of Jellyfish Classification: A Study Using YOLOv8 and Pre-Trained Models; 2024; p 6. [CrossRef]
- Li, J.; Xu, W.; Deng, L.; Xiao, Y.; Han, Z.; Zheng, H. Deep Learning for Visual Recognition and Detection of Aquatic Animals: A Review. Rev. Aquac. 2023, 15, 409–433. [Google Scholar] [CrossRef]
- Clark, H.P.; Smith, A.G.; Fletcher, D.M.; Larsson, A.I.; Jaspars, M.; Clippele, L.H.D. New Interactive Machine Learning Tool for Marine Image Analysis. bioRxiv October 16, 2023, p 2023.10.12.562046. [CrossRef]
- Rodríguez-Basalo, A.; Sánchez, F.; Punzón, A.; Gómez-Ballesteros, M. Updating the Master Management Plan for El Cachucho MPA (Cantabrian Sea) Using a Spatial Planning Approach. Cont. Shelf Res. 2019, 184, 54–65. [Google Scholar] [CrossRef]
- Gómez-Ballesteros, M.; Druet Vélez, M.; Muñoz, A.; Arrese-González, B.; Rivera, J.; Sánchez-Delgado, F.; Cristobo, J.; Parra-Descalzo, S.; García-Alegre, A.; González-Pola, C.; Gallastegui, J.; Acosta-Yepes, J. Geomorphology of the Avilés Canyon System, Cantabrian Sea (BayofBiscay). 2014. [CrossRef]
- Altuna, Á.; Ríos, P. Scleractinia (Cnidaria: Anthozoa) from INDEMARES 2010–2012 Expeditions to the Avilés Canyon System (Bay of Biscay, Spain, Northeast Atlantic). Helgol. Mar. Res. 1 2014, 68, 399–430. [Google Scholar] [CrossRef]
- Ríos, P.; Altuna, Á.; Frutos, I.; Manjón-Cabeza, E.; García-Guillén, L.; Macías-Ramírez, A.; Ibarrola, T.P.; Gofas, S.; Taboada, S.; Souto, J.; Álvarez, F.; Saiz-Salinas, J.I.; Cárdenas, P.; Rodríguez-Cabello, C.; Lourido, A.; Boza, C.; Rodríguez-Basalo, A.; Prado, E.; Abad-Uribarren, A.; Parra, S.; Sánchez, F.; Cristobo, J. Avilés Canyon System: Increasing the Benthic Biodiversity Knowledge. Estuar. Coast. Shelf Sci. 2022, 274, 107924. [Google Scholar] [CrossRef]
- García-Alegre, A.; Sánchez, F.; Gómez-Ballesteros, M.; Hinz, H.; Serrano, A.; Parra, S. Modelling and Mapping the Local Distribution of Representative Species on the Le Danois Bank, El Cachucho Marine Protected Area (Cantabrian Sea). Deep Sea Res. Part II Top. Stud. Oceanogr. 2014, 106, 151–164. [Google Scholar] [CrossRef]
- Price, D.M.; Robert, K.; Callaway, A.; Lo lacono, C.; Hall, R.A.; Huvenne, V.A.I. Using 3D Photogrammetry from ROV Video to Quantify Cold-Water Coral Reef Structural Complexity and Investigate Its Influence on Biodiversity and Community Assemblage. Coral Reefs 2019, 38, 1007–1021. [Google Scholar] [CrossRef]
- Sánchez, F.; Rodríguez, J.M. POLITOLANA, a New Low Cost Towed Vehicle Designed for the Characterization of the Deep-Sea Floor. Instrum. Viewp. 2013, 69. [Google Scholar]
- Martín-García, L.; Prado, E.; Falcón, J.M.; González Porto, M.; Punzón, A.; Martín-Sosa, P. Population Structure of Asconema Setubalense Kent, 1870 at Concepción Seamount, Canary Islands (Spain). Methodological Approach Using Non-Invasive Techniques. Deep Sea Res. Part 1 Oceanogr. Res. Pap. 2022, 185, 103775. [Google Scholar] [CrossRef]
- Terven, J.; Cordova-Esparza, D. A Comprehensive Review of YOLO Architectures in Computer Vision: From YOLOv1 to YOLOv8 and YOLO-NAS. Mach. Learn. Knowl. Extr. 2023, 5, 1680–1716. [Google Scholar] [CrossRef]
- Gayá-Vilar, A.; Cobo, A.; Abad-Uribarren, A.; Rodríguez, A.; Sierra, S.; Clemente, S.; Prado, E. High-Resolution Density Assessment Assisted by Deep Learning of Dendrophyllia Cornigera (Lamarck, 1816) and Phakellia Ventilabrum (Linnaeus, 1767) in Rocky Circalittoral Shelf of Bay of Biscay. PeerJ 2024, 12, e17080. [Google Scholar] [CrossRef] [PubMed]
- Kirillov, A.; Mintun, E.; Ravi, N.; Mao, H.; Rolland, C.; Gustafson, L.; Xiao, T.; Whitehead, S.; Berg, A.C.; Lo, W.-Y.; Dollár, P.; Girshick, R. Segment Anything. arXiv April 5, 2023. [CrossRef]
- Prado, E.; Rodríguez-Basalo, A.; Cobo, A.; Ríos, P.; Sánchez, F. 3D Fine-Scale Terrain Variables from Underwater Photogrammetry: A New Approach to Benthic Microhabitat Modeling in a Circalittoral Rocky Shelf. Remote Sens. 2020, 12, 2466. [Google Scholar] [CrossRef]
- Somoza, L.; Ercilla, G.; Urgorri, V.; León, R.; Medialdea, T.; Paredes, M.; Gonzalez, F.J.; Nombela, M.A. Detection and Mapping of Cold-Water Coral Mounds and Living Lophelia Reefs in the Galicia Bank, Atlantic NW Iberia Margin. Mar. Geol. 2014, 349, 73–90. [Google Scholar] [CrossRef]
- Vinha, B.; Murillo, F.J.; Schumacher, M.; Hansteen, T.H.; Schwarzkopf, F.U.; Biastoch, A.; Kenchington, E.; Piraino, S.; Orejas, C.; Huvenne, V.A.I. Ensemble Modelling to Predict the Distribution of Vulnerable Marine Ecosystems Indicator Taxa on Data-Limited Seamounts of Cabo Verde (NW Africa). Divers. Distrib. 2024, 30, e13896. [Google Scholar] [CrossRef]
- Prado, E.; Abad-Uribarren, A.; Ramo, R.; Sierra, S.; González-Pola, C.; Cristobo, J.; Ríos, P.; Graña, R.; Aierbe, E.; Rodríguez, J.M.; Rodríguez-Cabello, C.; Modica, L.; Rodríguez-Basalo, A.; Sánchez, F. Describing Polyps Behavior of a Deep-Sea Gorgonian, Placogorgia Sp., Using a Deep-Learning Approach. Remote Sens. 2023, 15, 2777. [Google Scholar] [CrossRef]
- Šiaulys, A.; Vaičiukynas, E.; Medelytė, S.; Buškus, K. Coverage Estimation of Benthic Habitat Features by Semantic Segmentation of Underwater Imagery from South-Eastern Baltic Reefs Using Deep Learning Models. Oceanologia 2024, 66, 286–298. [Google Scholar] [CrossRef]
|
Disclaimer/Publisher’s Note: The statements, opinions and data contained in all publications are solely those of the individual author(s) and contributor(s) and not of MDPI and/or the editor(s). MDPI and/or the editor(s) disclaim responsibility for any injury to people or property resulting from any ideas, methods, instructions or products referred to in the content. |
© 2024 by the authors. Licensee MDPI, Basel, Switzerland. This article is an open access article distributed under the terms and conditions of the Creative Commons Attribution (CC BY) license (http://creativecommons.org/licenses/by/4.0/).
