Submitted:
09 August 2024
Posted:
12 August 2024
You are already at the latest version
Abstract

Keywords:
1. Introduction
2. Materials and Methods
3.1. Raw Materials
3.2. Zeolite Synthesis
3.3. Characterization Techniques
3. Results and Discussion
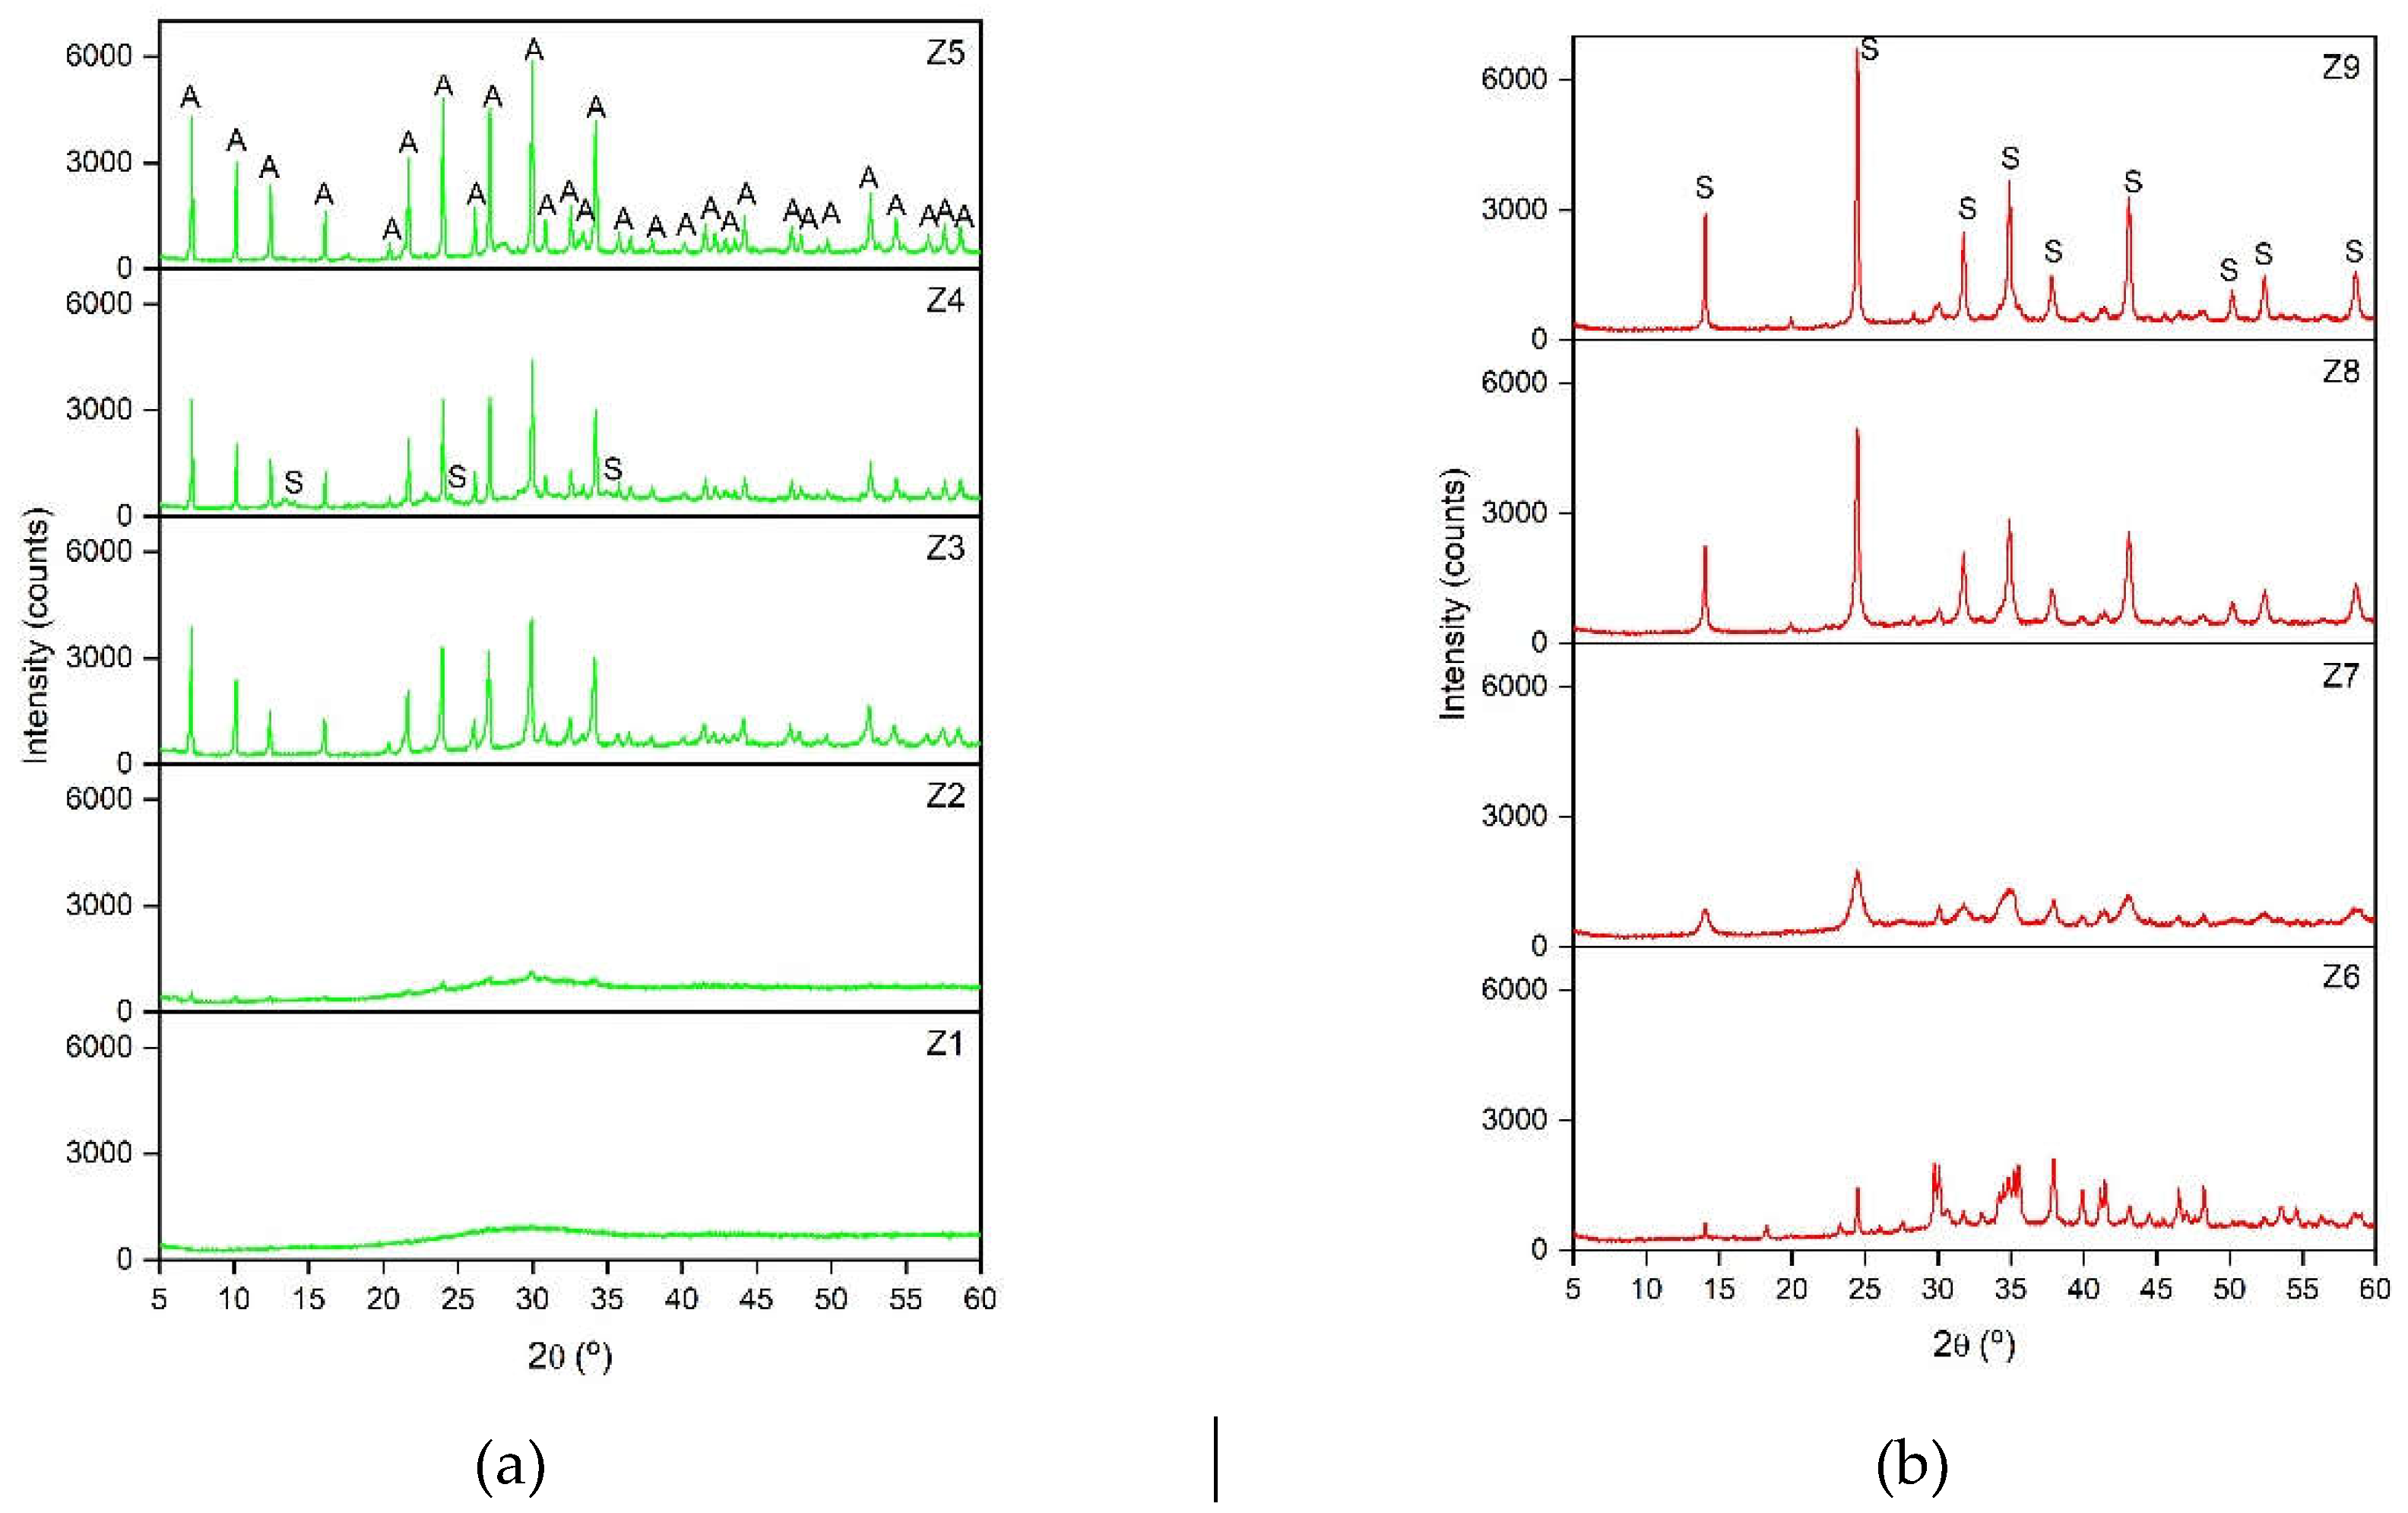
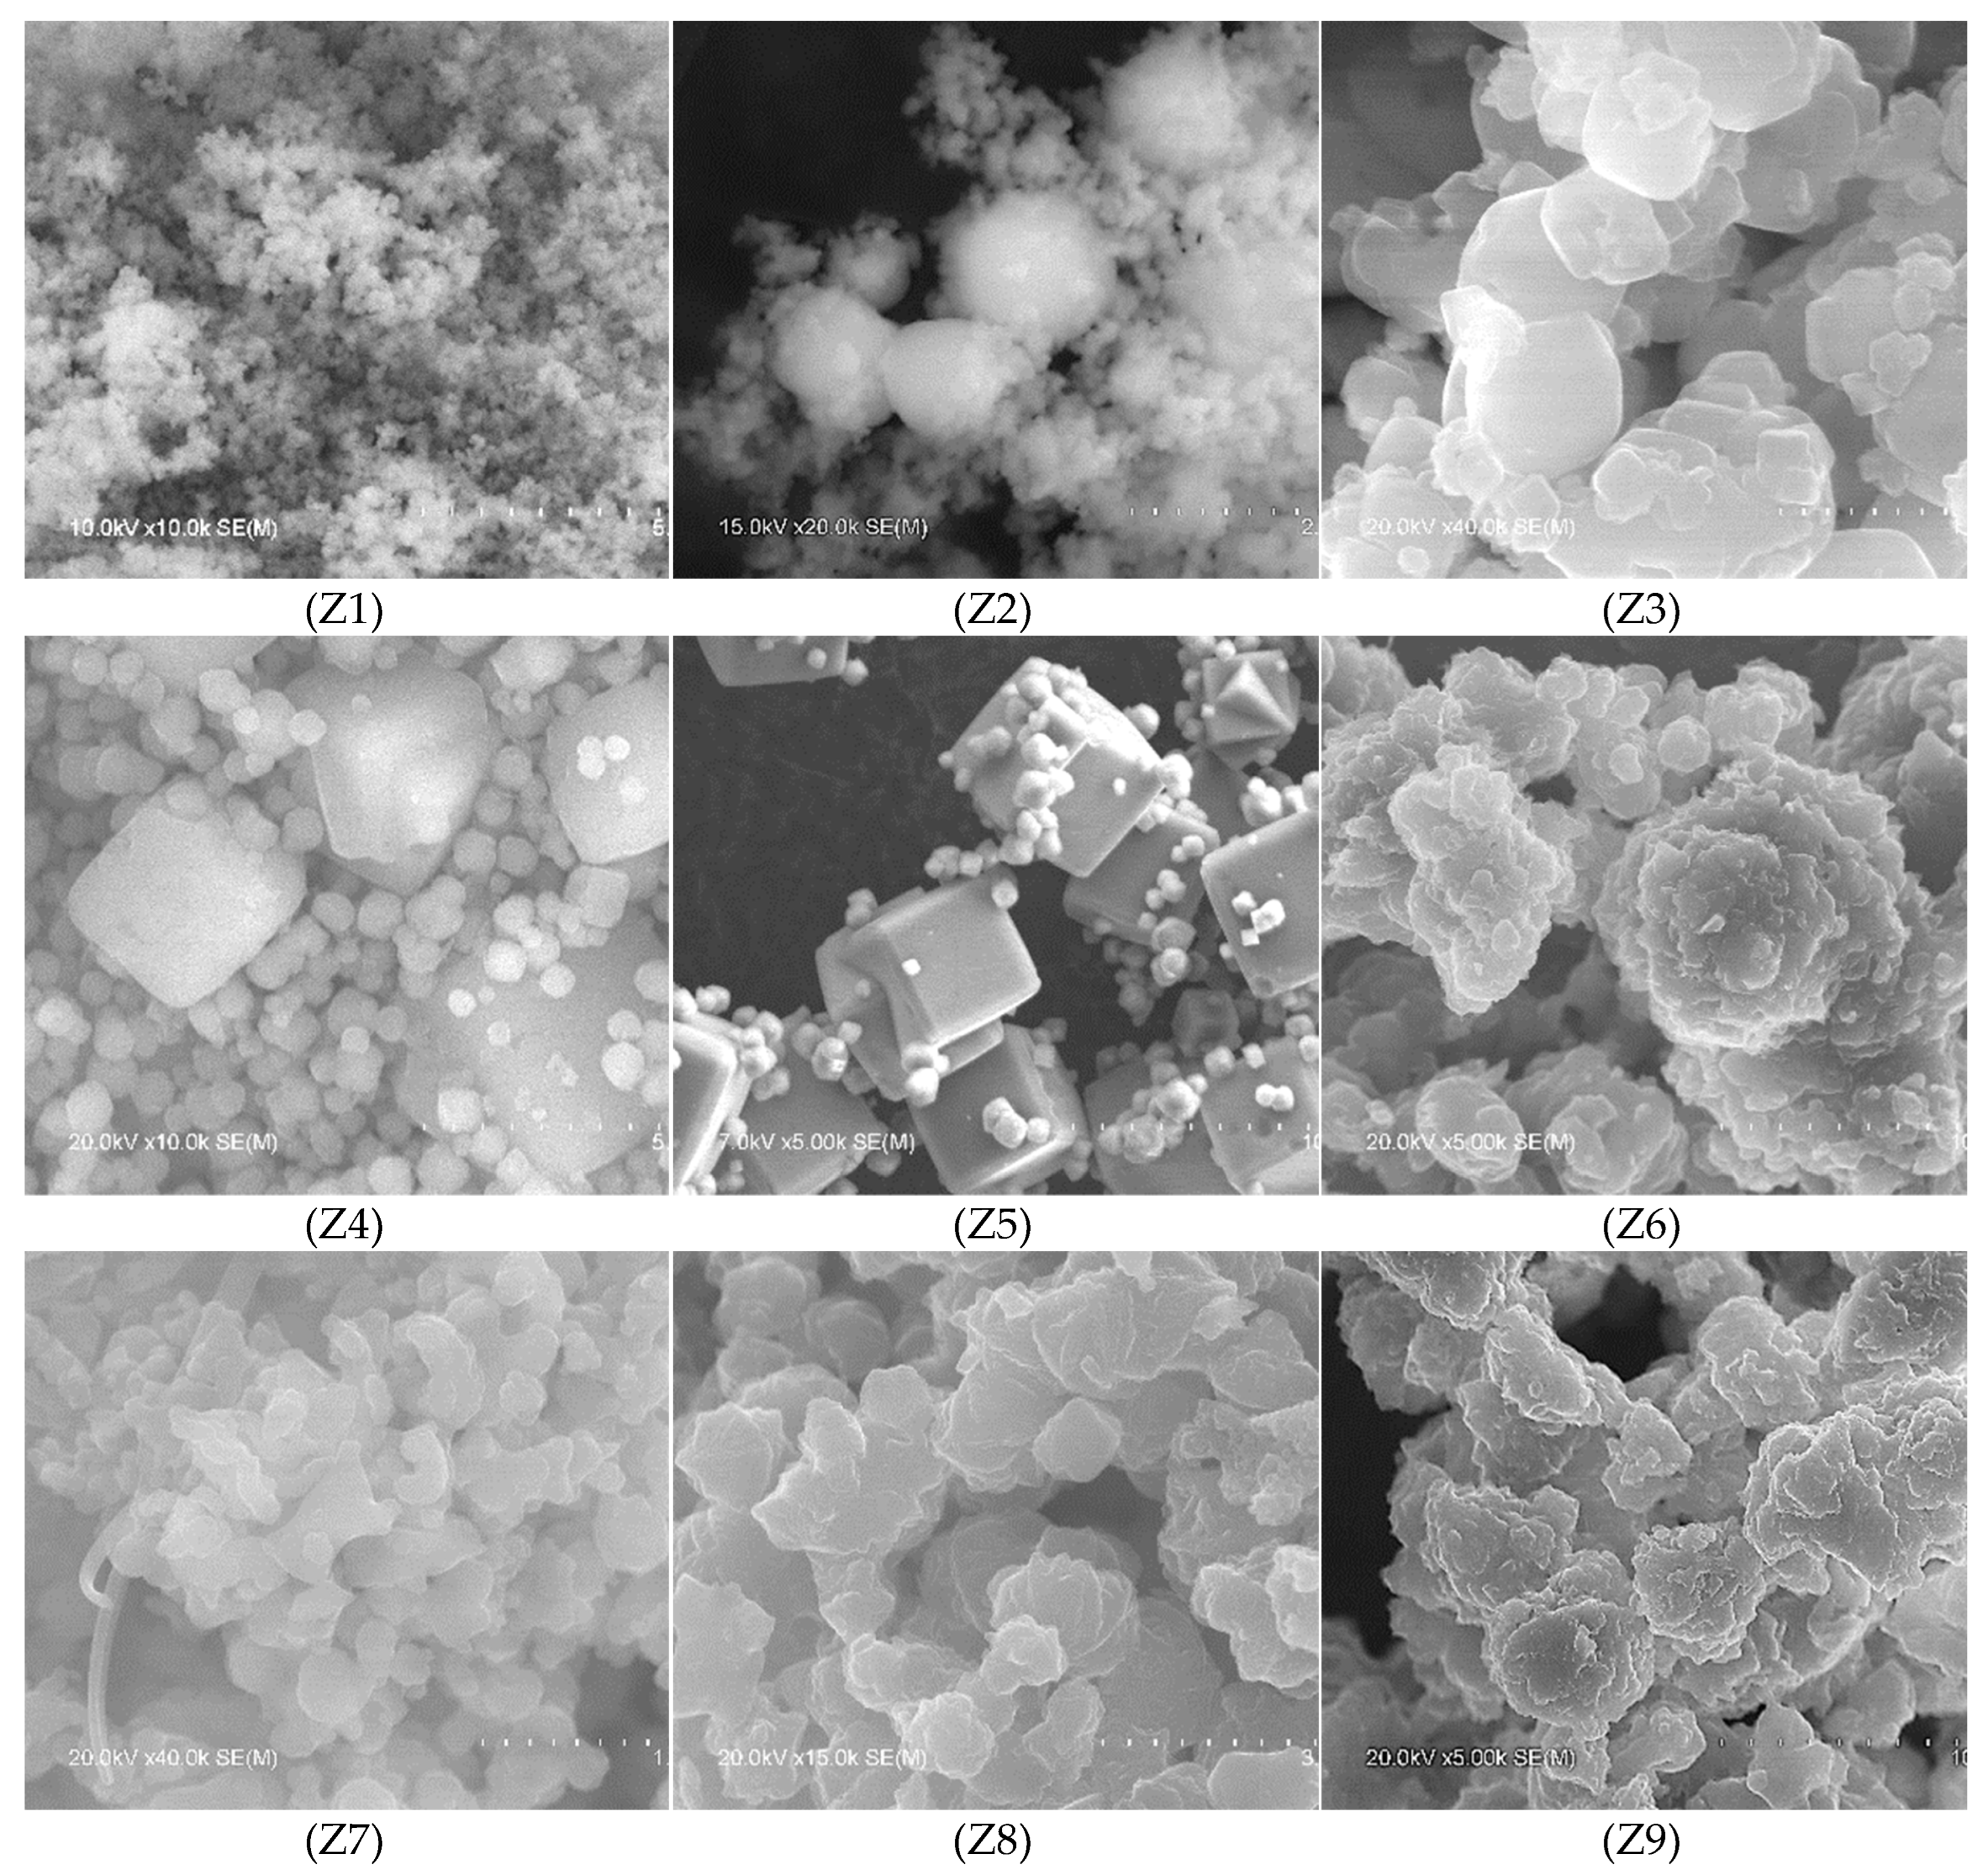
3.1. Effect of Ageing Time, Temperature and Alkali Concentration
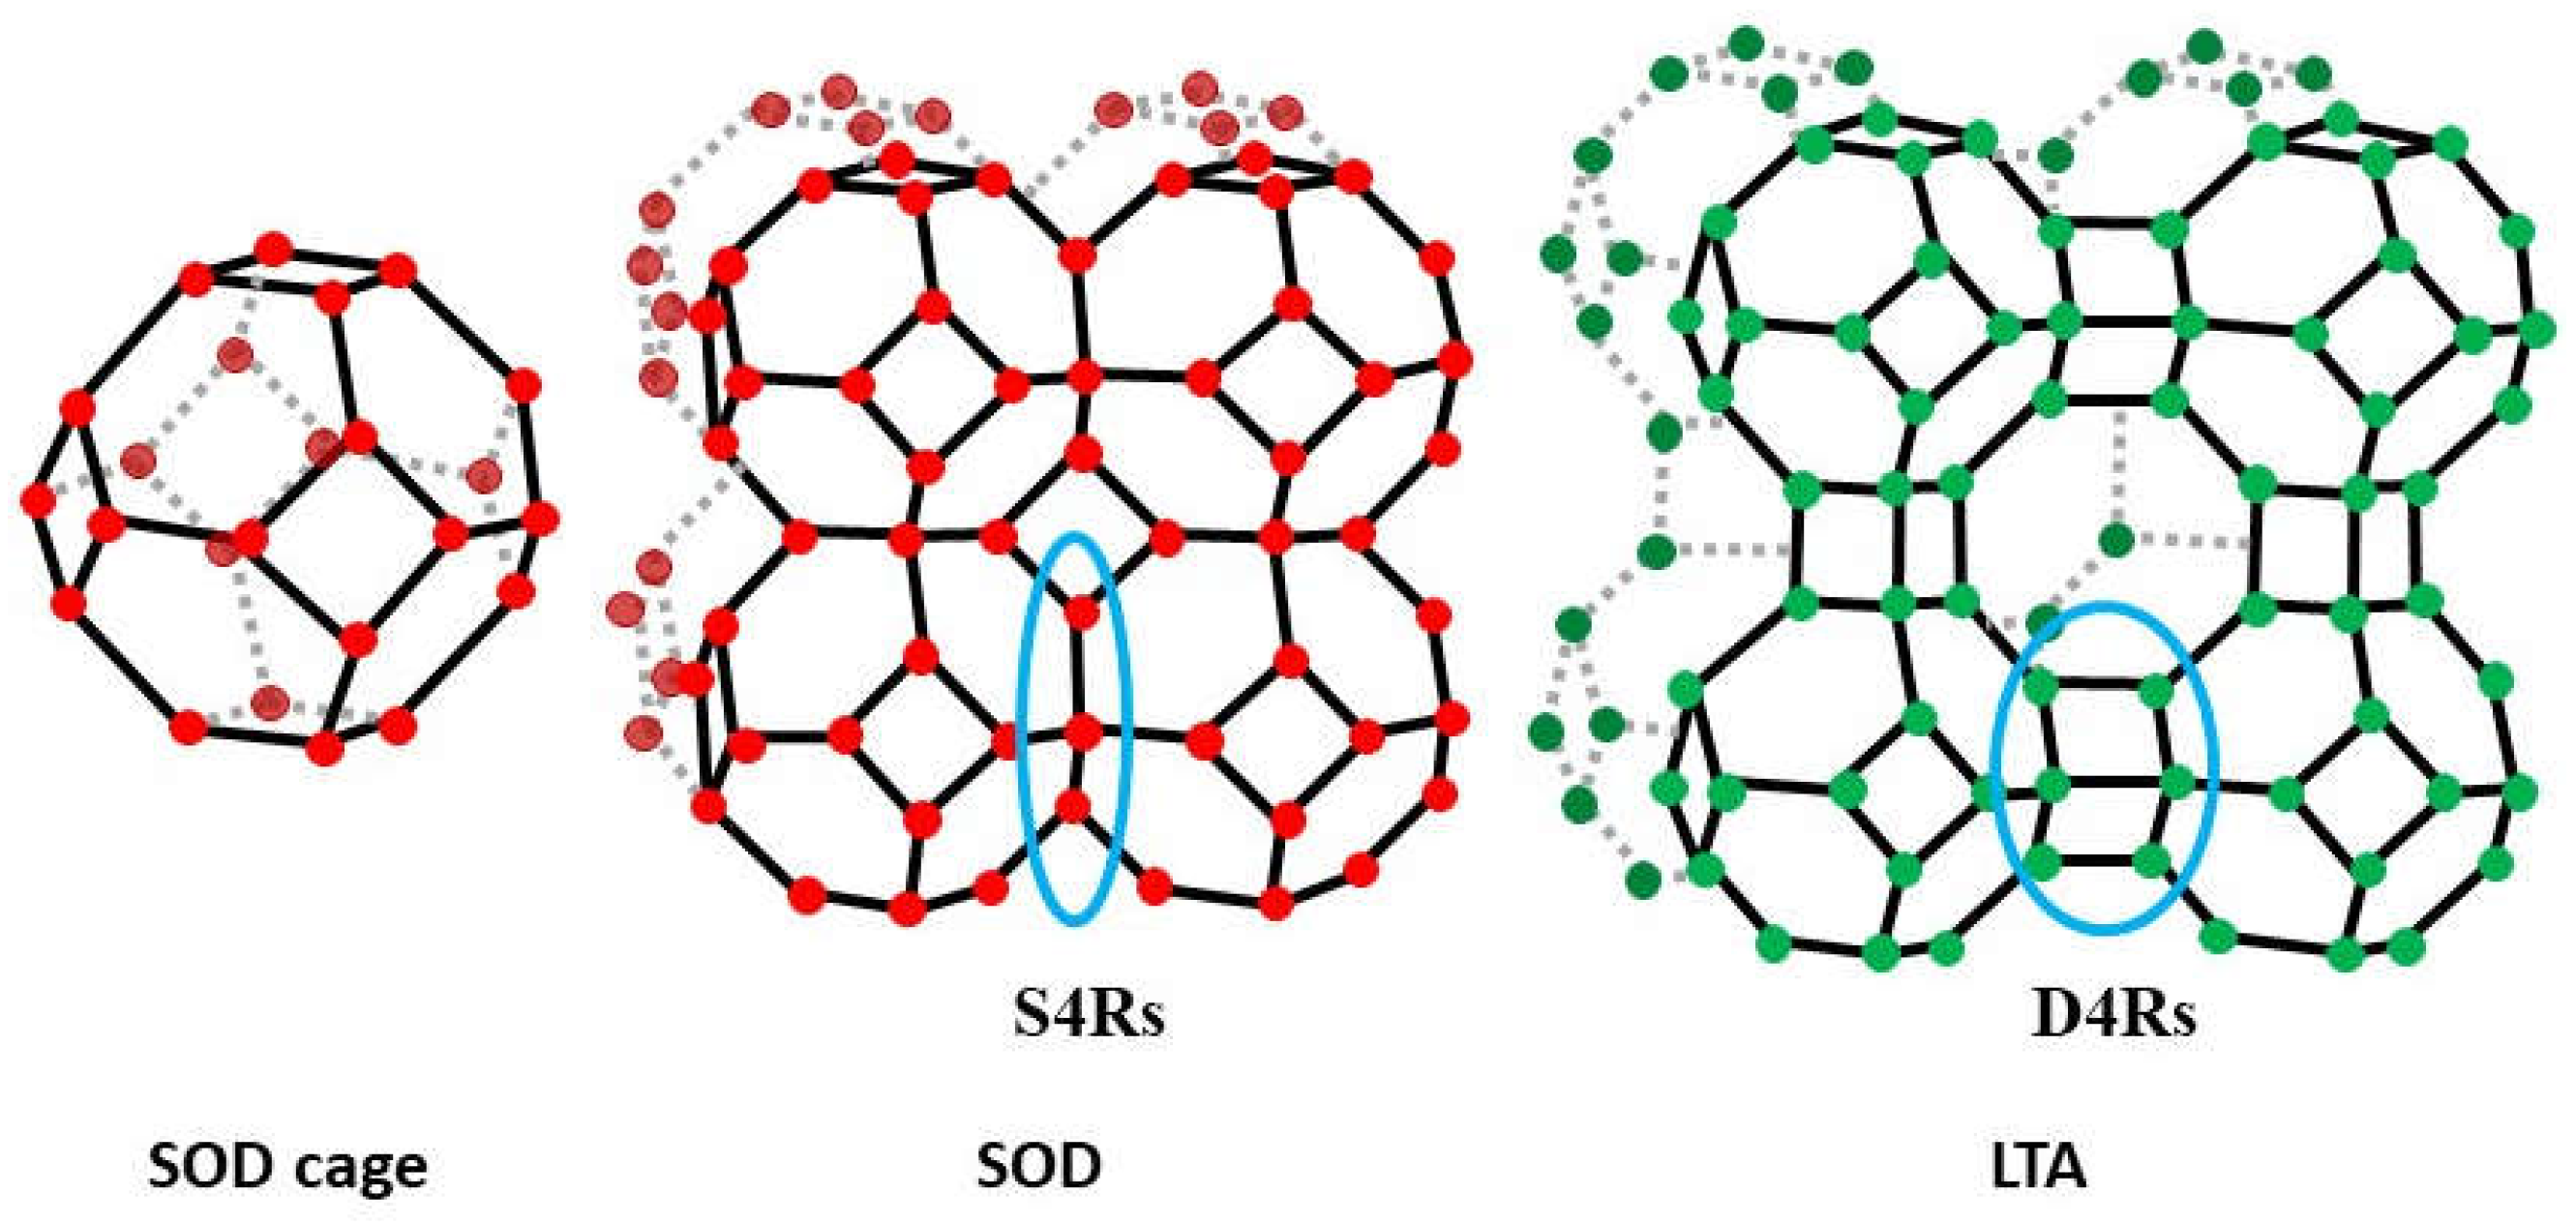
3.2. Study of LTA and SOD Zeolites
5. Conclusions
Author Contributions
Funding
Institutional Review Board Statement
Informed Consent Statement
Data Availability Statement
Acknowledgments
Conflicts of Interest
References
- Collins, F.; Rozhkovskaya, A.; Outram, J.G.; Millar, G.J. A Critical Review of Waste Resources, Synthesis, and Applications for Zeolite LTA. Microporous and Mesoporous Materials 2020, 291, 109667. [Google Scholar] [CrossRef]
- Markets and Markets. Zeolites Market by Type (Natural, Synthetic), Function (Ion-Exchange, Catalyst, Molecular Sieve), Synthetic Zeolite Application (Detergents, Adsorbent, Catalysts), Natural Zeolite Application, and Region – Global Forecast to 2026. Available online: https://www.marketsandmarkets.com/Market-Reports/zeolites-market-76442083.html (accessed on 5 July 2024).
- Mallapur, V.P.; Oubagaranadin, J.U.K. A Brief Review on the Synthesis of Zeolites from Hazardous Wastes. Transactions of the Indian Ceramic Society 2017, 76, 1–13. [Google Scholar] [CrossRef]
- El Bojaddayni, I.; Emin Küçük, M.; El Ouardi, Y.; Jilal, I.; El Barkany, S.; Moradi, K.; Repo, E.; Laatikainen, K.; Ouammou, A. A Review on Synthesis of Zeolites from Natural Clay Resources and Waste Ash: Recent Approaches and Progress. Minerals Engineering 2023, 198, 108086. [Google Scholar] [CrossRef]
- Prokof’ev, V. Yu.; Gordina, N.E. Preparation of Granulated LTA and SOD Zeolites from Mechanically Activated Mixtures of Metakaolin and Sodium Hydroxide. Applied Clay Science 2014, 101, 44–51. [Google Scholar] [CrossRef]
- Sánchez-Hernández, R.; López-Delgado, A.; Padilla, I.; Galindo, R.; López-Andrés, S. One-Step Synthesis of NaP1, SOD and ANA from a Hazardous Aluminum Solid Waste. Microporous and Mesoporous Materials 2016, 226, 267–277. [Google Scholar] [CrossRef]
- Wang, C.; Li, J.; Wang, L.; Sun, X.; Huang, J. Adsorption of Dye from Wastewater by Zeolites Synthesized from Fly Ash: Kinetic and Equilibrium Studies. Chinese Journal of Chemical Engineering 2009, 17, 513–521. [Google Scholar] [CrossRef]
- Kim, J.-C.; Choi, M.; Song, H.J.; Park, J.E.; Yoon, J.-H.; Park, K.-S.; Lee, C.G.; Kim, D.-W. Synthesis of Uniform-Sized Zeolite from Windshield Waste. Materials Chemistry and Physics 2015, 166, 20–25. [Google Scholar] [CrossRef]
- Lee, W.-H.; Lin, Y.-W.; Lin, K.-L. Parameter Optimization, Characterization, and Crystallization Mechanisms Underlying the Synthesis of Zeolite A Using Liquid Crystal Display Waste Glass and Sandblasting Waste as Alternative Raw Materials. Journal of Environmental Chemical Engineering 2022, 10, 108506. [Google Scholar] [CrossRef]
- Bohra, S.; Kundu, D.; Naskar, M.K. One-Pot Synthesis of NaA and NaP Zeolite Powders Using Agro-Waste Material and Other Low Cost Organic-Free Precursors. Ceramics International 2014, 40, 1229–1234. [Google Scholar] [CrossRef]
- Wajima, T.; Kiguchi, O.; Sugawara, K.; Sugawara, T. Synthesis of Zeolite-A Using Silica from Rice Husk Ash. J. Chem. Eng. Japan / JCEJ 2009, 42 (Supplement.), S61–S66. [Google Scholar] [CrossRef]
- Simanjuntak, W.; Pandiangan, K.D.; Sembiring, Z.; Simanjuntak, A.; Hadi, S. The Effect of Crystallization Time on Structure, Microstructure, and Catalytic Activity of Zeolite-A Synthesized from Rice Husk Silica and Food-Grade Aluminum Foil. Biomass and Bioenergy 2021, 148, 106050. [Google Scholar] [CrossRef]
- Wang, C.-F.; Li, J.-S.; Wang, L.-J.; Sun, X.-Y. Influence of NaOH Concentrations on Synthesis of Pure-Form Zeolite A from Fly Ash Using Two-Stage Method. Journal of Hazardous Materials 2008, 155, 58–64. [Google Scholar] [CrossRef] [PubMed]
- Melo, C.R.; Francisco, A.C.; Kuhnen, N.C.; da Rocha, M.R.; Melo, A.R.; Riella, H.G.; Angioletto, E. Production of Zeolite from Rice Husk Ash. MSF 2014, 798–799, 617–621. [Google Scholar] [CrossRef]
- Al-dahri, T.; AbdulRazak, A.A.; Rohani, S. Preparation and Characterization of Linde-Type A Zeolite (LTA) from Coal Fly Ash by Microwave-Assisted Synthesis Method: Its Application as Adsorbent for Removal of Anionic Dyes. International Journal of Coal Preparation and Utilization 2022, 42, 2064–2077. [Google Scholar] [CrossRef]
- Behin, J.; Bukhari, S.S.; Dehnavi, V.; Kazemian, H.; Rohani, S. Using Coal Fly Ash and Wastewater for Microwave Synthesis of LTA Zeolite. Chem Eng & Technol 2014, 37, 1532–1540. [Google Scholar] [CrossRef]
- Belviso, C.; Cavalcante, F.; Javier Huertas, F.; Lettino, A.; Ragone, P.; Fiore, S. The Crystallisation of Zeolite (X- and A-Type) from Fly Ash at 25°C in Artificial Sea Water. Microporous and Mesoporous Materials 2012, 162, 115–121. [Google Scholar] [CrossRef]
- Cao, J.; Wang, P.; Sun, Q. Green Synthesis of Magnetic Zeolite LTA Using NaOH Activated Fly Ash. Z. Anorg. Allg. Chem. 2020, 646, 1666–1670. [Google Scholar] [CrossRef]
- Cardoso, A.M.; Horn, M.B.; Ferret, L.S.; Azevedo, C.M.N.; Pires, M. Integrated Synthesis of Zeolites 4A and Na–P1 Using Coal Fly Ash for Application in the Formulation of Detergents and Swine Wastewater Treatment. Journal of Hazardous Materials 2015, 287, 69–77. [Google Scholar] [CrossRef]
- Kim, J.K.; Lee, H.D. Effects of Step Change of Heating Source on Synthesis of Zeolite 4A from Coal Fly Ash. Journal of Industrial and Engineering Chemistry 2009, 15, 736–742. [Google Scholar] [CrossRef]
- Shoumkova, A.; Stoyanova, V. Zeolites Formation by Hydrothermal Alkali Activation of Coal Fly Ash from Thermal Power Station “Maritsa 3”, Bulgaria. Fuel 2013, 103, 533–541. [Google Scholar] [CrossRef]
- Xu, H.; Wu, L.; Shi, T.; Liu, W.; Qi, S. Adsorption of Acid Fuchsin onto LTA-Type Zeolite Derived from Fly Ash. Sci. China Technol. Sci. 2014, 57, 1127–1134. [Google Scholar] [CrossRef]
- Ziejewska, C.; Grela, A.; Łach, M.; Marczyk, J.; Hordyńska, N.; Szechyńska-Hebda, M.; Hebda, M. Eco-Friendly Zeolites for Innovative Purification of Water from Cationic Dye and Heavy Metal Ions. Journal of Cleaner Production 2023, 406, 136947. [Google Scholar] [CrossRef]
- Espejel-Ayala, F.; Schouwenaars, R.; Durán-Moreno, A.; Ramírez-Zamora, R.M. Use of Drinking Water Sludge in the Production Process of Zeolites. Res Chem Intermed 2014, 40, 2919–2928. [Google Scholar] [CrossRef]
- Anuwattana, R.; Khummongkol, P. Conventional Hydrothermal Synthesis of Na-A Zeolite from Cupola Slag and Aluminum Sludge. Journal of Hazardous Materials 2009, 166, 227–232. [Google Scholar] [CrossRef] [PubMed]
- Rozhkovskaya, A.; Rajapakse, J.; Millar, G.J. Synthesis of High-Quality Zeolite LTA from Alum Sludge Generated in Drinking Water Treatment Plants. Journal of Environmental Chemical Engineering 2021, 9, 104751. [Google Scholar] [CrossRef]
- Wongwichien, J. Synthesis and Use of Zeolite Na-A from Waste Sludge of Water Treatment Plant for Ammonium Removal. Chiang Mai J. Sci. 2014, 41, 1262–1273. [Google Scholar]
- Abdelrahman, E.A.; Abou El-Reash, Y.G.; Youssef, H.M.; Kotp, Y.H.; Hegazey, R.M. Utilization of Rice Husk and Waste Aluminum Cans for the Synthesis of Some Nanosized Zeolite, Zeolite/Zeolite, and Geopolymer/Zeolite Products for the Efficient Removal of Co(II), Cu(II), and Zn(II) Ions from Aqueous Media. Journal of Hazardous Materials 2021, 401, 123813. [Google Scholar] [CrossRef]
- López-Delgado, A.; Robla, J.I.; Padilla, I.; López-Andrés, S.; Romero, M. Zero-Waste Process for the Transformation of a Hazardous Aluminum Waste into a Raw Material to Obtain Zeolites. Journal of Cleaner Production 2020, 255, 120178. [Google Scholar] [CrossRef]
- Selim, M.M.; EL-Mekkawi, D.M.; Aboelenin, R.M.M.; Sayed Ahmed, S.A.; Mohamed, G.M. Preparation and Characterization of Na-A Zeolite from Aluminum Scrub and Commercial Sodium Silicate for the Removal of Cd 2+ from Water. Journal of the Association of Arab Universities for Basic and Applied Sciences 2017, 24, 19–25. [Google Scholar] [CrossRef]
- Tounsi, H.; Mseddi, S.; Djemel, S. Preparation and Characterization of Na-LTA Zeolite from Tunisian Sand and Aluminum Scrap. Physics Procedia 2009, 2, 1065–1074. [Google Scholar] [CrossRef]
- Terzano, R.; D’Alessandro, C.; Spagnuolo, M.; Romagnoli, M.; Medici, L. Facile Zeolite Synthesis from Municipal Glass and Aluminum Solid Wastes. CLEAN Soil Air Water 2015, 43, 133–140. [Google Scholar] [CrossRef]
- Kuroki, S.; Hashishin, T.; Morikawa, T.; Yamashita, K.; Matsuda, M. Selective Synthesis of Zeolites A and X from Two Industrial Wastes: Crushed Stone Powder and Aluminum Ash. Journal of Environmental Management 2019, 231, 749–756. [Google Scholar] [CrossRef] [PubMed]
- Padilla, I.; Romero, M.; López-Andrés, S.; López-Delgado, A. Sustainable Management of Salt Slag. Sustainability 2022, 14, 4887. [Google Scholar] [CrossRef]
- tatista. Market volume of secondary aluminum worldwide in 2020, with a forecast for 2027. Available online: https://www.statista.com/statistics/1306589/global-market-volume-of-secondary-aluminum (accessed on 5 July 2024).
- Huang, X.-L.; Badawy, A.E.; Arambewela, M.; Ford, R.; Barlaz, M.; Tolaymat, T. Characterization of Salt Cake from Secondary Aluminum Production. Journal of Hazardous Materials 2014, 273, 192–199. [Google Scholar] [CrossRef] [PubMed]
- EWC. European Waste Catalogue and Hazardous Waste List, Published by Environmental Protection Agency. Ireland. 2001. Available online: https://v4r7y5k5.stackpathcdn.com/wp-content/uploads/2016/08/EWC_HWL.pdf (accessed on 2 June 2024).
- Attia, N.; Hassan, K.M.; Hassan, M.I. Environmental Impacts of Aluminum Dross After Metal Extraction. In Light Metals 2018; Martin, O., Ed.; The Minerals, Metals & Materials Series; Springer International Publishing: Cham, 2018; pp. 1155–1161. [Google Scholar] [CrossRef]
- Jiménez, A.; Misol, A.; Morato, Á.; Rives, V.; Vicente, M.A.; Gil, A. Synthesis of Pollucite and Analcime Zeolites by Recovering Aluminum from a Saline Slag. Journal of Cleaner Production 2021, 297, 126667. [Google Scholar] [CrossRef]
- Pode, R. Potential Applications of Rice Husk Ash Waste from Rice Husk Biomass Power Plant. Renewable and Sustainable Energy Reviews 2016, 53, 1468–1485. [Google Scholar] [CrossRef]
- FAO. Food Outlook – Biannual Report on Global Food Markets; FAO, 2024. [CrossRef]
- Ritter, M.T.; Lobo-Recio, M.Á.; Padilla, I.; Romero, M.; López-Delgado, A. Salt Slag and Rice Husk Ash as Raw Materials in Zeolite Synthesis: Process Optimization Using Central Composite Rotational Design. Sustainable Chemistry and Pharmacy 2024, 39, 101599. [Google Scholar] [CrossRef]
- NC 626. Natural Zeolites - Determination of Exchange Capacity Total Cationic - Ammonium Chloride Method; 2008.
- Johnson, E.B.G.; Arshad, S.E. Hydrothermally Synthesized Zeolites Based on Kaolinite: A Review. Applied Clay Science 2014, 97–98, 215–221. [Google Scholar] [CrossRef]
- Pangan, N.; Gallardo, S.; Gaspillo, P.; Kurniawan, W.; Hinode, H.; Promentilla, M. Hydrothermal Synthesis and Characterization of Zeolite A from Corn (Zea Mays) Stover Ash. Materials 2021, 14, 4915. [Google Scholar] [CrossRef]
- Asefa, M.T.; Feyisa, G.B. Comparative Investigation on Two Synthesizing Methods of Zeolites for Removal of Methylene Blue from Aqueous Solution. International Journal of Chemical Engineering 2022, 2022, 1–12. [Google Scholar] [CrossRef]
- Abdelrahman, E.A.; Hegazey, R.M. Utilization of Waste Aluminum Cans in the Fabrication of Hydroxysodalite Nanoparticles and Their Chitosan Biopolymer Composites for the Removal of Ni(II) and Pb(II) Ions from Aqueous Solutions: Kinetic, Equilibrium, and Reusability Studies. Microchemical Journal 2019, 145, 18–25. [Google Scholar] [CrossRef]
- Brar, T.; France, P.; Smirniotis, P.G. Control of Crystal Size and Distribution of Zeolite A. Ind. Eng. Chem. Res. 2001, 40, 1133–1139. [Google Scholar] [CrossRef]
- Andrades, R.C.; Neves, R.F.; Díaz, F.R.V.; Júnior, A.H.M. Influence of Alkalinity on the Synthesis of Zeolite A and Hydroxysodalite from Metakaolin. JNanoR 2020, 61, 51–60. [Google Scholar] [CrossRef]
- Milton, R.M. Molecular Sieve Adsorbents. United State Patent Office 1953.
- Hassan, I.; Grundy, H.D. Structure of Basic Sodalite, Na8Al6Si6O24(OH)2.2H2O. Acta Crystallogr C Cryst Struct Commun 1983, 39, 3–5. [Google Scholar] [CrossRef]
- Molecular Sieve Zeolites-I; Flanigen, E.M., Sand, L.B., Eds.; Advances in Chemistry; AMERICAN CHEMICAL SOCIETY: Washington, D.C., 1974; Vol. 101. [CrossRef]
- Vegere, K.; Kravcevica, R.; Krauklis, A.E.; Juhna, T. Comparative Study of Hydrothermal Synthesis Routes of Zeolite A. Materials Today: Proceedings 2020, 33, 1984–1987. [Google Scholar] [CrossRef]
- Musyoka, N.M.; Petrik, L.F.; Hums, E.; Kuhnt, A.; Schwieger, W. Thermal Stability Studies of Zeolites A and X Synthesized from South African Coal Fly Ash. Res Chem Intermed 2015, 41, 575–582. [Google Scholar] [CrossRef]
- Dimitrijevic, R.; Dondur, V.; Vulic, P.; Markovic, S.; Macura, S. Structural Characterization of Pure Na-Nephelines Synthesized by Zeolite Conversion Route. Journal of Physics and Chemistry of Solids 2004, 65, 1623–1633. [Google Scholar] [CrossRef]
- Selvaraj, K. Transformation of Chemically Fine Tuned Zeolite A Precursor into Dense Lithium Aluminosilicates – A Comprehensive Phase Evolution and Sintering Study. Microporous and Mesoporous Materials 2010, 135, 82–89. [Google Scholar] [CrossRef]
- Günther, C.; Richter, H.; Voigt, I.; Michaelis, A.; Tzscheutschler, H.; Krause-Rehberg, R.; Serra, J.M. Synthesis and Characterization of a Sulfur Containing Hydroxy Sodalite without Sulfur Radicals. Microporous and Mesoporous Materials 2015, 214, 1–7. [Google Scholar] [CrossRef]
- Ayele, L.; Pérez-Pariente, J.; Chebude, Y.; Díaz, I. Synthesis of Zeolite A from Ethiopian Kaolin. Microporous and Mesoporous Materials 2015, 215, 29–36. [Google Scholar] [CrossRef]
- Querol, X.; Moreno, N.; Umaña, J.C.; Alastuey, A.; Hernández, E.; López-Soler, A.; Plana, F. Synthesis of Zeolites from Coal Fly Ash: An Overview. International Journal of Coal Geology 2002, 50, 413–423. [Google Scholar] [CrossRef]
- Lobo-Recio, M.Á.; Rodrigues, C.; Custódio Jeremias, T.; Lapolli, F.R.; Padilla, I.; López-Delgado, A. Highly Efficient Removal of Aluminum, Iron, and Manganese Ions Using Linde Type-A Zeolite Obtained from Hazardous Waste. Chemosphere 2021, 267, 128919. [Google Scholar] [CrossRef]
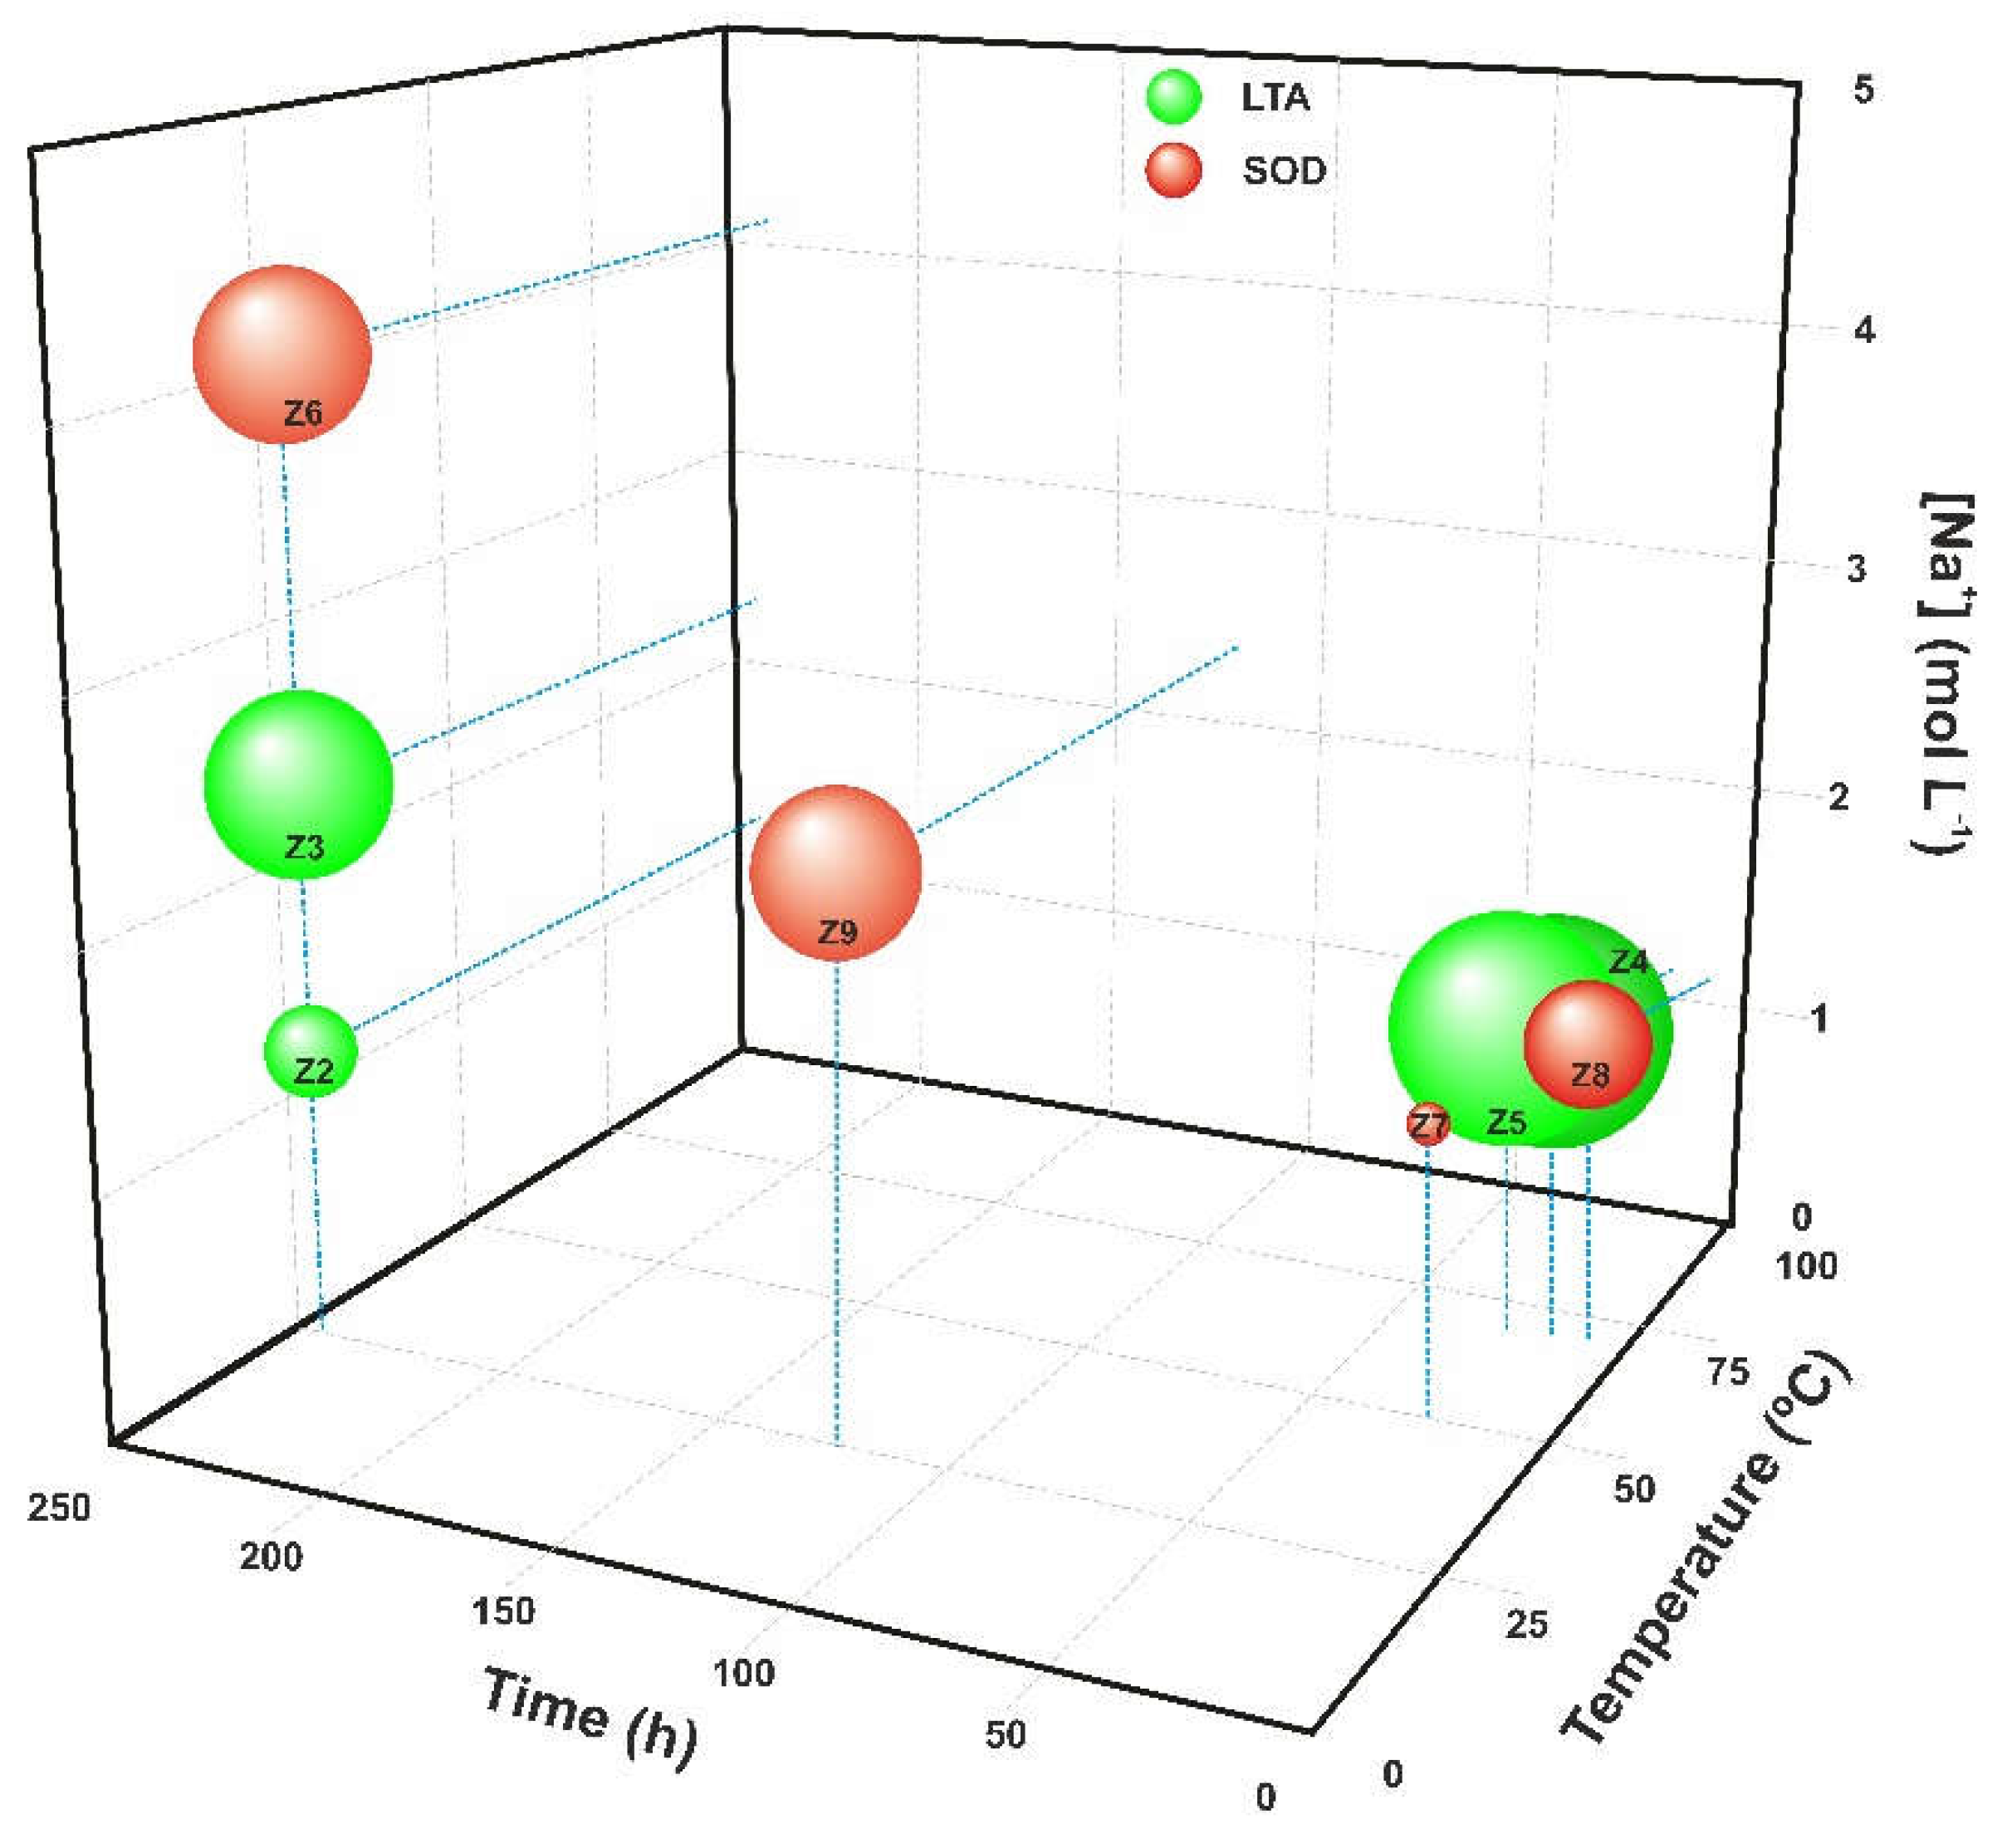
| Samples | T (°C) | t (h) | [Na+] (mol/L) |
|---|---|---|---|
| Z1 | RT | 24 | 1.27 |
| Z2 | RT | 240 | 1.27 |
| Z3 | RT | 240 | 2.36 |
| Z4 | 70 | 15 | 1.27 |
| Z5 | 70 | 24 | 1.27 |
| Z6 | RT | 240 | 4.12 |
| Z7 | 50 | 24 | 1.27 |
| Z8 | 70 | 6 | 1.27 |
| Z9 | RT | 120 | 2.36 |
| Samples | Phase | Zeolite (%) |
Intensity (counts) |
2θ (°) |
FWHM (°) |
Dhkl (nm) |
|---|---|---|---|---|---|---|
| Z1 | Amorphous phase | - | - | - | - | - |
| Z2 | LTA + amorphous phase | 47.4 | 1162 | 29.92 | 0.3743 | 22 |
| Z3 | LTA | 100 | 4101 | 29.88 | 0.1848 | 45 |
| Z4 | LTA SOD |
95.6 4.4 |
4423 | 29.96 | 0.1496 | 55 |
| Z5 | LTA | 100 | 5864 | 29.96 | 0.1564 | 53 |
| Z6 | SOD | 24.6 | 1464 | 24.49 | 0.1808 | 45 |
| Z7 | SOD | 30.0 | 1783 | 24.48 | 0.7829 | 10 |
| Z8 | SOD | 81.3 | 4955 | 24.48 | 0.2703 | 30 |
| Z9 | SOD | 81.8 | 6723 | 24.47 | 0.1992 | 41 |
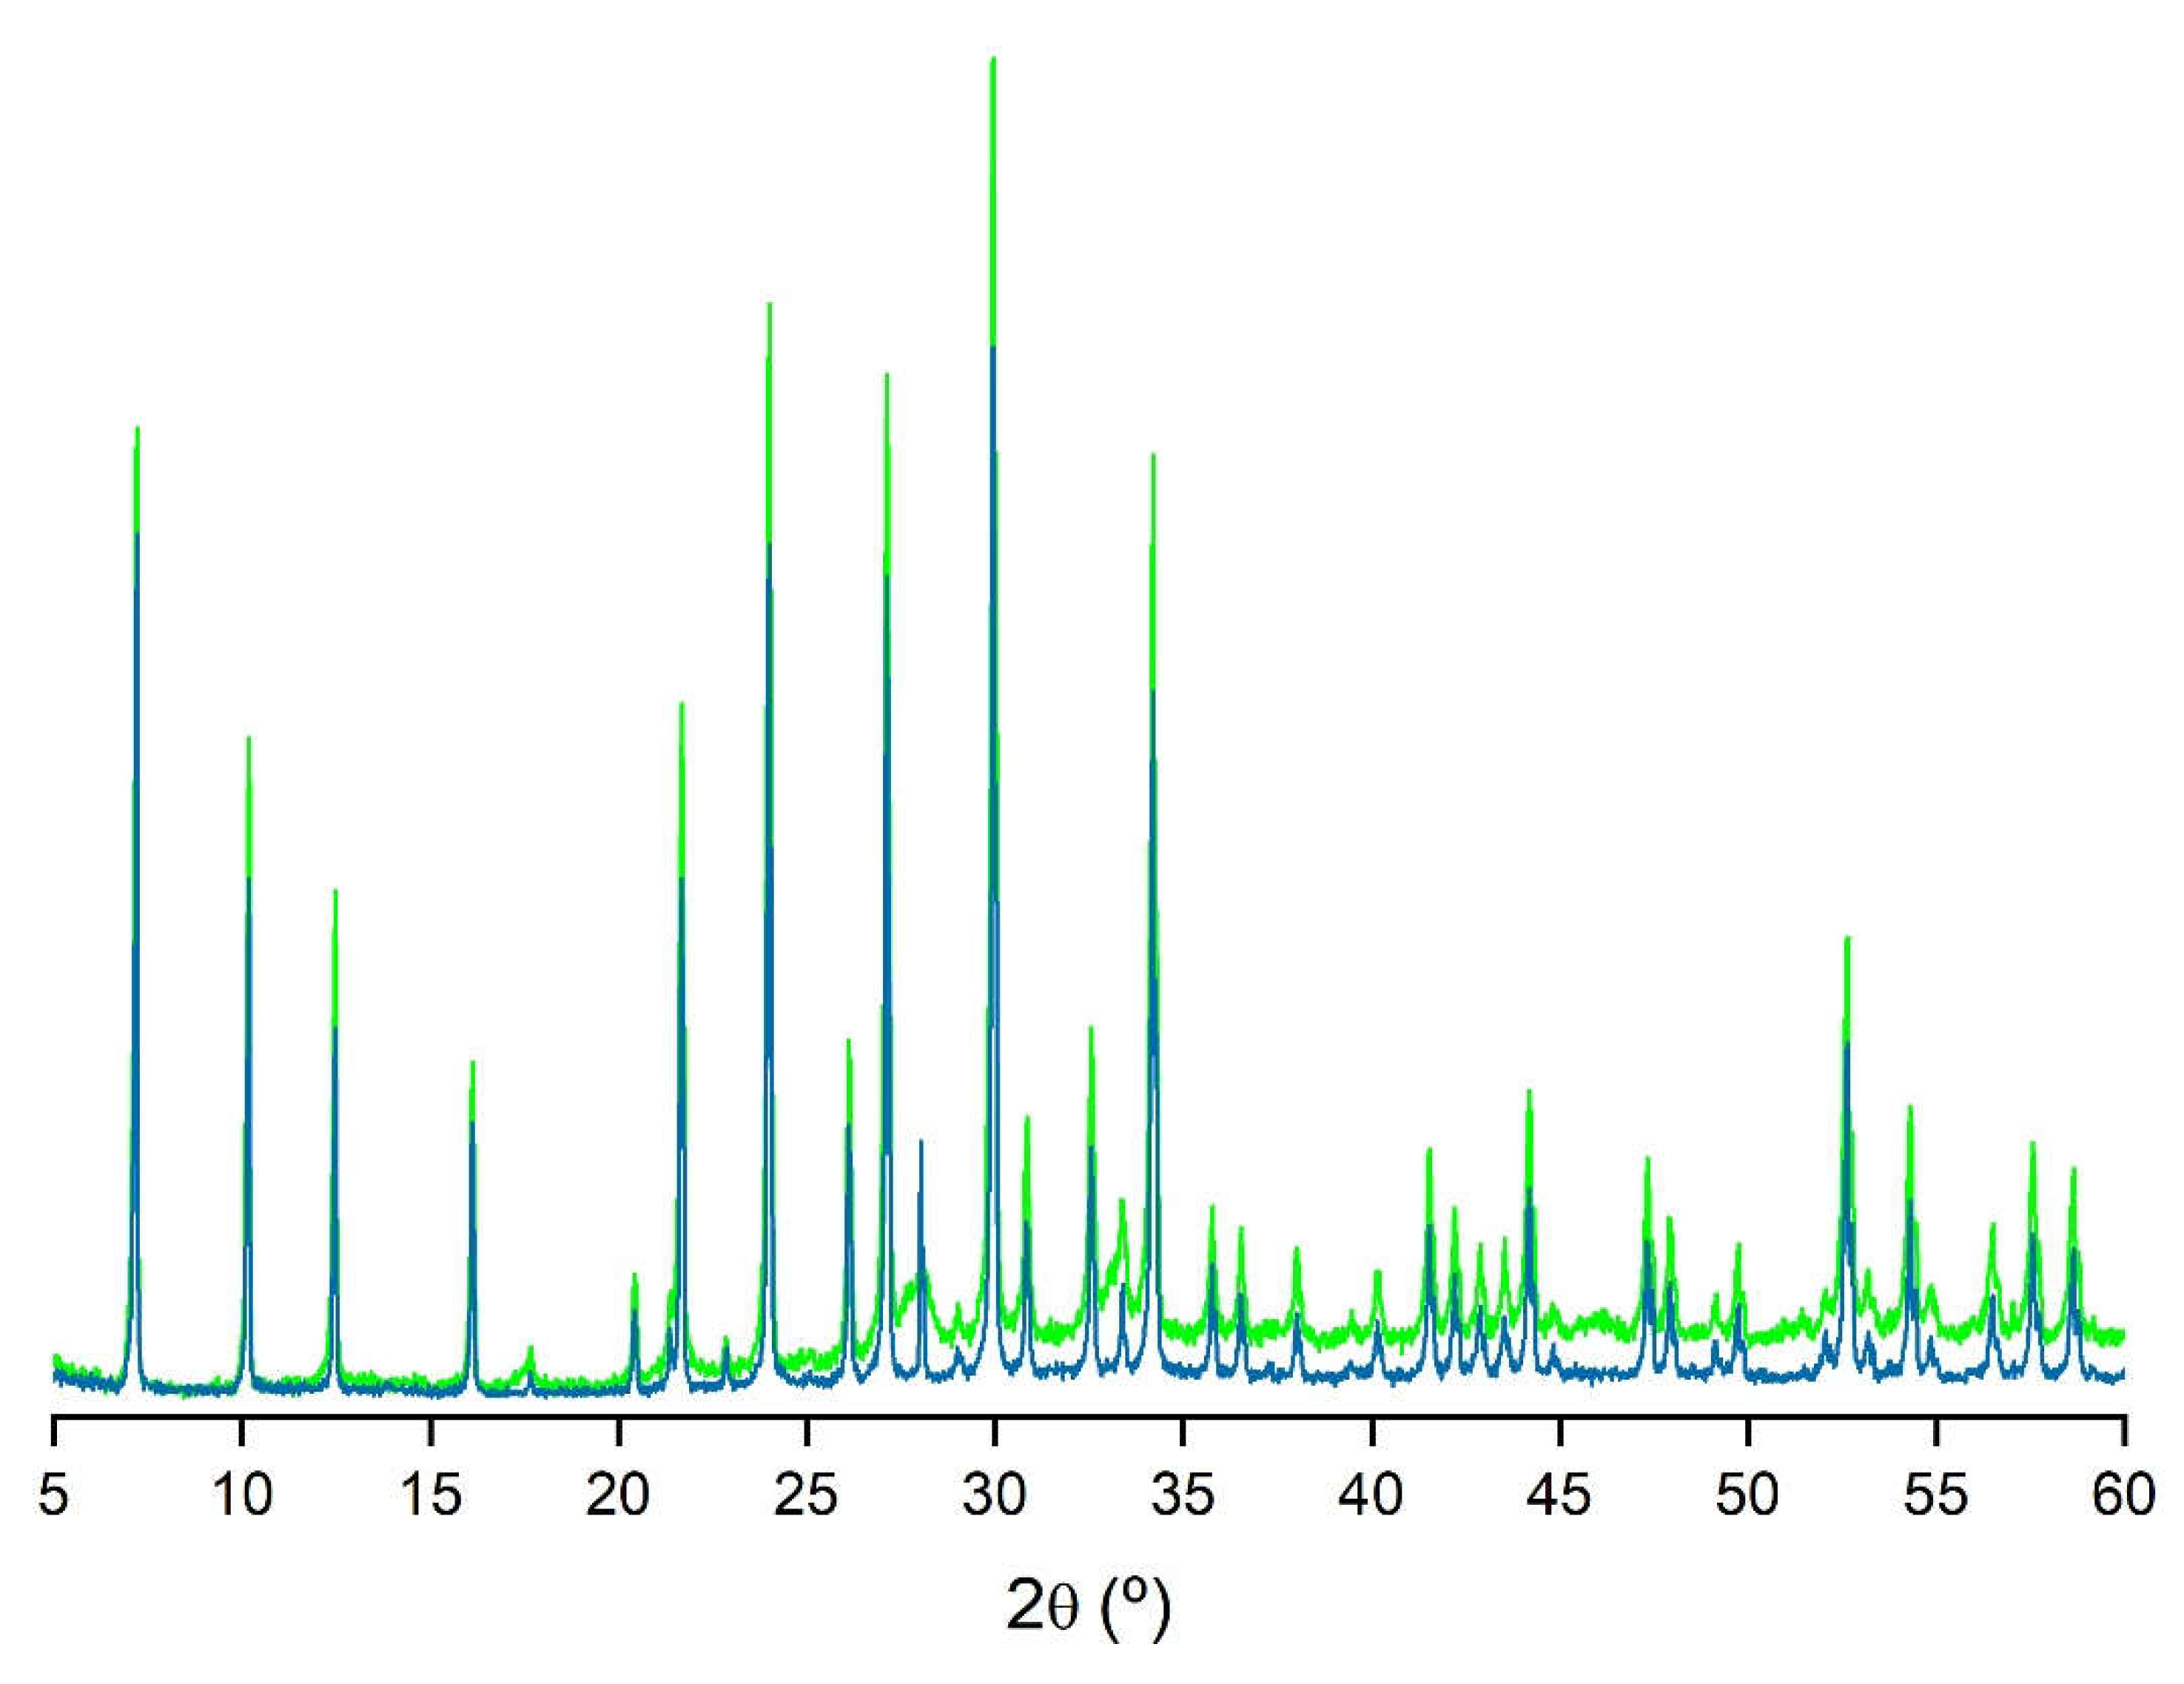
| Z5 (LTA) | ZCOM | PDF 73-2340 | |||||||||
|---|---|---|---|---|---|---|---|---|---|---|---|
| d(Å) | 2θ (°) | I/I0 | d(Å) | 2θ (°) | I/I0 | d(Å) | 2θ (°) | I/I0 | hkl | ||
| 12.27 | 7.20 | 73 | 12.27 | 7.20 | 64 | 12.31 | 7.18 | 69 | [2 0 0] | ||
| 8.69 | 10.17 | 51 | 8.69 | 10.17 | 39 | 8.70 | 10.16 | 46 | [2 2 0] | ||
| 7.09 | 12.47 | 40 | 7.09 | 12.47 | 28 | 7.10 | 12.45 | 51 | [2 2 2] | ||
| 4.10 | 21.68 | 54 | 4.10 | 21.68 | 39 | 4.10 | 21.65 | 39 | [6 0 0] | ||
| 3.71 | 24.00 | 82 | 3.71 | 24.00 | 63 | 3.71 | 23.97 | 54 | [6 2 2] | ||
| 3.41 | 26.12 | 29 | 3.41 | 26.12 | 21 | 3.41 | 26.09 | 8 | [6 4 0] | ||
| 3.29 | 27.13 | 77 | 3.29 | 27.13 | 60 | 3.29 | 27.09 | 67 | [6 4 2] | ||
| 2.98 | 29.96 | 100 | 2.98 | 29.96 | 100 | 2.98 | 29.92 | 100 | [6 4 4] | ||
| 2.75 | 32.56 | 30 | 2.75 | 32.56 | 19 | 2.75 | 32.52 | 22 | [8 4 0] | ||
| 2.62 | 34.20 | 72 | 2.62 | 34.18 | 52 | 2.62 | 34.15 | 50 | [6 6 4] | ||
| Z9 (SOD) | PDF 76-1639 | ||||||||
|---|---|---|---|---|---|---|---|---|---|
| d(Å) | 2θ (°) | I/I0 | d(Å) | 2θ (°) | I/I0 | hkl | |||
| 6.30 | 14.05 | 44 | 6.29 | 14.08 | 44 | [1 1 0] | |||
| 3.64 | 24.47 | 100 | 3.63 | 24.51 | 100 | [2 1 1] | |||
| 2.81 | 31.79 | 37 | 2.81 | 31.81 | 40 | [3 1 0] | |||
| 2.57 | 34.88 | 55 | 2.57 | 34.93 | 48 | [2 2 2] | |||
| 2.10 | 43.10 | 49 | 2.10 | 43.14 | 56 | [4 1 1] | |||
Disclaimer/Publisher’s Note: The statements, opinions and data contained in all publications are solely those of the individual author(s) and contributor(s) and not of MDPI and/or the editor(s). MDPI and/or the editor(s) disclaim responsibility for any injury to people or property resulting from any ideas, methods, instructions or products referred to in the content. |
© 2024 by the authors. Licensee MDPI, Basel, Switzerland. This article is an open access article distributed under the terms and conditions of the Creative Commons Attribution (CC BY) license (http://creativecommons.org/licenses/by/4.0/).


