Submitted:
09 August 2024
Posted:
12 August 2024
You are already at the latest version
Abstract
Keywords:
1. Introduction
2. Materials and Methods
2.1. Materials
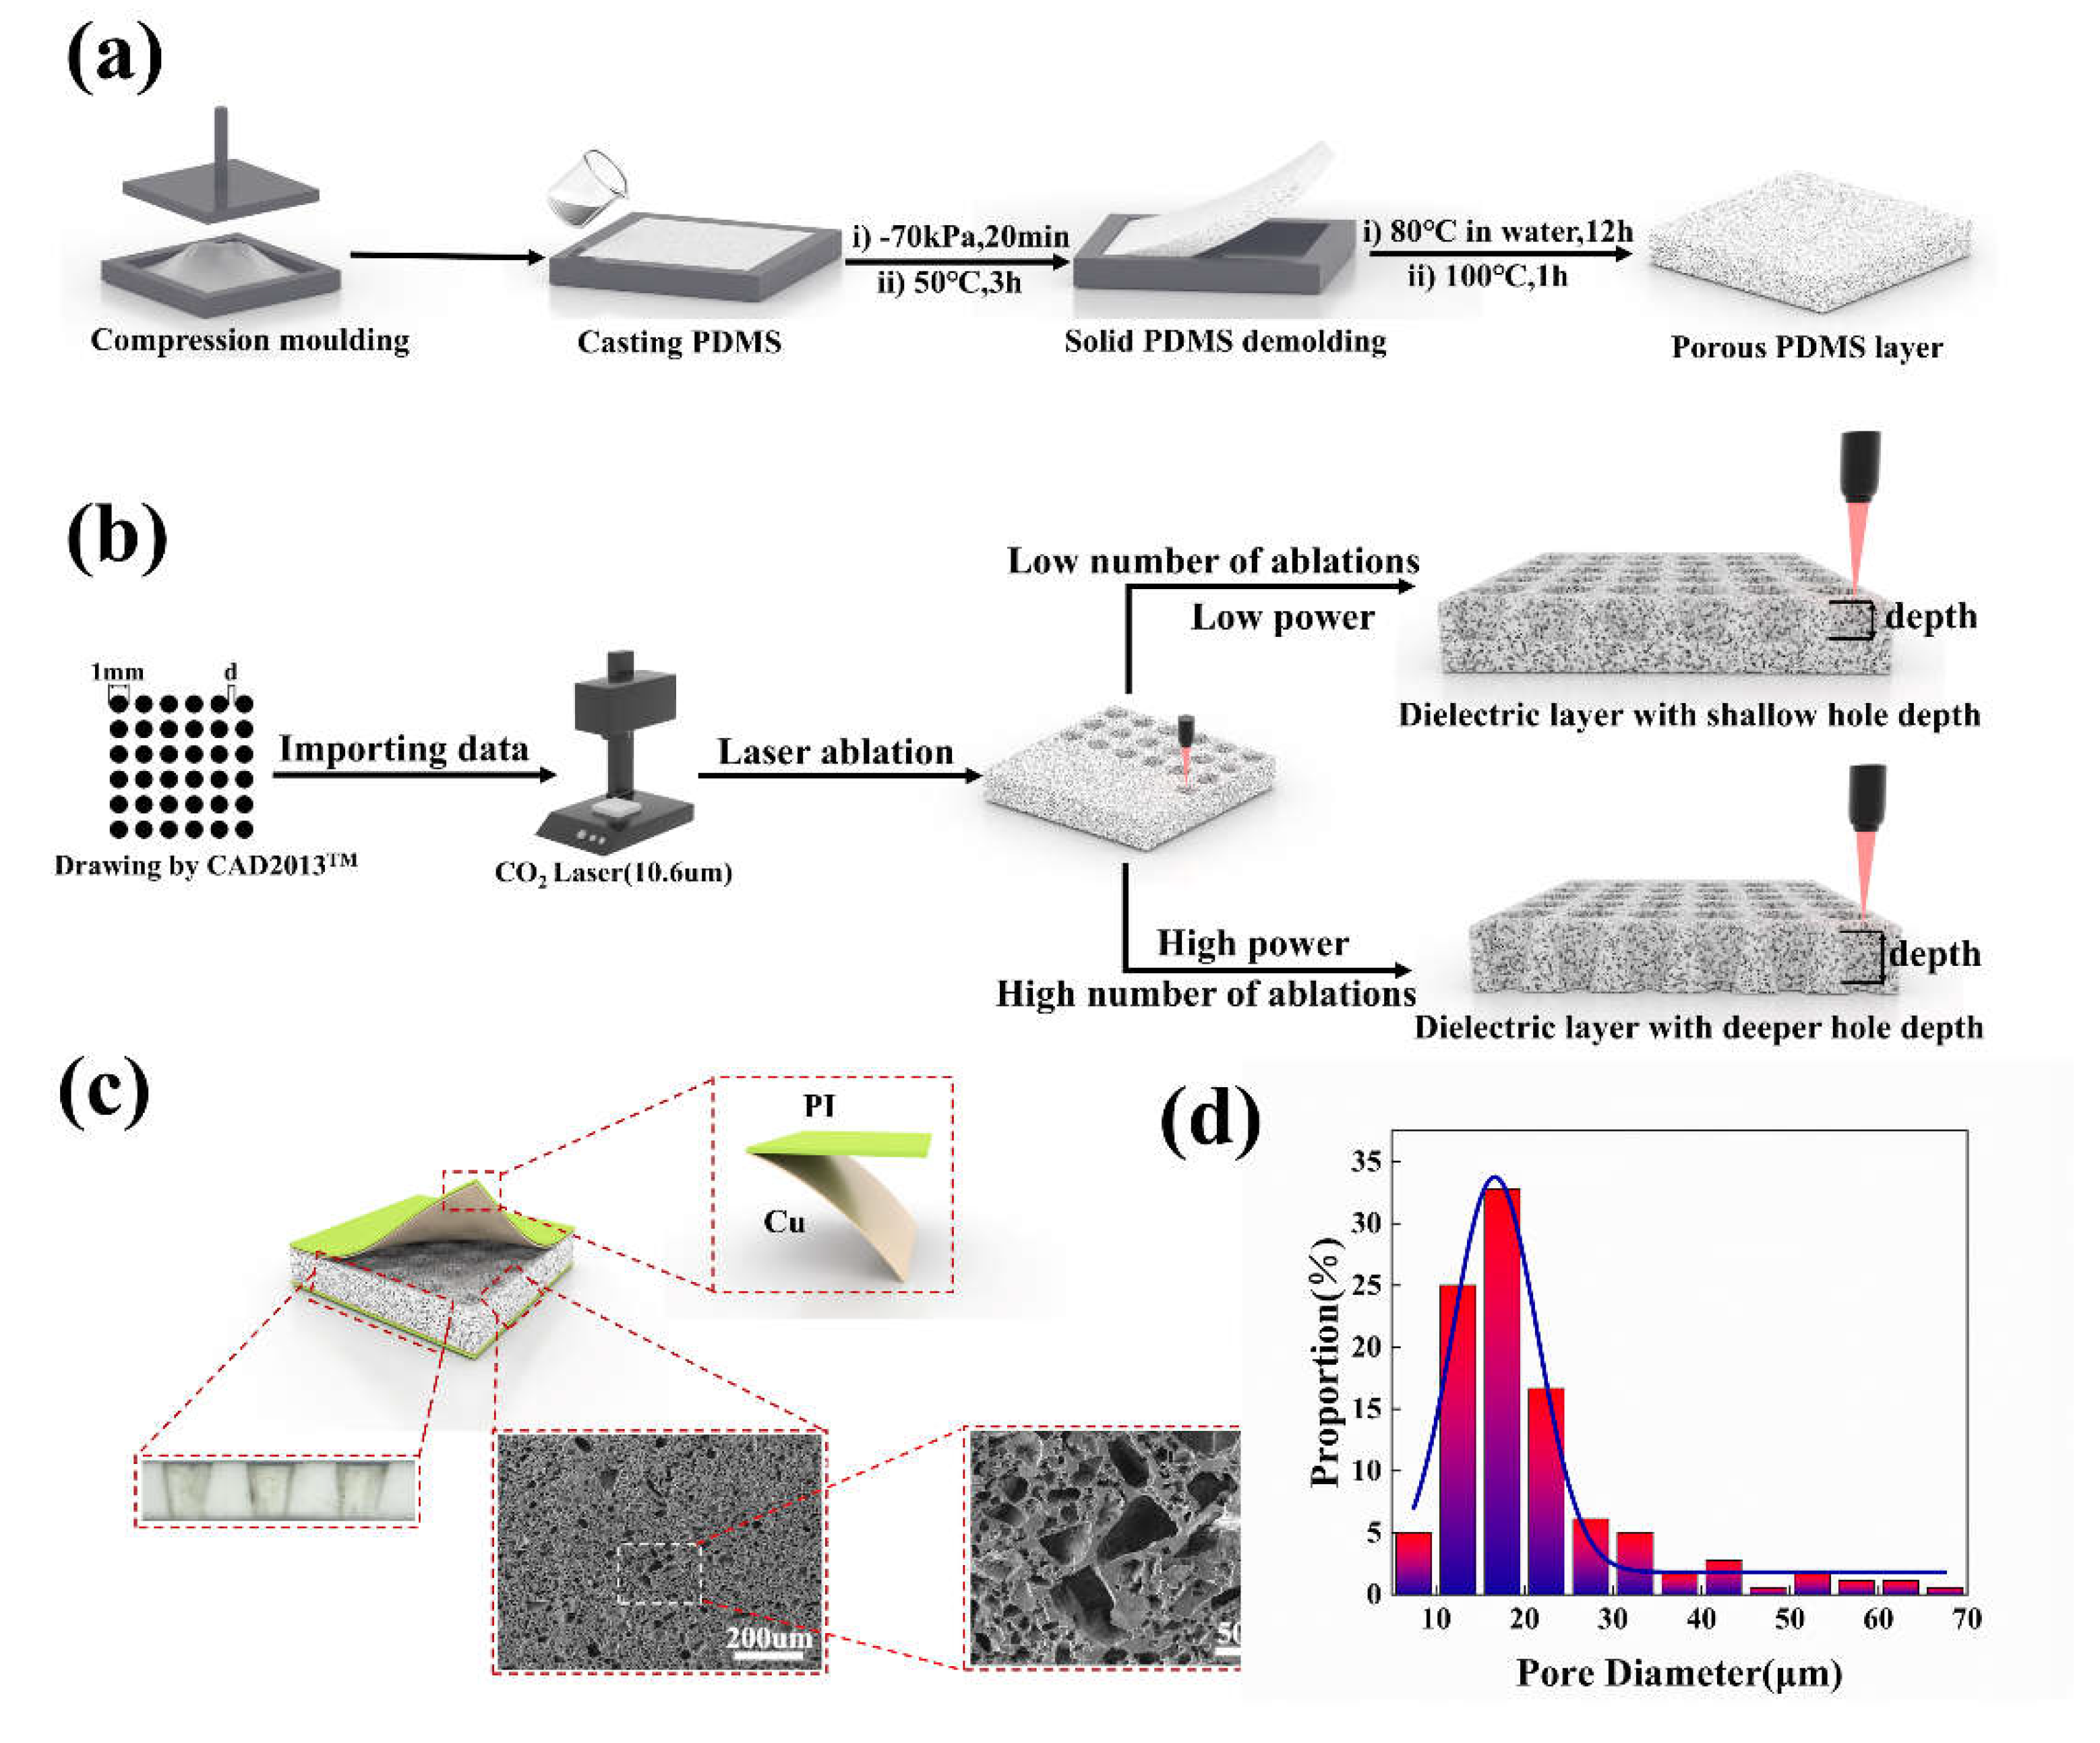
2.2. Preparation of Porous PDMS Dielectric
2.3. Preparation of Porous PDMS Dielectric Layers with Holes Array
2.4. Experimental Setup
3. Results and Discussion
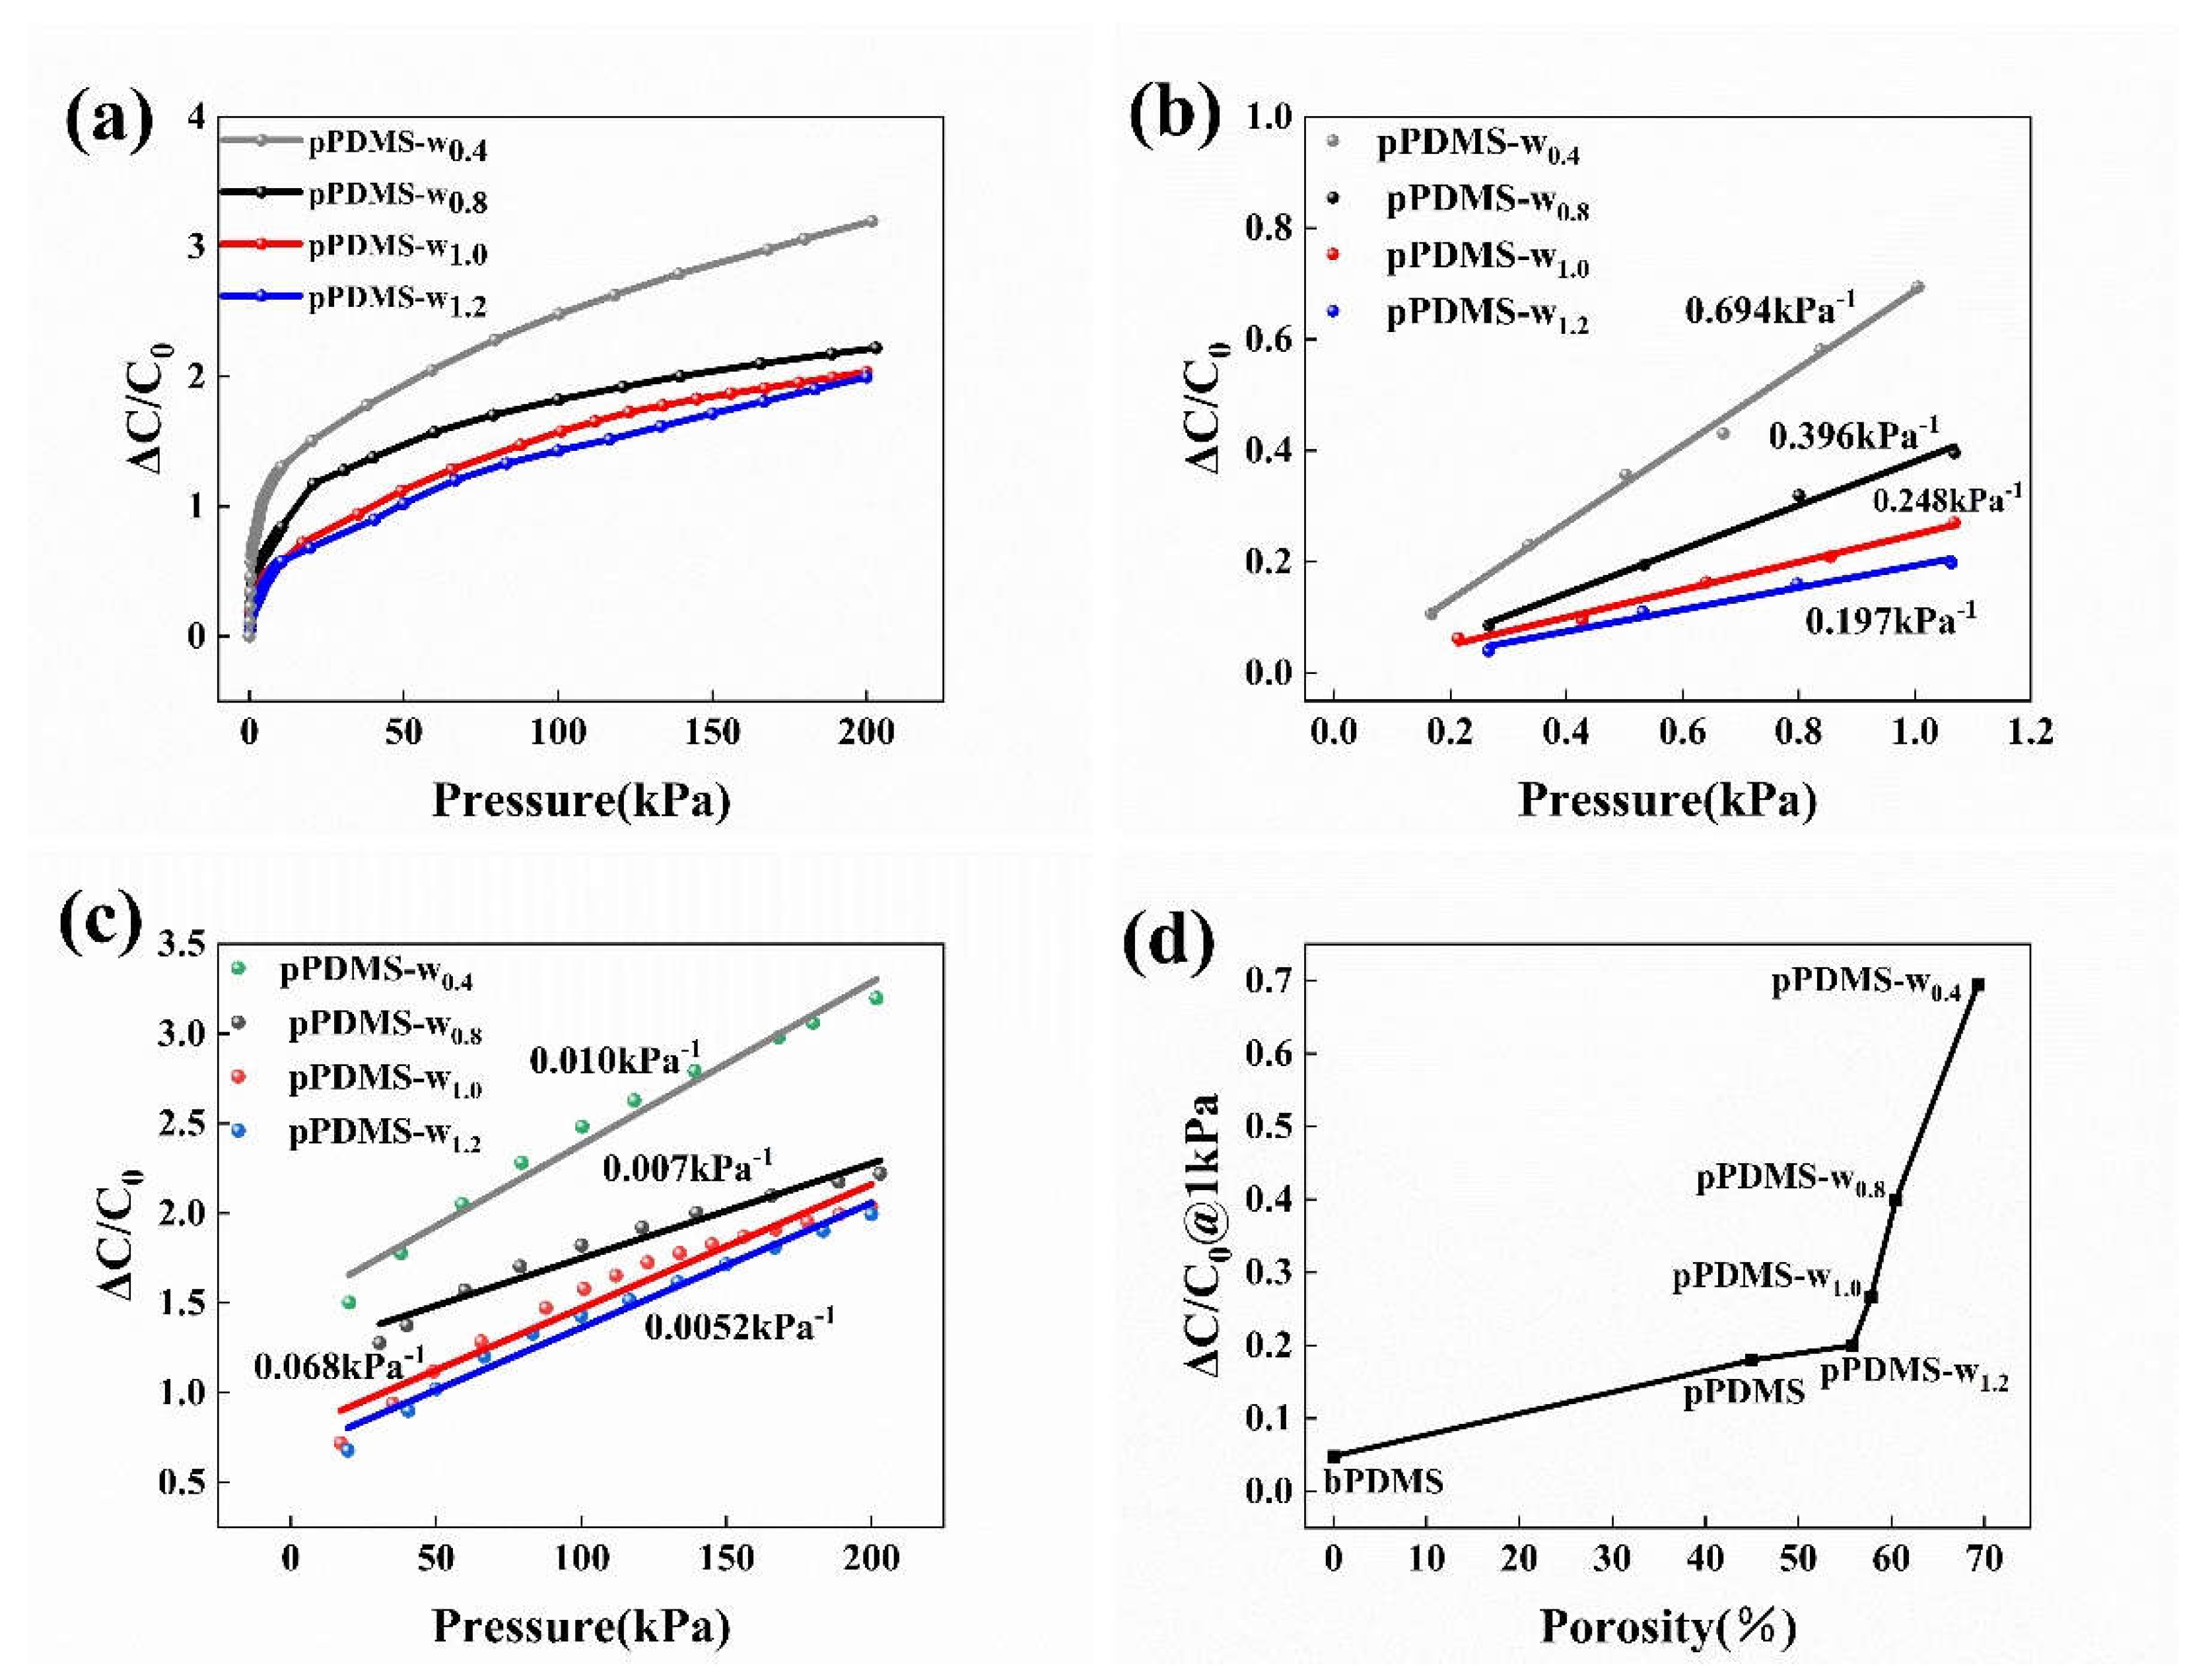
3.1. Measurement of Porosity in Porous Dielectric Layers
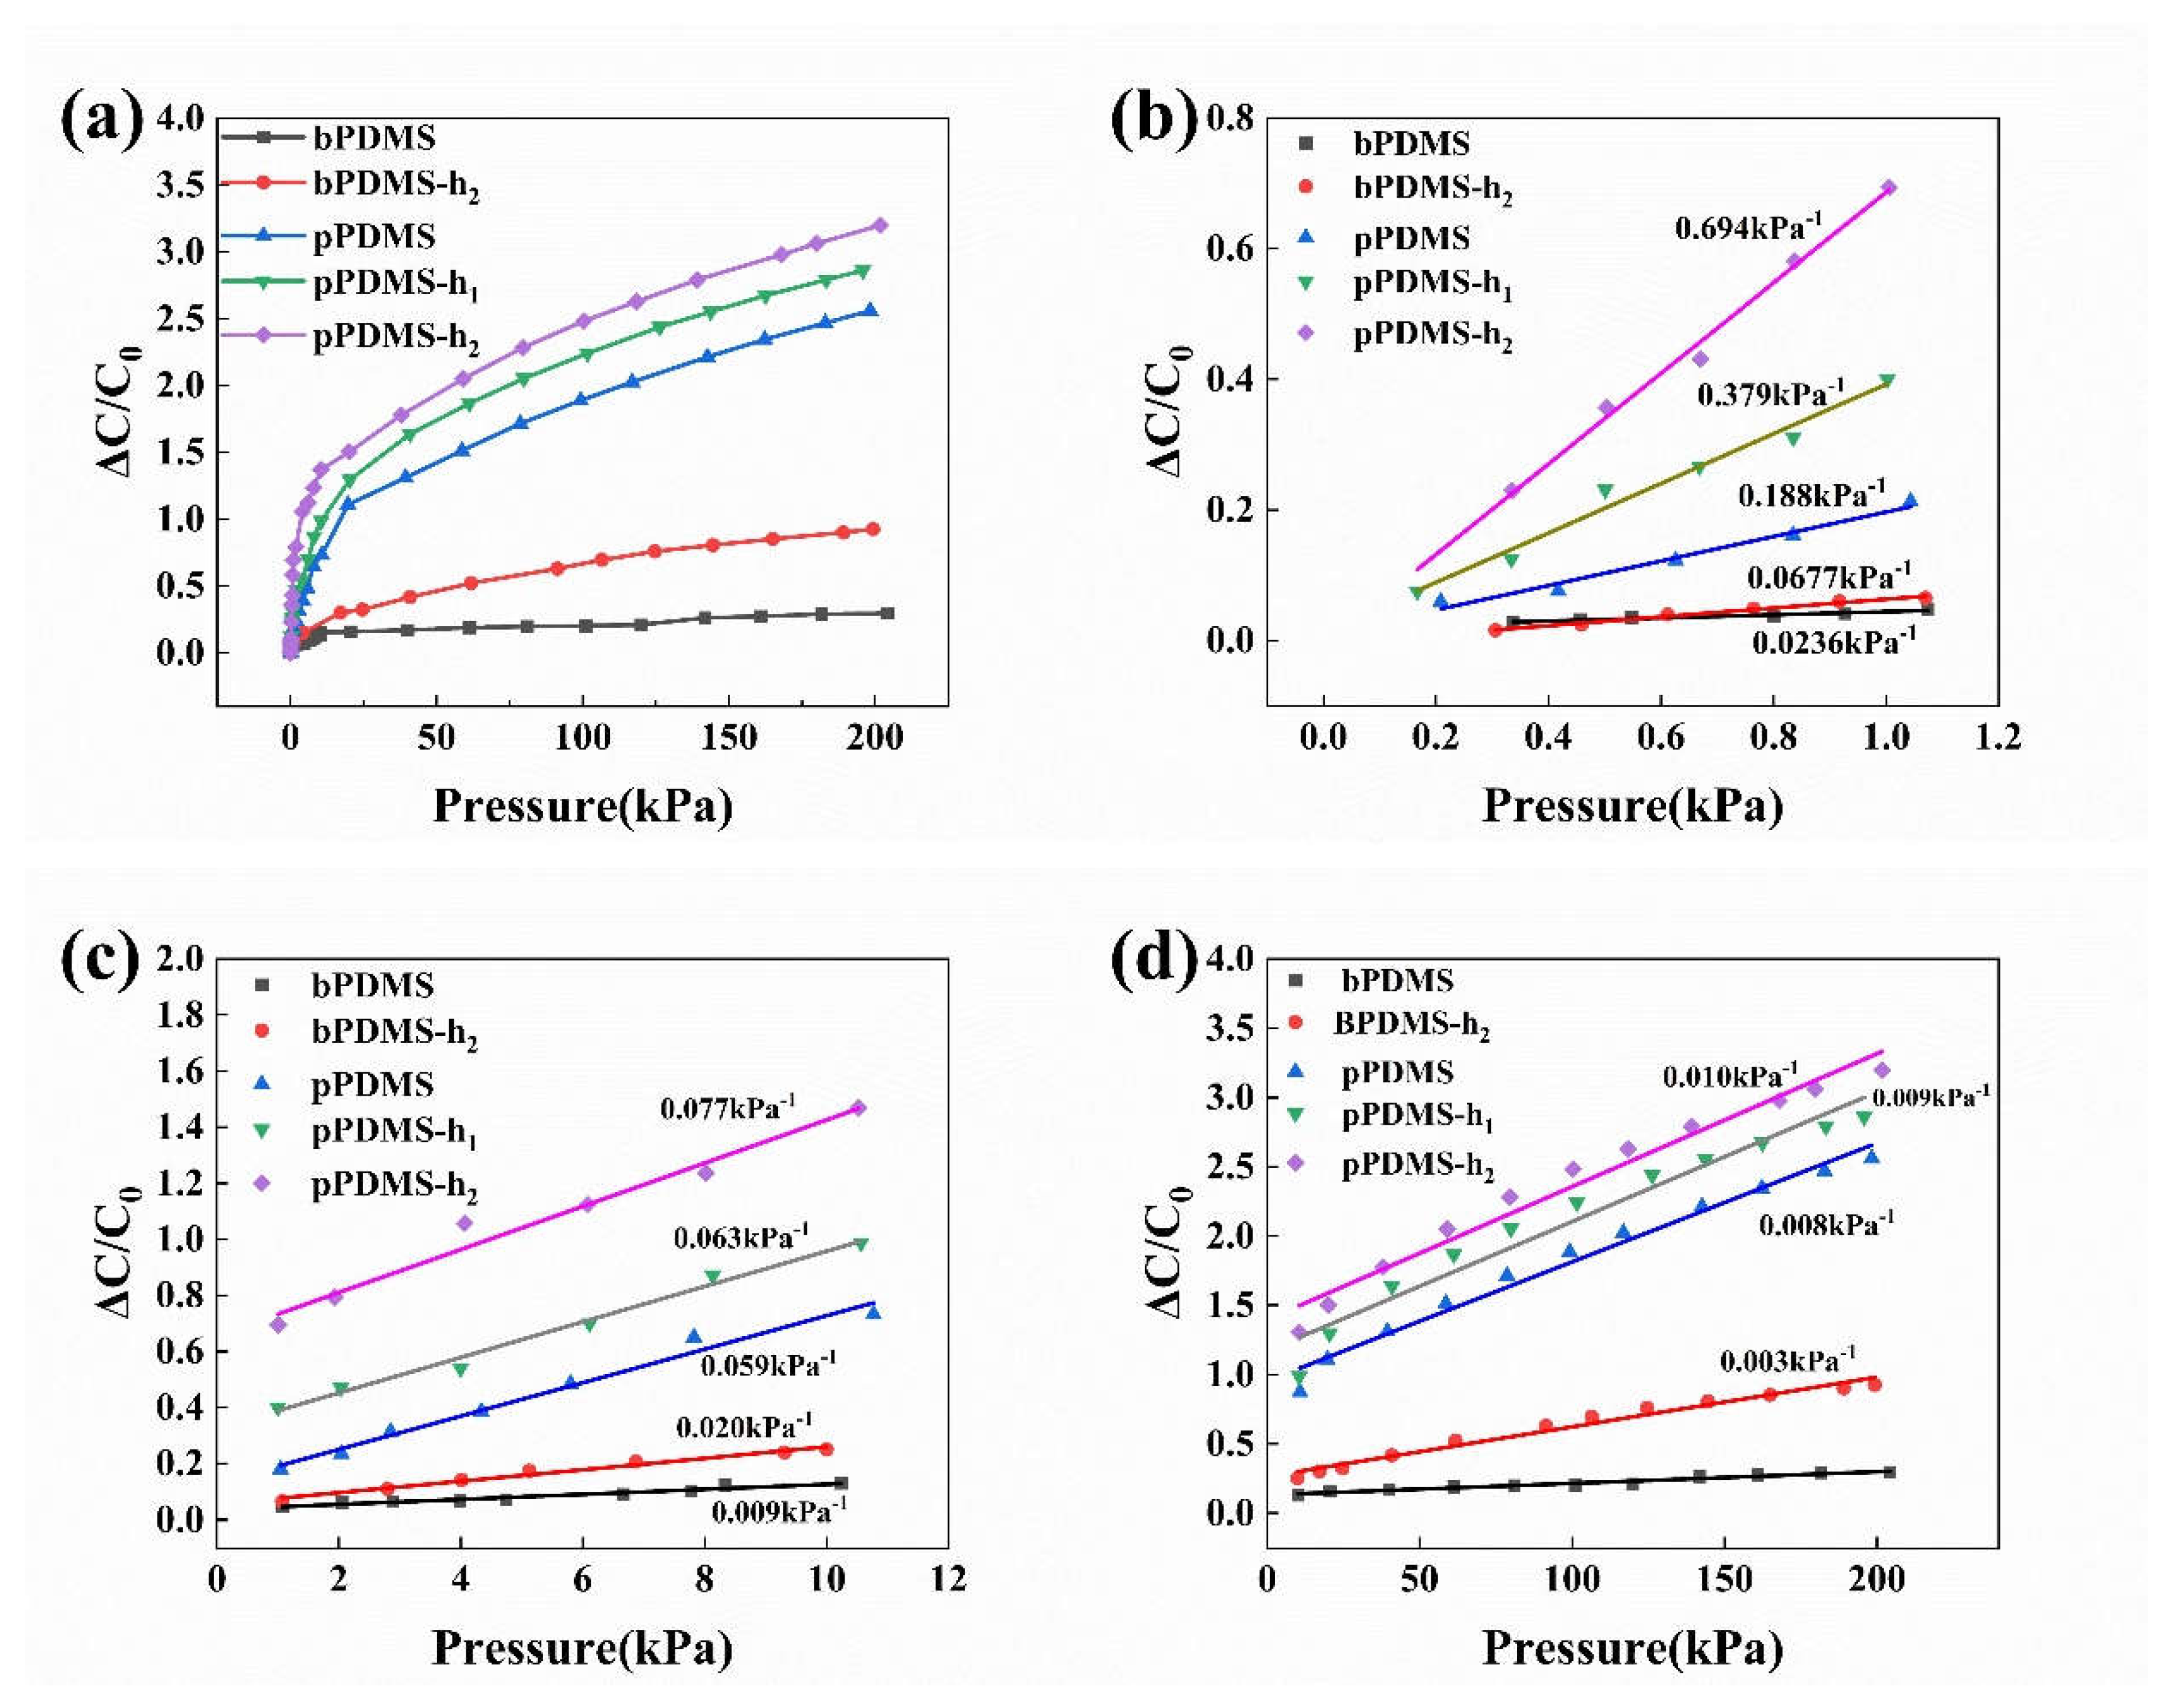
3.2. Characterization of Flexible Capacitive Sensors
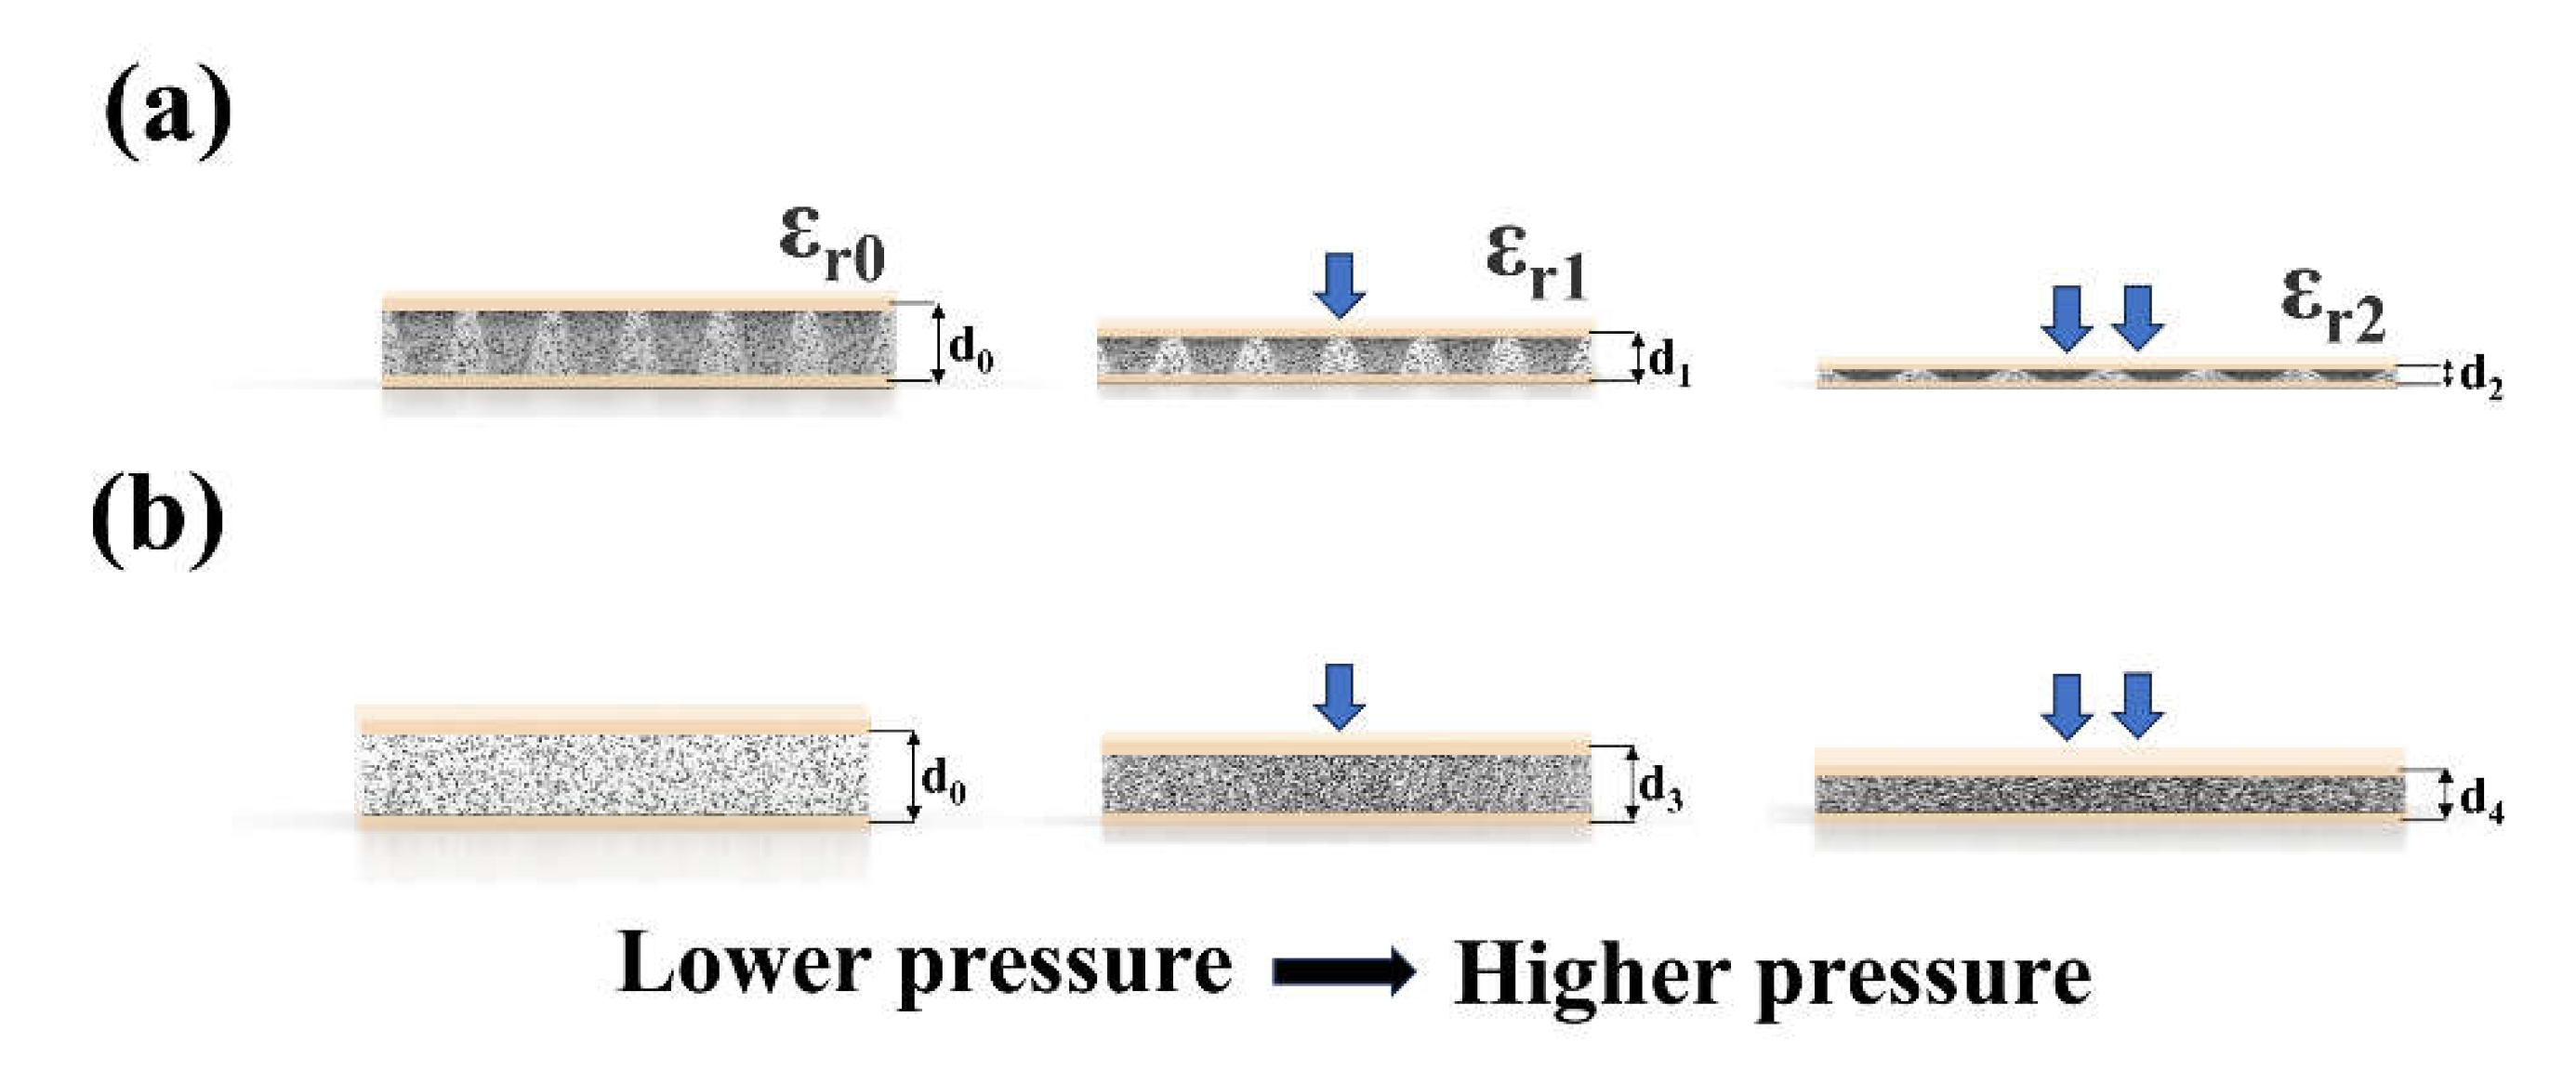
3.3. Sensing Mechanism of Capacitive Pressure Sensors
3.4. Sensor Performance Optimization and Improvement
3.5. The Comprehensive Performance of Flexible Capacitive Sensors
3.6. Performance Comparison of Different Porous Capacitive Pressure Sensors
3.7. Applications Related to Flexible Capacitive Pressure Sensors
4. Conclusions
Supplementary Materials
Author Contributions
Funding
Institutional Review Board Statement
Data Availability Statement
Acknowledgments
Conflicts of Interest
References
- Hu, T.; Sheng, B. A Highly Sensitive Strain Sensor with Wide Linear Sensing Range Prepared on a Hybrid-Structured CNT/Ecoflex Film via Local Regulation of Strain Distribution. Acs Applied Materials & Interfaces 2024, 16, 21061-21072. [CrossRef]
- Zhou, J.Y.; Zhao, S.S.; Tang, L.; Zhang, D.W.; Sheng, B. Programmable and Weldable Superelastic EGaIn/TPU Composite Fiber by Wet Spinning for Flexible Electronics. Acs Applied Materials & Interfaces 2023, 15, 57533-57544. [CrossRef]
- Si, R.; Chen, W.; Chen, J.; Yang, Y.; Zhou, W.; Zhang, Q.; Chen, C.; Han, B. Green chemistry fabrication of durable antimicrobial peptide- immobilized silk fibroin films for accelerated full-thickness wound healing. Materials Today Chemistry 2023, 29, 12. [CrossRef]
- Zhong, W.; Ming, X.; Jiang, H.; Ke, Y.; Ding, X.; Li, M.; Jia, K.; Wang, D. Full-Textile Human Motion Detection Systems Integrated by Facile Weaving with Hierarchical Core-Shell Piezoresistive Yarns. Acs Applied Materials & Interfaces 2021, 13, 52901-52911. [CrossRef]
- Lin, Q.; Huang, J.; Yang, J.; Huang, Y.; Zhang, Y.; Wang, Y.; Zhang, J.; Wang, Y.; Yuan, L.; Cai, M.; et al. Highly Sensitive Flexible Iontronic Pressure Sensor for Fingertip Pulse Monitoring. Advanced Healthcare Materials 2020, 9. [CrossRef]
- Yang, L.; Wang, H.; Yuan, W.; Li, Y.; Gao, P.; Tiwari, N.; Chen, X.; Wang, Z.; Niu, G.; Cheng, H. Wearable Pressure Sensors Based on MXene/Tissue Papers for Wireless Human Health Monitoring. Acs Applied Materials & Interfaces 2021, 13, 60531-60543. [CrossRef]
- Zhu, B.; Xu, Z.; Liu, X.; Wang, Z.; Zhang, Y.; Chen, Q.; Teh, K.S.; Zheng, J.; Du, X.; Wu, D. High-Linearity Flexible Pressure Sensor Based on the Gaussian-Curve-Shaped Microstructure for Human Physiological Signal Monitoring. Acs Sensors 2023, 8, 3127-3135. [CrossRef]
- Vinh Van, T.; Lee, S.; Lee, D.; Thanh-Hai, L. Recent Developments and Implementations of Conductive Polymer-Based Flexible Devices in Sensing Applications. Polymers 2022, 14. [CrossRef]
- Sakhuja, N.; Kumar, R.; Katare, P.; Bhat, N. Structure-Driven, Flexible, Multilayered, Paper-Based Pressure Sensor for Human-Machine Interfacing. Acs Sustainable Chemistry & Engineering 2022, 10, 9697-9706,. [CrossRef]
- Wang, Y.; Duan, S.; Liu, J.; Zhao, F.; Chen, P.; Shi, Q.; Wu, J. Highly-sensitive expandable microsphere-based flexible pressure sensor for human-machine interaction. Journal of Micromechanics and Microengineering 2023, 33. [CrossRef]
- Yuan, Y.; Xu, H.; Zheng, W.; Liu, M.; Li, S.; Yan, J.; Wang, D.; Liu, K.; Zhang, H.; Chen, G.; et al. Bending and Stretching-Insensitive, Crosstalk-Free, Flexible Pressure Sensor Arrays for Human-Machine Interactions. Advanced Materials Technologies 2024, 9. [CrossRef]
- Franco, M.; Correia, V.; Marques, P.; Sousa, F.; Silva, R.; Figueiredo, B.R.; Bernardes, A.; Silva, R.P.; Lanceros-Mendez, S.; Costa, P. Environmentally Friendly Graphene-Based Conductive Inks for Multitouch Capacitive Sensing Surfaces. Advanced Materials Interfaces 2021, 8. [CrossRef]
- Lei, M.; Feng, K.; Ding, S.; Wang, M.; Dai, Z.; Liu, R.; Gao, Y.; Zhou, Y.; Xu, Q.; Zhou, B. Breathable and Waterproof Electronic Skin with Three-Dimensional Architecture for Pressure and Strain Sensing in Nonoverlapping Mode. Acs Nano 2022, 16, 12620-12634. [CrossRef]
- Yang, C.; Wang, W.; Zhang, B.; Liu, W.; Zhang, H.; Zhang, D. High sensitivity SnSe2/MWCNTs flexible pressure sensors based on a lotus leaf biomimetic microstructure for electronic skin. Journal of Materials Chemistry C 2024. [CrossRef]
- Veeramuthu, L.; Cho, C.-J.; Liang, F.-C.; Venkatesan, M.; Kumar, G.R.; Hsu, H.-Y.; Chung, R.-J.; Lee, C.-H.; Lee, W.-Y.; Kuo, C.-C. Human Skin-Inspired Electrospun Patterned Robust Strain-Insensitive Pressure Sensors and Wearable Flexible Light-Emitting Diodes. Acs Applied Materials & Interfaces 2022, 14, 30160-30173. [CrossRef]
- Cao, M.; Su, J.; Fan, S.; Qiu, H.; Su, D.; Li, L. Wearable piezoresistive pressure sensors based on 3D graphene. Chemical Engineering Journal 2021, 406,. [CrossRef]
- Huang, X.; Zhang, X. Investigating the advanced characteristics of SiC based piezoresistive pressure sensors. Materials Today Communications 2020, 25,. [CrossRef]
- Kim, H.; Kim, G.; Kim, T.; Lee, S.; Kang, D.; Hwang, M.-S.; Chae, Y.; Kang, S.; Lee, H.; Park, H.-G.; et al. Transparent, Flexible, Conformal Capacitive Pressure Sensors with Nanoparticles. Small 2018, 14. [CrossRef]
- Li, J.; Chen, S.; Zhou, J.; Tang, L.; Jiang, C.; Zhang, D.; Sheng, B. Flexible BaTiO(3)-PDMS Capacitive Pressure Sensor of High Sensitivity with Gradient Micro-Structure by Laser Engraving and Molding. Polymers (Basel) 2023, 15. [CrossRef]
- Wang, H.; Li, Z.; Liu, Z.; Fu, J.; Shan, T.; Yang, X.; Lei, Q.; Yang, Y.; Li, D. Flexible capacitive pressure sensors for wearable electronics. Journal of Materials Chemistry C 2022, 10, 1594-1605. [CrossRef]
- Lei, Y.; Yang, J.; Xiong, Y.; Wu, S.; Guo, W.; Liu, G.-S.; Sun, Q.; Wang, Z.L. Surface engineering AgNW transparent conductive films for triboelectric nanogenerator and self-powered pressure sensor. Chemical Engineering Journal 2023, 462. [CrossRef]
- Zhong, Y.; Wang, J.; Wu, L.; Liu, K.; Dai, S.; Hua, J.; Cheng, G.; Ding, J. Dome-Conformal Electrode Strategy for Enhancing the Sensitivity of BaTiO3-Doped Flexible Self-powered Triboelectric Pressure Sensor. Acs Applied Materials & Interfaces 2023, 16, 1727-1736. [CrossRef]
- Wang, B.; Liu, C.; Xiao, Y.; Zhong, J.; Li, W.; Cheng, Y.; Hu, B.; Huang, L.; Zhou, J. Ultrasensitive cellular fluorocarbon piezoelectret pressure sensor for self-powered human physiological monitoring. Nano Energy 2017, 32, 42-49. [CrossRef]
- Cao, S.; Li, R.; Panahi-Sarmad, M.; Chen, T.; Xiao, X. A Flexible and Highly Sensitive Capacitive Pressure Sensor With Microstructured Dielectric TPU Layer Based on Mesh Fabric as Template. Ieee Sensors Journal 2022, 22, 20276-20284. [CrossRef]
- Huang, Y.; Fan, X.; Chen, S.-C.; Zhao, N. Emerging Technologies of Flexible Pressure Sensors: Materials, Modeling, Devices, and Manufacturing. Advanced Functional Materials 2019, 29. [CrossRef]
- Ye, J.; Chen, K.; Chen, L.; You, Z.; Jiang, J.; Wu, H. Highly linear capacitive tactile sensor with elastic dome-shaped electrodes. Smart Materials and Structures 2022, 31. [CrossRef]
- Lipomi, D.J.; Vosgueritchian, M.; Tee, B.C.K.; Hellstrom, S.L.; Lee, J.A.; Fox, C.H.; Bao, Z. Skin-like pressure and strain sensors based on transparent elastic films of carbon nanotubes. Nature Nanotechnology 2011, 6, 788-792. [CrossRef]
- Viry, L.; Levi, A.; Totaro, M.; Mondini, A.; Mattoli, V.; Mazzolai, B.; Beccai, L. Flexible Three-Axial Force Sensor for Soft and Highly Sensitive Artificial Touch. Advanced Materials 2014, 26, 2659-2664. [CrossRef]
- Zhang, H.; Wang, M.Y.; Li, J.; Zhu, J. A soft compressive sensor using dielectric elastomers. Smart Materials and Structures 2016, 25. [CrossRef]
- Ariati, R.; Sales, F.; Souza, A.; Lima, R.A.; Ribeiro, J. Polydimethylsiloxane Composites Characterization and Its Applications: A Review. Polymers 2021, 13. [CrossRef]
- Li, R.; Zhou, Q.; Bi, Y.; Cao, S.; Xia, X.; Yang, A.; Li, S.; Xiao, X. Research progress of flexible capacitive pressure sensor for sensitivity enhancement approaches. Sensors and Actuators a-Physical 2021, 321. [CrossRef]
- Mannsfeld, S.C.B.; Tee, B.C.K.; Stoltenberg, R.M.; Chen, C.; Barman, S.; Muir, B.V.O.; Sokolov, A.N.; Reese, C.; Bao, Z.N. Highly sensitive flexible pressure sensors with microstructured rubber dielectric layers. Nature Materials 2010, 9, 859-864. [CrossRef]
- Yang, J.C.; Kim, J.-O.; Oh, J.; Kwon, S.Y.; Sim, J.Y.; Kim, D.W.; Choi, H.B.; Park, S. Microstructured Porous Pyramid-Based Ultrahigh Sensitive Pressure Sensor Insensitive to Strain and Temperature. Acs Applied Materials & Interfaces 2019, 11, 19472-19480. [CrossRef]
- Wang, S.; Fan, X.; Zhang, Z.; Su, Z.; Ding, Y.; Yang, H.; Zhang, X.; Wang, J.; Zhang, J.; Hu, P. A Skin-Inspired High-Performance Tactile Sensor for Accurate Recognition of Object Softness. Acs Nano 2024, 18, 17175-17184. [CrossRef]
- Javidi, R.; Zand, M.M.; Majd, S.A. Numerical simulation analysis of flexible capacitive pressure sensors based on porous pyramidal microstructures. Journal of Computational Electronics 2024, 23, 108-121. [CrossRef]
- Li, X.; Liu, Y.; Ding, Y.; Zhang, M.; Lin, Z.; Hao, Y.; Li, Y.; Chang, J. Capacitive Pressure Sensor Combining Dual Dielectric Layers with Integrated Composite Electrode for Wearable Healthcare Monitoring. Acs Applied Materials & Interfaces 2024, 16, 12974-12985. [CrossRef]
- Rawal, G.; Ghatak, A. Highly sensitive flexible capacitive pressure sensor with structured elastomeric dielectric layers. Journal of Micromechanics and Microengineering 2024, 34. [CrossRef]
- Sumer, B.; Koc, I.M. Fabrication of a Flexible Tactile Sensor with Micro-Pillar Array. In Proceedings of the Conference on EUROSENSORS, Freiberg, GERMANY, 2015, Sep 06-09, 2015; pp. 134-137.
- Luo, Y.; Shao, J.; Chen, S.; Chen, X.; Tian, H.; Li, X.; Wang, L.; Wang, D.; Lu, B. Flexible Capacitive Pressure Sensor Enhanced by Tilted Micropillar Arrays. Acs Applied Materials & Interfaces 2019, 11, 17796-17803. [CrossRef]
- Jiang, C.; Sheng, B. Linear Capacitive Pressure Sensor with Gradient Architecture through Laser Ablation on MWCNT/Ecoflex Film. Polymers (Basel) 2024, 16. [CrossRef]
- Lee, S.; Liang, X.; Kim, J.S.; Yokota, T.; Fukuda, K.; Someya, T. Permeable Bioelectronics toward Biointegrated Systems. Chem Rev 2024, 124, 6543-6591. [CrossRef]
- Ha, K.H.; Huh, H.; Li, Z.J.; Lu, N.S. Soft Capacitive Pressure Sensors: Trends, Challenges, and Perspectives. Acs Nano 2022, 16, 3442-3448. [CrossRef]
- Ma, Z.Y.; Zhang, Y.; Zhang, K.Y.; Deng, H.; Fu, Q. Recent progress in flexible capacitive sensors: Structures and properties. Nano Materials Science 2023, 5, 265-277. [CrossRef]
- Zhu, D.; Handschuh-Wang, S.; Zhou, X. Recent progress in fabrication and application of polydimethylsiloxane sponges. Journal of Materials Chemistry A 2017, 5, 16467-16497. [CrossRef]
- Li, W.; Jin, X.; Zheng, Y.; Chang, X.; Wang, W.; Lin, T.; Zheng, F.; Onyilagha, O.; Zhu, Z. A porous and air gap elastomeric dielectric layer for wearable capacitive pressure sensor with high sensitivity and a wide detection range. Journal of Materials Chemistry C 2020, 8, 11468-11476. [CrossRef]
- Jung, Y.; Lee, W.; Jung, K.; Park, B.; Park, J.; Ko, J.; Cho, H. A Highly Sensitive and Flexible Capacitive Pressure Sensor Based on a Porous Three-Dimensional PDMS/Microsphere Composite. Polymers 2020, 12. [CrossRef]
- Atalay, O.; Atalay, A.; Gafford, J.; Walsh, C. A Highly Sensitive Capacitive-Based Soft Pressure Sensor Based on a Conductive Fabric and a Microporous Dielectric Layer. Advanced Materials Technologies 2018, 3. [CrossRef]
- Park, S.W.; Das, P.S.; Chhetry, A.; Park, J.Y. A Flexible Capacitive Pressure Sensor for Wearable Respiration Monitoring System. Ieee Sensors Journal 2017, 17, 6558-6564. [CrossRef]
- Masihi, S.; Panahi, M.; Maddipatla, D.; Hanson, A.J.; Bose, A.K.; Hajian, S.; Palaniappan, V.; Narakathu, B.B.; Bazuin, B.J.; Atashbar, M.Z. Highly Sensitive Porous PDMS-Based Capacitive Pressure Sensors Fabricated on Fabric Platform for Wearable Applications. Acs Sensors 2021, 6, 938-949. [CrossRef]
- Chen, S.; Zhuo, B.; Guo, X. Large Area One-Step Facile Processing of Microstructured Elastomeric Dielectric Film for High Sensitivity and Durable Sensing over Wide Pressure Range. Acs Applied Materials & Interfaces 2016, 8, 20364-20370. [CrossRef]
- Jung, S.; Kim, J.H.; Kim, J.; Choi, S.; Lee, J.; Park, I.; Hyeon, T.; Kim, D.-H. Reverse-Micelle-Induced Porous Pressure-Sensitive Rubber for Wearable Human-Machine Interfaces. Advanced Materials 2014, 26, 4825-+. [CrossRef]
- Karagiorgis, X.; Khandelwal, G.; Beniwal, A.; Chirila, R.; Skabara, P.J.; Dahiya, R. Polydimethylsiloxane Foam-Based Fully 3D Printed Soft Pressure Sensors. Advanced Intelligent Systems 2023. [CrossRef]
- Wang, Y.; Li, Y.; Song, Y.; Gao, Z. Flexible Capacitive Pressure Sensors and Their Applications in Electronic Skin. Conference Paper, 2023.
- Zhong, Y.; Wu, L.; Gu, F.; Wang, J.; Dai, S.; Zhu, H.; Cheng, G.; Ding, J. Negative pressure-assisted porous structure with gradient dielectrics design for linearity enhancement of flexible capacitance pressure sensor. Colloids and Surfaces a-Physicochemical and Engineering Aspects 2023, 676. [CrossRef]
- Giustiniani, A.; Guegan, P.; Marchand, M.; Poulard, C.; Drenckhan, W. Generation of Silicone Poly-HIPEs with Controlled Pore Sizes via Reactive Emulsion Stabilization. Macromolecular Rapid Communications 2016, 37, 1527-1532. [CrossRef]
- Kim, Y.; Yang, H.; Oh, J.H. Simple fabrication of highly sensitive capacitive pressure sensors using a porous dielectric layer with cone-shaped patterns. Materials & Design 2021, 197. [CrossRef]
- Yoon, S.; Seok, M.; Kim, M.; Cho, Y.-H. Wearable porous PDMS layer of high moisture permeability for skin trouble reduction. Scientific Reports 2021, 11. [CrossRef]
- Pan, S.; Li, Q.; Xian, Z.; Su, N.; Zeng, F. The Effects of Laser Parameters and the Ablation Mechanism in Laser Ablation of C/SiC Composite. Materials 2019, 12. [CrossRef]
- Liu, Q.; Liu, Y.; Shi, J.; Liu, Z.; Wang, Q.; Guo, C.F. High-Porosity Foam-Based Iontronic Pressure Sensor with Superhigh Sensitivity of 9280 kPa-1. Nano-Micro Letters 2022, 14. [CrossRef]
- Qu, C.; Lu, M.; Zhang, Z.; Chen, S.; Liu, D.; Zhang, D.; Wang, J.; Sheng, B. Flexible Microstructured Capacitive Pressure Sensors Using Laser Engraving and Graphitization from Natural Wood. Molecules 2023, 28. [CrossRef]
- Shin, J.; Ko, J.; Jeong, S.; Won, P.; Lee, Y.; Kim, J.; Hong, S.; Li Jeon, N.; Ko, S.H. Monolithic digital patterning of polydimethylsiloxane with successive laser pyrolysis. Nature Materials 2021, 20, 100-107. [CrossRef]
- Chortos, A.; Bao, Z.N. Skin-inspired electronic devices. Materials Today 2014, 17, 321-331. [CrossRef]
- Chhetry, A.; Yoon, H.; Park, J.Y. A flexible and highly sensitive capacitive pressure sensor based on conductive fibers with a microporous dielectric for wearable electronics. Journal of Materials Chemistry C 2017, 5, 10068-10076. [CrossRef]
- Chen, Y.; Zhang, P.; Li, Y.; Zhang, K.; Su, J.; Huang, L. Flexible capacitive pressure sensor based on multi-walled carbon nanotubes microstructure electrodes. Journal of Physics D-Applied Physics 2021, 54. [CrossRef]
- Fu, M.; Zhang, J.M.; Jin, Y.M.; Zhao, Y.; Huang, S.Y.; Guo, C.F. A Highly Sensitive, Reliable, and High-Temperature-Resistant Flexible Pressure Sensor Based on Ceramic Nanofibers. Advanced Science 2020, 7, 8. [CrossRef]
- Yoon, J.I.; Choi, K.S.; Chang, S.P. A novel means of fabricating microporous structures for the dielectric layers of capacitive pressure sensor. Microelectronic Engineering 2017, 179, 60-66. [CrossRef]
- Bijender; Kumar, A. Flexible and wearable capacitive pressure sensor for blood pressure monitoring. Sensing and Bio-Sensing Research 2021, 33. [CrossRef]
- Xia, Y.; Gu, H.; Xu, L.; Chen, X.D.; Kirk, T.V. Extending Porous Silicone Capacitive Pressure Sensor Applications into Athletic and Physiological Monitoring. Sensors (Basel) 2021, 21. [CrossRef]
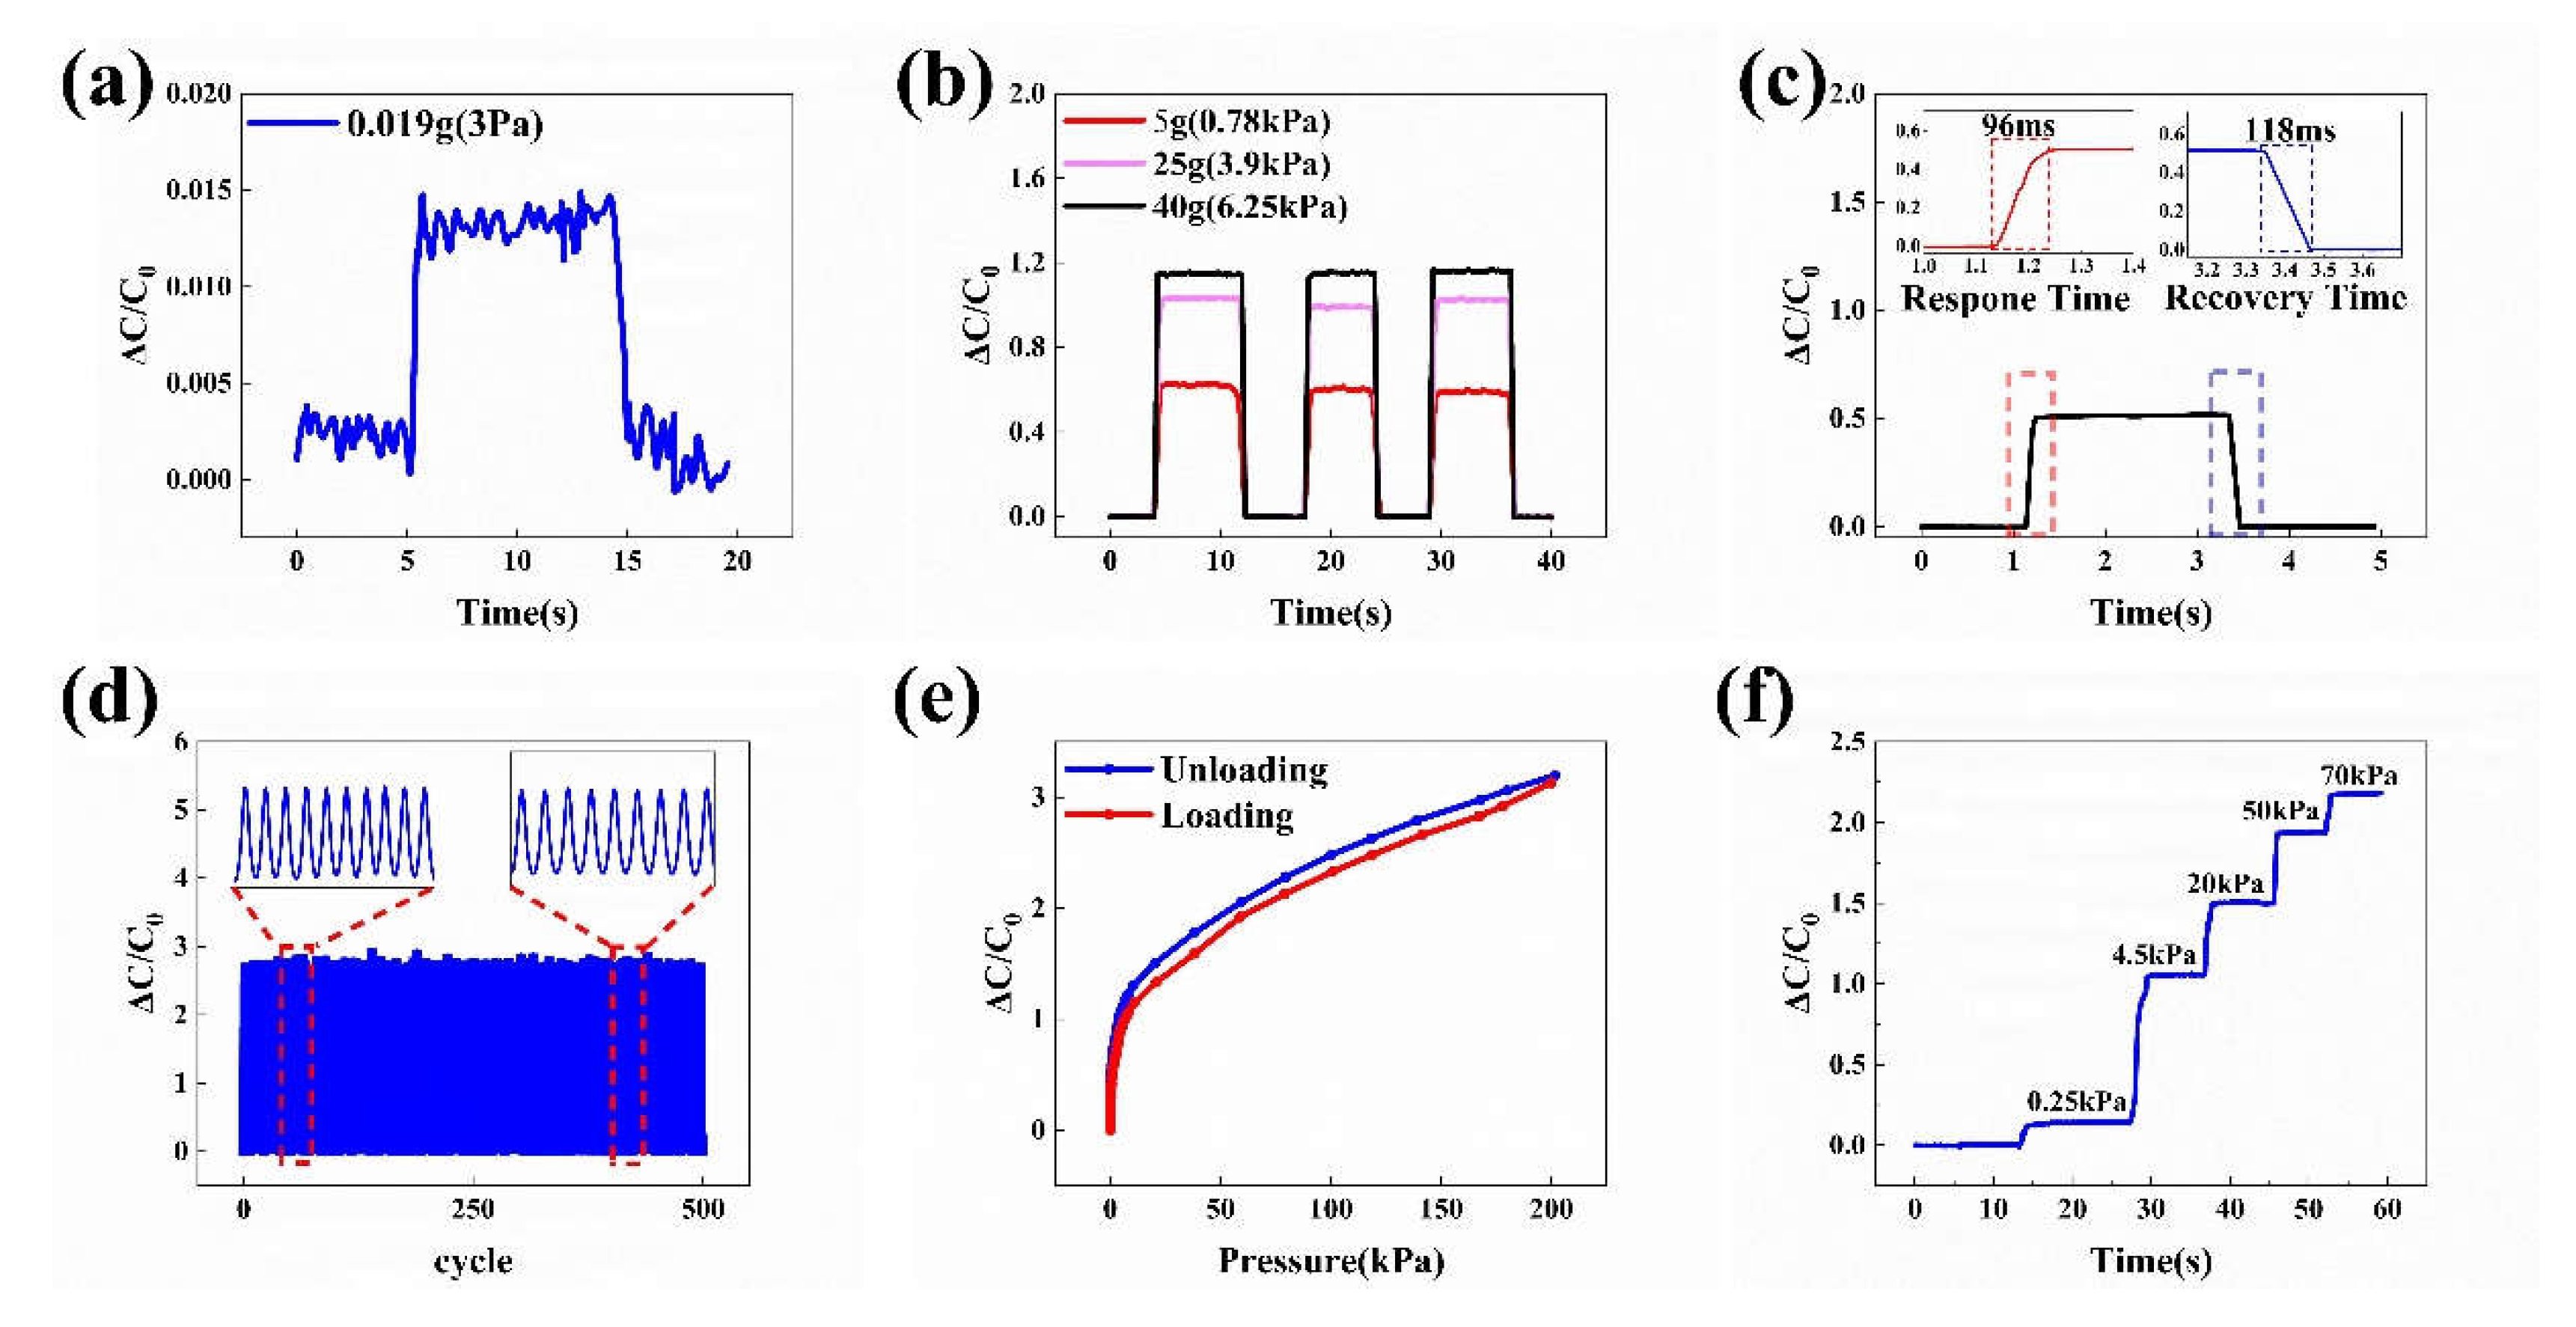
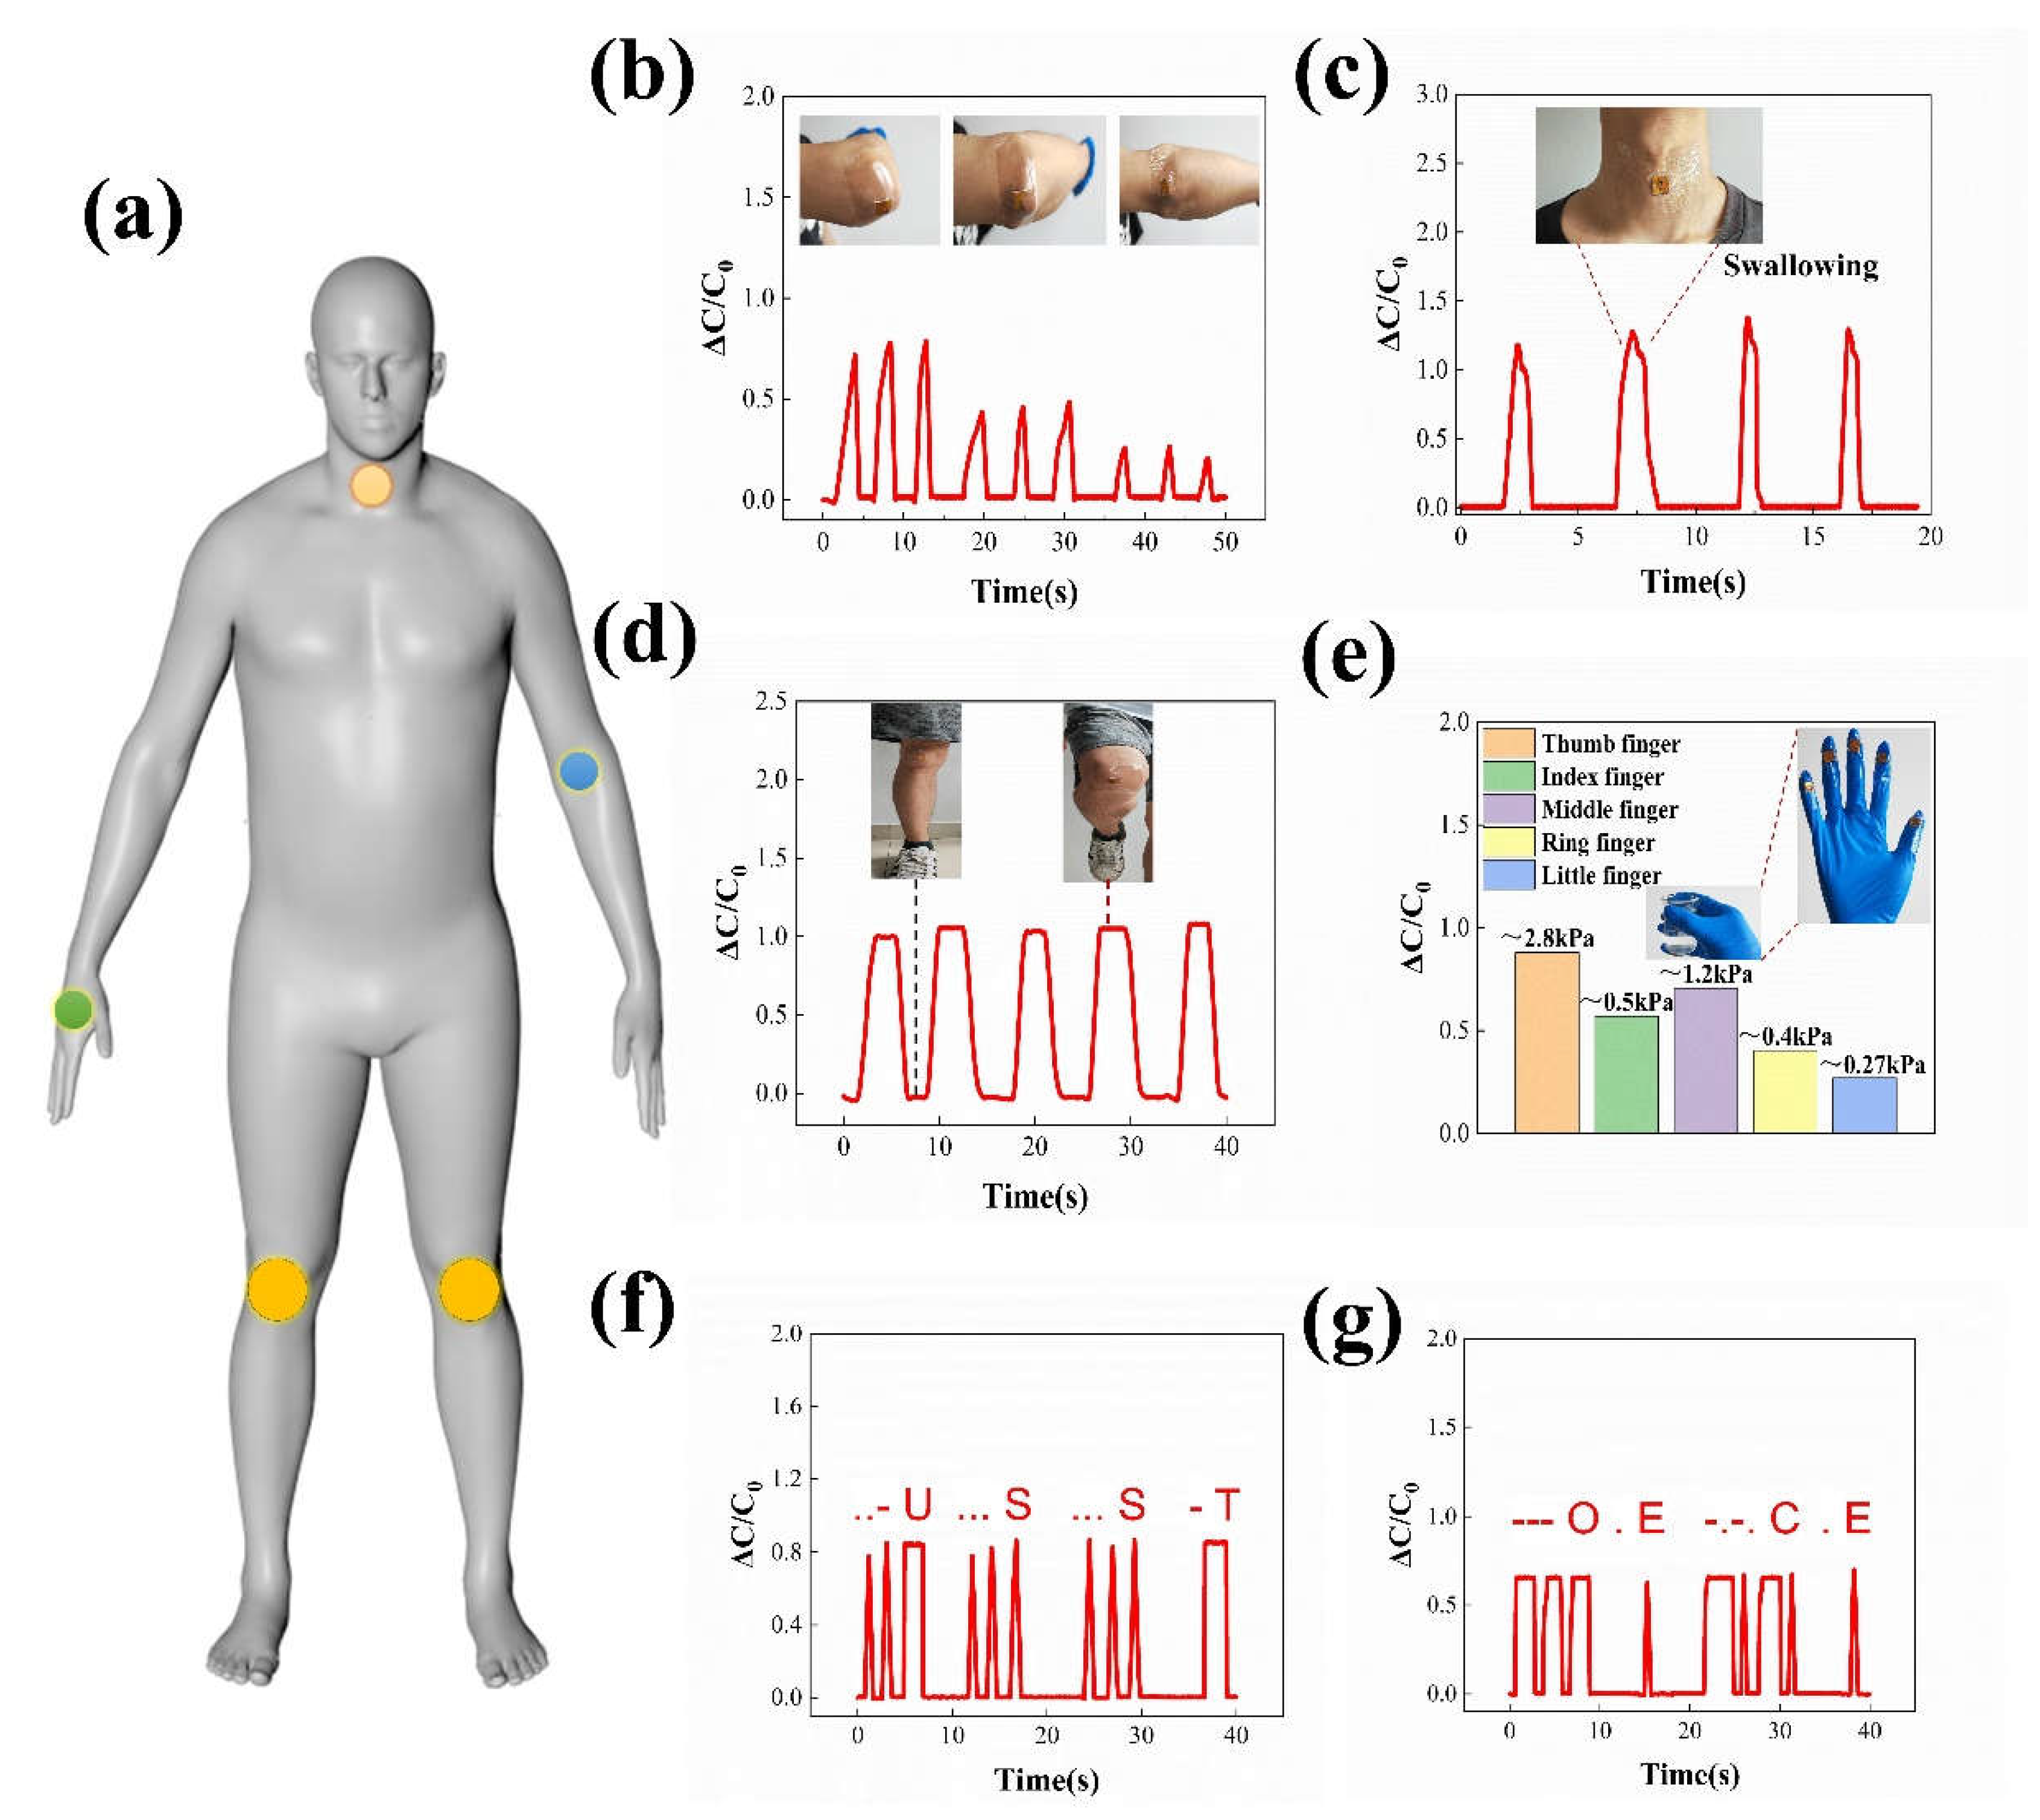
| Electrodes/Dielectric Layer | Key Materials to Fabricate the Dielectric | Pressure Range | Sensitivity | Response Time |
Reference |
|---|---|---|---|---|---|
| AgNPs-SBS/ Microporous PDMS |
PDMS/Glucose particles | 0-2kPa | 0.278kPa-1 | 340ms | [63] |
|
AgNWs and CFs-PDMS/ Microporous ecoflex |
Ecoflex/Sugar |
0-10kPa |
0.161kPa-1 |
NR |
[48] |
|
ITO coated flexible PET/ Porous PDMS Ag-TPU/ microporous PDMS |
PDMS/Sugar/Salt particles PDMS/NaHCO3/ HNO3 |
0-5kPa 0-50Pa 0.2-1MPa |
0.171kPa-1 0.3kPa-1 3.2MPa-1 |
162ms 116ms |
[66] [49] |
| ITO coated flexible PET/porous PDMS | PDMS/Deionized water | 0.1-0.5kPa |
0.095kPa-1 | 110ms | [67] |
|
CB-PDMS/ porous PDMS |
PDMS/Citric acid monohydrate |
0-4kPa 4-14kPa |
0.1kPa-1 0.049kPa-1 |
80ms |
[68] |
| PI-Cu/ microporous PDMS with holes array |
PDMS/Salt microparticles | 0-1kPa 1-10kPa 10-200kPa |
0.694kPa-1 0.077kPa-1 0.01kPa-1 |
96ms | This work |
Disclaimer/Publisher’s Note: The statements, opinions and data contained in all publications are solely those of the individual author(s) and contributor(s) and not of MDPI and/or the editor(s). MDPI and/or the editor(s) disclaim responsibility for any injury to people or property resulting from any ideas, methods, instructions or products referred to in the content. |
© 2024 by the authors. Licensee MDPI, Basel, Switzerland. This article is an open access article distributed under the terms and conditions of the Creative Commons Attribution (CC BY) license (http://creativecommons.org/licenses/by/4.0/).


