1. Introduction
Performing hydrodynamic model tests is standard practice for offshore structures and is often recommended or required by codes and classification societies [
1,
2]. As we venture into the world of sustainable energy, floating wind turbines (FWT) play a crucial role in capturing wind power in deeper waters. However, performing hydrodynamic model testing of FWT poses several challenges, the major one being the Froude-Reynolds scaling conflict, which prevents accurate modelling of rotor loads in hydrodynamic laboratories [
3]. Several techniques have been developed to address this issue, including performance-matched rotors [
4] and cyber-physical approaches [
5,
6]. The present paper focuses on the latter approach.
Generally speaking, cyber-physical testing is a method that combines numerical simulations with experimental testing. The goal of the method is to obtain more accurate results than what could be achieved with each method separately. In cyber-physical testing, a physical and numerical substructure are coupled in real-time using a control system. This technique has been applied to FWT testing for about a decade at SINTEF Ocean under the name ReaTHM
® testing
1 [
6,
7]. OpenFAST
2 has been used to compute the rotor loads. These are applied on the physical substructure (the floater in the hydrodynamic laboratory) using a Cable-Driven Parallel Robot (CDPR) [
8]. A CDPR consists in a set of winches, pulling each on a given point of the model. CDPR are used in several laboratories [
9,
10]. Current alternatives to CDPR are single fans [
5,
11] or multi-rotors [
12,
13,
14,
15].
There are significant differences between the actuators used in cyber-physical hydrodynamic testing: their intrusiveness in terms of weight and space, how many of the six load components they apply, how fast they respond to a commanded change of load, and how they cope with floater motions. The fidelity of cyber-physical tests relies on the performance of the control system as a whole [
16,
17], and of the actuators in particular. As of today, there is no standard way of assessing this performance.
The present paper proposes a set of short and targeted benchmark tests that aim at quantifying the performance of actuators used in cyber-physical FWT testing. They aim at verifying the performance of the actuator prior to running tests in a combined environment, and can be repeated on a regular basis to ensure a functional setup over long test programs. The procedure is exemplified by laboratory data acquired using SINTEF Ocean’s CDPR as a particular case. Note, however, that they are relevant for any actuator solutions and for other applications of cyber-physical testing beyond FWTs.
The paper is structured as follows. First, a general overview of the control loop used in cyber-physical hydrodynamic testing is presented, with a particular focus on the CDPR actuator. Then, two case studies are introduced involving wind/wave/current tests of 15MW FWTs, and illustrating the performance of the CDPR. In the fourth section, targeted benchmark tests for the CDPR are introduced, and it is shown how the performance of the CDPR obtained from these benchmark tests can be related to the tests performed in more complex wind/wave/current conditions. Conclusions are given in the last section.
2. Control Loop of a Cyber-Physical Model Test Using a Cable-Driven Parallel Robot (CDPR)
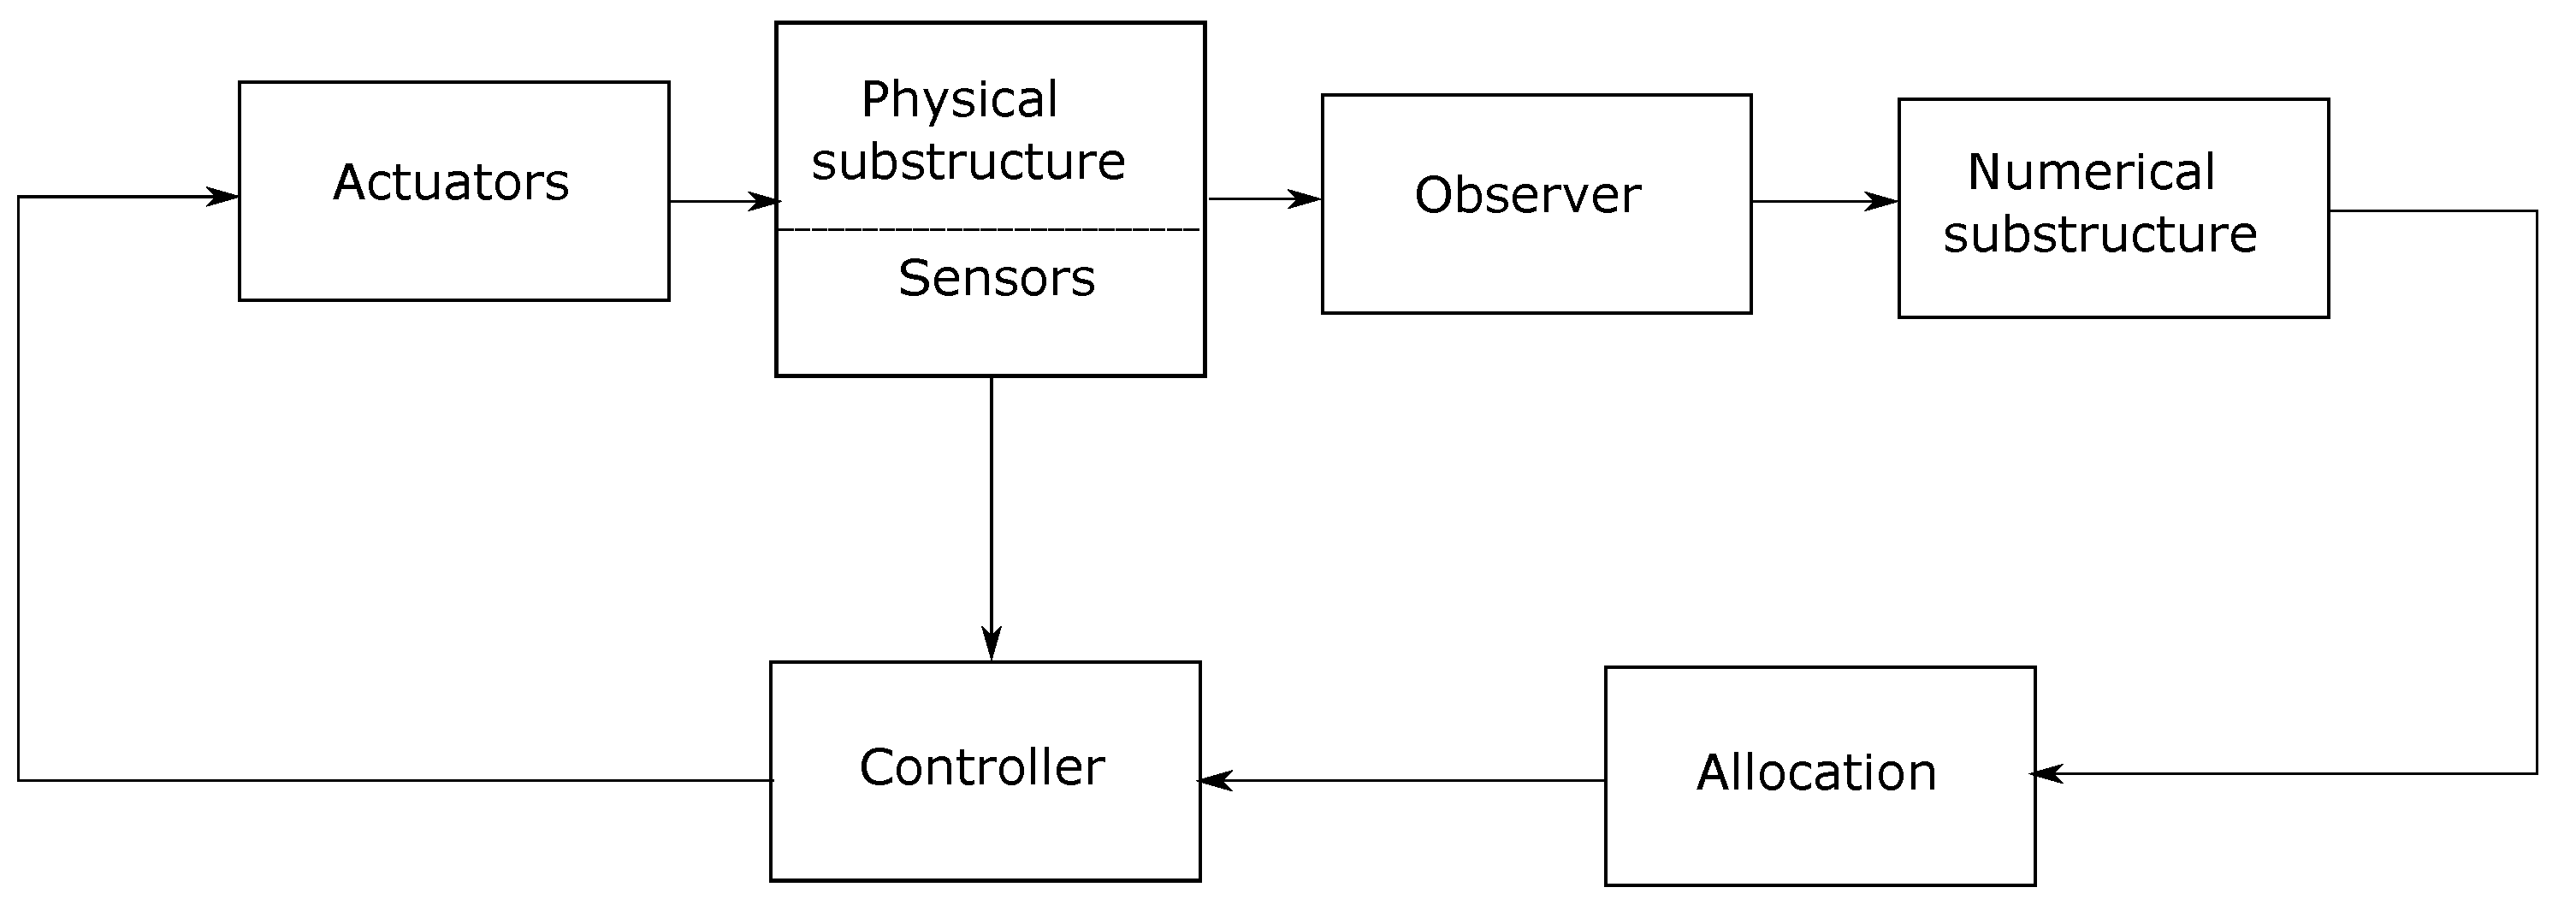
The typical control loop of a cyber-physical model test is illustrated in
Figure 1. When using a CDPR, the
actuators consist of several force-controlled winches located around the basin, which are attached to the model (referred to as the
physical substructure in
Figure 1).
Sensors mounted on the model typically include an accelerometer, a gyrometer, and an optical motion capture system that measures the floater’s position in six degrees of freedom (6DOF). The
Observer block in the control loop comprises a kinematic observer that estimates the position and velocities of the model, which are then used to calculate aerodynamic loads in the
Numerical substructure. The resulting desired loads are fed into the
allocation module, which calculates the target tension in each of the lines that yield the target load vector (commanded by the numerical substructure).
This control loop is rather generic and can be instantiated for various applications beyond FWT testing, such as testing of wind-assisted ships [
18], and estimation of nonlinear hydrodynamic loads on moored structures [
19]. In the following we will present in more details the working principle of the actuator (the CDPR), and the allocation module, which are of particular importance for the present paper. A thorough description of the force controller for each individual actuator has been given in [
20].
2.1. Coordinate System and Kinematic Transformations
We follow the notations of [
21, Chapter 2] and define two frames of references: the first one is Earth-fixed and denoted
. The second one is fixed to the FWT and denoted
. Two direct coordinates systems
, and
, are associated with
and
, respectively, with reference points and orientations that depend on the application at hand. Typically, for FWT, point B is located at the tower top, and
is along the tower’s axis, pointing from the tower top to the tower base. The Earth-fixed
and
point towards the North and the East, and
and
coincide when the FWT is at rest.
The position of
relative to
is described by the position of B in
The orientation, also known as
attitude, of
relative to
is described by the Euler angles
which denote the roll, pitch and yaw angles, respectively. The body
pose vector is
The rotation matrix
maps vectors from
to
:
with,
leading to
2.2. Load Applied by the CDPR from the TensionT in the Cables
The CDPR consists of a set of
actuators (typically 6 or 7 for FWT testing) mounted around the hydrodynamic laboratory, each connected with a cable to a frame located on the top of the FWT. See, for example, [
8] for alternative CDPR configurations. For each actuator
, let
be the fixed position of the
actuator
around the basin. Similarly, let
the
attachment point of the corresponding line on the FWT (often called the "end-effector" in the CDPR literature). The constant vector
in
describes the position of
with respect to
B. It follows that the absolute position of
in
is
For each actuator
, let now
be the force acting on the FWT at
, equal to
where the cable tensions are gathered in a vector
, and
is a unit vector given by
We then define the load vector
applied by the CDPR. Note that
is expressed in the local coordinate system
, such that
would for example refer to a "surge force", and not a "North force".
The so-called Jacobian matrix (or configuration matrix)
links the tension in the cables to the load vector
by
where
where the transformation
expresses line
i’s direction in
, and the cross-product computes the moment of the force
about the point B.
Note that J varies in time due to variations of the attitude of the FWT, and to the variation of the position p of the FWT involved in the expression of . To compute the load applied by the CDPR, it is therefore important to keep precise track of the tension in the cables and on the pose of the FWT.
2.3. Tension Allocation
In the previous section, equation (
10) linked the tension
T in the cables to the load
applied on the FWT. During cyber-physical tests, tension
allocation consists in choosing
T such that the resulting load
matches a desired reference load
. The integer
is the number of components of the rotor loads that one wishes to apply. Typically, in the context of FWT testing, the heave load is not of importance and can be neglected [
22], while all other load components are included, so
.
The allocation problem is cast as the following optimization problem:
where
is a preferred set of tensions (which we will come back to), and
is the Jacobian matrix expressed in (
11), but in which lines corresponding to components that are
not actuated have been removed. If heave is neglected, for example,
is obtained by removing the third line of
J.
Equation (
12) translates the fact that we wish to minimize deviations from a ”preferred” tension, while ensuring that the
actuated components of the desired load are as requested. The preferred tension
can be selected in different ways. If each winch is designed to apply a tension close to 20 N,
can be chosen as
. Note that in general,
, meaning that applying the
preferred set of tensions does not necessarily lead to zero load. If this is desirable, then
should be chosen in the kernel (or nullspace) of
.
A direct solution to (
12) can be obtained by
where
is the Moore-Penrose pseudo-inverse of
. In practice,
and
are provided at each time step, meaning that equation (
12) will be solved at every time-step. In that context, it is possible to compute the pseudo-inverse
efficiently in an iterative way[
23]:
where
, is the estimate of
from the previous time step, and iterations on
i are performed until convergence (typically after a few iterations).
An important remark is that the solution (
13) based on pseudo-inverse does not guarantee the positivity of
T. It means that the tension commanded to the winches might be negative, which is not feasible. If the CDPR is well configured, meaning that the actuators and attachment points have been wisely selected, such a situation should not happen. Optimal configuration of the CDPR has been discussed in [
24], for instance. Another aspect which is not guaranteed by the present approach is the smoothness of the solutions
, assuming that
is smooth. The interested reader is referred to [
25] for details about these issues and possible solutions.
Note that even if e.g. the heave force applied by the CDPR on the FWT is not
controlled, it is possible to compute the force that was actually applied using (
10). For practical cases in FWT, it typically amounts to a couple of Newtons directed along the tower axis, which is insignificant compared to FWT buoyancy and inertia heave forces.
2.4. Adapting the Preferred Tension
In some situations, for example when large heading variations occur, some cables might become slack or overloaded. To alleviate this, the pretension
can be adapted [
18]. One can for example select
in the kernel of
, and scale it by a factor
following the following adaptation law :
where
This moves the envelope of the tensions away from bounds defined by
tension values. The gain
is used to tune the speed of the adaptation.
3. Performance of the Actuator, Observed under Wind/Wave/Current Testing
This section will present the test cases, and show the performance of the CDPR when applying time-varying loads, during testing in wind, waves and current. This will motivate the definition of the benchmarks in the next section.
3.1. Description of the Test Cases
The control system and CDPR presented in the previous section have been used to perform cyber-physical testing of several 15MW state-of-the-art FWT designs at SINTEF Ocean. Two of these have been selected for the present study, as they differ significantly in terms of floater design, motion properties, and tower modelling strategies. The tower of FWT1 is stiffened compared to reality, while the one of FWT2 is designed to represent the first tower fore-aft and side-side tower frequency. Furthermore, the chosen FWT support two different 15 MW generators.
The natural frequencies for the rigid body motions and tower deformations for the two FWT models are given at model scale in
Table 1. Key excitation frequencies from waves and rotor loads are also indicated.
Wind and wave tests were conducted in the Ocean Basin at SINTEF Ocean (Trondheim, Norway). The mean of the turbulent wind velocity was 11m/s which is close to the rated velocity for both turbines, generating a maximum mean thrust. A nominal turbulence model was used. For the considered cases, waves were aligned with wind, and followed a JONSWAP spectrum with significant wave height of 0.18m (model scale), and peak frequencies indicated in
Table 1. While FWT1 was tested without current, FWT2 was tested in a current and exhibited larger dynamic yaw angles. Rotor loads were simulated with OpenFAST, including gyroscopic effect, tower shadowing, and blade flexibility.
In both cases, the CDPR included seven actuators placed around the basin boundaries. From each actuator, there was a thin line attached to a frame on top of the physical substructure placed in the basin. The tension in each line was measured and sampled at a frequency of 200Hz (model scale), using a strain-type transducer with an accuracy of
of measured value for significant response levels. These force transducers were used to control the CDPR, and to compute the total load applied on the structure using equation (
10).
3.2. Description of the Observed Quantities
For both test cases, commanded and measured surge and sway forces are compared (denoted and , respectively), and roll, pitch and yaw moments about tower top (denoted , respectively). These loads are in a body-fixed coordinate system.
In
Figure 2,
Figure 3,
Figure 4 and
Figure 5, the power spectral density of the commanded and measured loads are plotted at the various frequency ranges, listed in
Table 2. Separate plots enable the use of linear scales on the
y-axis (rather than logarithmic), which provides a clearer picture of possible discrepancies. Another remark is that
all controlled components are presented, not only the dominating ones. This is important because it enables checking whether the actuator manages to apply near-zero loads when such loads are commanded.
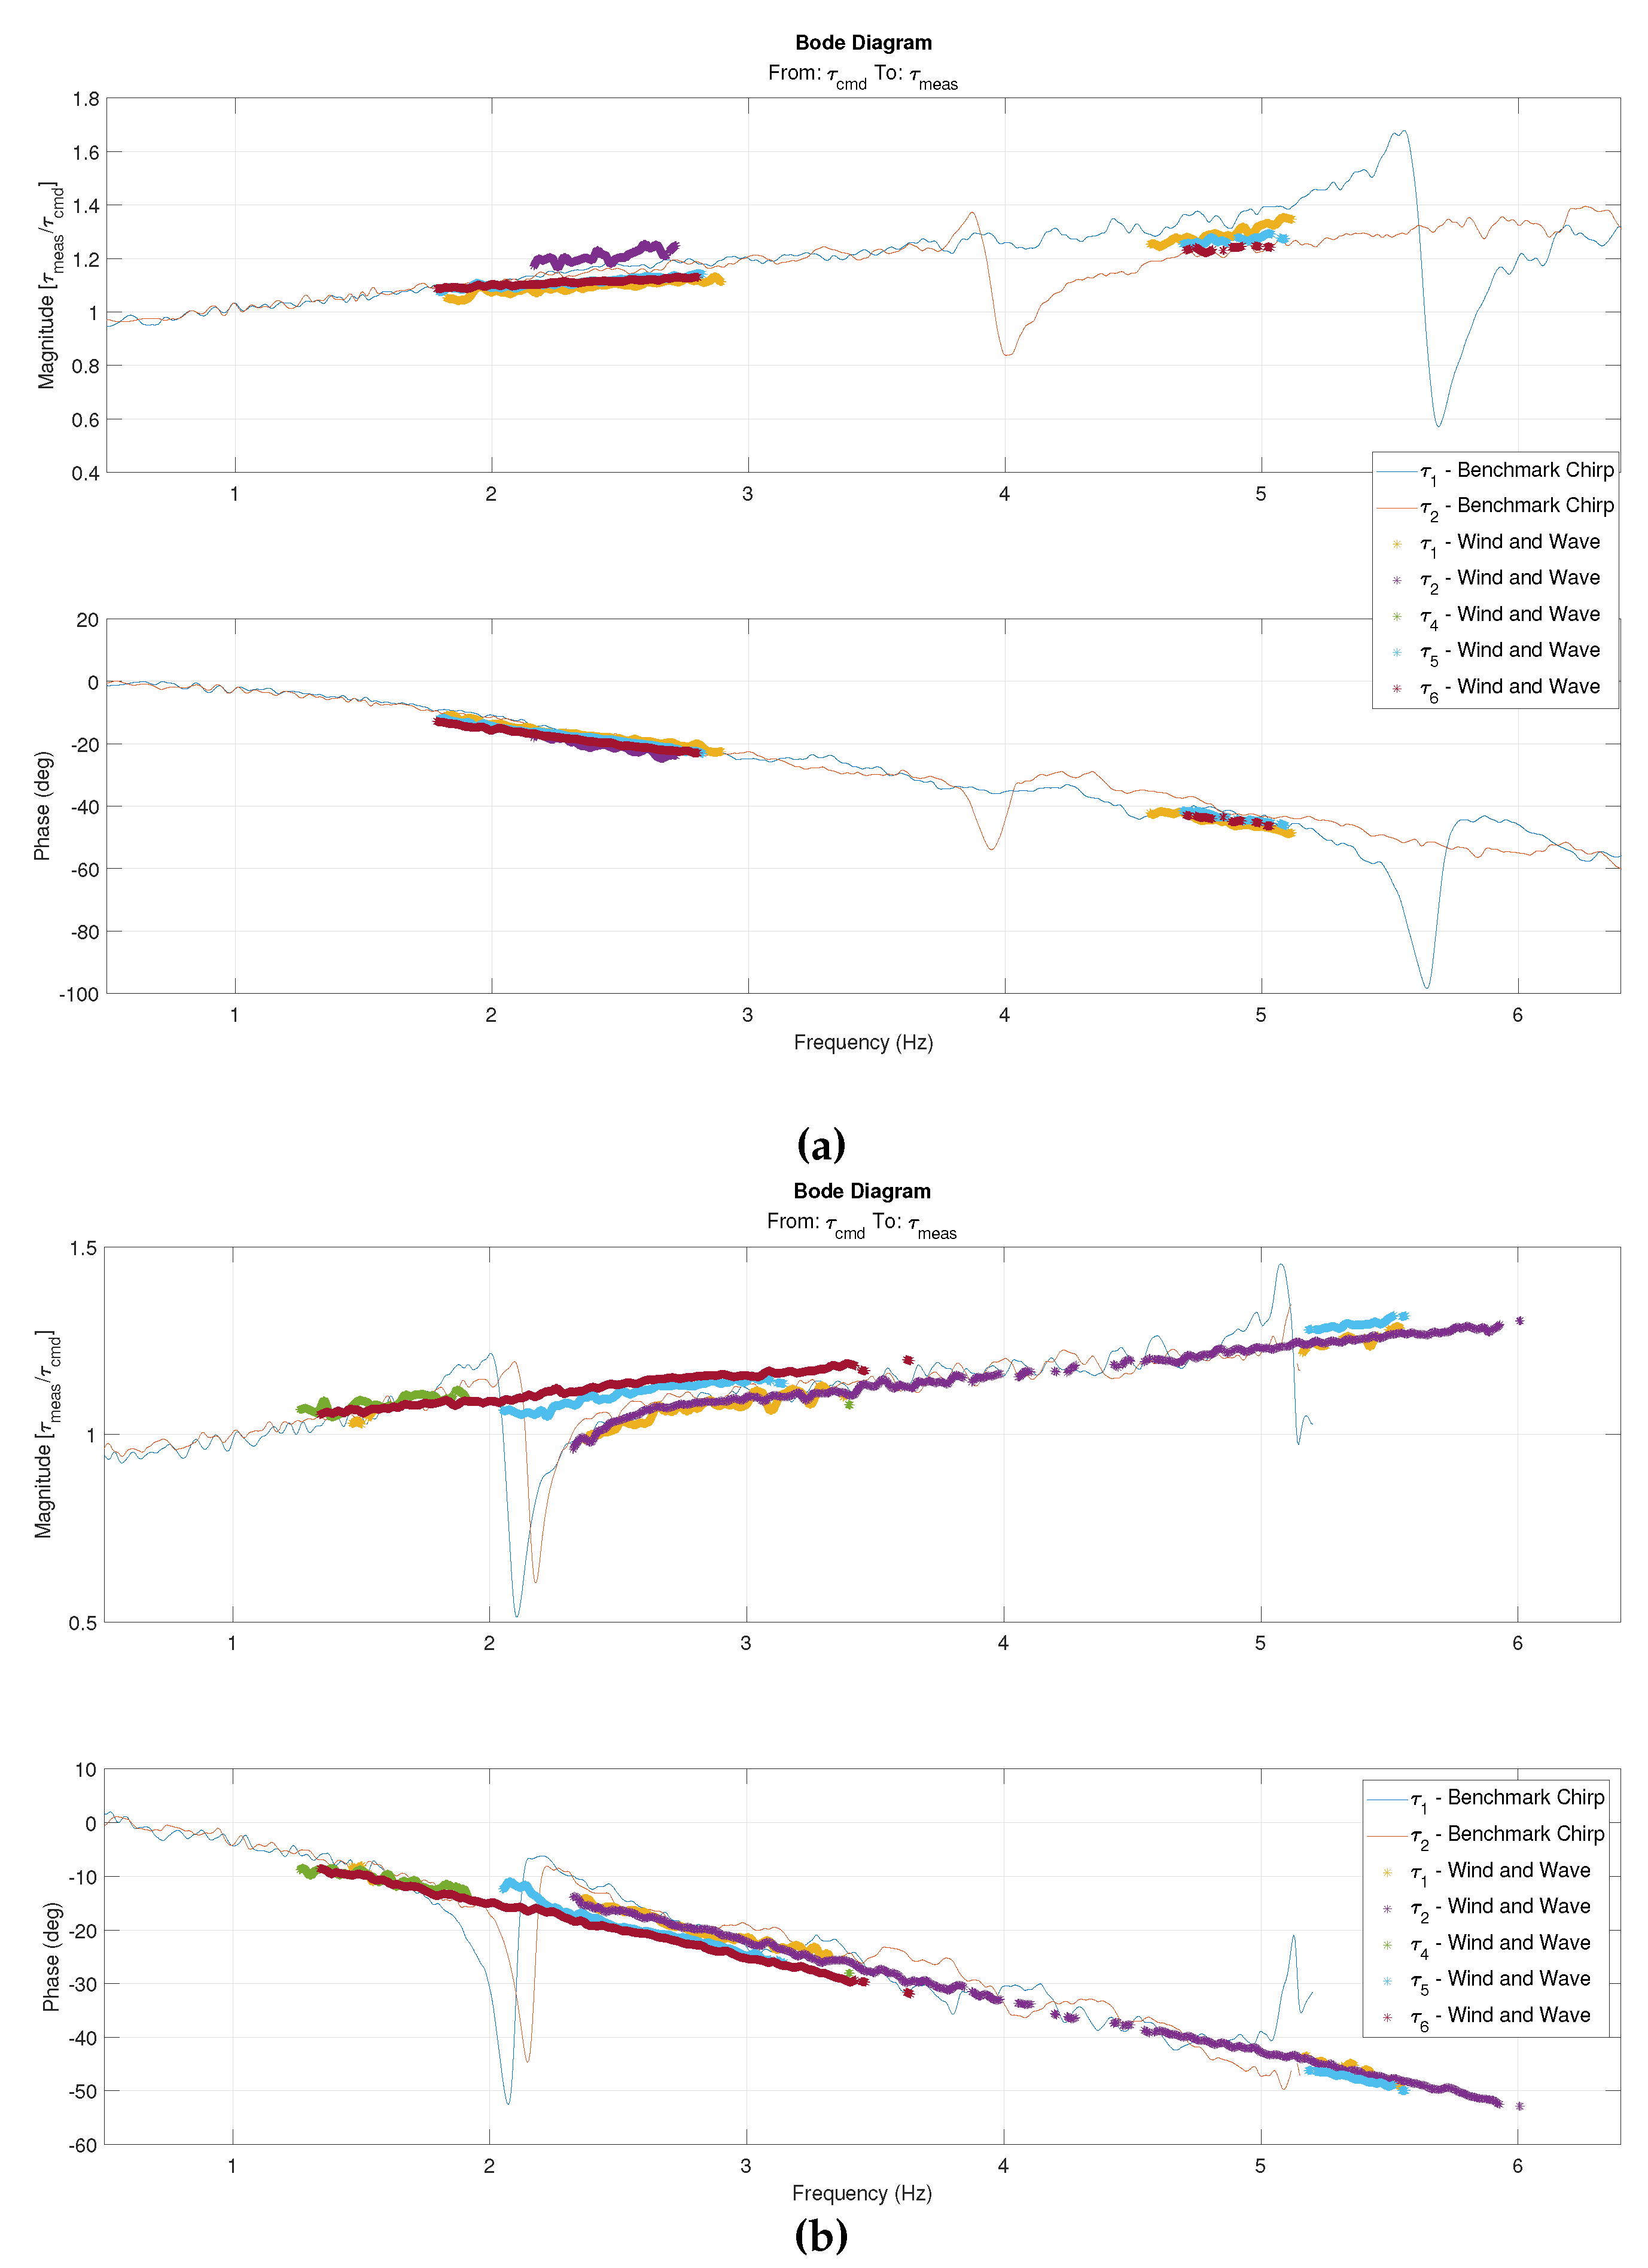
Bode plots that contain the RAO, including phase information between the commanded and measured signals, are presented in Figure 8 and will be commented in details in the next section. In the present section we will only consider the data represented by dots in Figure 8. Solid lines correspond to the benchmark tests which will be introduced later on.
3.3. Low- and Wave-Frequency Range
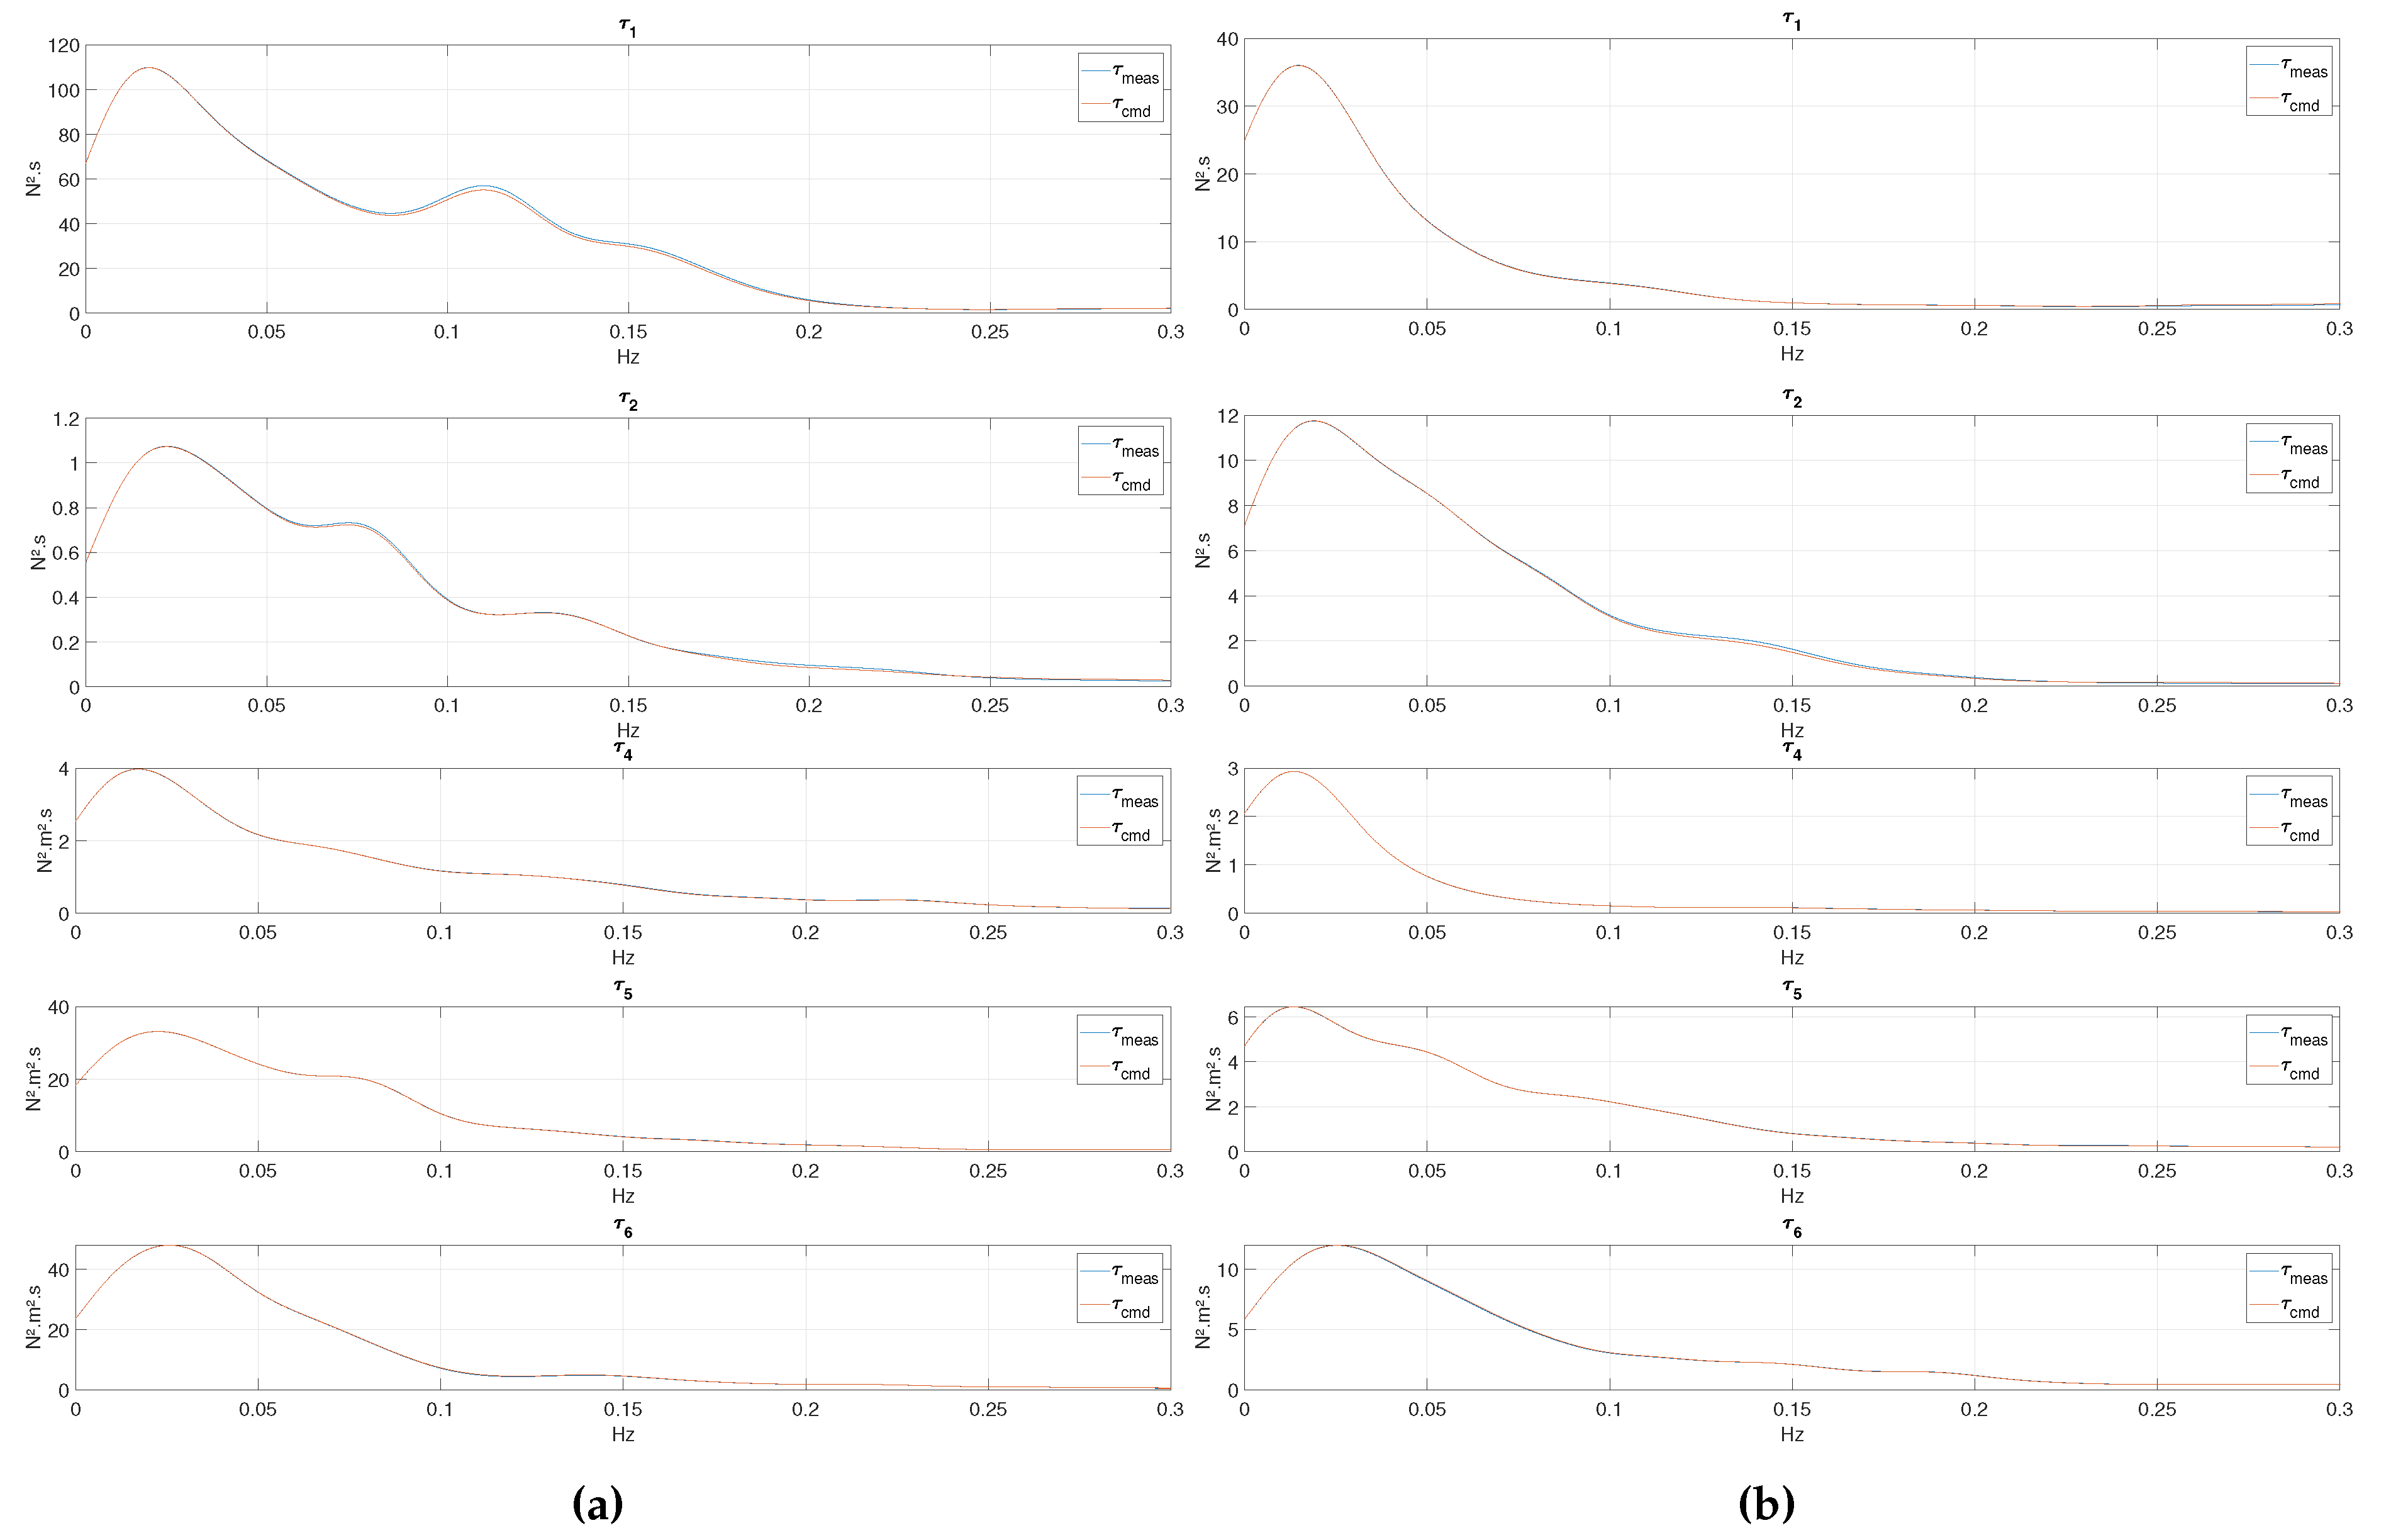
The power spectra in the low-frequency range are shown in
Figure 2a and
Figure 2b for FWT1 and FWT2, respectively. This is where the energy of the wind spectrum is concentrated, and we observe a perfect match for the low-frequency variations for both FWTs. For FWT1, loads in surge, pitch and yaw are clearly dominating, roll is observable, while sway is insignificant. For FWT2, which exhibits larger yaw motions, all load components are significant in this frequency range.
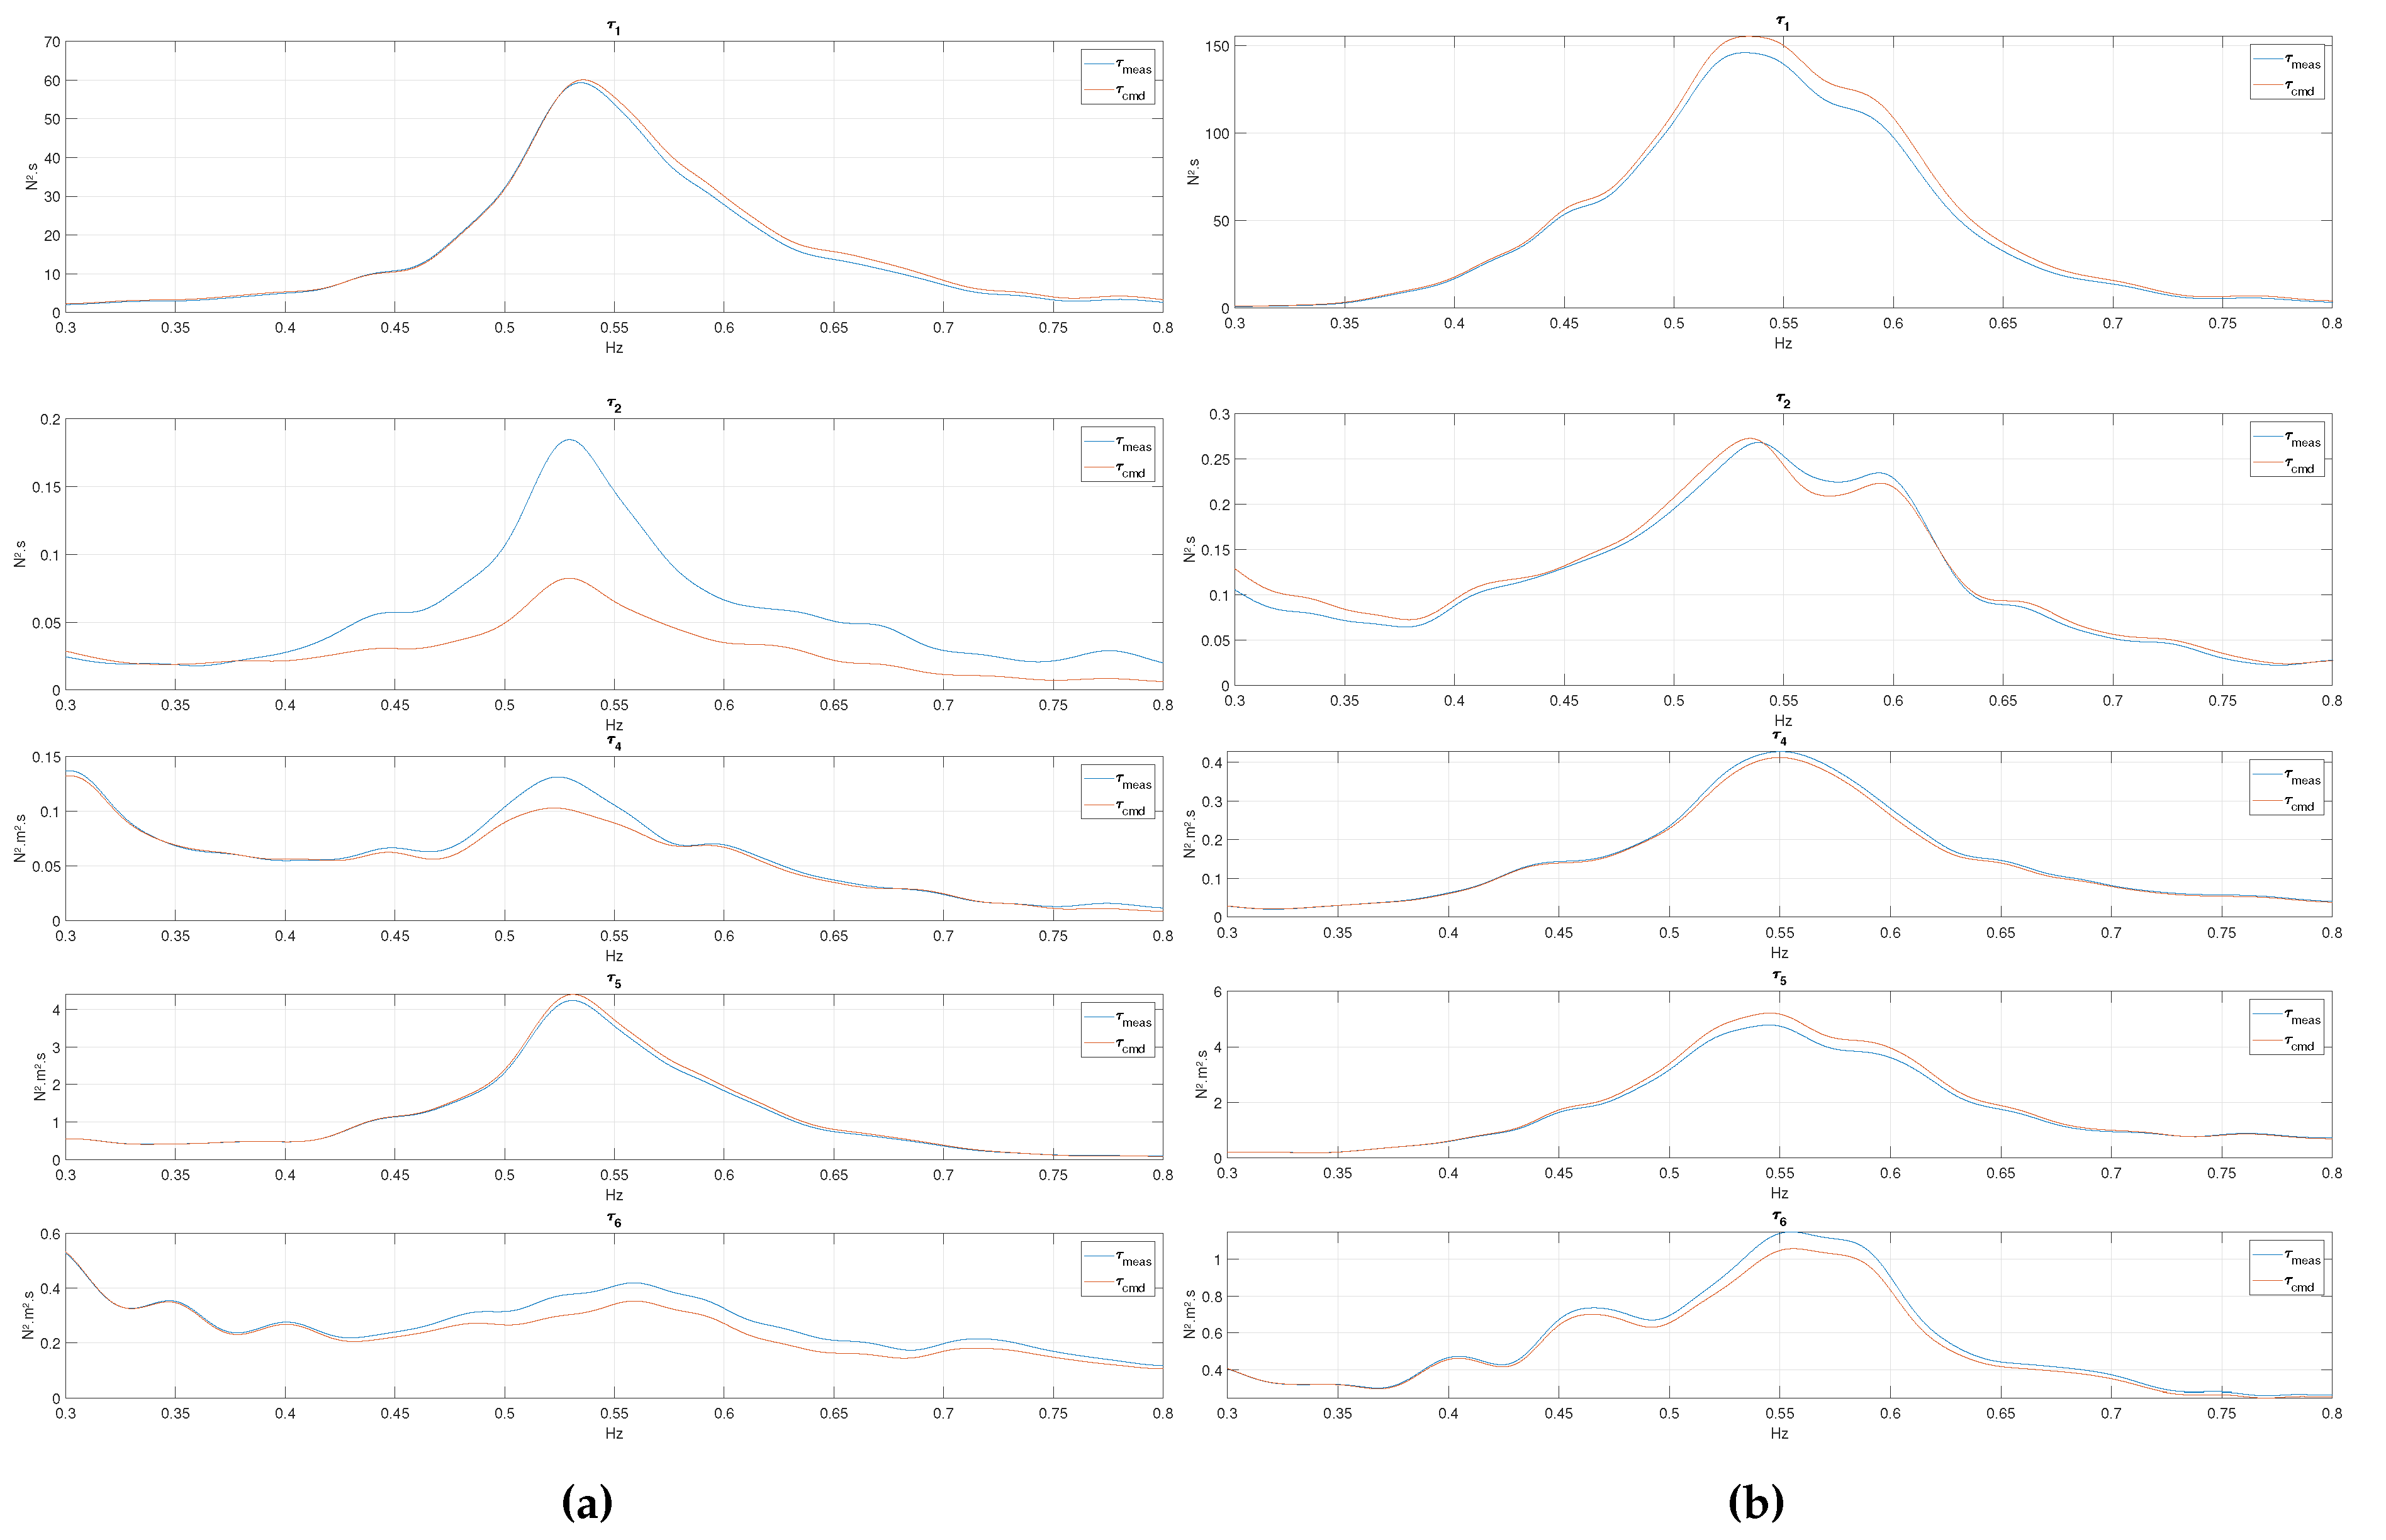
Figure 3a and
Figure 3b show the commanded and measured load spectra in the wave-frequency range. The load has a peak at the wave peak frequency
for both FWTs. This is because the wave-induced motions of the floater, fed into the rotor simulator (numerical substructure), generate significant aerodynamic loads (damping, for example). Thus, the wave frequency oscillations of the floater are mirrored in the commanded and measured loads. For FWT1, surge and pitch loads are clearly dominating, while all controlled load components except sway are important for FWT2.
The agreement between the commanded and measured loads at wave frequencies is very good for all components of importance in the wave frequency range. This is confirmed by the Bode plots in Figure 8, which indicate a perfect match in terms of amplitude and about zero phase lag in the LF- and WF-ranges.
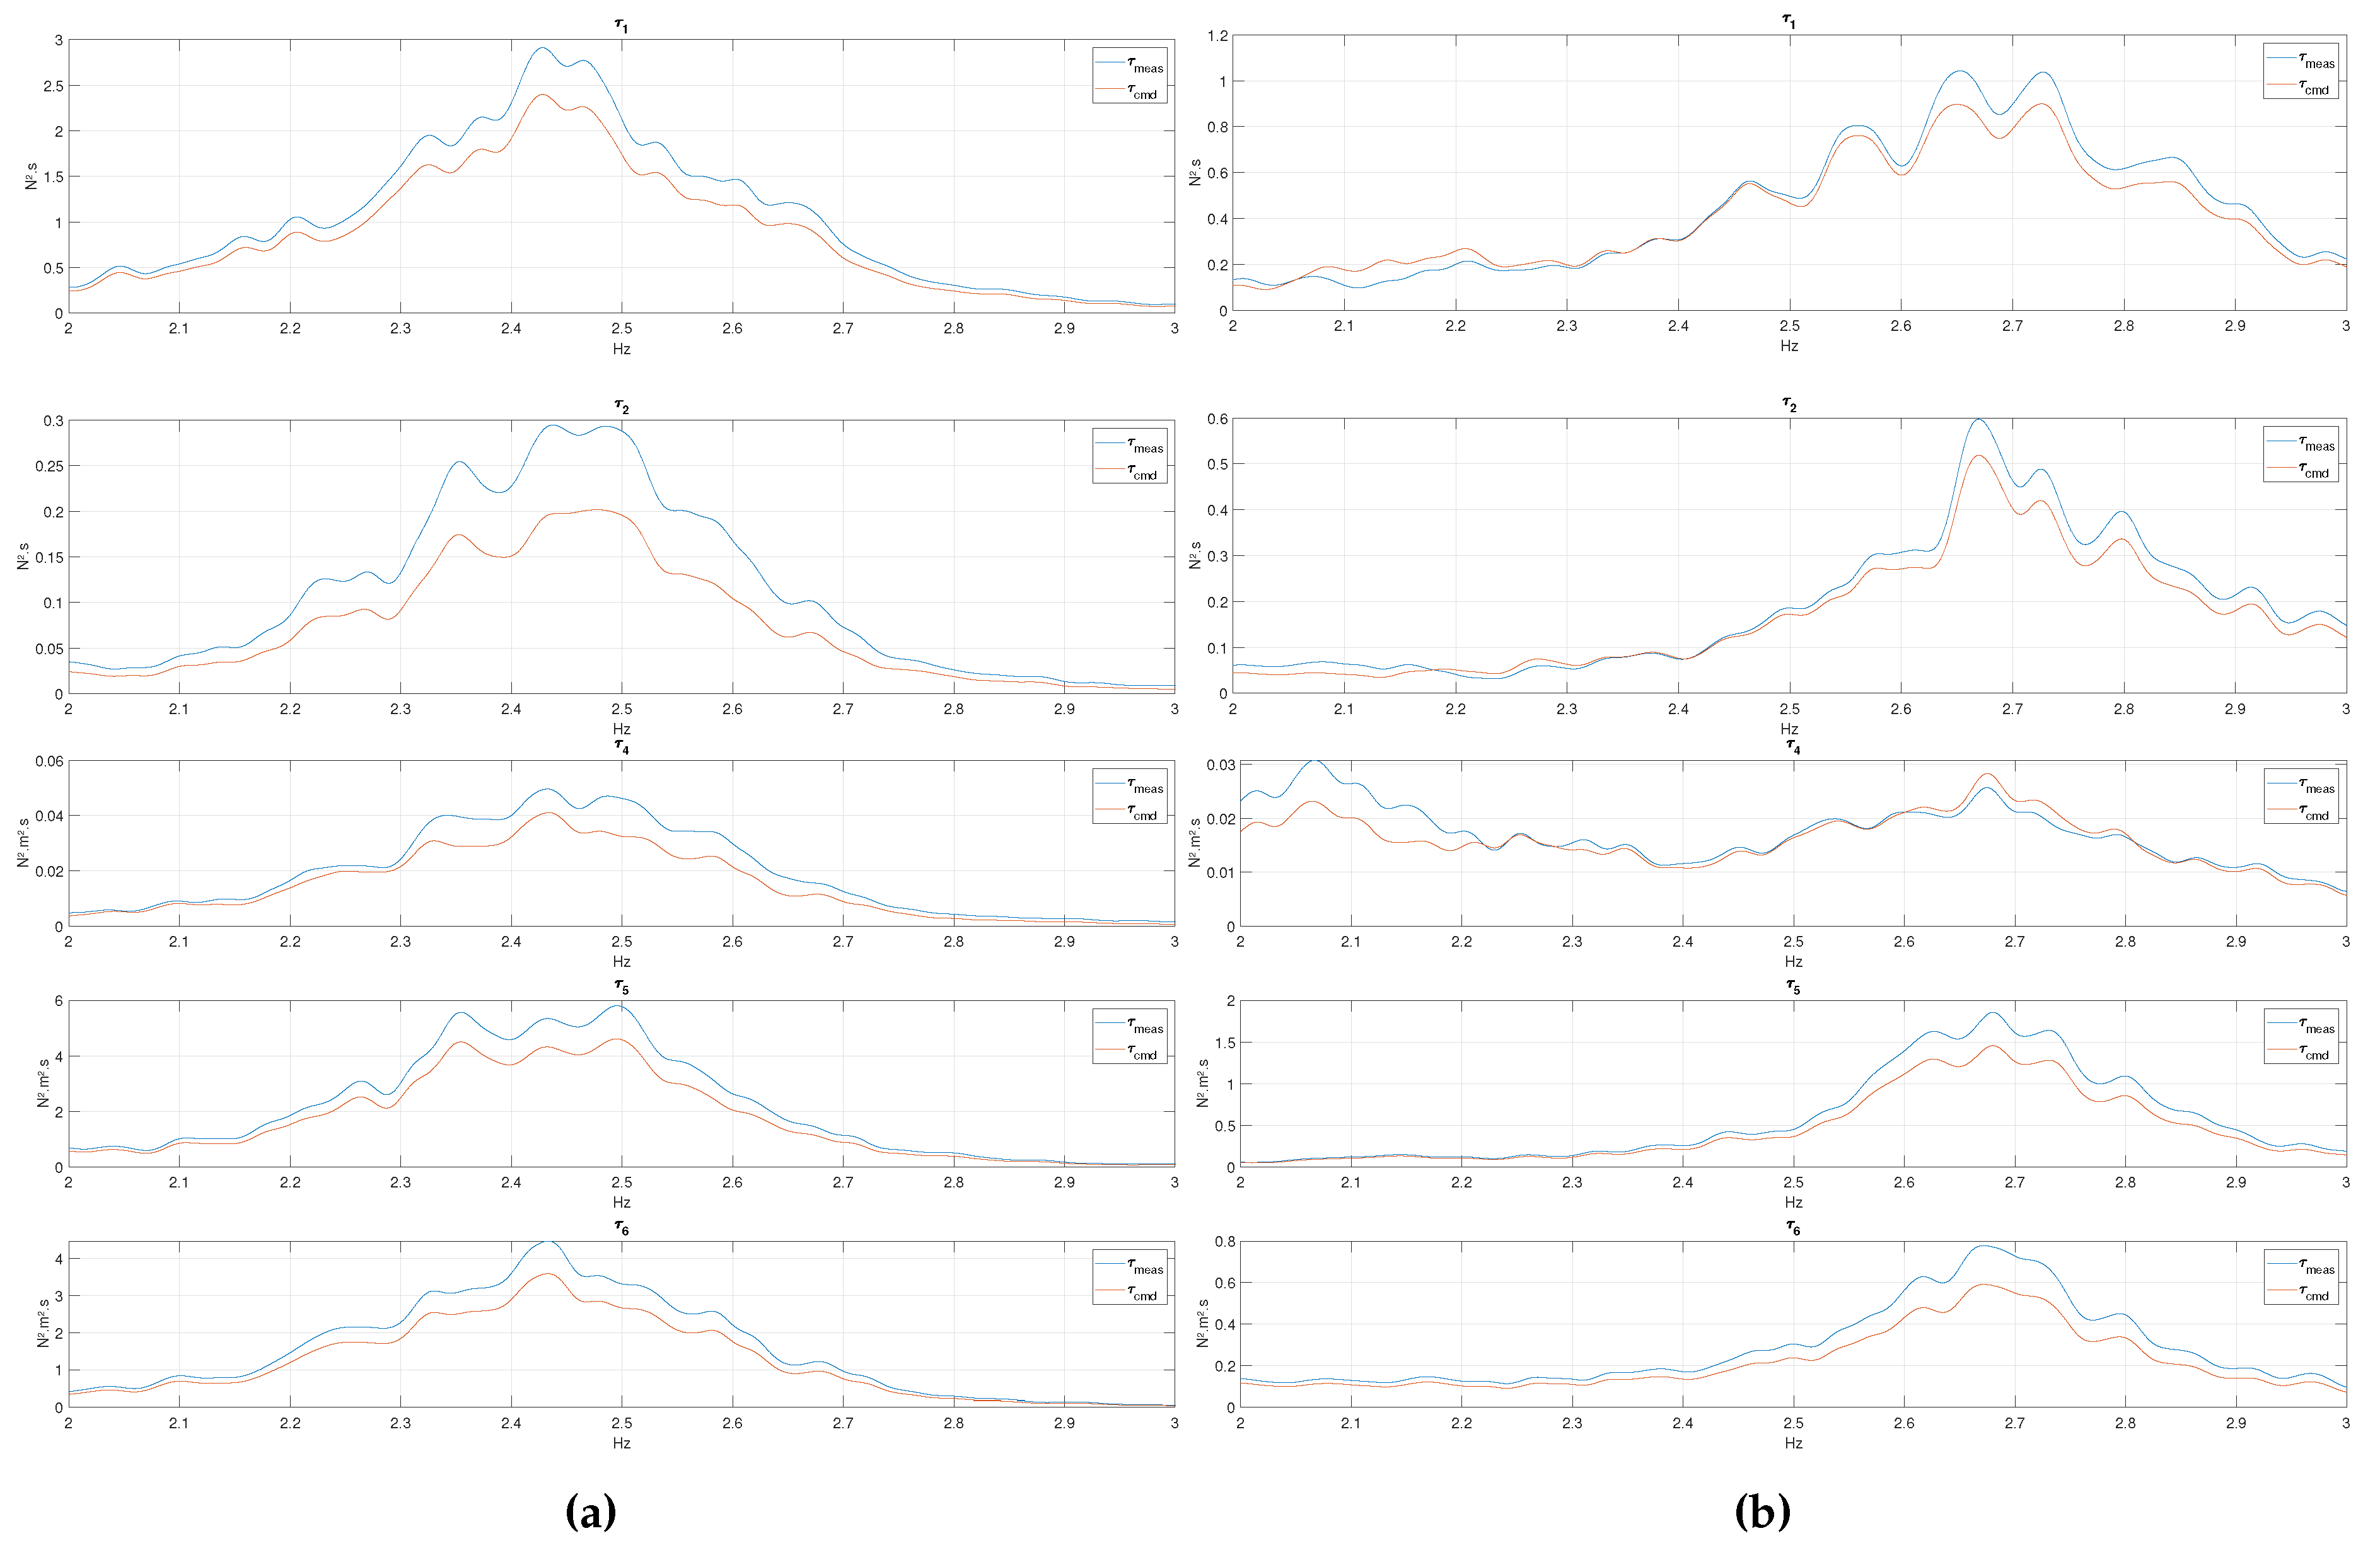
3.4. High-Frequency Range
Figure 4a and
Figure 4b show the commanded and measured load spectra in the 3
p region (blade passing frequency). The peak in the spectrum corresponds to the 3
p frequencies of 2.39 Hz for FWT1, and 2.71 Hz for FWT2, which are visible, and well captured in all 5 DOF. For FWT1, surge clearly dominates the sway force, pitch and yaw moments of the same order of magnitude, and roll is insignificant in this frequency range. For FWT2, surge and sway forces are of the same order of magnitude, pitch and yaw moments of the same order of magnitude, and roll moment insignificant. For the non-insignificant components of the load, the CDPR tends to apply larger loads than commanded, with an error on the power spectrum of about 20%, which represents about 10% in terms of amplitude. This amplification near 3
p is also visible in the Bode plots (Figure 8), which indicates a phase lag of about 20
o in this frequency range. The tower fore-aft and side-side natural frequencies for FWT2 is 2.15Hz. Possible resonant vibrations that could occur at this frequency do not have any particular effect on the CDPR performance.
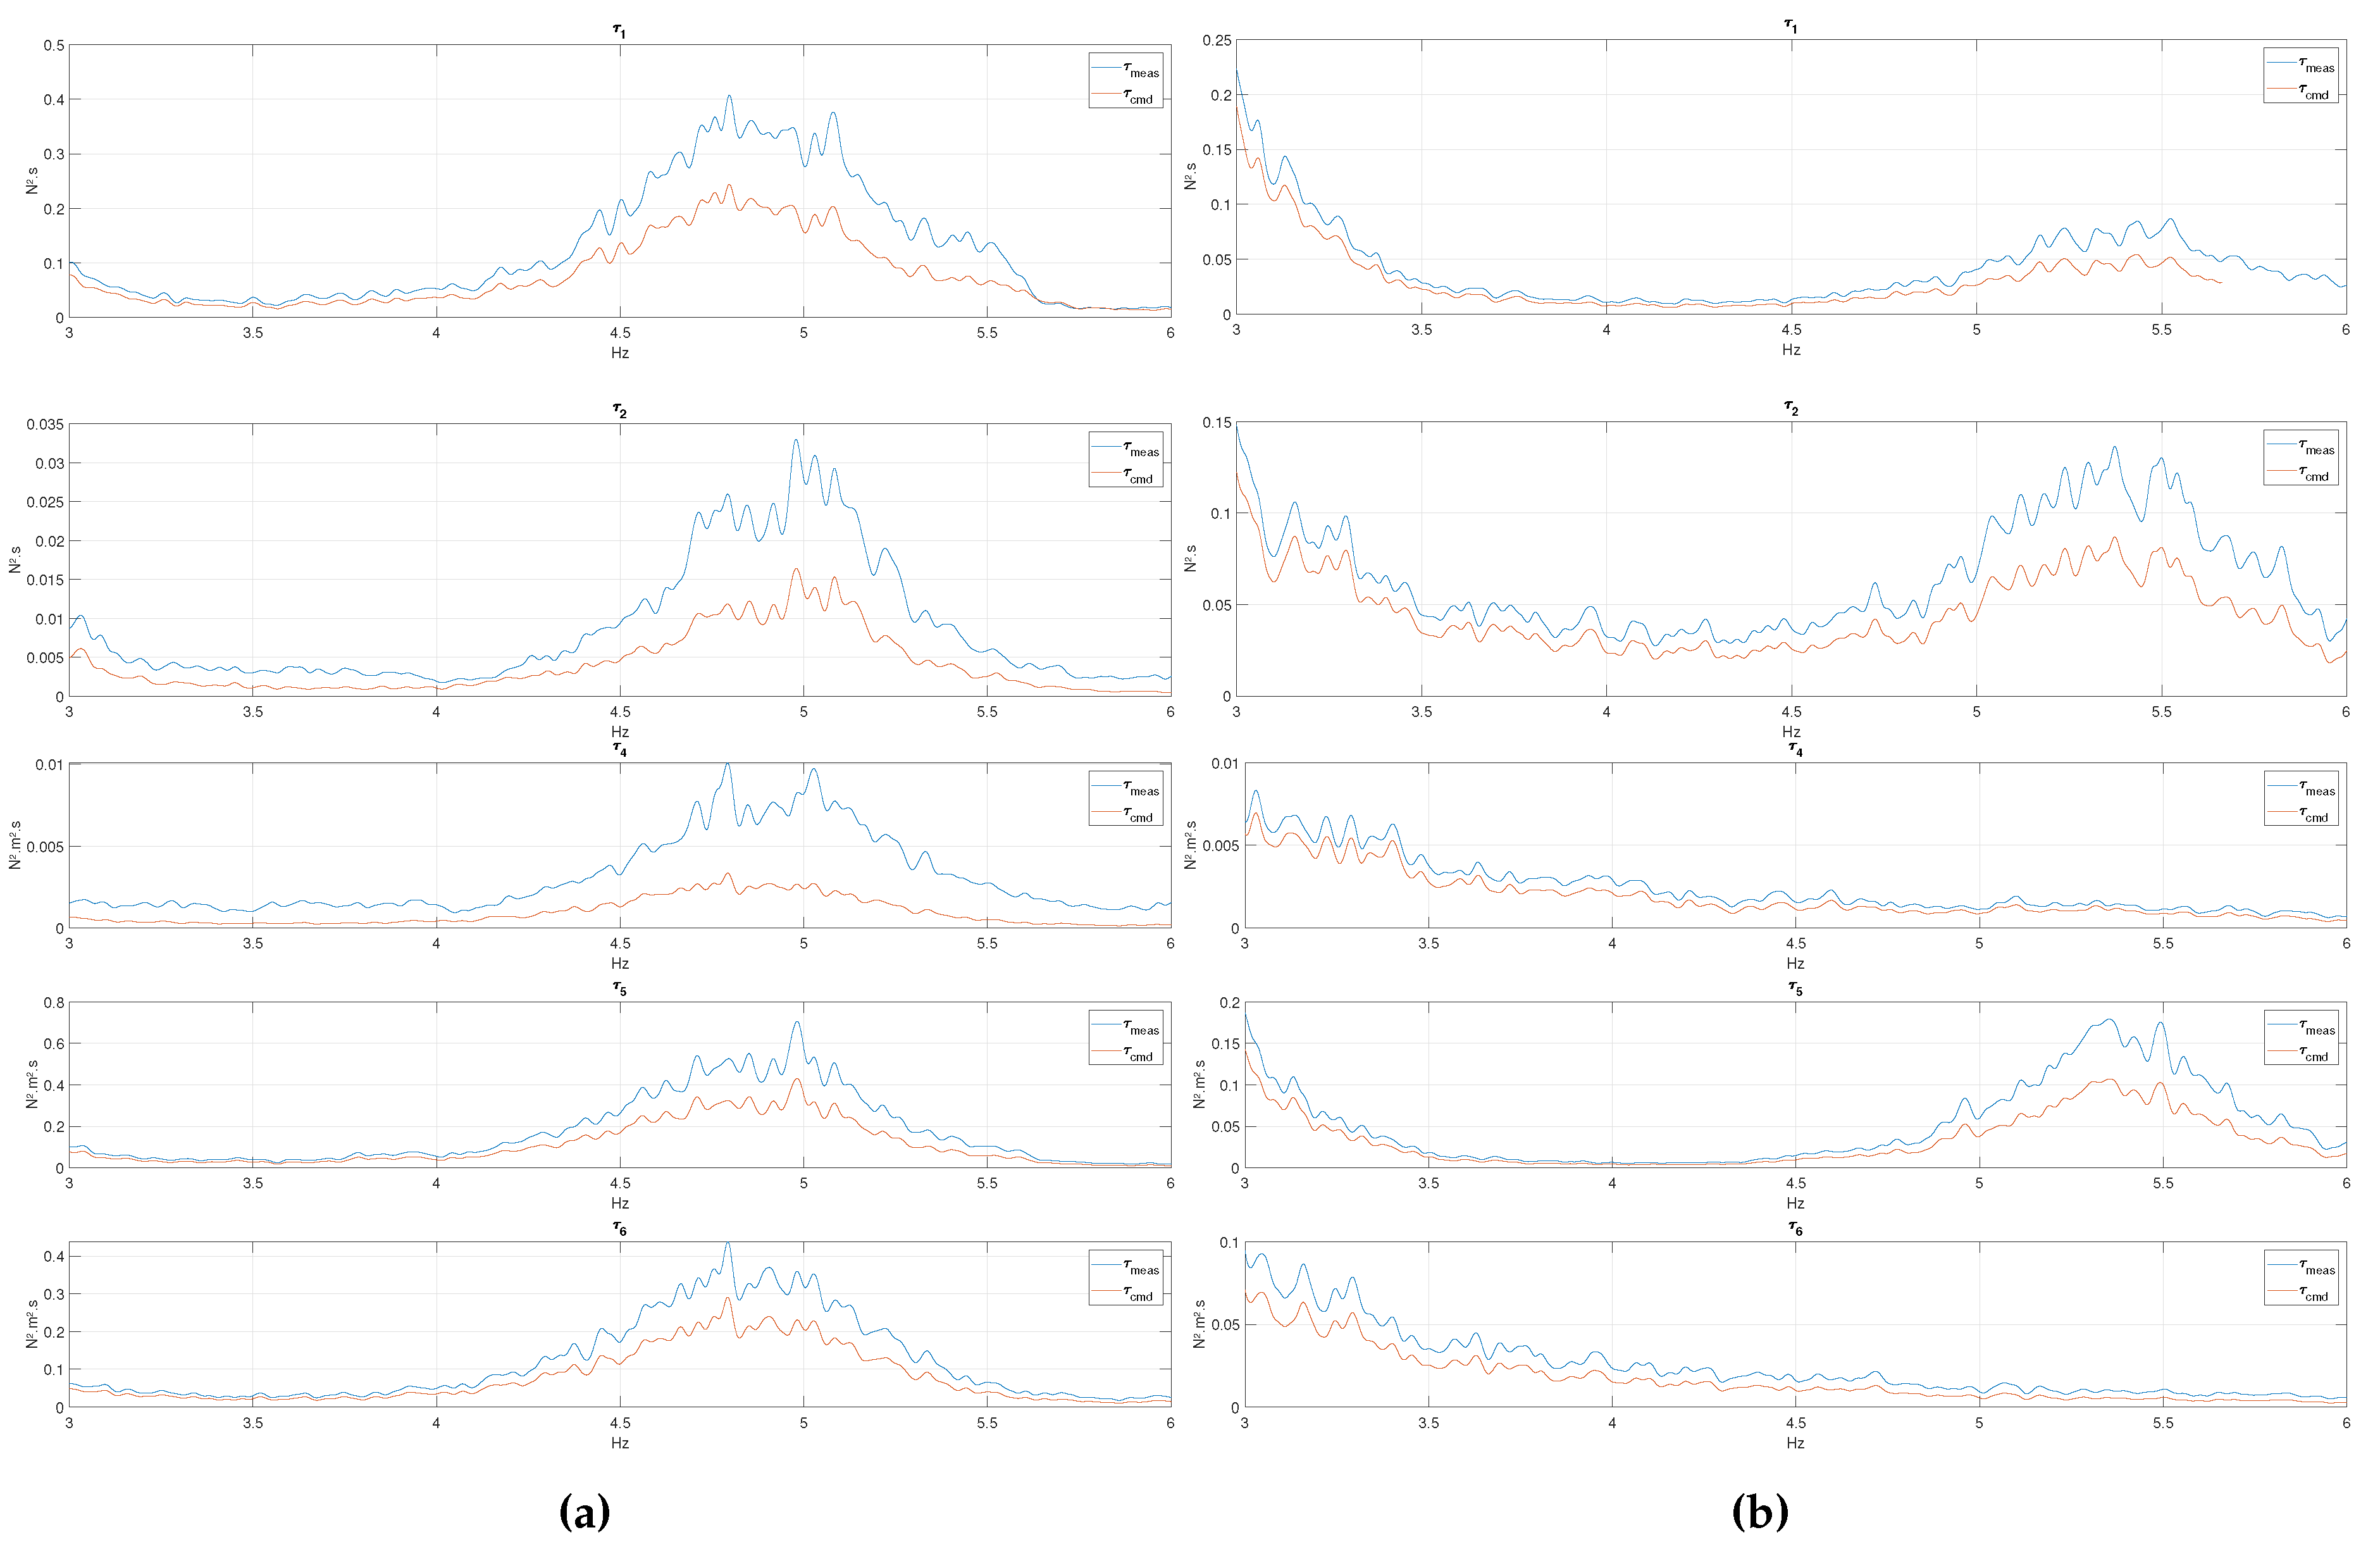
Figure 5a and
Figure 5b show the high-frequency range near
(4.79Hz for FWT1 and 5.41Hz for FWT2), which is also near the fore-aft and side-side natural frequencies of FWT1’s tower (5.65 Hz and 4.11 Hz, respectively). The
excitation frequency is clearly visible on the plots, while the presence of a tower natural frequency for FWT1 has no visible effect on the performance of the CDPR. As for the previous frequency ranges, surge dominates sway for FWT1, pitch and yaw moments have similar magnitudes, while roll is much smaller. The situation is similar for FWT2, except that surge and sway loads are comparable. In this frequency range, discrepancies between commanded and applied loads can be large, up to 40% in energy, meaning 20% in amplitude. This is confirmed by the Bode plots in Figure 8, which in addition indicate a phase lag of over 40
o between the commanded and applied load near 6
p.
3.5. Summary
This section illustrated the typical performance of the actuator (here a CDPR) to apply commanded loads during realistic wind/wave/current scenarios over a wide frequency range. However, in such complex tests with combined load sources and complex floater motions, possible issues related to the actuator are difficult to detect, understand, and solve. This is why, in the next section, a set of short and targeted benchmark tests are presented. They aim at verifying the performance of the actuator prior to running tests in combined environment, and can be repeated on a regular basis to ensure a functional setup over long test programs.
4. Benchmark Tests
When investigating the performance of a control system in cyber-physical testing, it is crucial to define the
purpose of the tests, and hence the Quantities of Interest (QoI) [
16,
22,
26]. When applied to FWT, QoI are the ones used in the verification of the FWT design, or in the calibration of numerical models: motions of the floater, accelerations at the nacelle, tensions in the mooring lines, and internal loads (shear forces, and bending moments) at the tower base. Frequencies of Interest (FoI) are also to be defined, which for FWT, are the ones listed in
Table 2.
To achieve high-fidelity, the control system orchestrating cyber-physical testing shall be "transparent" from a QoI point of view. Formulated in another way: the interconnection between the numerical and physical substructure should behave as if the two were ideally connected, i.e. the presence of the control system should not affect the QoI [
16]. As the scope of the present paper is the actuator (and not the whole control system depicted in
Figure 1), we transpose this requirement to the actuator as follows.
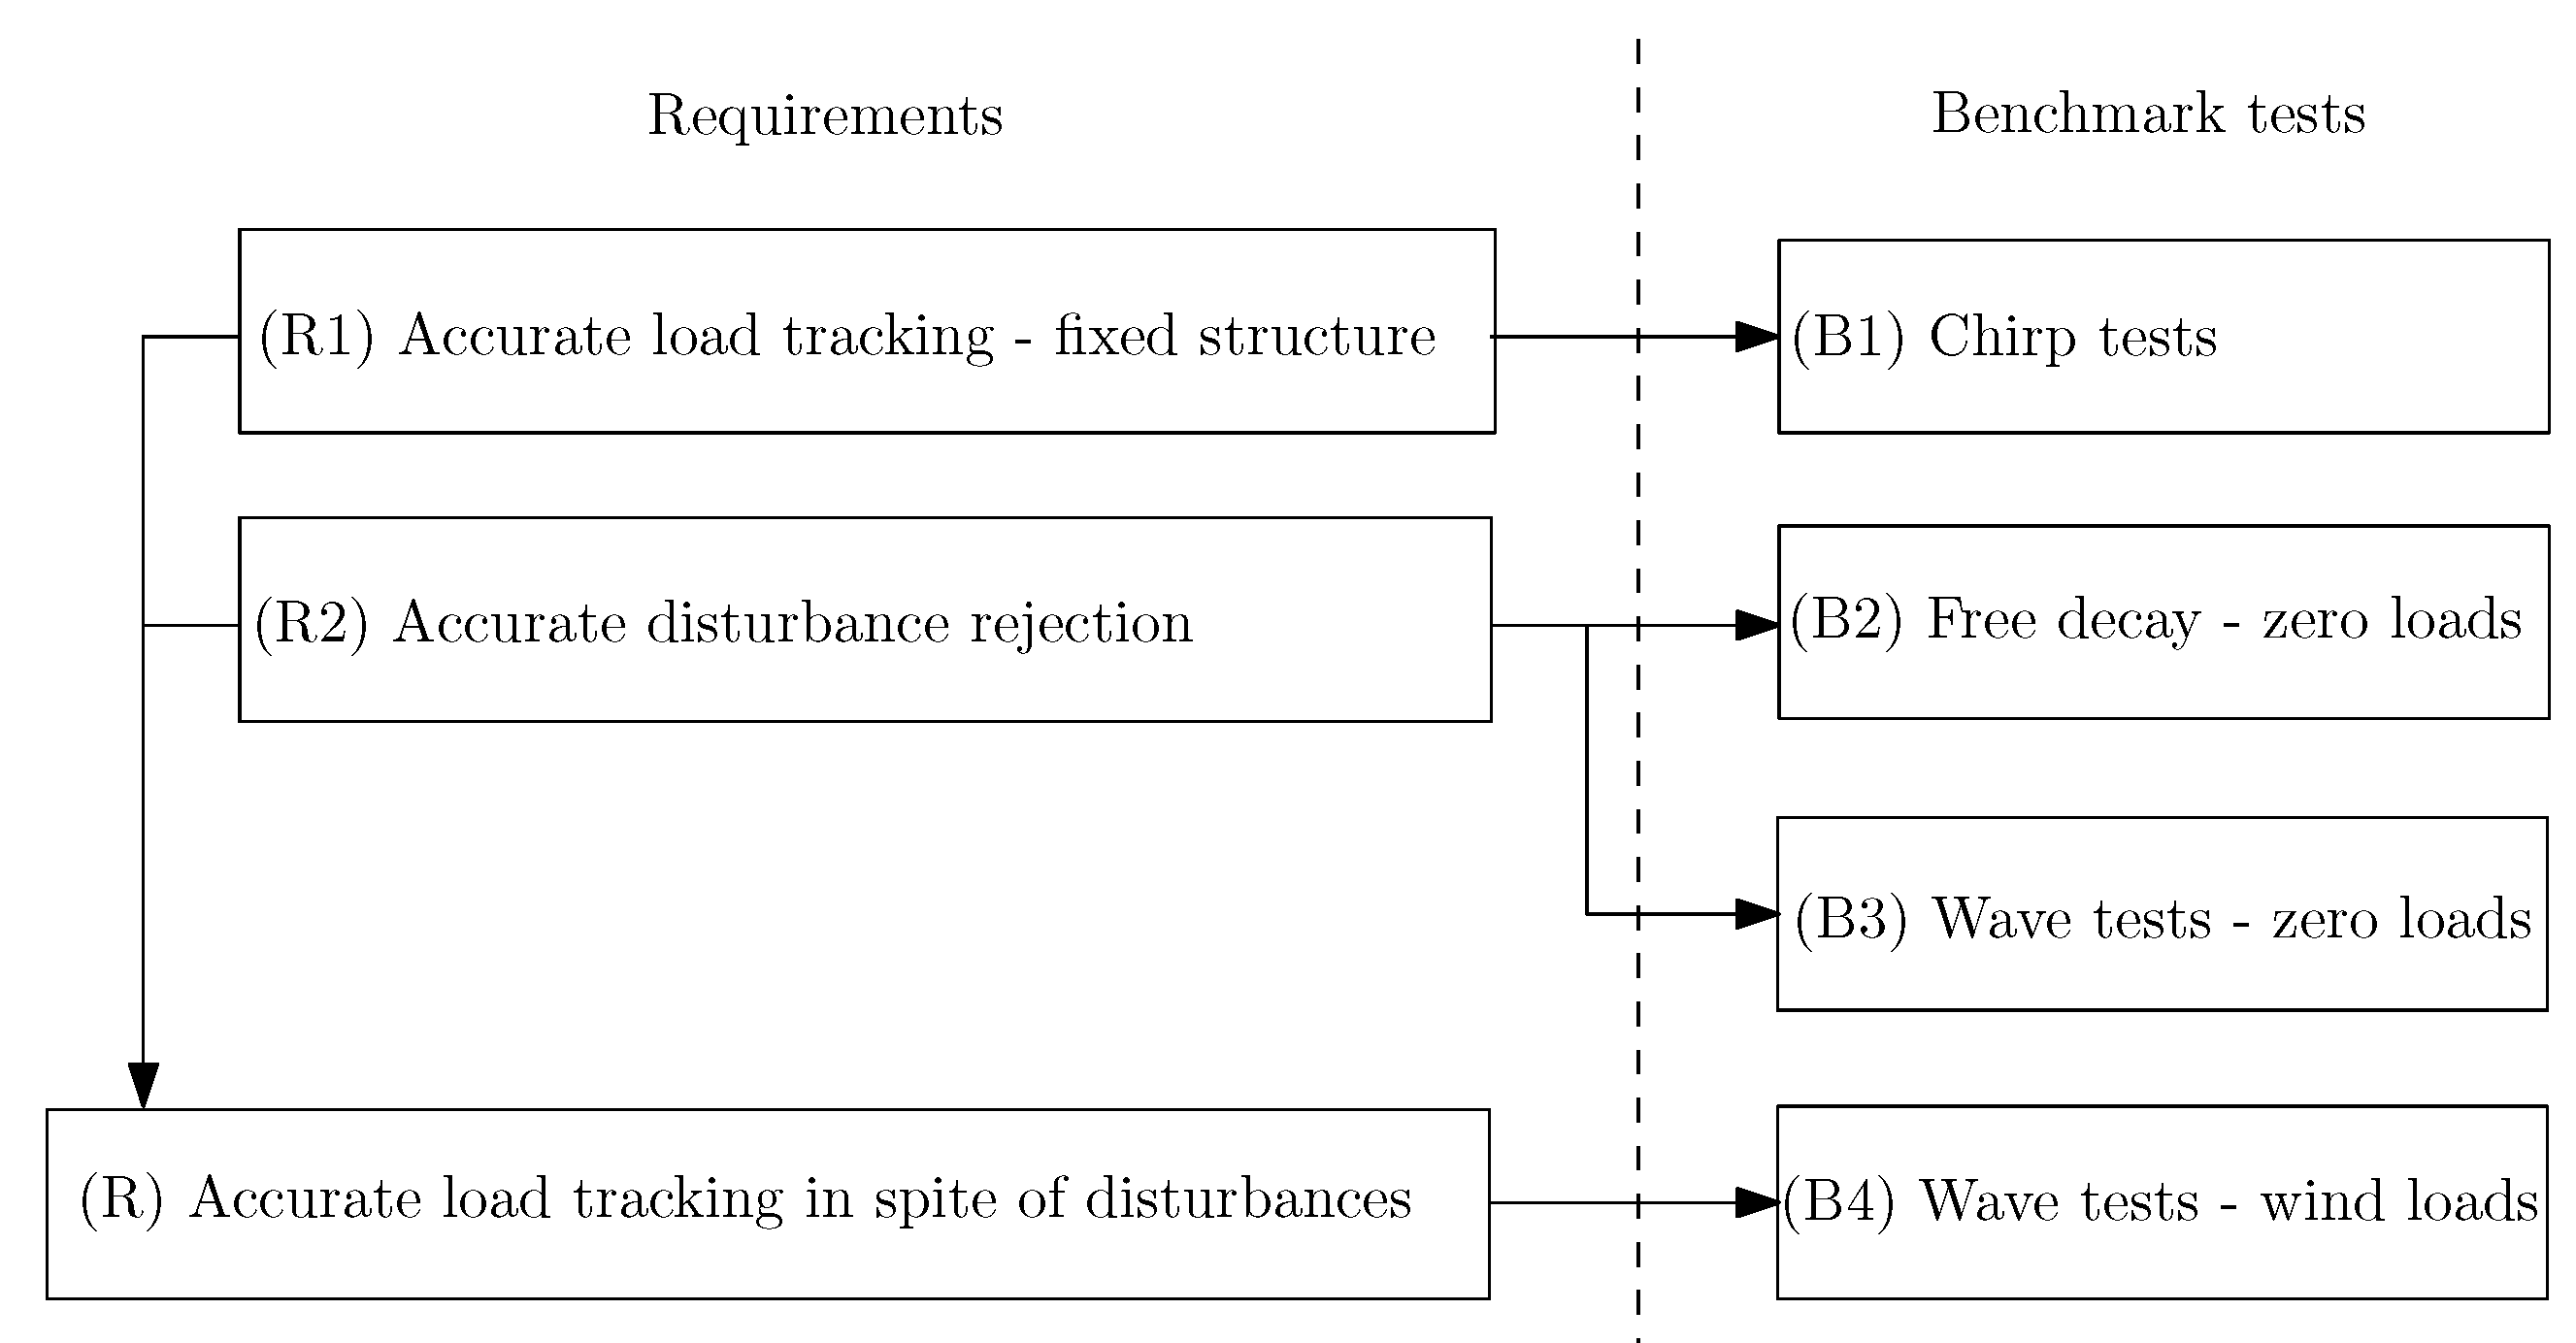
Requirements to the actuator: (R) the actuator should accurately apply loads over the FoI, and this in spite of motions/vibrations of the floater. This accuracy is to be assessed based on the QoI for the cyber-physical tests. A practical way to decompose (R) is to require (R1) that the actuator is able to apply the loads accurately on a nearly fixed structure over the FoI. This is referred to as load tracking. And (R2) that the actuator is able to apply a zero net load, and thus not influence the dynamic behaviour of the floater,in spite of floater motions occurring at the frequencies of interest. This is called disturbance rejection. Once (R1) and (R2) are both fulfilled, one can then verify that the combination of both (R) is fulfilled by performing combined wave-wind tests as presented in the previous section.
Note that [
20] presents a controller for the CDPR in which separate components are in charge of fulfilling (R1) and (R2), which facilitates the design of the controller, validation of its performance, and troubleshooting.
4.1. Description of Benchmark Tests
For FWT, the main challenges for actuators are (1) good load tracking for all FoI, particularly at high frequencies, and (2) disturbance rejection for large motions, which can occur at wave frequencies and natural frequencies. Therefore, three types of benchmark tests are defined to cover such situations.
Benchmark tests: (B1) Chirp tests that verify load tracking performance. (B2) Free decay tests during which the actuator must apply zero load. (B3) Wave tests during which the actuator must apply zero load. (R4) Finally, wave tests during which the actuator applies wind loads.
As shown in
Figure 6, benchmark test (B1) aims at verifying requirement (R1), while benchmark tests (B2) and (B3) enable verifying requirement (R2) with the structure moving at its natural frequencies, and at the wave frequencies, respectively. (B4) entails a final check of the actuator’s performance in realistic conditions. Note that for some actuator types, such as fan-based solutions, it is easier to verify (R2), as the actuator applying zero-load is simply deactivated. But (B2) and (B3) should still be performed to verify that the mass, the aerodynamic damping and the power cord are not disturbing the system.
The execution of these benchmark tests will be explained and exemplified in the following.
4.1.1. Chirp Tests (B1)
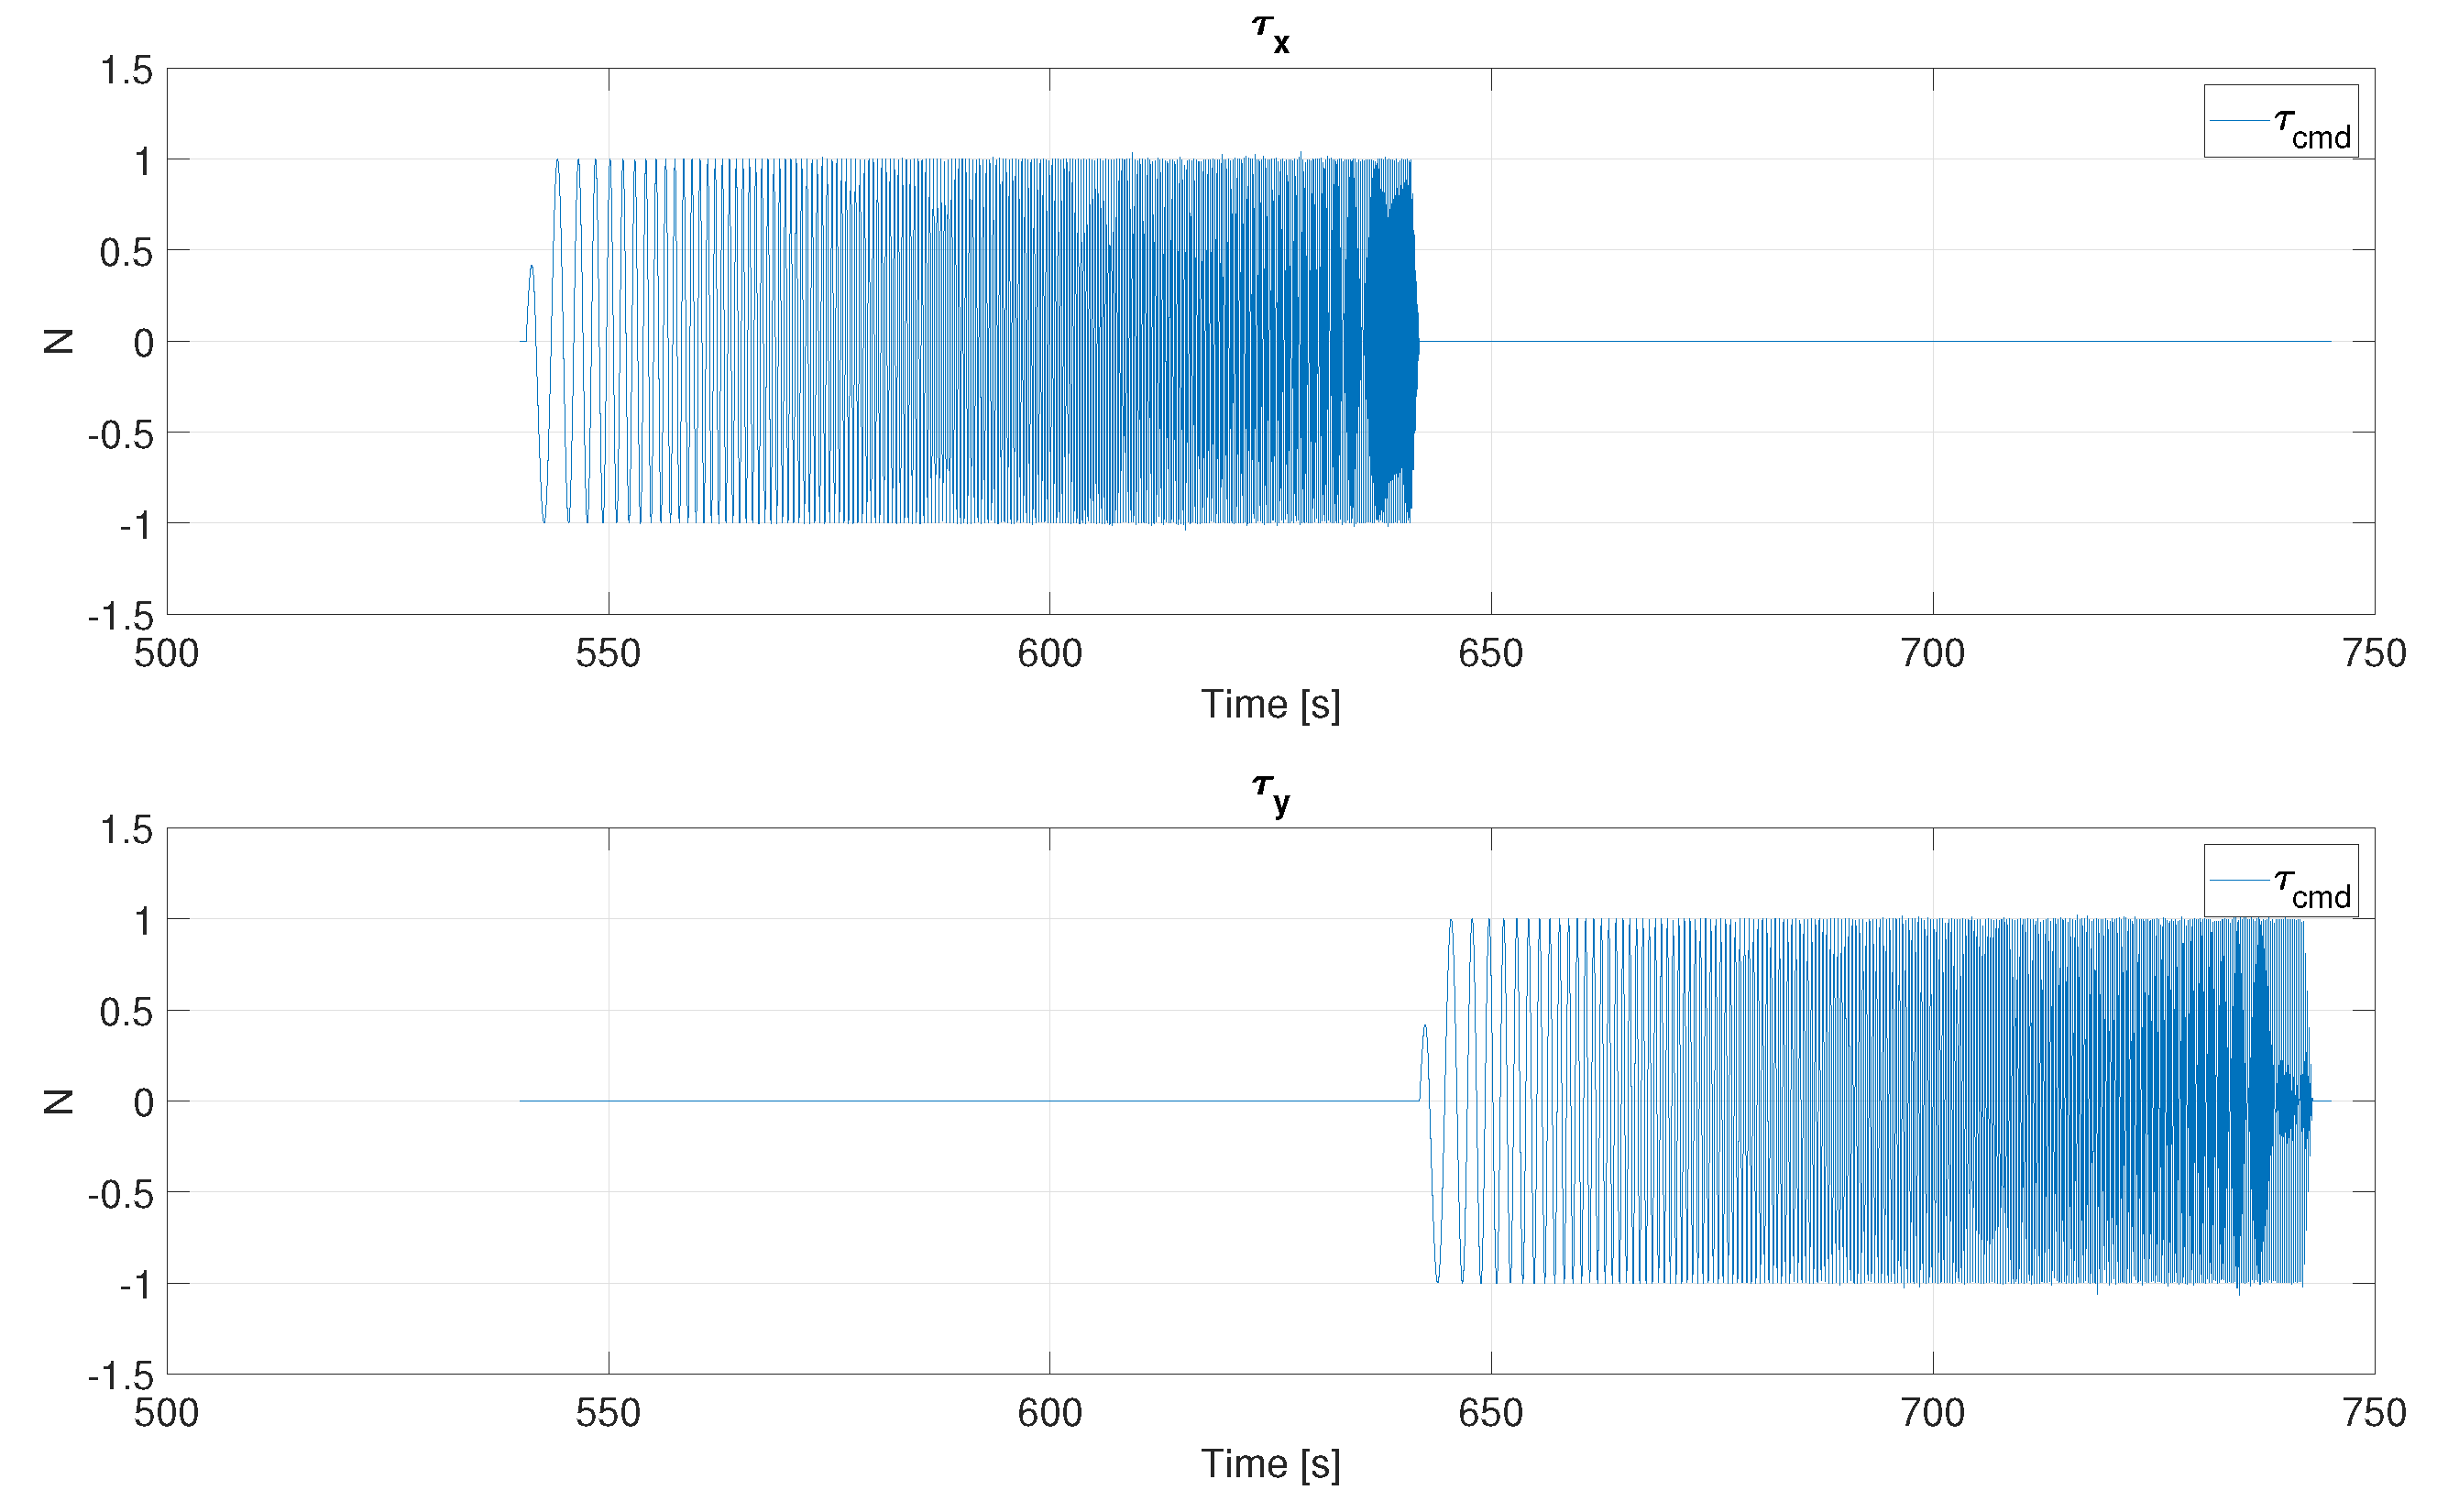
Chirp tests consist of applying a constant amplitude load centred on zero at an increasing frequency, such that the whole domain of FoI is covered. Several load components should be actuated: a surge chirp force at tower top, then a sway chirp force. They will induce a pitch and roll moment about the tower base, respectively. An example of a chirp time series in surge and sway force is shown in
Figure 7. The actual applied load should be measured and compared to the desired load. If couplings are expected between the actuators (such as possible wake/rotor interactions in multi-rotors), these can be checked using (B1).
4.1.2. Decay Tests - Zero Load (B2)
This benchmark consists of free decay tests, where the actuator shall apply zero net load on the floater. The initial conditions for the decays should be chosen as relevant for the test campaign. For a FWT, the initial condition in position/attitude can typically be the one obtained when applying the rated thrust of the turbine at tower top. This force is suddenly removed, triggering a free decay. Note that during the free decay, the CDPR remains connected to the structure with its lines taut but applies zero load (see
Section 2 on CDPR for details). A similar test should be performed with the actuator disconnected, and it is checked that the QoI are similar between the two tests. Natural periods and damping ratios for the excited degrees of freedom should match too. As in (B1), the direction of the initial force can be adjusted consistently with the test program, which can, for example, contain several wind incidence angles.
4.1.3. Wave Tests - Zero Load (B3)
In this benchmark test, the actuator is again bound to apply zero load, but this time the motions of the floater are triggered by waves. Motions will be rather energetic in the wave frequency range, as well as in the low-frequency range due to nonlinear hydrodynamic effects. This complements (B2), in which motions occur at the natural frequency of the floater. The type of waves selected for this test should be based on the plan of the test campaign. The QoI measured during these tests should be compared to those measured during a test involving the same wave but with CDPR disconnected.
4.1.4. Wave Tests - Wind Loads (B4)
This has been exemplified in the previous section.
4.2. Example of Results
Benchmark tests (B1)-(B4) were executed for both FWT1 and FWT2, as described previously. The following sections show examples of results and their interpretation.
4.2.1. Bode Plots from (B1)
The (B1) chirp tests cover a frequency range of [0,6.5 Hz] for FWT1 and [0,5 Hz] for FWT2 at model scale. Based on (B1), Bode plots can be drawn to illustrate the frequency-dependent relationship between the commanded and measured loads on the floater from the CDPR. Bode plots present the amplitude ratio and the phase lag between these two quantities. Ideally the former should be constant and equal to 1, and the latter to 0o, over the whole frequency range. Technically the amplitude ratio in a Bode plot should be presented with a logarithmic scale, but this has not been done here as it makes deviations from 1.0 less visible.
Bode plots for both FWT1 and FWT2 are shown in
Figure 8. On each plot, data from actual tests in wind, wave and current (discussed in the previous section) and from the benchmark test (B1) are superimposed. For the former, the five controlled load components are shown. Note however, that there are some frequency ranges where data is absent. This is because, in realistic wind/wave tests, there is very little energy in the commanded load in these frequency ranges, meaning that computing an RAO is not meaningful. In the benchmark tests, only two load components (surge and sway) were tested, but data is available over the whole frequency range.
The Bode plot obtained from the benchmark tests compares well to the one from normal operating tests. They are also very similar for the two different FWTs tested here. The general trend is that the amplitude error increases linearly from null at low frequency to +25% at 5Hz, while the phase lag increases linearly from 0o at low frequency to 40o at 5Hz.
Putting this in the context of cyber-physical testing, it is important to note that this phase lag is the one related to the CDPR only, Additional time delays, not related to the actuator (and thus out of scope of the present paper), occur due to the calculation time in numerical substructure (here: rotor simulation) and the exchange of data between different systems. Assuming that such a time delay
exists, it will cause an additional phase lag of
, which increases linearly with the frequency
f. It should be verified that such phase lag do not compromise fidelity [
16], or they should be compensated for [
27, Section 8.3.2].
On top of these linear trends, dips in the curves are observed at 4.11 Hz and 5.65 Hz for FWT1, and 2.1Hz for FWT2, which corresponds to the towers’ natural frequencies. These larger load tracking errors are due to large vibrations of the tower that build up when the CDPR load approaches these frequencies. It is however interesting that such force tracking errors are not visible during the wind-wave tests of FWT2, even if there was energy in the commanded load at these frequencies. This is likely because the resonant vibrations did not build up as intensely during a wind-wave tests as they do during the chirp test.
4.2.2. Comparison of Motions during Decay Tests, from (B2)
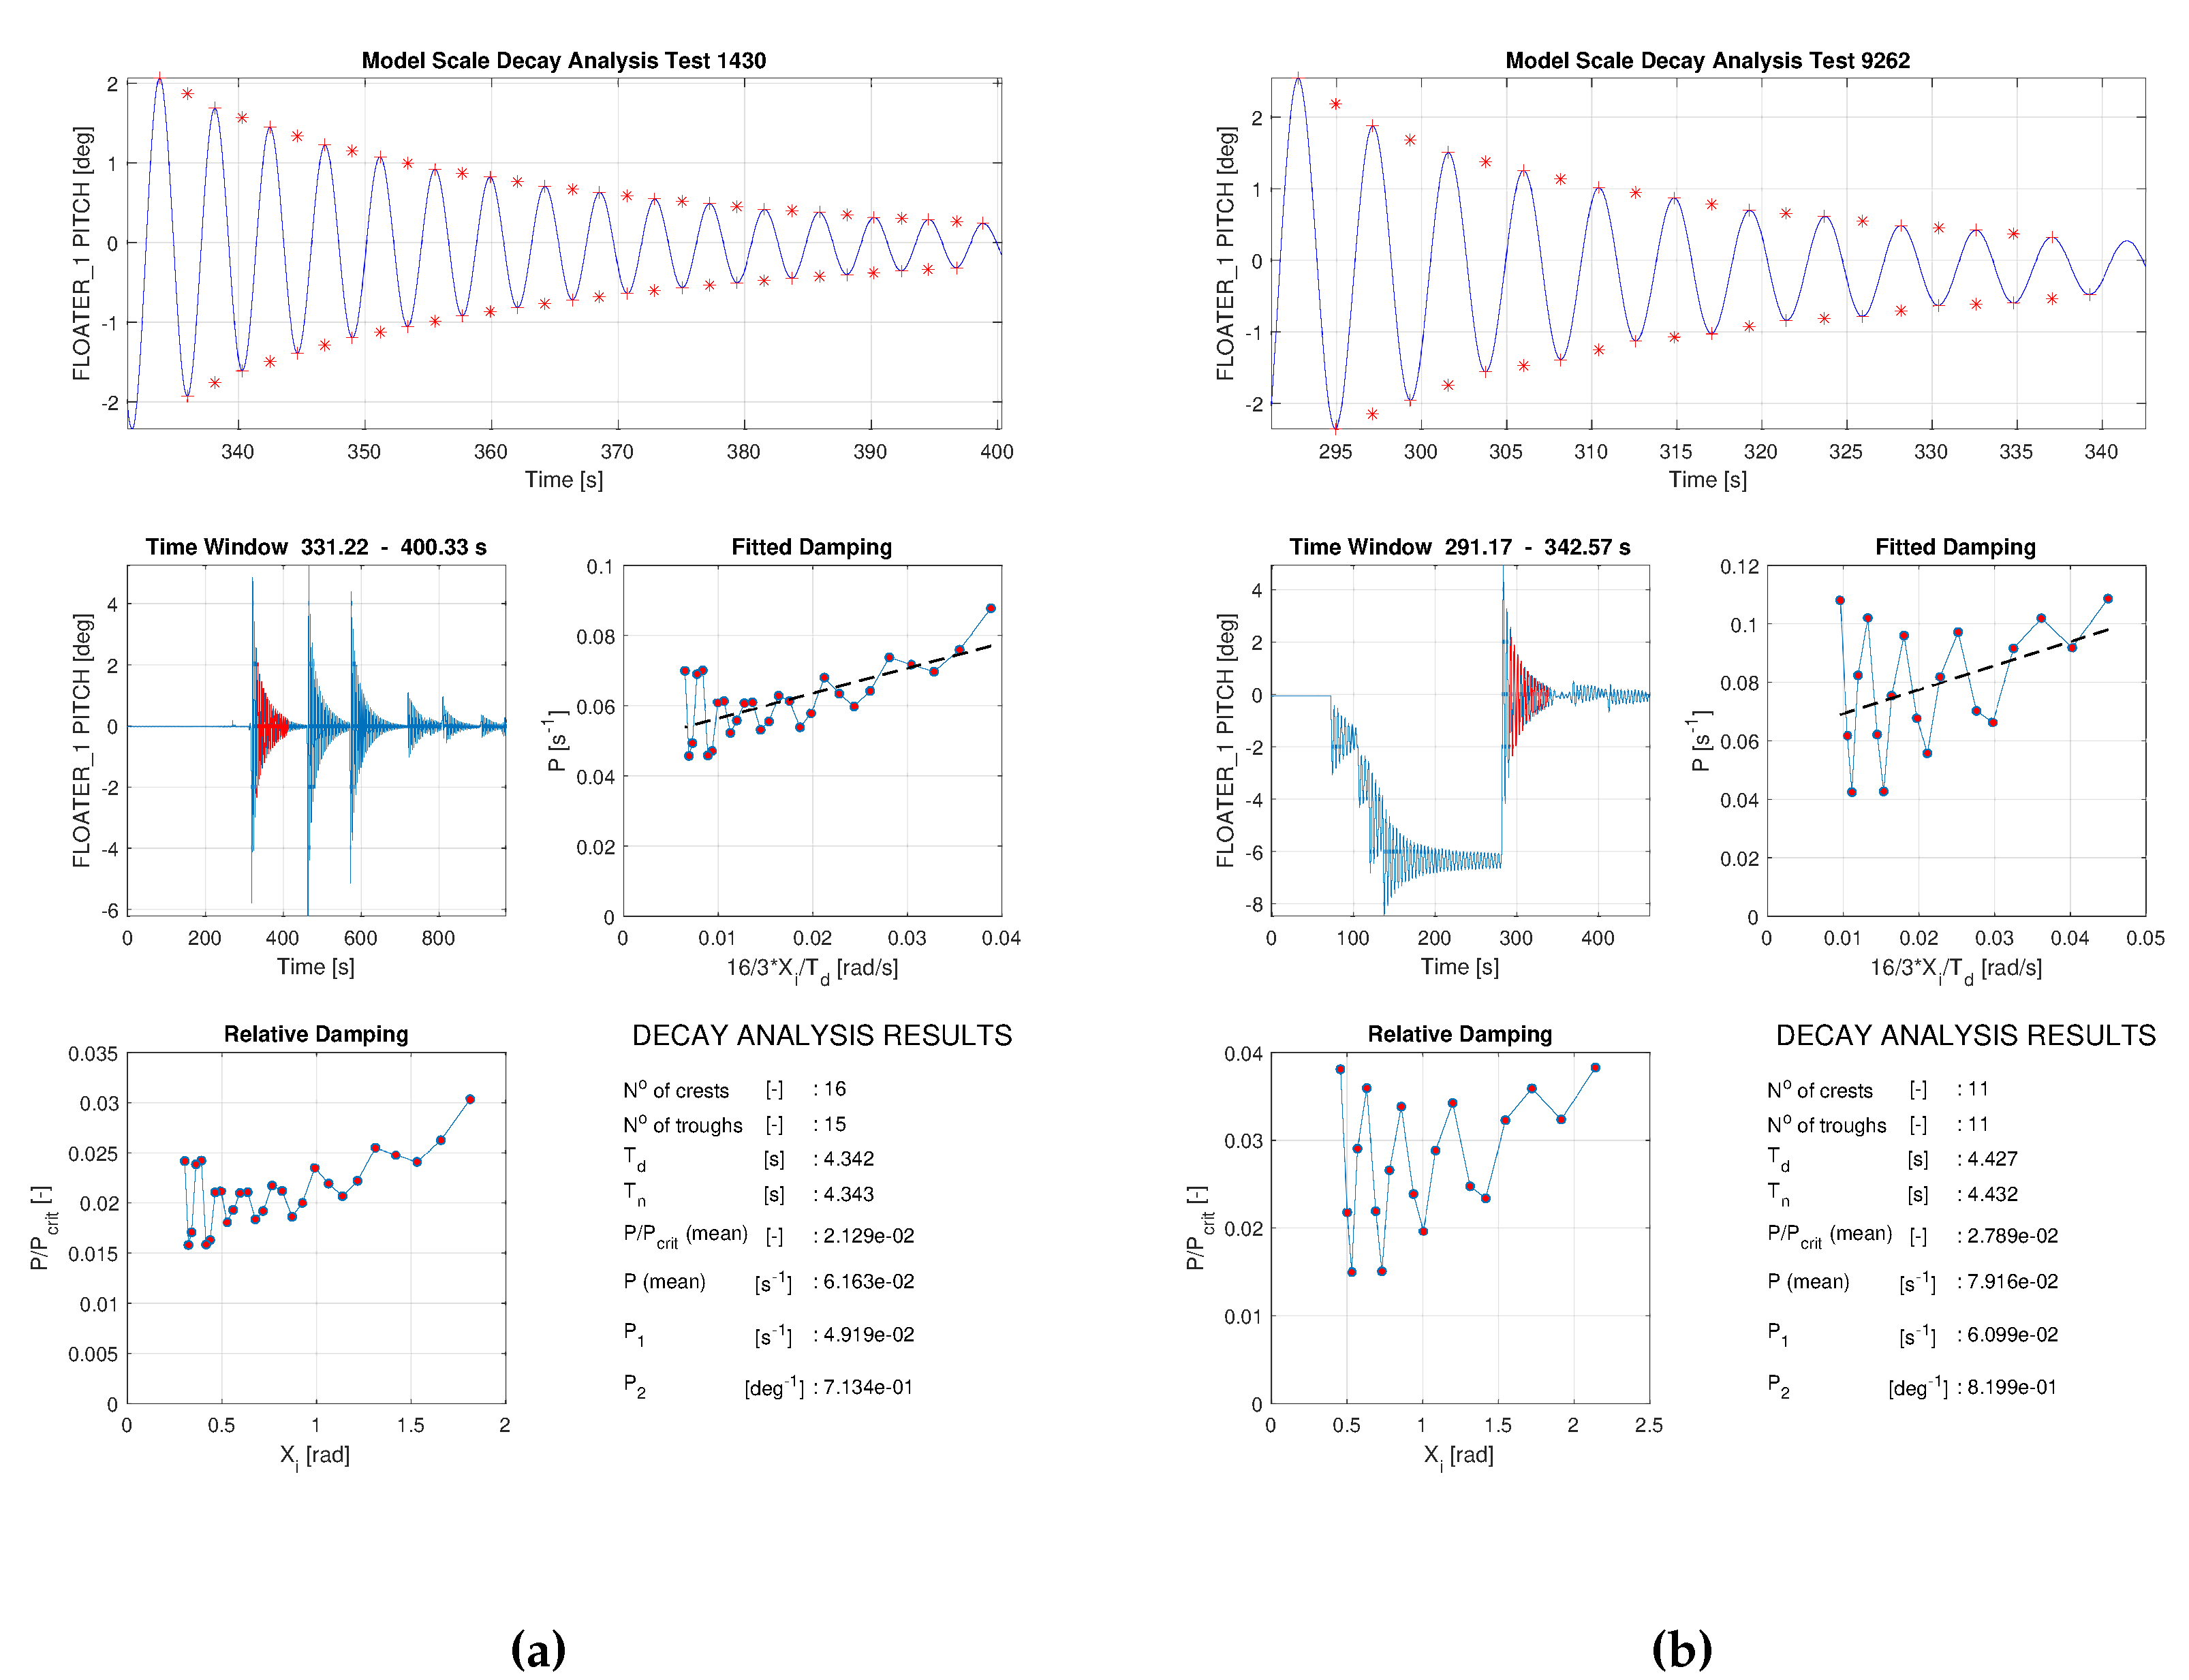
Benchmark (B2) investigates the ability to apply zero loads by conducting a free decay test, where the actuator shall apply zero net loads on the floater. Two pitch decay tests were conducted with and without the CDPR connected using FWT2.
Figure 9 shows a decay analysis from both tests, where the natural period and damping coefficients are calculated.
The decay tests reveal a good match between the damping coefficients and natural periods with and without the CDPR connected.
4.2.3. Comparison of Motions - CDPR Connected and Disconnected, from (B3)
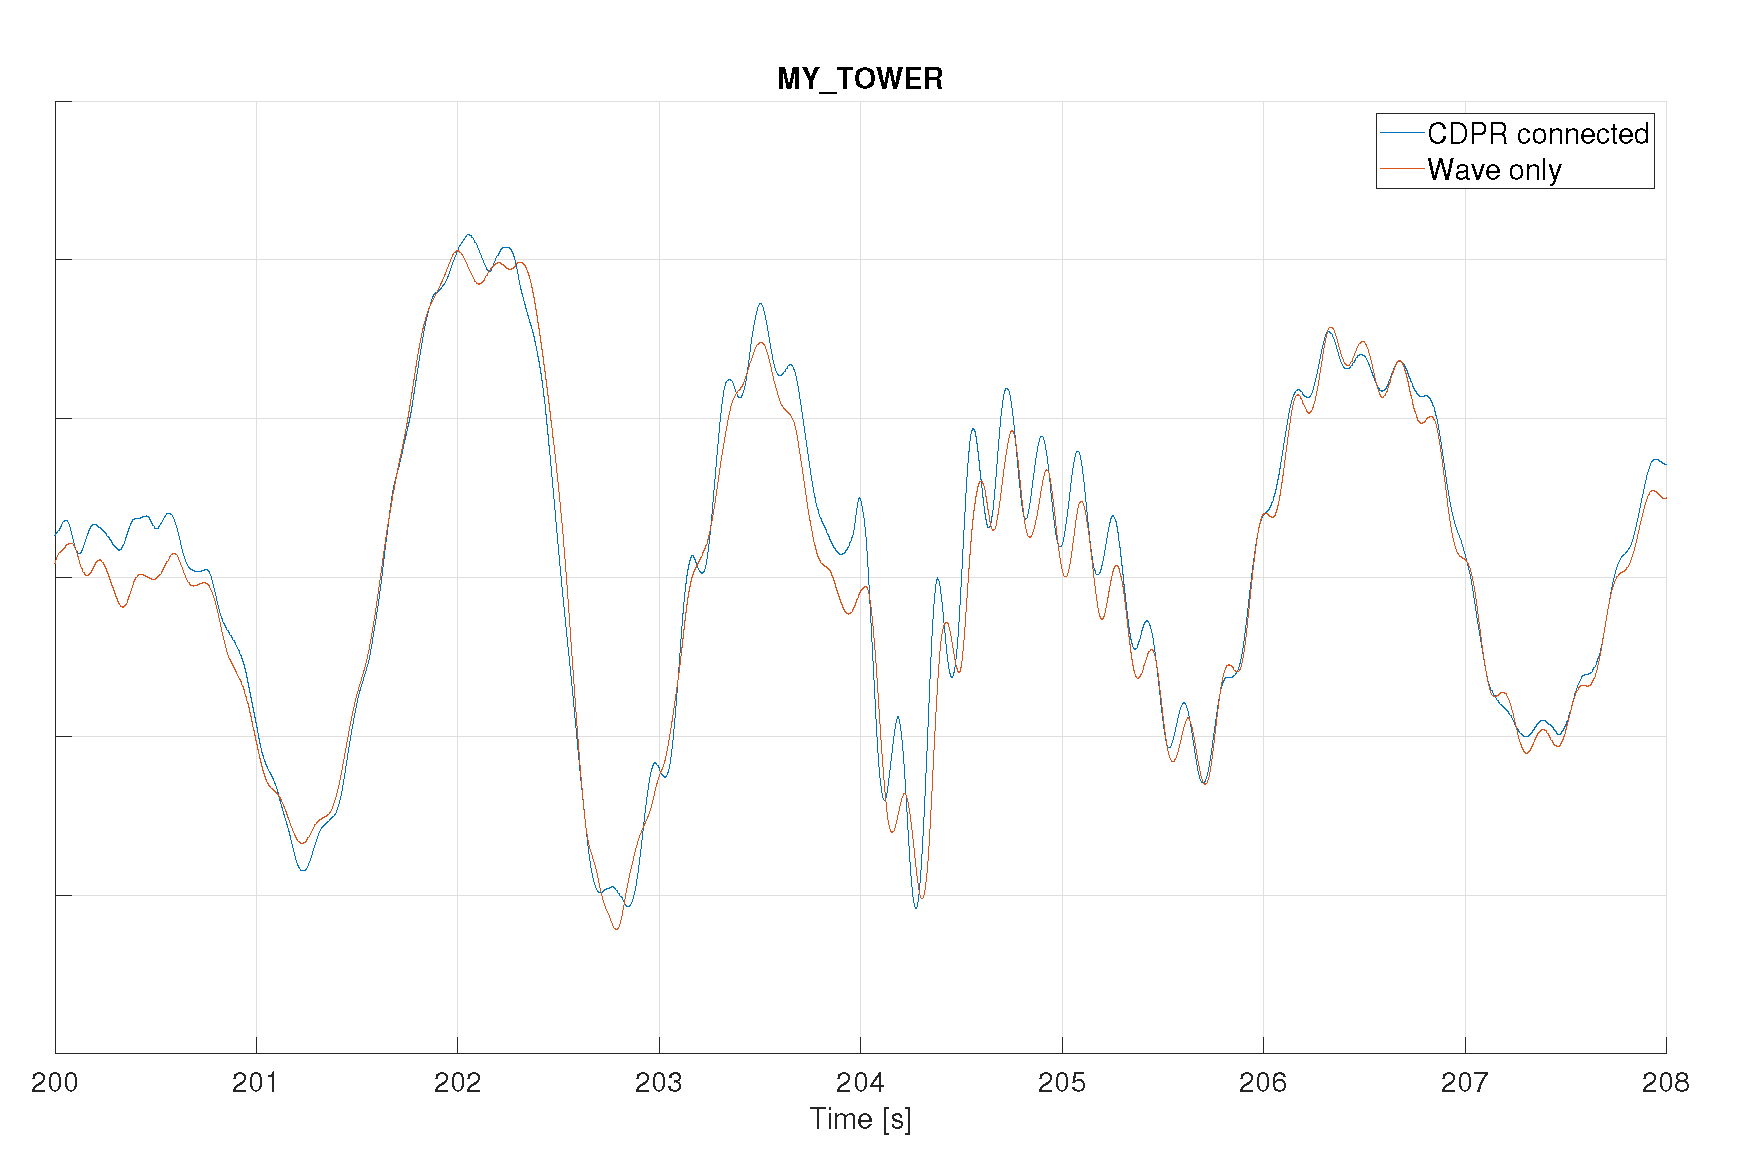
Benchmark (B3) assesses the disturbance rejection capability of the CDPR for frequency ranges covering the low frequency to wave frequency. In presence of waves, the CDPR is requested to apply zero load, and the Quantities of Interest are compared with their version when the CDPR is disconnected. The comparison is carried out in terms of time series and power spectra, which are shown here for FWT1. QoI considered are the motions of the tower top, particularly surge, pitch, and yaw, which are the ones responding significantly in these conditions. See
Figure 103.
The tests reveal a good match between the results obtained with and without the CDPR connected. The left-most peak in the power spectra corresponds to the structure’s natural frequency, while the second peak at about 0.54Hz corresponds to the wave frequency. The location of the natural frequencies matches very well, and so does the time series of motions between the two tests. While the match is nearly perfect for the surge motion, some minor differences are observed for the pitch and yaw time series. However, it should be noted that these are small (typical amplitude of 0.5 degrees).
4.2.4. Comparison of Structural Quantities of Interest - CDPR Connected and Disconnected, from (B3)
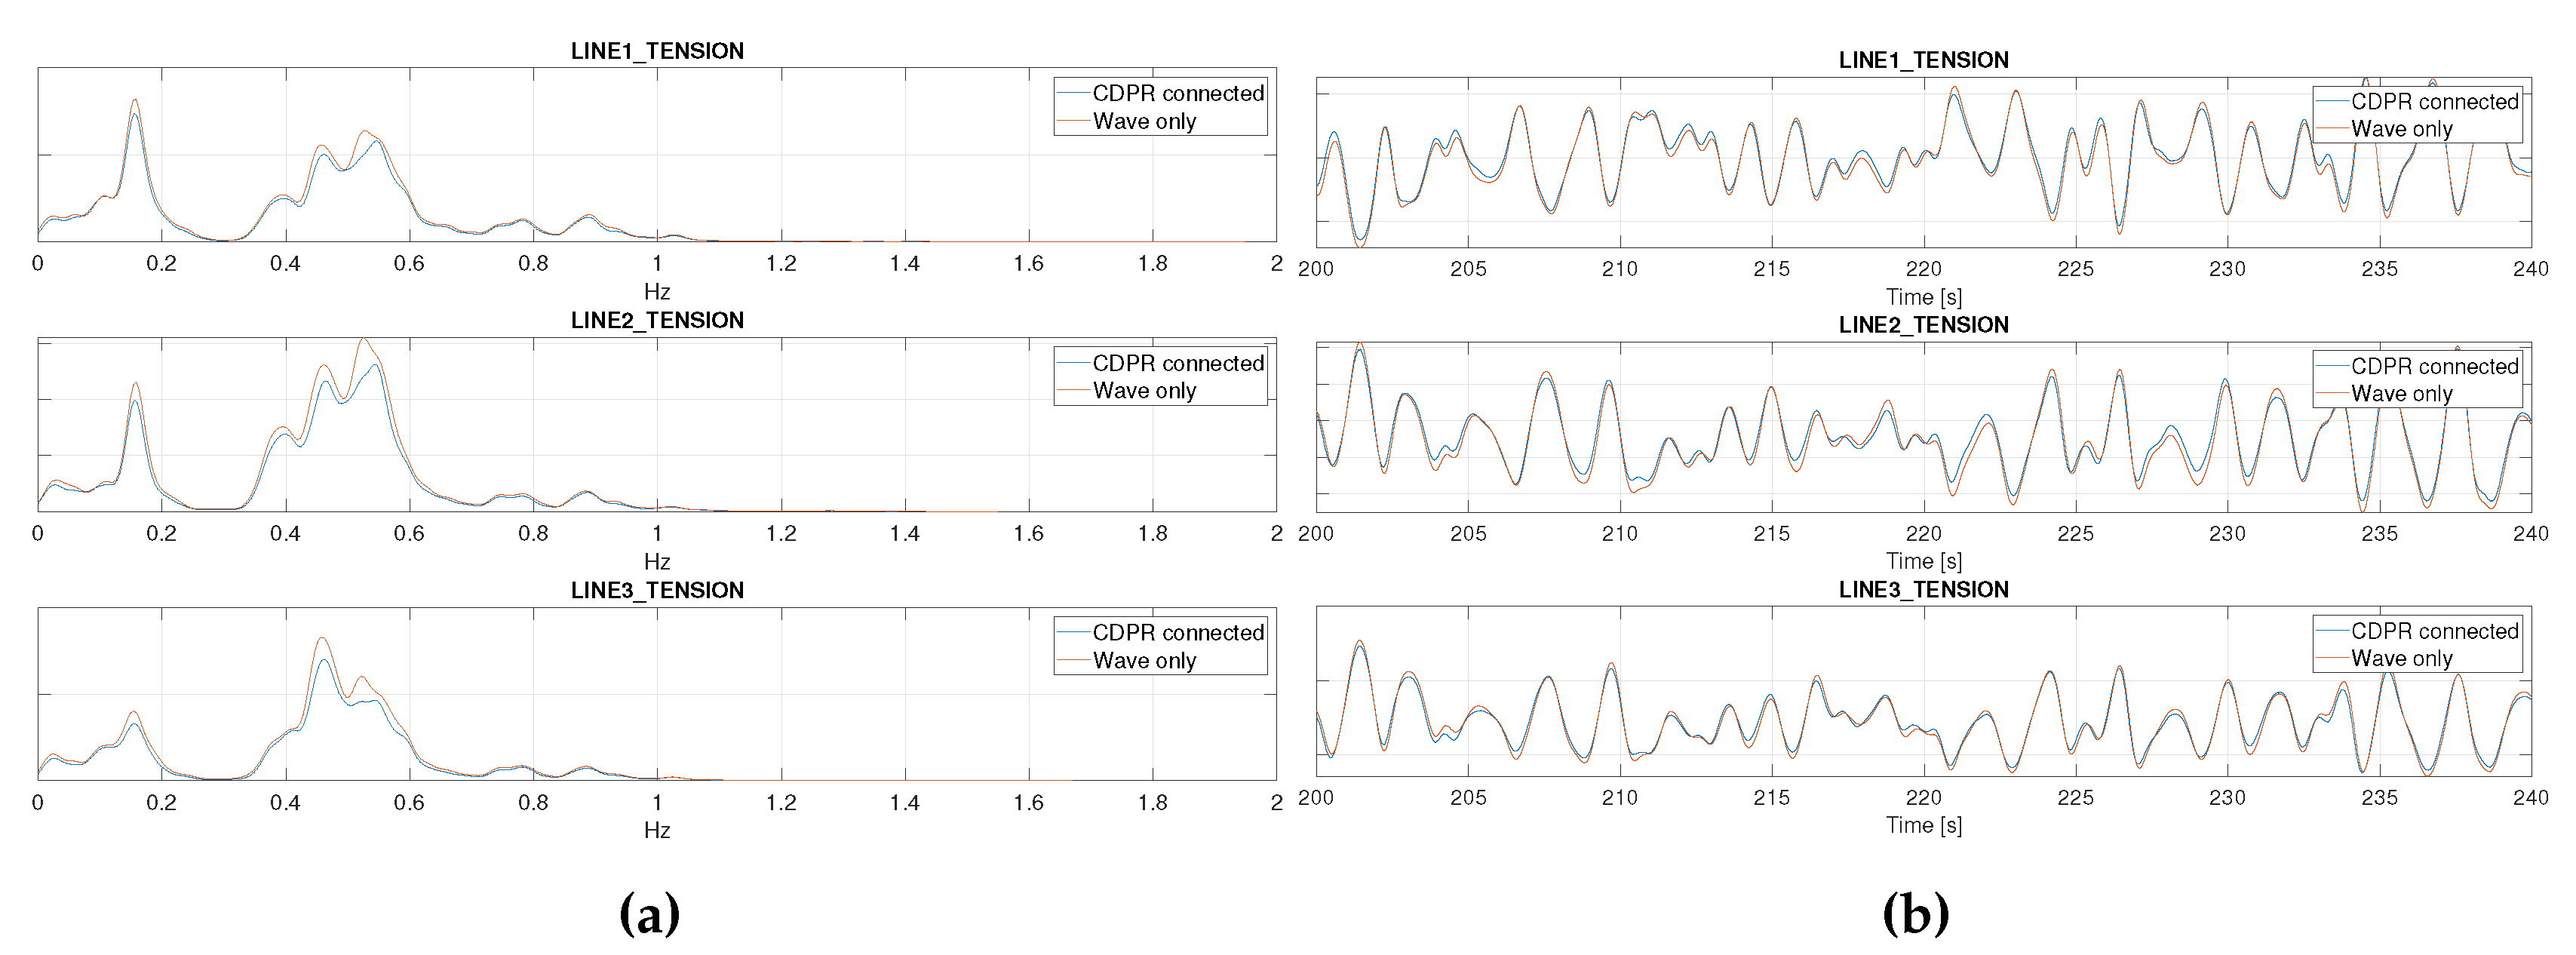
Figure 11 compares the frequency spectra of the tensions in the three mooring lines. Similar frequency patterns to the surge motion spectrum are observed. Both spectrum and time series demonstrate good consistency between the tests conducted with and without CDPR connected.
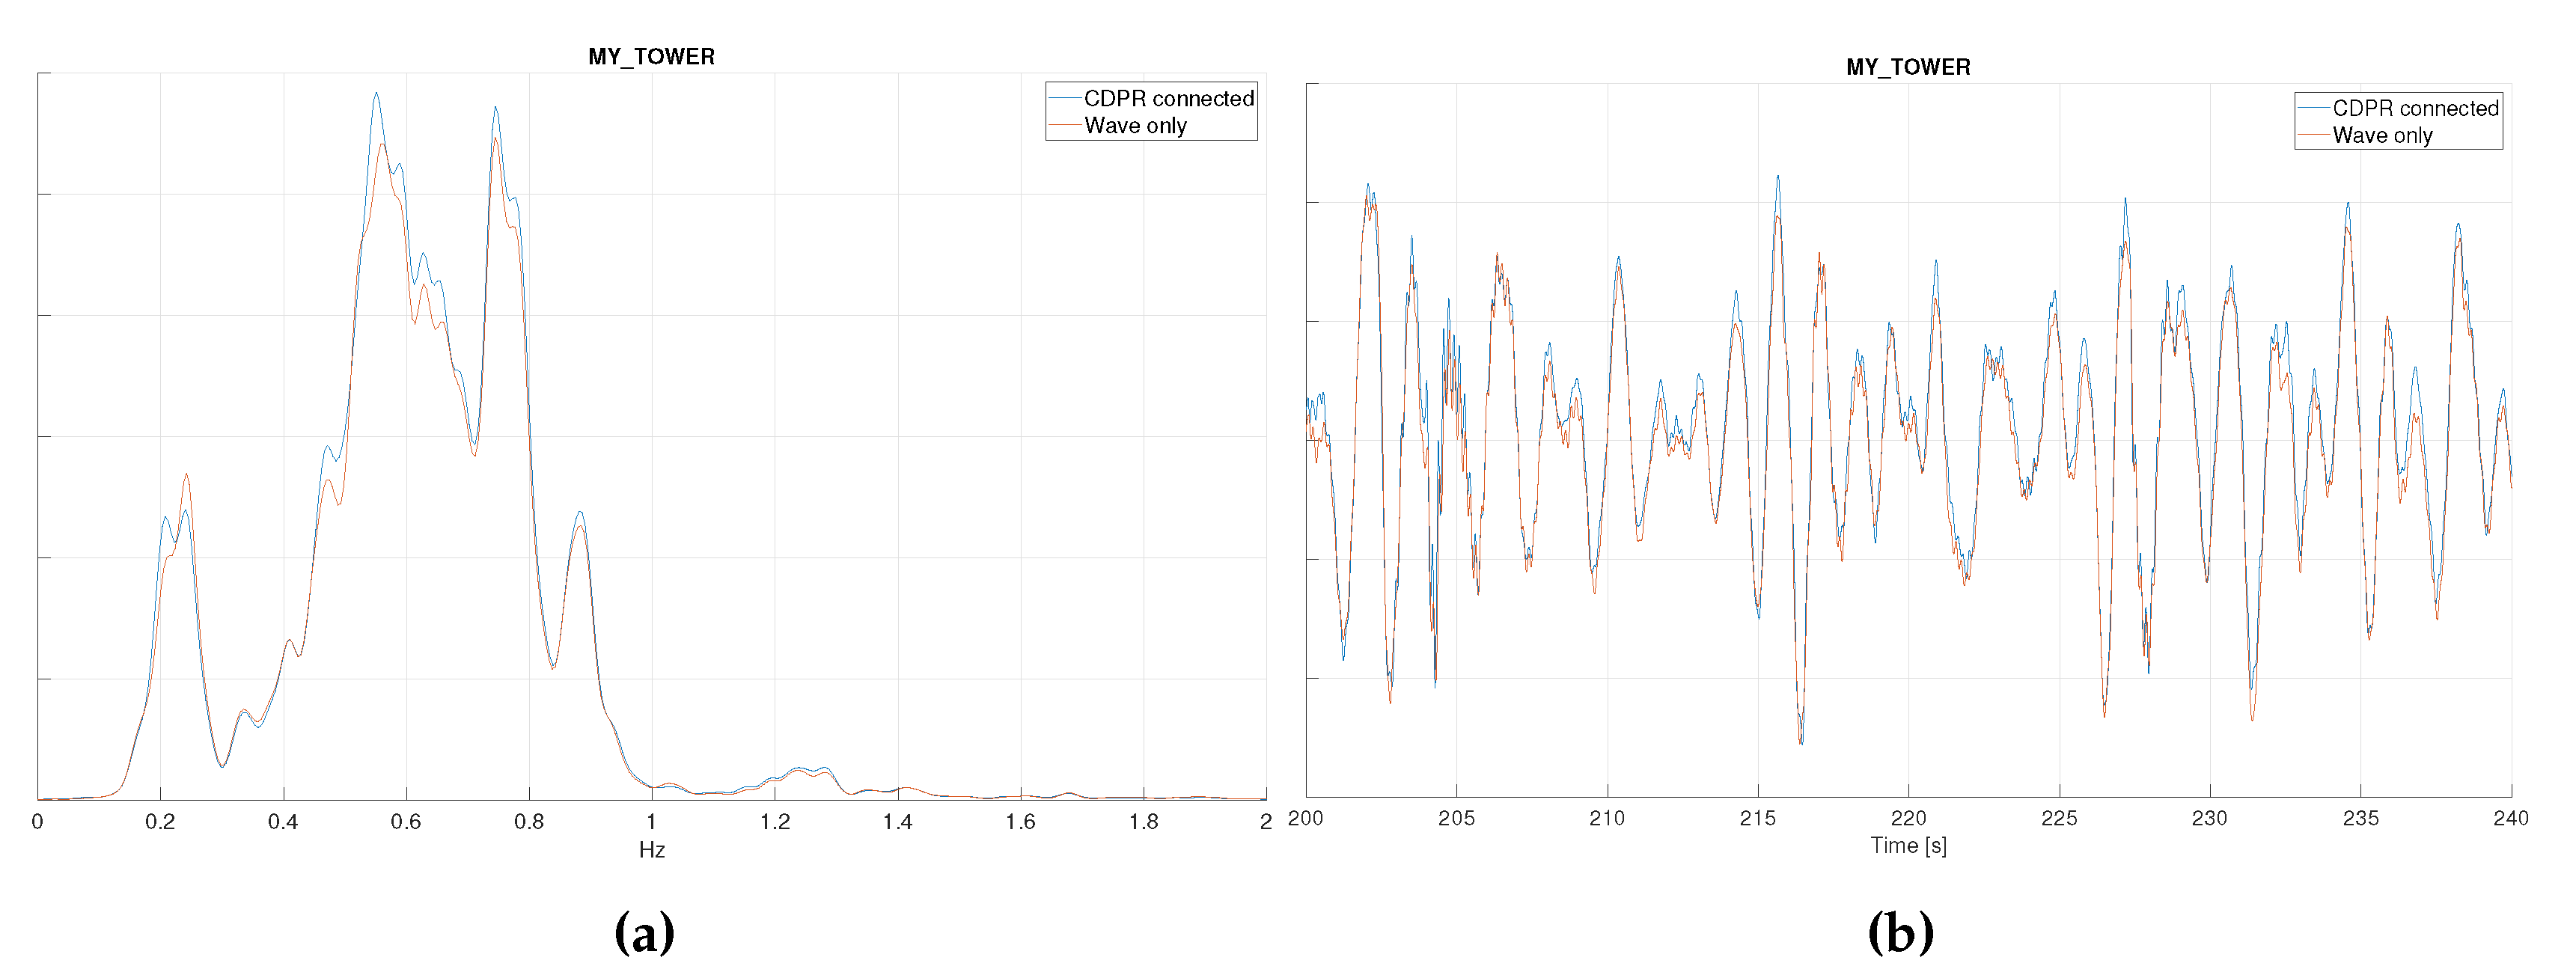
This is also the case for the fore-aft bending moment measured at tower base, see
Figure 12.
Figure 13 shows a close-up of the time series measurement of the internal bending moment during a slamming event, triggering high-frequency vibrations of the tower. It can be observed that the measured bending moments are the same with and without the CPDR connected.
4.2.5. Accelerations at Nacelle - CDPR Connected and Disconnected, from (B3)
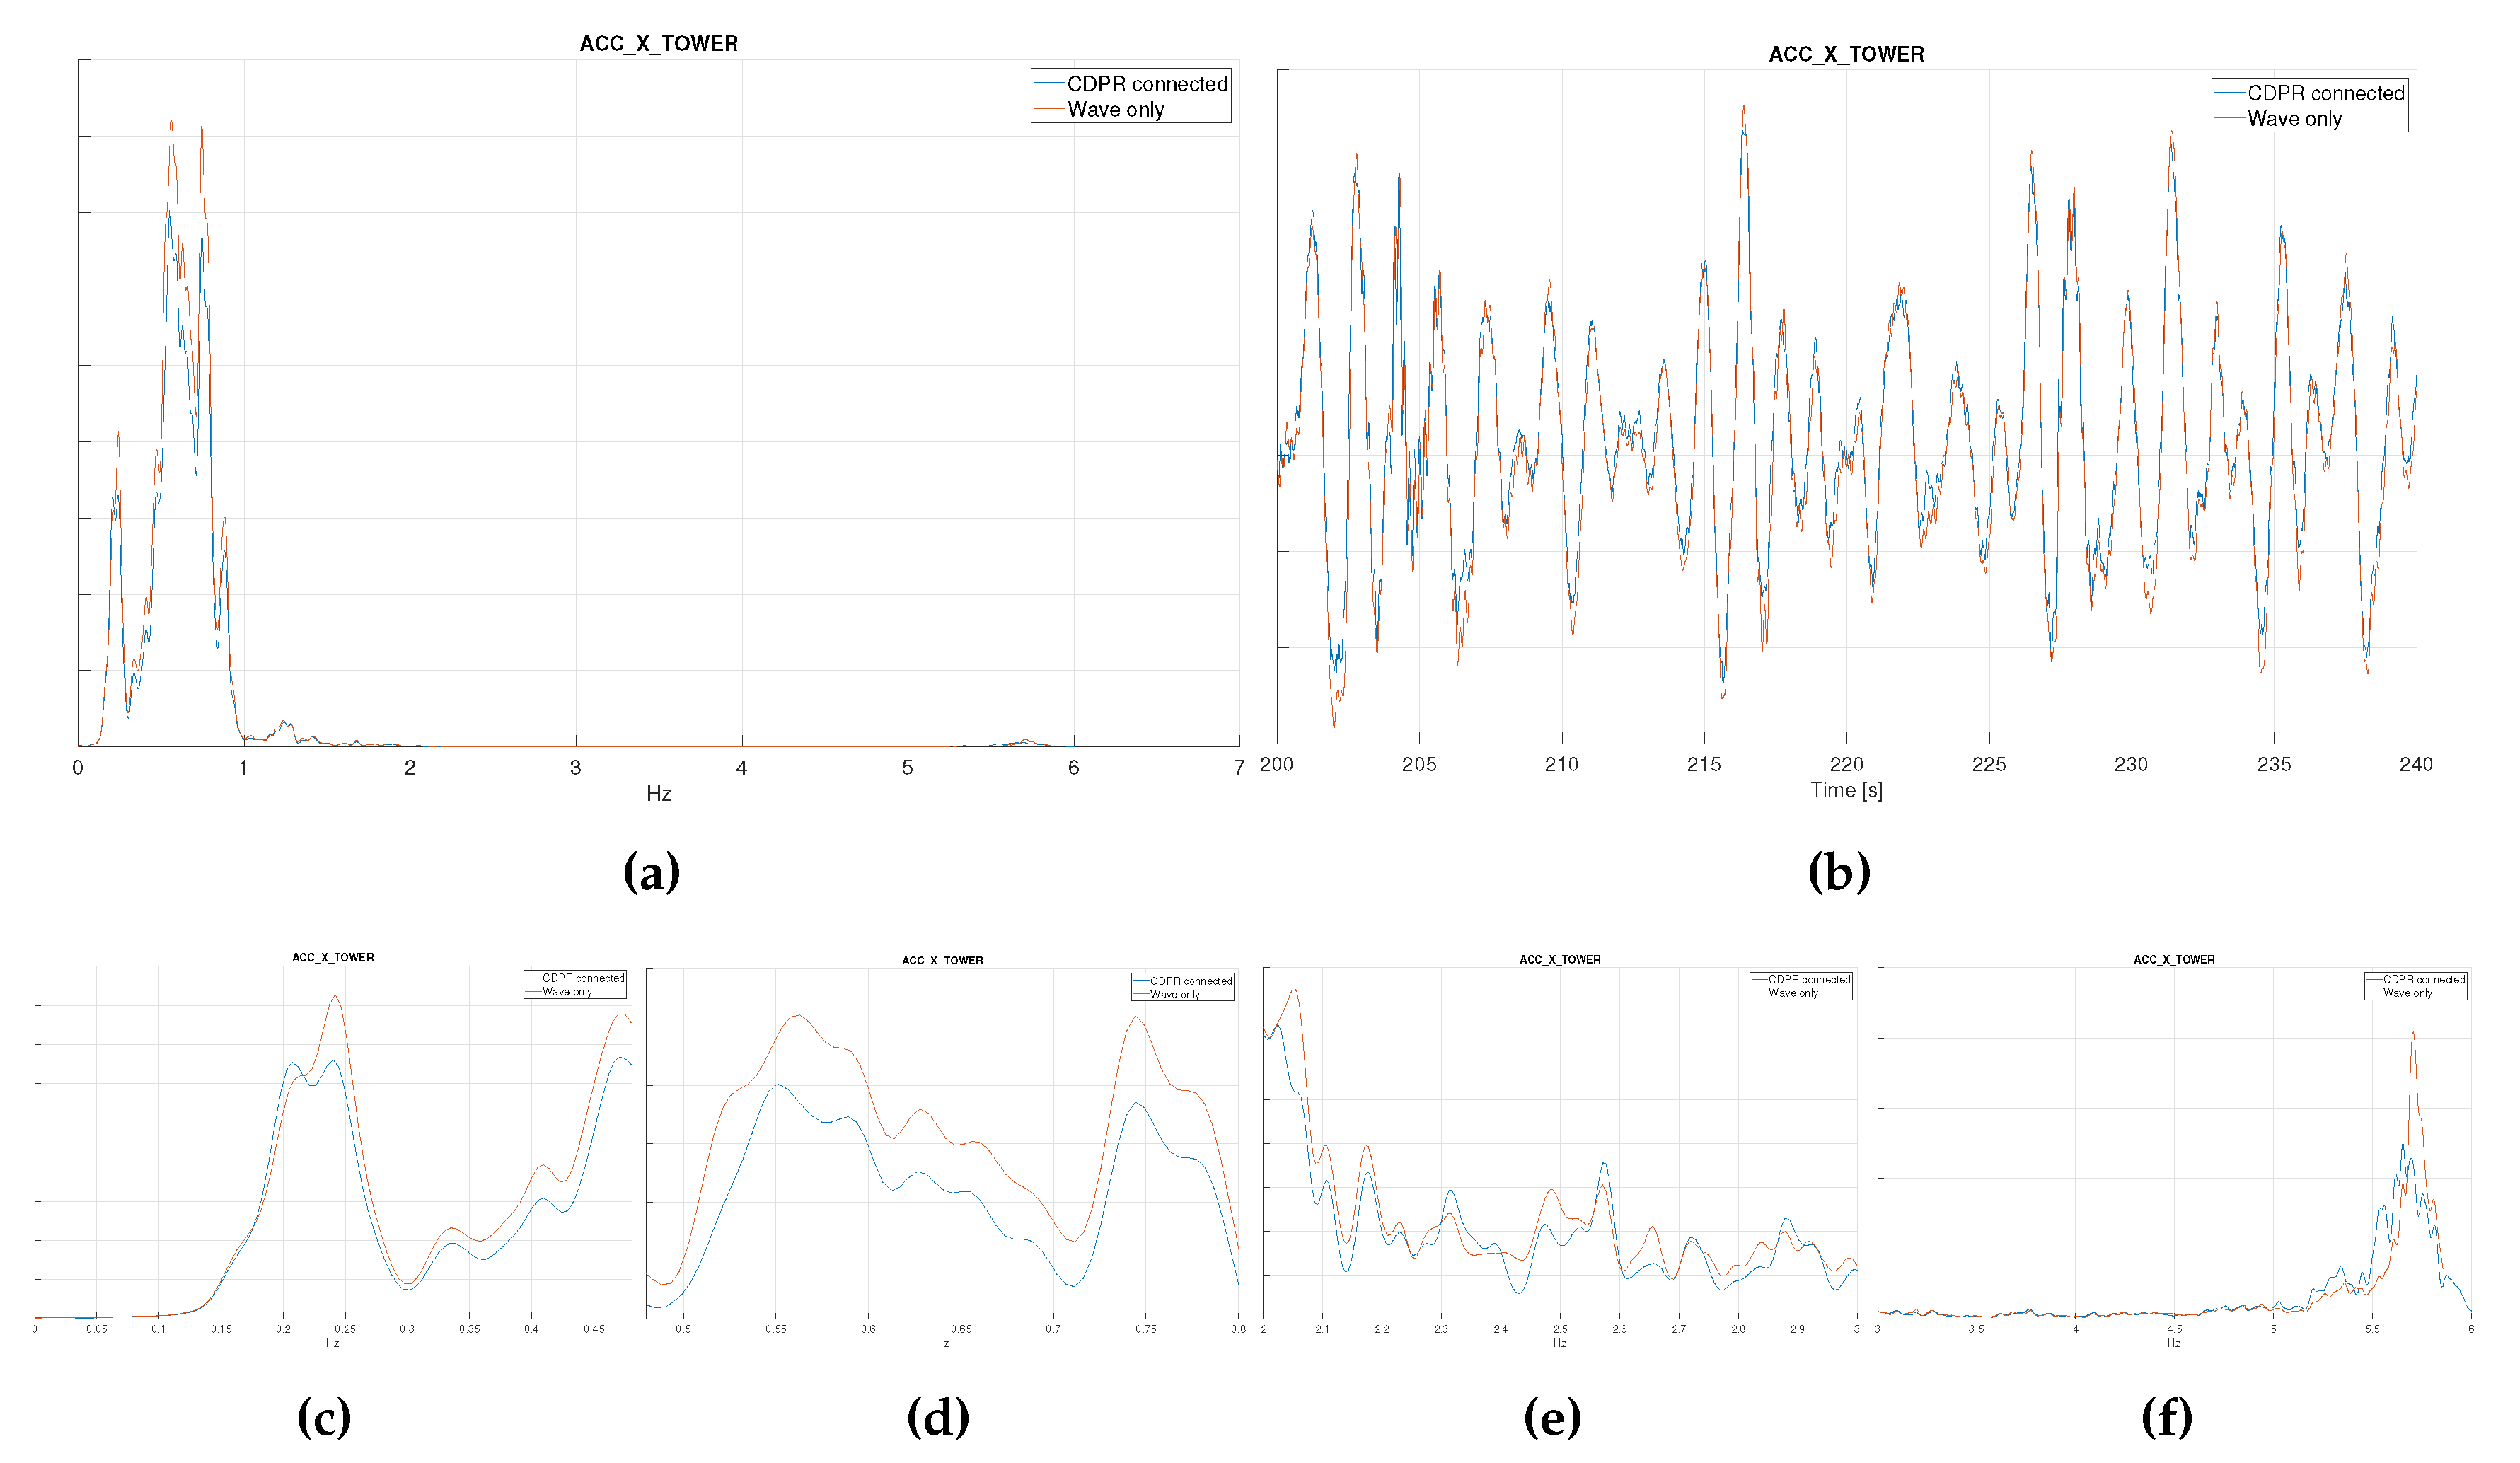
Figure 14 shows the spectrum and time series of accelerations at the nacelle level. On the lower part of the figure, the power spectrum is divided into low-frequency, wave-frequency, 3
p and 6
p frequency range to better observe the frequency spectrum magnitude. Except a discrepancy in the accelerations at 6
p (but with very low energy), the accelerations compare satisfactorily with CDPR connected and disconnected.
4.3. Summary
The defined benchmark tests enabled to assess SINTEF Ocean’s CDPR performance using FWTs with different dynamic behaviours. It is found that the CDPR has good disturbance rejection capabilities and very small load tracking errors in the low- and wave-frequency ranges. At frequency ranges close to 3p, a phase lag of about 20 degrees and an amplitude error of 15% are observed. Both errors keep on increasing approximately linearly with increasing frequency.
5. Conclusion
Actuators play a key role in achieving high-fidelity cyber-physical testing of floating wind turbines. There are significant differences in the the type of actuators used across hydrodynamic testing facilities, as they presently take the form of multi-rotors, single fans, single winches, and cable-driven parallel robots (CDPR). While it is trivial to compare their intrusiveness (in terms of weight and space required on the model), or how many of the six load components they are able to apply, it has so far not been clear how to characterize their dynamic performance.
The present paper motivated and introduced (1) a set of requirements and sub-requirements to the actuator, (2) a set of simple benchmark tests that aim at checking that these requirements are fulfilled, and (3) exemplified these benchmark tests using SINTEF Ocean’s CDPR and two different 15MW FWT concepts. The benchmark tests are meant to be performed prior to initiation of the tests, and repeated on a regular basis during longer test campaigns to ensure their quality. It was seen that actuator properties obtained during the benchmark and the tests under complex wind/wave/current loading were consistent.
The need to identify quantities and frequencies of interest as a basis for assessment of the results was emphasized. It was also recommended to employ linear scales (rather than logarithmic) and splitting plots over the frequency ranges of interest (rather than showing only a single spectrum covering all frequencies) to avoid missing some important benchmark results.
The future trend for FWT concepts is to accommodate rotors with rated power beyond 15MW. By comparing the IEA 15MW and 22MW reference turbines, it is seen that the range of frequencies over which the actuator should perform will not increase. However, static and dynamic rotor loads will increase significantly. To achieve this, the actuator must be upscaled. A CDPR can conveniently cope with this by adding more actuators, without increasing the weight of the reduced-scale model. A short discussion about the consequence of such a reconfiguration of the CDPR on its performance is discussed in the Appendix.
Author Contributions
Conceptualization, T.S. M.T and Y.J; methodology, T.S.; software, Y.J.; validation, Y.J. and T.S.; formal analysis, Y.J.; investigation, T.S and Y.J.; resources, M.T. and T.S.; data curation, Y.J.; writing—original draft preparation, Y.J. and T.S.; writing—review and editing, T.S., Y.J. and M.T.; visualization, Y.J.; supervision, T.S. and M.T.; project administration, Y.J. and T.S.; funding acquisition, T.S. and M.T. All authors have read and agreed to the published version of the manuscript.
Funding
This research has been funded by the Research Council of Norway through project 326654 CYBERLAB KPN, a collaboration between SINTEF Ocean, NTNU, University of Aarhus, Equinor, Aker Offshore Wind, APL Norway, Sevan SSP and Delmar Systems.
Institutional Review Board Statement
Not applicable.
Informed Consent Statement
Not applicable.
Data Availability Statement
Data is contained within the article.
Conflicts of Interest
The authors declare no conflict of interest.
Appendix A. Consequence of Reconfiguring/Upscaling the CDPR on Its Performance
A CDPR can be reconfigured, which means that the number and placement of actuators can be adapted to the problem at hand. A relevant question in the context of this paper is then how the performance of the CDPR is affected by this reconfiguration. To investigate this, the performance of
individual winches was compared to the performance of the CDPR as a whole. This was done by revisiting the data from the chirp benchmark tests (B1) that involved seven winches. While the analysis of (B1) has so far been targeting global loads, as presented in
Figure 8, the tension measurements obtained during (B1) can be used to investigate the force tracking performance of
individual winches.
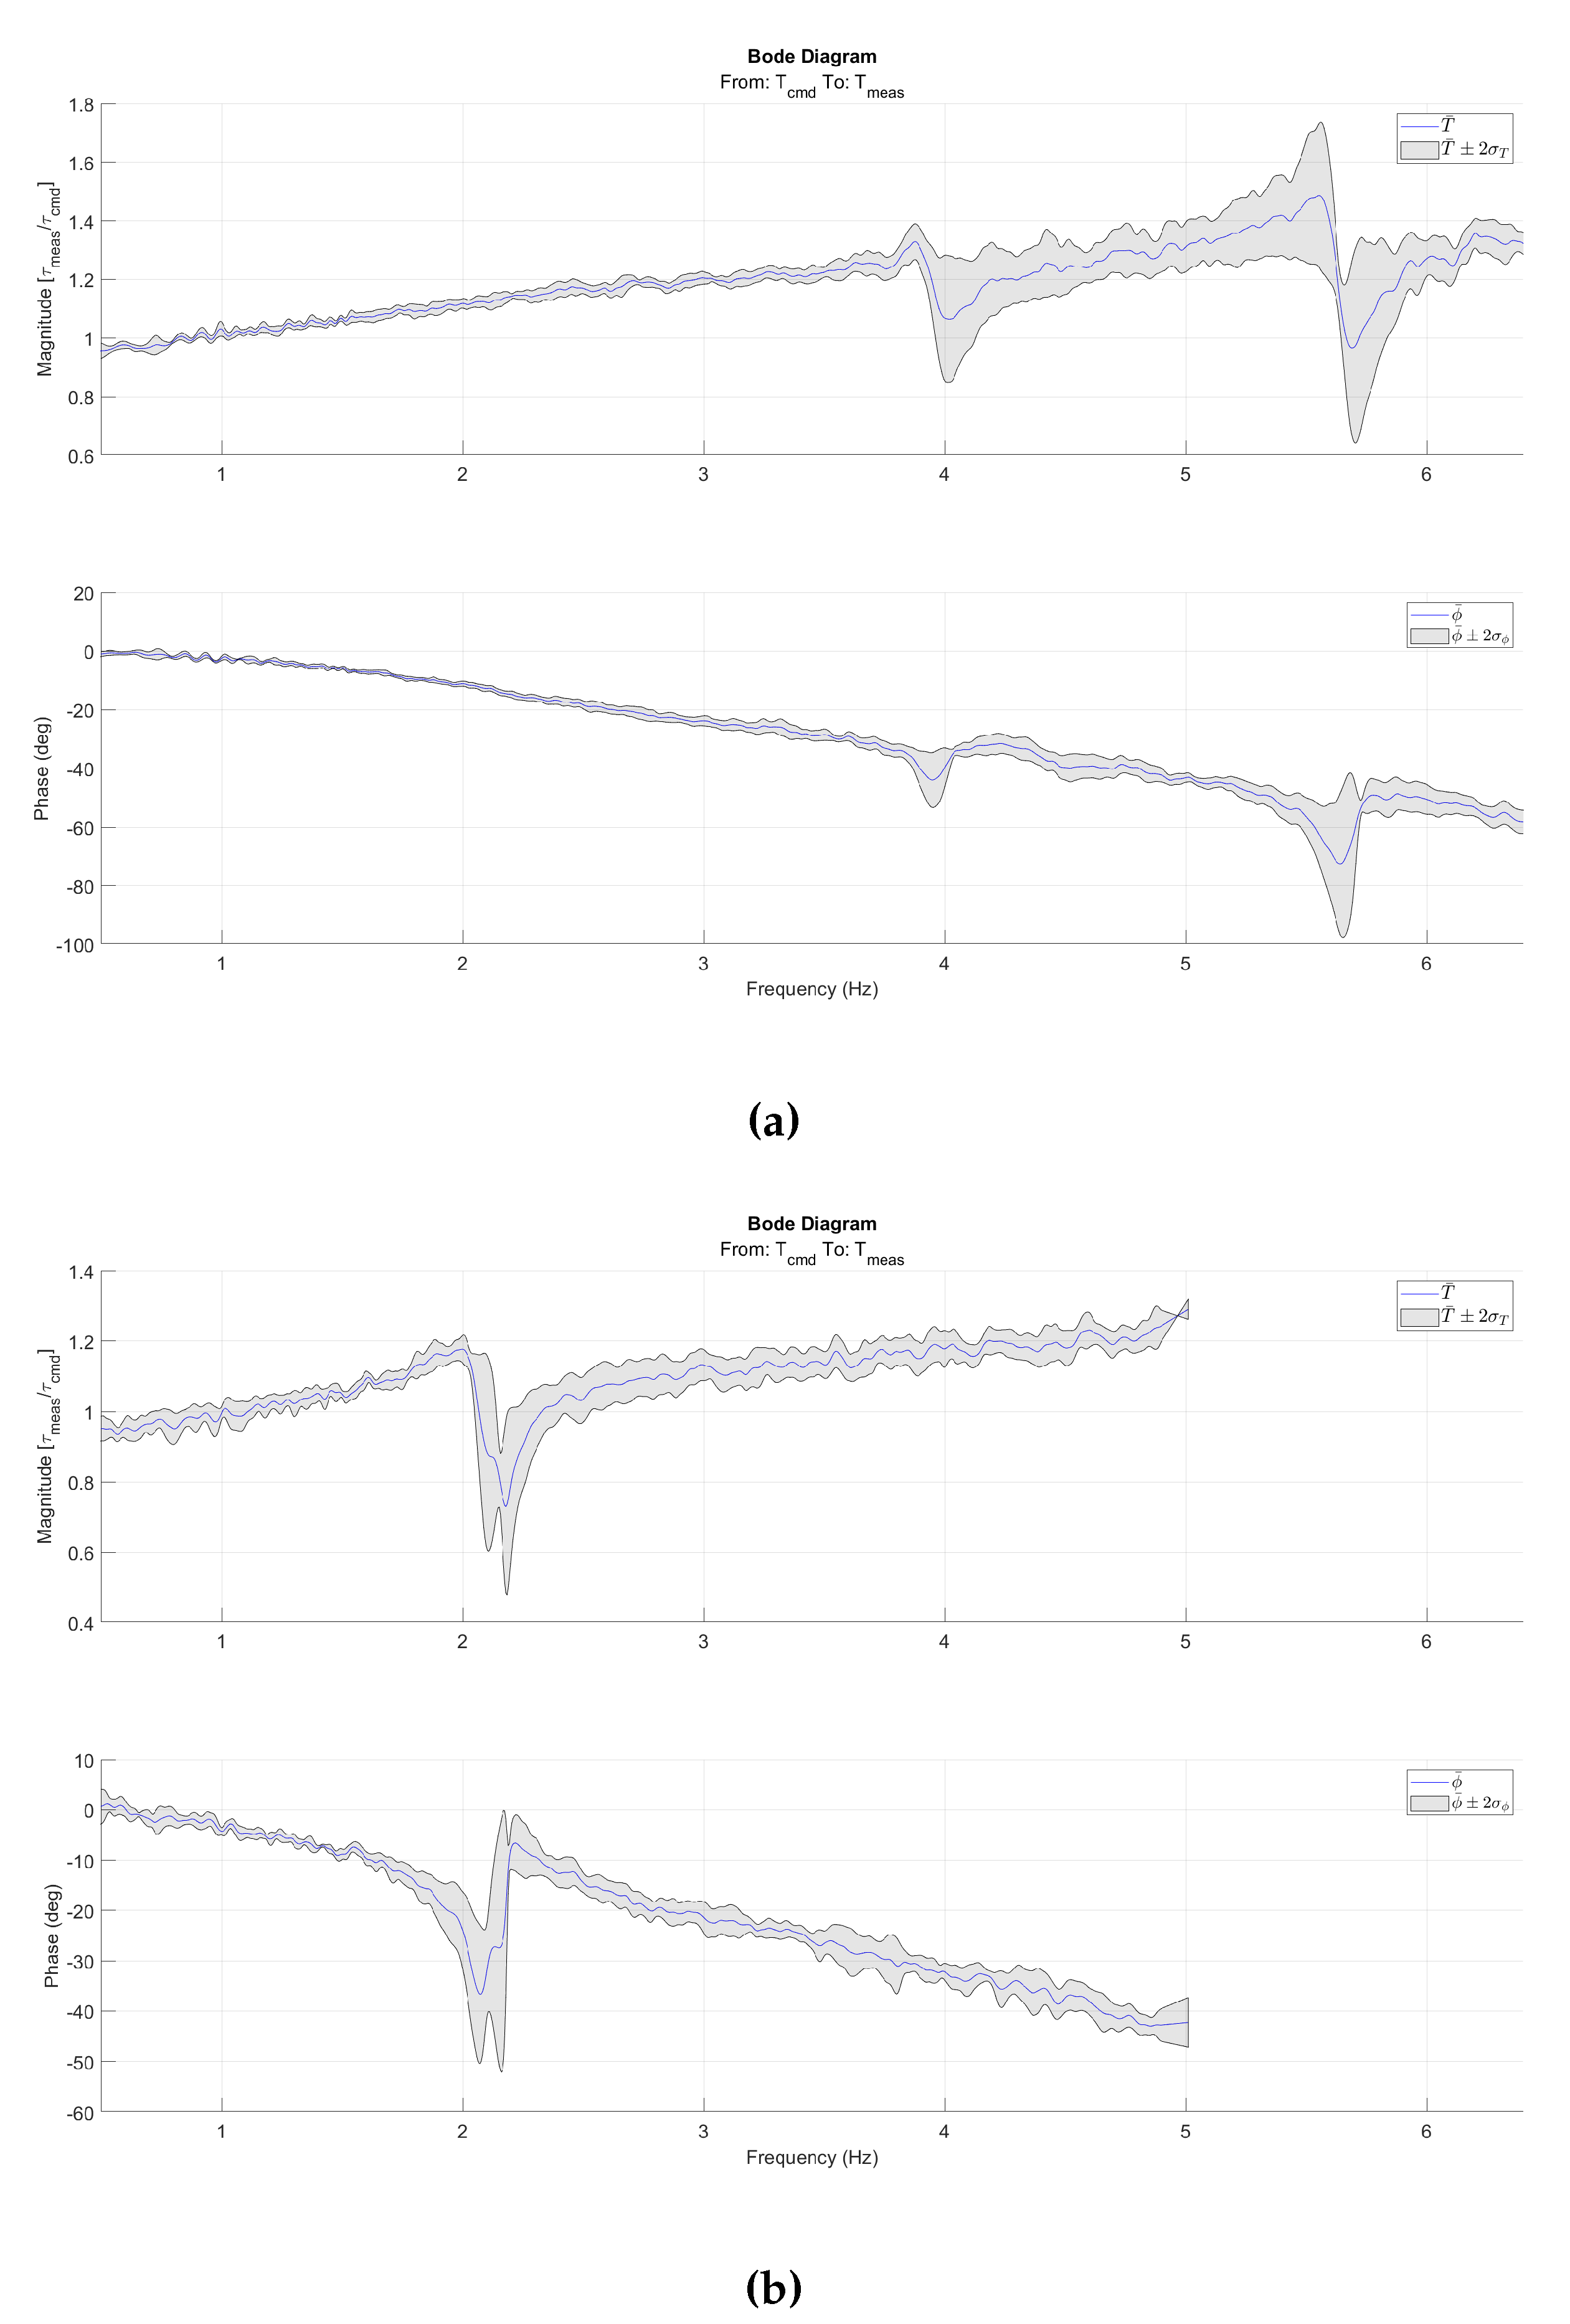
Figure A1 shows the average RAO for the winches (plus/minus two standard deviations) as a function of frequency. By comparing
Figure 8 and
Figure A1, it is clear that the performance of individual winches in terms of load tracking corresponds to that of the CDPR as a whole. This indicates that the performance of the CDPR as whole reflects the performance of the individual winches, and therefore that the performance will not be significantly influenced by reconfiguration, e.g. adding more actuators to achieve higher loads.
Figure A1.
Bode diagrams of the average RAO between commanded and measured tensions in the cables: (a) FWT1 and (b) FWT2. The grey background illustrates ±2 standard deviations to the average. Amplitude is denoted T and phase denoted .
Figure A1.
Bode diagrams of the average RAO between commanded and measured tensions in the cables: (a) FWT1 and (b) FWT2. The grey background illustrates ±2 standard deviations to the average. Amplitude is denoted T and phase denoted .
Notes
| 1 |
ReaTHM® testing stands for Real-Time Hybrid Model testing, and is a registered trademark of SINTEF Ocean |
| 2 |
|
| 3 |
As the focus is on the comparison between measurements made with and without CDPR connected, and due to confidentiality requirements, the y-axes of this figure and the four next ones have been removed. |
References
- DNV. Offshore Standard - Floating Wind Turbine Structures (DNV-ST-0119), 2021.
- DNV. Recommended Practice - Environmental Conditions and Environmental Loads (DNV-RP-C205), 2024.
- Martin, H.R.; Kimball, R.W.; Viselli, A.M.; Goupee, A.J. Methodology for Wind/Wave Basin Testing of Floating Offshore Wind Turbines. Journal of Offshore Mechanics and Arctic Engineering 2014, 136, 020905. [Google Scholar] [CrossRef]
- Kimball, R.; Goupee, A.J.; Fowler, M.J.; de Ridder, E.J.; Helder, J. Wind/Wave Basin Verification of a Performance-Matched Scale-Model Wind Turbine on a Floating Offshore Wind Turbine Platform. In Proceedings of the ASME 2014 33rd International Conference on Ocean, Offshore and Arctic Engineering. American Society of Mechanical Engineers, 2014.
- Azcona, J.; Bouchotrouch, F.; González, M.; Garciandía, J.; Munduate, X.; Kelberlau, F.; Nygaard, T.A. Aerodynamic Thrust Modelling in Wave Tank Tests of Offshore Floating Wind Turbines Using a Ducted Fan. Journal of Physics: Conference Series 2014, 524, 012089. [Google Scholar] [CrossRef]
- Sauder, T.; Chabaud, V.; Thys, M.; Bachynski, E.E.; Sæther, L.O. Real-Time Hybrid Model Testing of a Braceless Semi-submersible Wind Turbine. Part I: The Hybrid Approach. In Proceedings of the ASME 2016 35th International Conference on Ocean, Offshore and Arctic Engineering, 2016.
- Thys, M.; Sauder, T.; Fonseca, N.; Berthelsen, P.A.; Engebretsen, E.; Haslum, H. Experimental Investigation of the Coupling between Aero- and Hydrodynamical Loads on a 12 Mw Semi-Submersible Floating Wind Turbine. In Proceedings of the Proceedings of the ASME 2021 40th International Conference on Ocean, Offshore and Arctic Engineering, 2021. [CrossRef]
- Chabaud, V.; Eliassen, L.; Thys, M.; Sauder, T. Multiple-Degree-of-Freedom Actuation of Rotor Loads in Model Testing of Floating Wind Turbines Using Cable-Driven Parallel Robots. Journal of Physics: Conference Series 2018.
- Hall, M.; Goupee, A.J. Validation of a Hybrid Modeling Approach to Floating Wind Turbine Basin Testing: Validation of a Hybrid Modeling Approach to Floating Wind Turbine Basin Testing. Wind Energy 2018. [Google Scholar] [CrossRef]
- Gueydon, S.; Bayati, I.; de Ridder, E. Discussion of Solutions for Basin Model Tests of FOWTs in Combined Waves and Wind. Ocean Engineering 2020, 209, 107288. [Google Scholar] [CrossRef]
- Matoug, C.; Augier, B.; Paillard, B.; Maurice, G.; Sicot, C.; Barre, S. An Hybrid Approach for the Comparison of VAWT and HAWT Performances for Floating Offshore Wind Turbines. Journal of Physics: Conference Series 2020, 1618, 032026. [Google Scholar] [CrossRef]
- Otter, A.; Murphy, J.; Desmond, C.J. Emulating Aerodynamic Forces and Moments for Hybrid Testing of Floating Wind Turbine Models. Journal of Physics: Conference Series 2020, 1618, 032022. [Google Scholar] [CrossRef]
- Vittori, F.; Azcona, J.; Eguinoa, I.; Pires, O.; Rodríguez, A.; Morató, Á.; Garrido, C.; Desmond, C. Model Tests of a 10 MW Semi-Submersible Floating Wind Turbine under Waves and Wind Using Hybrid Method to Integrate the Rotor Thrust and Moments. Wind Energy Science 2022, 7, 2149–2161. [Google Scholar] [CrossRef]
- Hmedi, M.; Uzunoglu, E.; Medina-Manuel, A.; Mas-Soler, J.; Vittori, F.; Pires, O.; Azcona, J.; Souto-Iglesias, A.; Guedes Soares, C. Experimental Analysis of CENTEC-TLP Self-Stable Platform with a 10 MW Turbine. Journal of Marine Science and Engineering 2022, 10, 1910. [Google Scholar] [CrossRef]
- Bonnefoy, F.; Leroy, V.; Mojallizadeh, M.; Delacroix, S.; Arnal, V.; Gilloteaux, J.C. Multidimensional Hybrid Software-in-the-Loop Modeling Approach for Experimental Analysis of a Floating Offshore Wind Turbine in Wave Tank Experiments. Ocean Engineering 2024, 309, 118390. [Google Scholar] [CrossRef]
- Sauder, T.; Marelli, S.; Sørensen, A.J. Probabilistic Robust Design of Control Systems for High-Fidelity Cyber-Physical Testing. Automatica 2019, 101, 111–119. [Google Scholar] [CrossRef]
- Sauder, T.; Marelli, S.; Larsen, K.; Sørensen, A.J. Active Truncation of Slender Marine Structures: Influence of the Control System on Fidelity. Applied Ocean Research 2018, 74, 154–169. [Google Scholar] [CrossRef]
- Sauder, T.; Alterskjær, S.A. Hydrodynamic Testing of Wind-Assisted Cargo Ships Using a Cyber–Physical Method. Ocean Engineering 2022, 243, 110206. [Google Scholar] [CrossRef]
- Sauder, T. Empirical Estimation of Low-Frequency Nonlinear Hydrodynamic Loads on Moored Structures. Applied Ocean Research 2021, 117, 102895. [Google Scholar] [CrossRef]
- Ueland, E.; Sauder, T.; Skjetne, R. Force Tracking Using Actuated Winches with Position-controlled Motors for Use in Hydrodynamical Model Testing. IEEE Access 2021. [Google Scholar] [CrossRef]
- Fossen, T.I. Handbook of Marine Craft Hydrodynamics and Motion Control; John Wiley & Sons, Ltd, 2011.
- Bachynski, E.E.; Chabaud, V.; Sauder, T. Real-Time Hybrid Model Testing of Floating Wind Turbines: Sensitivity to Limited Actuation. Energy Procedia 2015, 80, 2–12. [Google Scholar] [CrossRef]
- Ben-Israel, A.; Cohen, D. On Iterative Computation of Generalized Inverses and Associated Projections. SIAM Journal on Numerical Analysis 1966, 3, 410–419. [Google Scholar] [CrossRef]
- Ueland, E.; Sauder, T.; Skjetne, R. Optimal Actuator Placement for Real-Time Hybrid Model Testing Using Cable-Driven Parallel Robots. Journal of Marine Science and Engineering 2021, 9, 191. [Google Scholar] [CrossRef]
- Ueland, E.; Sauder, T.; Skjetne, R. Optimal Force Allocation for Overconstrained Cable-Driven Parallel Robots: Continuously Differentiable Solutions With Assessment of Computational Efficiency. IEEE Transactions on Robotics, 2020; 1–8. [Google Scholar] [CrossRef]
- Vilsen, S.; Sauder, T.; Sørensen, A.J.; Føre, M. Method for Real-Time Hybrid Model Testing of Ocean Structures: Case Study on Horizontal Mooring Systems. Ocean Engineering 2019, 172, 46–58. [Google Scholar] [CrossRef]
- Vilsen, S.; Sauder, T.; Sørensen, A.J. Real-Time Hybrid Model Testing of Moored Floating Structures Using Nonlinear Finite Element Simulations. In Dynamics of Coupled Structures; Springer International Publishing, 2017; Vol. 4, Conference Proceedings of the Society for Experimental Mechanics Series, pp. 79–92.
Figure 1.
Generic control loop of cyber-physical testing.
Figure 1.
Generic control loop of cyber-physical testing.
Figure 2.
Power spectrum of the load applied: (a) FWT1 and (b) FWT2. - Low-frequency range. From top to bottom: surge, sway, roll, pitch, yaw.
Figure 2.
Power spectrum of the load applied: (a) FWT1 and (b) FWT2. - Low-frequency range. From top to bottom: surge, sway, roll, pitch, yaw.
Figure 3.
Power spectrum of the load - Wave-frequency range: (a) FWT1; (b) FWT2. Note that the scale on the y-axis is not the same across the plots.
Figure 3.
Power spectrum of the load - Wave-frequency range: (a) FWT1; (b) FWT2. Note that the scale on the y-axis is not the same across the plots.
Figure 4.
Power spectrum of the load - -frequency range: (a) FWT1; (b) FWT2.
Figure 4.
Power spectrum of the load - -frequency range: (a) FWT1; (b) FWT2.
Figure 5.
Power spectrum of the load - -frequency range: (a) FWT1; (b) FWT2.
Figure 5.
Power spectrum of the load - -frequency range: (a) FWT1; (b) FWT2.
Figure 6.
Overview over the requirements and benchmark tests.
Figure 6.
Overview over the requirements and benchmark tests.
Figure 7.
Chirp time series that consist of applying a constant amplitude load, centered on zero. First in surge, then in sway at the tower top, at an increasing frequency.
Figure 7.
Chirp time series that consist of applying a constant amplitude load, centered on zero. First in surge, then in sway at the tower top, at an increasing frequency.
Figure 8.
Bode diagrams of the estimated transfer function between commanded and measured force, (a) FWT1 and (b) FWT2, for each degree of freedom. The solid line is estimated from the benchmark chip test, and the dots represent the estimation during a wave and wind test under operating conditions. The latter is not displayed where the desired load was insignificant (as the ratio between measured and commanded would be singular).
Figure 9.
FWT2, Pitch decay test: (a) with CDRP connected; (b) CDPR disconnected.
Figure 9.
FWT2, Pitch decay test: (a) with CDRP connected; (b) CDPR disconnected.
Figure 10.
Motion power spectra (a) and time series (b) from tests with and without the CDPR connected - FWT1. Top: surge, mid: pitch, bottom: yaw.
Figure 10.
Motion power spectra (a) and time series (b) from tests with and without the CDPR connected - FWT1. Top: surge, mid: pitch, bottom: yaw.
Figure 11.
Mooring line tension (a) spectra and (b) time series from tests with and without the CDPR connected - FWT1.
Figure 11.
Mooring line tension (a) spectra and (b) time series from tests with and without the CDPR connected - FWT1.
Figure 12.
Tower base fore-aft bending moment: (a) Power spectrum; (b) time series from tests with and without the CDPR connected - FWT1.
Figure 12.
Tower base fore-aft bending moment: (a) Power spectrum; (b) time series from tests with and without the CDPR connected - FWT1.
Figure 13.
Close-up view of the fore-aft bending moment time series during a slamming event triggering tower vibrations - FWT1.
Figure 13.
Close-up view of the fore-aft bending moment time series during a slamming event triggering tower vibrations - FWT1.
Figure 14.
Top: nacelle acceleration power spectrum (a), and time series (b); close-up of the acceleration spectrum for various frequency ranges: (c) LF, (d) WF, (e) 3p and (f) 6p.
Figure 14.
Top: nacelle acceleration power spectrum (a), and time series (b); close-up of the acceleration spectrum for various frequency ranges: (c) LF, (d) WF, (e) 3p and (f) 6p.
Table 1.
Frequencies of interest [Hz, model scale] for the tested FWT.
Table 1.
Frequencies of interest [Hz, model scale] for the tested FWT.
| |
FWT1 |
FWT2 |
| Natural frequency - Surge |
0.148 |
0.105 |
| Natural frequency - Sway |
0.150 |
0.121 |
| Natural frequency - Heave |
0.469 |
0.472 |
| Natural frequency - Roll |
0.247 |
0.243 |
| Natural frequency - Pitch |
0.242 |
0.229 |
| Natural frequency - Yaw |
0.088 |
0.079 |
| Wave peak frequency () |
0.543 |
0.552 |
| Rotor frequency
|
0.80 |
0.90 |
| Blade passing frequency
|
2.39 |
2.71 |
| Double passing frequency
|
4.79 |
5.41 |
| Natural frequency tower (wet) - fore-aft |
5.65 |
2.15 |
| Natural frequency tower (wet) - side-side |
4.11 |
2.15 |
Table 2.
Frequency ranges and reference to figures. F-A stands for fore-aft, and S-S stands for side-side.
Table 2.
Frequency ranges and reference to figures. F-A stands for fore-aft, and S-S stands for side-side.
|
Disclaimer/Publisher’s Note: The statements, opinions and data contained in all publications are solely those of the individual author(s) and contributor(s) and not of MDPI and/or the editor(s). MDPI and/or the editor(s) disclaim responsibility for any injury to people or property resulting from any ideas, methods, instructions or products referred to in the content. |
© 2024 by the authors. Licensee MDPI, Basel, Switzerland. This article is an open access article distributed under the terms and conditions of the Creative Commons Attribution (CC BY) license (http://creativecommons.org/licenses/by/4.0/).
