Submitted:
03 October 2024
Posted:
04 October 2024
Read the latest preprint version here
Abstract
Keywords:
1. Introduction
- RQ1:
- How to make TBPA software more adaptable to process changes?
- RQ2:
- How to reduce the dependence on practitioners to elicit requirements for TBPA software?
2. Background and Related Works
2.1. Traditional Business Process Automation Software
2.2. Process Variability
2.3. Practitioner Unavailability
2.4. Process Mining
2.5. Logger
2.6. Web Scraping
3. Proposed Approach
3.1. Approach Overview
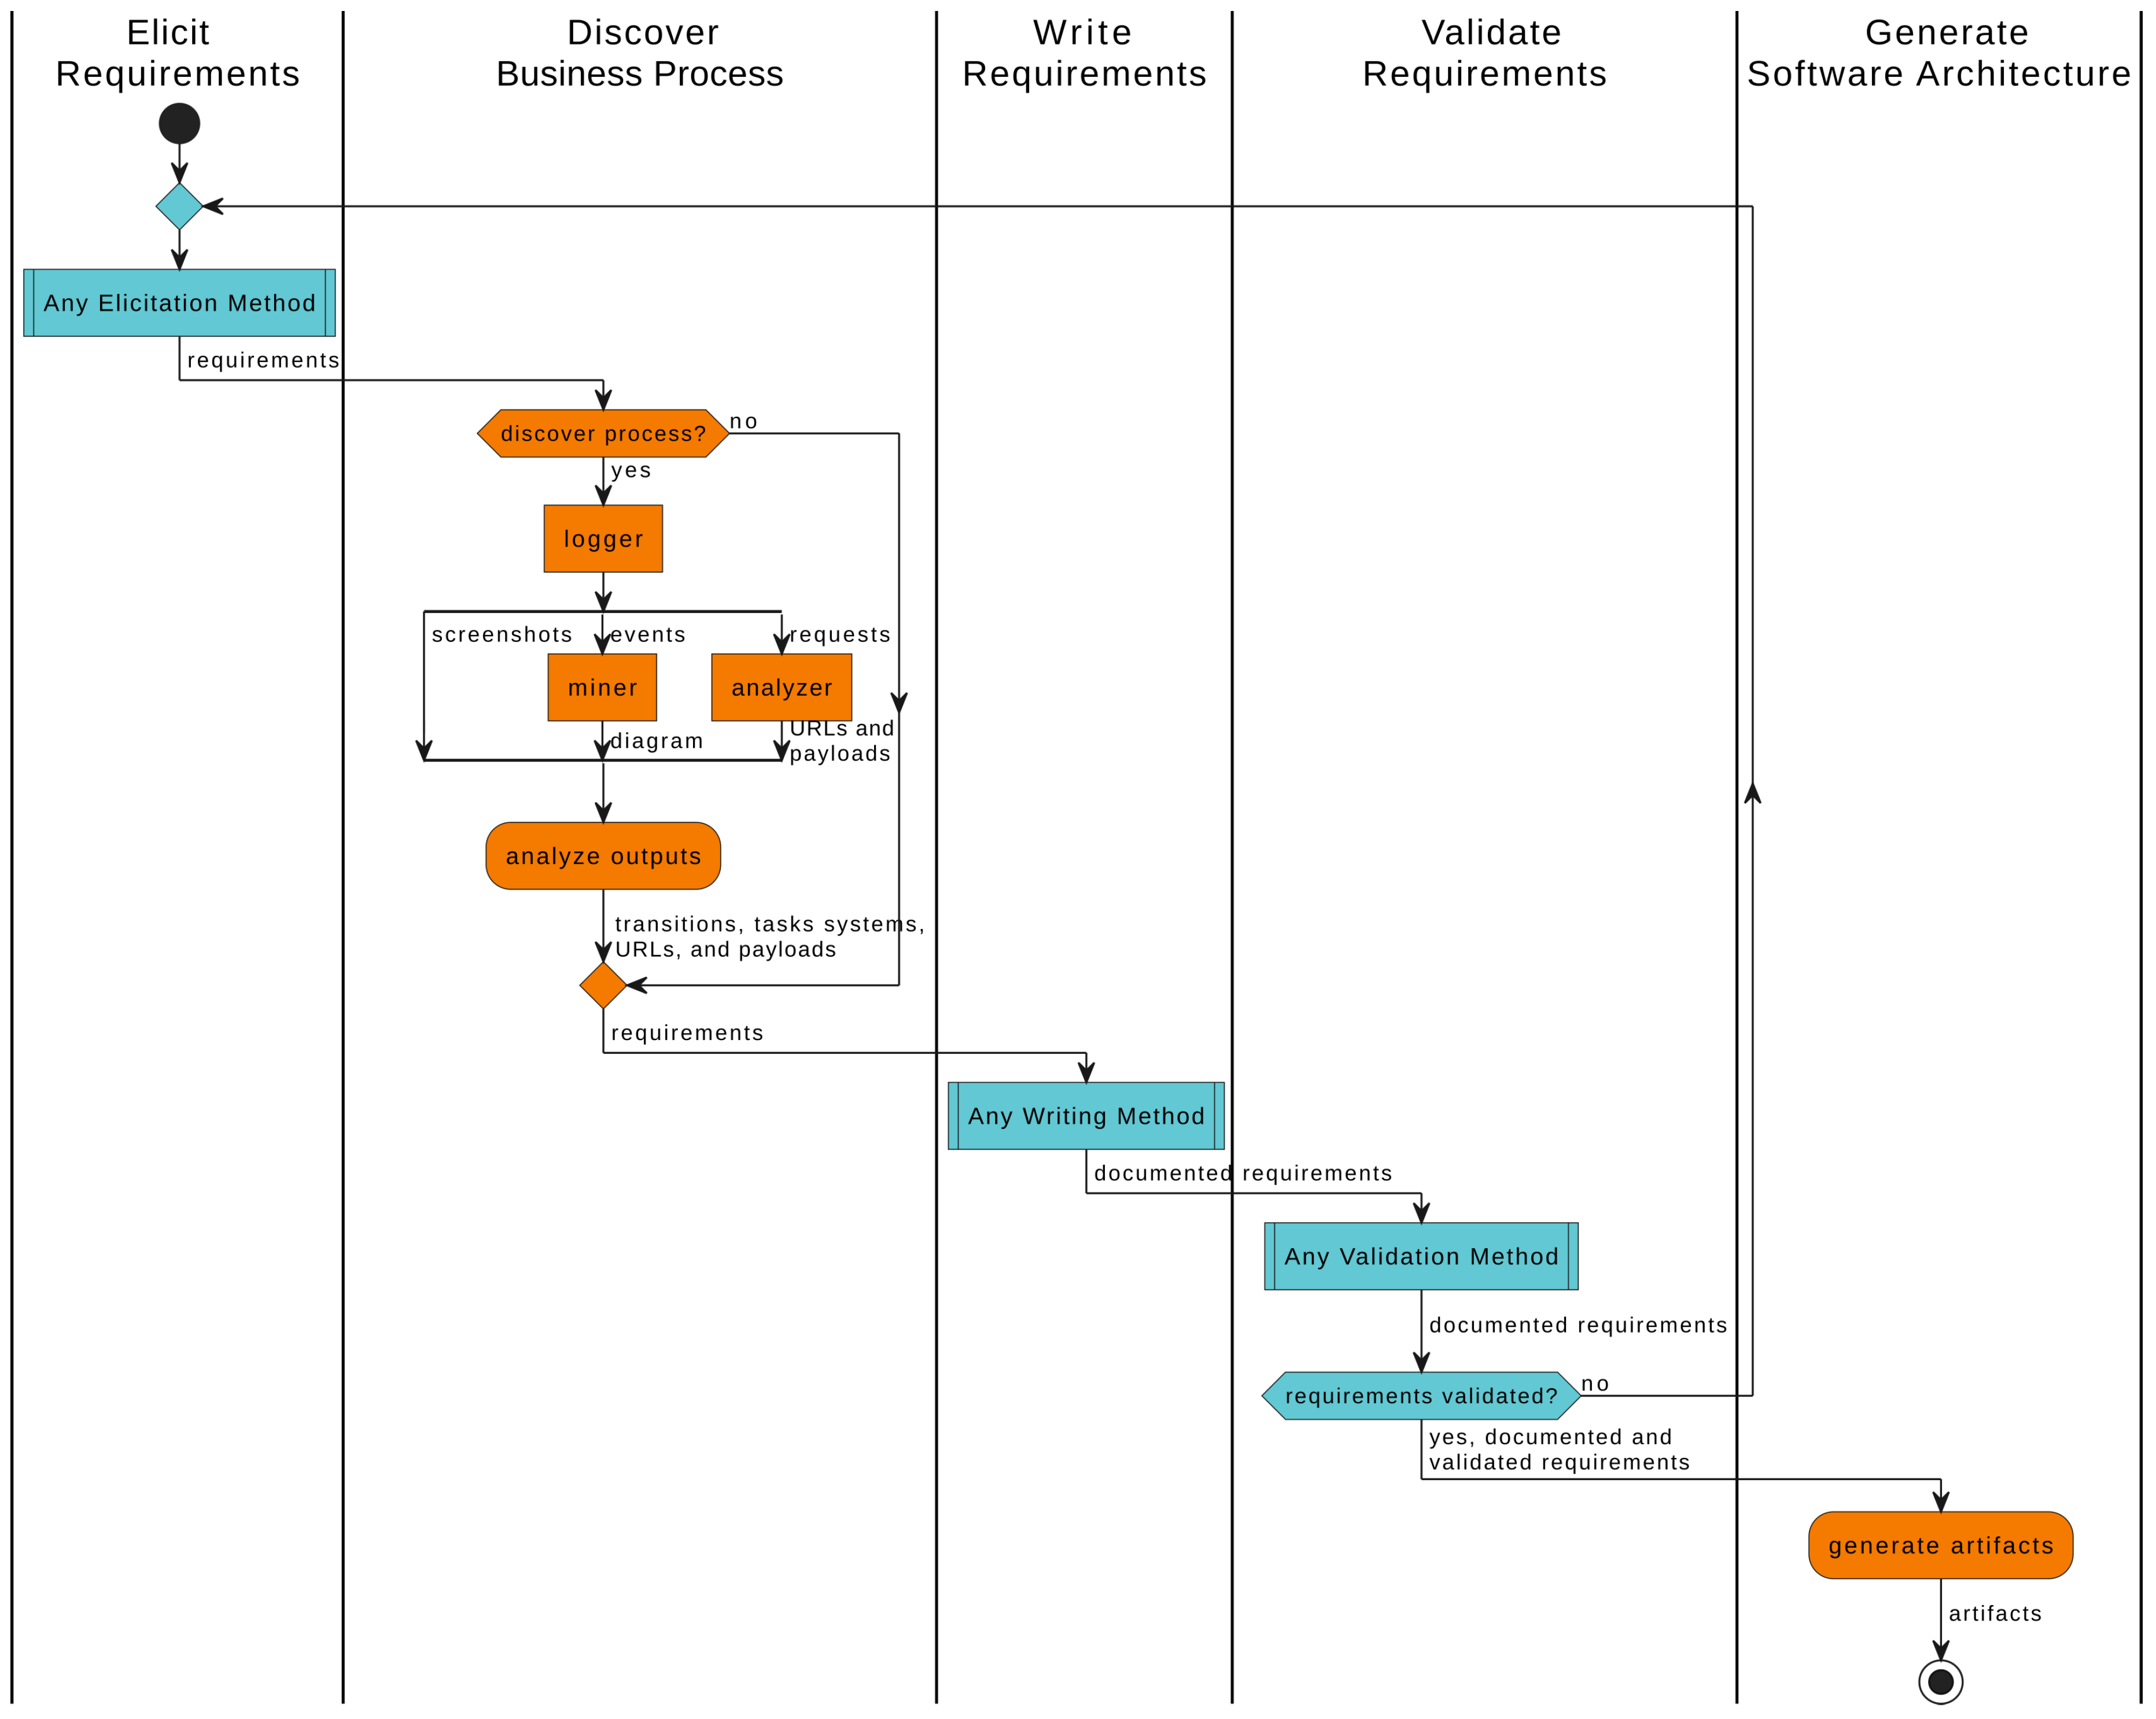
3.1.1. Elicit Requirements
3.1.2. Discover Business Process
3.1.3. Write Requirements
3.1.4. Validate Requirements
3.1.5. Generate Software Architecture
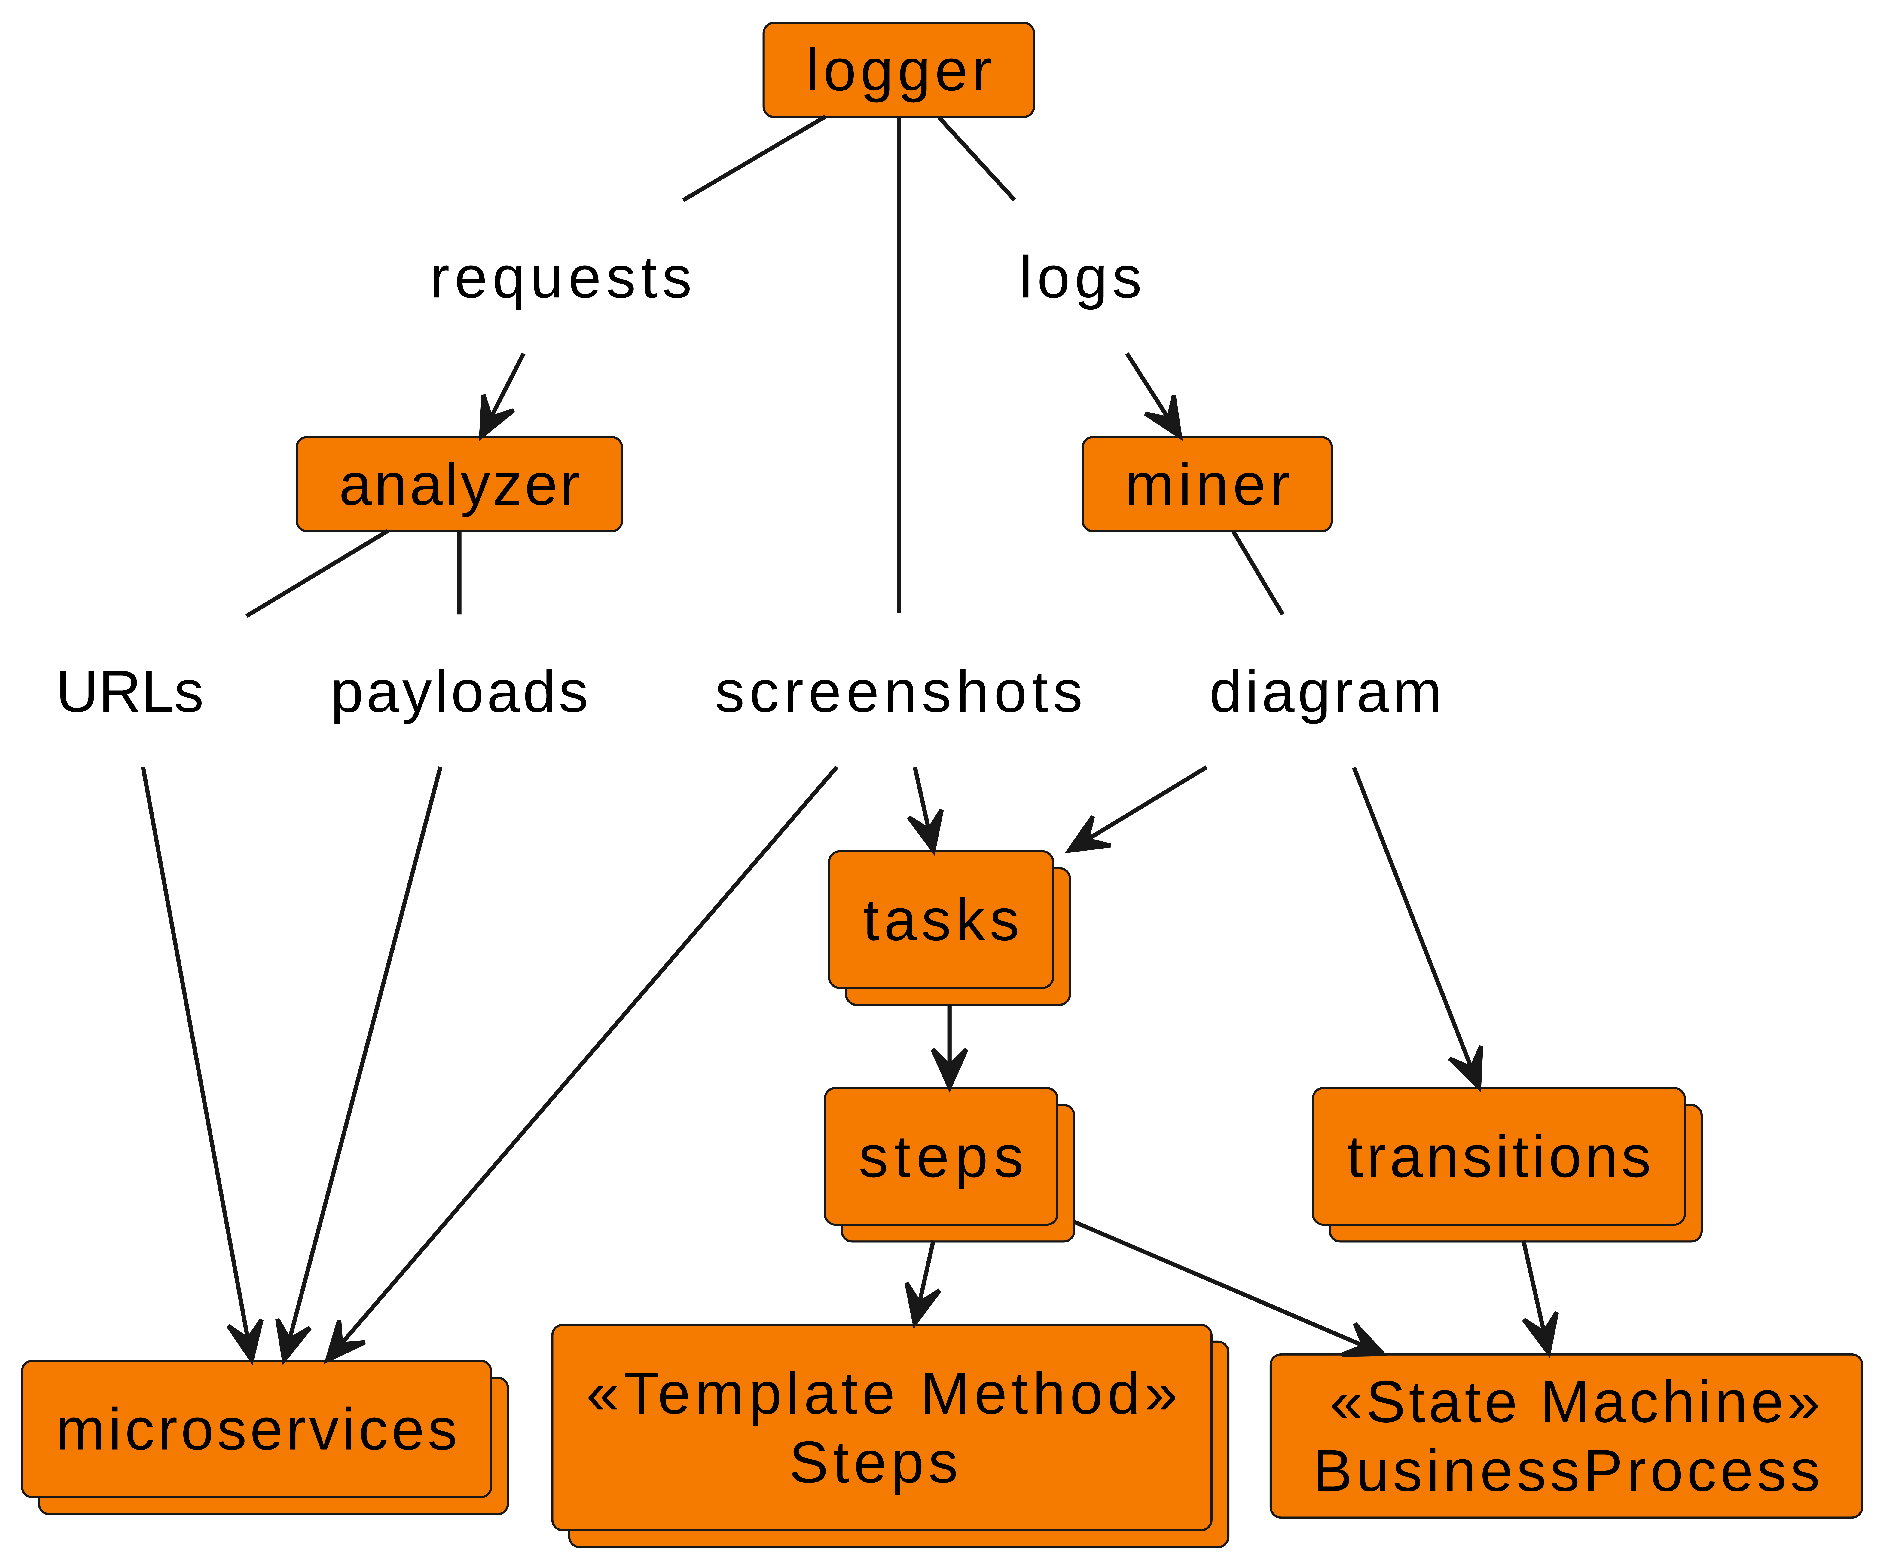
3.2. Logger
3.3. Process Miner
3.4. HTTP Request Analyzer
3.5. Business Process Discovery
3.6. Software Architecture Generation
- Group related tasks into a step to reduce transitions;
- Implement each step utilizing the template method pattern to create a class Step with a method for running its respective tasks;
- Model steps and transitions using a state machine to create the class BusinessProcess;
- Emulate system functionalities in specific microservices; in general, such emulation is implemented using web scraping techniques [31].
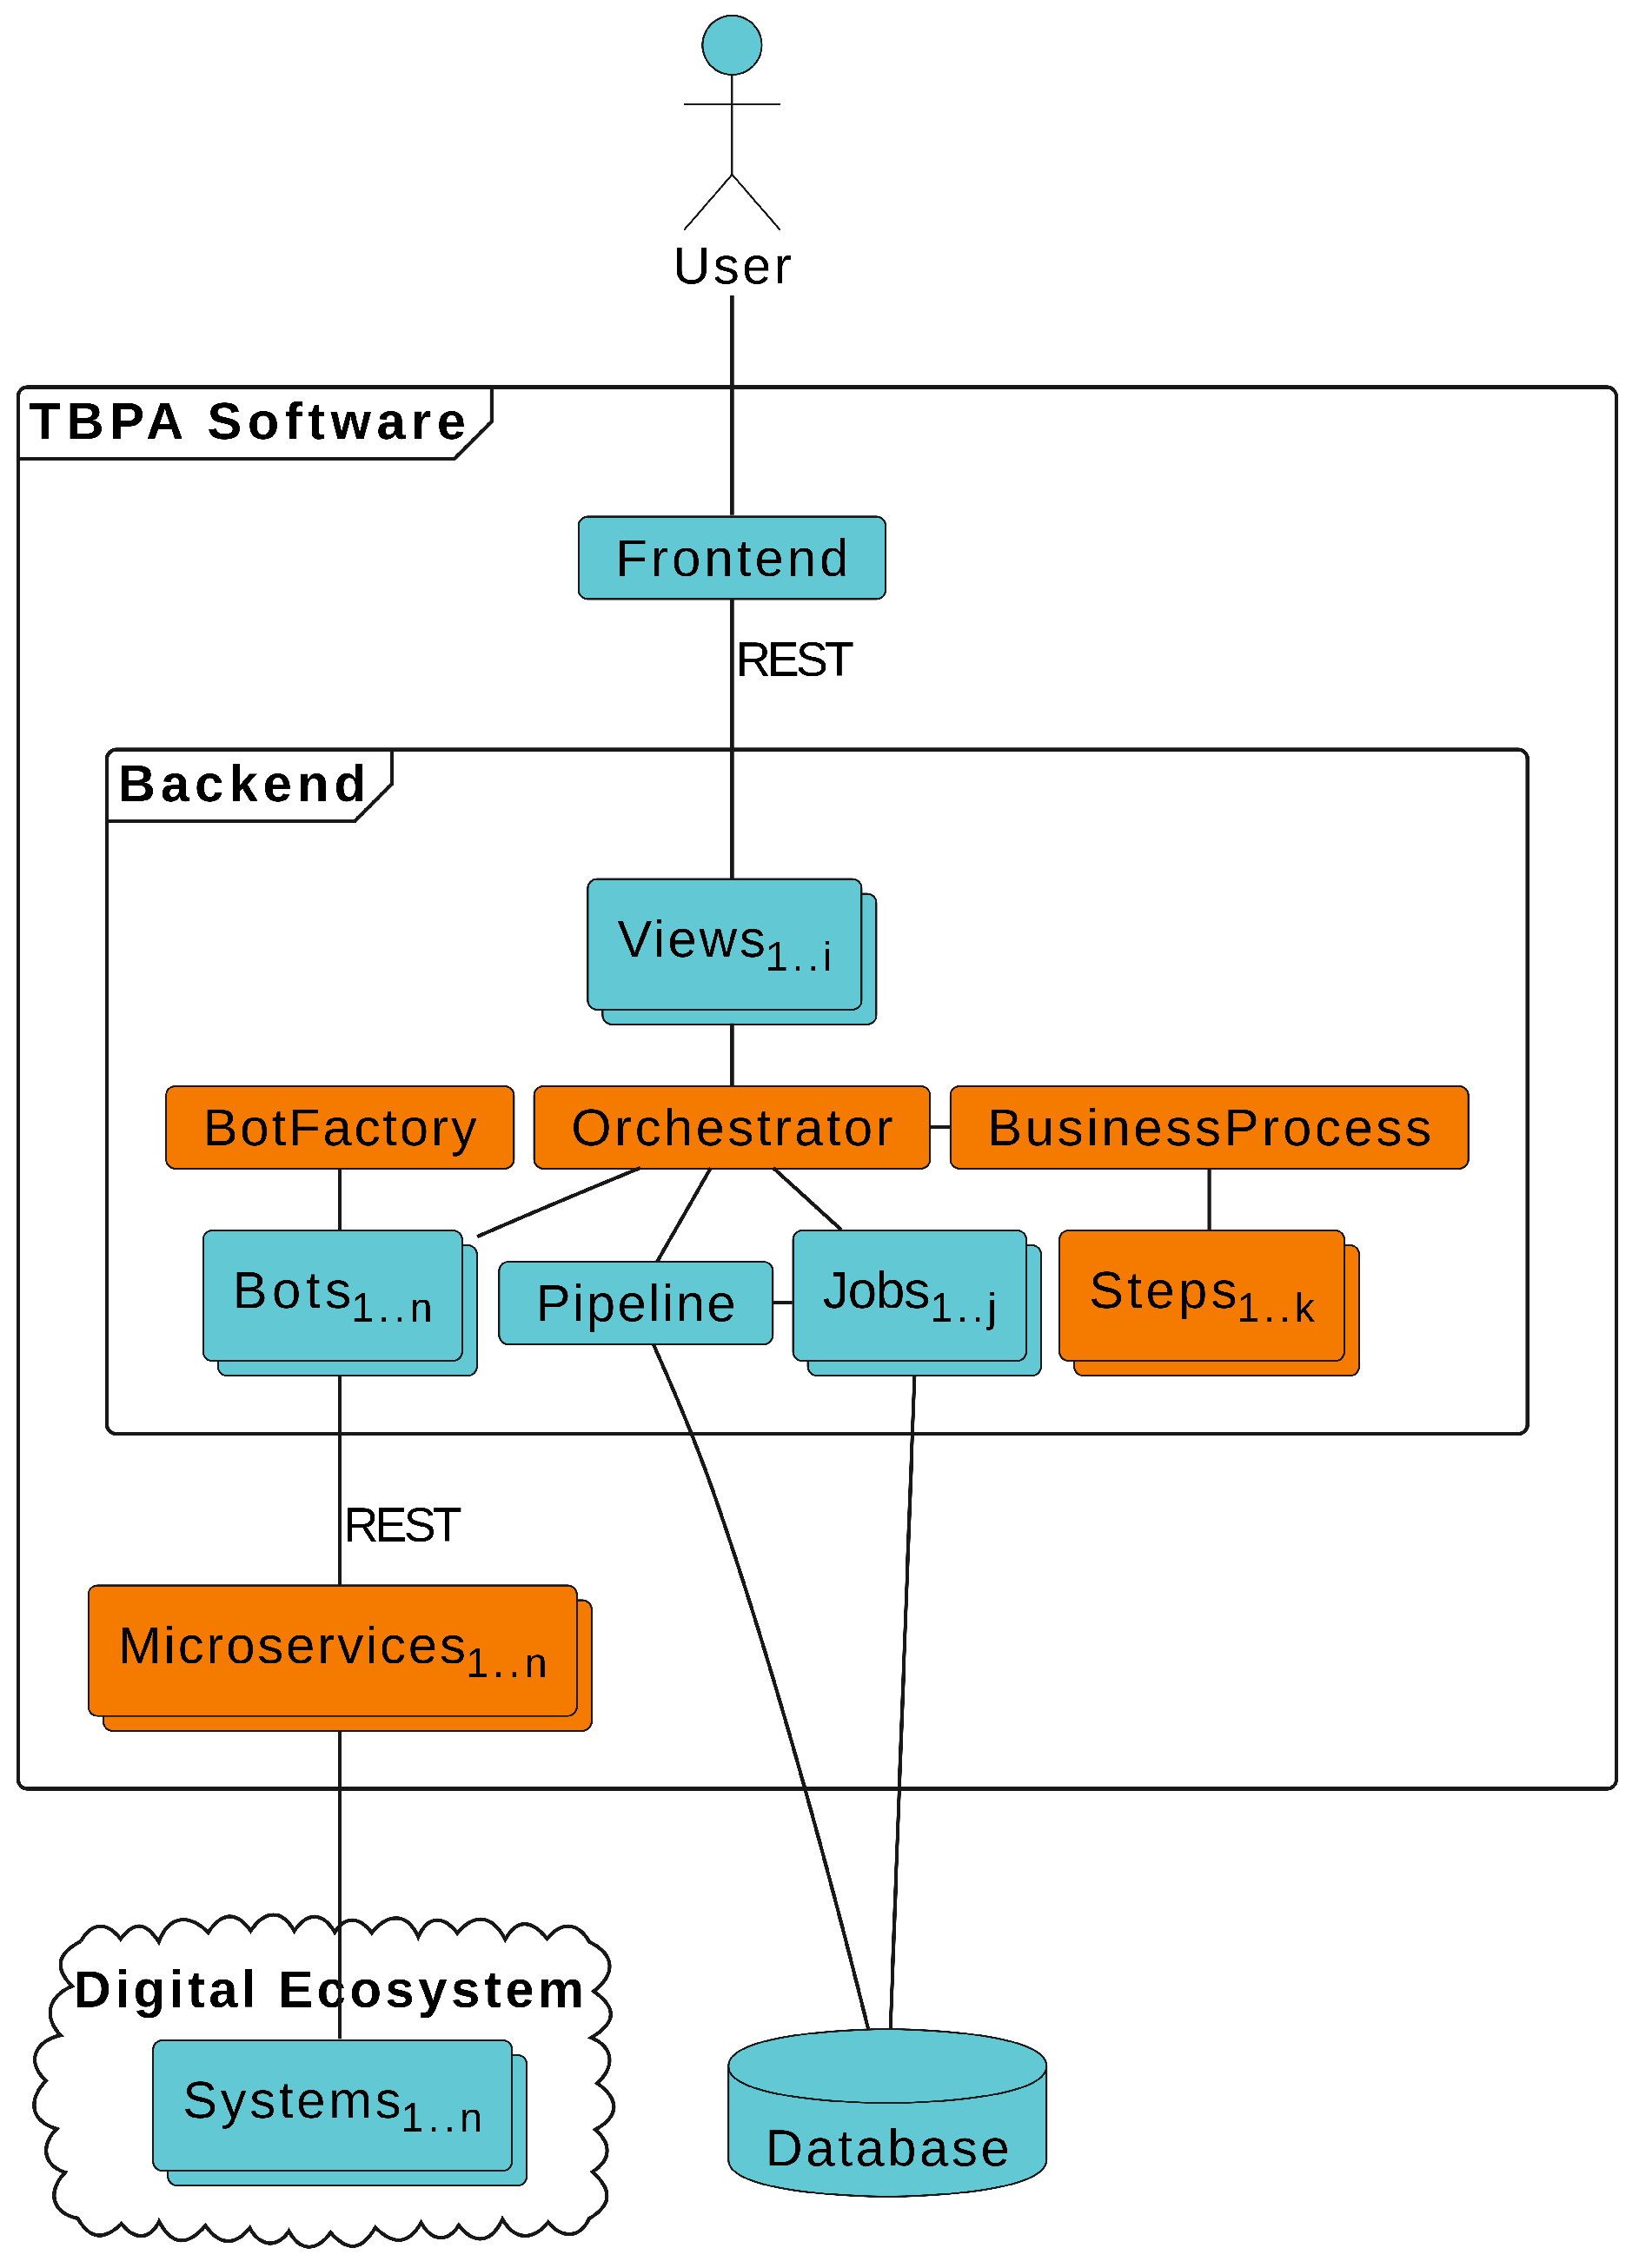
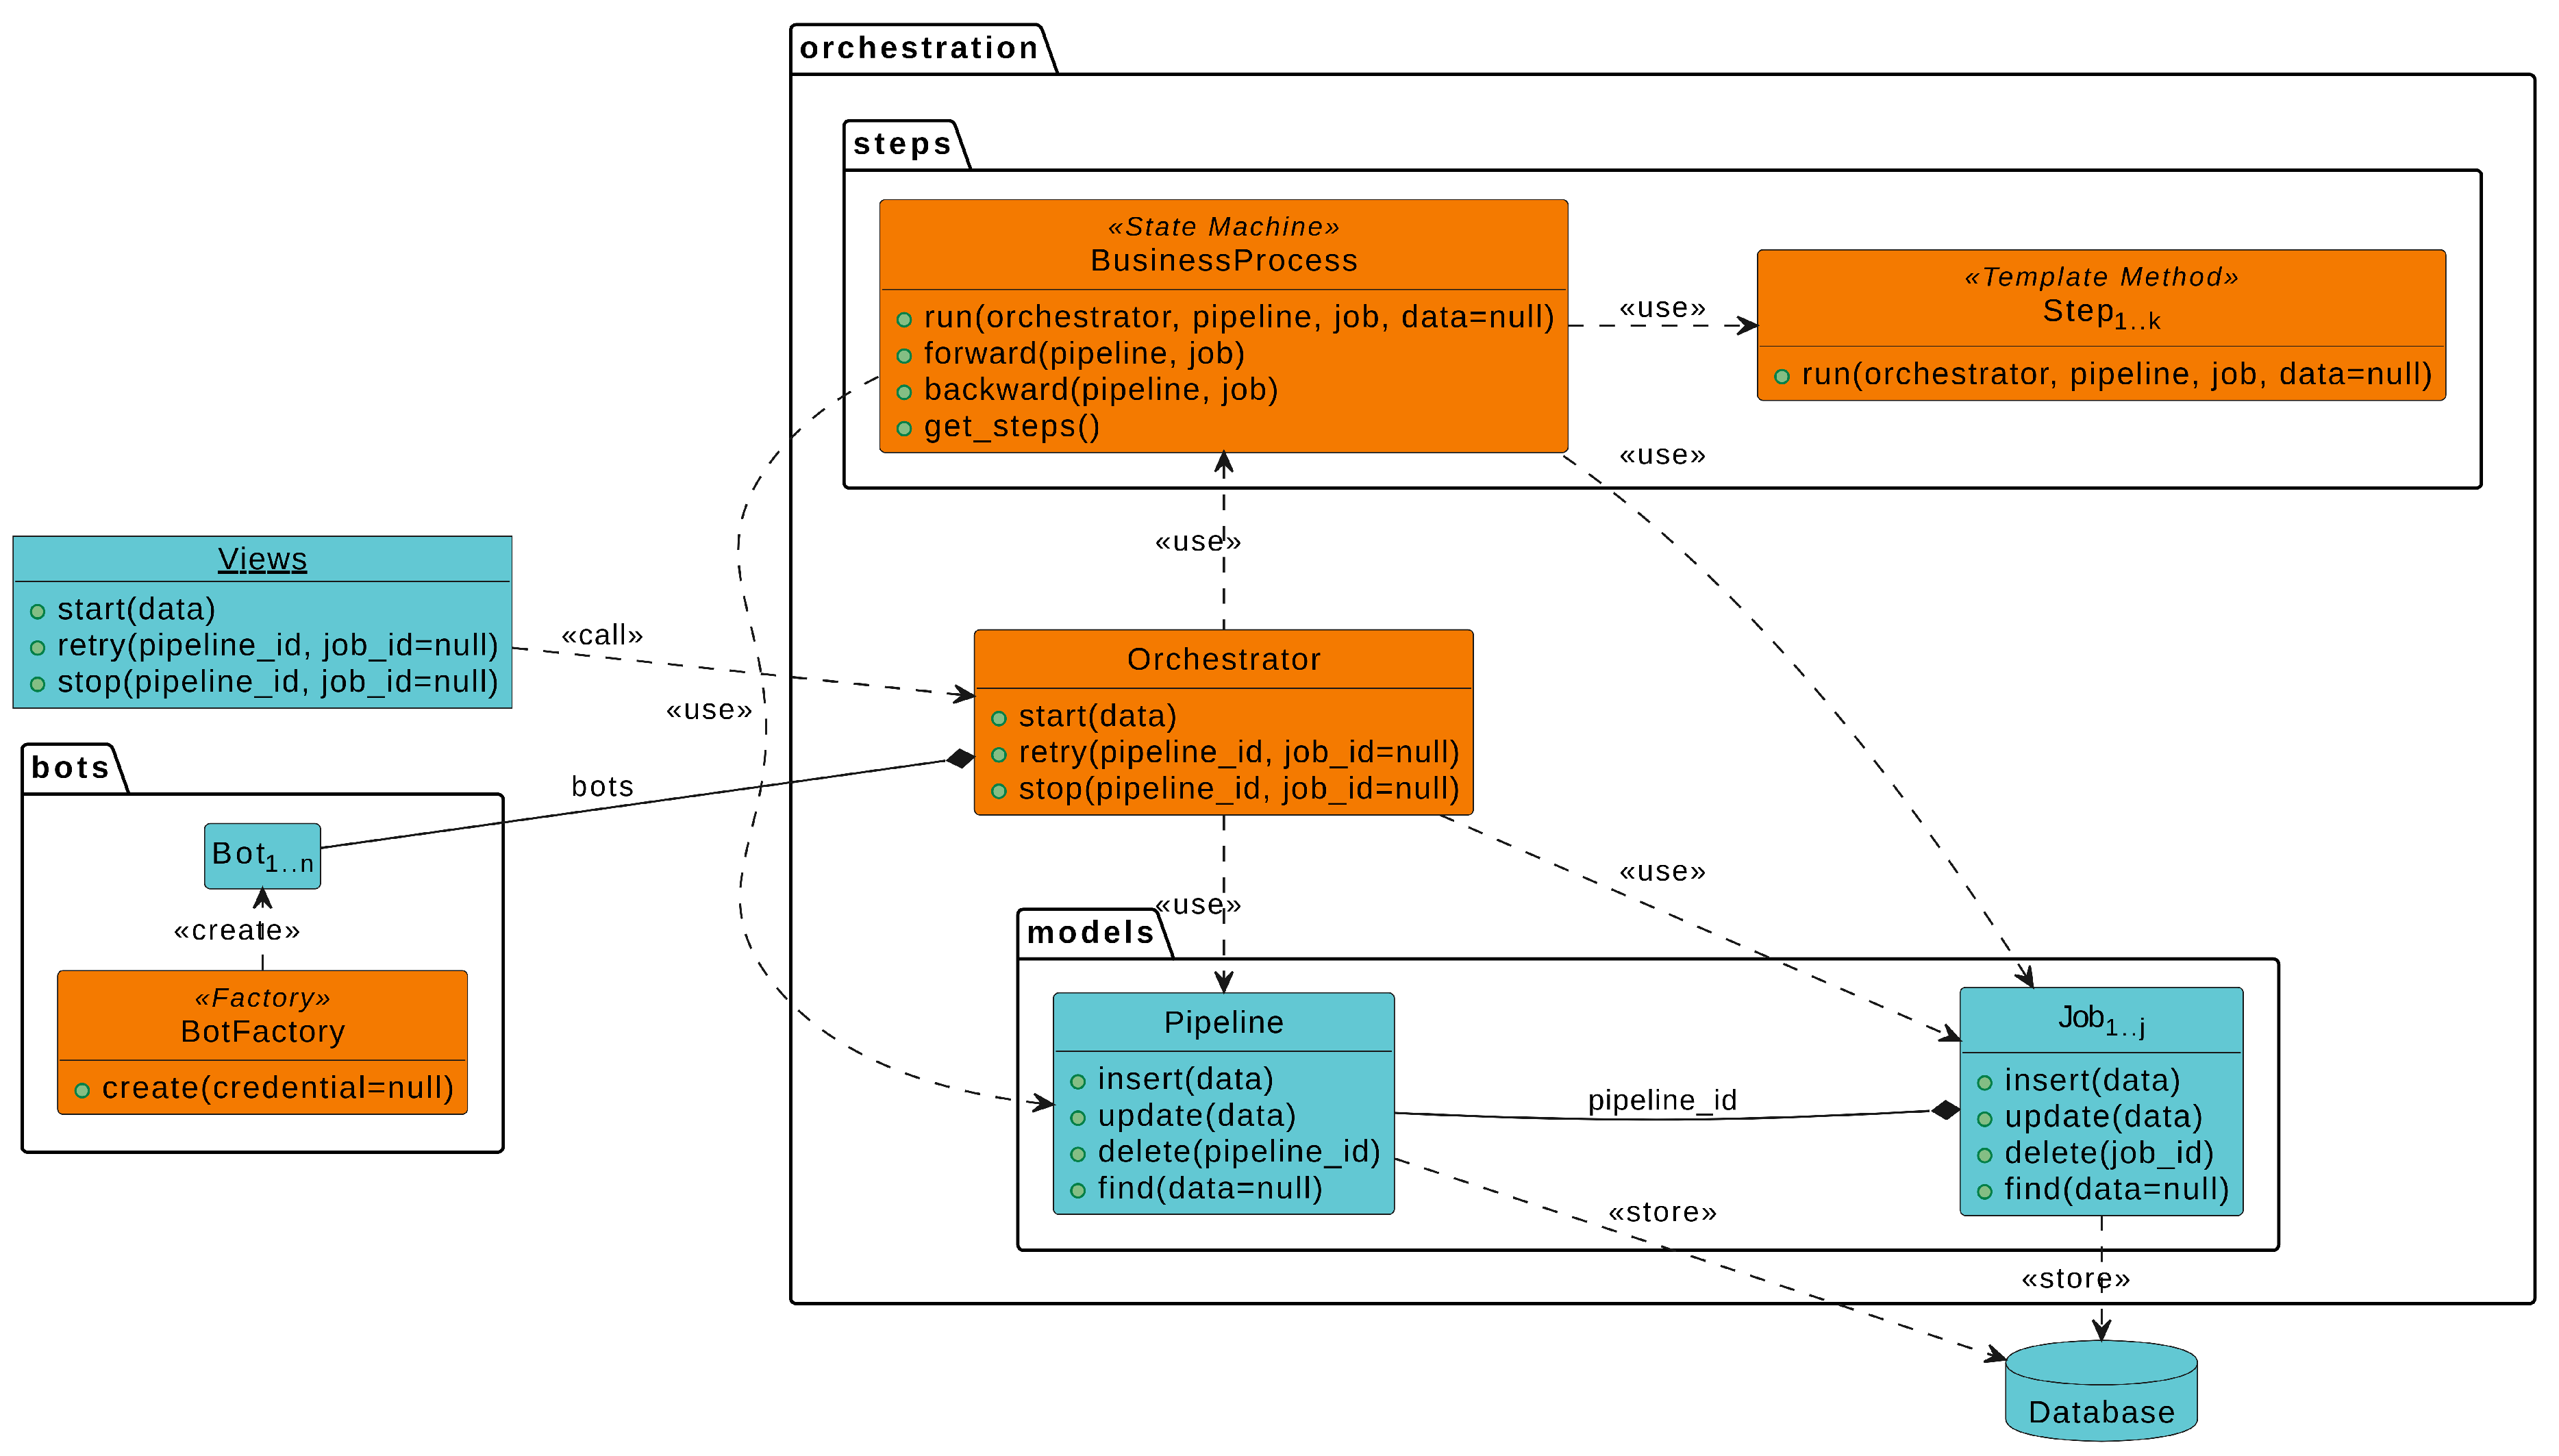
- Orchestrator centralizes and orchestrates the business process execution;
- BusinessProcess refers to a state machine that models the business process transitions;
- Step implements a template method to execute a set of related tasks that are associated with a specific process step;
- Pipeline stores general process data or information that is shared across all jobs;
- Job stores specific data about a particular process execution;
- BotFactory provides an interface for creating bots;
- Bot integrates the Orchestrator into a microservice;
- Microservice implements the necessary functionalities of a particular system.
- View associates a specific URL route to a method from the Orchestrator.
4. Case Study
4.1. Objectives and Hypotheses
-
For RQ1:
- H1:
- High traceability between business process requirements and software architecture improves the adaptability of TBPA software to process changes.
-
For RQ2:
- H1:
- Logs and process mining aid elicitors to discover the digital ecosystem technologies and the business process without assistance from practitioners;
- H2:
- Logs and process mining give an overview of the whole business process and the digital ecosystem that assists elicitors to elicit more precise and reliable requirements, which has the potential to reduce the reliance on practitioners;
4.2. The Case
4.3. Data and Metrics
-
Data related to H1, adaptability to process changes:
- -
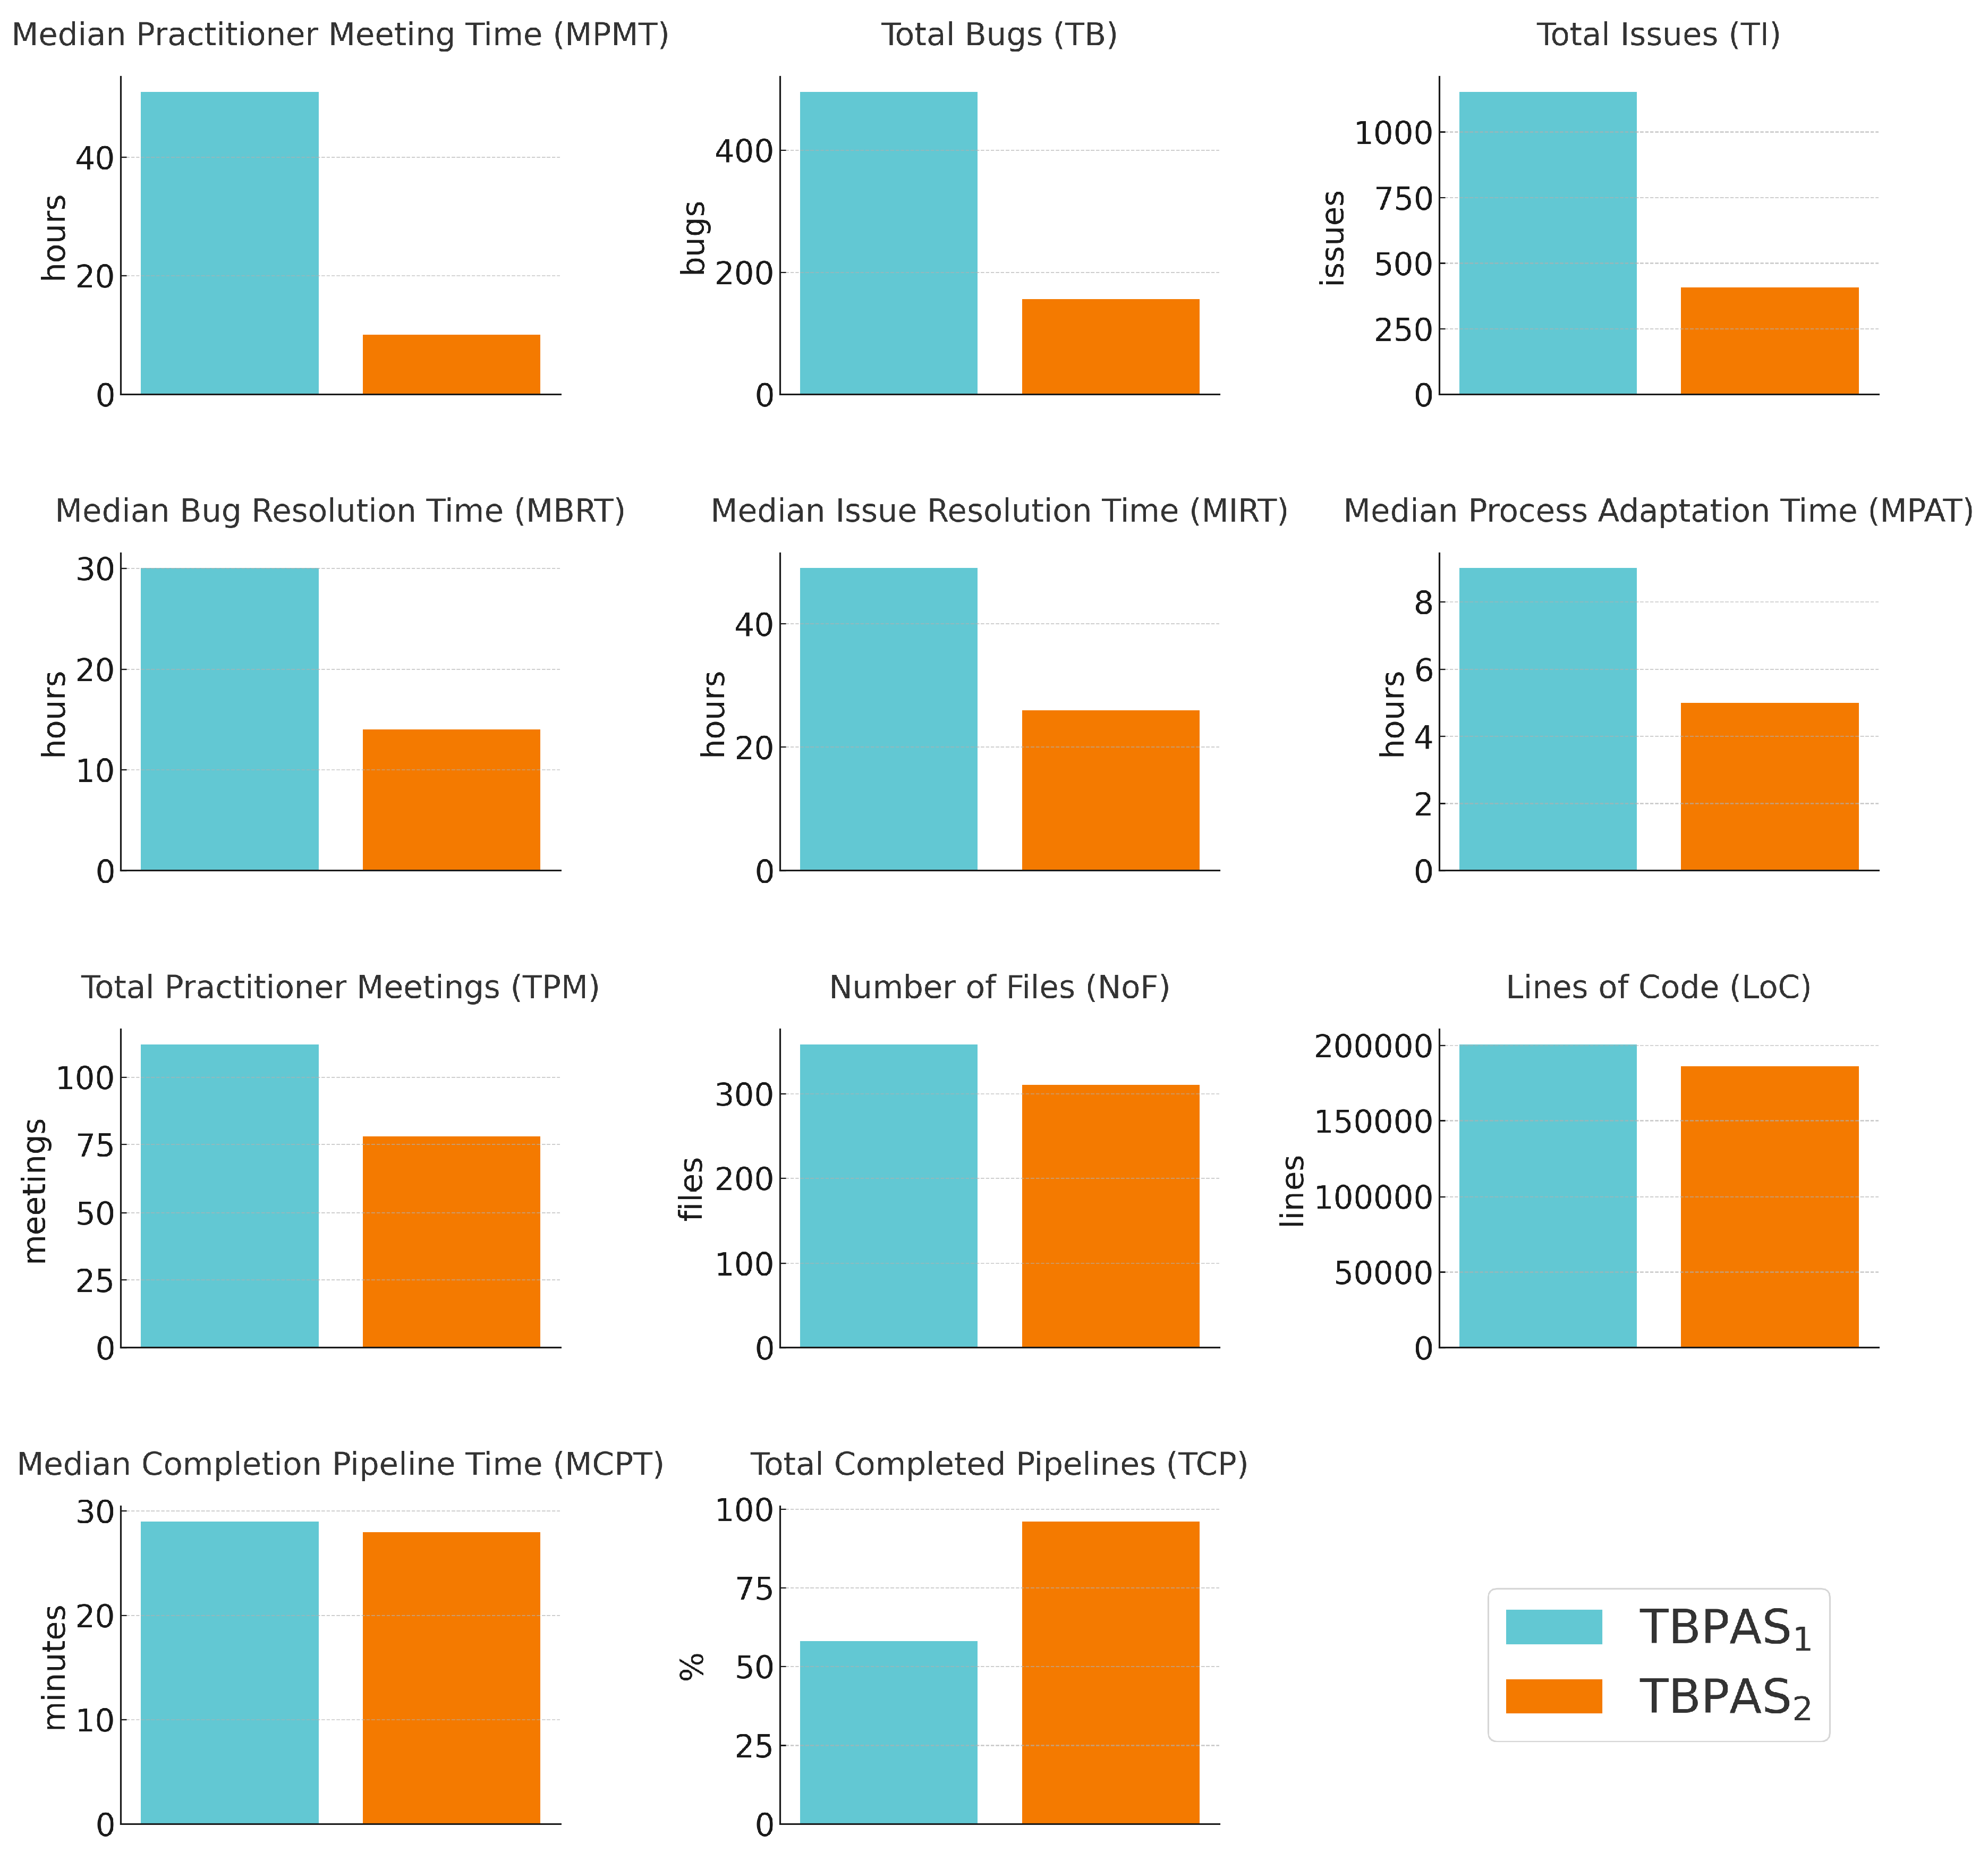
- Process Adaptation Time (PAT): time, in hours, taken to adapt the project when process changes [70];
-
Data related to H2 and H3, dependence on practitioners:
-
Data related to development efficiency:
- -
- Bug Resolution Time (BRT): time, in hours, taken to resolve a bug [70];
- -
- Issue Resolution Time (IRT): time, in hours, taken to complete an issue (bug, improvement, process change, practitioner meeting, task, or other) [70];
- -
- -
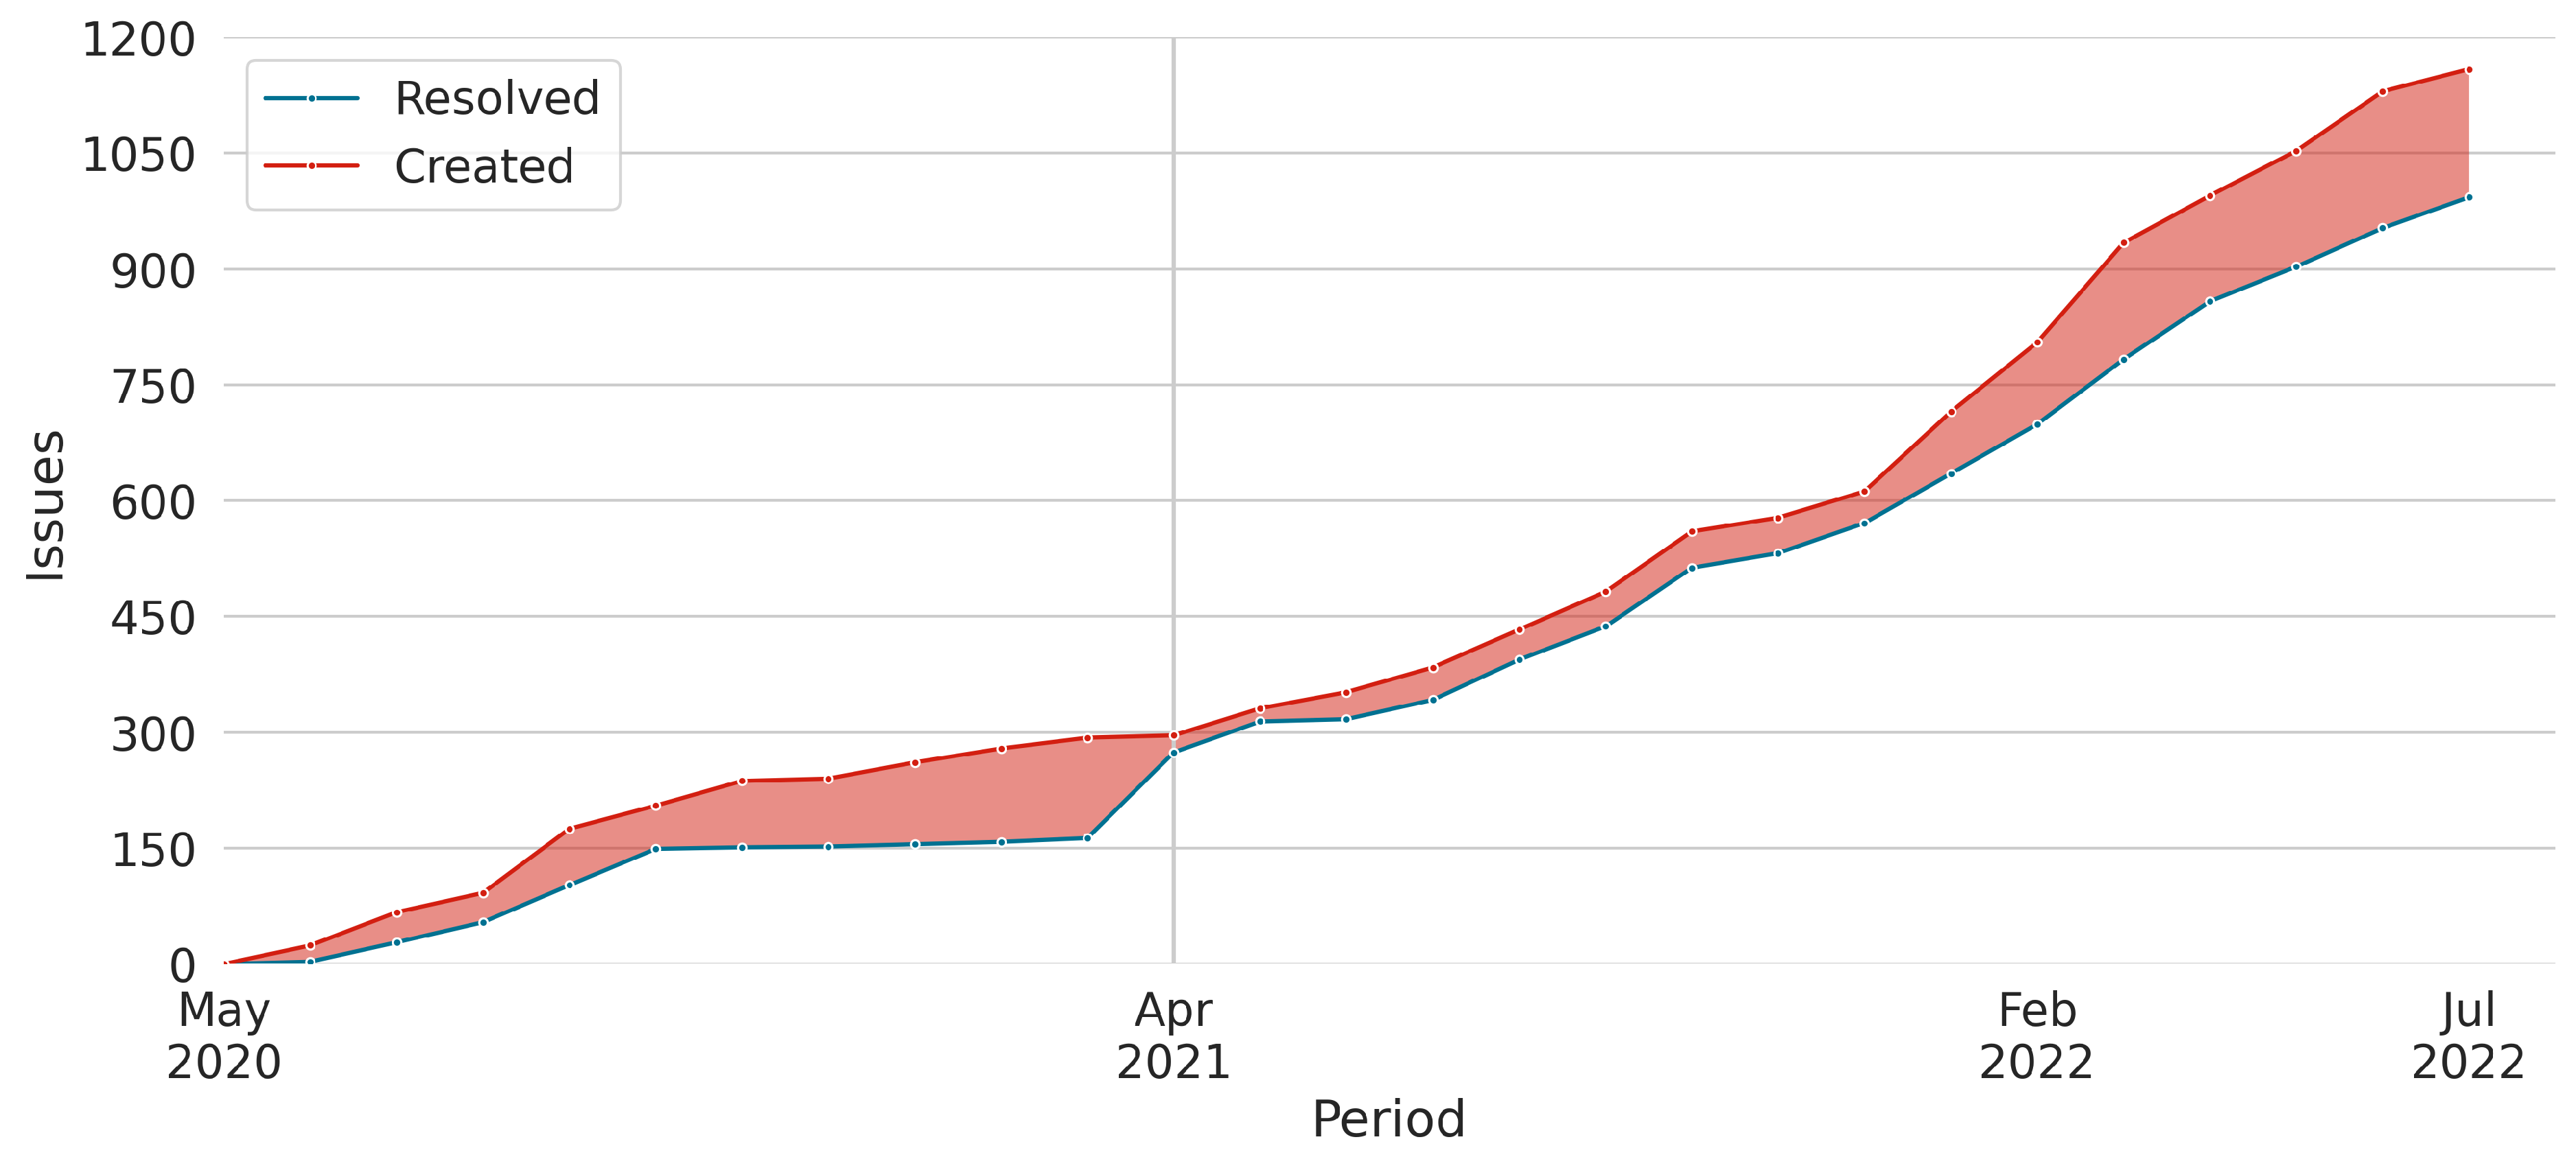
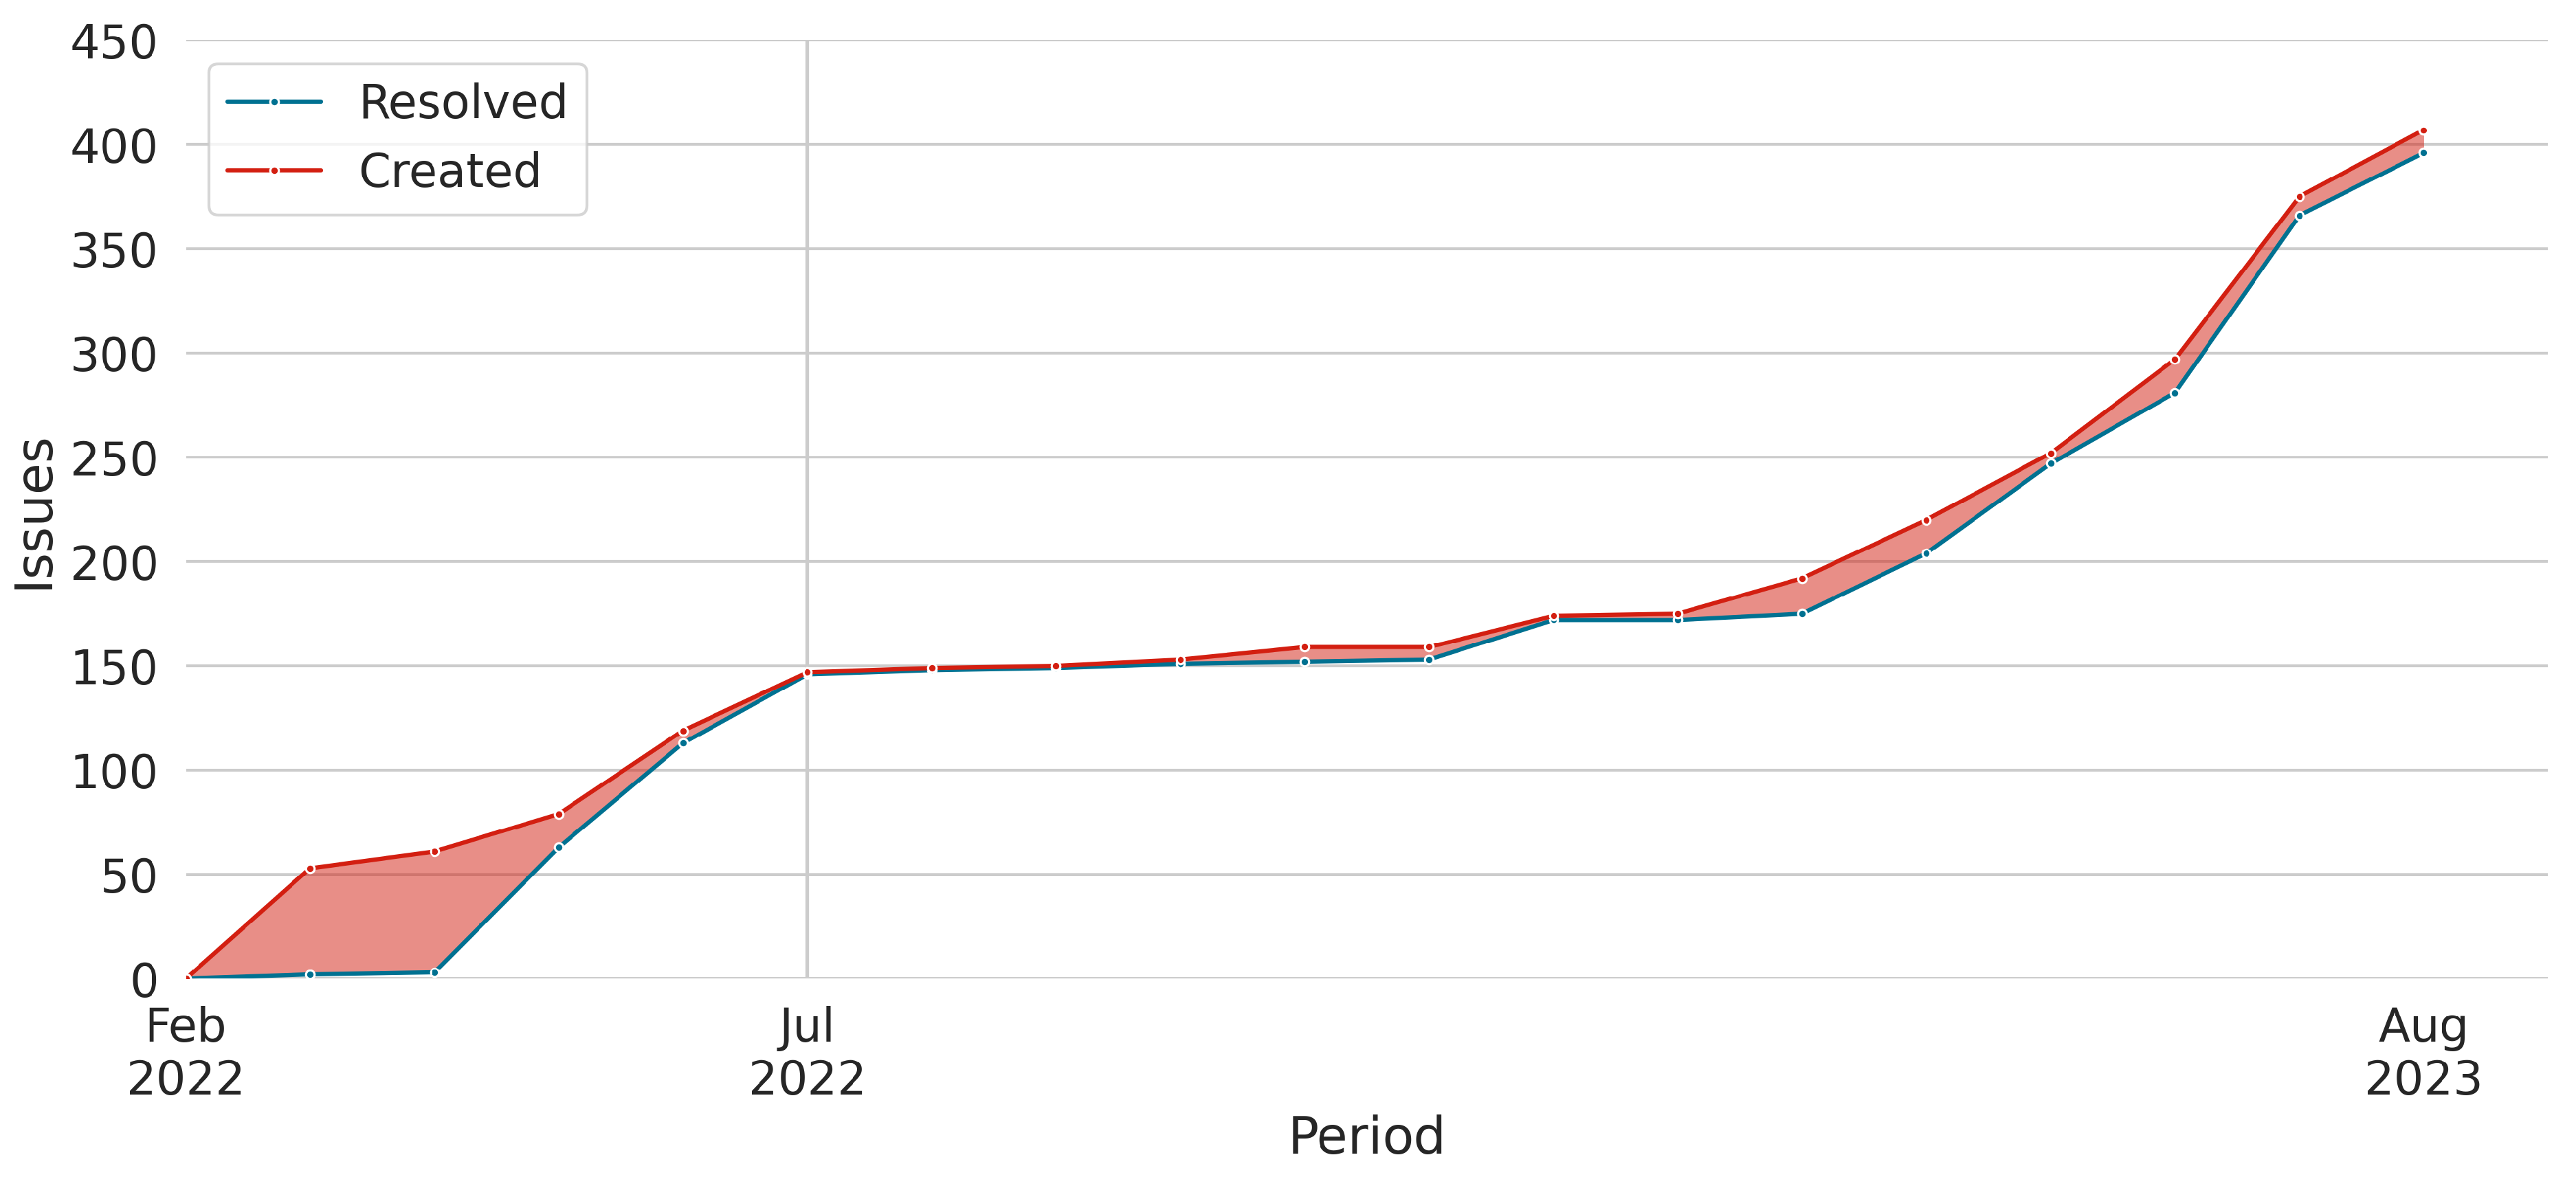
- Total Issues (TI): amount of all issues within the project (bugs, improvements, process changes, practitioner meetings, tasks, and others) [71].
-
Data related to BPA performance:
-
Data related to code size:
- -
- Number of Files (NoF): amount of files found within the project [73];
- -
4.4. Sister Project
4.5. Data Collection
-
For LoC:
- -
- find . -name "*.py" | xargs wc -l;
- -
- find . -name "*.ts" | xargs wc -l;
- -
- find . -name "*.html" | xargs wc -l;
- -
- find . -name "*.css" | xargs wc -l.
-
For NoF:
- -
- find . -type f | wc -l.
4.6. Results
4.7. Lessons Learned
4.8. Threats to Validity
4.9. Confidentiality and Compliance
5. Discussion
6. Conclusions
7. Future Works
Acknowledgments
References
- van der Aalst, W.M.; Bichler, M.; Heinzl, A. Robotic Process Automation. Business and Information Systems Engineering 2018, 60, 269–272. [Google Scholar] [CrossRef]
- Gartner Says Worldwide Spending on Robotic Process Automation Software to Reach $680 Million in 2018. https://www.gartner.com/en/newsroom/press-releases/2018-11-13-gartner-says-worldwide-spending-on-robotic-process-automation-software-to-reach-680-million-in-2018, 2018. Accessed at 2020-08-03.
- Lewicki, P.; Tochowicz, J.; van Genuchten, J. Are Robots Taking Our Jobs? A RoboPlatform at a Bank. IEEE Software 2019, 36, 101–104. [Google Scholar] [CrossRef]
- Barbosa, H.O.; Bonifácio, B.; Menezes, T.M.d.; Uebel, L.F.; Pires, F.B.; Neto, A.F. Uma Análise do Uso de Ferramentas em Desenvolvimento Distribuído de Software para Atualização da Plataforma Android. WWW/INTERNET 2019 2019, pp. 39–46.
- Axmann, B.; Harmoko, H. Robotic Process Automation: An Overview and Comparison to Other Technology in Industry 4.0. 2020 10th International Conference on Advanced Computer Information Technologies (ACIT), 2020, pp. 559–562. [CrossRef]
- Hofmann, P.; Samp, C.; Urbach, N. Robotic process automation. Electronic Markets 2020, 30, 99–106. [Google Scholar] [CrossRef]
- Gartner Forecasts Worldwide Hyperautomation-Enabling Software Market to Reach Nearly $600 Billion by 2022. https://www.gartner.com/en/newsroom/press-releases/2021-04-28-gartner-forecasts-worldwide-hyperautomation-enabling-software-market-to-reach-nearly-600-billion-by-2022, 2021. Accessed at 2022-03-01.
- de Menezes, T.M. User Experience Evaluation for Automation Tools: An Industrial Experience. International Journal on Cybernetics and Informatics 2022, 11, 53–60. [Google Scholar] [CrossRef]
- Menezes, T. A Review to Find Elicitation Methods for Business Process Automation Software. Software 2023, 2, 177–196. [Google Scholar] [CrossRef]
- Bornet, P.; Barkin, I.; Wirtz, J. INTELLIGENT AUTOMATION: Welcome to the World of HYPERAUTOMATION: Learn How to Harness Artificial Intelligence to Boost Business & Make Our World More Human; World Scientific, 2021.
- Gartner. Gartner Glossary. https://www.gartner.com/en/glossary, s.d. Accessed at 2022-02-08.
- Rathee, G.; Ahmad, F.; Iqbal, R.; Mukherjee, M. Cognitive automation for smart decision-making in industrial internet of things. IEEE Transactions on Industrial Informatics 2020, 17, 2152–2159. [Google Scholar] [CrossRef]
- Ip, F.; Crowley, J.; Torlone, T. Democratizing Artificial Intelligence with UiPath: Expand automation in your organization to achieve operational efficiency and high performance; Packt Publishing, 2022.
- Poosapati, V.; Manda, V.K.; Katneni, V. Cognitive Automation Opportunities, Challenges and Applications. Journal of Computer Engineering and Technology 2018, 9, 89–95. [Google Scholar]
- LASSO-RODRIGUEZ, G.; Winkler, K. Hyperautomation to fulfil jobs rather than executing tasks: the BPM manager robot vs human case. Romanian Journal of Information Technology & Automatic Control/Revista Română de Informatică și Automatică 2020, 30. [Google Scholar]
- Lucassen, G.; Dalpiaz, F.; Van Der Werf, J.M.; Brinkkemper, S. Bridging the Twin Peaks–The Case of the Software Industry. 2015 IEEE/ACM 5th International Workshop on the Twin Peaks of Requirements and Architecture. IEEE, 2015, pp. 24–28.
- Spijkman, T.; Brinkkemper, S.; Dalpiaz, F.; Hemmer, A.F.; van de Bospoort, R. Specification of requirements and software architecture for the customisation of enterprise software: A multi-case study based on the RE4SA model. 2019 IEEE 27th International Requirements Engineering Conference Workshops (REW). IEEE, 2019, pp. 64–73.
- Nordal, H.; El-Thalji, I. Modeling a predictive maintenance management architecture to meet industry 4.0 requirements: A case study. Systems Engineering 2021, 24, 34–50. [Google Scholar] [CrossRef]
- Parant, A.; Gellot, F.; Philippot, A.; Carré-Ménétrier, V. Model-based engineering for designing cyber-physical systems control architecture and improving adaptability from requirements. International Workshop on Service Orientation in Holonic and Multi-Agent Manufacturing. Springer, 2021, pp. 457–469.
- Gillani, M.; Niaz, H.A.; Ullah, A. Integration of Software Architecture in Requirements Elicitation for Rapid Software Development. IEEE Access 2022, 10, 56158–56178. [Google Scholar] [CrossRef]
- Ming, Z.; Nellippallil, A.B.; Wang, R.; Allen, J.K.; Wang, G.; Yan, Y.; Mistree, F. Requirements and architecture of the decision support platform for design engineering 4.0. In Architecting a Knowledge-Based Platform for Design Engineering 4.0; Springer, 2022; pp. 1–22.
- Zada, I.; Shahzad, S.; Ali, S.; Mehmood, R.M. OntoSuSD: Software engineering approaches integration ontology for sustainable software development. Software: Practice and Experience 2023, 53, 283–317. [Google Scholar] [CrossRef]
- Zada, I.; Shahzad, S.; Alatawi, M.N.; Ali, S.; Khan, J.A. LAGSSE: An Integrated Framework for the Realization of Sustainable Software Engineering 2023.
- Ghasemi, M. Towards Goal-Oriented Process Mining. 2018 IEEE 26th International Requirements Engineering Conference (RE), 2018, pp. 484–489. [CrossRef]
- Ghasemi, M. What Requirements Engineering can Learn from Process Mining. 2018 1st International Workshop on Learning from other Disciplines for Requirements Engineering (D4RE), 2018, pp. 8–11. [CrossRef]
- Saito, S. Identifying and Understanding Stakeholders using Process Mining: Case Study on Discovering Business Processes that Involve Organizational Entities. 2019 IEEE 27th International Requirements Engineering Conference Workshops (REW), 2019, pp. 216–219. [CrossRef]
- vom Brocke, J.; Jans, M.; Mendling, J.; Reijers, H.A. A five-level framework for research on process mining, 2021.
- Marin-Castro, H.M.; Tello-Leal, E. Event log preprocessing for process mining: a review. Applied Sciences 2021, 11, 10556. [Google Scholar] [CrossRef]
- Hernandez-Resendiz, J.D.; Tello-Leal, E.; Ramirez-Alcocer, U.M.; Macías-Hernández, B.A. Semi-Automated Approach for Building Event Logs for Process Mining from Relational Database. Applied Sciences 2022, 12, 10832. [Google Scholar] [CrossRef]
- Sousa, L.; Nascimento, J.; Souza, R.; Aragao, J.; Menezes, T.; Andrade, E. BTS-Validator: identificando Aplicações Potencialmente Prejudiciais embarcadas no Android por meio de relatórios. Anais da XX Escola Regional de Redes de Computadores; SBC: Porto Alegre, RS, Brasil, 2023; pp. 115–120. [Google Scholar] [CrossRef]
- Diouf, R.; Sarr, E.N.; Sall, O.; Birregah, B.; Bousso, M.; Mbaye, S.N. Web scraping: state-of-the-art and areas of application. 2019 IEEE International Conference on Big Data (Big Data). IEEE, 2019, pp. 6040–6042.
- Uskenbayeva, R.; Kalpeyeva, Z.; Satybaldiyeva, R.; Moldagulova, A.; Kassymova, A. Applying of RPA in Administrative Processes of Public Administration. 2019 IEEE 21st Conference on Business Informatics (CBI), 2019, Vol. 02, pp. 9–12. [CrossRef]
- Aguirre, S.; Rodriguez, A. Automation of a business process using robotic process automation (RPA): A case study. Communications in Computer and Information Science 2017, 742, 65–71. [Google Scholar] [CrossRef]
- Gupta, S.; Rani, S.; Dixit, A. Recent Trends in Automation-A study of RPA Development Tools. 2019 3rd International Conference on Recent Developments in Control, Automation Power Engineering (RDCAPE), 2019, pp. 159–163. [CrossRef]
- Huang, F.; Vasarhelyi, M.A. Applying robotic process automation (RPA) in auditing: A framework. International Journal of Accounting Information Systems 2019, 35, 100433. [Google Scholar] [CrossRef]
- Parchande, S.; Shahane, A.; Dhore, M. Contractual Employee Management System Using Machine Learning and Robotic Process Automation. 2019 5th International Conference On Computing, Communication, Control And Automation (ICCUBEA), 2019, pp. 1–5. [CrossRef]
- Ma, Y.; Lin, D.; Chen, S.; Chu, H.; Chen, J. System Design and Development for Robotic Process Automation. 2019 IEEE International Conference on Smart Cloud (SmartCloud), 2019, pp. 187–189. [CrossRef]
- Maalla, A. Development Prospect and Application Feasibility Analysis of Robotic Process Automation. 2019 IEEE 4th Advanced Information Technology, Electronic and Automation Control Conference (IAEAC), 2019, Vol. 1, pp. 2714–2717. [CrossRef]
- Ortiz, F.C.M.; Costa, C.J. RPA in Finance: supporting portfolio management : Applying a software robot in a portfolio optimization problem. 2020 15th Iberian Conference on Information Systems and Technologies (CISTI), 2020, pp. 1–6. [CrossRef]
- Syed, R.; Suriadi, S.; Adams, M.; Bandara, W.; Leemans, S.J.; Ouyang, C.; ter Hofstede, A.H.; van de Weerd, I.; Wynn, M.T.; Reijers, H.A. Robotic Process Automation: Contemporary themes and challenges. Computers in Industry 2020, 115, 103162. [Google Scholar] [CrossRef]
- Timbadia, D.H.; Jigishu Shah, P.; Sudhanvan, S.; Agrawal, S. Robotic Process Automation Through Advance Process Analysis Model. 2020 International Conference on Inventive Computation Technologies (ICICT), 2020, pp. 953–959. [CrossRef]
- Wewerka, J.; Reichert, M. Towards Quantifying the Effects of Robotic Process Automation. 2020 IEEE 24th International Enterprise Distributed Object Computing Workshop (EDOCW), 2020, pp. 11–19. [CrossRef]
- William, W.; William, L. Improving Corporate Secretary Productivity using Robotic Process Automation. 2019 International Conference on Technologies and Applications of Artificial Intelligence (TAAI), 2019, pp. 1–5. [CrossRef]
- Cardoso, E.C.S.; Almeida, J.P.A.; Guizzardi, G. Requirements engineering based on business process models: A case study. 2009 13th Enterprise Distributed Object Computing Conference Workshops. IEEE, 2009, pp. 320–327.
- Panayiotou, N.; Gayialis, S.P.; Evangelopoulos, N.P.; Katimertzoglou, P.K. A business process modeling-enabled requirements engineering framework for ERP implementation. Bus. Process. Manag. J. 2015, 21, 628–664. [Google Scholar] [CrossRef]
- Aysolmaz, B.; Leopold, H.; Reijers, H.; Demirörs, O. A semi-automated approach for generating natural language requirements documents based on business process models. Inf. Softw. Technol. 2018, 93, 14–29. [Google Scholar] [CrossRef]
- Abbas, M.; Ferrari, A.; Shatnawi, A.; Enoiu, E.P.; Saadatmand, M. Is requirements similarity a good proxy for software similarity? an empirical investigation in industry. Requirements Engineering: Foundation for Software Quality: 27th International Working Conference, REFSQ 2021, Essen, Germany, April 12–15, 2021, Proceedings 27. Springer, 2021, pp. 3–18.
- Belfadel, A.; Laval, J.; Bonner Cherifi, C.; Moalla, N. Requirements engineering and enterprise architecture-based software discovery and reuse. Innovations in Systems and Software Engineering 2022, pp. 1–22.
- Scheer, A.W. ARIS—business process modeling; Springer Science & Business Media, 2000.
- Process Mining Manifesto. https://www.tf-pm.org/upload/1580738212409.pdf, 2012. Accessed at 2021-01-22.
- Berti, A.; van Zelst, S.; Schuster, D. PM4Py: a process mining library for Python. Software Impacts 2023, 17, 100556. [Google Scholar] [CrossRef]
- van der Aalst, W.; Weijters, T.; Maruster, L. Workflow mining: discovering process models from event logs. IEEE Transactions on Knowledge and Data Engineering 2004, 16, 1128–1142. [Google Scholar] [CrossRef]
- Van Der Aalst, W.; Adriansyah, A.; De Medeiros, A.K.A.; Arcieri, F.; Baier, T.; Blickle, T.; Bose, J.C.; Van Den Brand, P.; Brandtjen, R.; Buijs, J.; others. Process mining manifesto. Business Process Management Workshops: BPM 2011 International Workshops, Clermont-Ferrand, France, August 29, 2011, Revised Selected Papers, Part I 9. Springer, 2012, pp. 169–194.
- van der Aalst, W. Data Science in Action; Springer Berlin Heidelberg: Berlin, Heidelberg, 2016; pp. 3–23. [Google Scholar] [CrossRef]
- Rozinat, A.; Aalst, W. Conformance checking of processes based on monitoring real behavior. Information Systems 2008, 33, 64–95. [Google Scholar] [CrossRef]
- Badhiye, S.S.; Chatur, P.; Wakode, B. Data logger system: A Survey. International Journal of Computer Technology and Electronics Engineering (IJCTEE) 2011, pp. 24–26.
- Mitchell, R. Web scraping with Python: Collecting more data from the modern web; " O’Reilly Media, Inc.", 2018.
- Khder, M.A. Web Scraping or Web Crawling: State of Art, Techniques, Approaches and Application. International Journal of Advances in Soft Computing & Its Applications 2021, 13. [Google Scholar]
- Awad, A.; Weidlich, M.; Sakr, S. Process Mining over Unordered Event Streams. 2020 2nd International Conference on Process Mining (ICPM), 2020, pp. 81–88. [CrossRef]
- Van Der Aalst, W.M. A practitioner’s guide to process mining: Limitations of the directly-follows graph, 2019.
- Megargel, A.; Poskitt, C.M.; Shankararaman, V. Microservices Orchestration vs. Choreography: A Decision Framework. 2021 IEEE 25th International Enterprise Distributed Object Computing Conference (EDOC), 2021, pp. 134–141. [CrossRef]
- Richards, M.; Ford, N. Fundamentals of software architecture: an engineering approach; O’Reilly Media, 2020.
- Gamma, E.; Helm, R.; Johnson, R.; Vlissides, J.M. Design Patterns: Elements of Reusable Object-Oriented Software; Addison-Wesley Professional, 1994.
- Kitchenham, B.; Pickard, L.; Pfleeger, S.L. Case studies for method and tool evaluation. IEEE software 1995, 12, 52–62. [Google Scholar] [CrossRef]
- Runeson, P.; Höst, M. Guidelines for conducting and reporting case study research in software engineering. Empirical software engineering 2009, 14, 131–164. [Google Scholar] [CrossRef]
- Yao, Q.; Zhang, J.; Wang, H. Business process-oriented software architecture for supporting business process change. 2008 International Symposium on Electronic Commerce and Security. IEEE, 2008, pp. 690–694.
- Jamshidi, P.; Pahl, C. Business process and software architecture model co-evolution patterns. 2012 4th International Workshop on Modeling in Software Engineering (MISE). IEEE, 2012, pp. 91–97.
- Pourmirza, S.; Peters, S.; Dijkman, R.; Grefen, P. A systematic literature review on the architecture of business process management systems. Information Systems 2017, 66, 43–58. [Google Scholar] [CrossRef]
- Kiblawi, T.; Muhanna, M.; Qusef, A. The Role of Software Architecture in Business Model Transformability. 2023 IEEE Jordan International Joint Conference on Electrical Engineering and Information Technology (JEEIT). IEEE, 2023, pp. 68–73.
- Silva, S.; Tuyishime, A.; Santilli, T.; Pelliccione, P.; Iovino, L. Quality Metrics in Software Architecture. 2023 IEEE 20th International Conference on Software Architecture (ICSA). IEEE, 2023, pp. 58–69.
- Diamantopoulos, T.; Saoulidis, N.; Symeonidis, A. Automated issue assignment using topic modelling on Jira issue tracking data. IET Software 2023. [Google Scholar] [CrossRef]
- Mo, R.; Wei, S.; Feng, Q.; Li, Z. An exploratory study of bug prediction at the method level. Information and software technology 2022, 144, 106794. [Google Scholar] [CrossRef]
- Herraiz, I.; Robles, G.; González-Barahona, J.M.; Capiluppi, A.; Ramil, J.F. Comparison between SLOCs and number of files as size metrics for software evolution analysis. Conference on Software Maintenance and Reengineering (CSMR’06). IEEE, 2006, pp. 8–pp.
- Bhatia, S.; Malhotra, J. A survey on impact of lines of code on software complexity. 2014 International Conference on Advances in Engineering & Technology Research (ICAETR-2014). IEEE, 2014, pp. 1–4.
- Wang, T.; Li, B. Analyzing software architecture evolvability based on multiple architectural attributes measurements. 2019 IEEE 19th International Conference on Software Quality, Reliability and Security (QRS). IEEE, 2019, pp. 204–215.

| Activity | UserID | DeviceID | ScreenshotID | PCAPID | Timestamp |
|---|---|---|---|---|---|
| PS - Sync Changes | 145 | 226 | 264877 | 289784 | 20230405T150132 |
| TBPAS1 | TBPAS2 | |||
|---|---|---|---|---|
| Metric | Unit | 01/05/2020 | 01/02/2022 | Result |
| 01/07/2022 | 17/08/2023 | |||
| Equation 1 | ||||
| Practitioner Meeting Time (PMT) | hours | 51 | 10 | 80% |
| Total Bugs (TB) | bugs | 495 | 156 | 68% |
| Total Issues (TI) | issues | 1153 | 407 | 65% |
| Bug Resolution Time (BRT) | hours | 30 | 14 | 53% |
| Issue Resolution Time (IRT) | hours | 49 | 26 | 47% |
| Process Adaptation Time (PAT) | hours | 9 | 5 | 44% |
| Total Practitioner Meetings (TPM) | meetings | 112 | 78 | 30% |
| Number of Files (NoF) | files | 358 | 310 | 13% |
| Lines of Code (LoC) | lines | 200379 | 185838 | 7% |
| Completion Pipeline Time (CPT) | minutes | 29 | 28 | 3% |
| Equation 2 | ||||
| Total Completed Pipelines (TCP) | % | 58 | 96 | 65% |
| Shapiro-Wilk | Mann-Whitney U | ||||
| Data | W | p | Statistic | p | |
| Issue Resolution Time (IRT) | 0.723 | <.001 | 131792 | <.001 | |
| Bug Resolution Time (BRT) | 0.837 | <.001 | 21421 | <.001 | |
| Process Adaptation Time (PAT) | 0.941 | <.001 | 1330 | <.001 | |
| Practitioner Meeting Time (PMT) | 0.877 | <.001 | 758 | <.001 | |
| Completion Pipeline Time (CPT) | 0.456 | <.001 | 48663 | 0.084 | |
| Software | IRT | BRT | PAT | PMT | CPT | |
| Sample size | TBPAS1 | 1153 | 495 | 183 | 112 | 516 |
| TBPAS2 | 407 | 156 | 97 | 78 | 202 | |
| 25th percentile | TBPAS1 | 8.47 | 14.1 | 6.61 | 26.1 | 29.3 |
| TBPAS2 | 0.967 | 8.19 | 4.03 | 2.05 | 28.1 | |
| 50th percentile | TBPAS1 | 49.2 | 30.1 | 9.09 | 51 | 29.3 |
| TBPAS2 | 26.1 | 14 | 5 | 10 | 28.1 | |
| 75th percentile | TBPAS1 | 52.9 | 104 | 13.4 | 51.8 | 58.4 |
| TBPAS2 | 32.6 | 35.9 | 5.92 | 13.2 | 35.9 |
| Approach | Method | Benefits | Limitations |
|---|---|---|---|
| RWL | It utilizes log analysis and process mining to refine requirements and generate a standardized software architecture for TBPA software. | Enhances the speed and accuracy of requirement elicitation, ensures and improves traceability between software specifications and business processes, even with process changes. | It requires human intervention to precisely obtain the business process and trace it into the architecture, can be complex to implement, and may result in data privacy issues and network traffic overload. |
| [44] | It employs business process models to systematically extract and document software requirements. | It promotes clear communication through visual models, improves alignment between software and business processes, and enhances traceability. | Managing large models can be challenging and resource-intensive, dependent on the quality of the models. |
| [45] | It integrates business process modeling with ERP system requirements to enhance customization and alignment. | It detailed process documentation, supports customization, and improves specification precision. | High complexity and resource demands, dependence on accurate modeling, and potential for over-engineering. |
| [46] | It generates requirements documents from business process models using semi-automated tools to bridge the gap between process models and requirements. | Automation increases efficiency, reduces inconsistencies, and enhances traceability between requirements and architecture. | Dependent on model quality, requires a high initial investment, and focuses primarily on process-driven requirements. |
| [17] | It integrates requirements with software architecture to manage complex software projects. | Promotes better communication, enables concurrent development, and supports systematic documentation. | Complex to implement, dependent on the quality of the initial requirements, and potential for over-engineering. |
| [26] | It uses process mining to identify and model business processes that involve various organizational entities. | It identifies stakeholders accurately, generates detailed documentation, and facilitates system customization. | Dependent on detailed logs, computationally intensive, and requires high-quality data. |
| [47] | It utilizes NLP techniques to link software requirements with similar existing software components for code reuse. | It provides efficient requirement retrieval, enhances mapping accuracy, and supports the identification of reusable components. | High dependency on data quality, complex implementation, and potential misalignment of requirements with code. |
| [48] | It combines requirements with enterprise architecture to efficiently reuse existing software capabilities. | It enhances compatibility between stakeholder requirements and solutions, promotes systematic reuse of software capabilities, and aligns solutions with business goals. | Requires significant expertise, is reliant on accurate architectural models, has scalability concerns and limited flexibility for rapid development cycles. |
Disclaimer/Publisher’s Note: The statements, opinions and data contained in all publications are solely those of the individual author(s) and contributor(s) and not of MDPI and/or the editor(s). MDPI and/or the editor(s) disclaim responsibility for any injury to people or property resulting from any ideas, methods, instructions or products referred to in the content. |
© 2024 by the authors. Licensee MDPI, Basel, Switzerland. This article is an open access article distributed under the terms and conditions of the Creative Commons Attribution (CC BY) license (http://creativecommons.org/licenses/by/4.0/).


