Submitted:
09 August 2024
Posted:
12 August 2024
You are already at the latest version
Abstract
Keywords:
I. Introduction
II. Methodology
III. Results
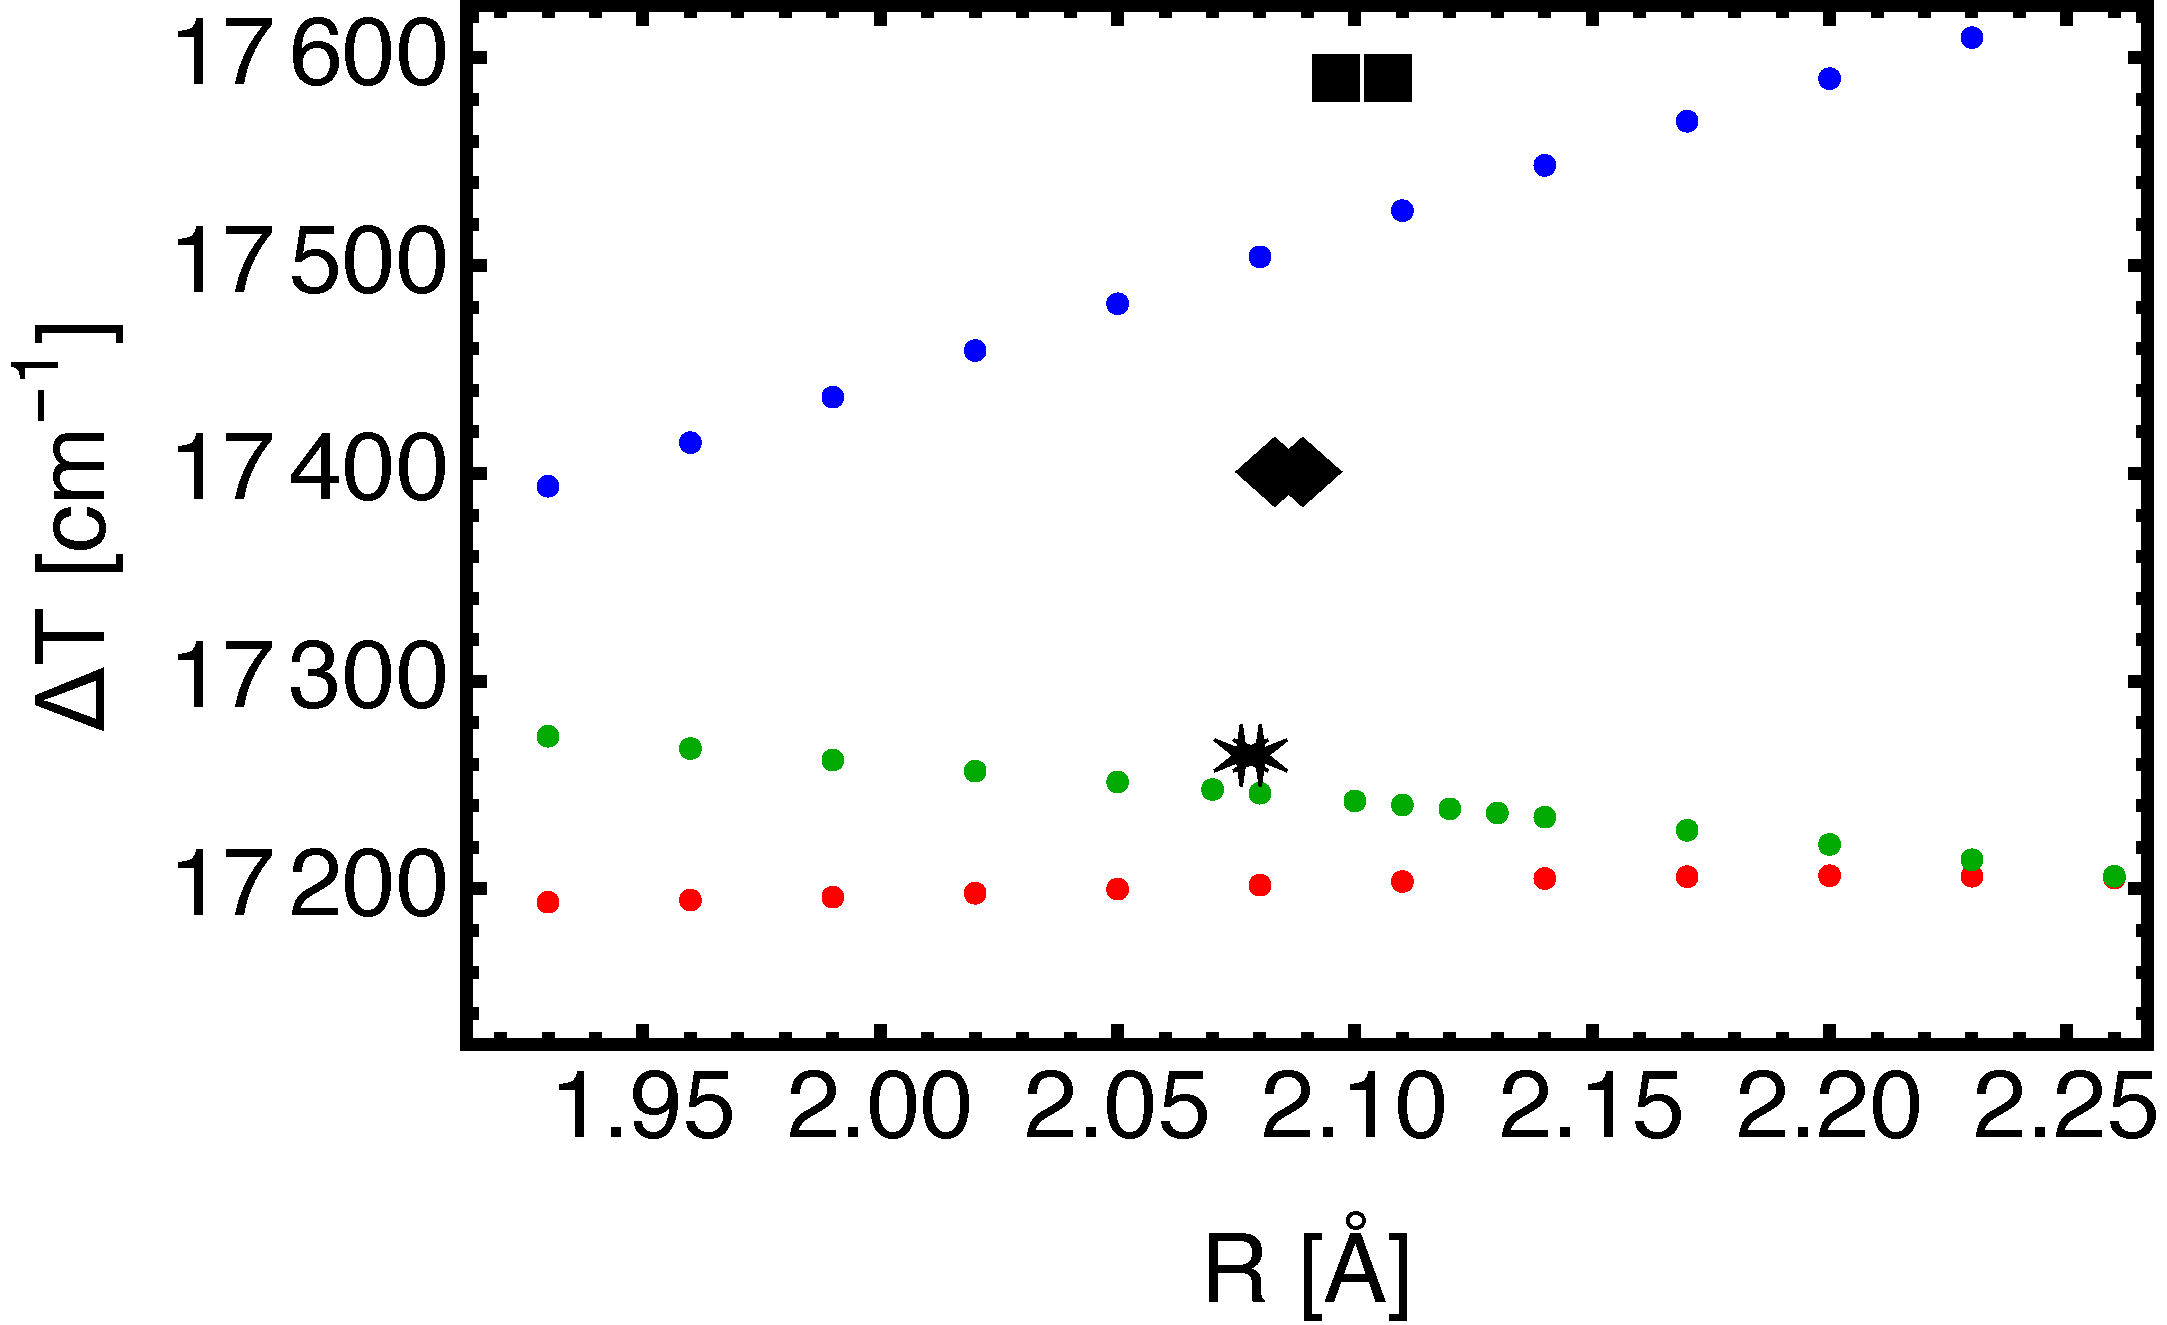
A. SrF()
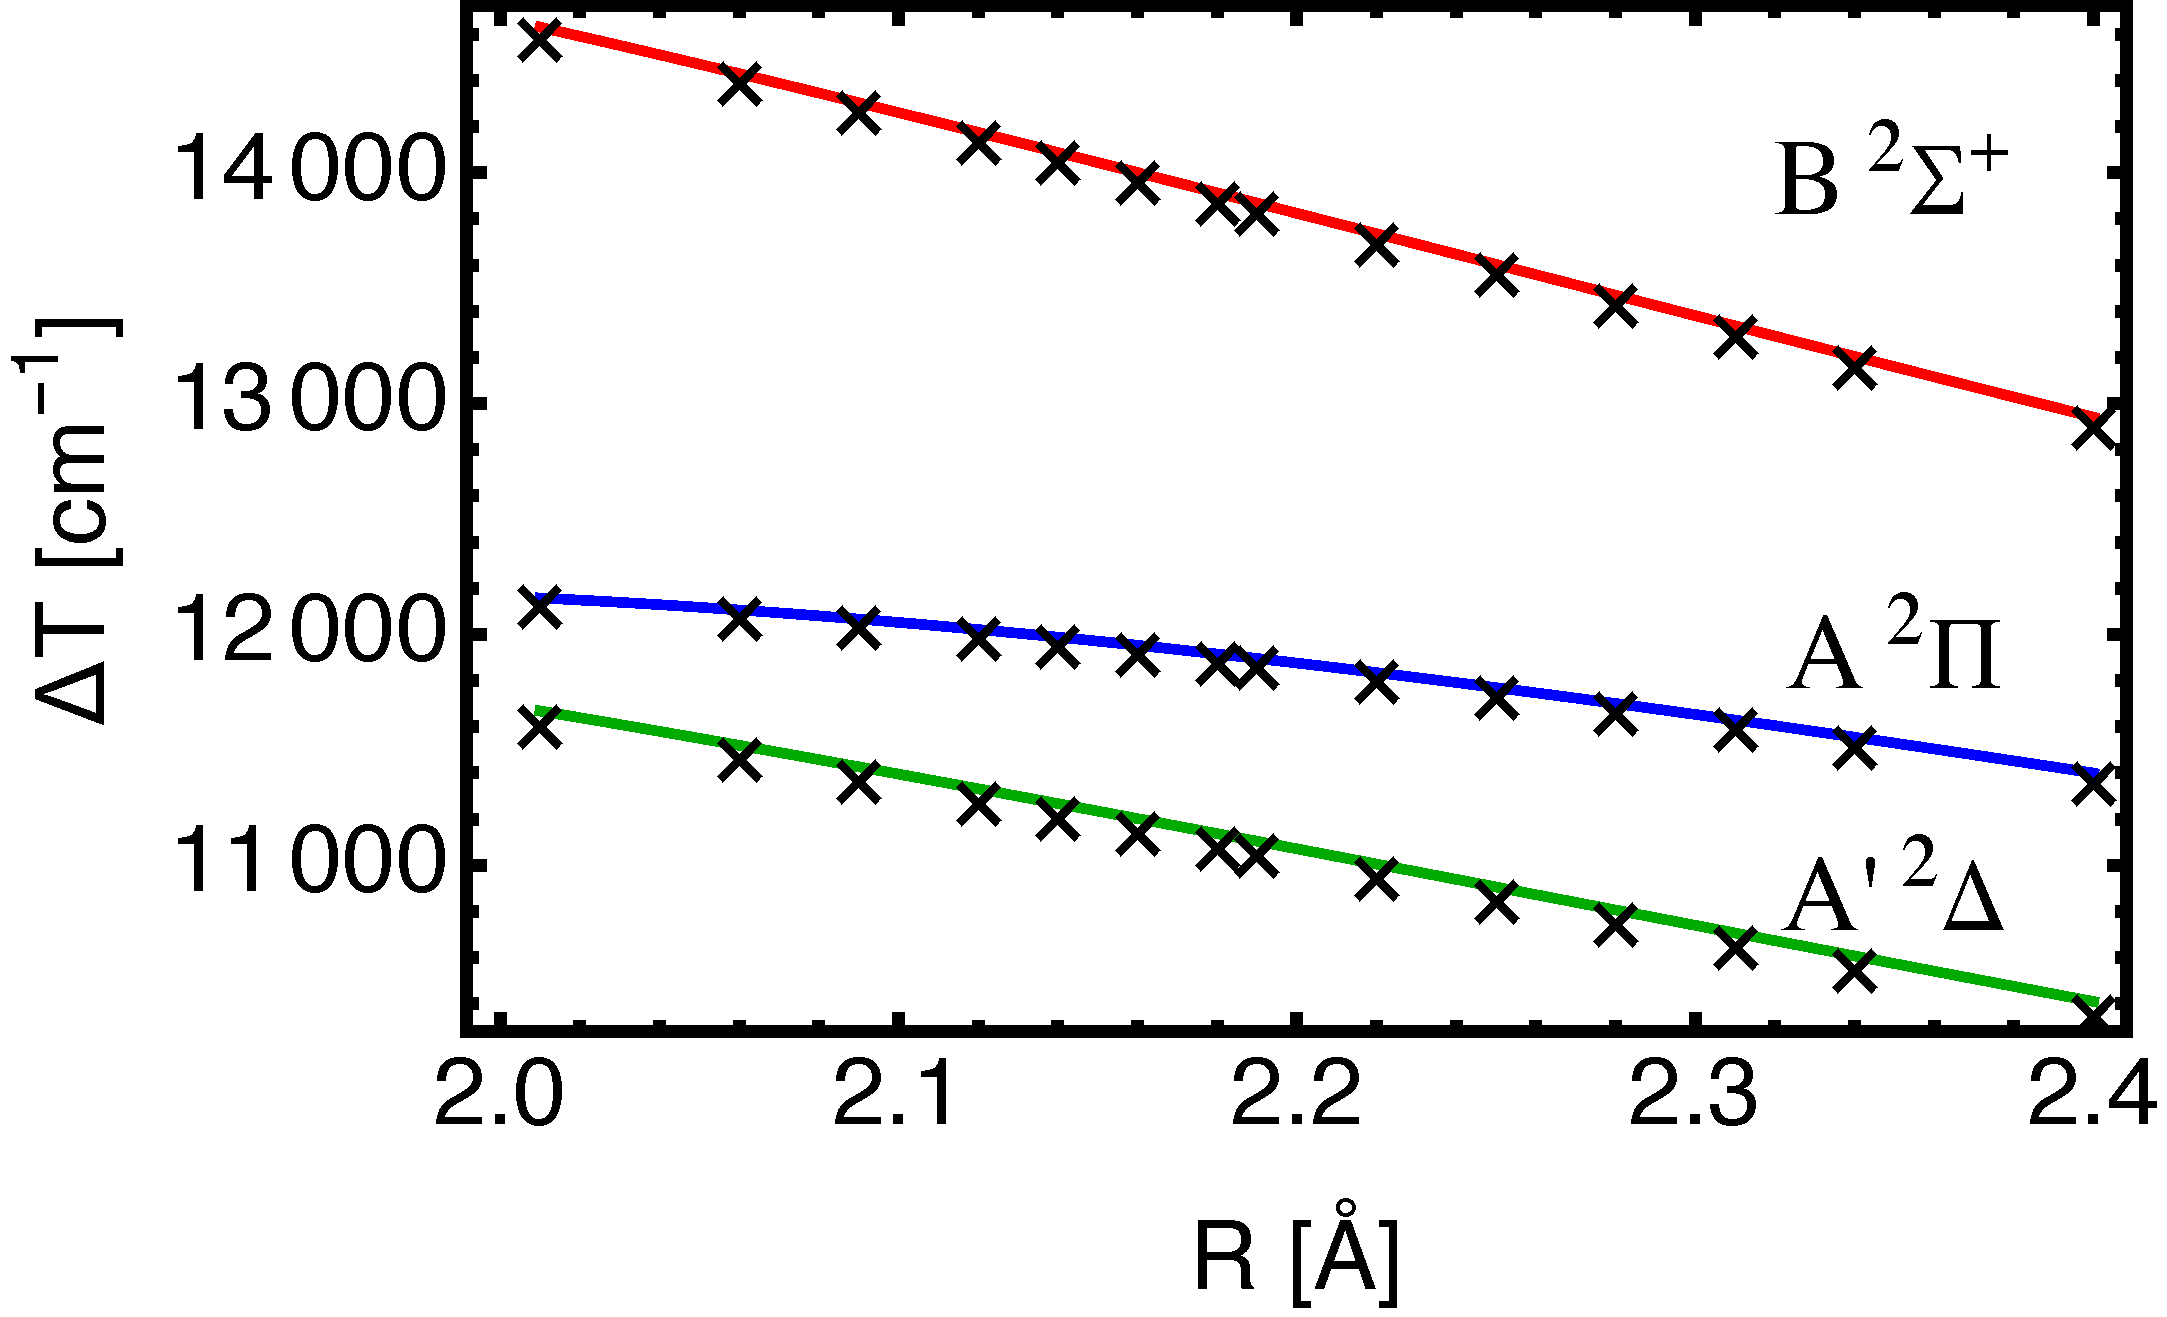
B. BaF(, , )

IV. Conclusions
Acknowledgments
Appendix A
| Method | R [Å] | ||||
|---|---|---|---|---|---|
| EOM-CC3 | 2.01 | -125.27549126 | -125.22232710 | -125.22009727 | -125.20882965 |
| 2.06 | -125.27873089 | -125.22624470 | -125.22357258 | -125.21298780 | |
| 2.11 | -125.28070218 | -125.22892852 | -125.22585778 | -125.21592208 | |
| 2.16 | -125.28116764 | -125.23012756 | -125.22670690 | -125.21737647 | |
| 2.21 | -125.28049152 | -125.23019824 | -125.22647458 | -125.21770545 | |
| 2.26 | -125.27885127 | -125.22931269 | -125.22532878 | -125.21707479 | |
| 2.31 | -125.27641989 | -125.22763820 | -125.22343428 | -125.21565498 | |
| 2.36 | -125.27334842 | -125.22532102 | -125.22093362 | -125.21358932 | |
| EOM-CCSD | 2.16 | -125.25688898 | -125.20589866 | -125.20207560 | -125.19235173 |
| EOM-CCSD | 2.16 | -125.25729908 | -125.20643000 | -125.20249267 | -125.19279287 |
| -CCSD | 2.16 | -125.25688897 | -125.20596253 | -125.20302866 | -125.19340808 |
| -CCSD(T) | 2.16 | -125.27876575 | -125.22780103 | -125.22426517 | -125.21485159 |
| -CC3 | 2.16 | -125.28116806 | -125.23008276 | -125.22652706 | -125.21714501 |
| EOM-CC3 | 2.01 | -125.27619337 | -125.22314957 | -125.22078430 | -125.20959123 |
| 2.06 | -125.27919971 | -125.22682037 | -125.22403798 | -125.21348092 | |
| 2.09 | -125.28051516 | -125.22856143 | -125.22553502 | -125.21536980 | |
| 2.12 | -125.28130166 | -125.22978244 | -125.22652966 | -125.21674161 | |
| 2.14 | -125.28155940 | -125.23033380 | -125.22693976 | -125.21739462 | |
| 2.16 | -125.28161379 | -125.23068403 | -125.22715668 | -125.21784780 | |
| 2.18 | -125.28147360 | -125.23084251 | -125.22718908 | -125.21810835 | |
| 2.19 | -125.28133651 | -125.23085492 | -125.22714142 | -125.21817269 | |
| 2.22 | -125.28069044 | -125.23065988 | -125.22677682 | -125.21813306 | |
| 2.25 | -125.27970333 | -125.23012609 | -125.22608895 | -125.21775394 | |
| 2.28 | -125.27842499 | -125.22930182 | -125.22512556 | -125.21708388 | |
| 2.31 | -125.27688344 | -125.22821412 | -125.22391279 | -125.21614988 | |
| 2.34 | -125.27511229 | -125.22689580 | -125.22248262 | -125.21498428 | |
| 2.40 | -125.27098835 | -125.22367141 | -125.21907086 | -125.21206175 |
References
- P. Aggarwal, H. L. Bethlem, A. Borschevsky, M. Denis, K. Esajas, P. A. B. Haase, Y. Hao, S. Hoekstra, K. Jungmann, T. B. Meijknecht, M. C. Mooij, R. G. E. Timmermans, W. Ubachs, L. Willmann, A. Zapara, and T. N. eEDM collaboration, The European Physical Journal D 72, 197 (2018).
- A. Boeschoten, V. R. Marshall, T. B. Meijknecht, A. Touwen, H. L. Bethlem, A. Borschevsky, S. Hoekstra, J. W. F. van Hofslot, K. Jungmann, M. C. Mooij, R. G. E. Timmermans, W. Ubachs, and L. Willmann (NL-eEDM Collaboration), Phys. Rev. A 110, L010801 (2024).
- S. J. Li, H. D. Ramachandran, R. Anderson, and A. C. Vutha, New Journal of Physics 25, 082001 (2023).
- I. S. Lim, P. Schwerdtfeger, B. Metz, and H. Stoll, The Journal of Chemical Physics 122, 104103 (2005).
- J. G. Hill and K. A. Peterson, The Journal of Chemical Physics 147, 244106 (2017).
- Y. Hao, L. F. Pašteka, L. Visscher, P. Aggarwal, H. L. Bethlem, A. Boeschoten, A. Borschevsky, M. Denis, K. Esajas, S. Hoekstra, K. Jungmann, V. R. Marshall, T. B. Meijknecht, M. C. Mooij, R. G. E. Timmermans, A. Touwen, W. Ubachs, L. Willmann, Y. Yin, A. Zapara, and N. eEDM Collaboration), The Journal of Chemical Physics 151, 034302 (2019).
- L. V. Skripnikov, D. V. Chubukov, and V. M. Shakhova, The Journal of Chemical Physics 155, 144103 (2021).
- A. A. Kyuberis, L. F. Pašteka, E. Eliav, H. A. Perrett, A. Sunaga, S. M. Udrescu, S. G. Wilkins, R. F. Garcia Ruiz, and A. Borschevsky, Phys. Rev. A 109, 022813 (2024).
- M. Denis, P. A. B. Haase, M. C. Mooij, Y. Chamorro, P. Aggarwal, H. L. Bethlem, A. Boeschoten, A. Borschevsky, K. Esajas, Y. Hao, S. Hoekstra, J. W. F. van Hofslot, V. R. Marshall, T. B. Meijknecht, R. G. E. Timmermans, A. Touwen, W. Ubachs, L. Willmann, and Y. Yin (NL-eEDM Collaboration), Phys. Rev. A 105, 052811 (2022).
- R. L. Lambo, G. K. Koyanagi, A. Ragyanszki, M. Horbatsch, R. Fournier, and E. A. Hessels, Molecular Physics 121, e2198044 (2023a).
- R. L. Lambo, G. K. Koyanagi, M. Horbatsch, R. Fournier, and E. A. Hessels, Molecular Physics 121, e2232051 (2023b).
- M. Horbatsch, Atoms 12 (2024), 10.3390/atoms12080040.
- I. S. Lim, H. Stoll, and P. Schwerdtfeger, The Journal of Chemical Physics 124, 034107 (2006).
- J. Lee, D. W. Small, and M. Head-Gordon, The Journal of Chemical Physics 151, 214103 (2019).
- Y. Damour, A. Scemama, D. Jacquemin, F. Kossoski, and P.-F. Loos, Journal of Chemical Theory and Computation 20, 4129 (2024).
- D. G. A. Smith, L. A. Burns, A. C. Simmonett, R. M. Parrish, M. C. Schieber, R. Galvelis, P. Kraus, H. Kruse, R. Di Remigio, A. Alenaizan, A. M. James, S. Lehtola, J. P. Misiewicz, M. Scheurer, R. A. Shaw, J. B. Schriber, Y. Xie, Z. L. Glick, D. A. Sirianni, J. S. OâBrien, J. M. Waldrop, A. Kumar, E. G. Hohenstein, B. P. Pritchard, B. R. Brooks, I. Schaefer, Henry F., A. Y. Sokolov, K. Patkowski, I. DePrince, A. Eugene, U. Bozkaya, R. A. King, F. A. Evangelista, J. M. Turney, T. D. Crawford, and C. D. Sherrill, The Journal of Chemical Physics 152, 184108 (2020).
- P. F. Bernath, Spectra of Atoms and Molecules (4th Edition) (Oxford University Press, 2020).
- P.-F. Loos, A. Scemama, A. Blondel, Y. Garniron, M. Caffarel, and D. Jacquemin, Journal of Chemical Theory and Computation 14, 4360 (2018), pMID: 29966098.
- W. Ernst and J. Schröder, Chemical Physics 78, 363 (1983).
- T. C. Steimle, P. J. Domaille, and D. O. Harris, Journal of Molecular Spectroscopy 68, 134 (1977).
- P. J. Domaille, T. C. Steimle, and D. O. Harris, Journal of Molecular Spectroscopy 68, 146 (1977).
- R. F. Barrow and J. R. Beale, Chem. Commun. (London) , 606a (1967).
- A. Bernard, C. Effantin, J. d’Incan, J. Vergès, and R. Barrow, Molecular Physics 70, 747 (1990).
- G. F. de Melo and F. R. Ornellas, Journal of Quantitative Spectroscopy and Radiative Transfer 237, 106632 (2019).
- K. G. Dyall, Theoretical Chemistry Accounts 135, 237 (2016).
- R. Barrow, A. Bernard, C. Effantin, J. D’Incan, G. Fabre, A. El Hachimi, R. Stringat, and J. Vergès, Chemical Physics Letters 147, 535 (1988).
- C. Effantin, A. Bernard, J. d’Incan, G. Wannous, J. Vergès, and R. Barrow, Molecular Physics 70, 735 (1990).
- A. Bernard, C. Effantin, E. Andrianavalona, J. Vergès, and R. Barrow, Journal of Molecular Spectroscopy 152, 174 (1992).
- M. Rockenhäuser, F. Kogel, E. Pultinevicius, and T. Langen, Phys. Rev. A 108, 062812 (2023).
- G. J. Shuying Kang, Fangguang Kuang and J. Du, Molecular Physics 114, 810 (2016).
- A. Berning, M. Schweizer, H.-J. Werner, P. J. Knowles, and P. Palmieri, Molecular Physics 98, 1823 (2000).


| Expt [20,22] | 2.076 | 501 | 2.27 | 2.080 | 496 | 2.34 | 17 264 | |
| X2C-FSCC [6] | 2.083 | 500 | 2.45 | 2.089 | 492 | 2.16 | 17 405 | |
| EOM-CC3(5Z) | 2.079 | 495 | 2.1 | 2.081 | 493 | 2.1 | 17 246 | |
| EOM-CC3(4Z) | 2.075 | 507 | 2.2 | 2.074 | 507 | 2.3 | 17 202 | |
| EOM-CC3(3Z) | 2.099 | 510 | 2.3 | 2.093 | 516 | 2.4 | 17 516 |
| State | [Å] | ||||
|---|---|---|---|---|---|
| 0 | 469.416 | 1.837 | 0.33 | 2.1593 | |
| 10 940.3 | 437.4 | 1.83 | - | ||
| 11 962.2 | 437.9 | 1.85 | 2.183 | ||
| 14 062.5 | 424.8 | 1.85 | 0.39 | 2.208 |
| State | Ref. [23] | ||
|---|---|---|---|
| 11 178 | 11 168 | 10 938.9 | |
| 11 952 | 11 947 | 11 979.6 | |
| 13 995 | 13 927 | 13 944.5 |
| State | |||
|---|---|---|---|
| 2.153 | 456 | 1.6 | |
| aug/aug: | 2.155 | 459 | 1.5 |
| 2.189 | 427 | 1.4 | |
| aug/aug: | 2.188 | 430 | 1.7 |
| 2.173 | 428 | 1.4 | |
| aug/aug: | 2.174 | 432 | 1.7 |
| 2.201 | 417 | 1.3 | |
| aug/aug: | 2.202 | 419 | 1.6 |
| Method | |||
|---|---|---|---|
| EOM-CC3 | 11 202 | 11 953 | 14 000 |
| EOM-CC3 | 11 178 | 11 952 | 13 955 |
| -CC3 | 11 212 | 11 992 | 14 051 |
| EOM-CCSD | 11 191 | 12 030 | 14 164 |
| EOM-CCSD | 11 164 | 12 029 | 14 157 |
| -CCSD | 11 177 | 11 821 | 13 932 |
| -CCSD(T) | 11 185 | 11 961 | 14 027 |
Disclaimer/Publisher’s Note: The statements, opinions and data contained in all publications are solely those of the individual author(s) and contributor(s) and not of MDPI and/or the editor(s). MDPI and/or the editor(s) disclaim responsibility for any injury to people or property resulting from any ideas, methods, instructions or products referred to in the content. |
© 2024 by the authors. Licensee MDPI, Basel, Switzerland. This article is an open access article distributed under the terms and conditions of the Creative Commons Attribution (CC BY) license (http://creativecommons.org/licenses/by/4.0/).


