Preprint
Article

Parametric Characterization of Nonlinear Optical Susceptibilities in Four-Wave Mixing: Solvent and Molecular Structure Effects

Altmetrics

Downloads

62

Views

23

Comments

0

A peer-reviewed article of this preprint also exists.

Submitted:

09 August 2024

Posted:

12 August 2024

You are already at the latest version

Alerts
Abstract
We study the nonlinear absorptive and dispersive optical properties of molecular systems immersed in a thermal reservoir interacting with a Four-wave Mixing (FWM) signal. Residual spin-orbit Hamiltonians are considered in order to take into account the internal structure of the molecule. As system parameters in the dissipation processes, transverse and longitudinal relaxation times are considered for stochastic solute-solvent interaction processes. The intramolecular coupling effects on the optical responses are studied using a molecule model consisting of two coupled harmonic curves of electronic energies with displaced minima in nuclear energies and positions. In this study, it was considered the complete frequency space is considered through the pump-probe detuning, not restricting the derivations to only maximums of population oscillations. This approach opens the possibility of studying the behavior of optical responses, which is very useful in experimental design. Our results indicate the sensitivity of the optical responses to parameters of the molecular structure as well as to those derived from the photonic process of FWM signal generation.
Keywords: 
Subject: Physical Sciences  -   Optics and Photonics

1. Introduction

Semiclassical models are used to study the nonlinear optical properties in complex system [1,2,3,4]. It is very common to model the active system subject to interaction with electric fields as a set of two levels that can represent the optical transition and its transitions are evaluated through a Gaussian or Lorentzian distribution of inhomogeneities. This type of modeling has the advantage of simplicity since it does not require an internal structure of the states that imply different transitions. Within this framework, a theoretical study carried out by Hesabi et al. [5], focused on the study of the information flow for a field with lorentzian spectrum through the dynamics of a two-level system immersed in a fluctuating classical field interacting with its environment through dipolar interaction, revealed the existence of two work regimes corresponding to the broad and sharp spectrum of the field, in which the memory effects are governed by the energy difference between two levels or by the interaction energy. Sakiroglu [6] studied the third-order linear and nonlinear optical absorption coefficients induced by an electric field and the changes in the refractive index in a quantum well, represented by the Morse potential, fusing a two-level system. He found that the total optical absorption increases and resonant peaks shift to higher energy values with an increase in electric field and decrease in the well parameter that describes the confining potential range and controls its asymmetry, also a decrease in the change in total refractive index with the well structural parameter was observed. Mukamel and Abramavicius [7] performed theoretical calculations of polarization and nonlinear optical susceptibilities to simulate nonlinear chromophore spectroscopies using the many-body approach. Pishchalnikov [8] used a brownian oscillator model to include stochastic effects in his study for the simulation of linear optical response in photosynthetic pigments such as chlorophyll and bacteriochlorophyll, employing 49 vibronic modes for chlorophyll and 60 modes for bacteriochlorophyll; he calculated parameters of electron-phonon coupling and lower frequency modes, parameters that can be used to model the nonlinear optical response under light presence.
Paz et al. [9] have already carried out studies on the nonlinear optical responses in a saturation regime, incorporating a molecular structure in the two-level model through the insertion of spin-orbit residual terms of the total Hamiltonian of the system and including stochastic effects, observing modifications in the wave functions that describe the system, and allowing the presence of permanent dipole moments in molecules that present parity symmetry. Following this last line, other theoretical studies have now been considered to account molecular structure through a possible vibronic coupling, using both cumulant expansions in Gaussian distributions and without them [10,11,12,13]. Paz et al. [14] have reported, by constructing a kinetic model for the description of the spatial propagation of electromagnetic fields in four-wave mixing spectroscopy [15,16,17,18,19,20] in a two-level molecular model, that the nonlinear optical processes of absorption and scattering can be described by an analogy with the kinetic processes of a chemical reaction. They found that an apparent equilibrium constant can be defined that regulates the competition of the photonic processes involved, similar to Einstein's model of spontaneous emission, but extended to nonlinear optical processes and relaxation. Four-wave mixing has also been employed in frequency measurement and conversion, spatial signal processing, etc. [21,22,23,24,25,26]. The characterization of molecular systems of optoelectronic interest and quantum control with various technological applications have been the subject of study and analysis by different authors. Al Saidi et al. [27], have reported modifications in the sign and magnitude of the nonlinear refractive index, nonlinear absorption coefficient, and third-order nonlinear optical susceptibility with the chemical concentration of Giemsa dye, because of its high saturable absorption, which is useful for developing optical limiters. Cheng et al. [28], analyzed the optical properties of graphene to account for multiphotonic processes occurring in its band structure, reflected in the changes of electrical conductivity allowing to exploitation of the potential of this organic molecule in the development of photonic and optoelectronic devices such as: optical modulators, optical limiters, photodetectors, and saturable absorbers. Yao et al. [29], studied the optical properties of 2,9,16,23-phenoxyphthalocyanine and 2,9,16,23-phenoxyphthalocyanine-zinc in solution by nanosecond laser pulse excitation, finding that the optical limiting efficiency depends on the concentration, exhibiting good all-optical switching properties for potential application in signal processing. Siva et al. [30] have reported the synthesis and evaluation of nonlinear optical properties of a new metal-organic single crystal of bis[hexaacuacobalt(II) sulfate] 2-aminopyridinium monohydrate, finding that it possesses high nonlinearity, attributed to a saturable absorption process, an essential property for its use in devices of opto-electronic nature. Naik et al. [31] synthesized and crystallized two chalcones to investigate their structural, thermal, linear, and nonlinear optical properties. Among the third-order nonlinear optical parameters they determined were the absorption coefficient, nonlinear refractive index, susceptibility, and molecular hyperpolarizability. The result they obtained suggest that thiophene-chalcones could be used in frequency generators, switches, and optical limiters.
From the theoretical point of view, to reach all these above developments, we require more detailed modeling of the molecular structure with less pretensions in the formality of the electromagnetic field [32,33]. The inclusion of the electron-nuclear correlation in our study systems allows us to determine the sensitivity of the study parameters on the coherent and incoherent components of the optical responses associated with the dispersive and absorptive properties. Finally, the nonlinear optical responses show little sensitivity to the saturation order of the weak beam and to influences from both electron-nucleus correlation and solvent. More significant in the behavior of the optical response are the relaxation processes strictly controlled by the T 1 / T 2 ratio. The importance of vibronic coupling in these studies is determined by the extension that can be made to molecular systems with permanent dipole moments without the need to resort explicitly to the rotating wave approximation.

2. Theory

A theoretical model involving the derivation of the optical Bloch equations through Liouville's formulation was developed. For this purpose, the Hamiltonians of the system, reservoir, and the two interaction potentials were considered. In the inclusion of the internal structure, adiabatic states of the chemical solute were constructed, considering the wave function as a linear combination of the electronic and vibrational states, and calculating on a new basis the adiabatic states responsible for the Bohr frequency and the permanent and transition dipole moments. Finally, it was also considered that the solvent induces shifts in the Bohr frequency of the molecular system, converting the conventional optical Bloch equations into stochastic ones. In this sense, our proposal incorporates from its base, two considerations: 1) the Bohr frequency shift to a time-dependent function, as a solvent effect in random terms, 2) the crossing of curves by residual Hamiltonian effects, which incorporates the electron-nuclear correlation.

2.1. Optical Bloch Equations in the Density Matrix Formalism

To describe the temporal dynamics of the systems, we start with the Liouville-von Newmann equation i t ρ ( t ) [ H , ρ ( t ) ] = 0 , where ρ ( t ) is the global density matrix, and where the Hamiltonian is defined as H = n H n + m n H m n for n = S , F , R (S: System, F:Field, R: Reservoir), with H m n represents the Hamiltonian of the interactions. In our model we do not incorporate the F-R interaction because it is out of resonance in the frequency absorption and we do not take the quantization of F. Considering the quantum theory of relaxation and applying the model to a two-level system, the equations of the dynamics of the density matrix components are finally obtained:
t ρ ( t ) = A ( t ) ρ ( t ) + B r e l a x
where   ρ ( t ) = ( ρ D ρ b a ρ a b ) ;   B r e l a x = ( ρ D e q . / T 1 0 0 ) ,
and   A ( t ) = ( 1 T 1 2 i V a b 2 i V a b i V b a ( i ω 0 + 1 T 2 ) + i ( V a a V b b ) 0 i V a b 0 ( i ω 0 1 T 2 ) i ( V a a V b b ) )
In eq. (1) we use the frequency domain to avoid possible future complications related to memory and coherence issues. For this purpose, we performed Fourier series expansions of the components of the density matrix. From these expressions, it can be seen how the components of the density matrix are related to each other in the frequency space. The coherent superposition of the eigenstates | b and | a induced by the radiative interaction oscillates at the frequencies of the incident beams and of the beam generated in the medium in which the molecular system is located; the component ρ a b oscillates at the negative of the oscillation frequencies of ρ b a and ρ D oscillates at a combination of both. Here, ω 0 is the Bohr frequency, T 1 , T 2 are the longitudinal and transversal relaxation times, respectively, and V a b , V a a , V b b are the nondiagonal, and diagonal potentials, respectively. The superscripts (eq) denote the equilibrium value of the population difference.

2.2. Vibronic Coupling and Stochastic Nature due to Solvent Presence

The interaction between nuclear and electronic motions in molecules gives rise to the crossing of two or more potential energy curves, a process associated with intramolecular coupling. The effect of coupling on the response of the molecular system of interest can be treated by considering wave functions on a new basis, composed of a linear combination of the product of electronic and vibrational wave functions [34,35,36,37]. For the consideration of vibronic coupling in the model, we use the previous results as described in ref. [9] which take into account for the energies of the adiabatic states, the reconfiguration of the Bohr frequency ( ω ˜ 0 ), and the new permanent and transition dipole moments (eqs.10-13) [13]. On the other hand, it was considered that the solvent, besides acting as a thermal reservoir, induces random shifts in the Bohr frequency of the molecular system under study. To address this situation, the natural frequency of the system is now considered to have a stochastic behavior of the form ξ ( t ) = ω ˜ 0 + σ ( t ) . In this expression, all the stochasticity of ξ(t) has been introduced in the function σ(t). The latter function generates an inhomogeneous broadening of the upper energy level. Frequency fluctuations occur around the transition frequency ω ˜ 0 , so one has σ ( t ) = 0 . In solving this problem, an Ornstein-Uhlenbeck process (OUP) is considered, taking the reservoir as a colored noise source [38]. The noise considered has an intensity γ and an exponential correlation function with a decay rate τ, i.e., ξ ( t ) ξ ( t ' ) = γ τ exp ( τ | t t ' | ) . In this distribution, the variance is given by the product γ τ . Taking these considerations into account, by replacing the Bohr frequency of the system with the new time-dependent frequency ξ(t), the conventional optical Bloch equations are transformed into stochastic optical Bloch equations. It is important to note that ω ˜ 0 refers to the adiabatic states (A, B) by the insertion of the vibronic coupling.

2.3. Nonlinear Optical Susceptibilities: Stochastic and Intramolecular Considerations

Using eq.(2) for the diagonal and extra-diagonal frequency components of the reduced density matrix in the presence of the intramolecular coupling effects due to the internal molecular nature, and of the stochasticity due to the presence of the solvent and its strong collisions with the solute and the consequent shift in the deterministic frequency ω ˜ 0 , we obtain the corresponding Fourier components at frequencies ω 1 , ω 2 , ω 3 , necessary for the evaluation of the nonlinear polarizations induced in the medium. For this, we do: E ( t ) = n = 1 3 E n ( ω n ) exp ( i ω n t ) where E n ( ω n ) = E n 0 exp ( i k n . r + ϕ ) and taking as interaction potential the one given by the electric dipole approximation V n m = μ n m . E ( t ) [39]. Considering the strong pump beam ( E 1 ) in saturation regimes, the probe beam ( E 2 ) in the second order and the emerging signal beam ( E 3 ) in the first order, under perturbative schemes, we have for the FWM signal:
ρ B A ( ω 1 ) = [ i Ω ˜ 1 δ 1 , m 2 i J * Ω ˜ 1 | Ω ˜ 2 | 2 | J | 2 u 1 , 2 δ 1 , m 2 i Ω ˜ 1 * Ω ˜ 2 Ω ˜ 3 | J | 2 ( J * u 3 , 1 + J u 2 , 1 ) ] ρ D d c D 1
ρ B A ( ω 2 ) = [ i Ω ˜ 2 + δ 1 , m 4 i Ω ˜ 1 2 | Ω ˜ 2 | 2 Ω ˜ 3 * | J | 2 u 1 , 1 u 1 , 2 2 i J Ω ˜ 2 | Ω ˜ 1 | 2 u 2 , 1 | J | 2 2 i J Ω ˜ 1 2 Ω ˜ 3 * u 1 , 3 | J | 2 ] ρ D d c D 2
ρ B A ( ω 3 ) = [ i Ω ˜ 3 + δ 1 , m 4 i | Ω ˜ 1 | 2 | Ω ˜ 2 | 2 Ω ˜ 3 | J | 2 u 1 , 1 u 2 , 1 2 i J * Ω ˜ 1 2 Ω ˜ 2 * u 1 , 2 | J | 2 2 i J * Ω ˜ 3 | Ω ˜ 1 | 2 u 3 , 1 | J | 2 ] ρ D d c D 3 .
We select the value of m = 0 for the perturbative treatment at the first order for the probe beam and the value m = 1 , when considering the second order in the probe beam. In these expressions we have considered the validity of the rotating wave approximation RWA [40]; ρ D d c which represents the canonical population difference in the adiabatic basis in the presence of the saturation effects of the pump and probe beams. We can observe its tendency to the Boltzmann-type equilibrium value in the cases of the absence of radiation. We can notice that with the incorporation of the second order of probe ( m = 1 ), the expressions still have the same symmetry in their terms for the probe and signal beams; for m = 0 , the elements of the density matrix ρ B A ( ω 2 ) and ρ B A ( ω 3 ) maintain a symmetry of terms different from the previous one, and in that case, the pump-beam maintains a mathematical structure that only involves its beam in the photonic processes. We have defined: J = Γ 1 + 2 | Ω ˜ 1 | 2 u 3 , 2 + δ 1 , m 2 | Ω ˜ 2 | 2 / D 1 ; u i , k = 1 / D i + 1 / D k * ; D n = T 2 1 + i ( ξ ( t ) ω n ) ; Γ n = T 1 1 i n Δ ; Ω ˜ j is the Rabi frequency of the beam j in presence of the intramolecular coupling. Using eqs. (3), we evaluate the Fourier components of the complex nonlinear polarizations at different frequencies, according to P ( ω j ) = N ( ρ B A ( ω j ) ξ μ ˜ A B θ ) . Here, the external bracket denotes average over the probability distributions of molecular orientations o the molecules, while the internal bracket implies the average over the set of realizations of the random variable in the range between ξ and ξ + d ξ , and N the concentration of active molecules interacting with the field. In the tensorial approximation, we express the polarization components of the form:
P ( ω j ) = P p r o c e s s C , I ( ω j ) + P c o u p F W M ( ω j ) ,
where P p r o c e s s C , I ( ω j ) reflects the contribution of the coherent (C) and incoherent (I) processes to the induced polarization of frequency ( ω j ) , while P c o u p F W M ( ω j ) corresponding to the contribution of the coupling process of the beams at frequencies ω 1 , ω 2 , ω 3 , whose arrangements in the FWM process generate photons at frequency ( ω j ) . Here, we have defined:
P p r o c e s s C , I ( ω j ) = χ S V ( ω j ) E ( ω j ) + χ e f f ( ω j ) E ( ω j )
with j=1,2,3
where χ e f f ( ω j ) = χ I ( 1 ) ( ω j ) + χ C ( 3 ) ( ω j ) , and χ S V ( ω j ) is the solvent contribution. On the other hand, we define:
P c o u p F W M ( ω j ) = χ c o u p ( 3 ) ( ω j ) E e f f ( ω j ) ,
where ω j = ω q + ω p ω r and E e f f ( ω j ) = E q E p E r * , valid for the following values: j = 1 (pump), with q = 2 , p = 3 , r = 1 ; j = 2 (probe), with q = p = 1 , r = 3 ; j = 3 (signal), with q = p = 1 , r = 2 . Thus, we have the optical susceptibilities in incoherent processes (those due to absorption), the following:
χ I ( 1 ) ( ω j ) = a 1 ρ D d c D j ξ ,   j = 1 , 2 , 3 .
For coherent processes (those due to saturation), we have the following optical susceptibilities:
χ C ( 3 ) ( ω 1 ) = δ 1 , m a 2 u 1 , 2 J ρ D d c D 1 ξ | E ( ω 2 ) | 2 ;   χ C ( 3 ) ( ω 2 ) = a 2 u 2 , 1 J * ρ D d c D 2 ξ | E ( ω 1 ) | 2
χ C ( 3 ) ( ω 3 ) = a 2 u 3 , 1 J ρ D d c D 3 ξ | E ( ω 1 ) | 2 + δ 1 , m a 3 u 1 , 1 u 2 , 1 | J | 2 ρ D d c D 3 ξ | E ( ω 1 ) | 2 | E ( ω 2 ) | 2
For the coupling processes at the different frequencies, we obtain:
χ c o u p ( 3 ) ( ω 1 ) = δ 1 , m a 2 ( u 3 , 1 J + u 2 , 1 J * ) ρ D d c D 1 ξ
χ c o u p ( 3 ) ( ω 2 ) = a 2 u 1 , 3 J * ρ D d c D 2 ξ | E ( ω 1 ) | 2 + δ 1 , m a 3 u 1 , 1 u 1 , 2 | J | 2 ρ D d c D 2 ξ | E ( ω 2 ) | 2
χ c o u p ( 3 ) ( ω 3 ) = a 2 u 1 , 2 J ρ D d c D 3 ξ .
where a 1 = i | μ ˜ B A | 2 N / , a 2 = 2 i | μ ˜ B A | 4 N / 3 , a 3 = 4 i | μ ˜ B A | 6 N / 5 . The superscripts ( k = 1 , 3 ) are the minimum order required in the process. We note that the case of m = 0 the probe- and FWM-signal beams acquire a similar but not symmetrical coupling susceptibility in their process, and a photon-generating coupling process at the frequency of the pumping beam is not reflected. That is, the strong intensity beam (pump) acts through a single absorption process in the medium, with no FWM processes that allow the couplings to generate photons at the frequency ω 1 (pump) (that is χ c o u p ( 3 ) ( ω 1 ) = 0 ). However, for the coupling processes the weak beams are differentiated through the pump intensity (eq. 9), a fact that is reflected by the same perturbative condition given to both beams. Similarly, the coherent process becomes strictly symmetric in the lower intensity beams (probe and signal) and the coherent process disappears at the pump beam frequency ω 1 , and again the susceptibilities are symmetrized. It is important to draw attention to these optical responses, since considering a probe beam at second order and differentiating it from the emerging signal beam, allows the appearance of a coupling process that now involves the optical response at the pump frequency, and they become very different for the probe and signal beams. This fact is repeated in the same way in the coherent responses. It is necessary to indicate that the incoherent process, independently of the type of beam considered, remains invariant, since it is only attributed to the absorption processes, independent of the treatment given to the test. Making use of eqs. (3), it is possible to show that:
ρ D d c = T 2 2 | D 1 | 2 | D 2 | 2 T 2 2 | D 1 | 2 | D 2 | 2 ( 1 δ 1 , m T 1 j = 1 3 ϕ j ) + 4 S ˜ 1 + δ 1 , m 4 S ˜ 2 ρ D e q . ,
ρ D d c is the population difference component at zero frequency, and where the saturation parameters are defined as: S ˜ 1 = | Ω ˜ 1 | 2 T 1 T 2 | D 2 | 2 and S ˜ 2 = | Ω ˜ 2 | 2 T 1 T 2 | D 1 | 2 , for the pump- and probe-beams, respectively, and in presence of the coupling intramolecular. The functions ϕ j are defined as follows:
ϕ 1 = 4 | Ω ˜ 1 | 2 | Ω ˜ 2 | 2 | J | 2 ( J * u 1 , 2 2 + J u 2 , 1 2 ) ;   ϕ 2 = 4 Ω ˜ 1 2 Ω ˜ 2 * Ω ˜ 3 * | J | 2 ( J u 1 , 3 u 2 , 1 + 1 D 1 * J * u 1 , 2 ) ;   ϕ 3 = Ω ˜ 1 2 ( Ω ˜ 1 * ) 2 ϕ 2 * .
However, taking a particular case of organic dyes as our system of study, it is possible to have T 1 j = 1 3 ϕ j 1 , and therefore eq. (10) is reduced to:
ρ D d c = ρ D e q 1 + 4 | Ω ˜ 1 | 2 T 1 | D 1 | 2 T 2 + δ 1 , m 4 | Ω ˜ 2 | 2 T 1 | D 2 | 2 T 2 .
Indicating that in situations of low pump saturation and in conditions of perturbative treatments at first order of probe, the steel-frequency component of the population difference is defined by a Boltzmann distribution in equilibrium regimes. We also note that for cases where m = 1 we have that: 4 ( | Ω ˜ 1 | 2 / | D 1 | 2 + δ 1 , m | Ω ˜ 2 | 2 / | D 2 | 2 ) T 1 / T 2 1 , and can be developed in series and finally obtain:
ρ D d c = ρ D e q . n = 0 q n k = 0 n q k , n 1 | D 1 | 2 ( n k ) 1 | D 2 | 2 k .
Taking as example the incoherent susceptibility of type χ I ( 1 ) ( ω 1 ) , we have
χ I ( 1 ) ( ω 1 ) = n = 0 q n k = 0 n q k , n λ 1 Φ ( 1 ) ( n , k ) ξ
q n = ( 1 ) n ( 4 T 1 T 2 ) n ,   q k , n = n ! k ! ( n k ) ! | Ω ˜ 1 | 2 ( n k ) | Ω ˜ 2 | 2 k ,   and   Φ ( 1 ) ( n , k ) ξ = D 1 * | D 1 | 2 ( n k + 1 ) | D 2 | 2 k ξ .
Considering a Gaussian probability distribution function, we have for Φ ( 1 ) ( n , k ) ξ in the OUP [41]:
Φ ( 1 ) ( n , k ) ξ = 1 2 π γ τ T 2 1 i ( ξ ω 1 ) [ T 2 2 + ( ξ ω 1 ) 2 ] n k + 1 [ T 2 2 + ( ξ ω 2 ) 2 ] k e ( ξ ω 0 ) 2 2 γ τ d ξ .
From eq. (14) it is possible to derive the following recursive formulas (real and imaginary parts)
2 ( n k ) Re [ Φ ( 1 ) ( n , k ) ξ ] + 2 k Re [ Φ ( 1 ) ( n , k + 1 ) ξ ] T 2 2 ( T 2 Re [ Φ ( 1 ) ( n 1 , k ) ξ ] ) T 2 = 0 Im [ Φ ( 1 ) ( n , k ) ξ ] + T 2 2 ( n k ) Re [ Φ ( 1 ) ( n 1 , k ) ξ ] Δ 1 = 0 n k
To reduce the computational effort required for this type of increasingly complex integrals as we advance in the development of the orders of perturbations and the type of susceptibilities, we have for Φ ( 1 ) ( 0 , 0 ) and all those terms that cannot be achieved from the recursive relation, the use of Parseval's formula:
x 1 ( t ) x 2 * ( t ) d t = 1 2 π X 1 ( ω ) X 2 * ( ω ) d ω
X 1 ( ω ) and X 2 * ( ω ) are the Fourier transforms of the complex functions x 1 ( t ) and x 2 * ( t ) , respectively. Taking a particular case to illustrate the calculation, we have:
Re [ Φ ( 1 ) ( 1 , 1 ) ξ ] = b Δ e T 2 2 Δ 1 2 2 γ τ [ ( T 2 Δ cos ( b Δ 1 ) 2 sin ( b Δ 1 ) ) + ( T 2 Δ cos ( b Δ 1 ) + 2 sin ( b Δ 2 ) ) ]
Im [ Φ ( 1 ) ( 1 , 1 ) ξ ] = b Δ [ e T 2 2 Δ 1 2 2 γ τ ( 2 cos ( b Δ 1 ) + T 2 Δ sin ( b Δ 1 ) ) e T 2 2 Δ 2 2 2 γ τ ( ( T 2 2 Δ 2 + 2 ) cos ( b Δ 2 ) + T 2 Δ sin ( b Δ 2 ) ) ]
where b Δ = π 2 γ τ ( T 2 Δ ( 4 + T 2 2 Δ 2 ) ) ; b Δ j = Δ j T 2 1 / γ τ , with Δ j = ω j ω ˜ 0 for j = 1,2 .
In the case of Δ = Δ 1 Δ 2 = 0 associated with the maximum population oscillations condition, (MPO) [42], eqs. (17) have non indeterminate and analytically closed solutions, given by:
lim Δ 0 ( Re Φ ( 1 ) ( 1 , 1 ) ξ ) = 1 2 ( γ τ ) 3 / 2 exp ( 1 T 2 2 Δ 1 2 2 γ τ T 2 ) [ ( 1 γ τ T 2 2 ) cos ( b Δ 1 ) ( T 2 Δ 1 ) sin ( b Δ 1 ) ]
lim Δ 0 ( Im Φ ( 1 ) ( 1 , 1 ) ξ ) = 1 2 ( γ τ ) 3 / 2 exp ( 1 T 2 2 Δ 1 2 2 γ τ T 2 ) [ ( T 2 Δ 1 ) cos ( b Δ 1 ) + sin ( b Δ 1 ) ]
It is important to note that the real and imaginary components of the optical responses observed in frequency space obey the detuning conditions of each of the beams. For our derivative, we have estimated non-degenerate conditions at the frequencies of the incident beams, so that when we try to study the MPO, the values are indeterminate. However, if the treatment starts under these resonance conditions, the result obtained in the optical responses is as indicated by eqs. (18), showing clearly that the magnitude of the signal is only obtained analytically when the calculation is subject to the MPO condition. Our results allow us to explore any region of the frequency space Δ 1 , Δ 2 , subject to RWA, but under simultaneous considerations of stochastic effects caused by the presence of the solvent and intramolecular couplings because of the molecular structure of the active substrate in the radiation-matter interaction. The present study differs substantially from previous works, which not only fails to explore the simultaneity of these effects, but restricts the optical response only to considerations in MPO regimes. It should be noted that these terms correspond to the first order of the series development for the ρ D d c component. In general, it is possible to obtain:
χ I ( 1 ) ( ω j ) = n = 0 q n k = 0 n q k , n λ 1 Φ ( j ) ( n , k ) ξ j = 1 , 2 , 3
with Φ ( j ) ( n , k ) ξ = D j * | D 1 | 2 ( n k ) | D 2 | 2 k | D j | 2 ξ . In the case of the coherent susceptibilities, we obtain:
χ C ( 3 ) ( ω j ) = n = 0 q n k = 0 n q k , n [ ( λ 2 δ 2 , j λ 2 * δ 3 , j ) ( G 1 ( j ) ( n , k ) ξ + G 2 ( j ) ( n , k ) ξ )
+ ( λ 3 δ 3 , j δ 1 , m ) | E ( ω 1 ) | 2 ( G 3 ( 3 ) ( n , k ) ξ + G 4 ( 3 ) ( n , k ) ξ ) / J ]
Where
G 1 ( j ) ( n , k ) ξ = ( D j * ) 2 | D 1 | 2 ( n k ) | D 2 | 2 k | D j | 4 ξ ;   G 2 ( j ) ( n , k ) ξ = D 1 D j * | D 1 | 2 ( n k ) | D 2 | 2 k | D 1 | 2 | D j | 2 ξ
G 3 ( 3 ) ( n , k ) ξ = D 1 * D 3 * | D 1 | 2 ( n k ) | D 2 | 2 k | D 1 | 2 | D 2 | 2 | D 3 | 2 ξ ;   G 4 ( 3 ) ( n , k ) ξ = D 1 D 3 * | D 1 | 2 ( n k ) | D 2 | 2 k | D 1 | 4 | D 3 | 2 ξ
For the coupling susceptibility at frequency ( ω 2 ), we have
χ c o u p ( 3 ) ( ω 2 ) = n = 0 q n k = 0 n q k , n { λ 2 ( L 1 ( n , k ) ξ + L 2 ( n , k ) ξ ) + δ 1 , m λ 3 2 T 2 ( L 3 ( n , k ) ξ + L 4 ( n , k ) ξ ) }
we have defined:
L 1 ( n , k ) ξ = D 1 * D 2 * | D 1 | 2 ( n k + 1 ) | D 2 | 2 ( k + 1 ) ξ ;   L 2 ( n , k ) ξ = D 2 * D 3 | D 1 | 2 ( n k ) | D 2 | 2 ( k + 1 ) | D 3 | 2 ξ
L 3 ( n , k ) ξ = D 1 * D 2 * | D 1 | 2 ( n k + 2 ) | D 2 | 2 ( k + 1 ) ξ ;   L 4 ( n , k ) ξ = 1 | D 1 | 2 ( n k + 1 ) | D 2 | 2 ( k + 1 ) ξ .
For the frequency-coupled component of the FWM signal ( ω 2 ), we have
χ c o u p ( 3 ) ( ω 3 ) = n = 0 q n k = 0 n q k , n { λ 2 * ( M 1 ( n , k ) ξ + M 2 ( n , k ) ξ ) }
Considering the following functions:
M 1 ( n , k ) ξ = D 1 D 3 * | D 1 | 2 ( n k + 1 ) | D 2 | 2 k | D 3 | 2 ξ ;   M 2 ( n , k ) ξ = D 2 D 3 * | D 1 | 2 ( n k ) | D 2 | 2 ( k + 1 ) | D 3 | 2 ξ
where the J-function is defined as
J = 1 T 1 ( 1 + 4 S 1 T 2 2 D 3 D 2 * ) i Δ ( 1 4 S 1 T 1 T 2 D 3 D 2 * ) + 2 | Ω ˜ 2 | 2 D 1 1 T 1 i Δ
In this case, J can be interpreted as a Lorentzian width regulated by the longitudinal relaxation time, for the local and non-saturated cases of FWM signal. We have defined in the above expressions:
λ 1 = a 1 ρ D e q .   ;   λ 2 = a 2 ρ D e q . J * | E ( ω 1 ) | 2 ;   λ 3 = a 3 ρ D e q . J * | E ( ω 2 ) | 2 .
It is important to note that the different processes (I,C,coupling), q n strictly contains dissipative processes defining the type of molecular system through the ratio of the relaxation times (except in case of q 0 = 1 ); q k , n defines the intensity of the pump- and probe-beam dispersion processes (except in case of q 0 , 0 = 1 ); while Φ ( j ) ( n , k ) ξ , controls the stochastic nature ξ ( t ) = ω ˜ 0 + σ ( t ) of the process by the presence of the solvent and its strong interaction with the solute. It is important to note that in the functions λ n for ( n = 1 , 2 , 3 ) reside the molecular structure effects under consideration of the vibronic coupling through the transition dipole moments of the states in the adiabatic basis μ B A ; on the other site, the terms D n contain a Bohr frequency evaluated in the states with vibronic-type energies E A , E B . Because of the asymmetric treatment of the pump beam at all orders, unlike the perturbative scheme for the weak beams has that χ C ( 3 ) ( ω 1 ) = χ c o u p ( 3 ) ( ω 1 ) = 0 . On the other hand, it is possible to note that, in the incoherent susceptibilities, independent of the optical frequency of calculation, the λ 1 parameter has no dependence on the intensities of the beams. So far, the treatment we have given to the FWM signal is associated to the local regime, considering the quantum nature of the structure and the strong presence of the solvent through the function ξ ( t ) . Taking the nonlinear polarization induced in the material as the source of propagation, and using Maxwell's equation [42], it is possible to derive expressions for the absorption coefficient and nonlinear refractive index, given by: α ˜ j ( ω j , z ) = 2 π ω j η ˜ j c Im χ e f f ( ω j , z ) and η ˜ j ( ω j , z ) = [ 1 + 4 π Re χ e f f ( ω j , z ) ] 1 / 2 , respectively, for χ e f f ( ω j , z ) = χ I ( 1 ) ( ω j , z ) + χ C ( 3 ) ( ω j , z ) . In this case, α ˜ j ( ω j , z ) and η ˜ j ( ω j , z ) represent the quantities under study, which have dependencies both on the structural parameters that define the vibronic coupling both in the Rabi frequency and in the induced dipole moments, and on those parameters of the FWM signal generation process, mainly associated to the longitudinal and transverse relaxation times. In the present work, we will focus on reviewing the nonlinear optical absorption and scattering properties and the sensitivity of these in relation to different parameters of both the molecular structure and the solvent effect. The study of these nonlinear responses can be complemented with the developments of optical propagation and the effect of coherent and incoherent components on the susceptibility responses, proposed in Ref. [42].

3. Results and Discussion

3.1. Nonlinear Optical Properties

The FWM signal was characterized in terms of the behavior of its nonlinear optical properties and relative intensity, considering the stochasticity due to the presence of the solvent and the intramolecular nature of the coupling of the states. We keep the rotating wave approximation in the strictly near-resonance processes and select as a guide for the choice of some parameters, organic dyes such as green malachite chloride. We raise perturbatively the second order of the probe, which allows us to give presence to new photonic processes and how they can influence the specific signal of higher intensity at frequency ω 3 = ω 1 + Δ . To elucidate the behavior of the signal, we focus our attention on the different nonlinear susceptibilities that are generated, both absorptive (I) and saturative (C), as well as those generated by new coupling processes. We study how sensitive they respond to the optical length z, the intensity of the beams, frequency detuning of the pump and probe beams, time ratios of the longitudinal and transverse relaxation processes, and the parameters that specifically characterize the stochastic nature of the solute-solvent collision, and the vibronic effects resulting from the residual Hamiltonian. The latter is conditioned on the Bohr frequency of the adiabatic states ω ˜ 0 and the coupling strength ν by the generation of the new transition dipoles ( Ω ˜ k = μ ˜ B A . E k / ). To reduce the complexity of the calculations, we have considered the permanent dipoles of the adiabatic basis to be null. The reason why we cannot determine the values at the maxima of the population oscillations is not because the permanent dipole moments of the adiabatic states are equal or because their energies are close. It is because we need to stay in the RWA and avoid including terms associated with non-resonant processes: ± ( ω 1 + ω 2 ) , n ω 1 ( n 1 ) ω 2 (for n 3 ) or n ω 2 ( n 1 ) ω 1 (for n 2 ). This assumption makes sense, since the higher-order components of ρ B A ( ω k ) must become less significant if the Fourier series in eq. (3) are the converge and the RWA is to remain valid. We selected an internal angle between the pump and probe incident beams, of θ 3 ° (0,0523599 radians) [14], given the very fast decay of the FWM signal intensity as the optical length increases. The parameters corresponding to a typical molecular system, i.e., the Malachite Green organic dye, were used to generate sensible realistic values for the calculations. For this well-known dye, the transition dipole moment in the adiabatic representation is μ b a = 2 , 81 × 10 18 e r g 1 / 2 c m 3 / 2 and the Bohr frequency is ω 0 = 3 , 06 × 10 15 s 1 [43]. In the same way, to establish a real comparison, we choose a defined optical length to study the nonlinear optical properties. We have centered this study on both the nonlinear optical properties and the intensity of the emerging signal from the FWM process. The profiles presented further obtained, obey an adiabatic representation of the intramolecular character at the crossing of harmonic curves of the considered states and an interaction with the solvent that shifts the natural Bohr frequency to a time-dependent and stochastic function.

3.1.1. Nonlinear Refraction Index

Figure 1 shows the general scattering profiles in the frequency space Δ 1 and Δ 2 at different values of the transverse relaxation time. It can be noted that an increase in this parameter, in addition to changing the shape of the surface, causes the extreme values of this property to become increasingly distant from the refractive index of water ( η 0 = 1.3333 ), which is used as a solvent. We have assumed in these cases that all other variables such as saturation, propagation, longitudinal relaxation time, chemical concentration, vibronic coupling, angle of incidence between the beams, and coupling parameters with the thermal bath, remain constant.
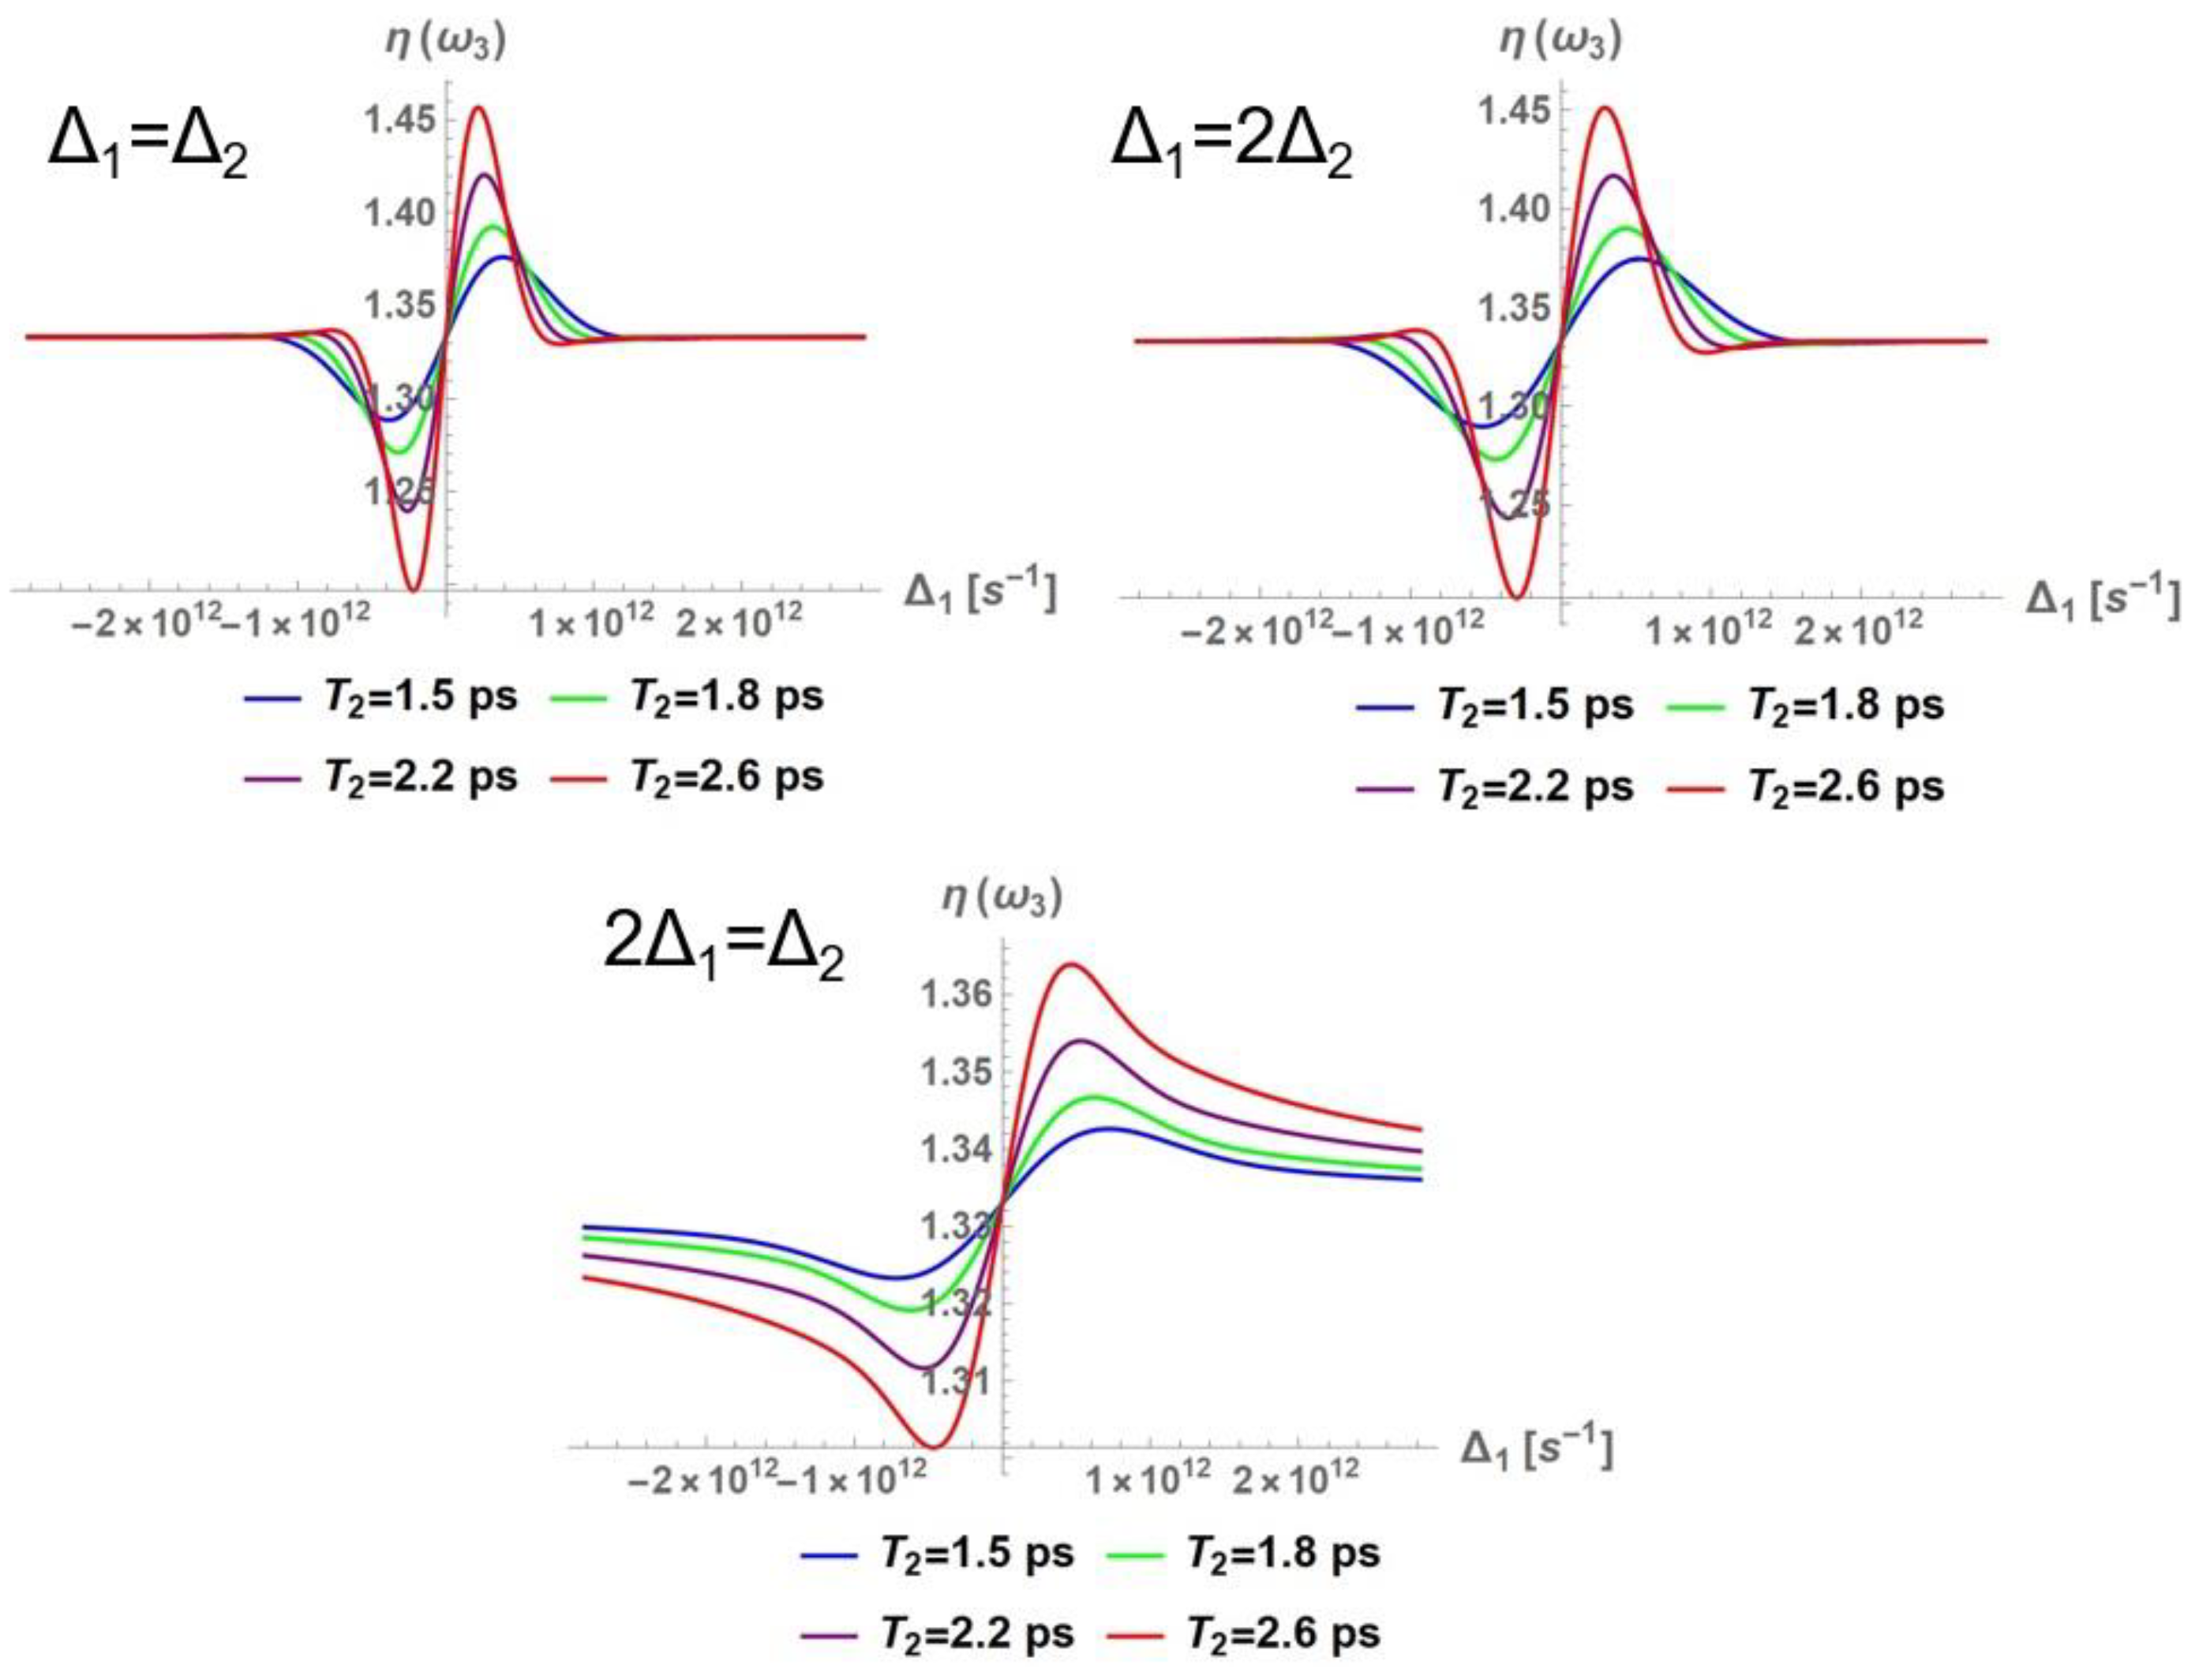
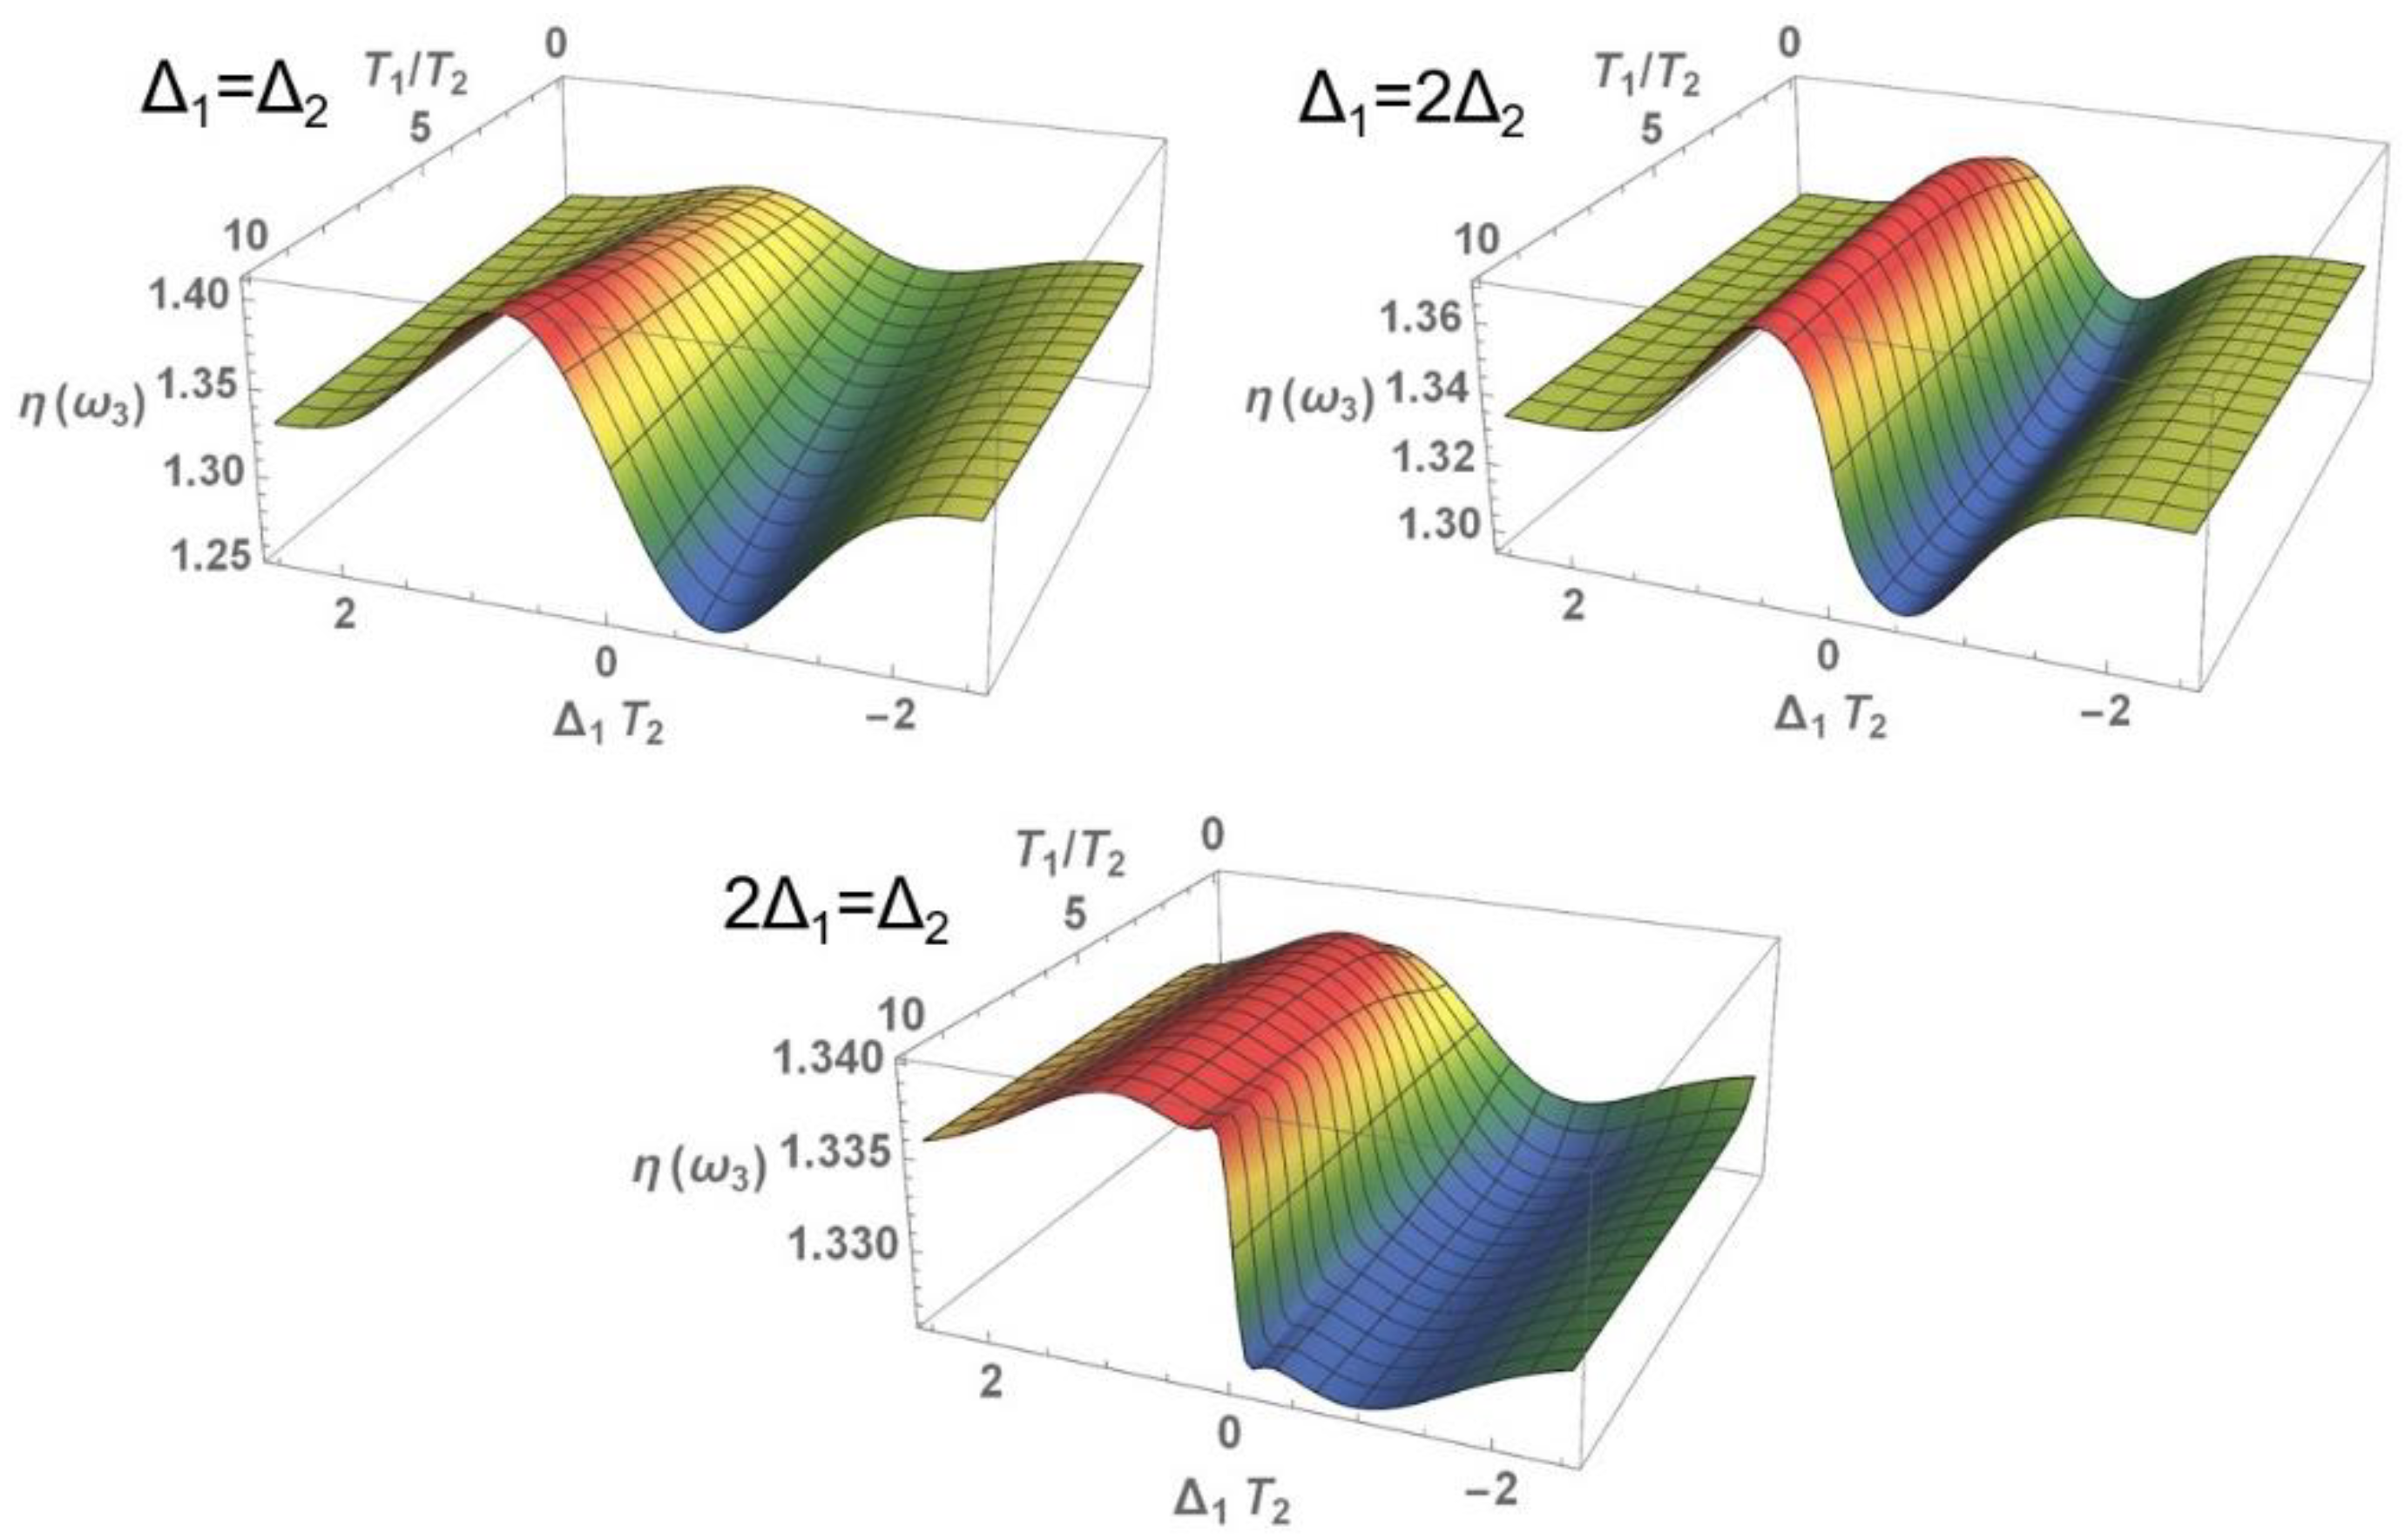
Figure 2 shows cross sections of the nonlinear refractive index for different ratios between the frequencies Δ 1 and Δ 2 at different times T 2 , showing that the increase of this molecular parameter, in addition to shifting them vertically, also produces a horizontal shift of the maxima and minima towards the vertical axis, thus narrowing the dispersion curves. It is also worth mentioning that this effect is slightly larger for the case of Δ 1 = 2 Δ 2 and considerably smaller when 2 Δ 1 = Δ 2 . To evaluate the maximum contrast in the refractive index, we select the parameter where there is the highest maximum of the positive and negative sides Δ 1 and evaluate the quantity: β ( ε ) = Δ η Δ 1 = 2 Δ 2 / Δ η Δ 2 = 2 Δ 1 , which ε indicates the parameter being studied. Selecting T 2 = 2.6 p s , the result is β ( T 2 ) = 4.7 . That is, the variations in the refractive index for this T 2 are 4.7 times in the process Δ 1 = 2 Δ 2 than those reached in the same conditions when the process is Δ 2 = 2 Δ 1 . In the latter case, the frequency of the generated signal beam coincides with the natural frequency of the system, so the absorption is considerably increased and hence the dispersion is reduced. In general, this turns out to be true for all subsequent analyses. In the processes Δ 1 = Δ 2 and Δ 1 = 2 Δ 2 we observe rapid decay until the value of the refractive index of water is reached.
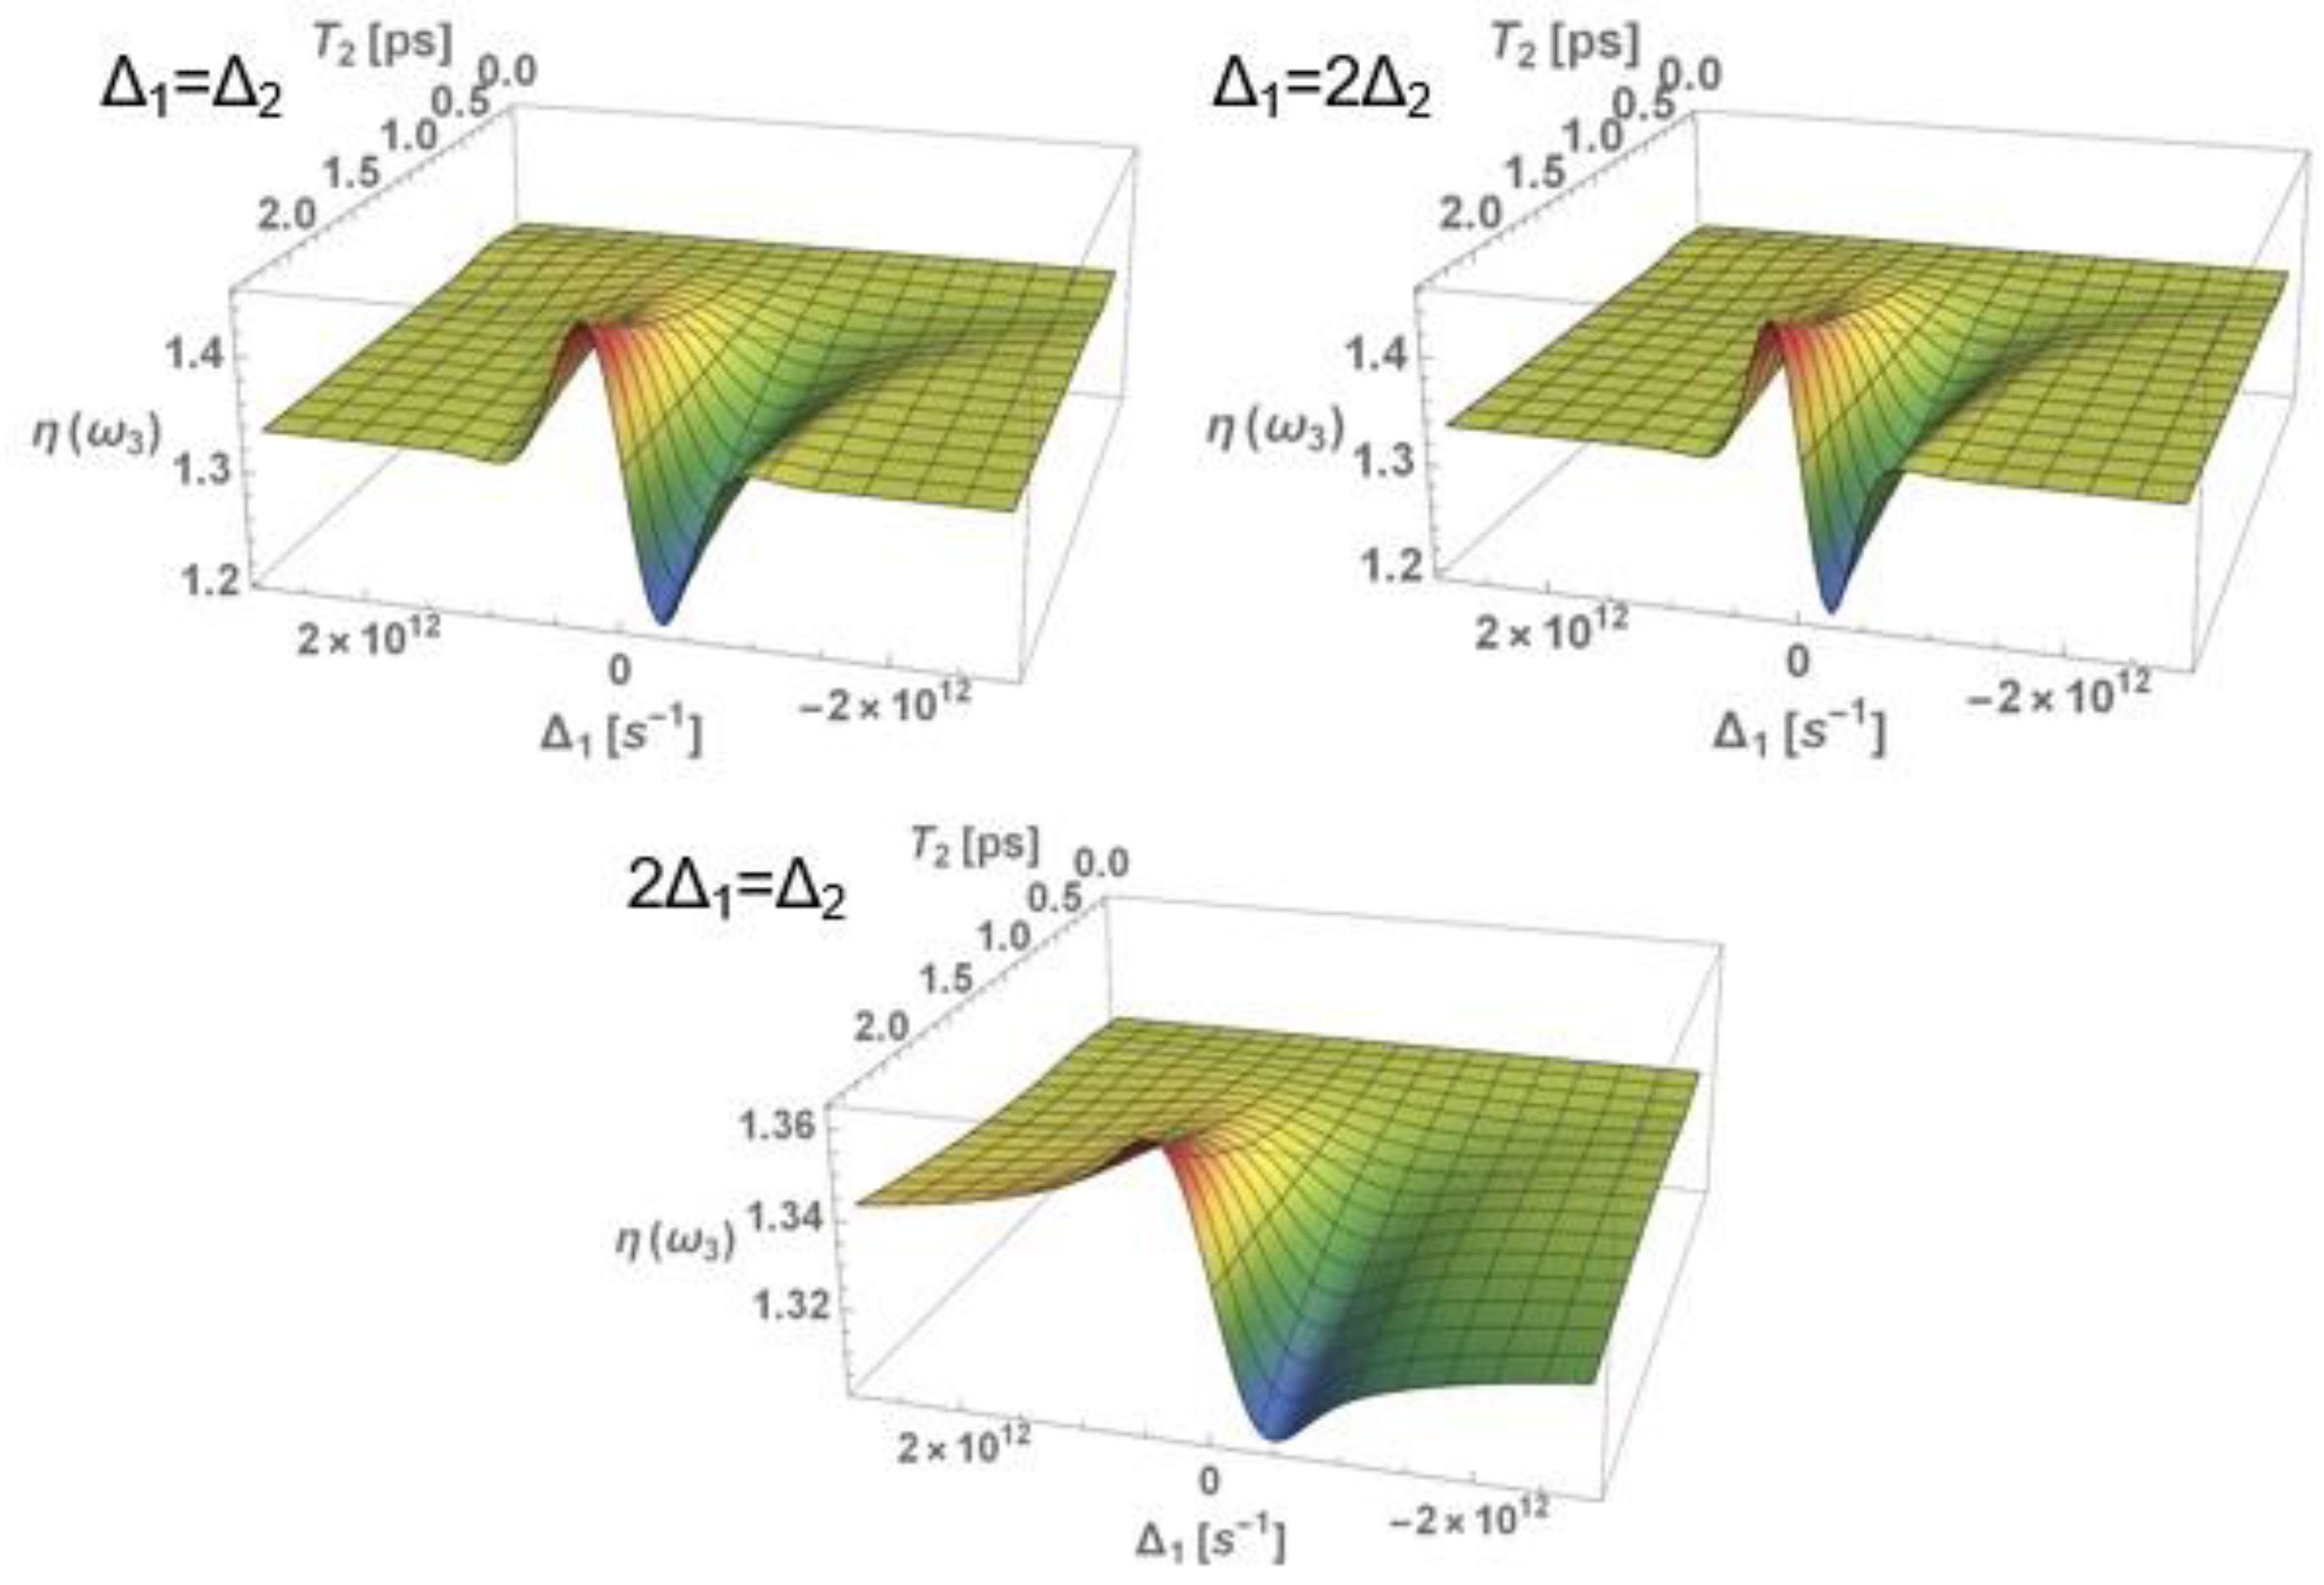
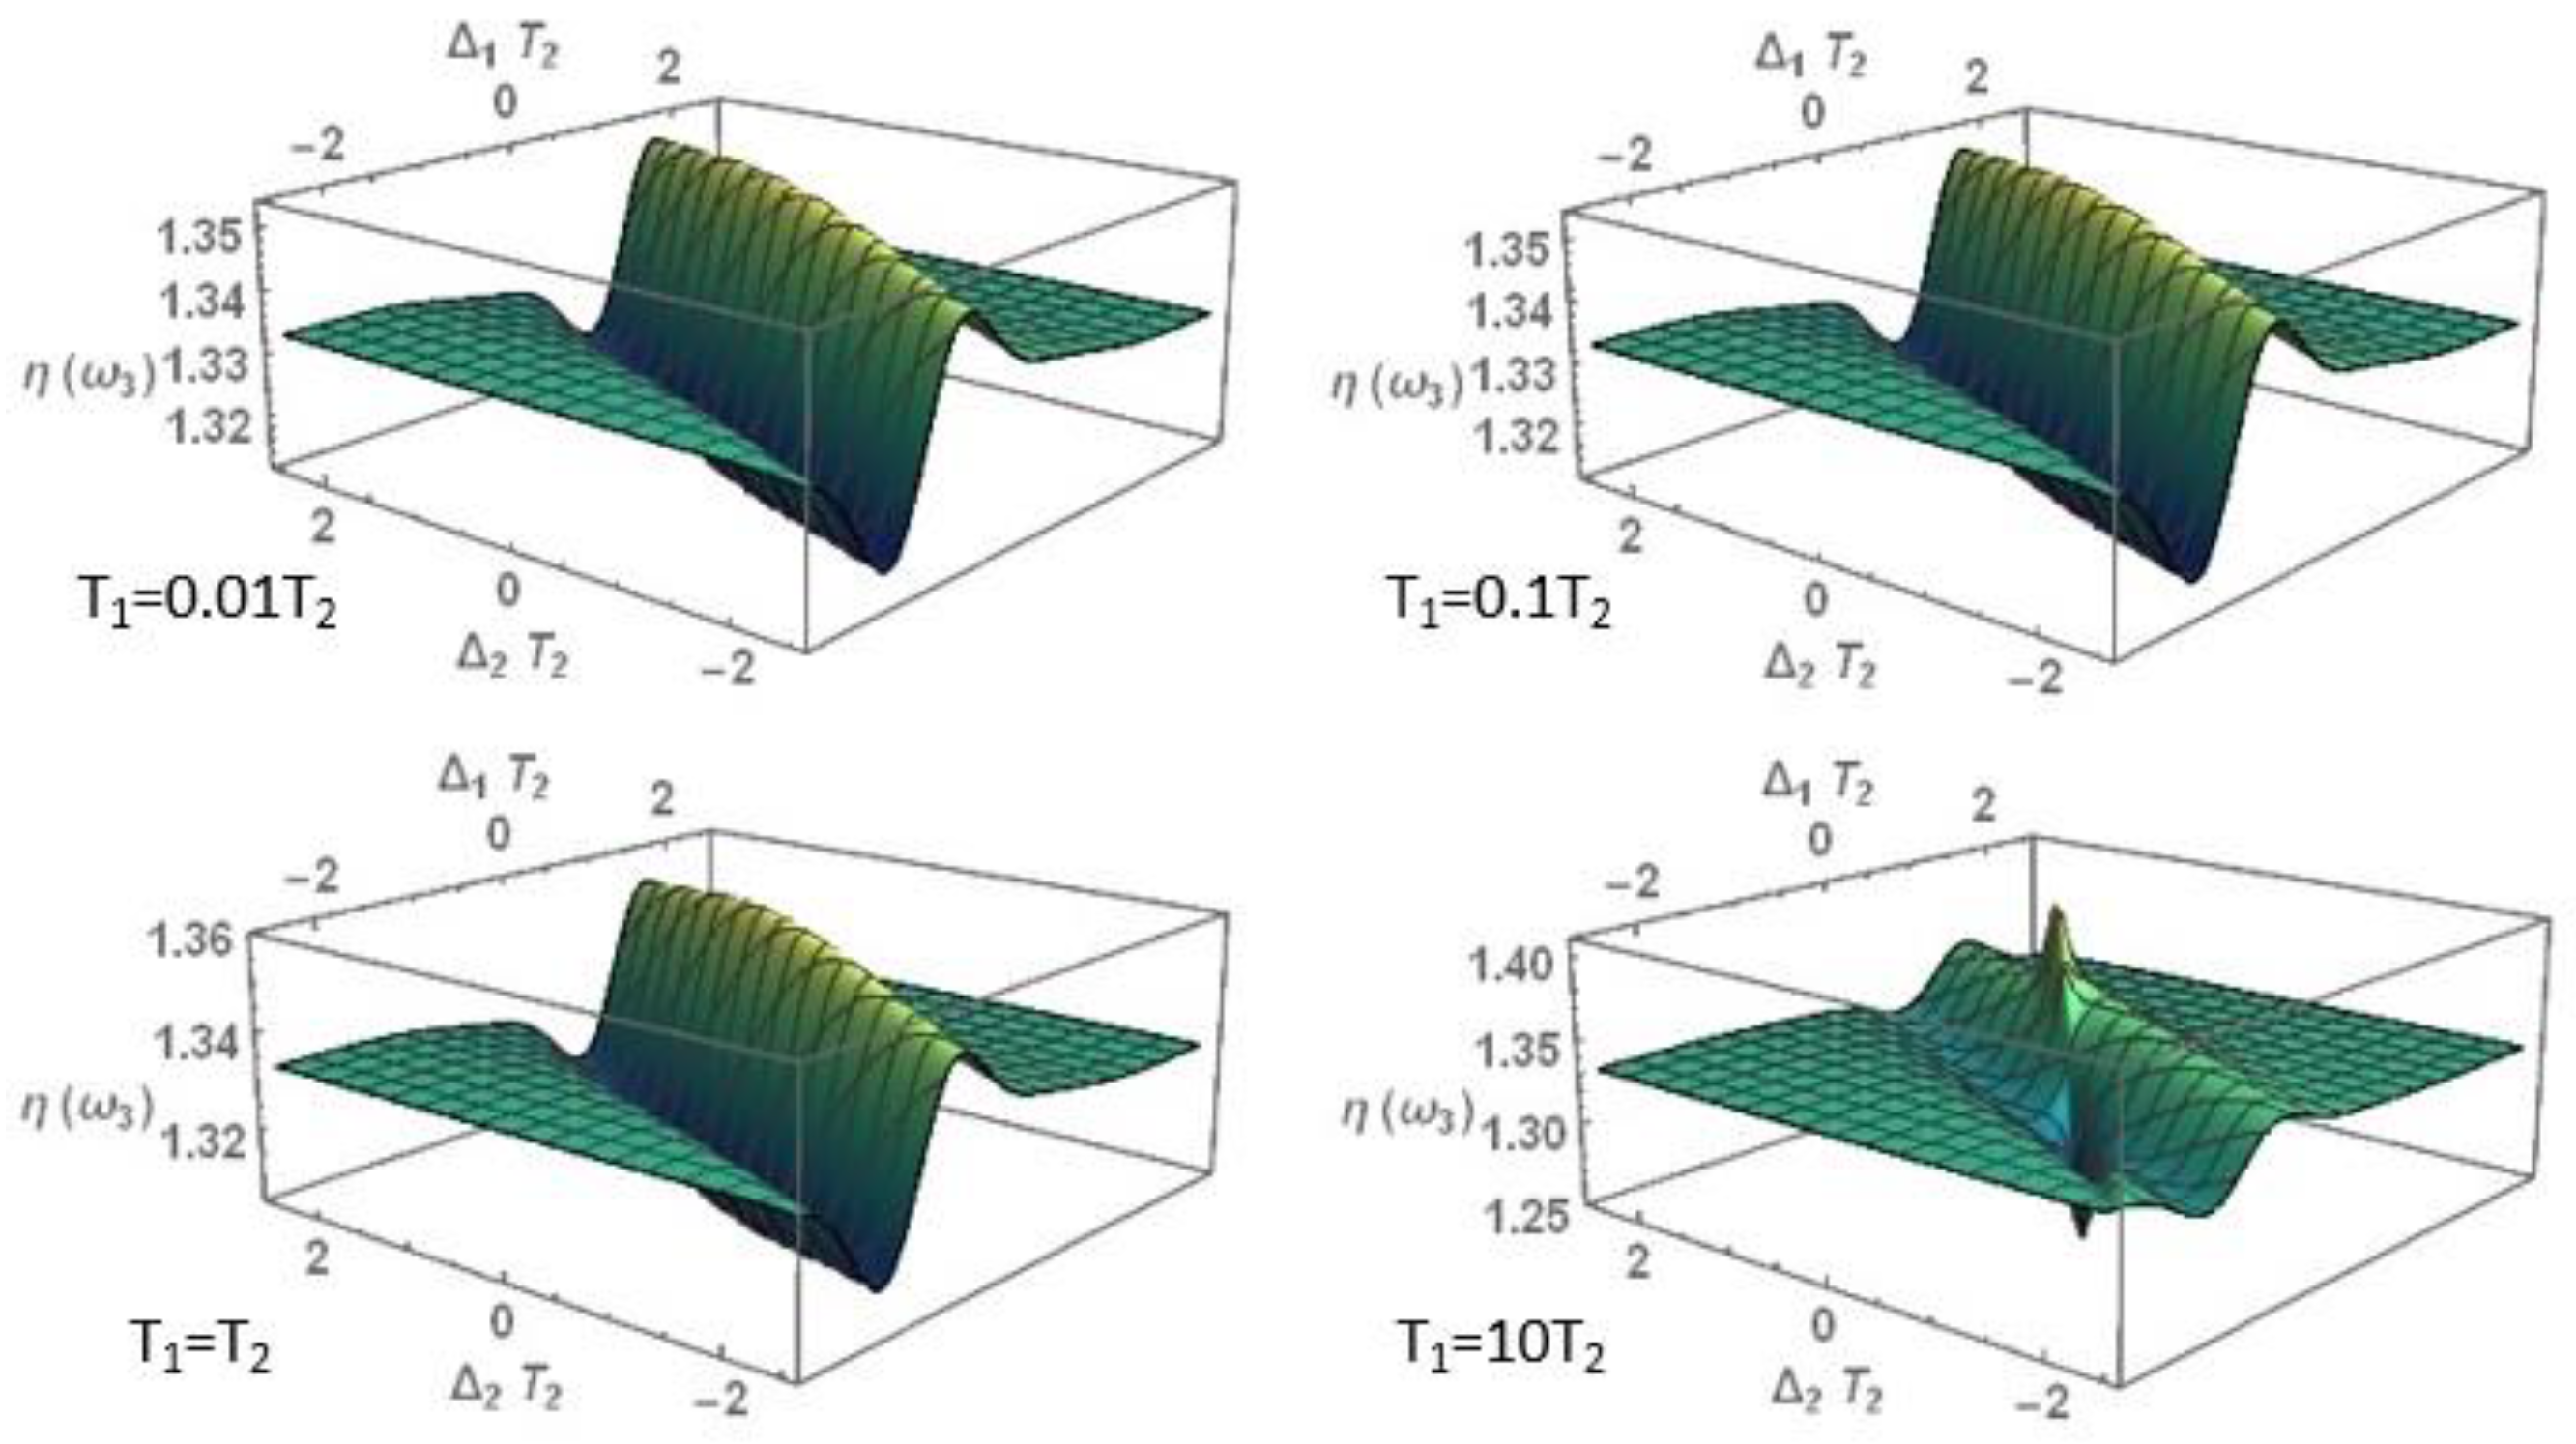
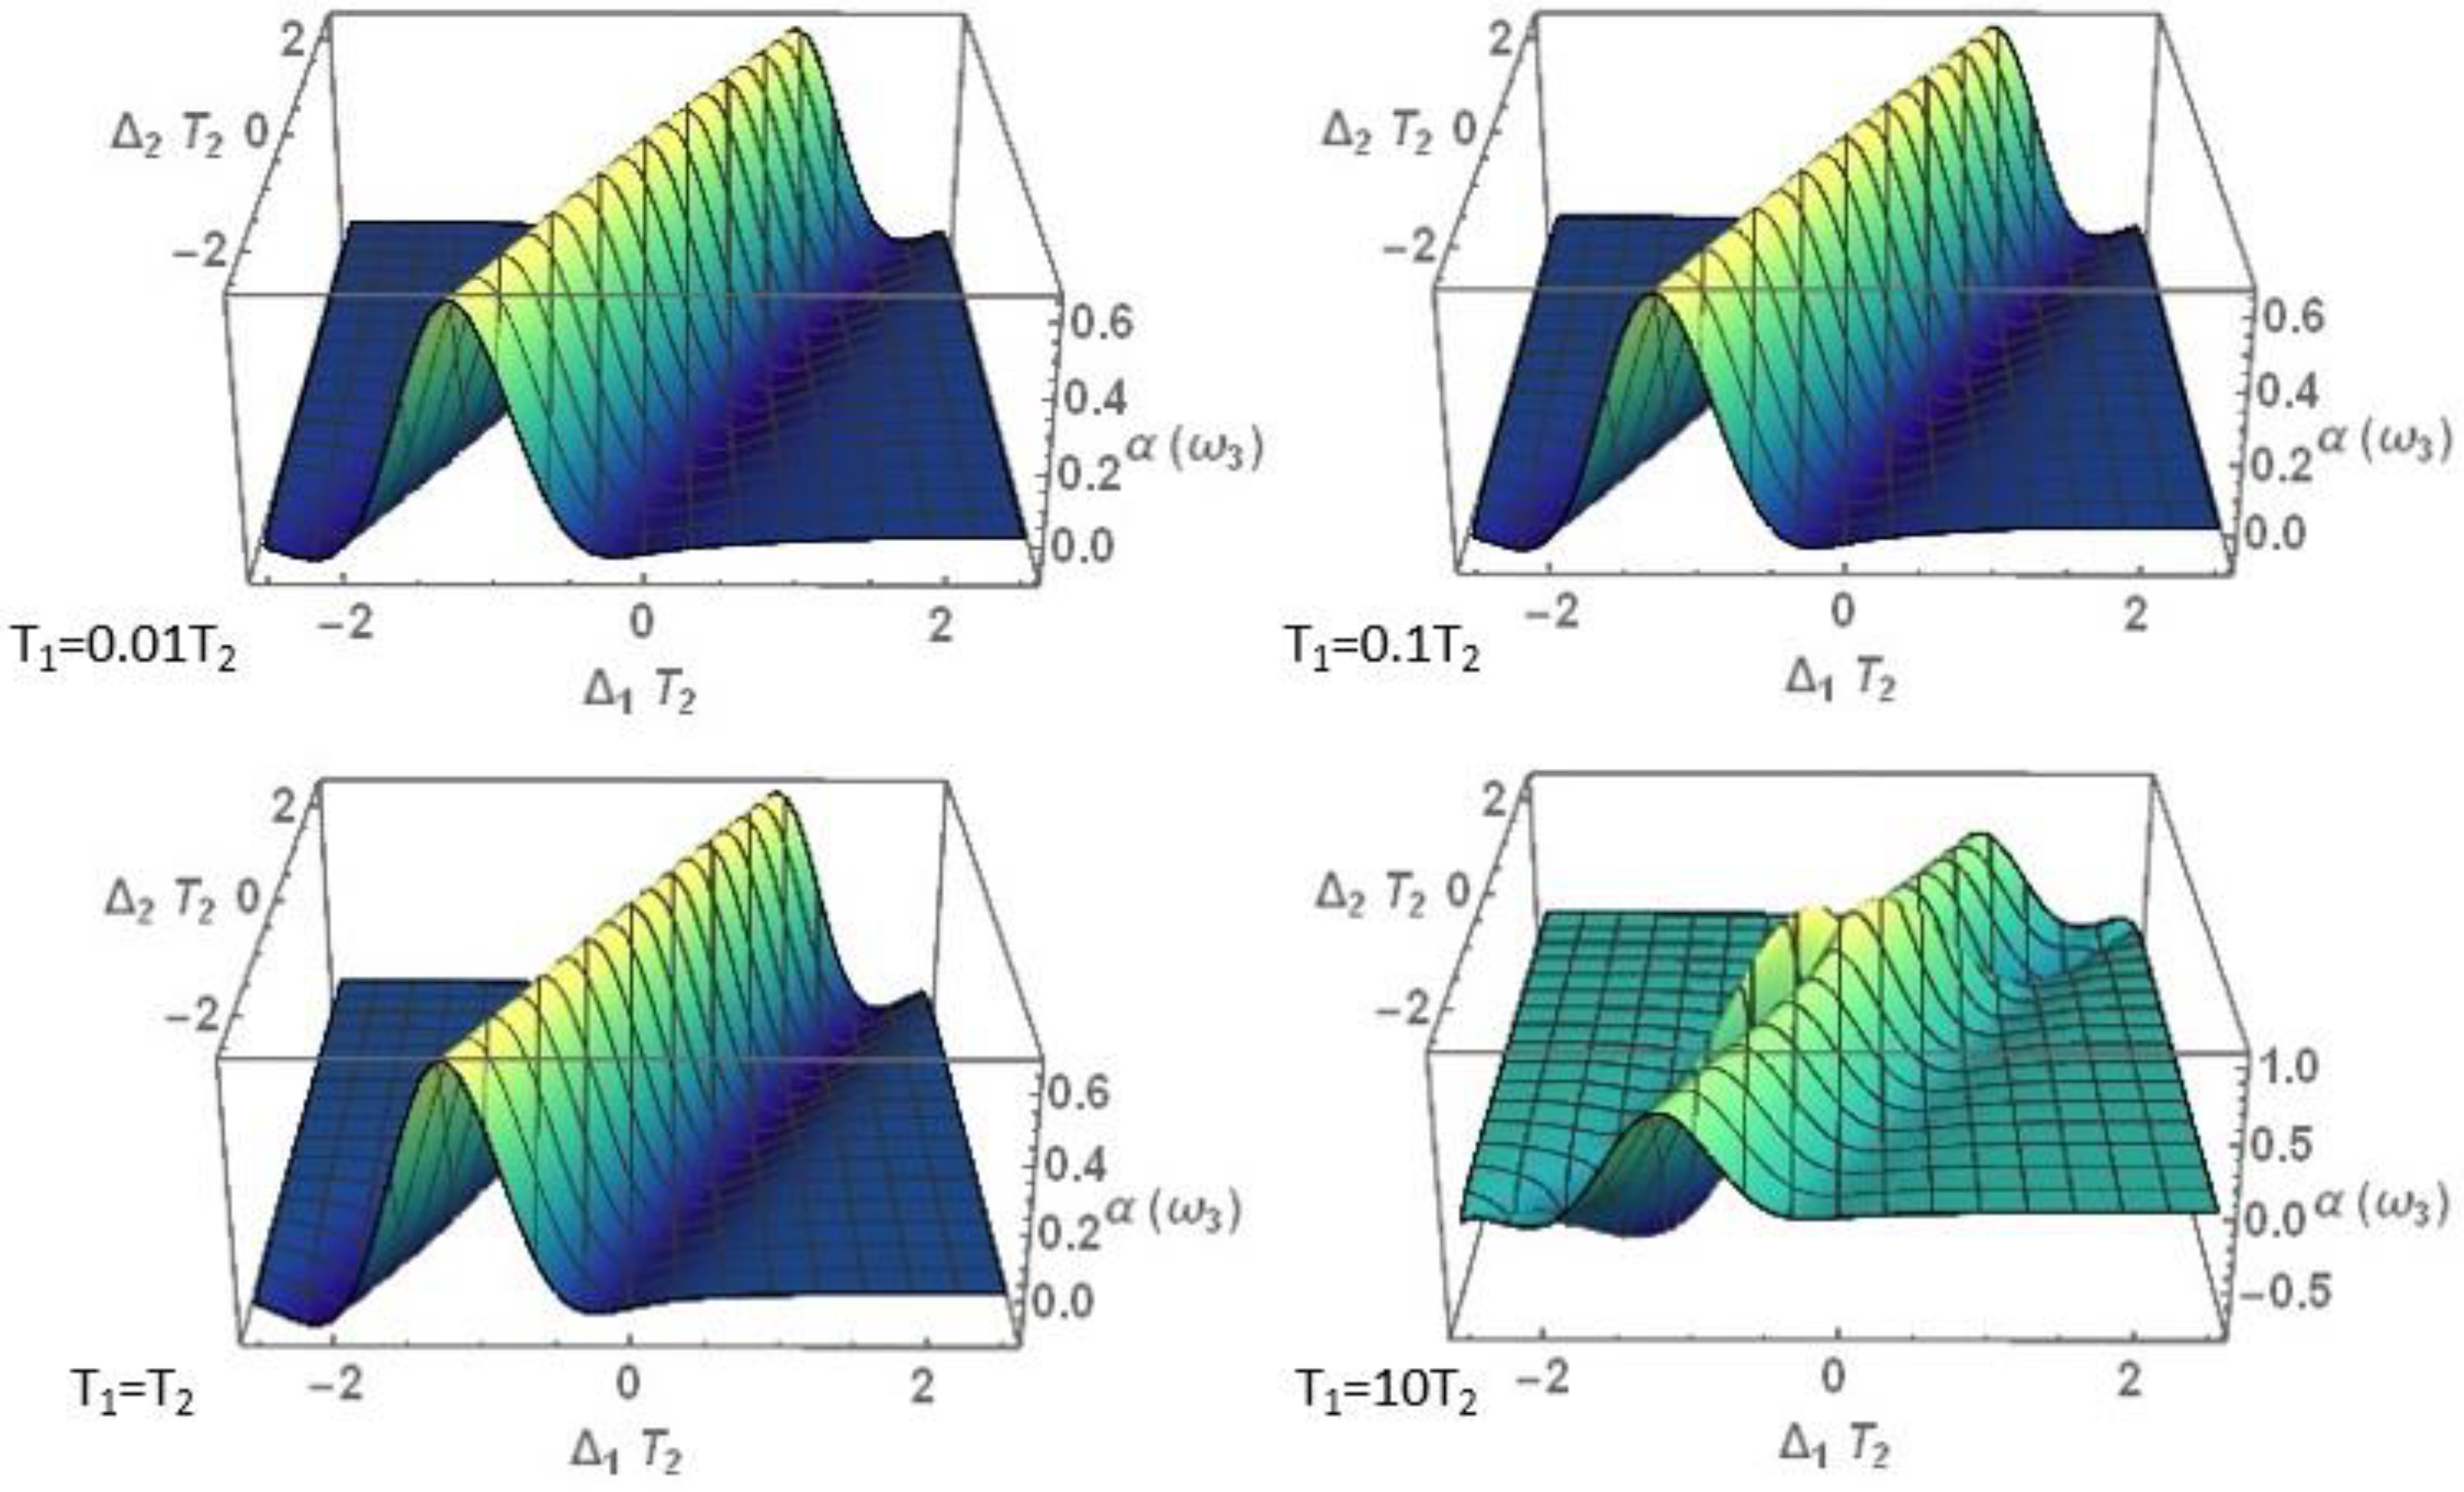
In Figure 3 the behavior of the dispersion curves can be corroborated by a continuous variation of the T 2 time. Since the transverse relaxation time is the time in which the molecular system loses the coherence of the induced electric dipoles; a longer delay in the loss of coherence implies a longer persistence of the induced polarization; which results in a higher scattering capacity of the beam. Figure 4 shows the overall scattering profiles in the frequency space Δ 1 and Δ 2 at different ratios between the longitudinal relaxation times T 1 and transverse relaxation times T 2 . On the surfaces it can be noted that the most significant change is observed for when T 1 = 10 T 2 , there is a noticeable difference along the plane Δ 1 = Δ 2 and its surroundings
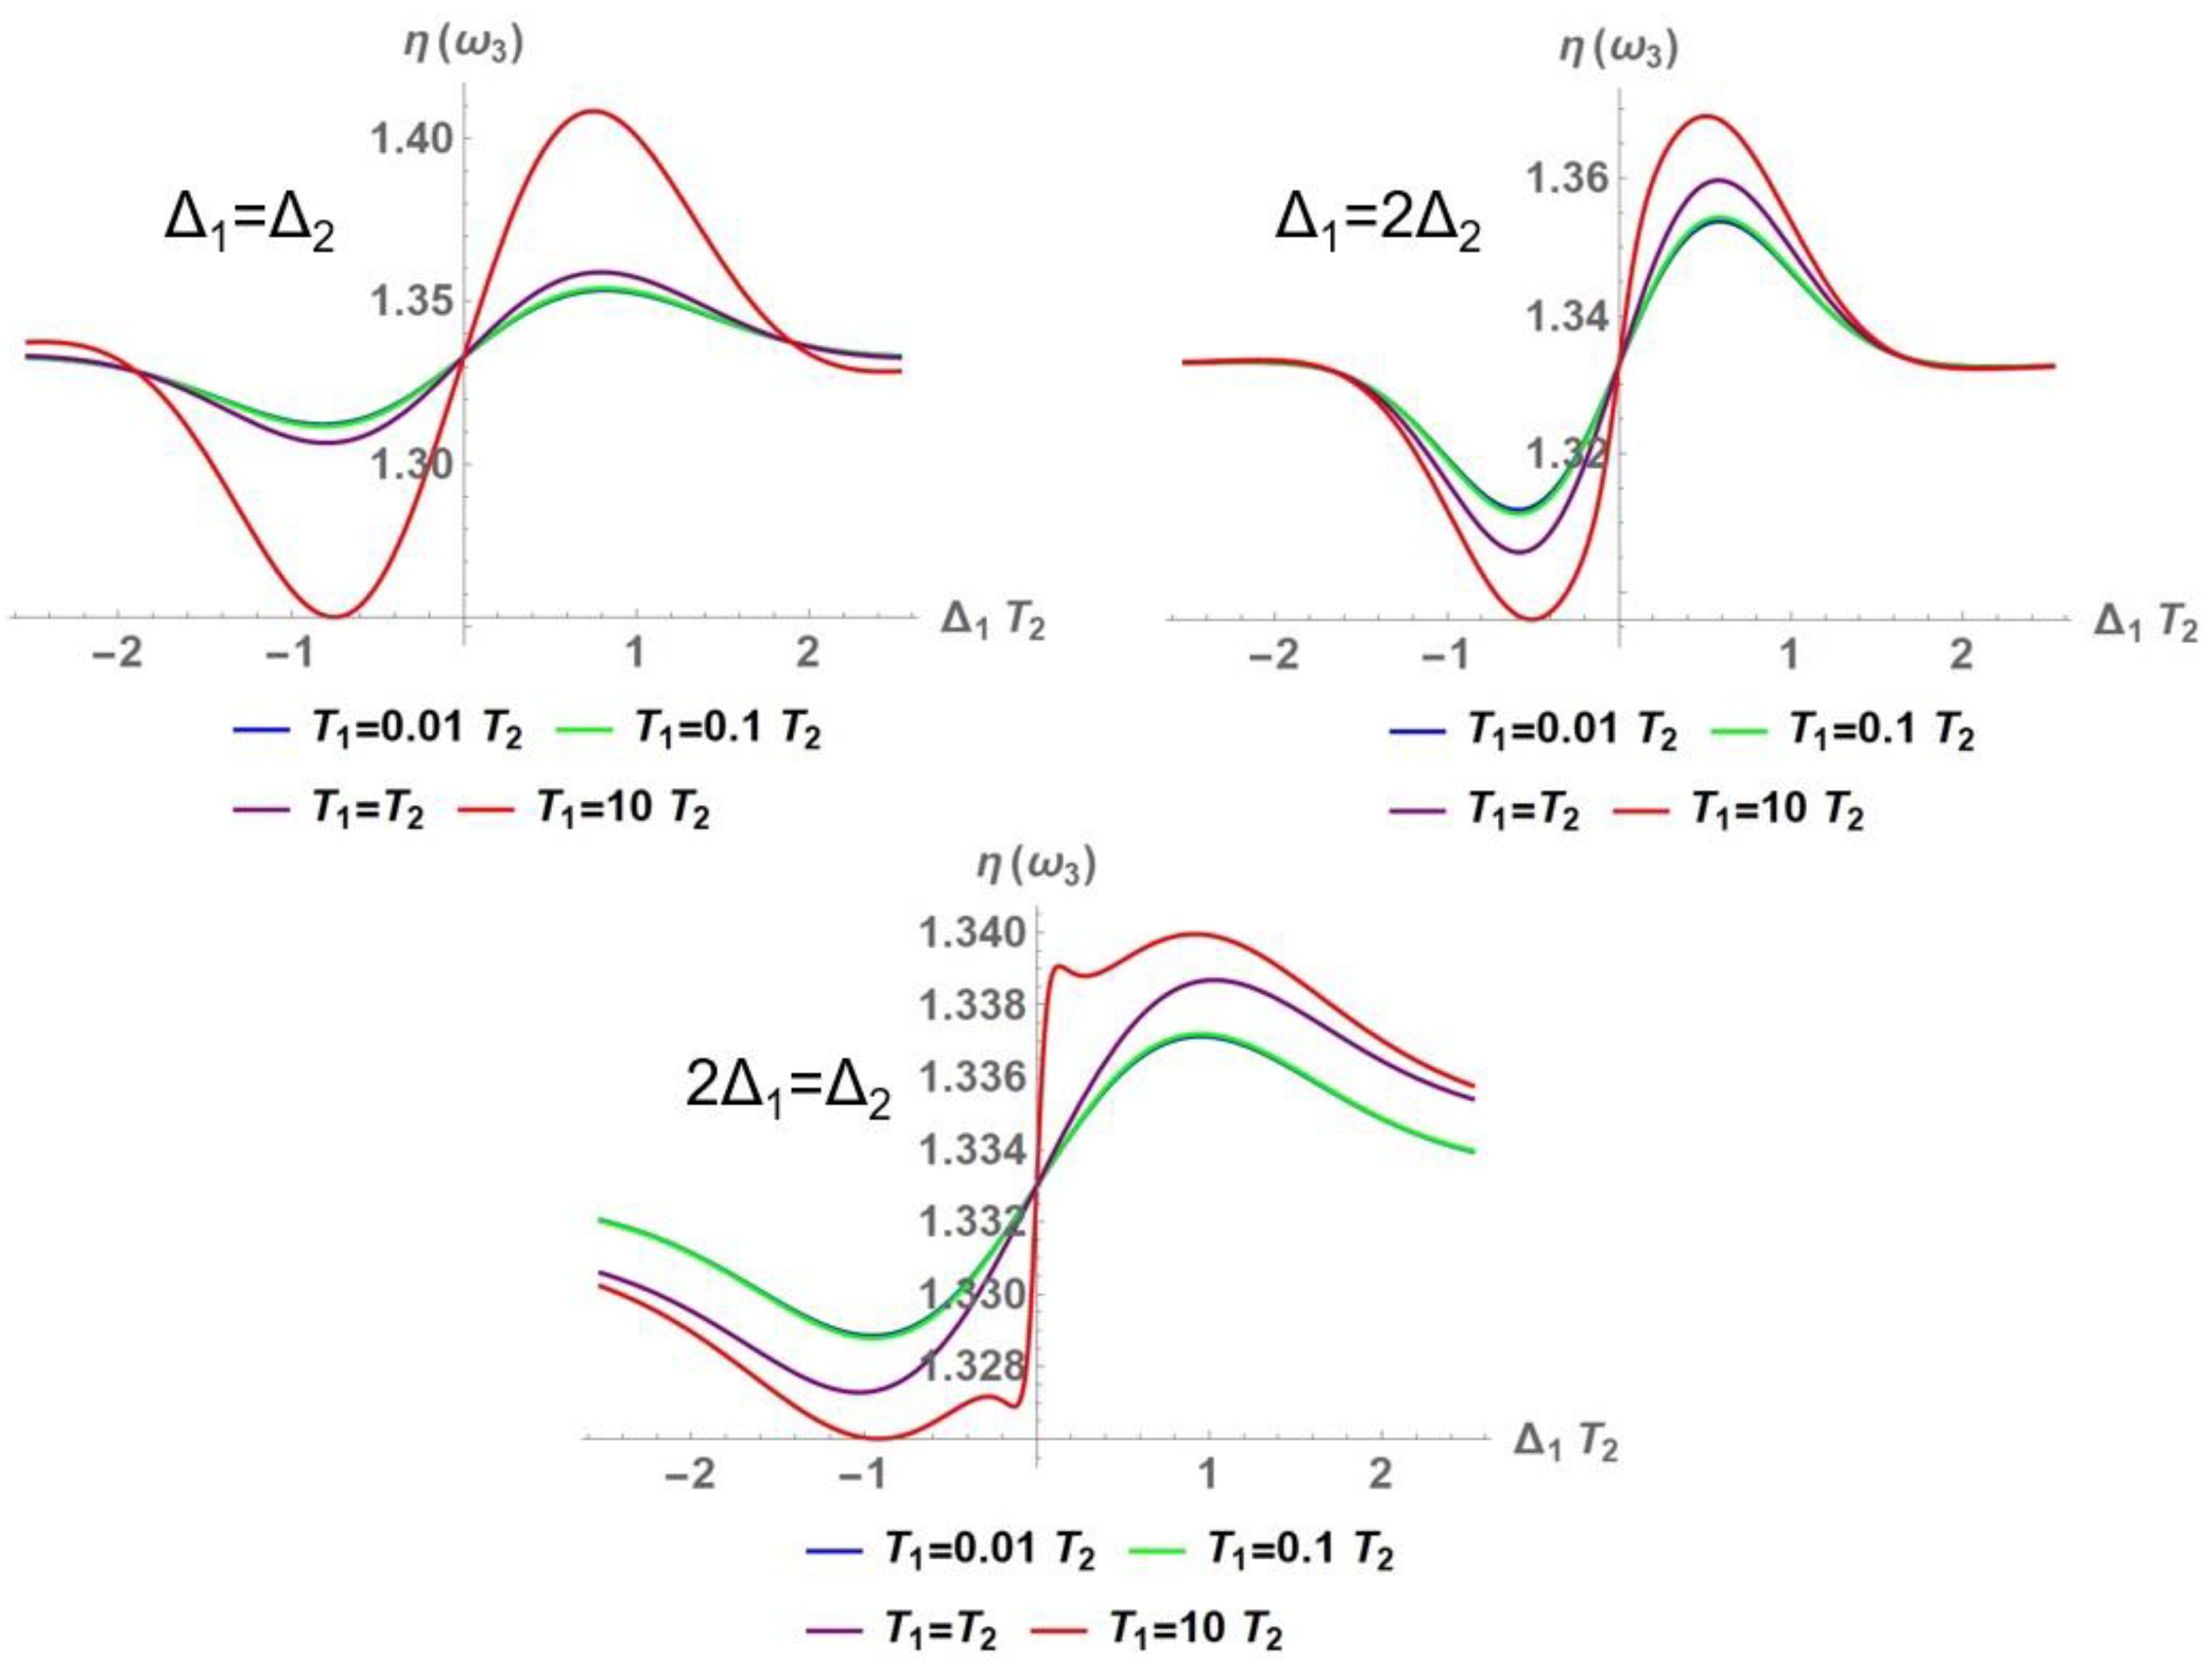
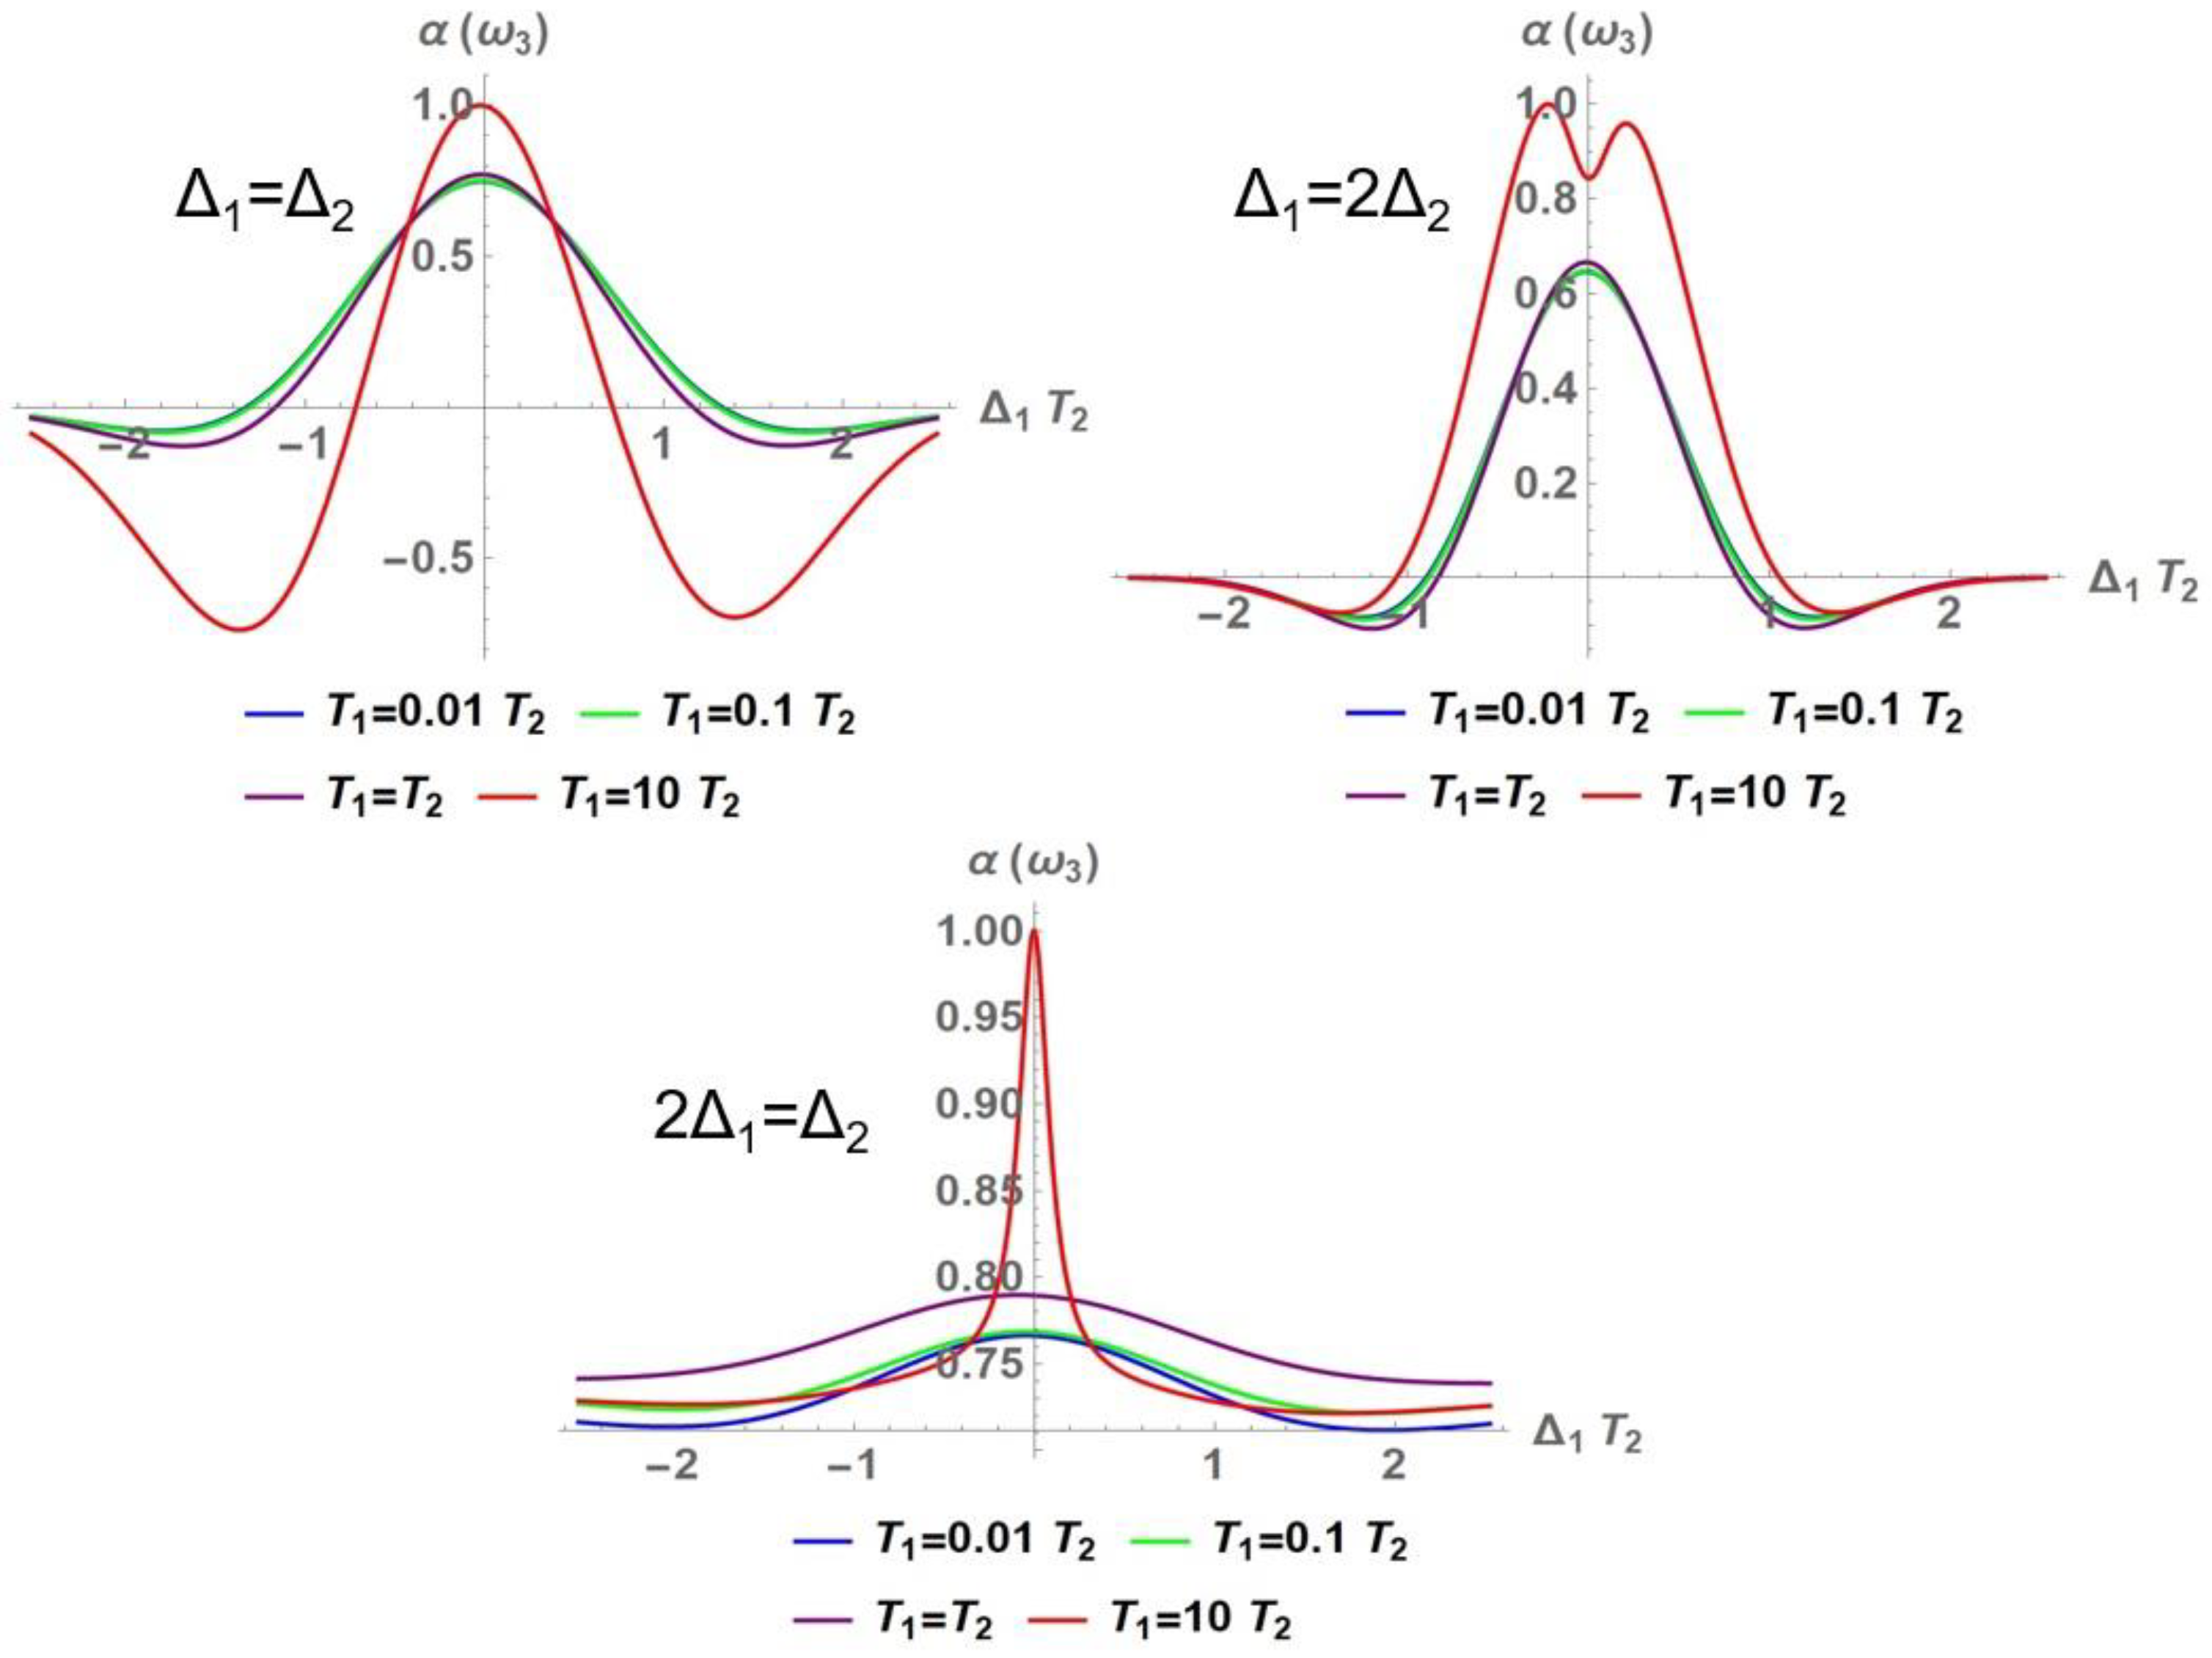
The aforementioned can be corroborated by visualizing in Figure 5 the cross sections of the surface at the considered ratios between Δ 1 and Δ 2 : the maximum and minimum values reached by the dispersion differ considerably between the first and second case. In the resonance case, T 1 = 10 T 2 a very accelerated variation in the dispersion of the generated signal beam is observed when the detuning of the pumping and test beam are close to zero. This latter fact of an abrupt change in the refractive index at a minimum change in the pumping beam detuning is remarkable. However, it is possible to observe that it is fulfilled: β ( T 1 / T 2 ) 7 in cases where T 1 = 10 T 2 .
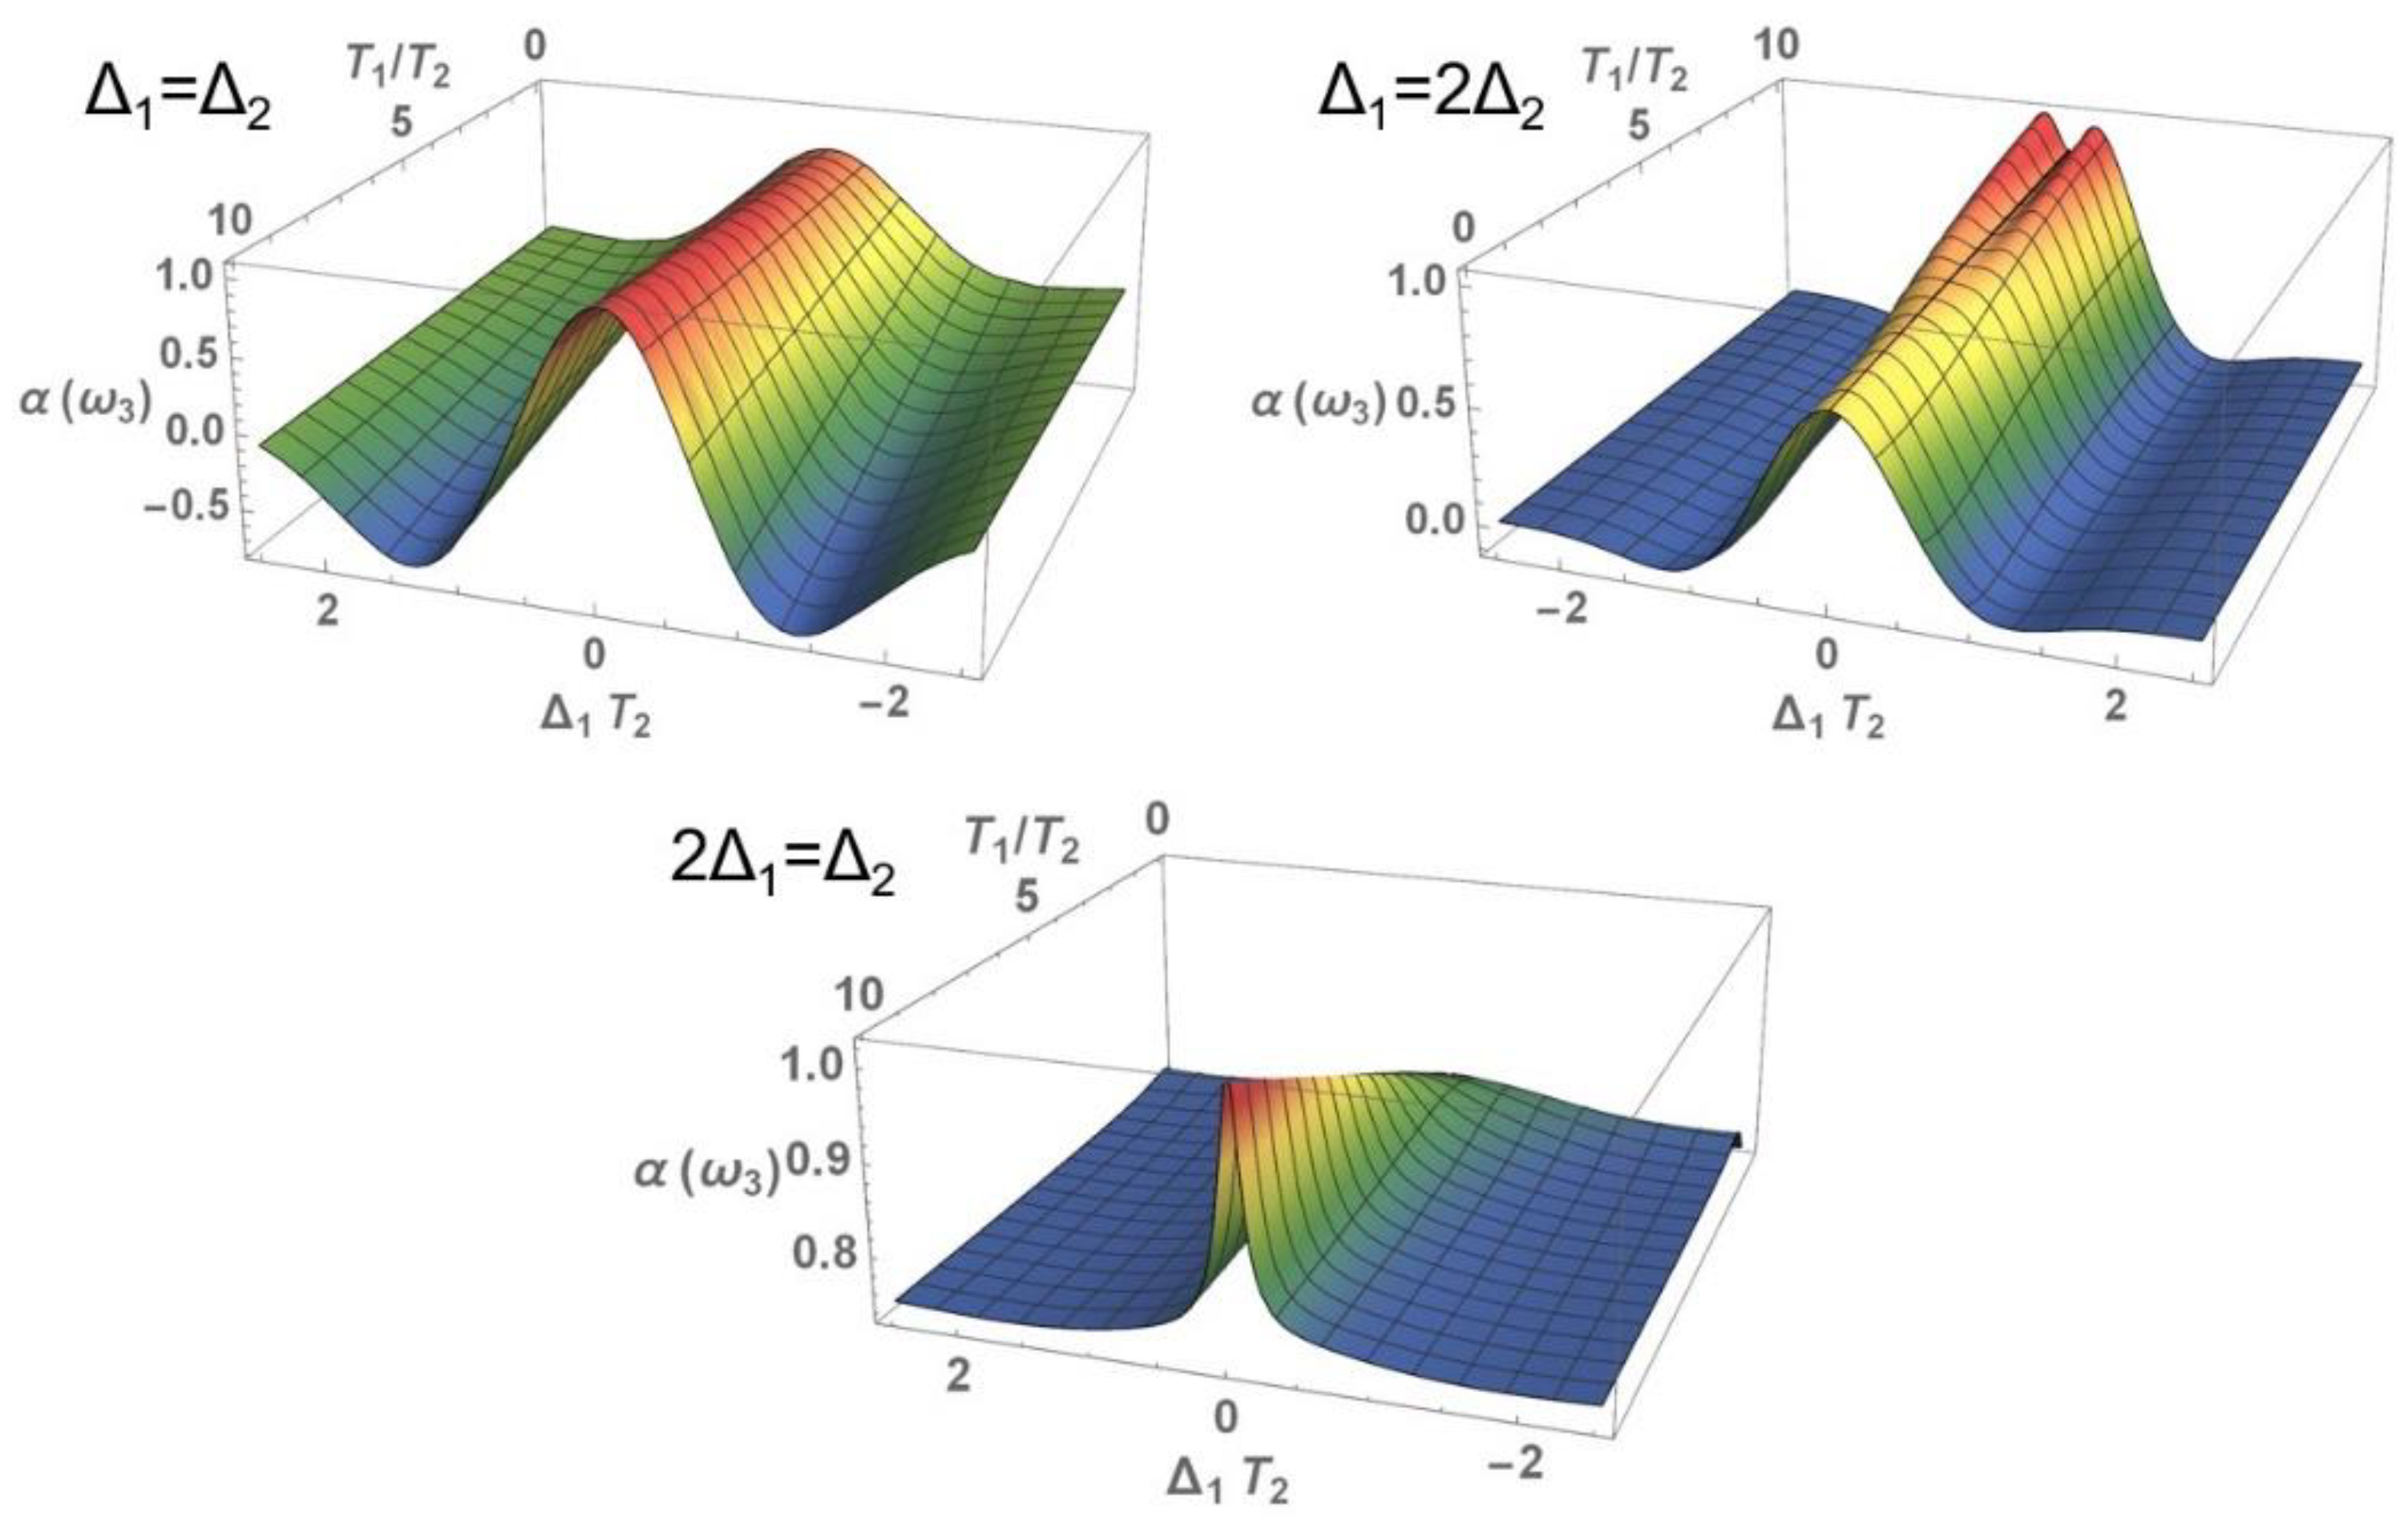
Figure 6 plots these changes by continuously varying the ratio between when T 1 and T 2 . A higher ratio between these two relaxation times implies, as has been shown, an increase in signal beam dispersion. This longitudinal component is the time it takes for the molecular system to reach thermodynamic equilibrium once its excitation by the electromagnetic field has stopped, so if this time is longer T 2 (as is normally the case) the system will take longer to reach equilibrium and may scatter more light. It is possible to observe that the refractive index shows a higher contrast just at the resonance process ω 3 with the Bohr frequency of the coupled states ( ω ˜ 0 ). Although the intensity differences are not very high, however, this fact of abrupt change can be used as a sensor generation mechanism, since it changes rapidly with small variations in the pumping detuning.
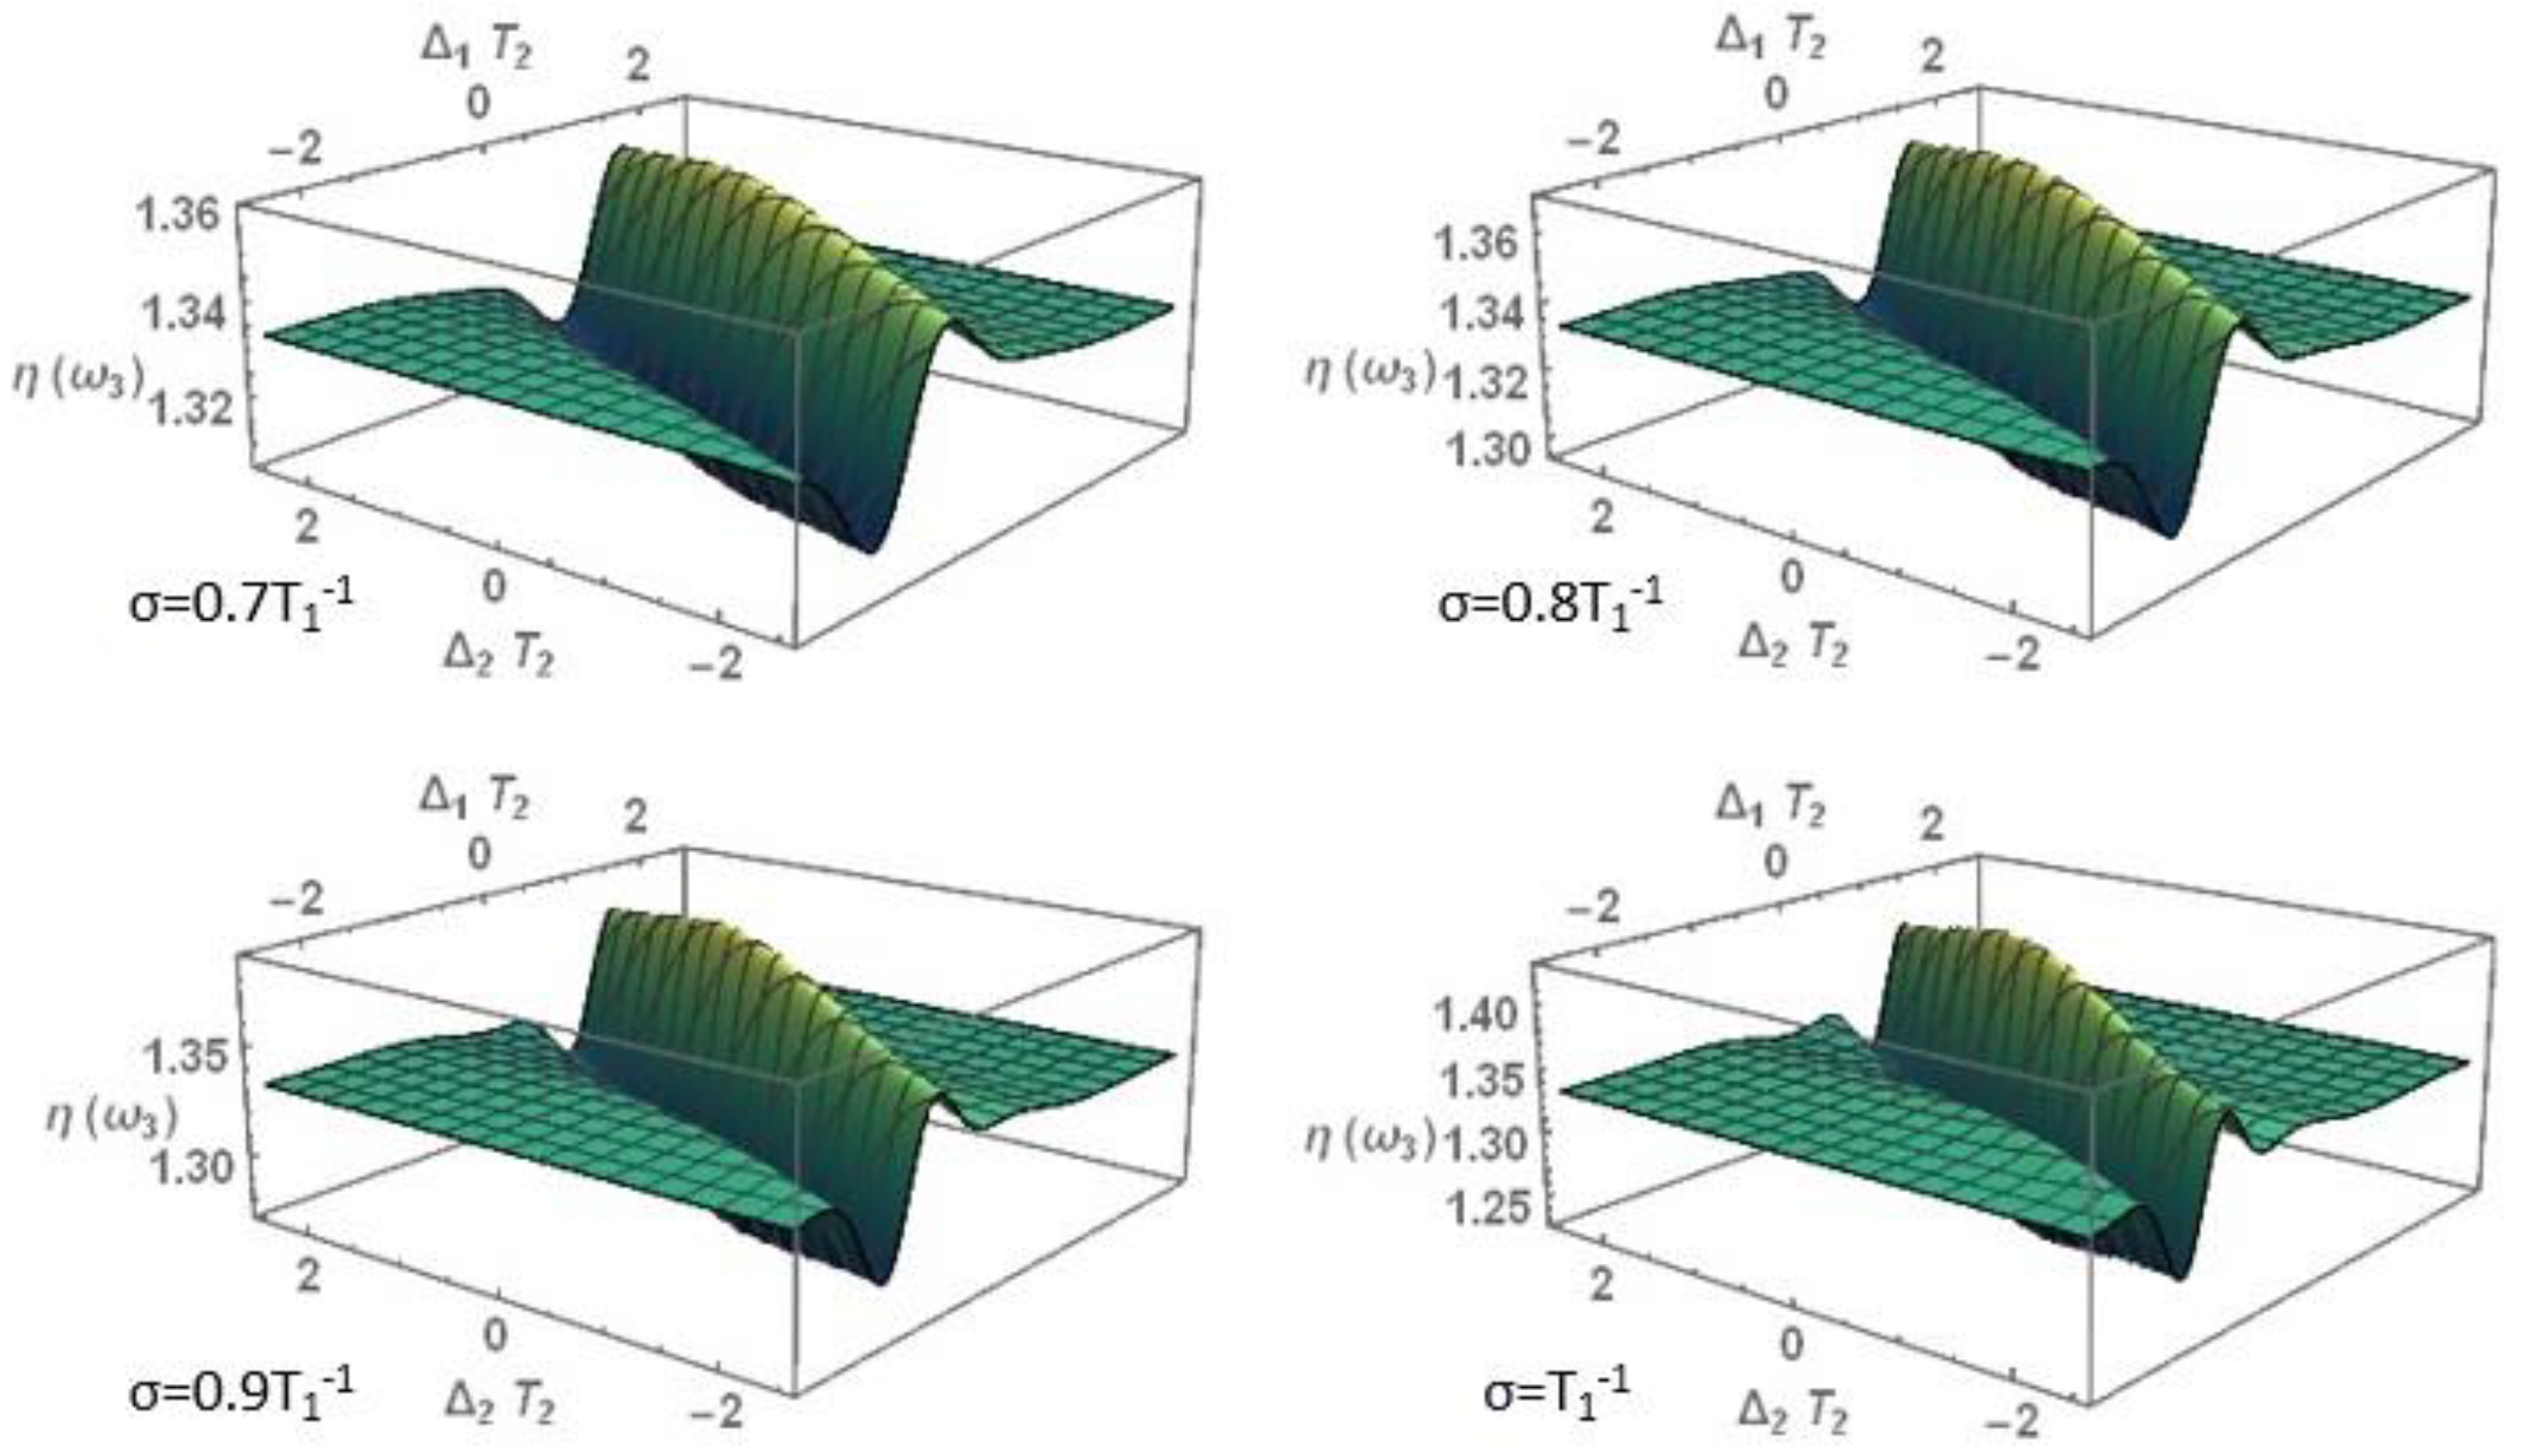
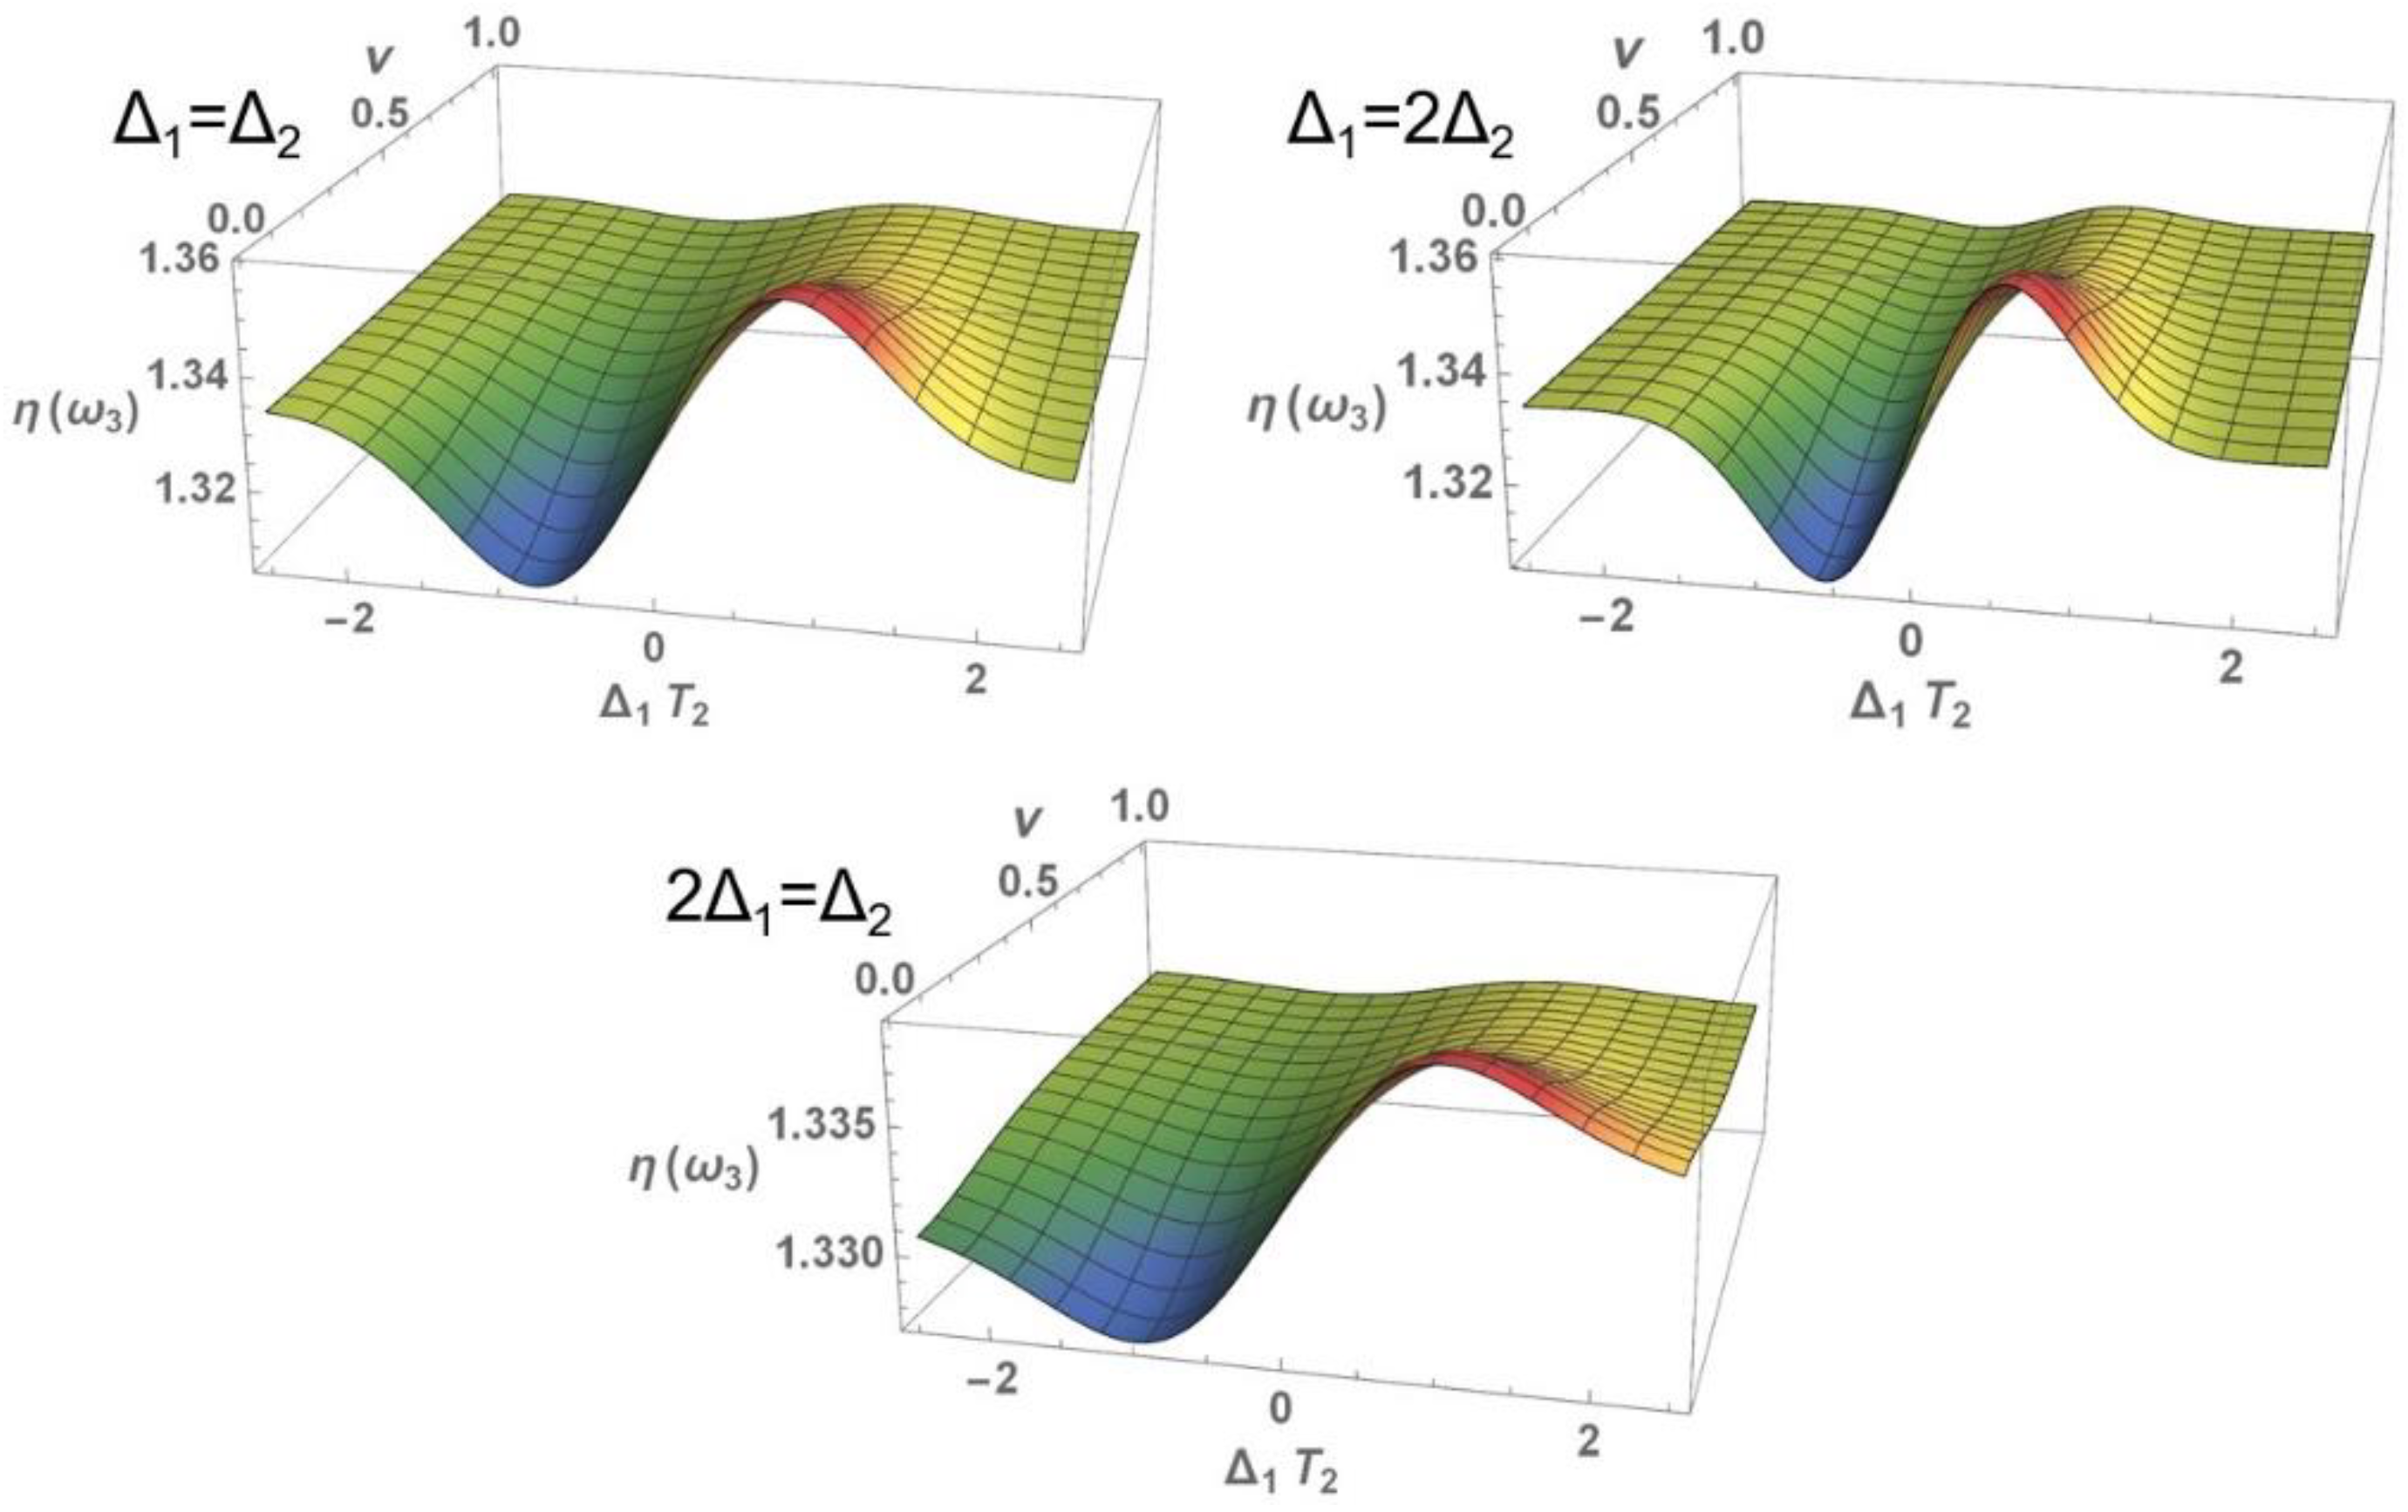
Figure 7 shows the general surfaces of the nonlinear refractive index in the frequency space Δ 1 and Δ 2 at different coupling factors between the molecular system under study and the thermal reservoir used.
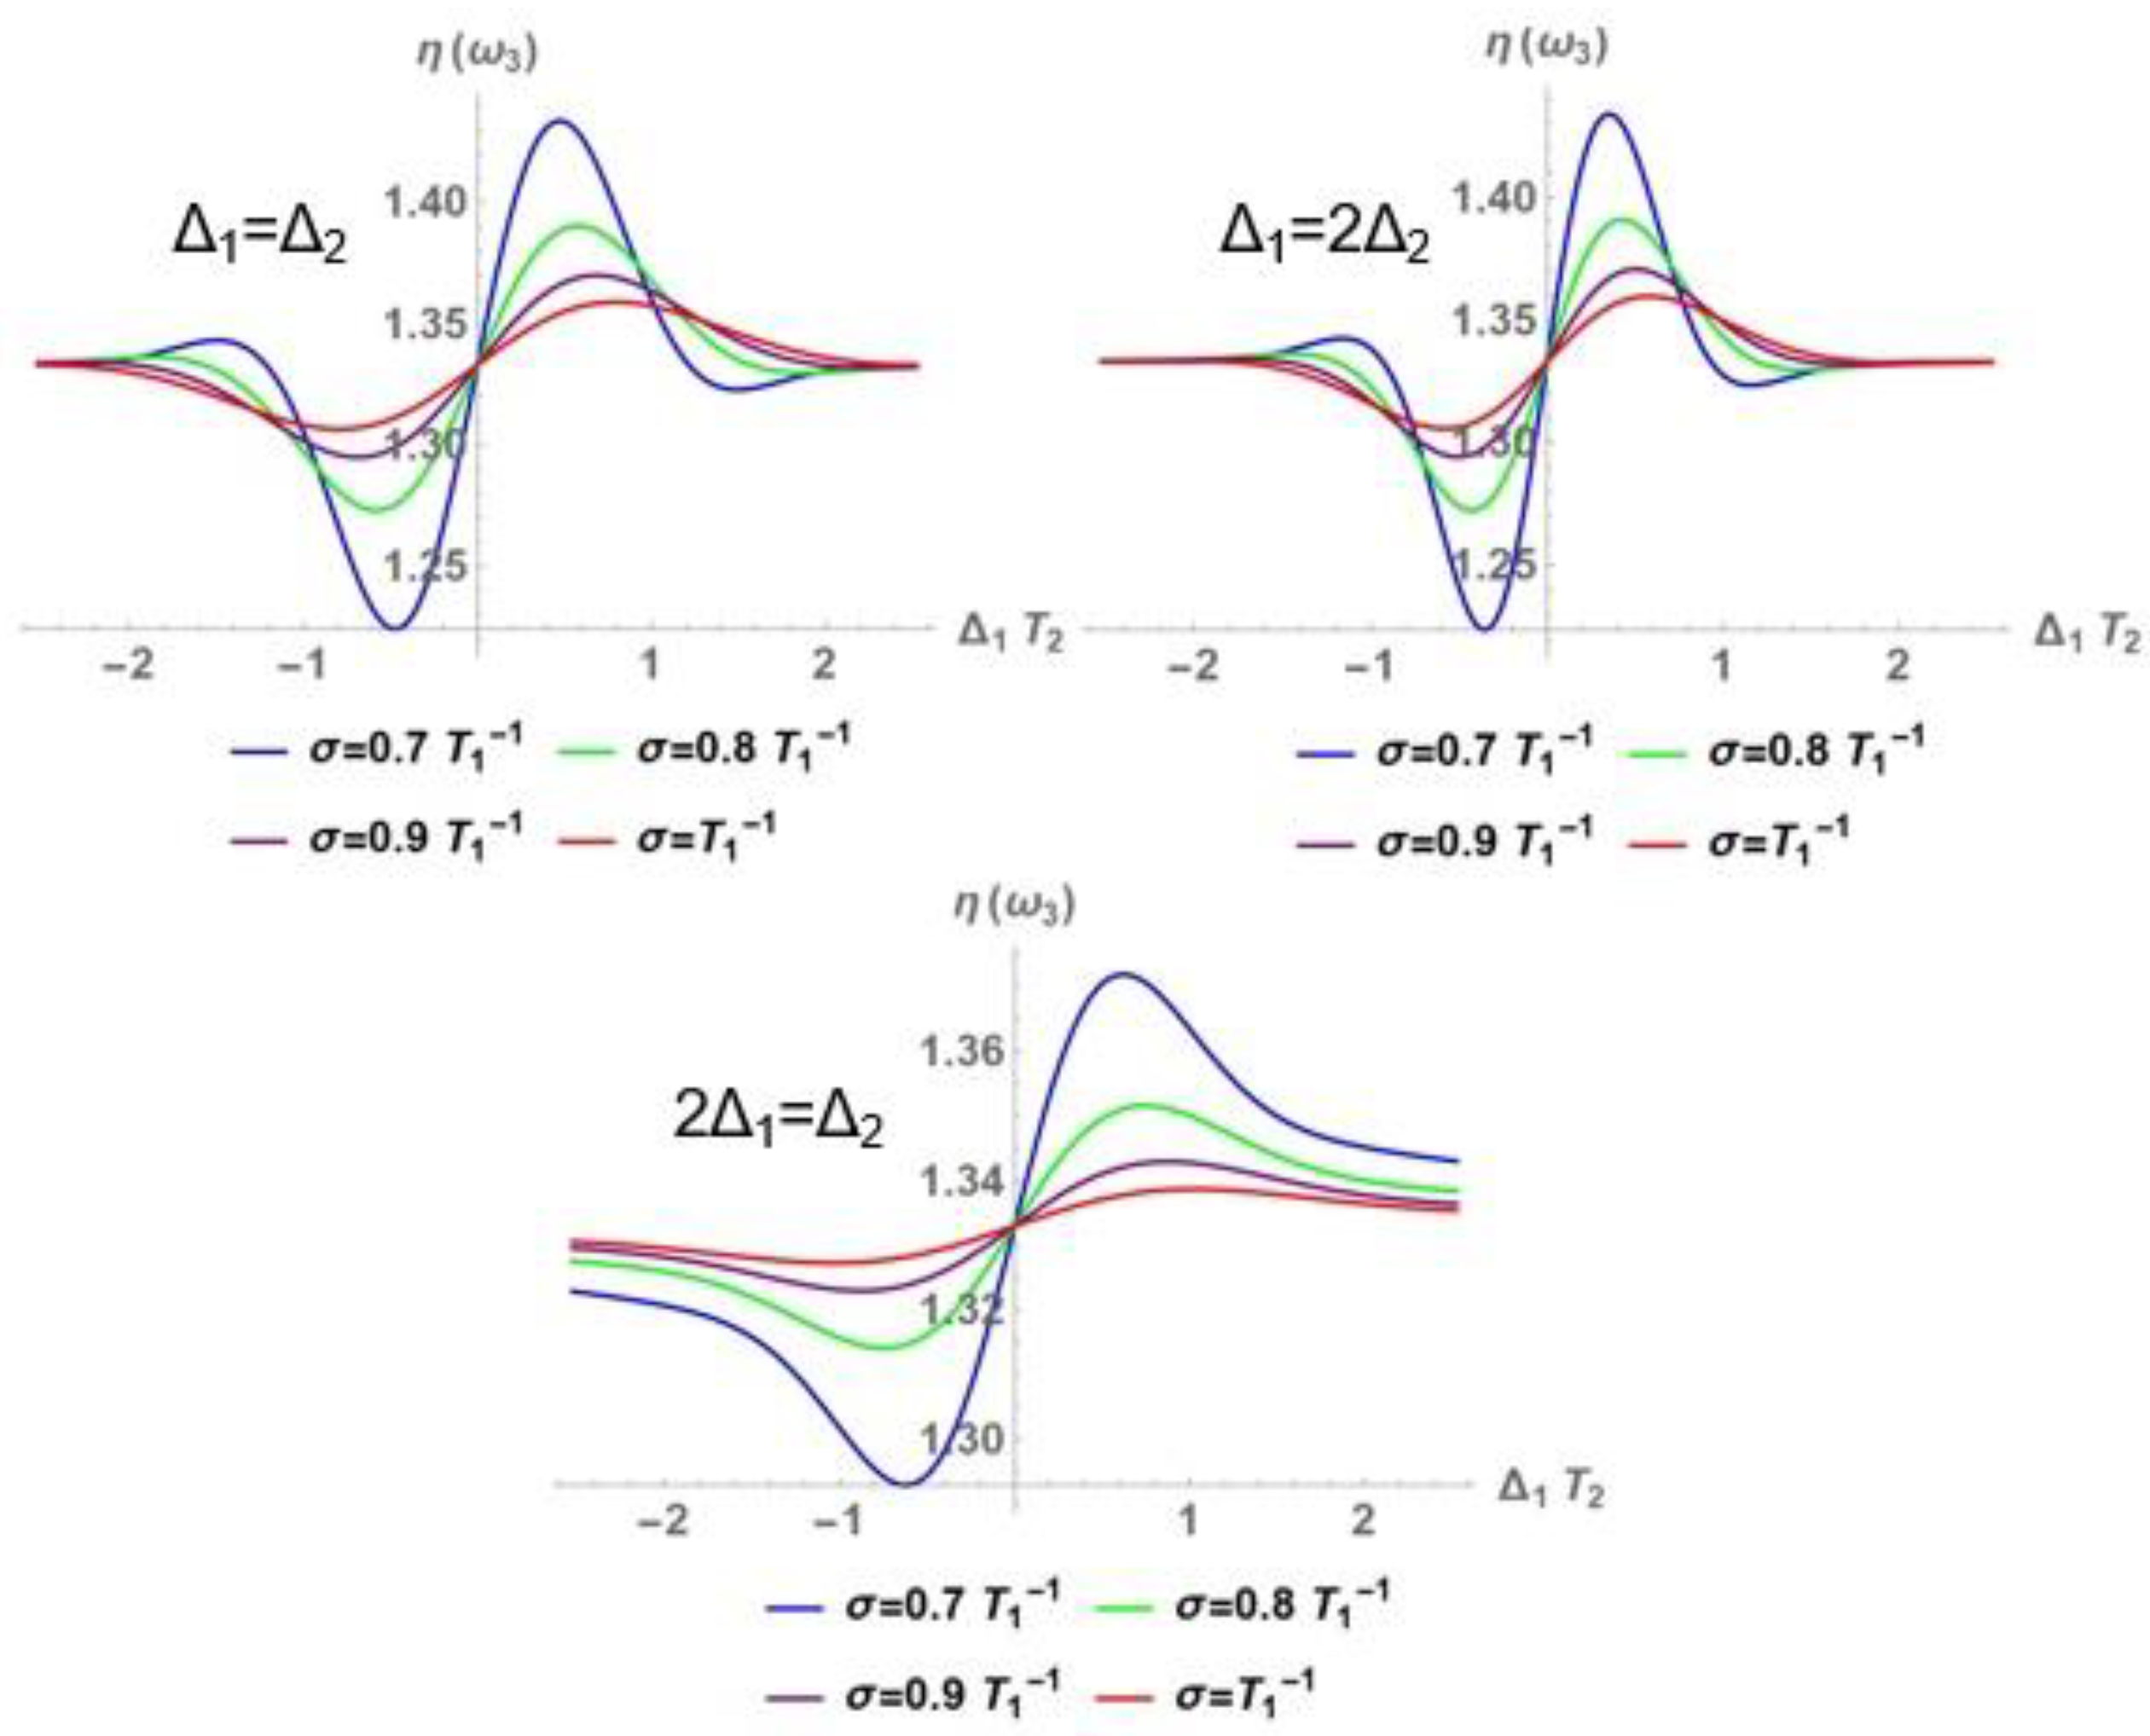
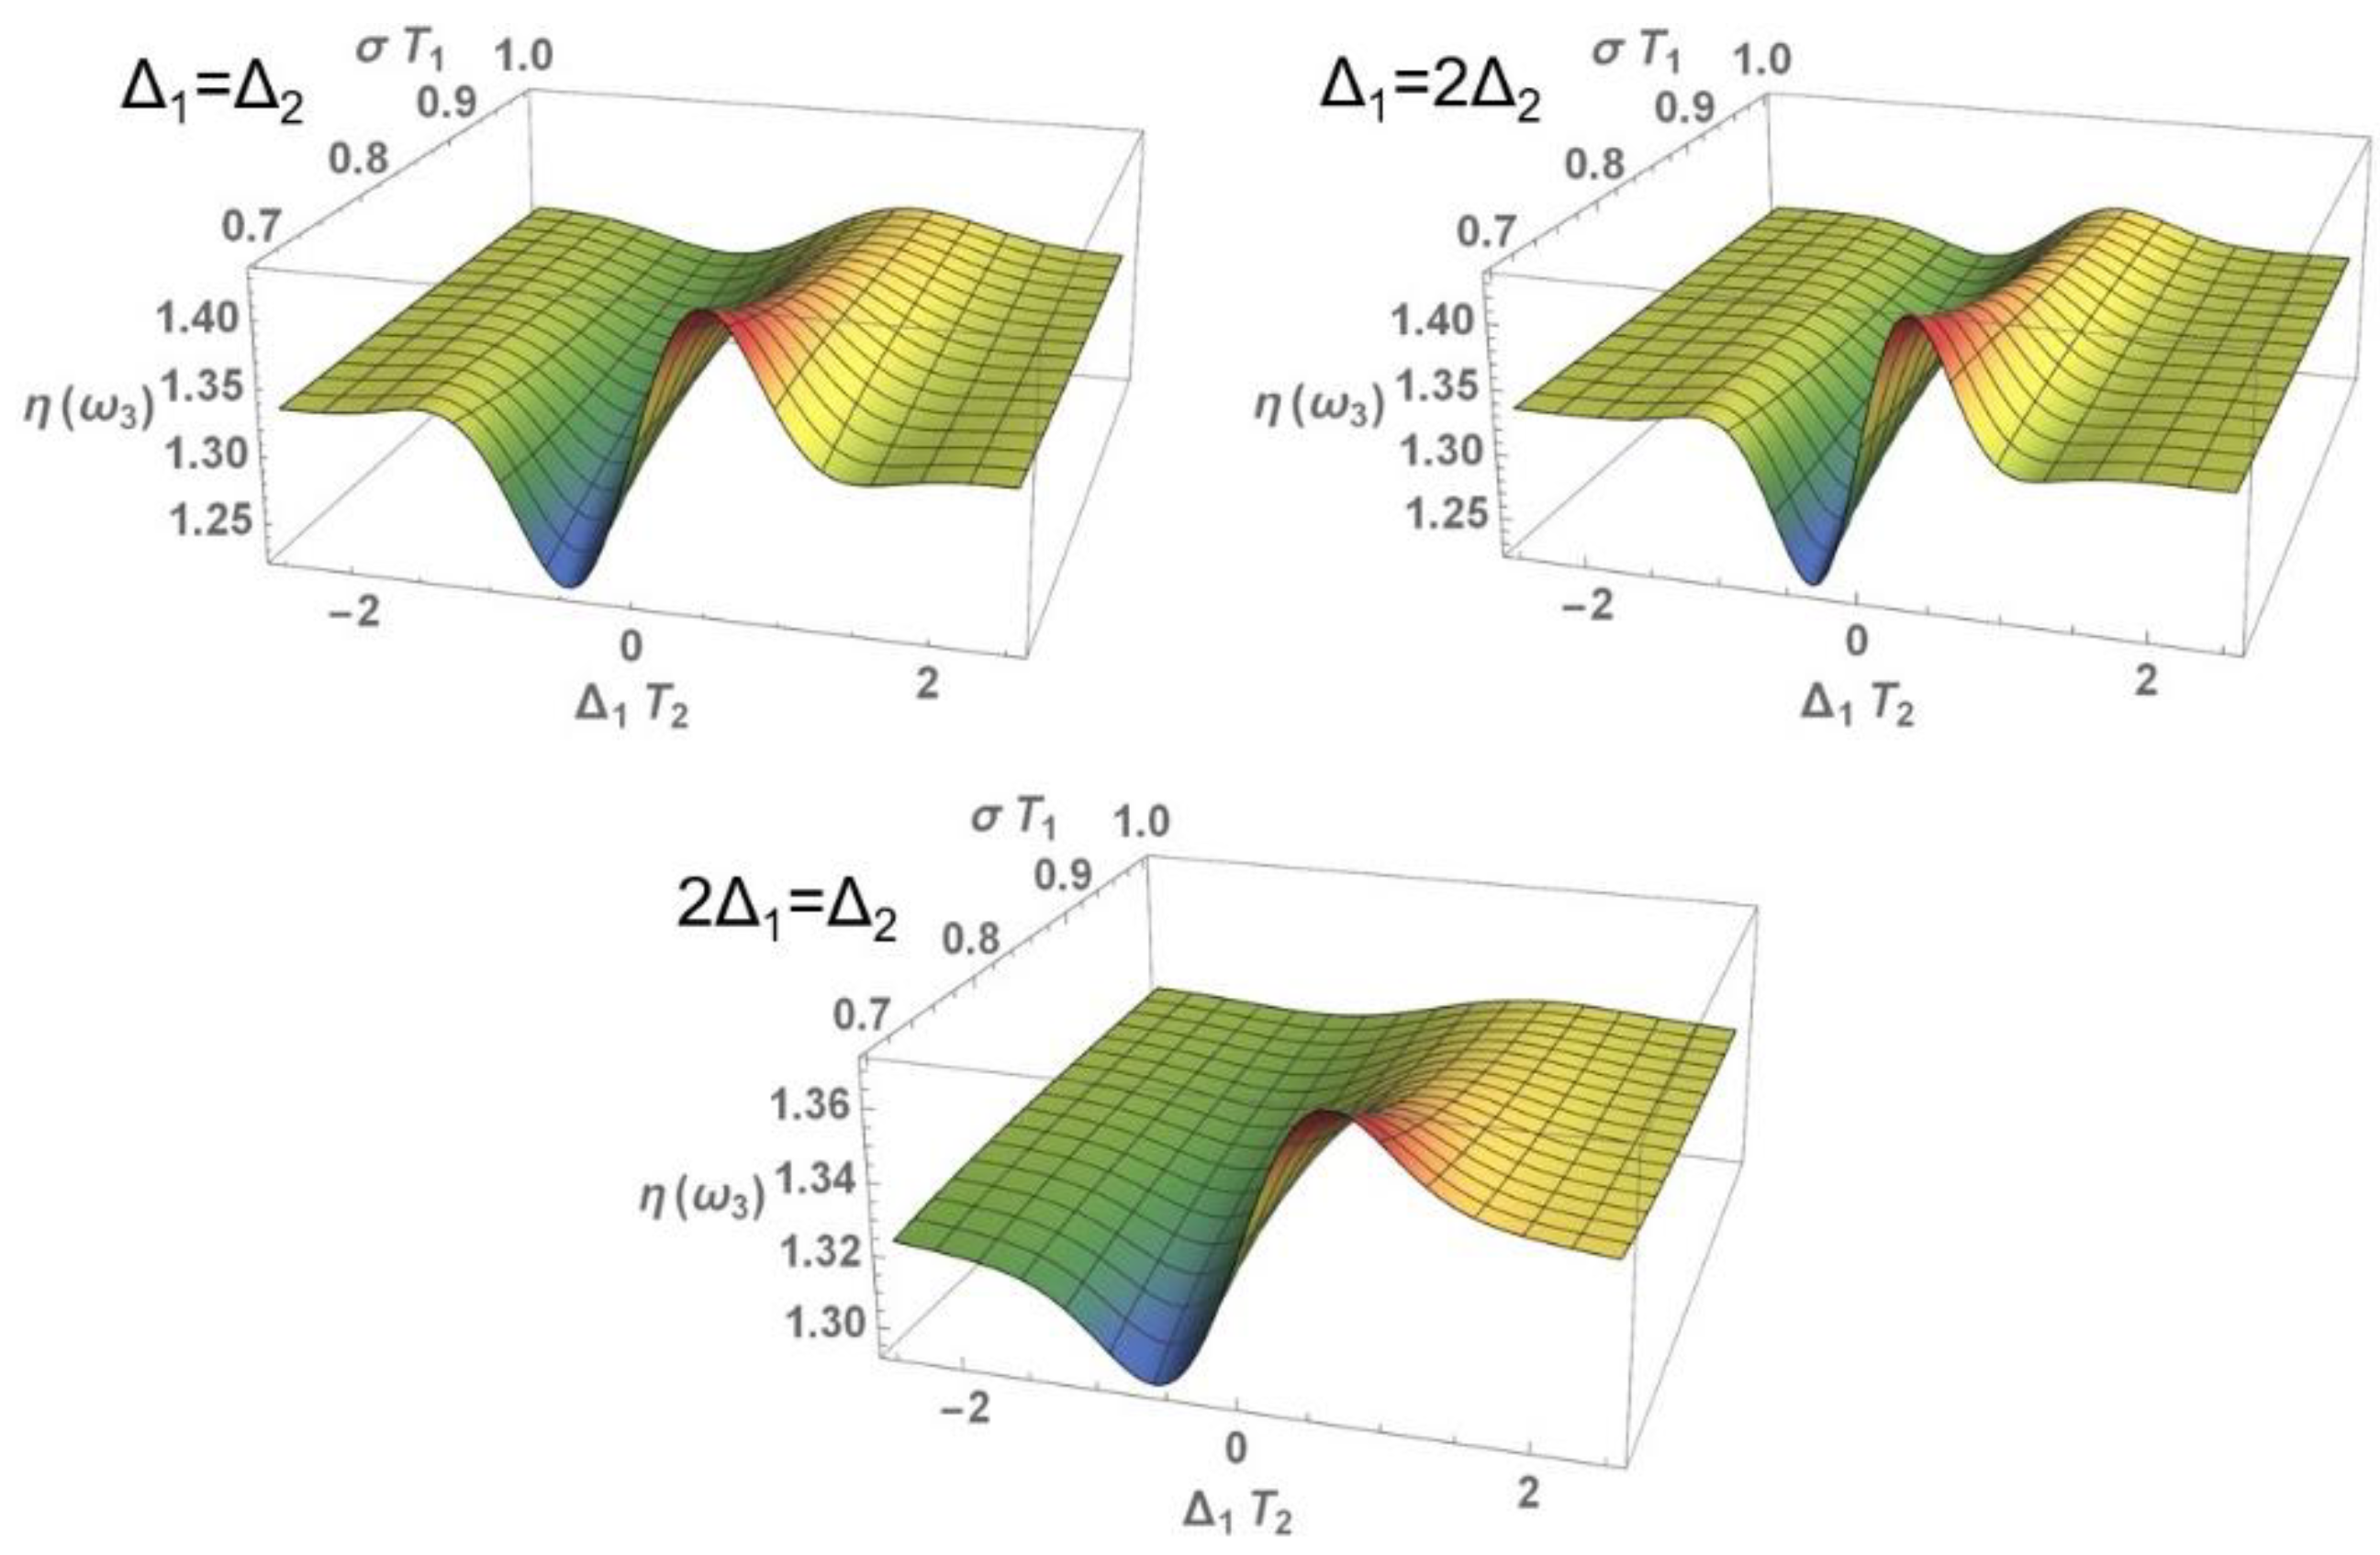
As shown in Figure 7, Figure 8 and Figure 9, a decrease in this coupling factor σ increases the light scattering capacity. The coupling factor between the molecular system and the thermal reservoir is a measure of the interaction between these two entities, so a lower interaction would imply a lower number of collisions and, therefore, a longer time to reach thermodynamic equilibrium. The presence of the thermal bath in its collision with the potentials of the active system, acts by modifying the minima vertically without modifying the nuclear coordinates, leading to a randomness in the process and a lower dispersion, a fact that is reflected mainly in the resonance process of ω 3 with ω ˜ 0 . It is important to note that for values σ T 1 1 = 0.7 it is necessary that β ( σ T 1 ) 2.3 .
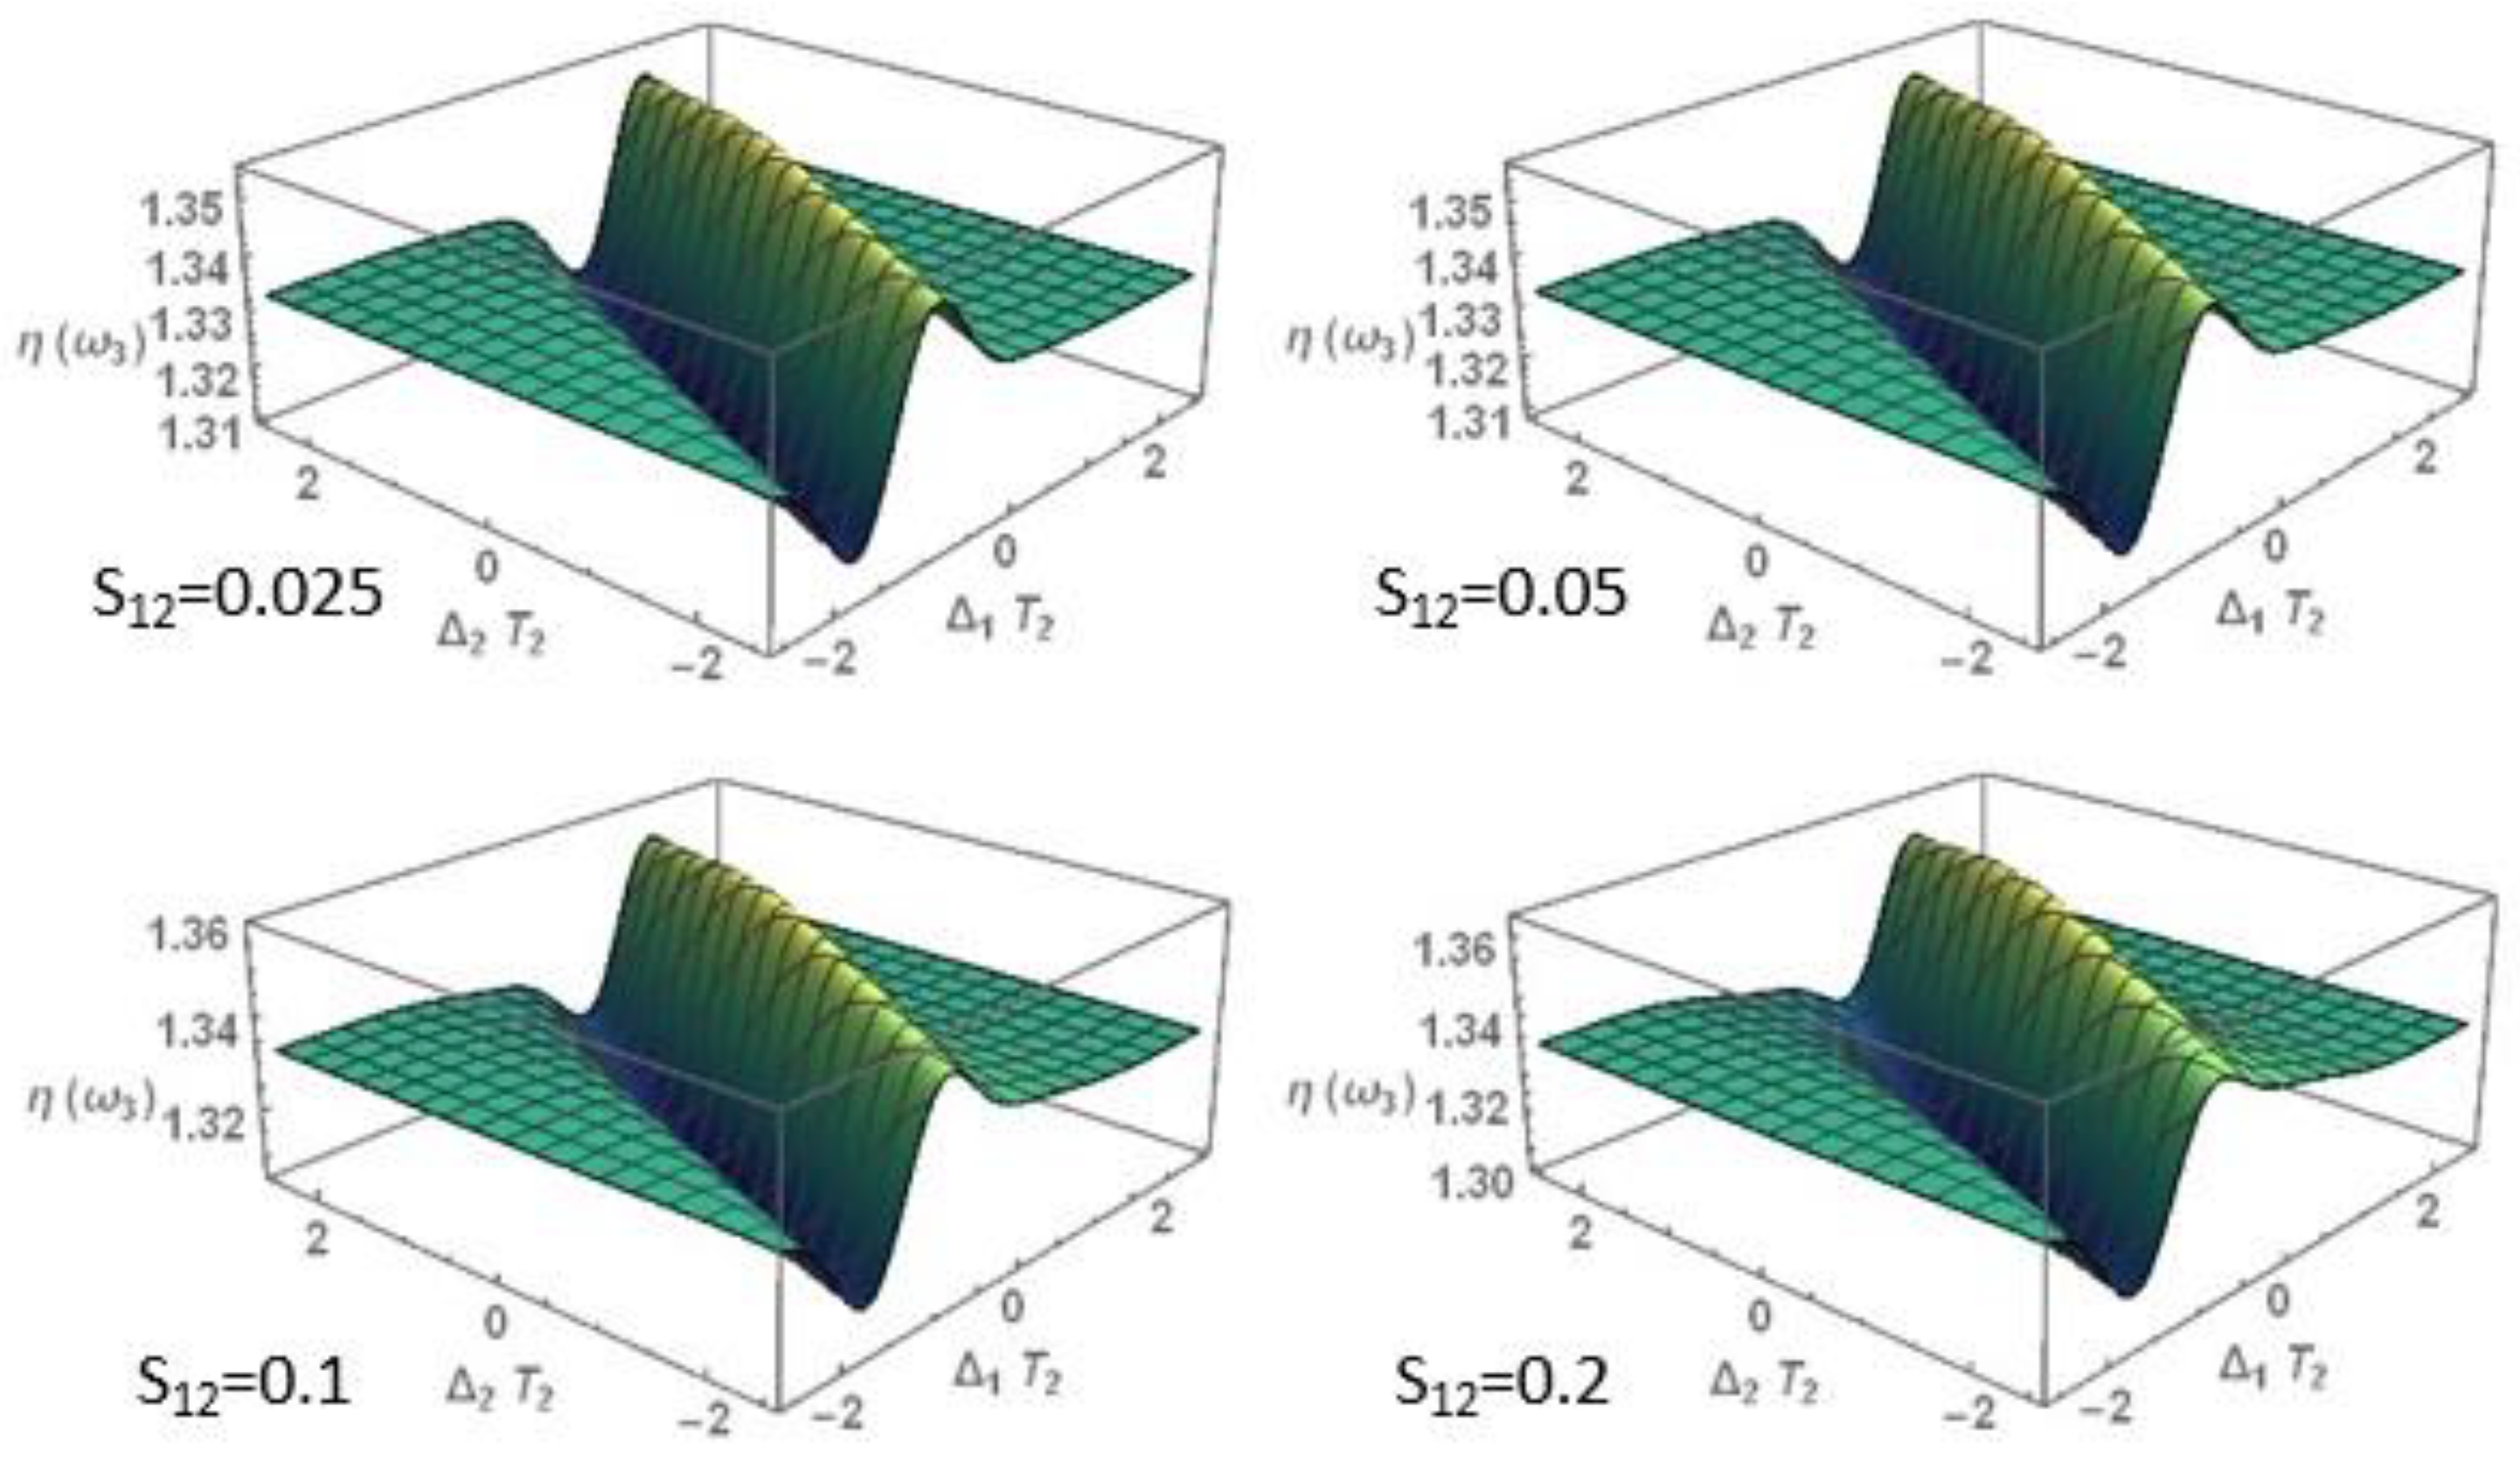
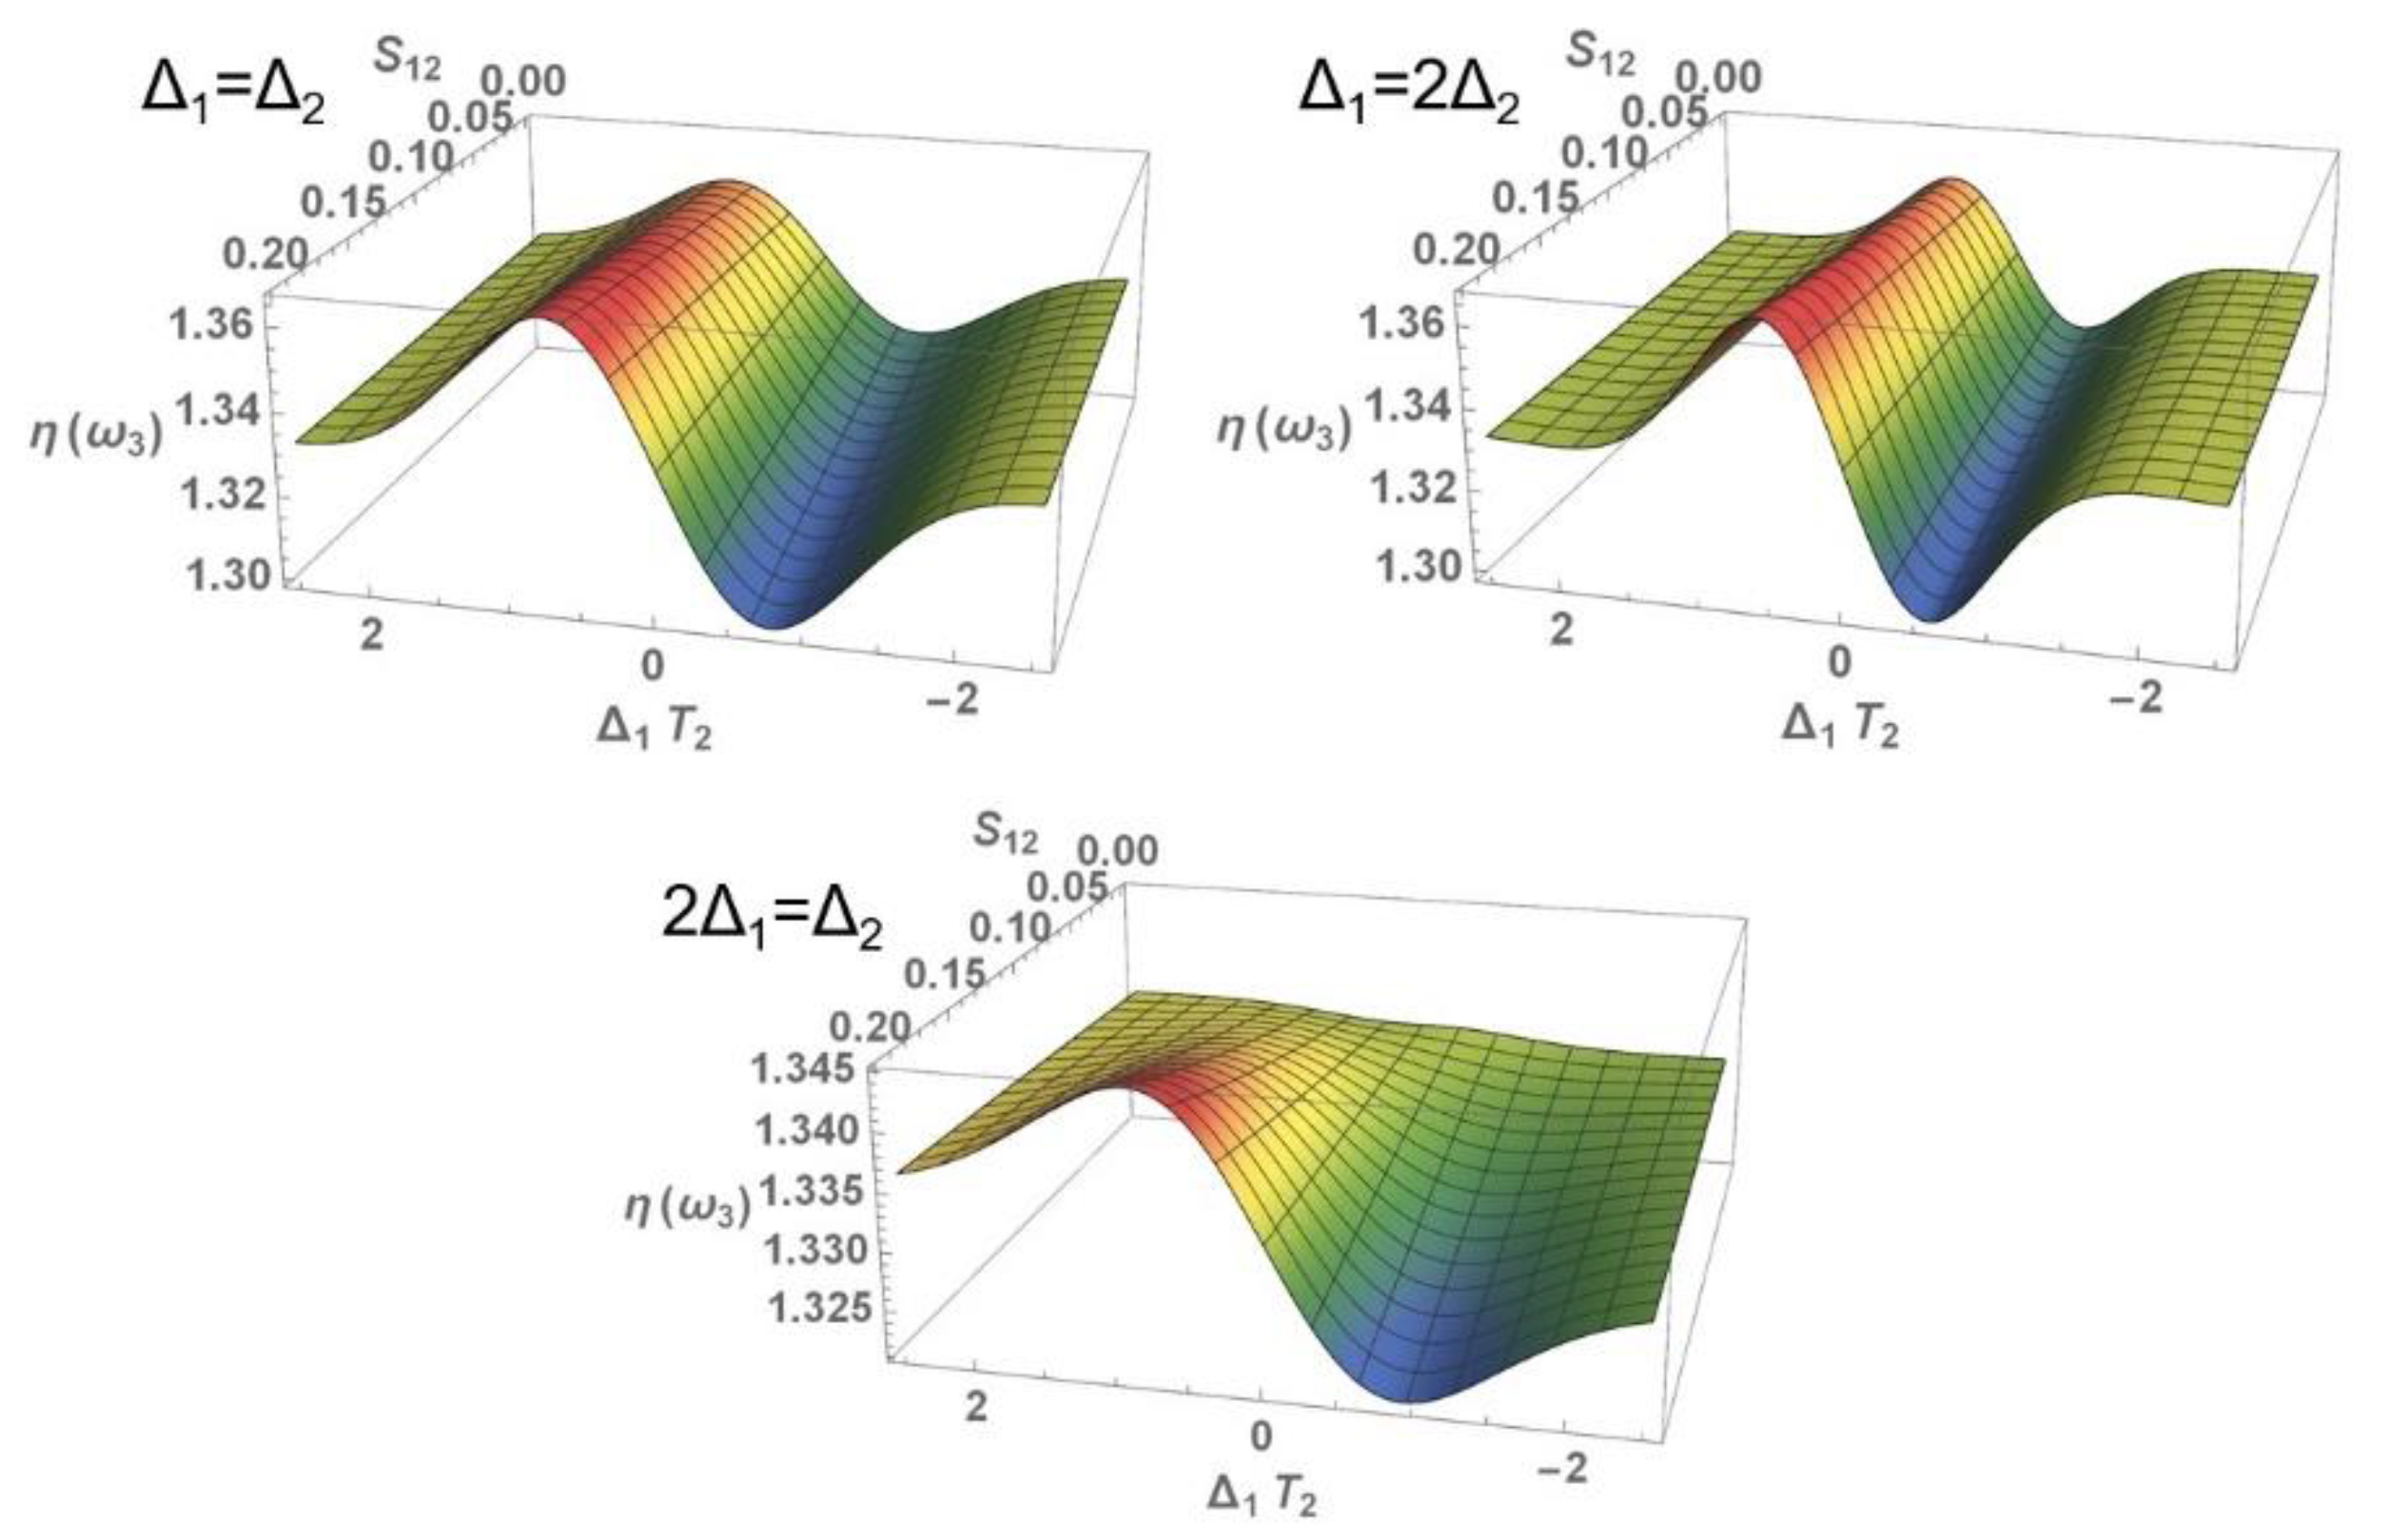
Figure 10 shows the general dispersion profiles in the frequency space Δ 1 and Δ 2 at different values of the saturation parameter. In these profiles and those shown in Figure 11 and Figure 12, the effect of saturation in the system is to increase the dispersion of the signal beam, keeping practically constant the values at which the maximum and minimum of this property of the system are reached. As saturation increases, the population of the upper-level also increases, so there will be less molecules in the fundamental state, thus limiting absorption and, as less is absorbed, the beam generated will be more dispersed.
The saturation values were selected in experimental correlation and conditioning their magnitudes for the fulfilment of the approximations carried in the expansion of the zero-frequency components of the population difference. We note in this case that due to the saturation effect, we have β ( S 12 ) 2.6
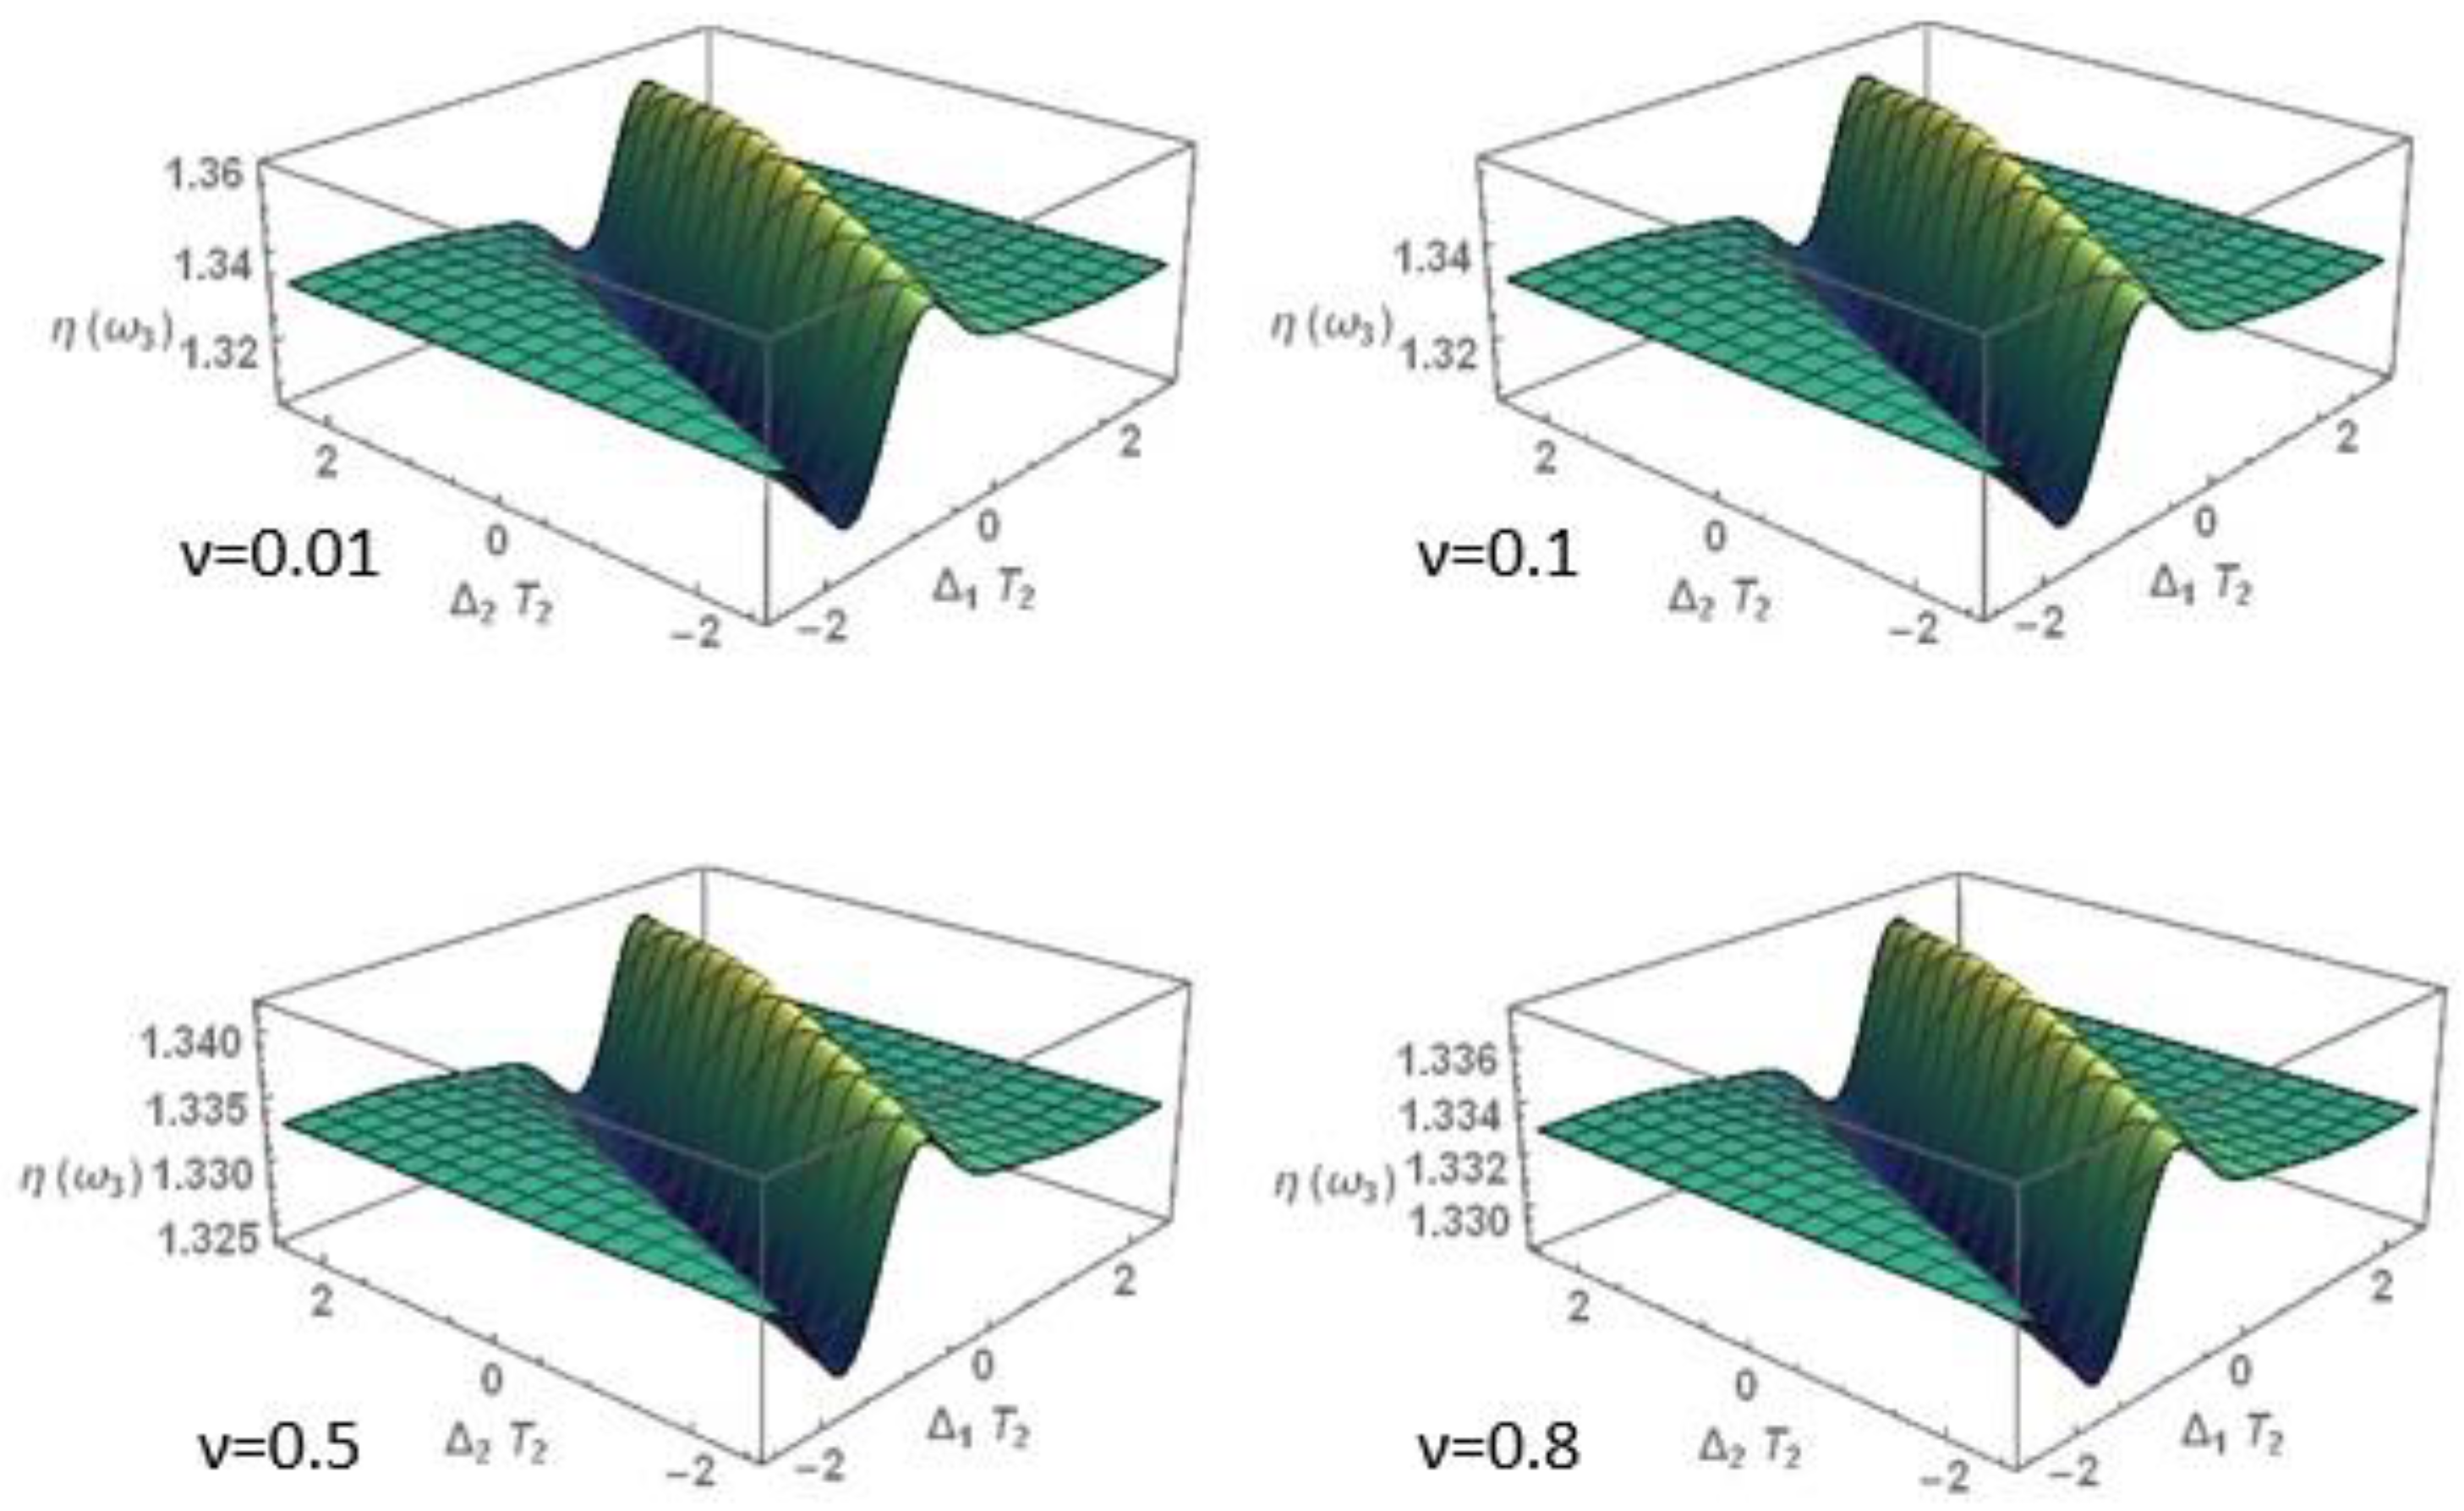
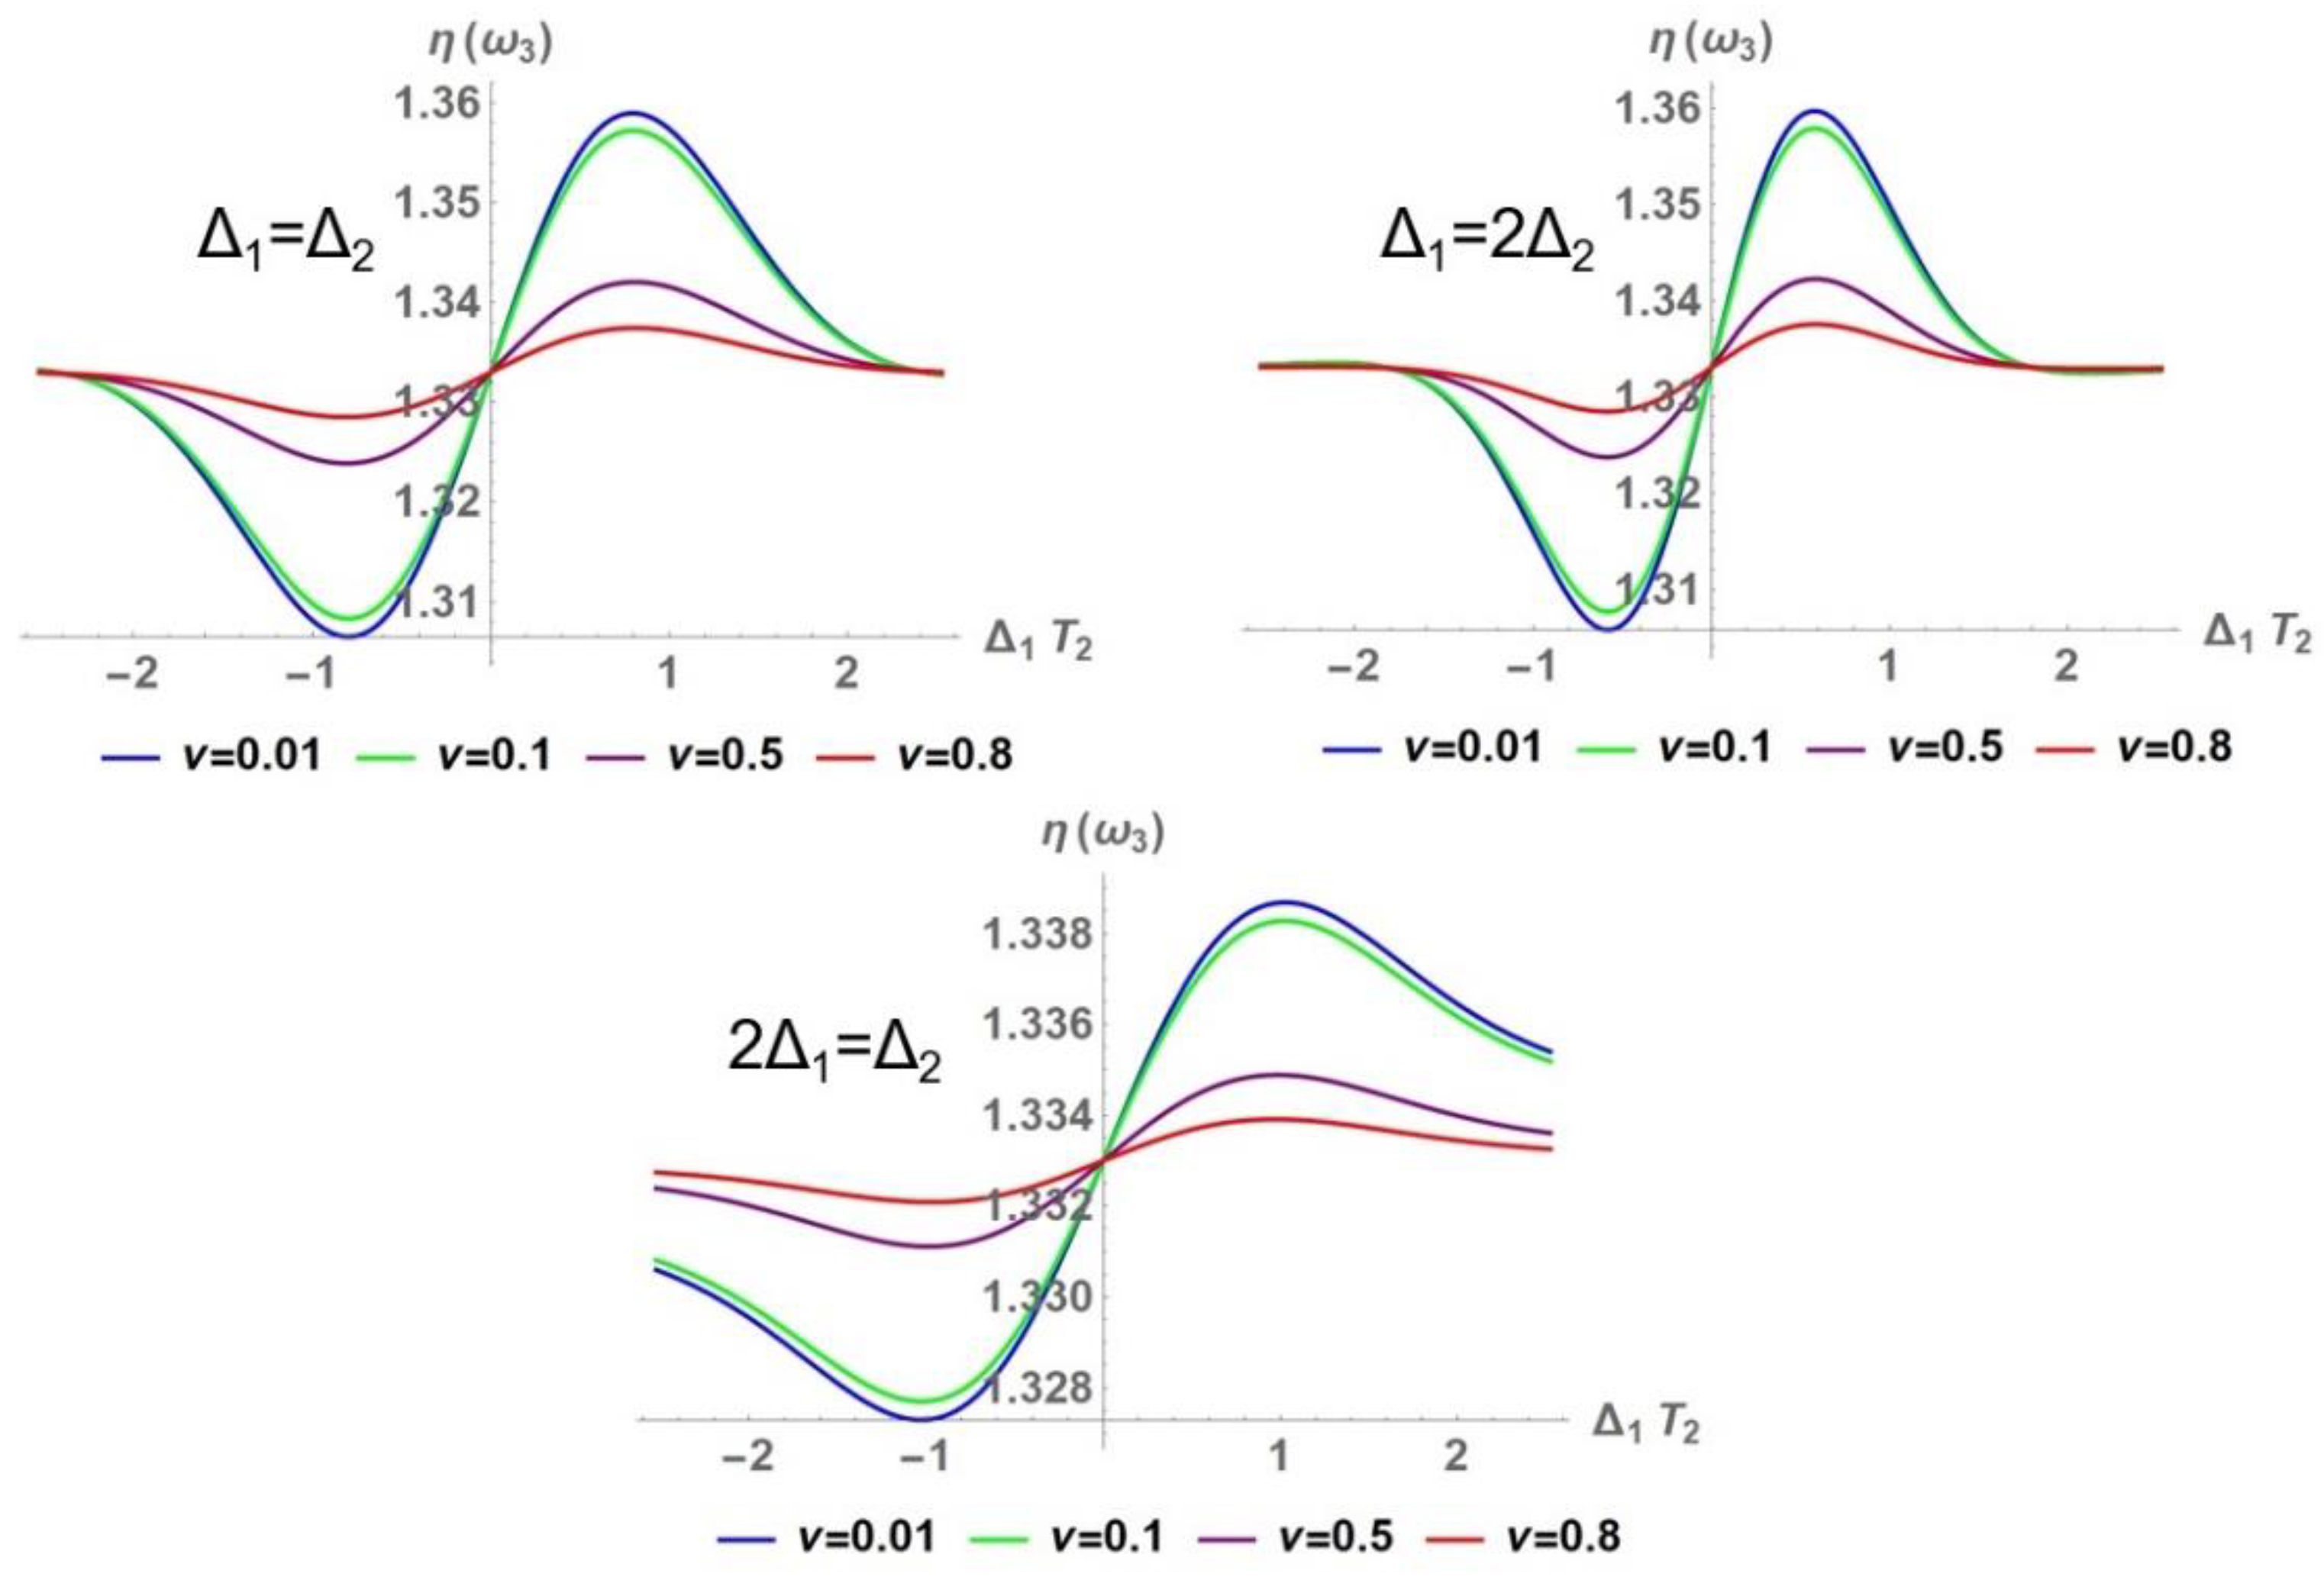
Figure 13 shows the overall scattering profiles in the frequency space Δ 1 and Δ 2 at different values of the intramolecular coupling parameter ν. The maxima and minima of the surfaces start to be closer to the refractive index of water as the value of this parameter is increased. In the cross sections for different ratios between Δ 1 and Δ 2 at different values of ν in Figure 14, the effect of intramolecular coupling is better visualized, which decreases the optical property in question as it increases. However, in this case β ( ν ) 4 when the lowest coupling value is taken. In cases where the intramolecular effect is considerably increased, β 1 is taken.
Initially, the effect is not very noticeable between ν = 0.01 and ν = 0.1 , but then it ends up becoming more visible as the coupling continues to increase, as shown in Figure 15. From the expression for μ ˜ A B (and thus for μ ˜ B A ) it can be found that an increase in the intramolecular coupling factor decreases the value of this transition dipole in the adiabatic basis, which decreases the electrical susceptibility of the system and thus its ability to polarize and orient its dipoles, so it ends up scattering less light.
In general, since the detuning of the incident beams is exactly zero, the refractive index turns out to be that of the solvent. In addition, it can be also noted that this property presents an inversion symmetry to an origin centered at the point (0,1.333) of the coordinate plane. In summary, we can indicate that the refractive index variations taken in the ratio of the Δ 1 = 2 Δ 2 and Δ 2 = 2 Δ 1 processes are most sensitive to the relaxation time ratio T 1 = 10 T 2 , with similar effects when varying the effects of coupling with the thermal bath σ T 1 1 and beam saturation S 12 , leaving very little sensitivity to the effects of intramolecular coupling ν . From the information obtained from the parameter ε we observe the highest sensitivity with the relaxation time ratio T 1 / T 2 . This denotes that the optical property raises its intensity contrast symmetrically in relation to detuning, parameterized by the relaxation kinetics at thermal equilibrium with respect to the loss of coherence between states. This fact correlates with that proposed by Yajima et al. [44,45] when analyzing the response of organic dyes in Rayleigh-type optical mixing processes.

3.1.2. Nonlinear Absorption Coefficient

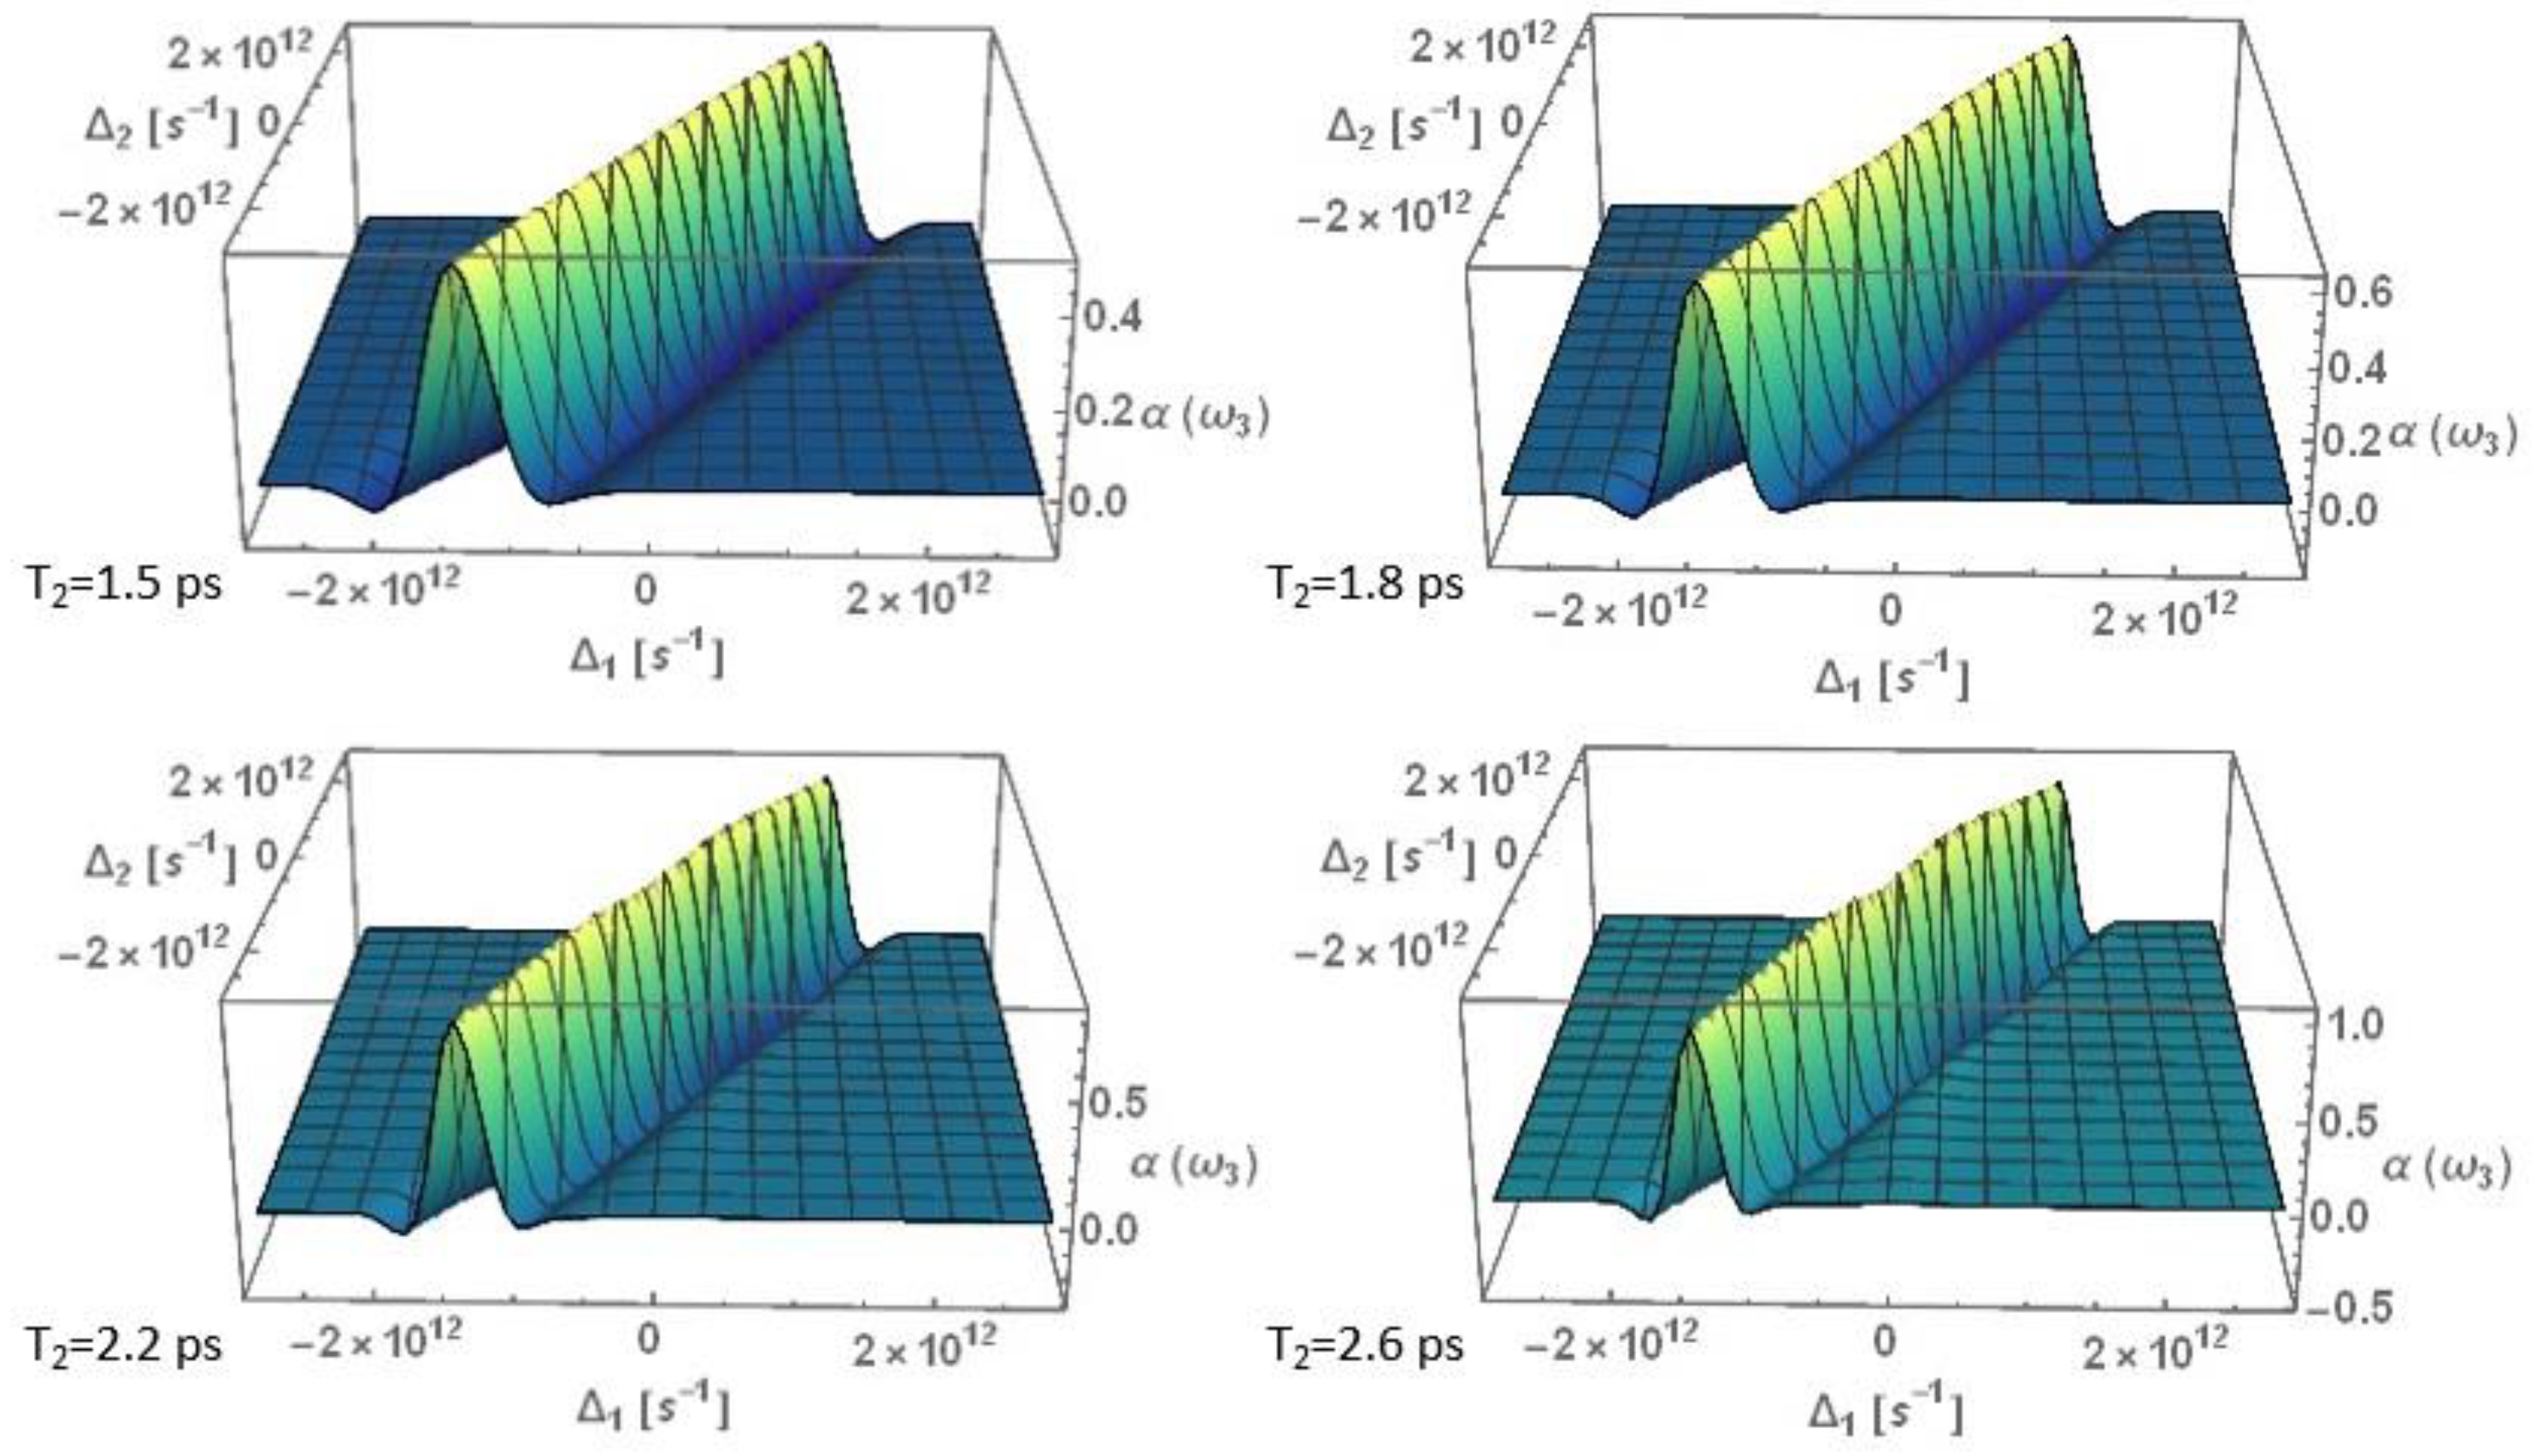
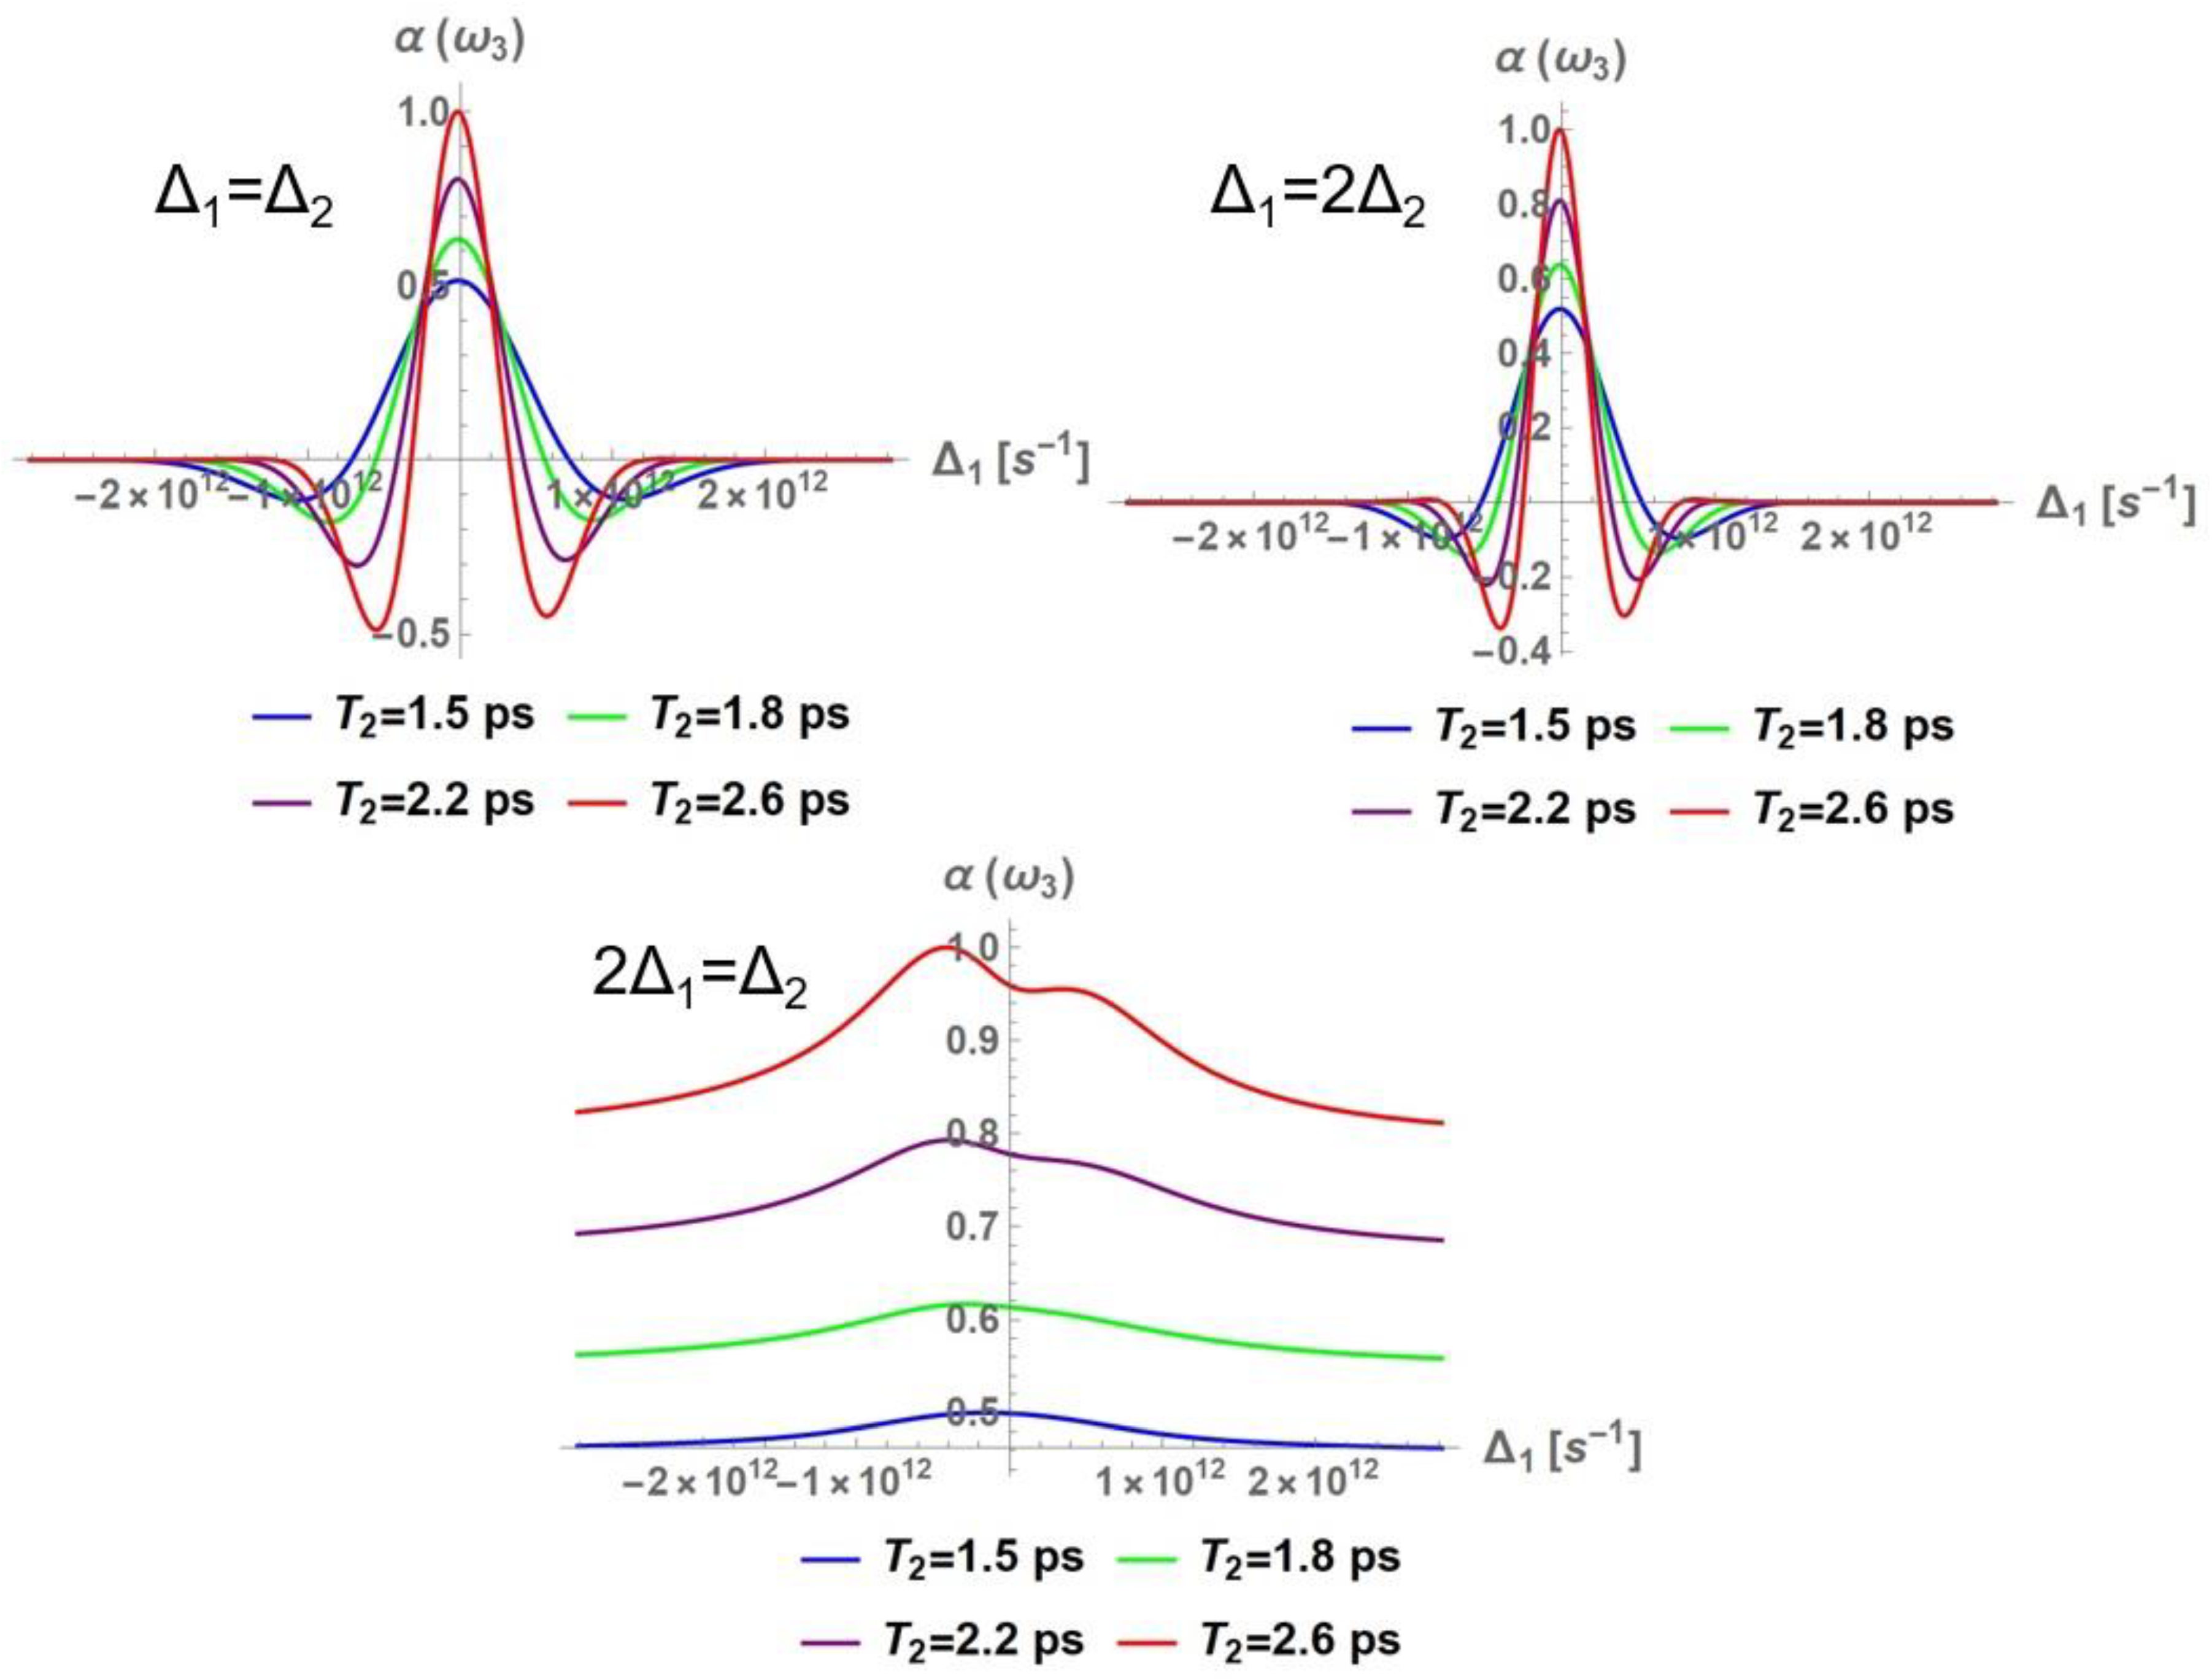
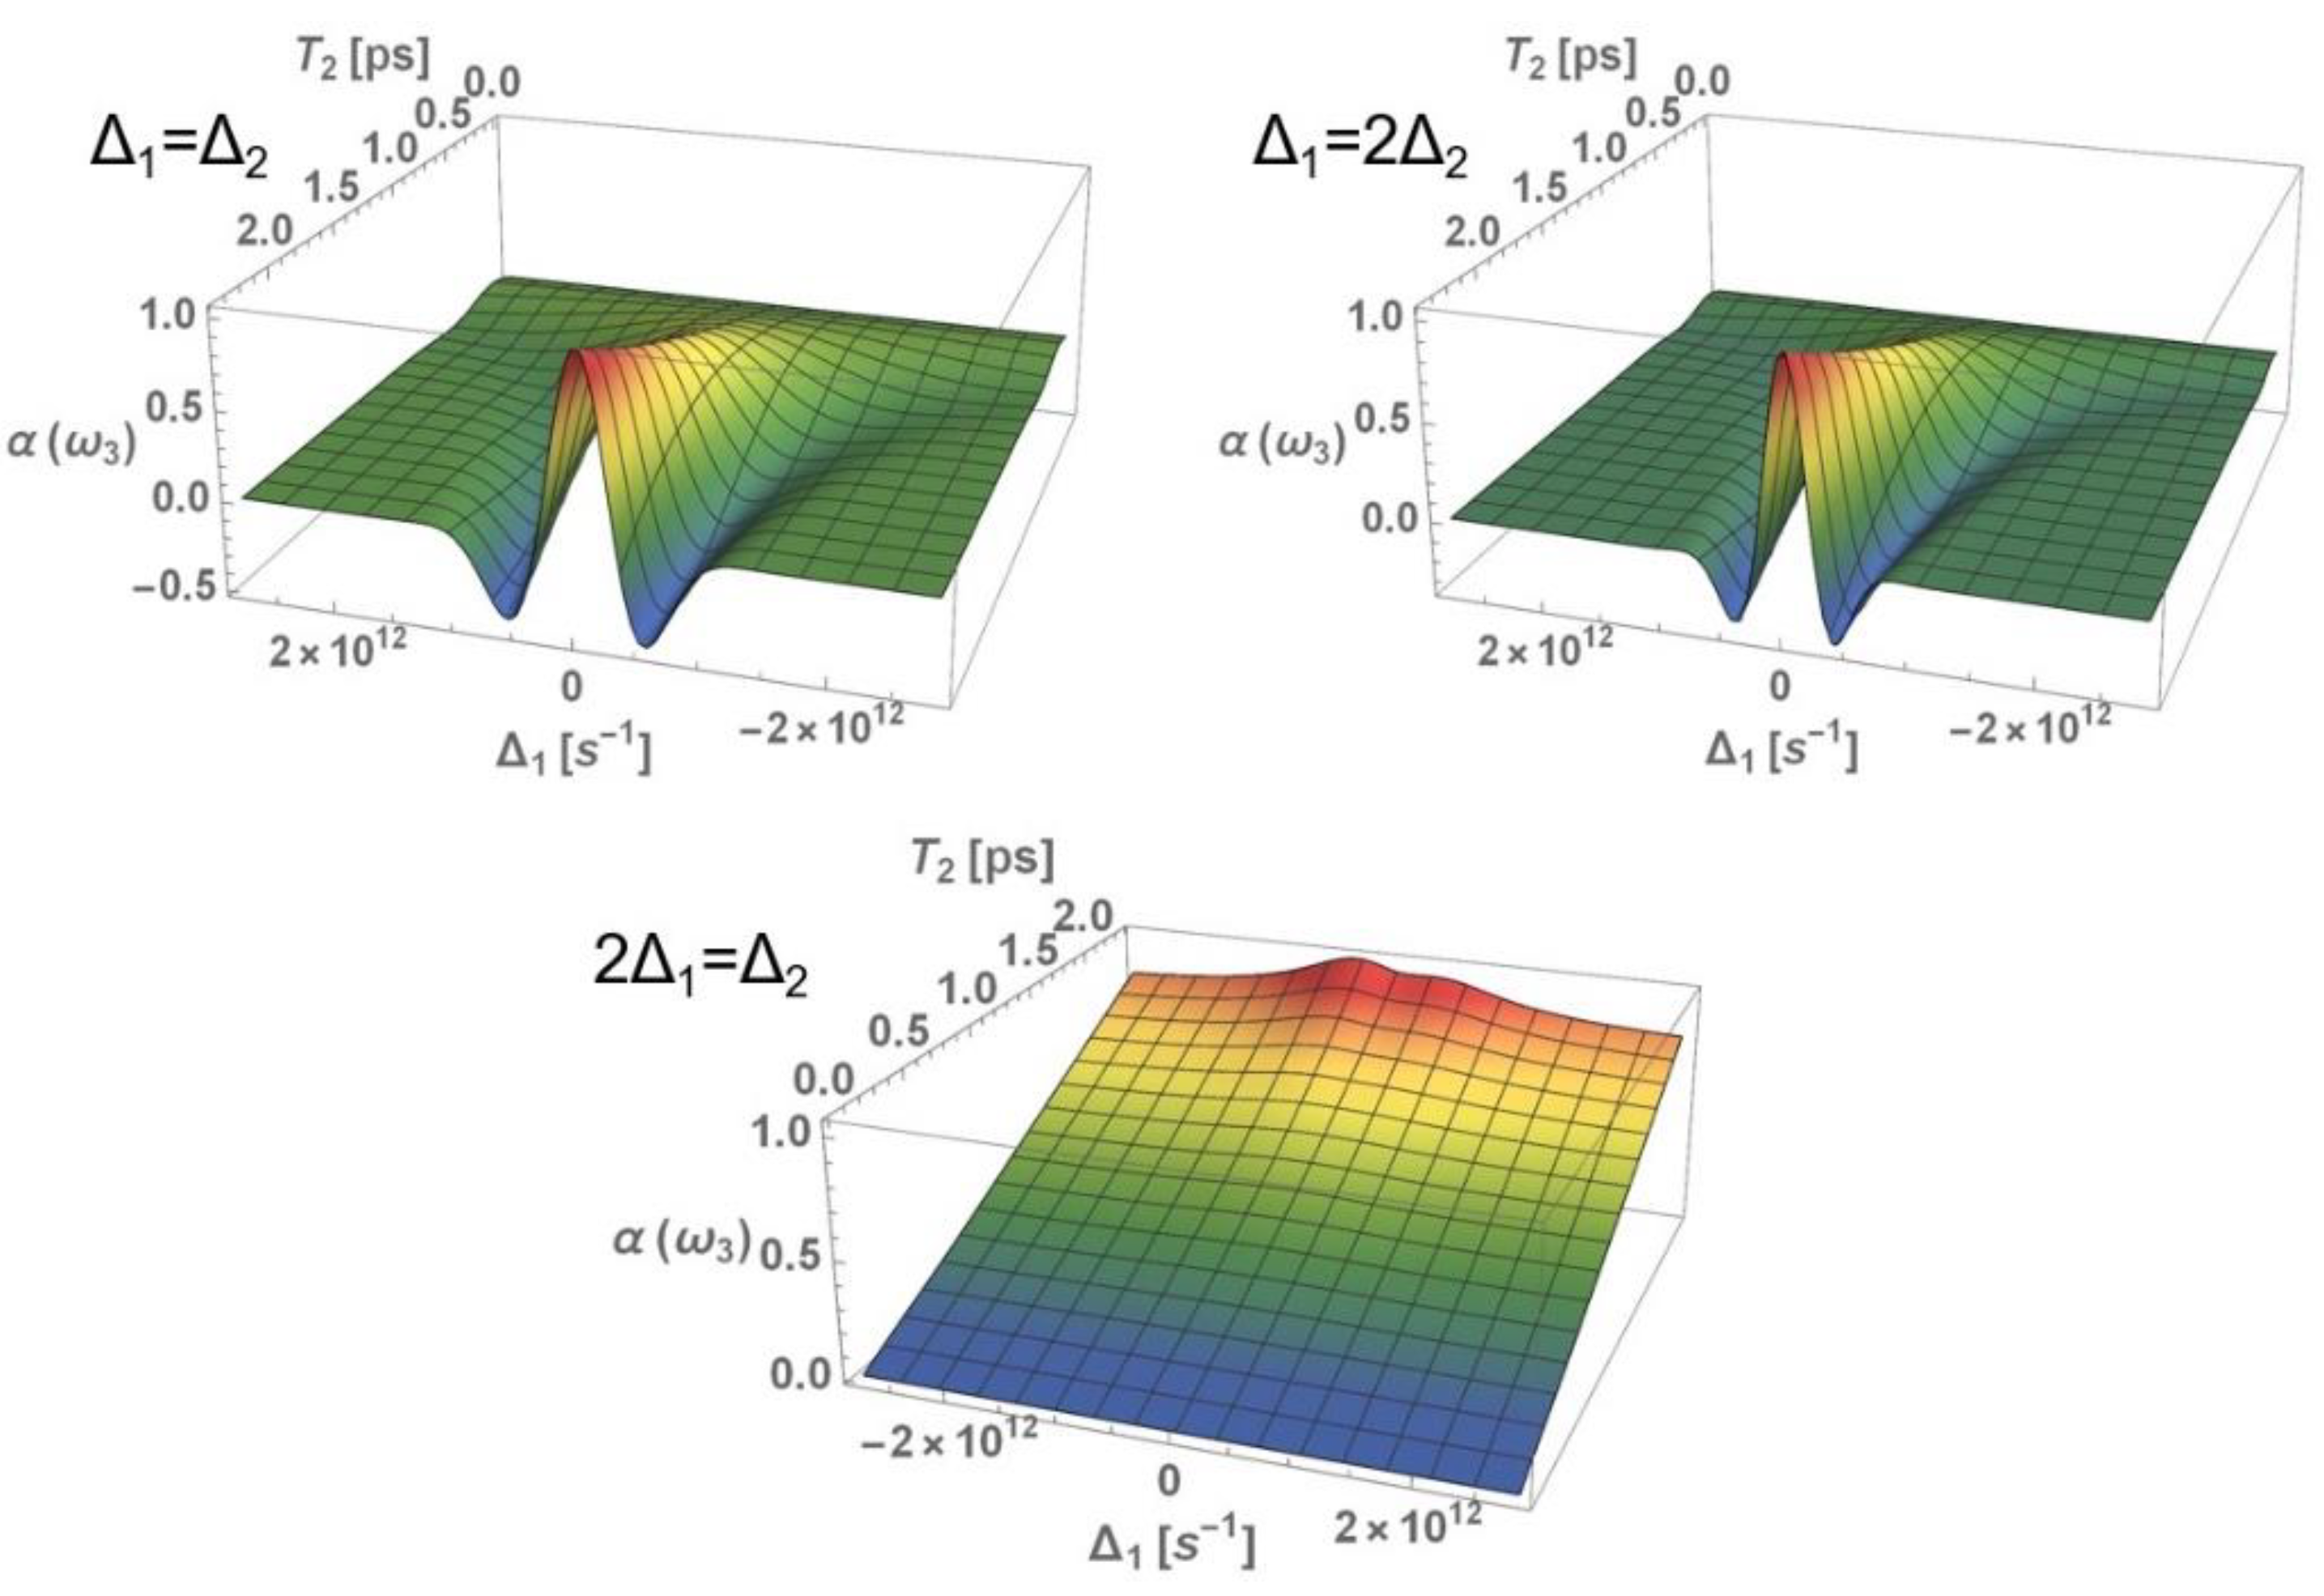
Figure 16, Figure 17 and Figure 18 show different absorption profiles as the transverse relaxation time T 2 is varied. It is observed that an increase in the transverse relaxation time implies greater absorption since its increase reflects the dissipation mechanism in which the dipoles take longer to lose their coherence, which implies that a greater matter-field interaction is maintained, and with-it greater absorption.
As can be noticed, compared to the other cases, the absorption ω 3 = ω ˜ 0 is significantly higher than the other cases of the ratio between Δ 1 and Δ 2 .
Also, for this case the absorption is never negative, so one would not expect to observe some kind of parametric amplification in this frequency ratio when studying the spatial variation of the generated signal intensity. We also observe that in this resonance, the response presents a greater width for a higher pumping detuning frequency range, which we can also predict from the HWHM associated with the inverse of the transverse relaxation time.
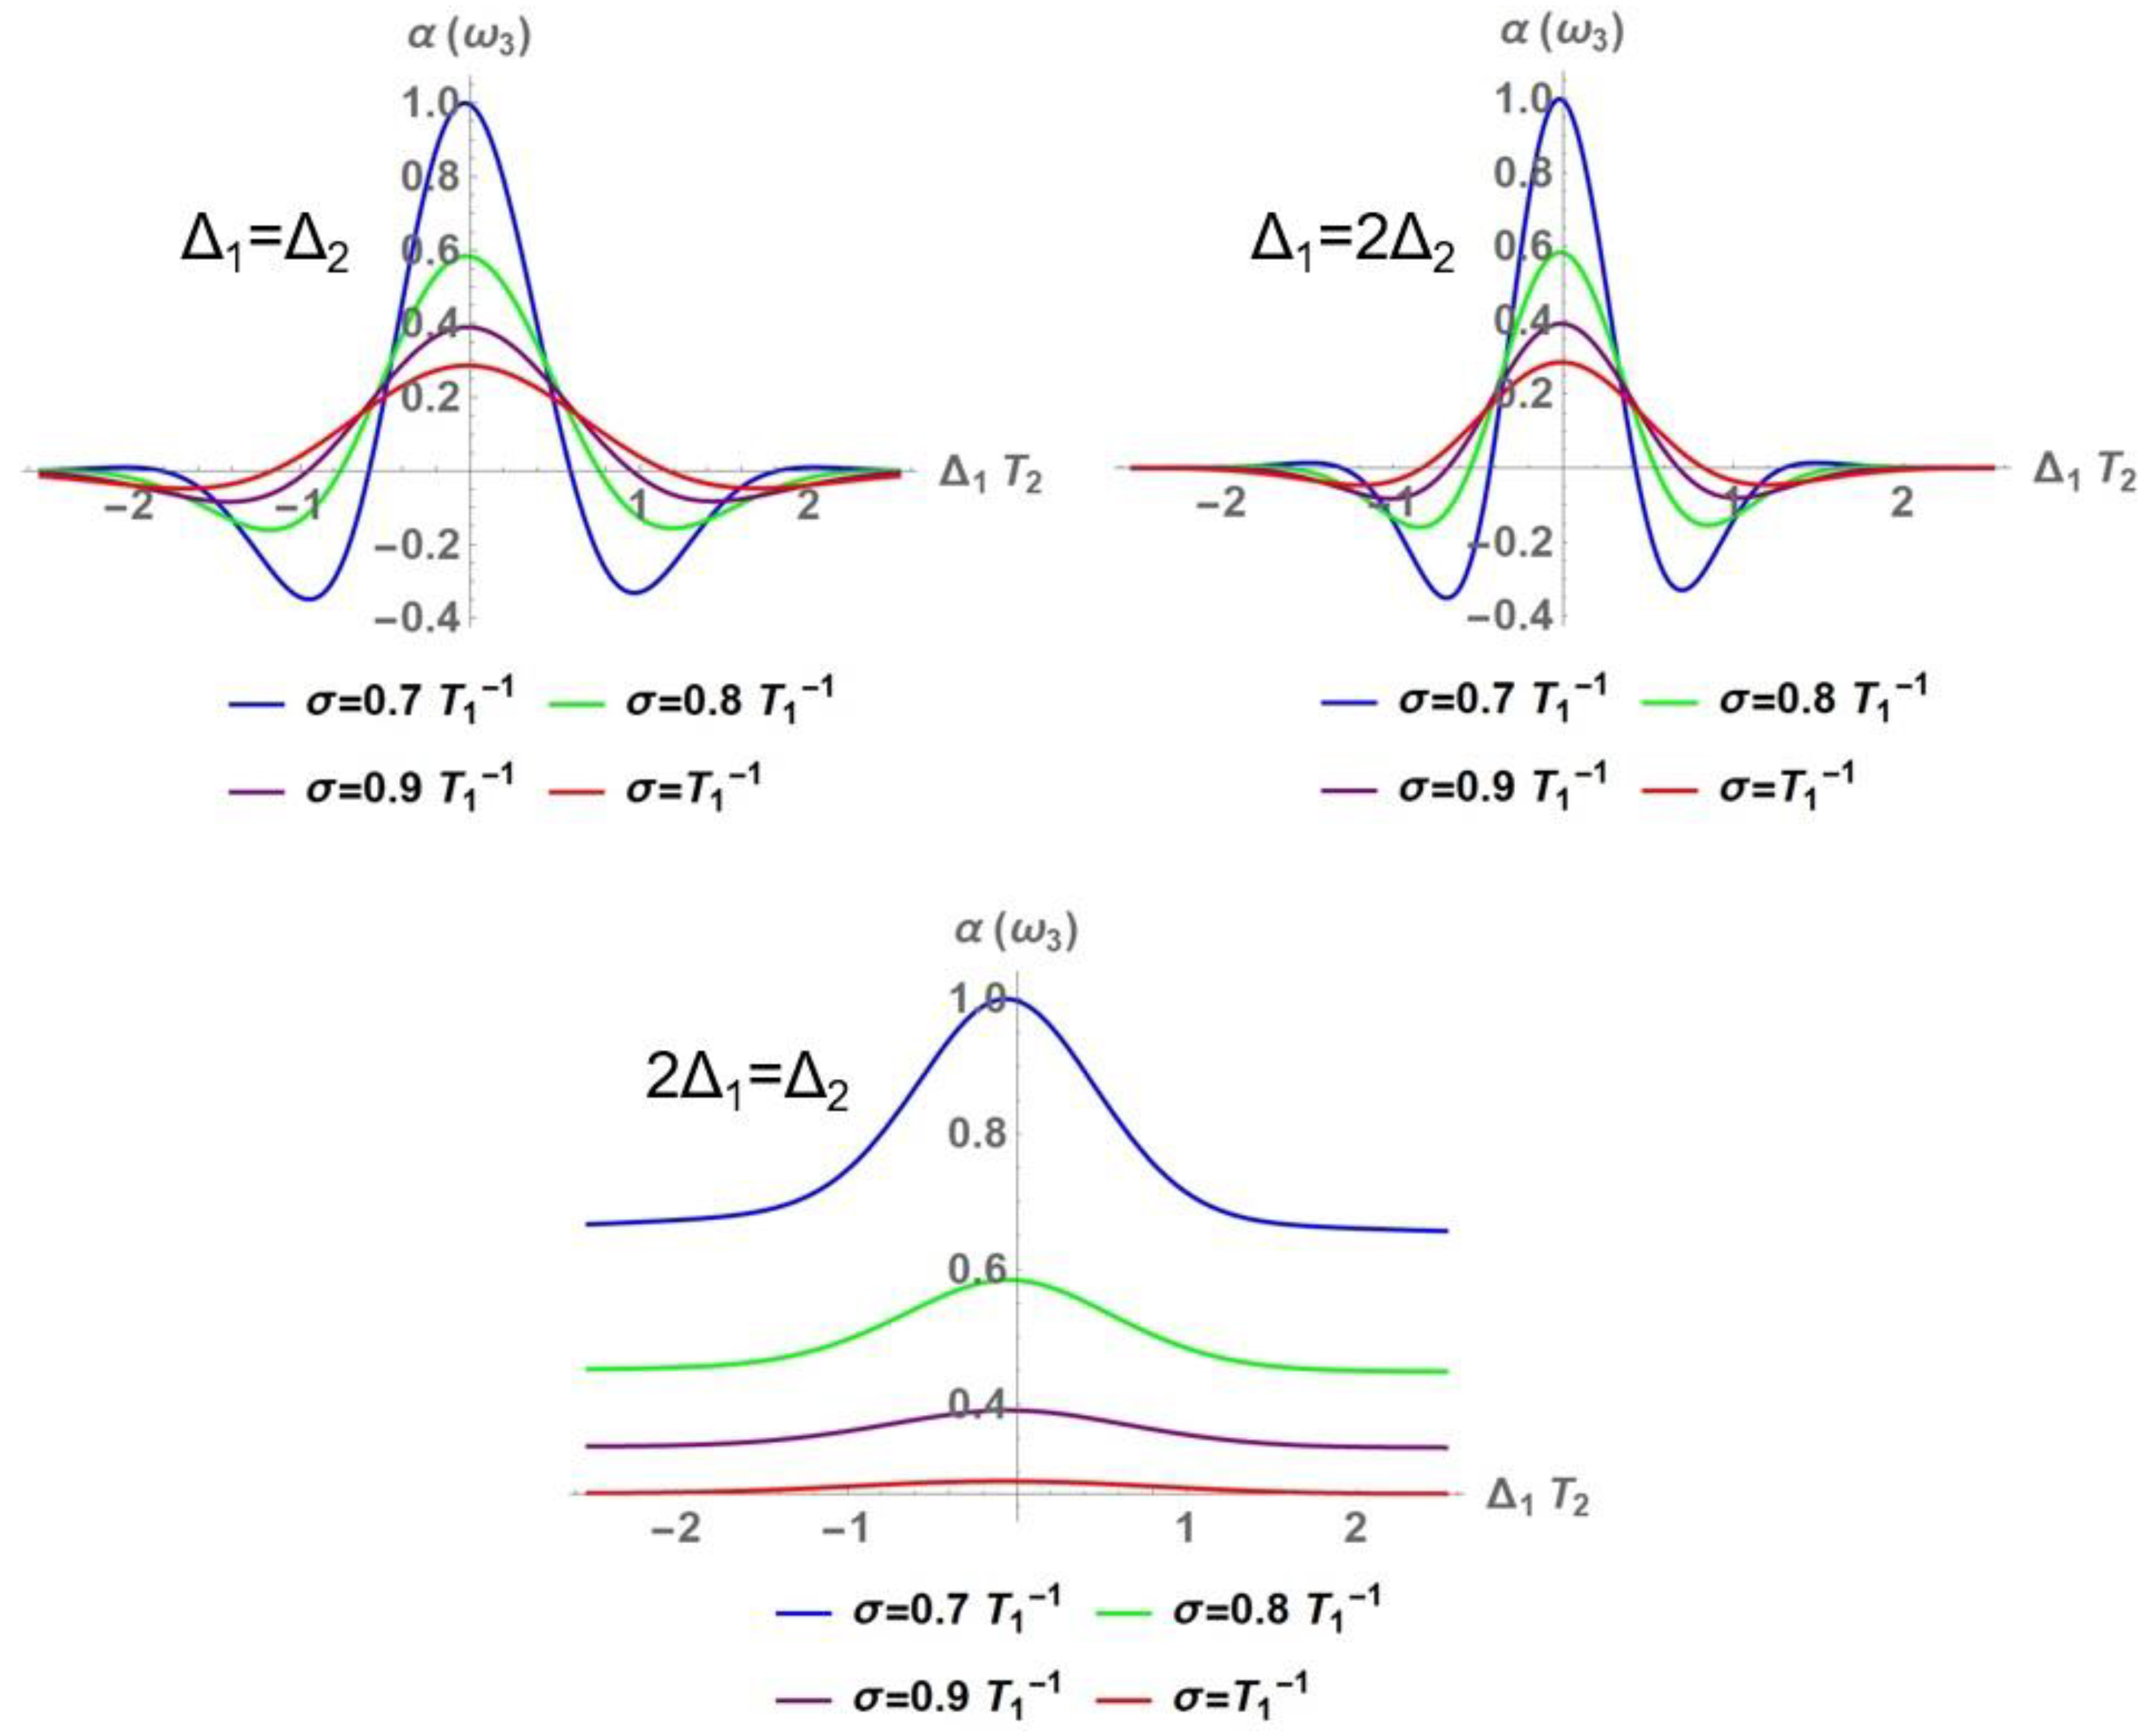
Figure 19, Figure 20 and Figure 21 show the change in the absorption profiles due to the increase in the ratio of longitudinal and transverse relaxation times T 1 / T 2 . For the case where T 1 = 10 T 2 we observe a significant distortion in the absorption profile, with apparent zones of parametric amplification around Δ 1 T 2 1 .
We can appreciate the resonances of the degenerate processes Δ 1 = Δ 2 and 2 ω 2 ω 1 = ω ˜ 0 that in time ratios of T 1 = 10 T 2 the optical response shows a great broadening in contrast to the process 2 ω 1 ω 2 = ω ˜ 0 where the profile is maintained with a very reduced width. However, the apparent zones of amplification in the first two profiles are fundamentally accentuated at these time ratios, totally different in the cases of resonance of the FWM signal where although there is very high broadening because of the decrease of the time ratio and the HWMH, no parametric amplifications (negative absorptions) are shown throughout the detuning zone of the pumping.
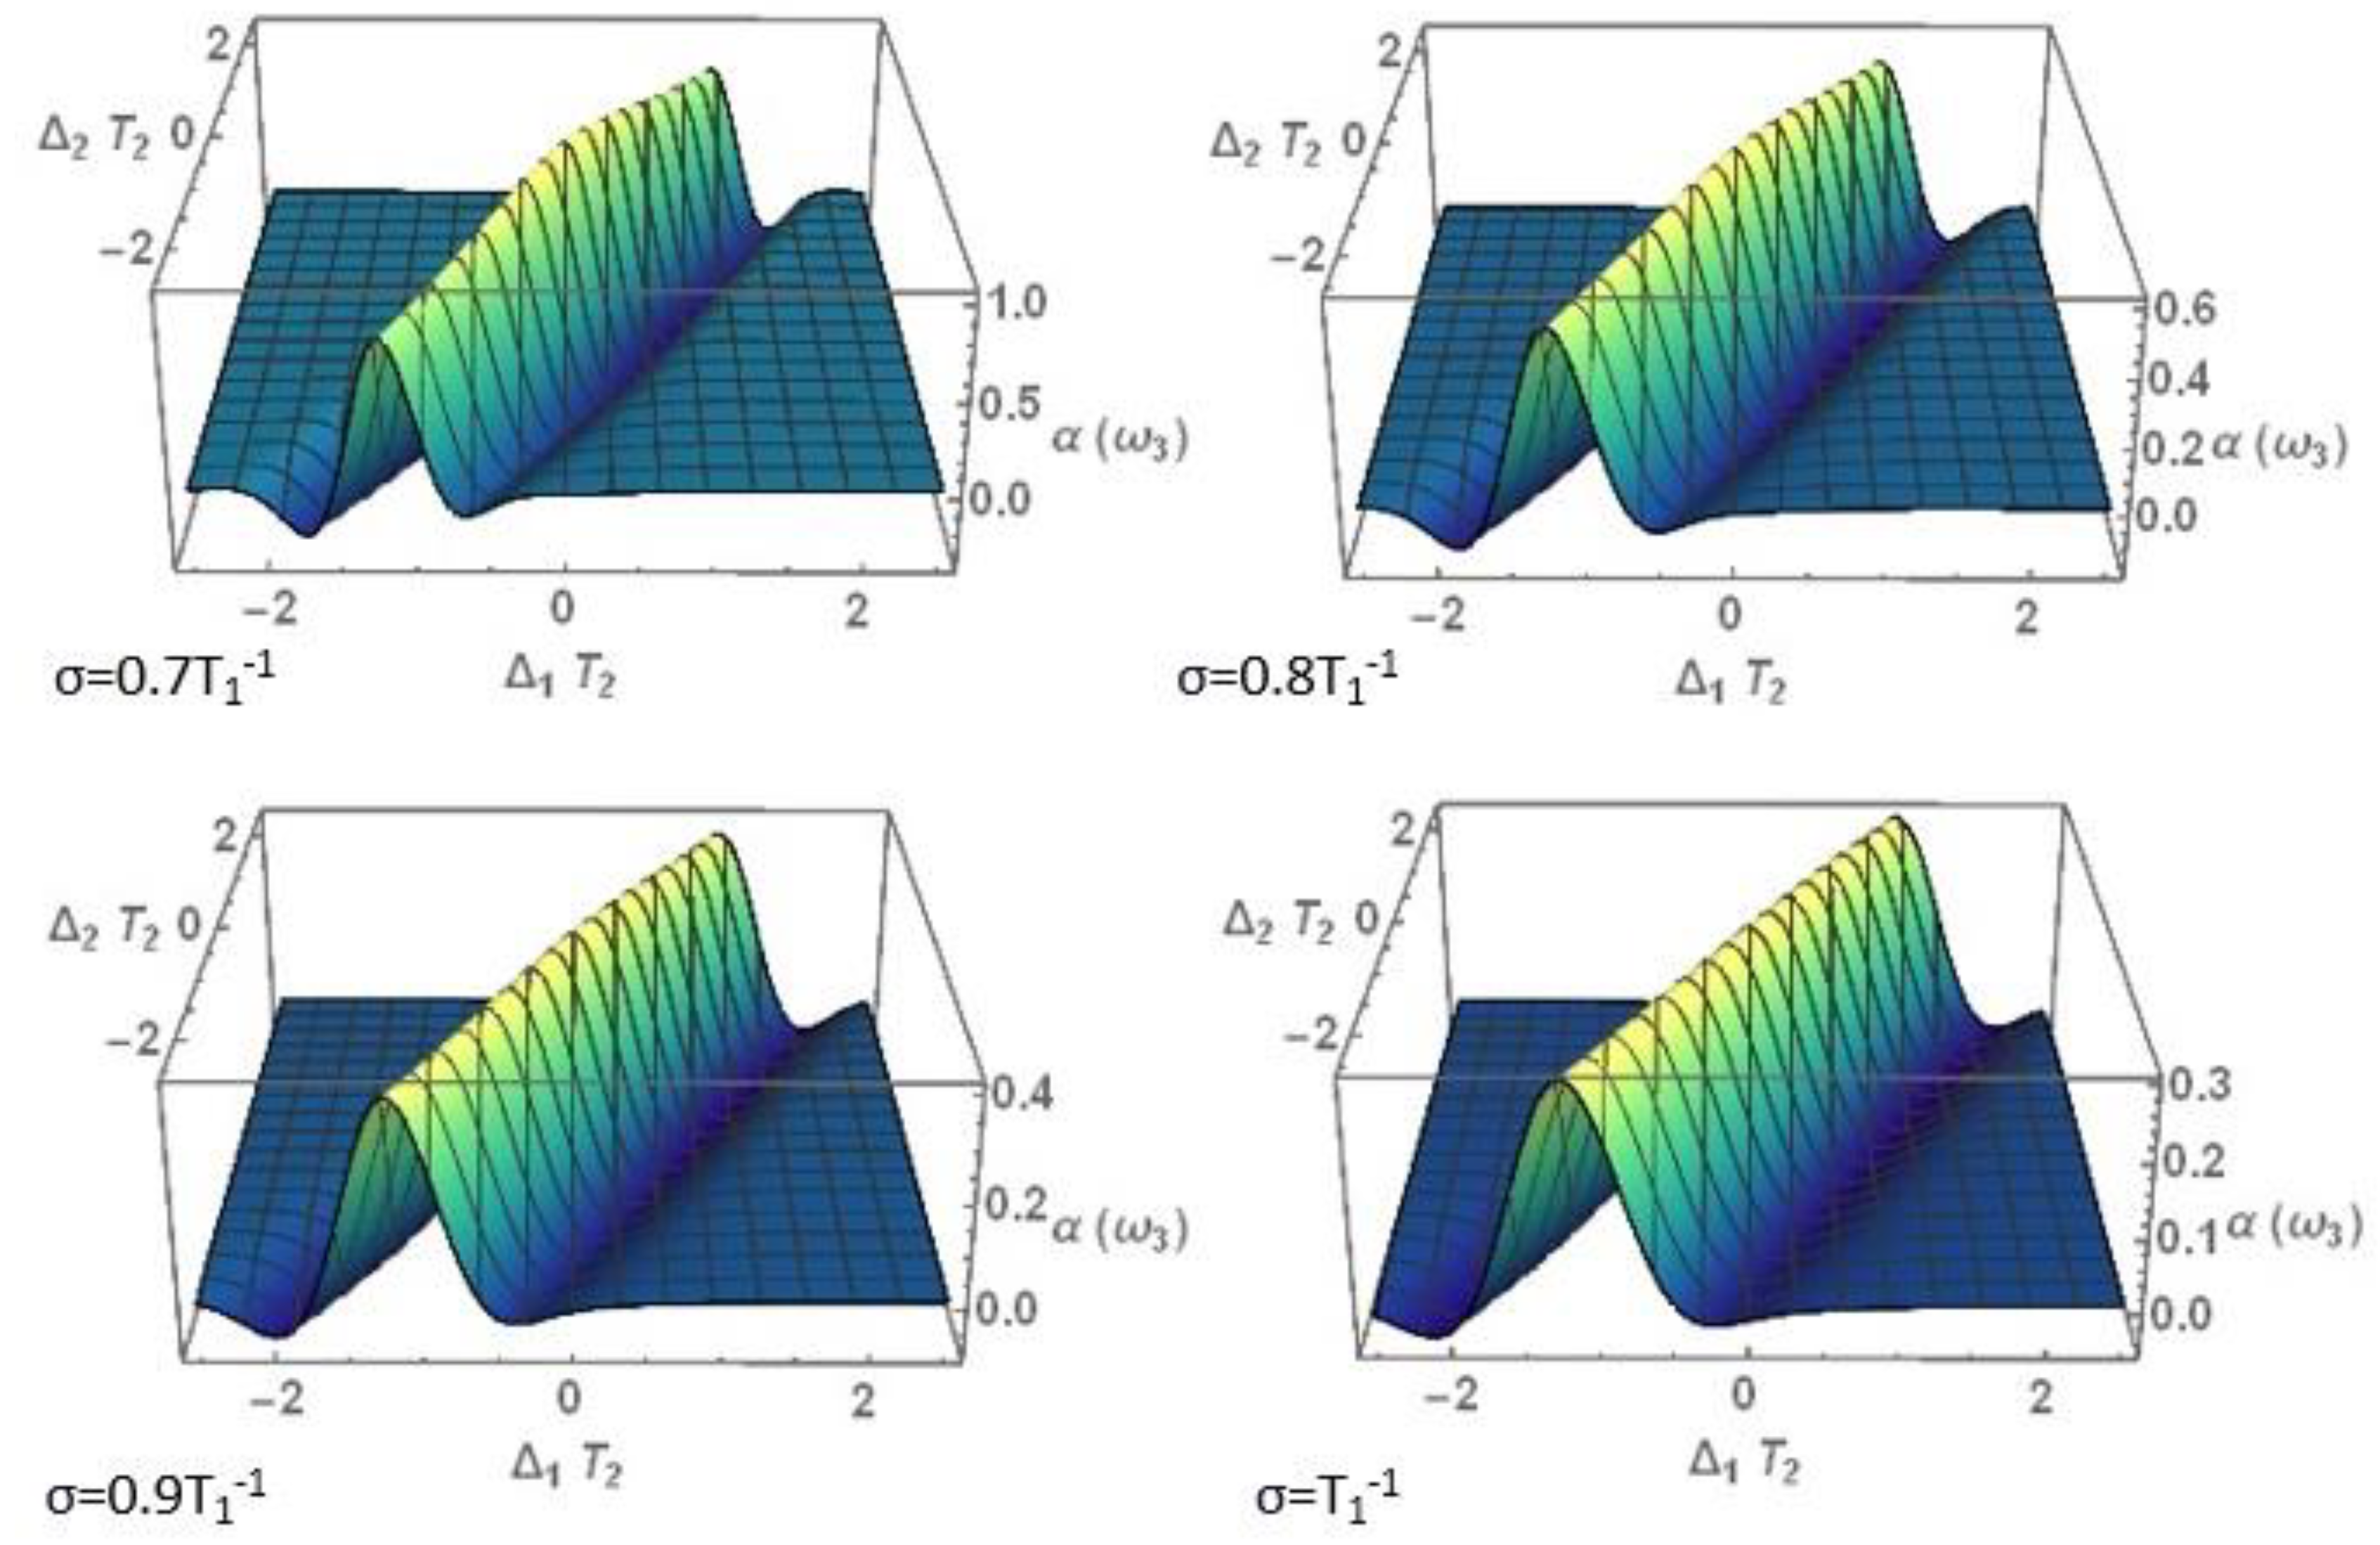
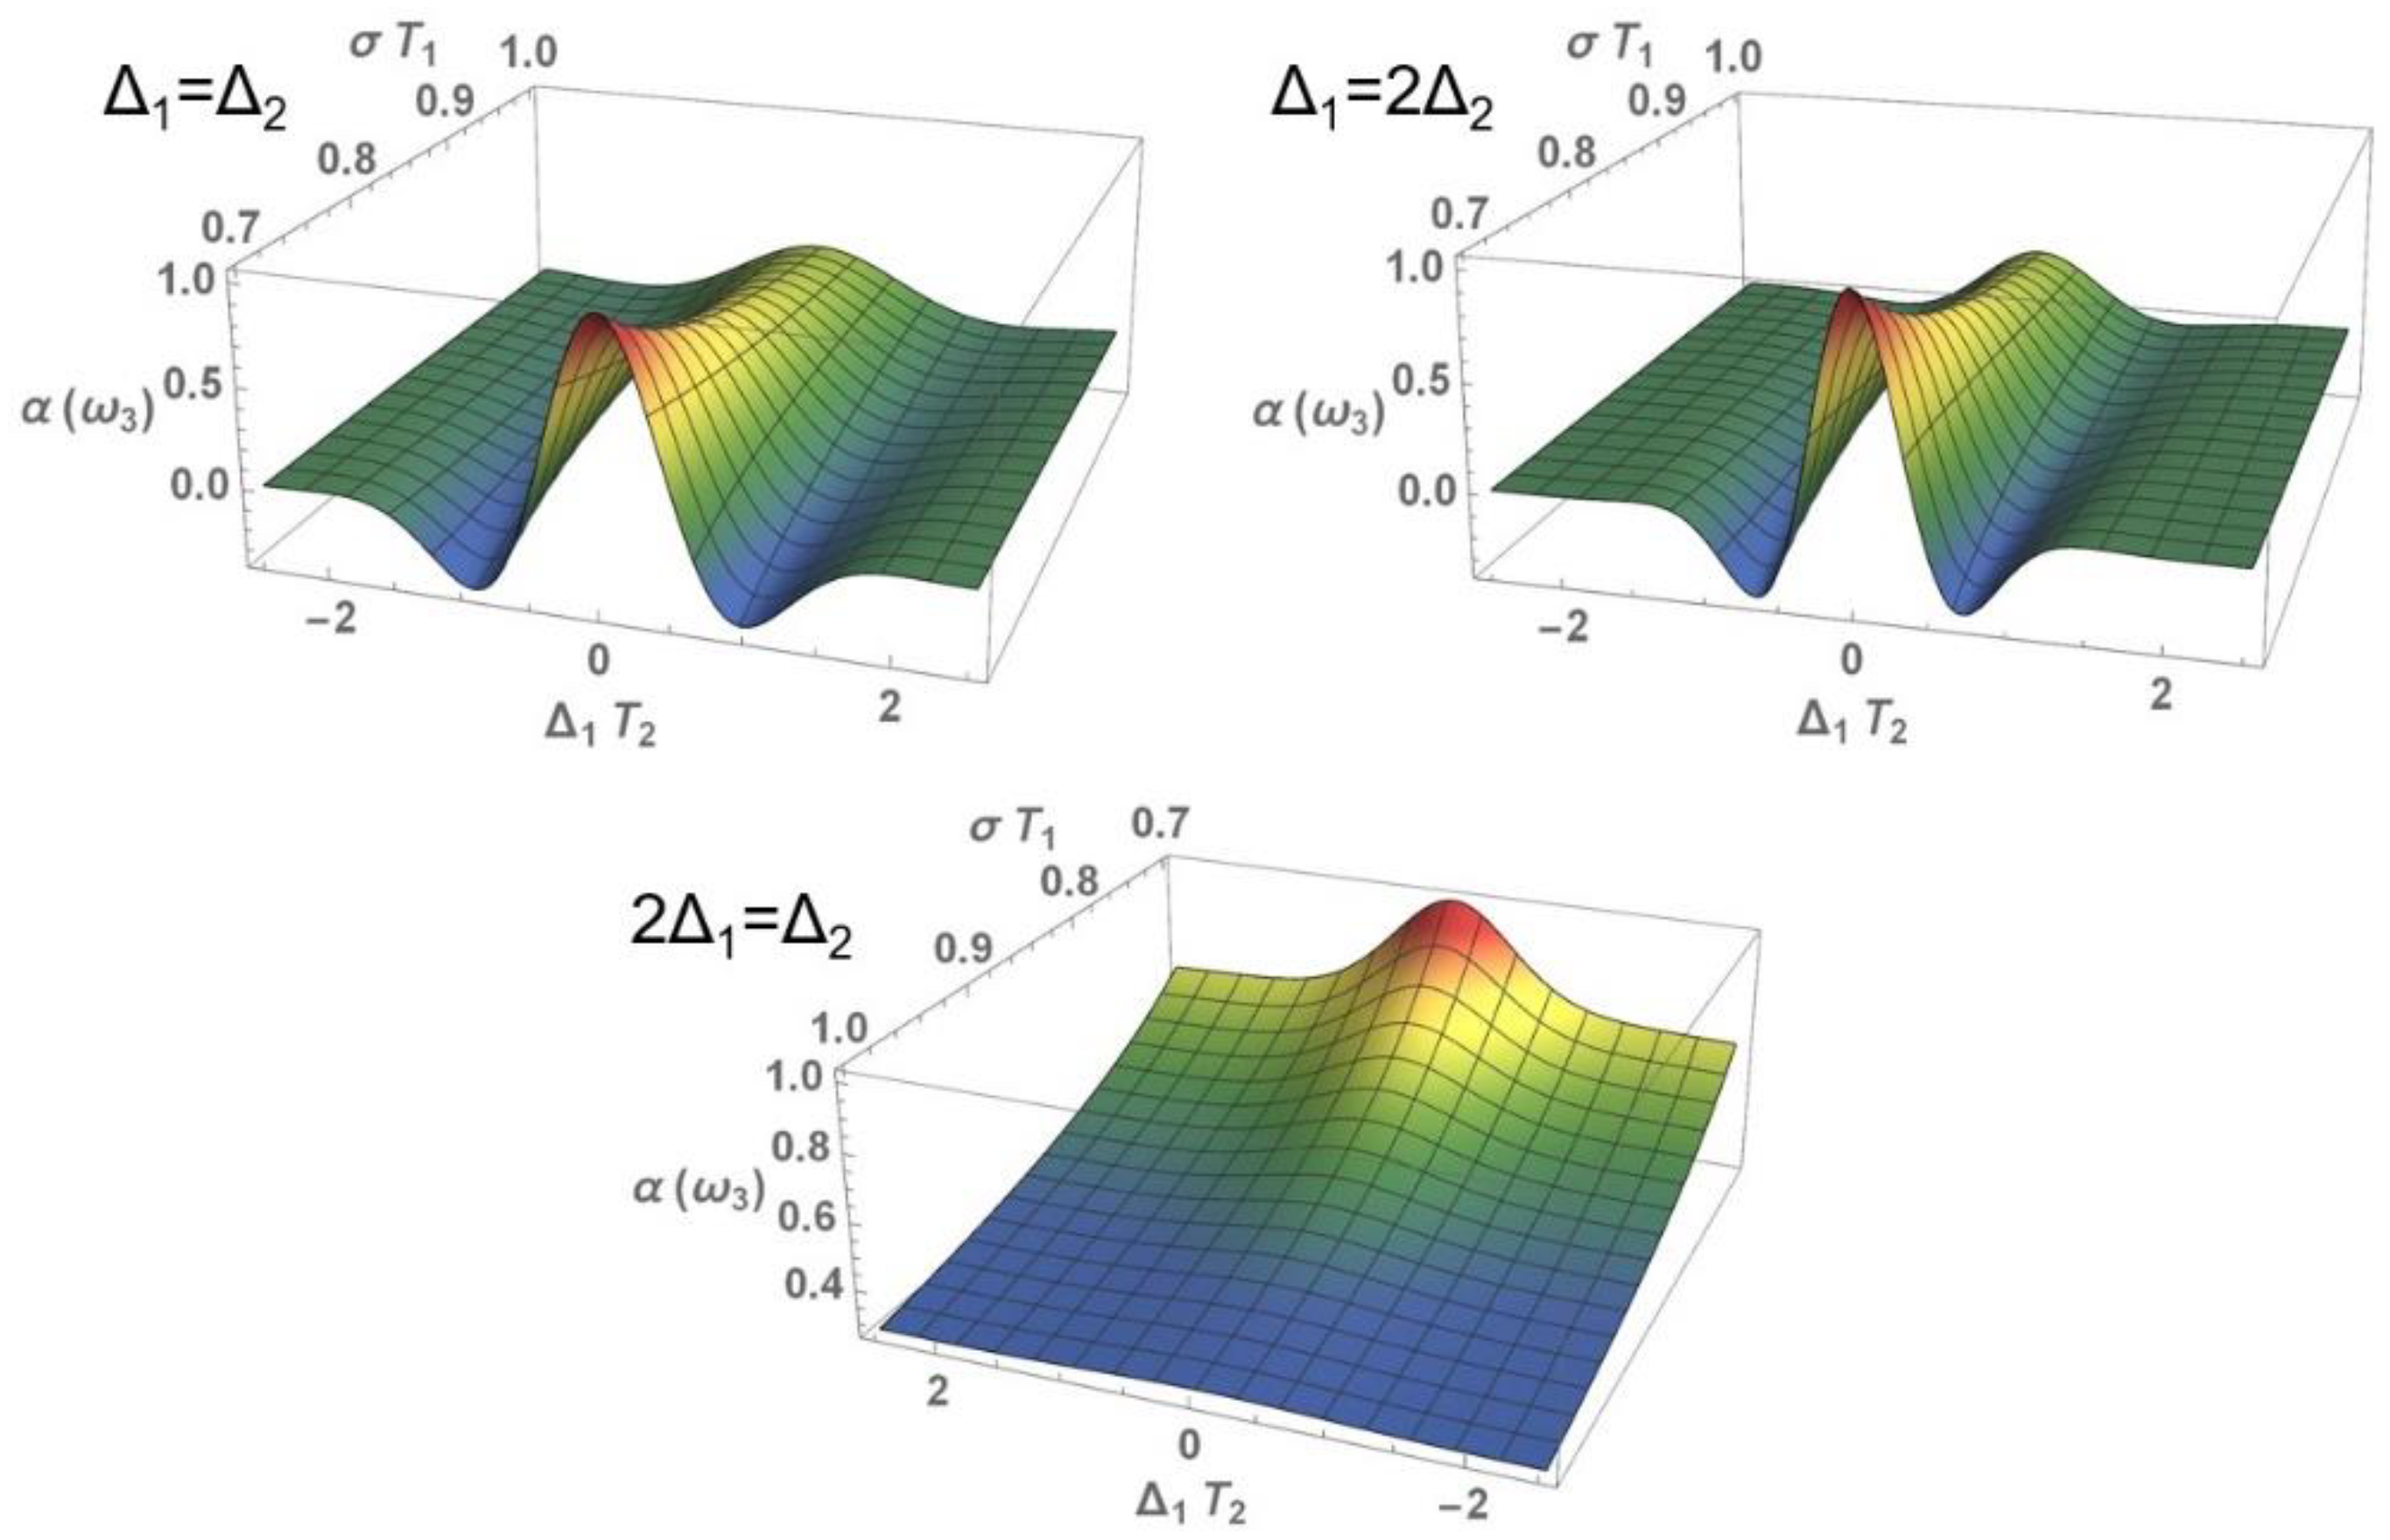
In agreement with the previous result, a longer time to reach equilibrium will lead to an intensification in light absorption, which is observed in the profiles of Figure 22, Figure 23 and Figure 24. In this case, the longer time to reach equilibrium is given by the lower coupling factor between the system of interest and the thermal reservoir through a lower number of intermolecular collisions.
We also see that in the ω 1 = ω 2 resonance the effect is very similar to the one that occurs when varying the time ratio in this profile. The two processes of resonance degenerate and are tuned to 2 ω 2 ω 1 = ω ˜ 0 show negative absorption zones mostly accentuated in weak couplings, however, in the resonance 2 ω 1 ω 2 = ω ˜ 0 , the spectrum tends to be extinguished with the greater increase of the strong coupling with the solvent. It is evident that, for higher coupling values, the randomness increases and the movements of the potential minima of the two harmonic curves make the transition less effective and considerably decrease the absorption of the system, producing extreme broadening and decreased absorption in the MPO zone.
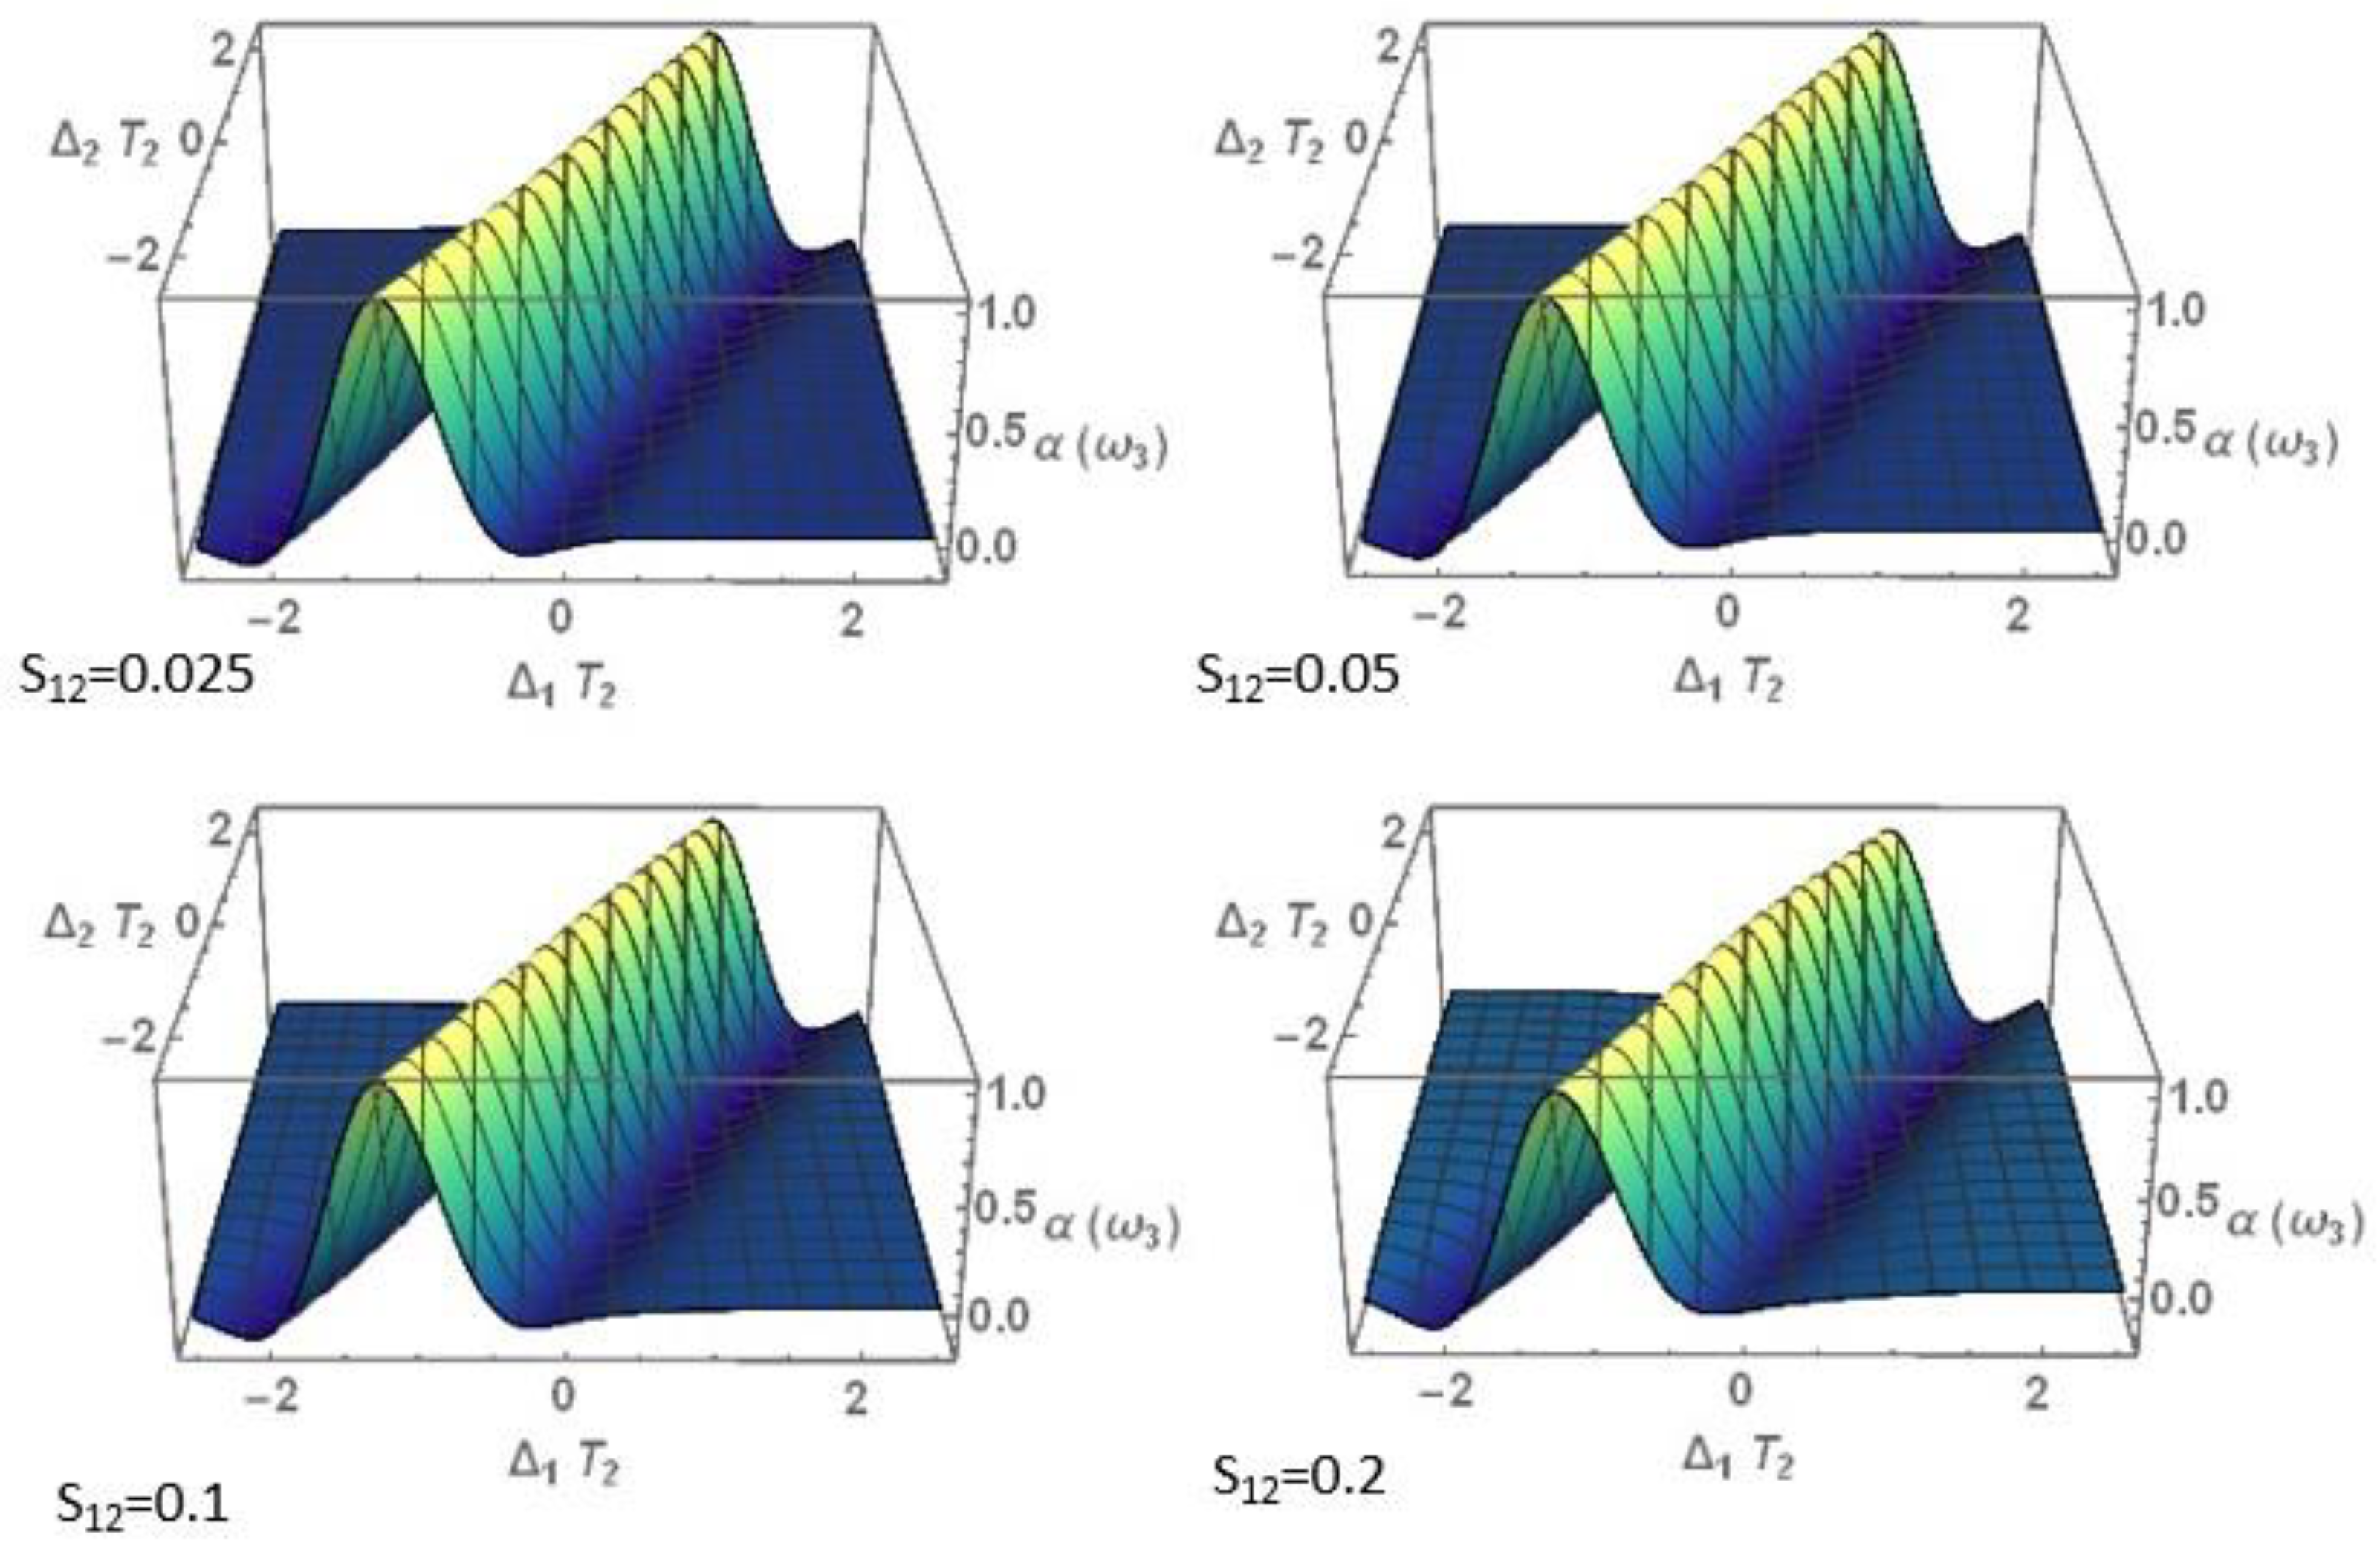
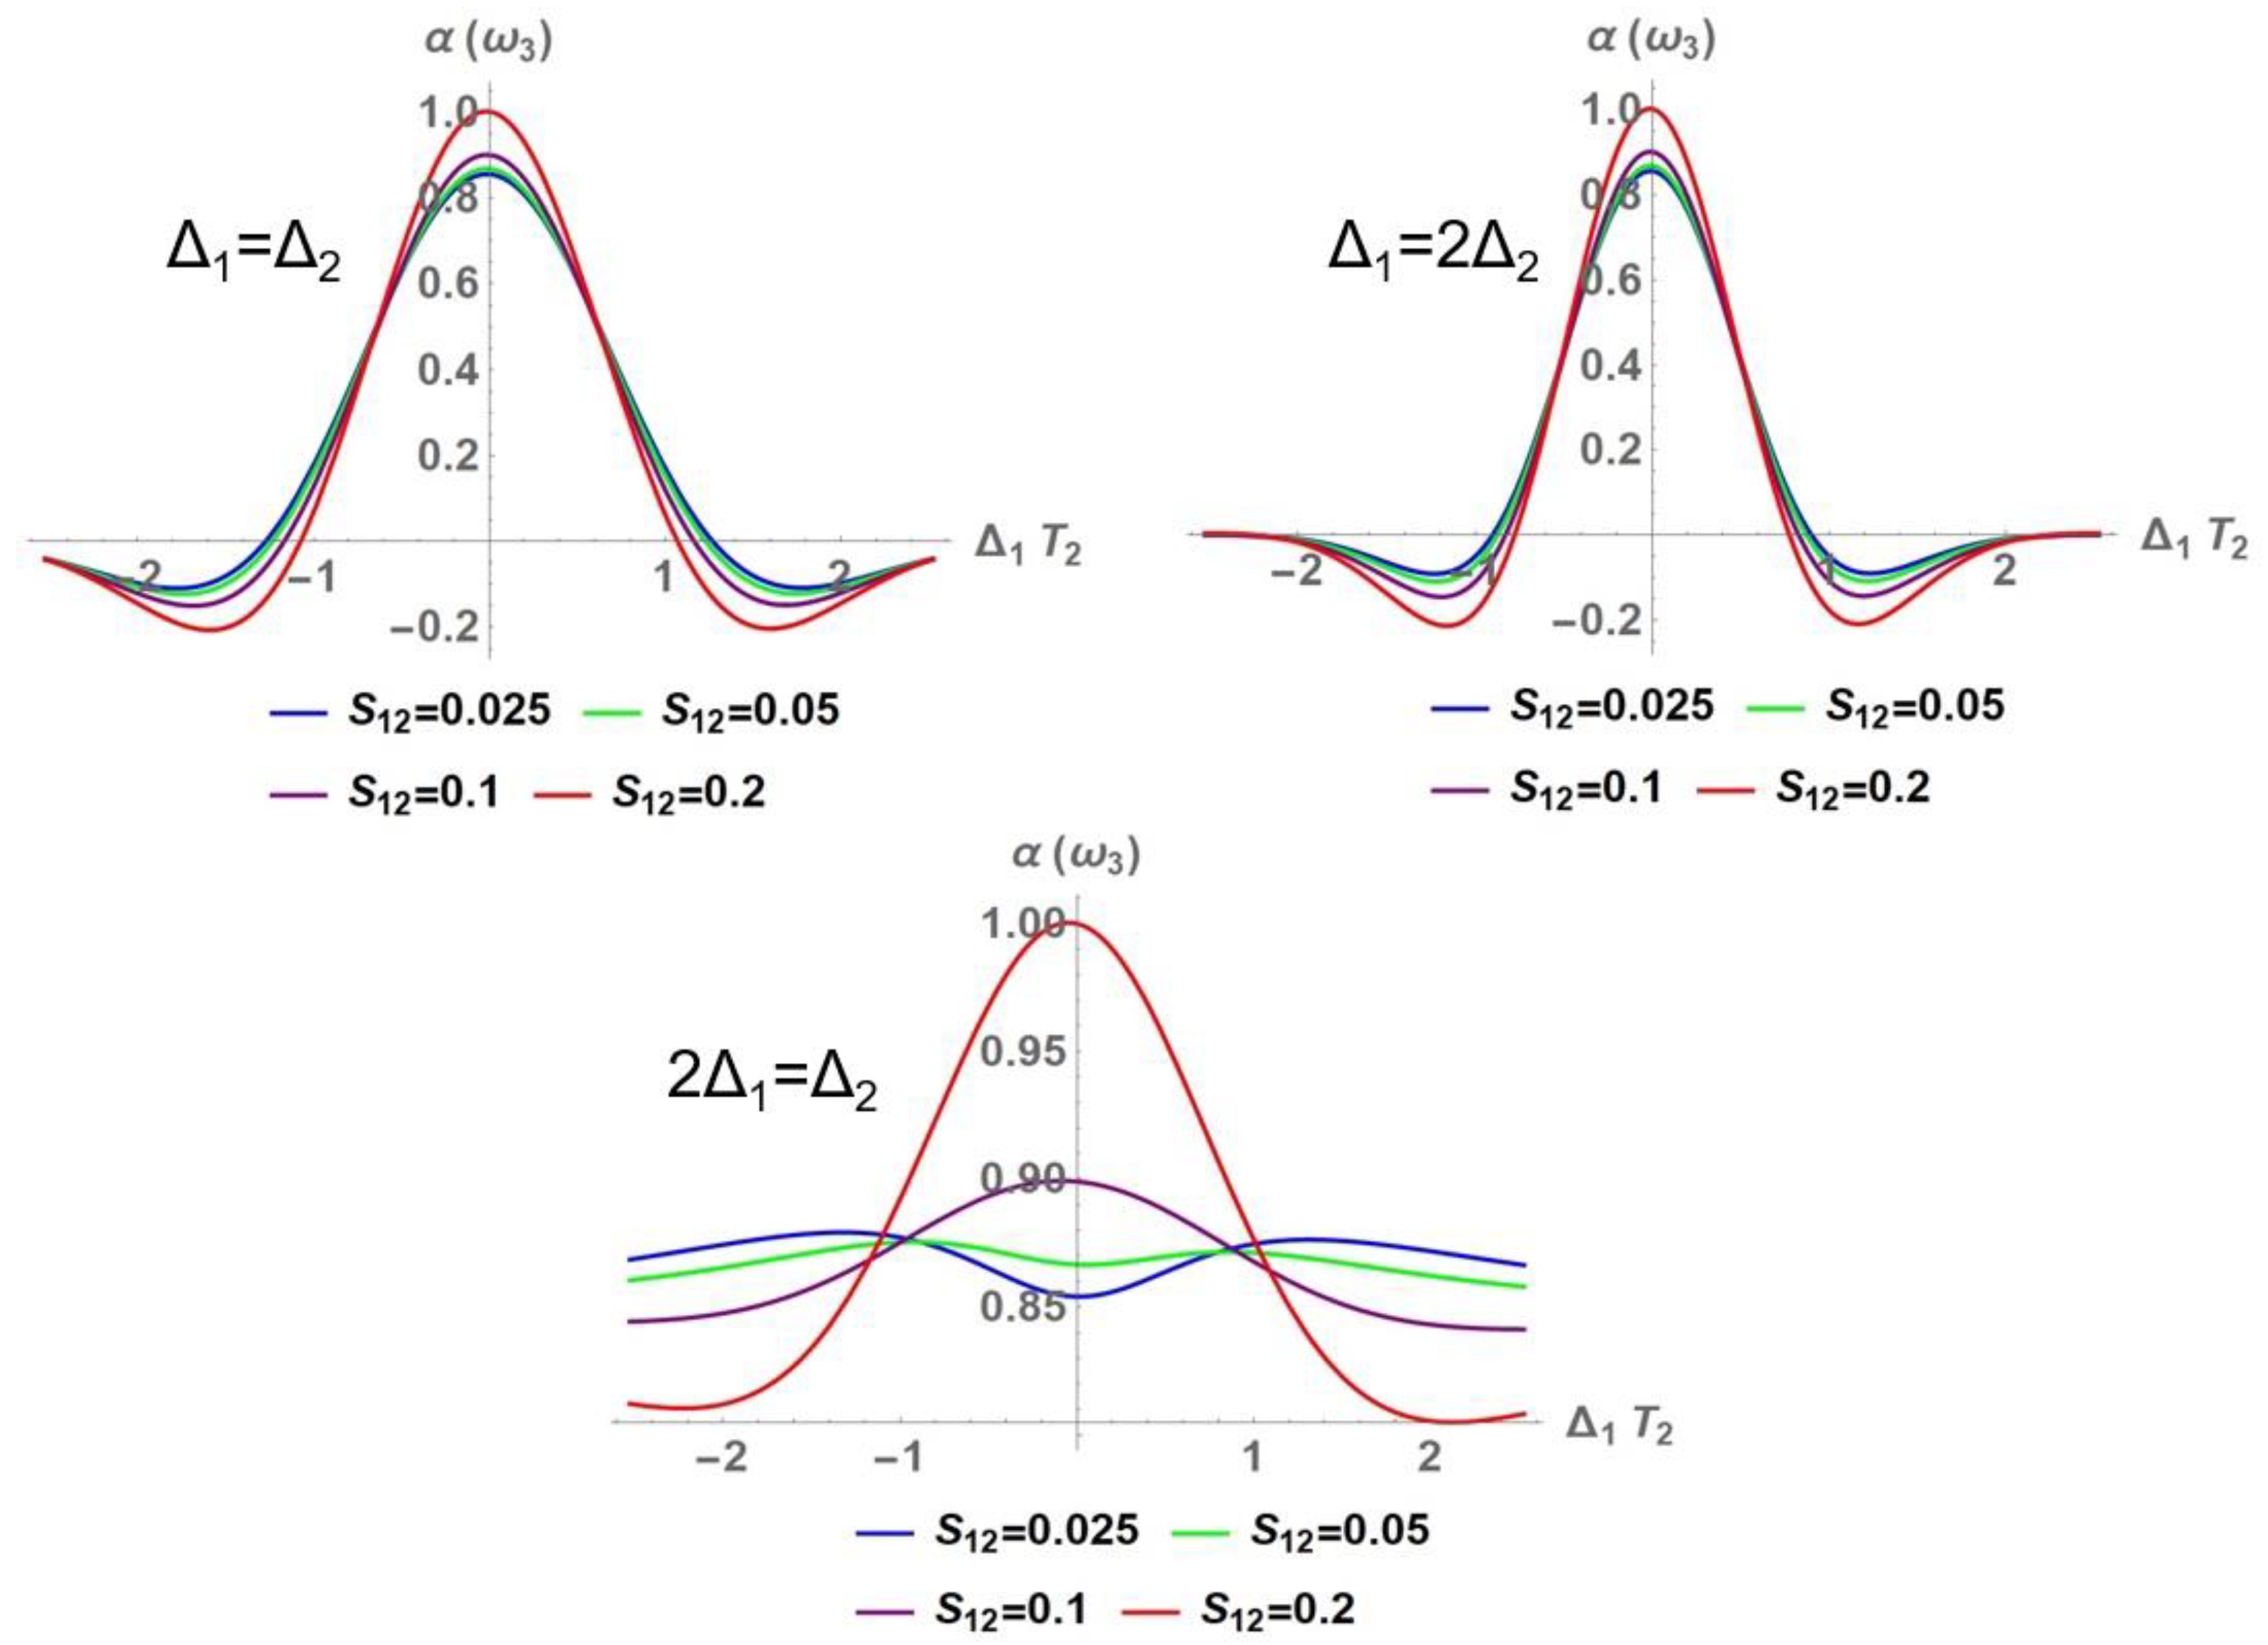
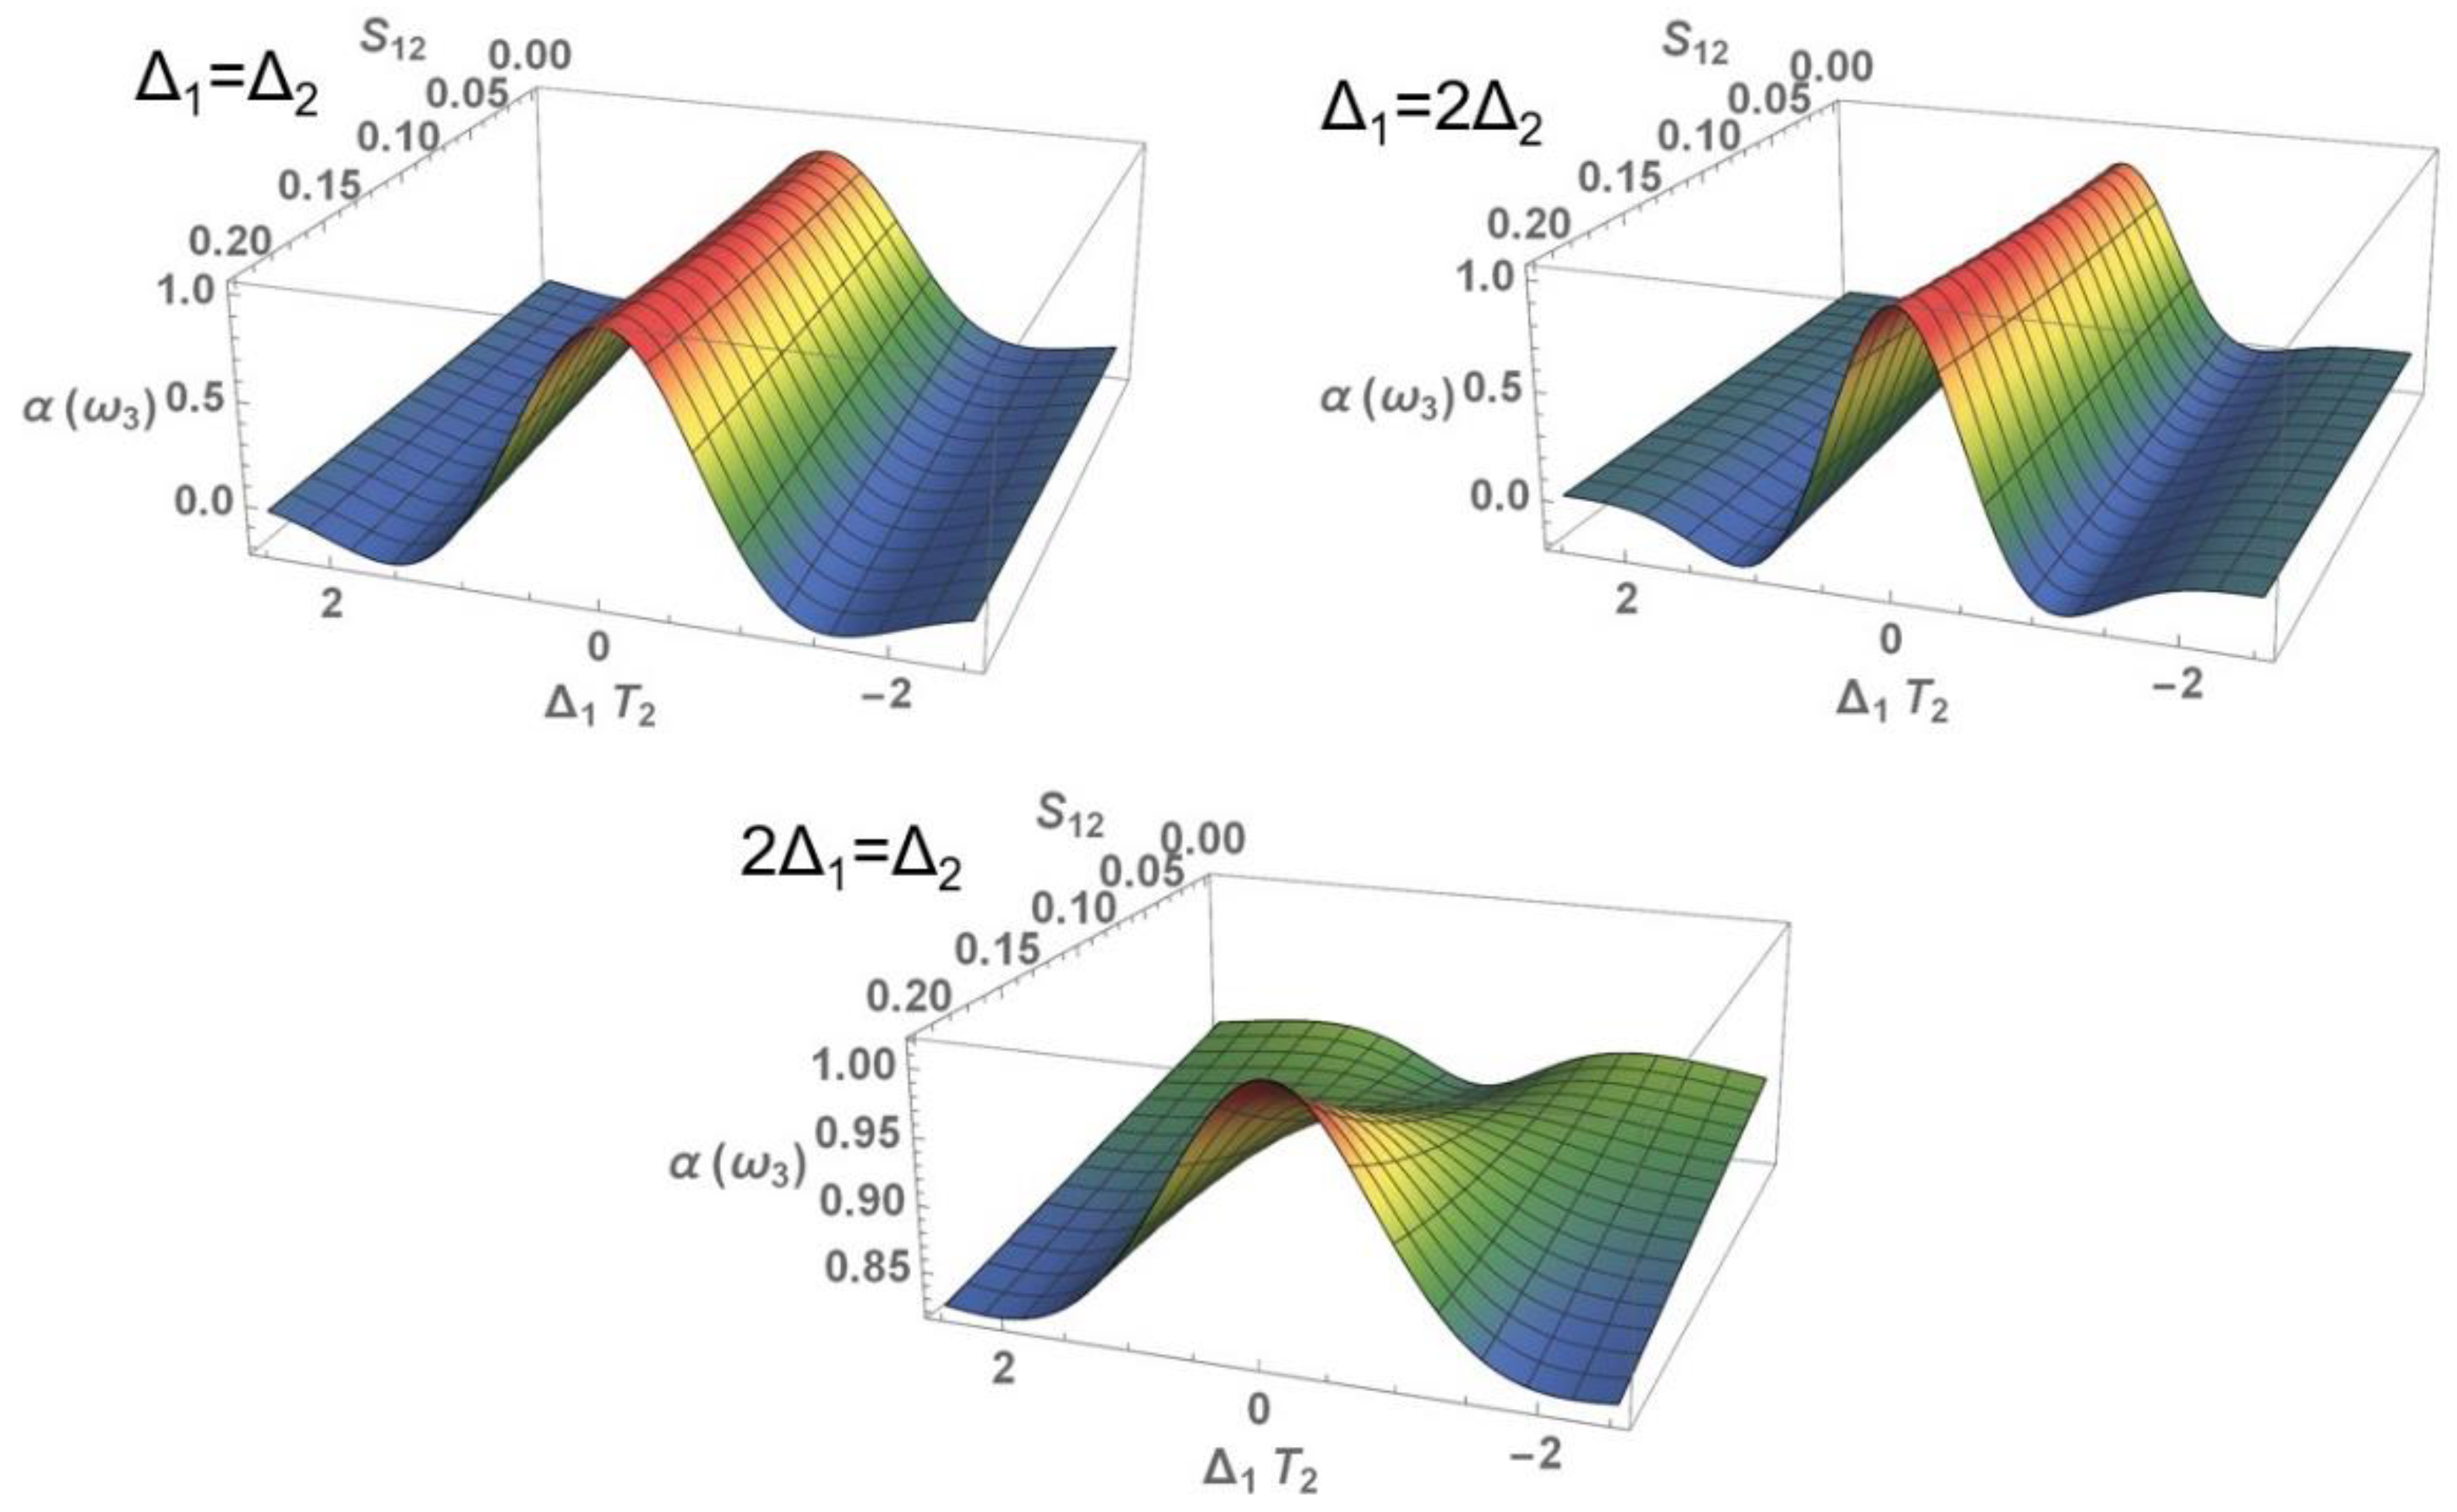
The absorption profiles of the signal beam can be seen in Figure 25, Figure 26 and Figure 27. In general, increasing saturation will mean that the upper level is more populated and there is less room for an absorption transition since the population of the ground state will be smaller, which can be seen in the profiles up to a certain detuning value.
However, as the detuning value is closer to zero, the absorption will begin to grow even when the saturation is also growing, since as the electromagnetic wave has a frequency closer to the transition frequency, even when the population of the basal level is lower, the probability of transition and the absorption increase.
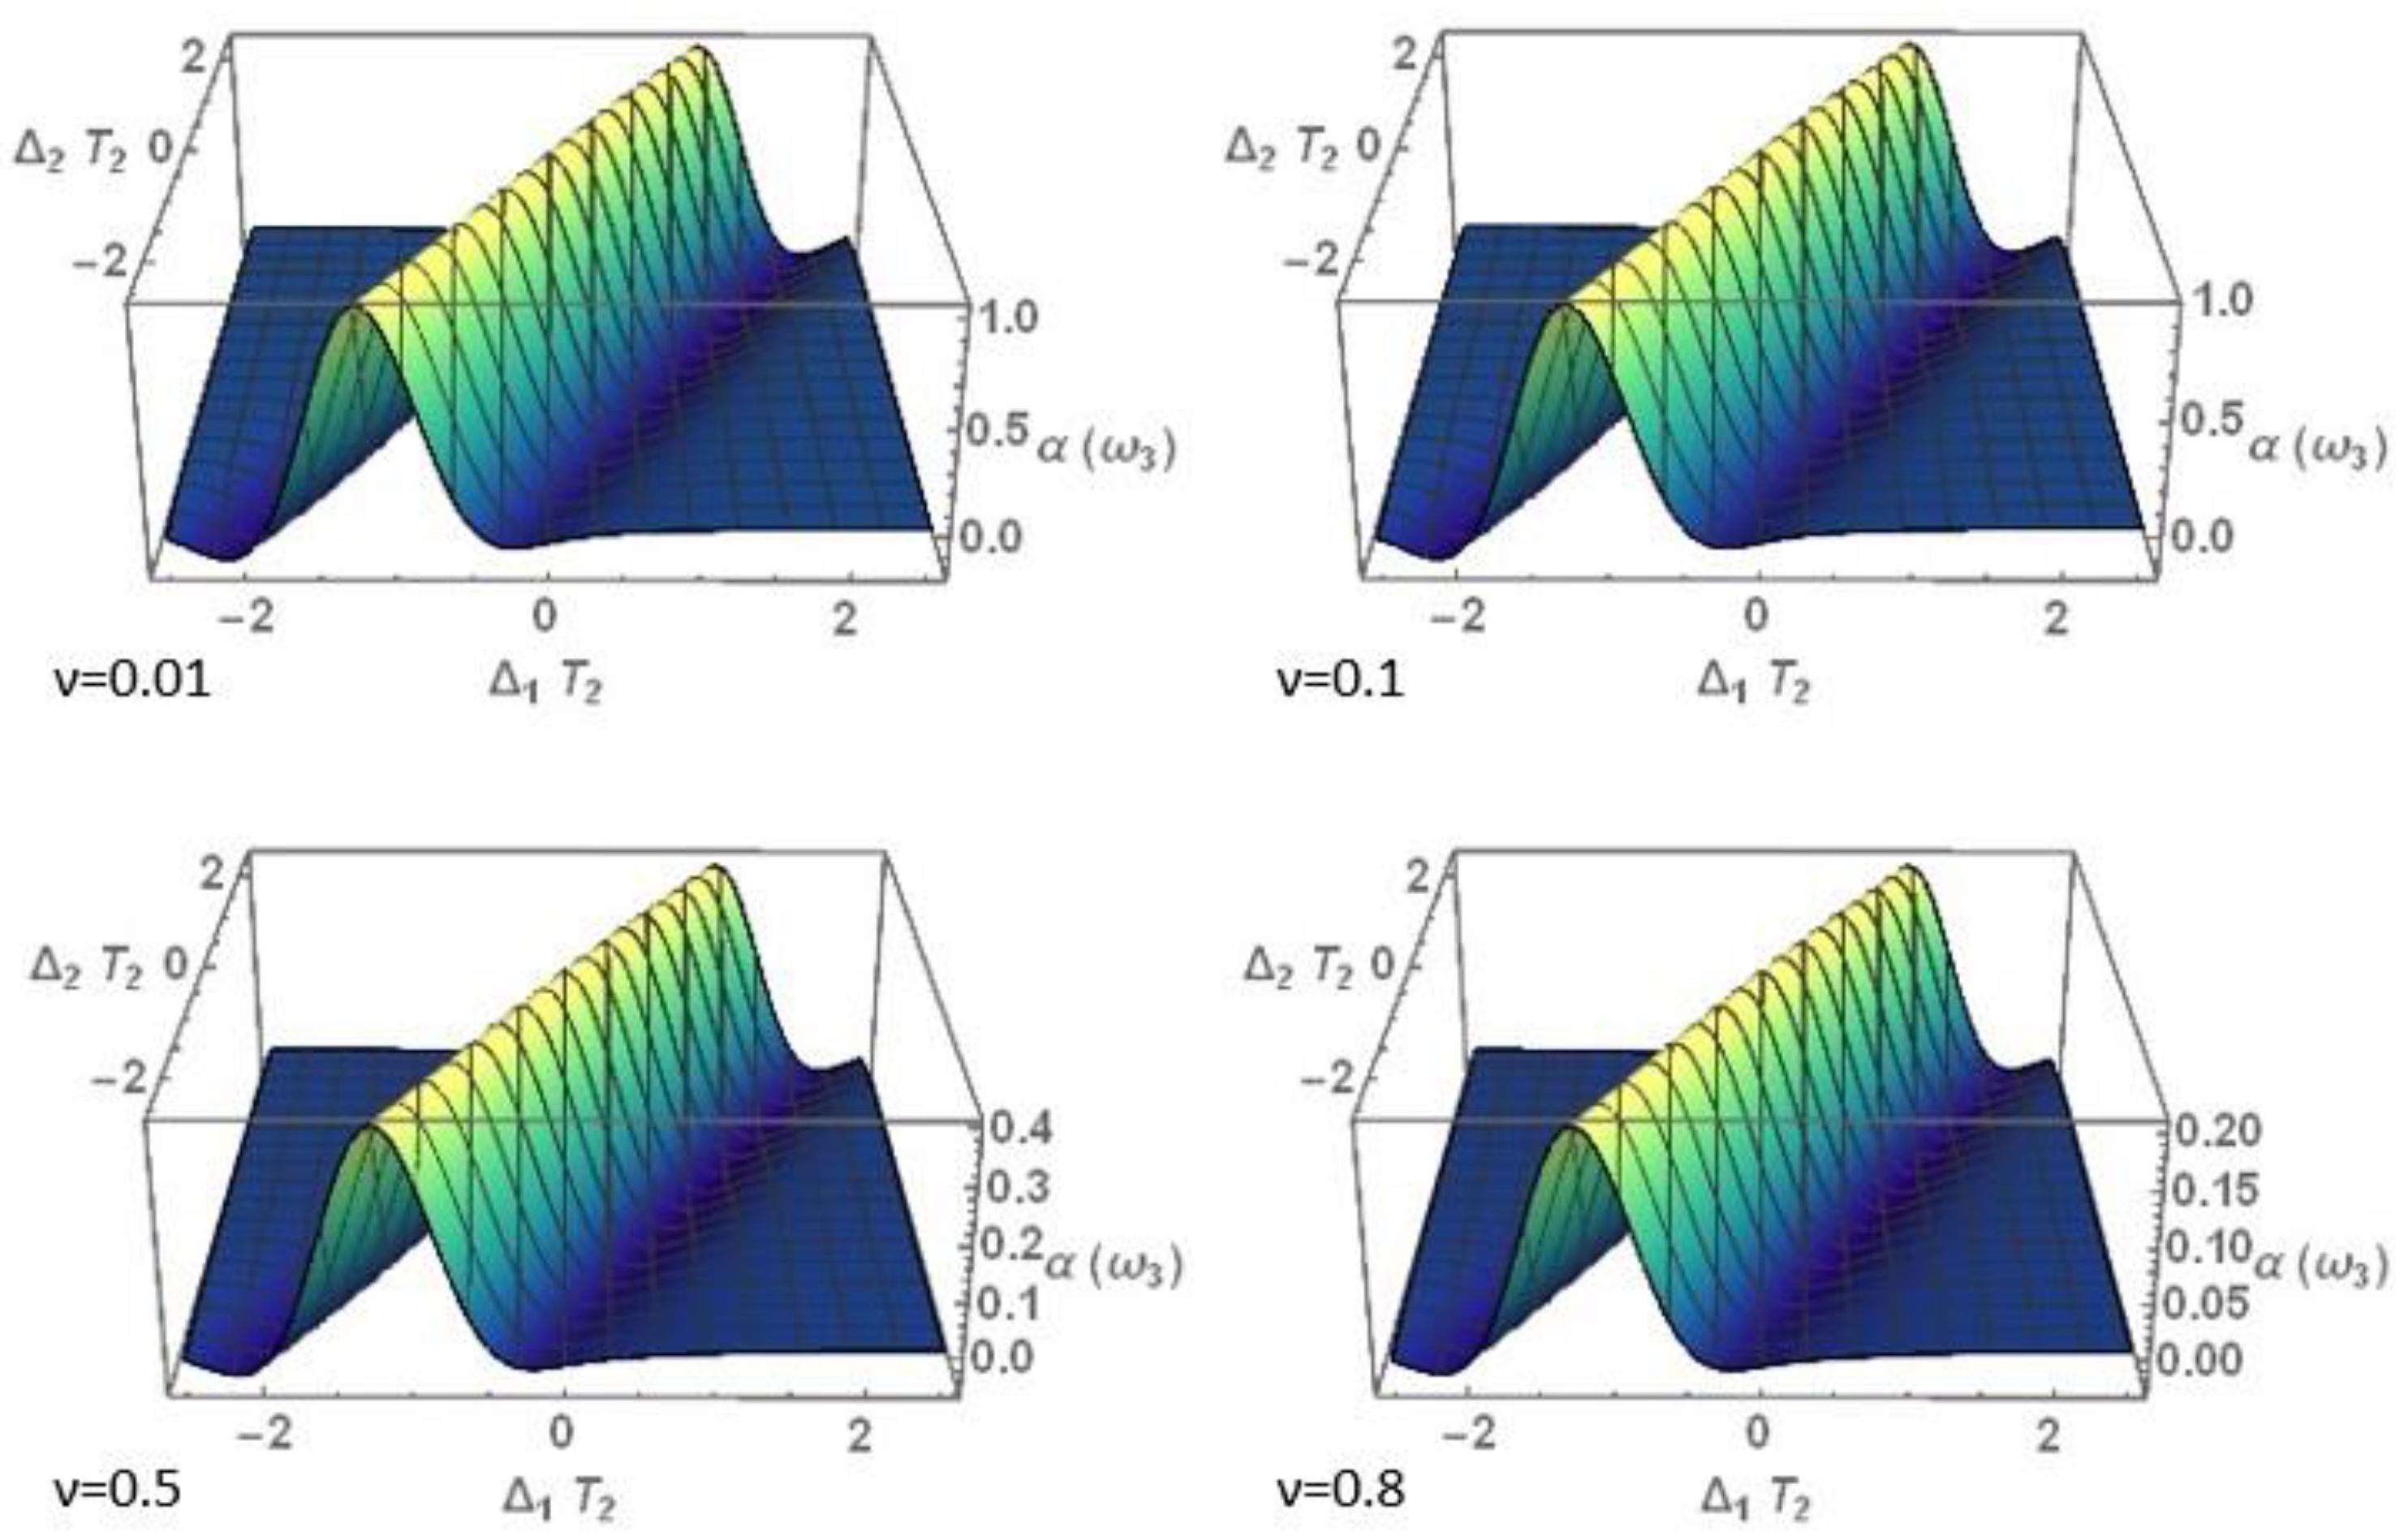
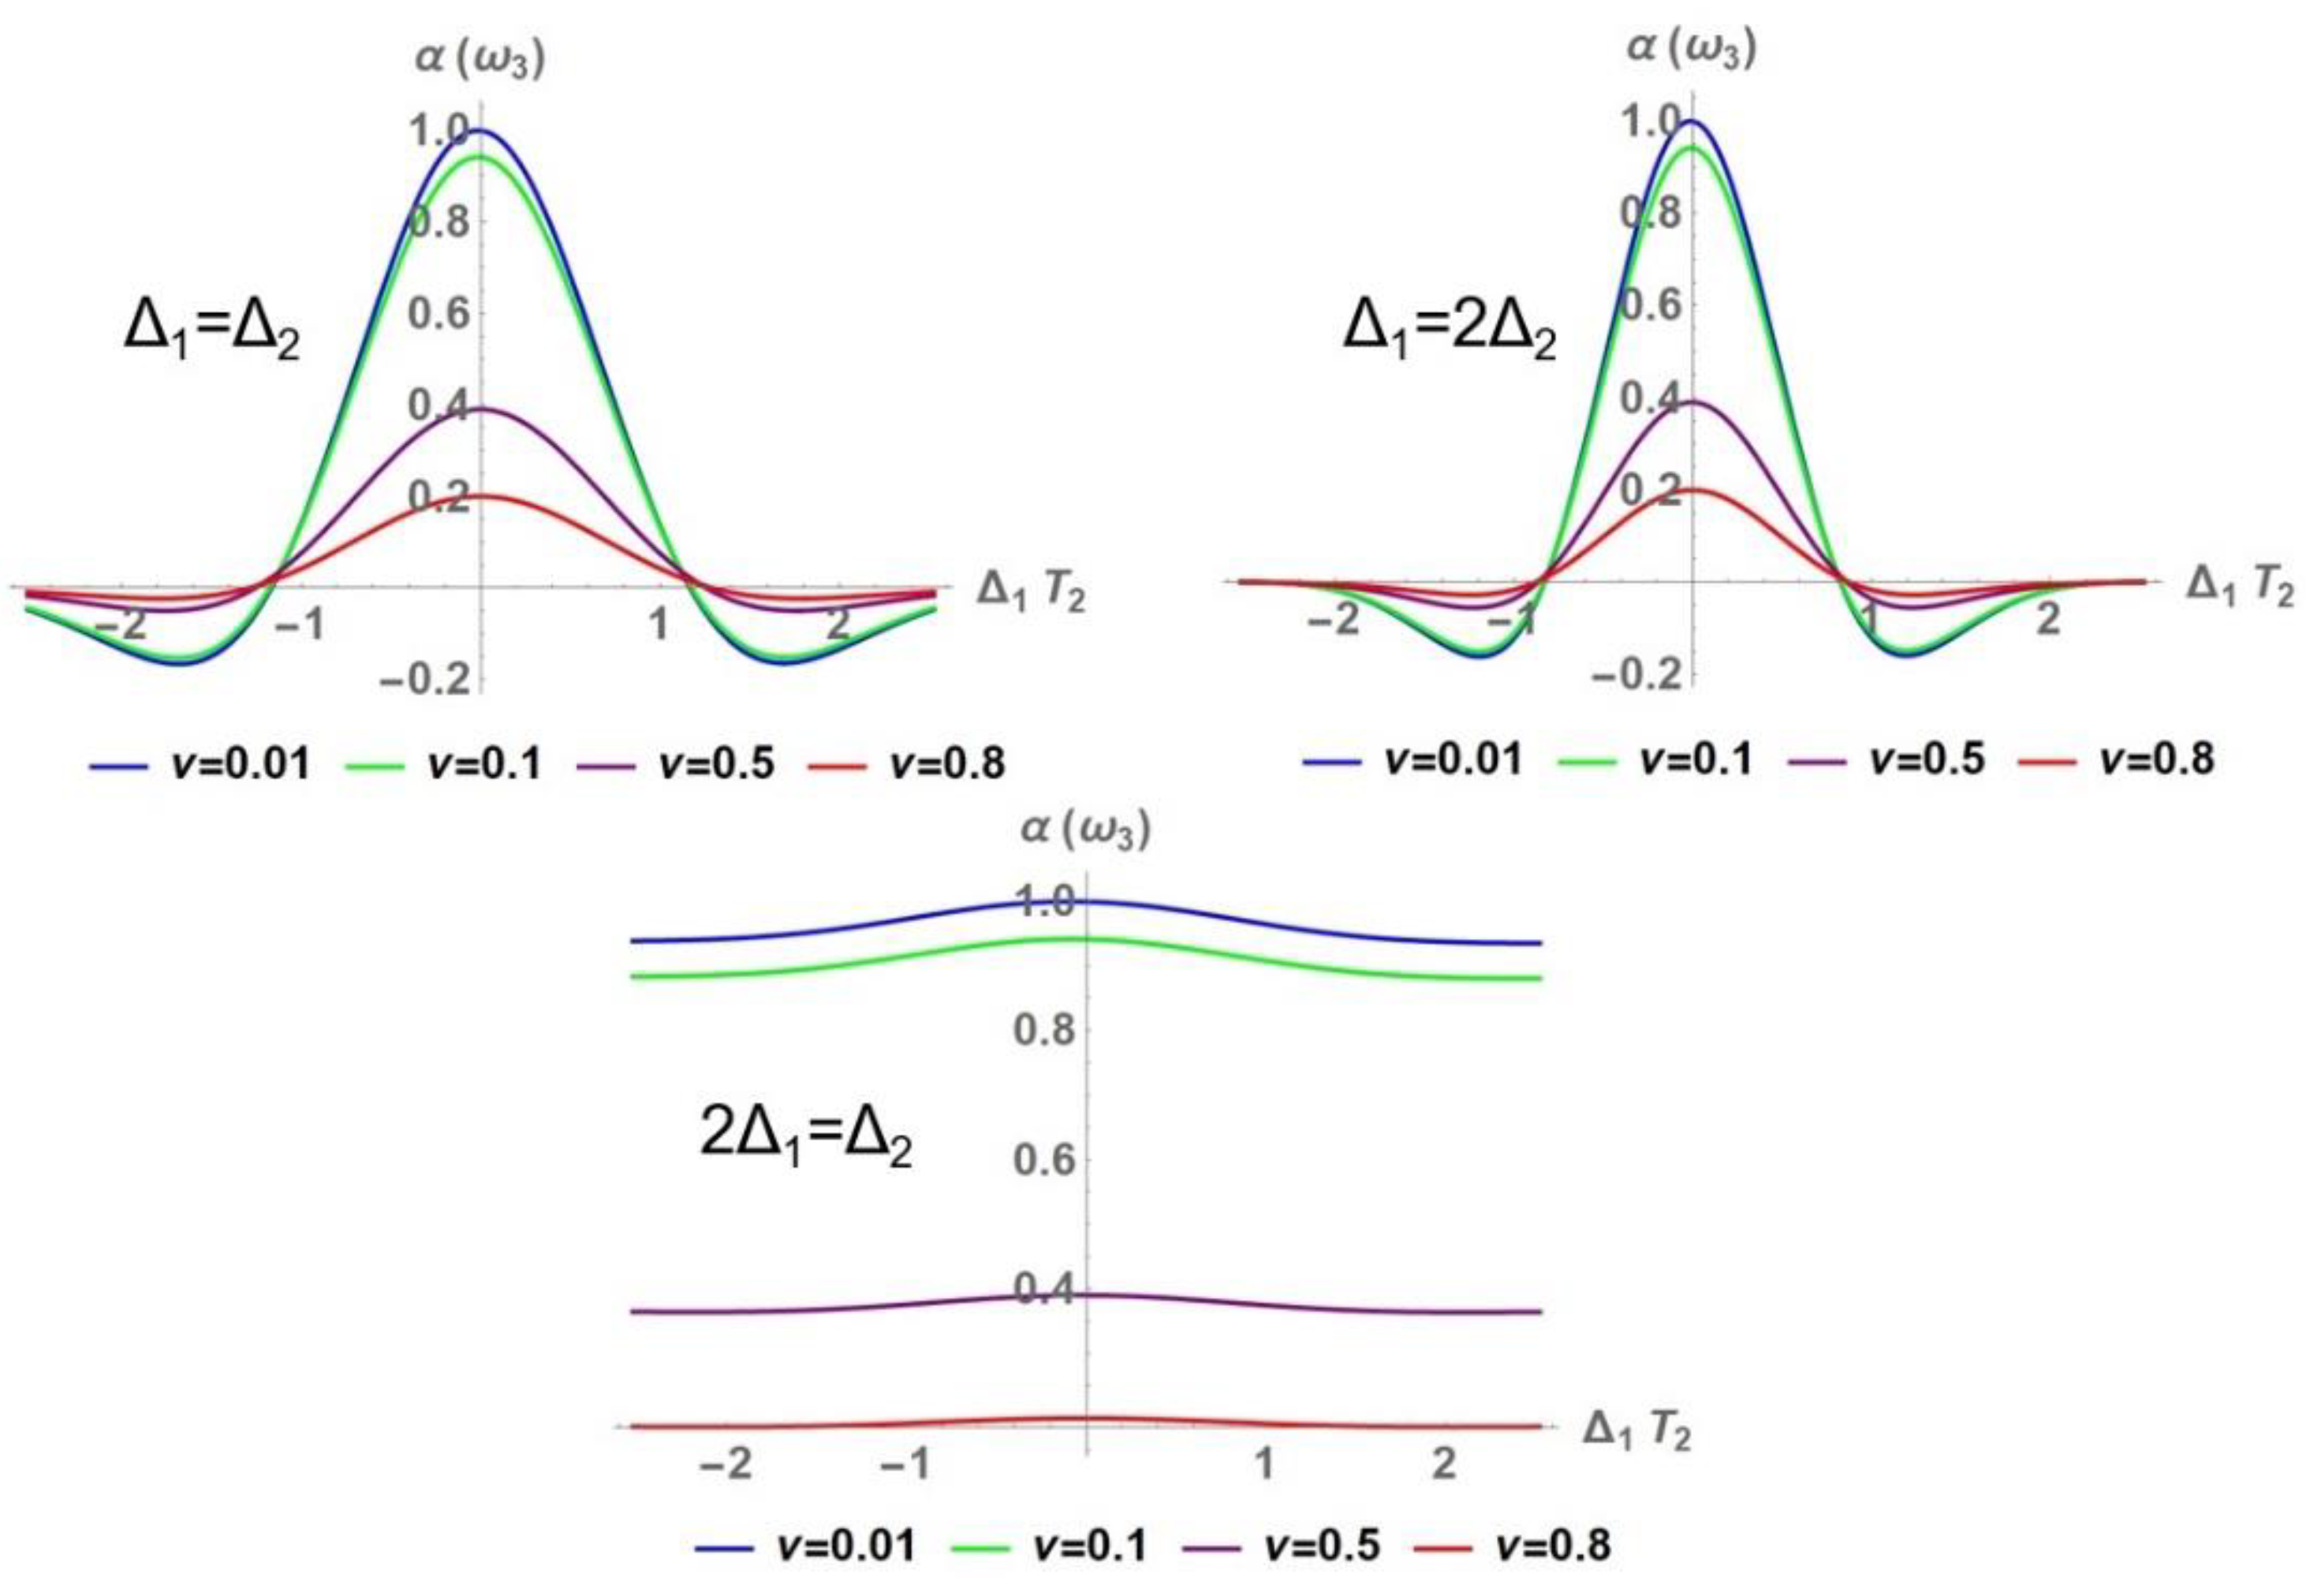
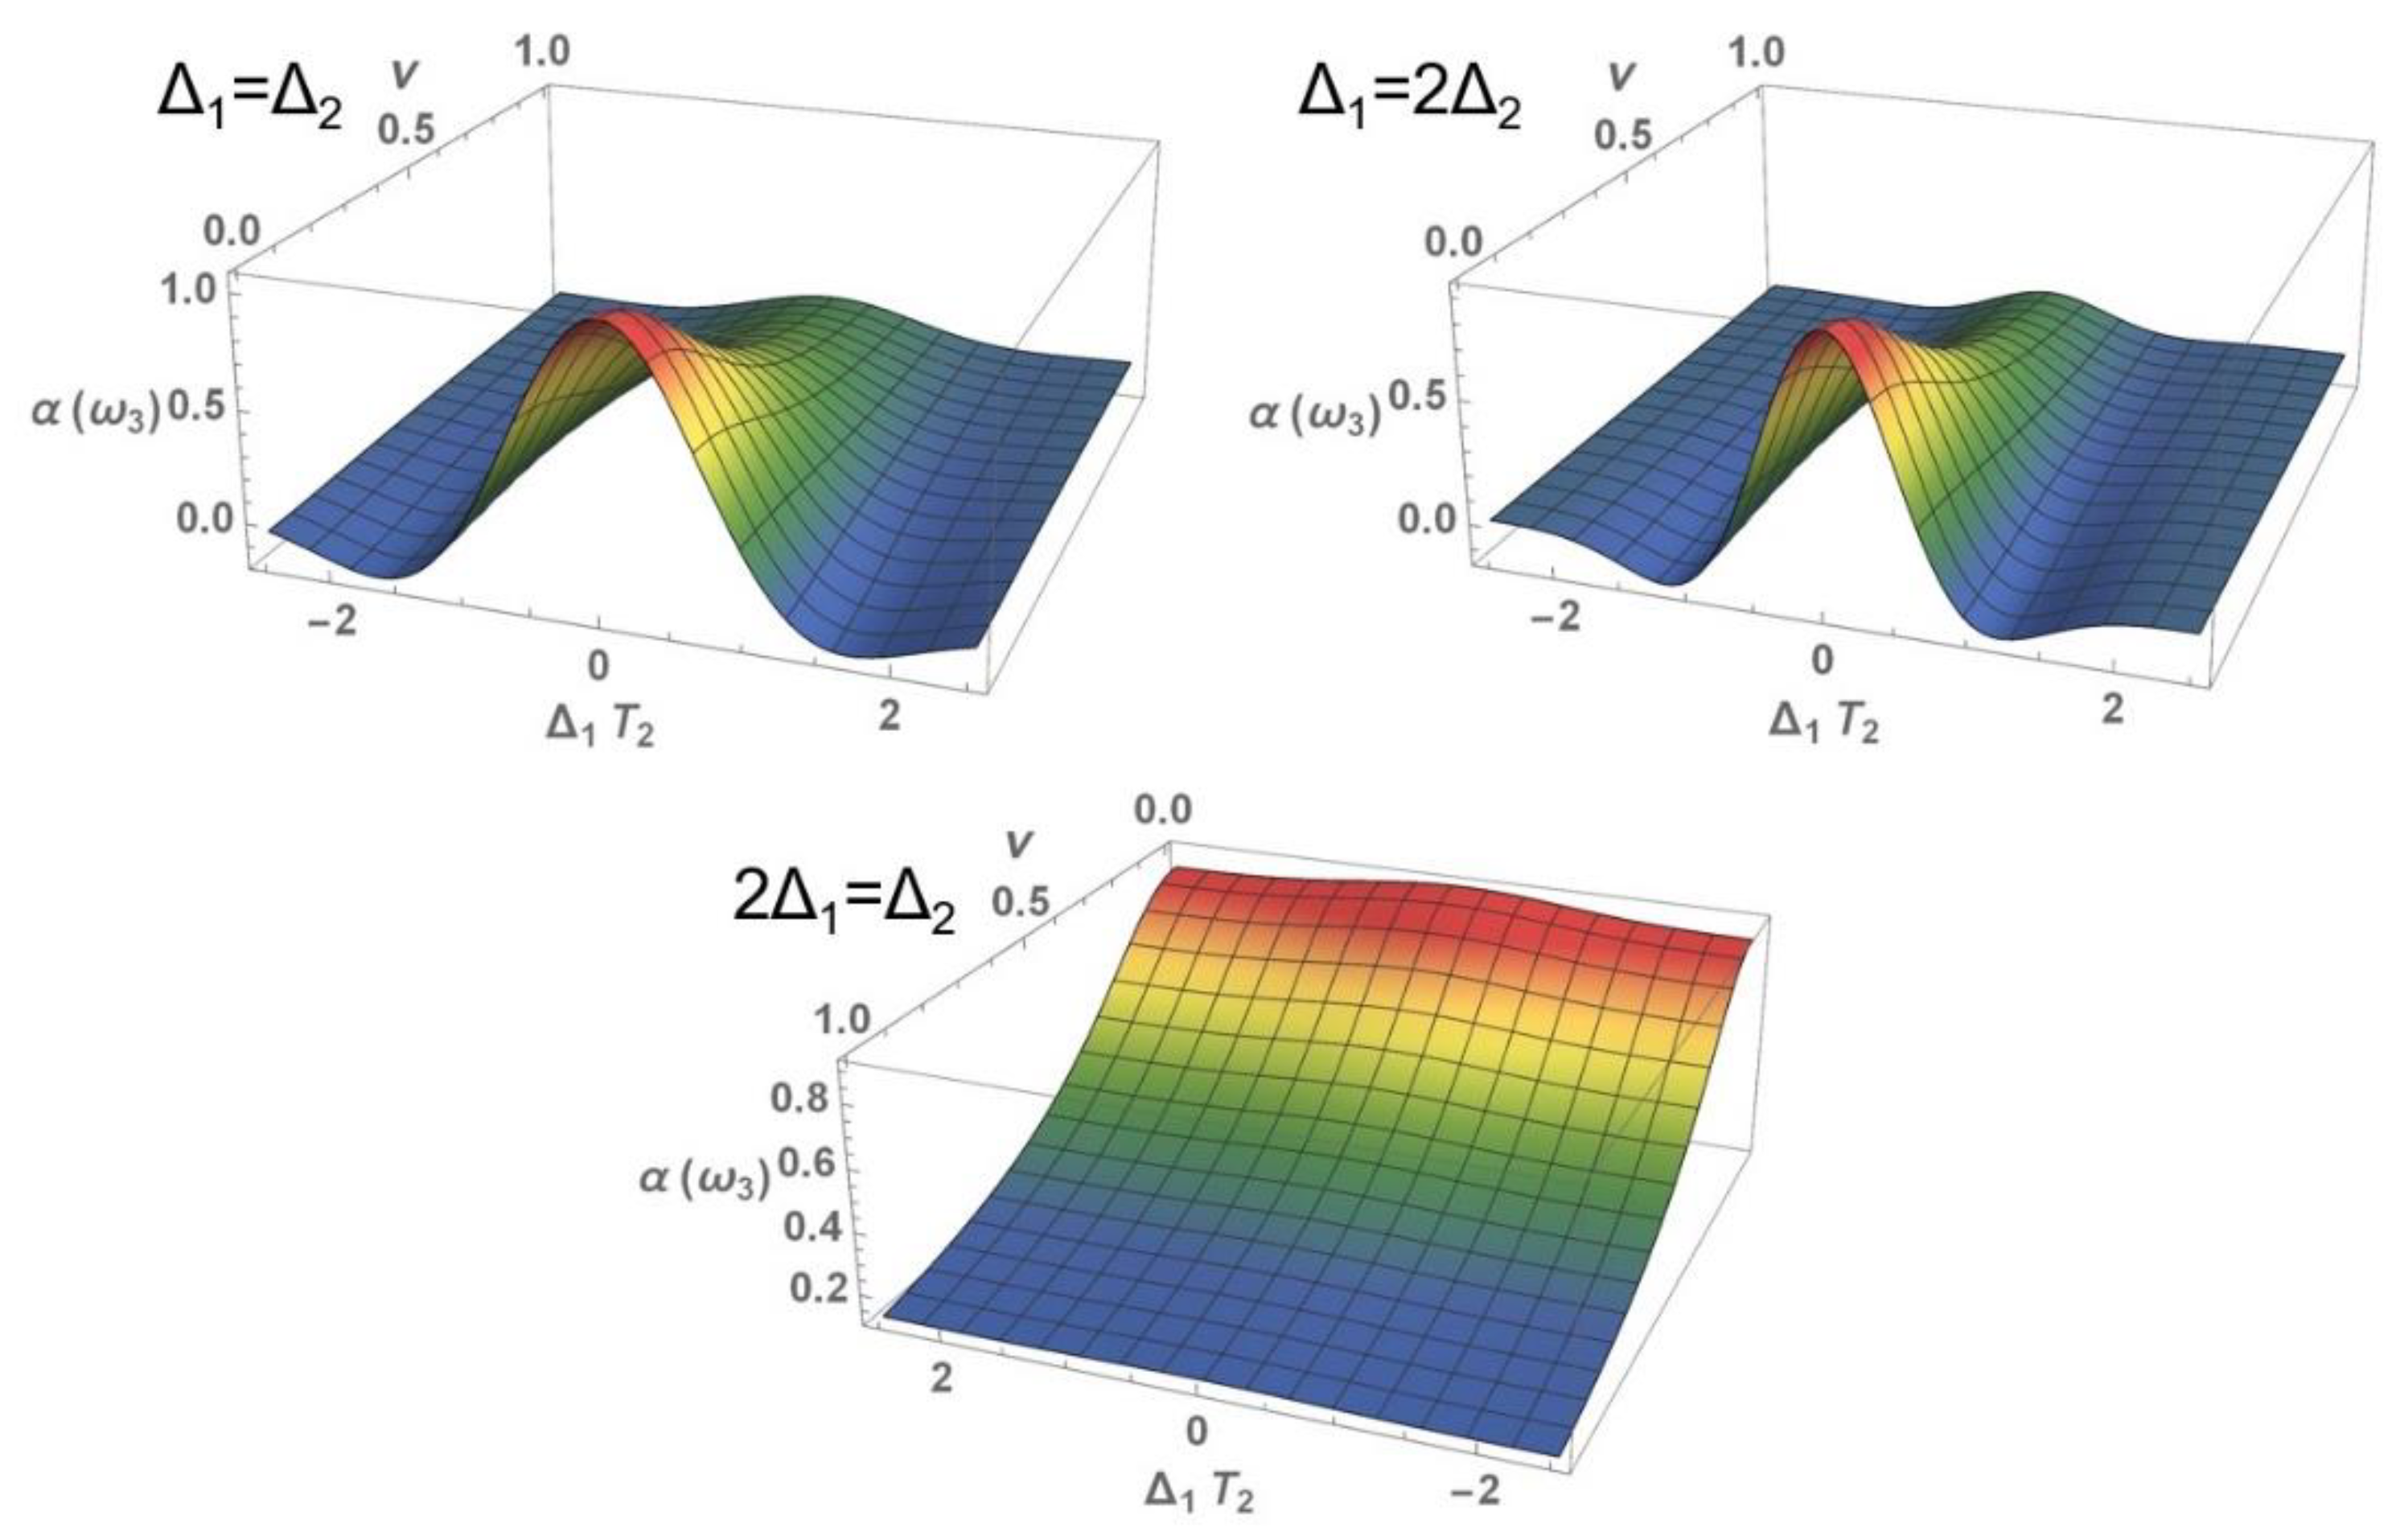
The effect of intramolecular coupling on the absorption profiles is shown in Figure 28, Figure 29 and Figure 30. Following a similar reasoning as in the scattering case, the absorption coefficient will increase as the intramolecular coupling decreases, due to the effect of the latter on the transition dipole moment.
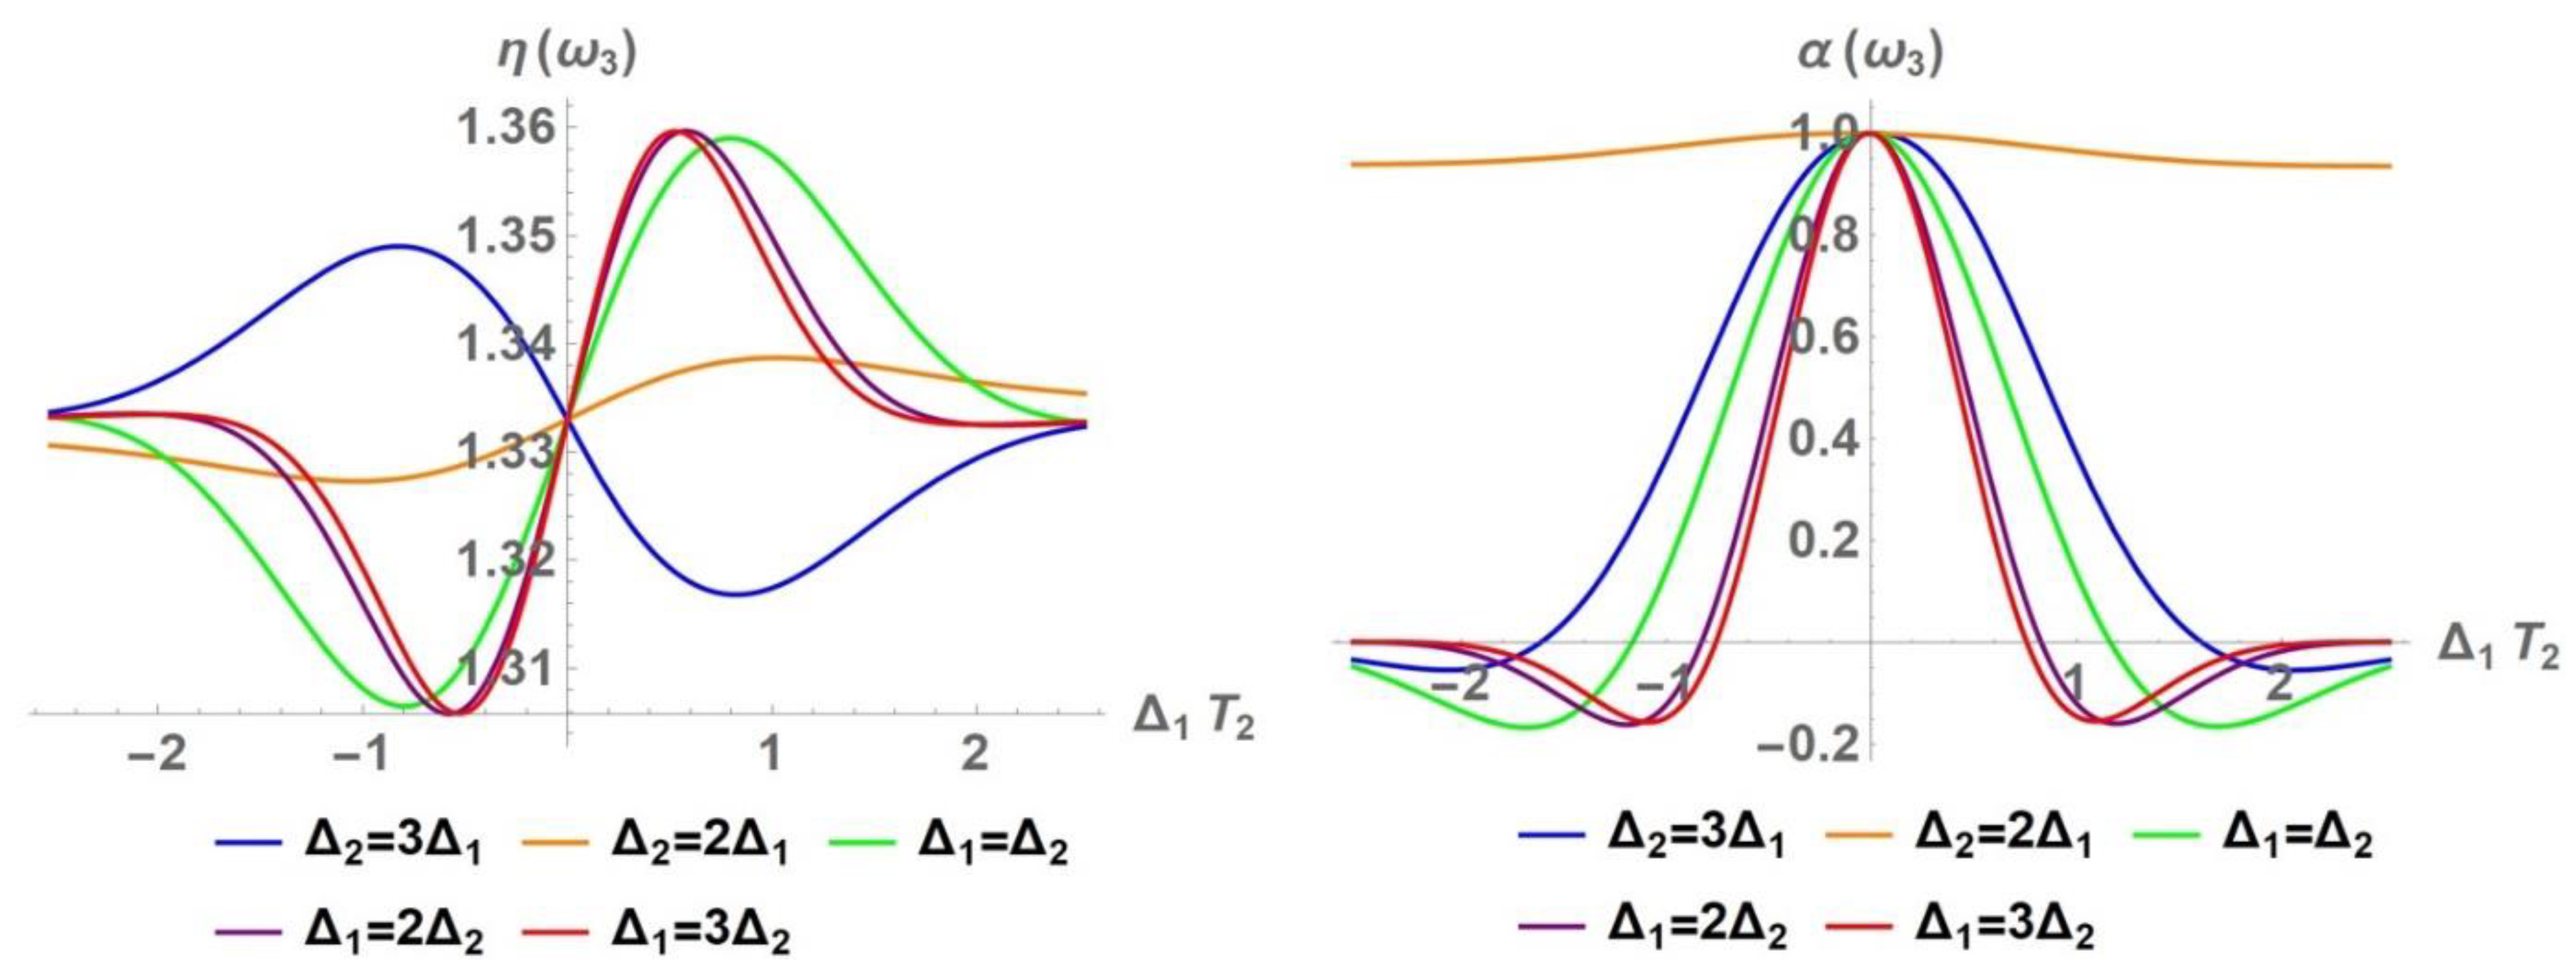
In all cases, the absorption reaches its maximum value when all detuning is equal to zero. It can also be noted that the absorption coefficient presents some symmetry to Δ 1 , however, because the refractive index and the exact symmetry is not reached. In summary terms, we can represent both profiles for different points in the frequency space, according to Figure 31.
In general, as would have been appreciated earlier, the optical properties do not exhibit symmetry in terms of the exchange between Δ 1 and Δ 2 . For the refractive index, it can be noted that the more the ratio Δ 1 / Δ 2 increases, the more the maxima and minima shift more towards the vertical axis, also reaching a higher and lower value, respectively; it can also be observed that the scattering decays faster as the ratio increases. It follows naturally that the radiation scatters to a greater extent as the resulting frequency moves farther and farther away from the transition frequency of the system. In addition, the detuning of the pumping beam should be smaller and smaller so that the resulting frequency of the signal does not differ so much from that of the system and these can interact. Another important detail that can be noticed is that for the case Δ 2 = 3 Δ 1 the maximum and minimum of dispersion change position with respect to the vertical axis, this because the detuning Δ 3 turns out to be the negative of Δ 1 . As for the absorption coefficient, starting from Δ 3 = 0 , any increase or decrease in the ratio Δ 1 / Δ 2 will imply a horizontal contraction in the absorption curve. In these cases, as the signal frequency is farther away from the natural frequency, Δ 1 would need to be decreased to decrease the frequency difference so that the beam interacts more with the system and an increase or decrease in the radiation intensity is observed.

3.2. Perturbative Influence on the Development of the Zero-Frequency Component

The participation of the probe beam in the FWM generation process to second order in a perturbative manner (eq. 6) is also evaluated. Considering the incident probe beam at this order, not only generates new dynamical processes of importance included in the nonlinear response optical susceptibilities, but also constitutes a difference in treatment to the emerging signal beam treated to the first order. Treating the probe beam to the second order does not necessarily imply losing or changing its role in the signal generation process as an observer of the perturbing effect of the intense pump beam but allows the test beam a recognition in the process not necessarily linked to its intensity.
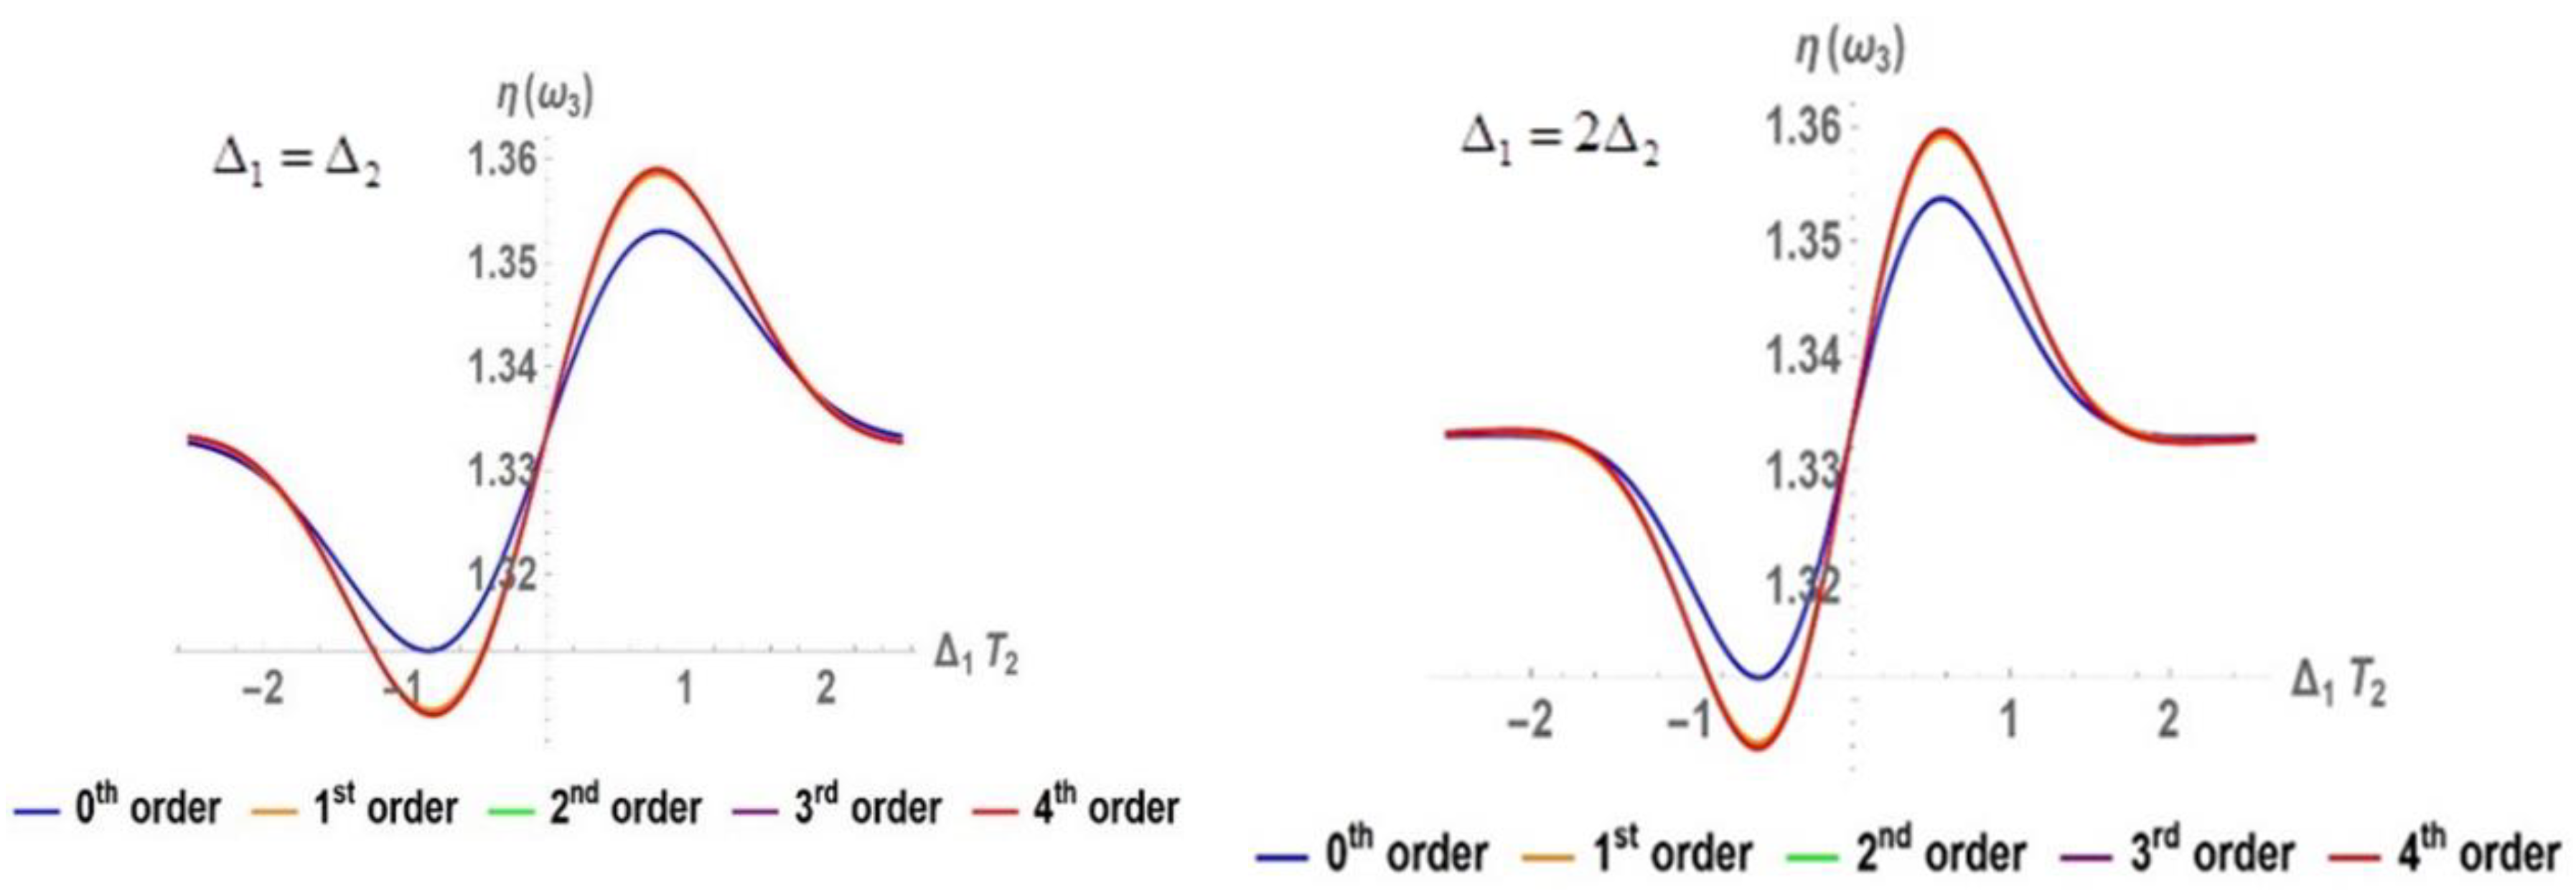
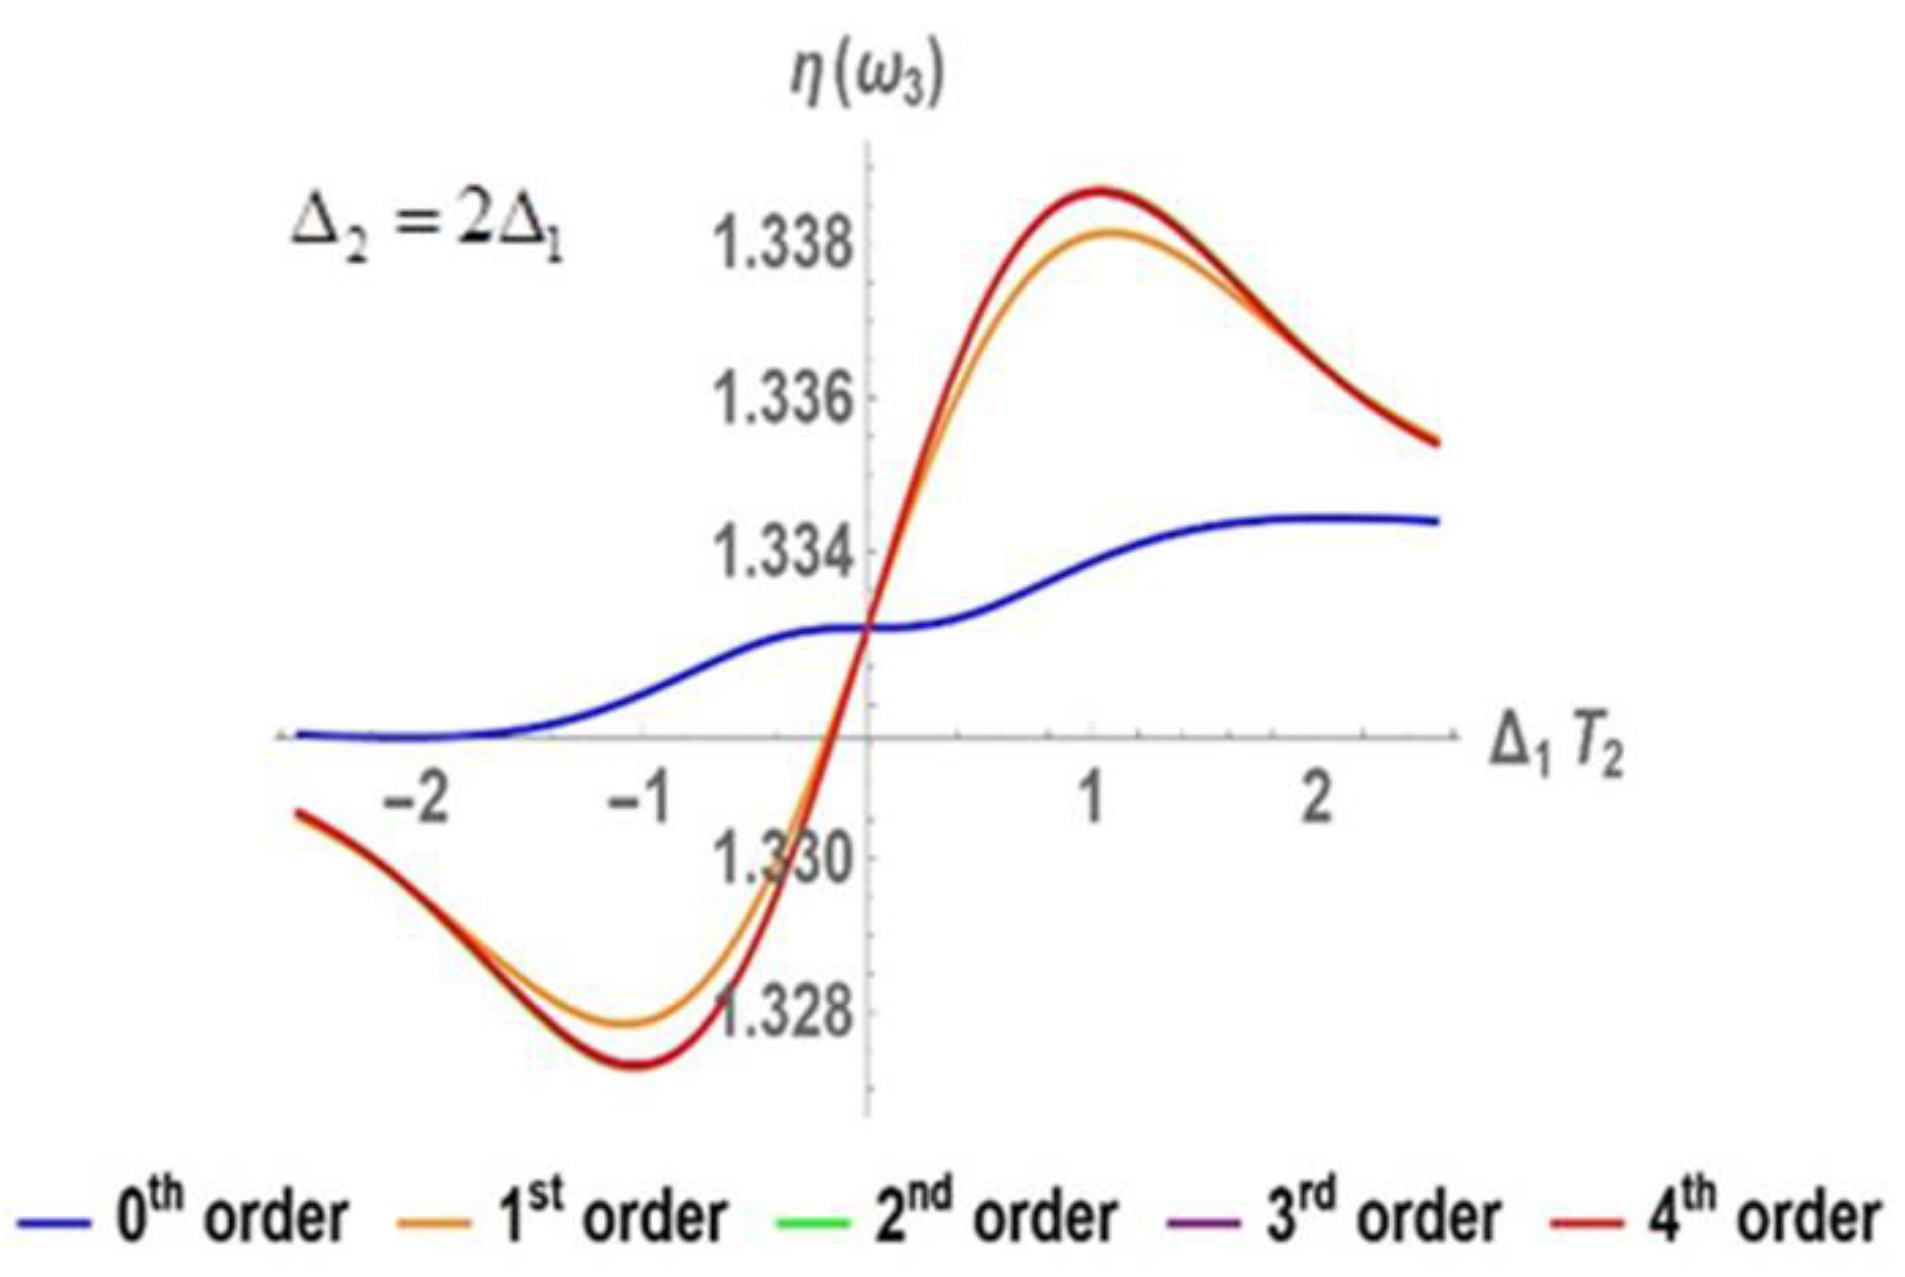
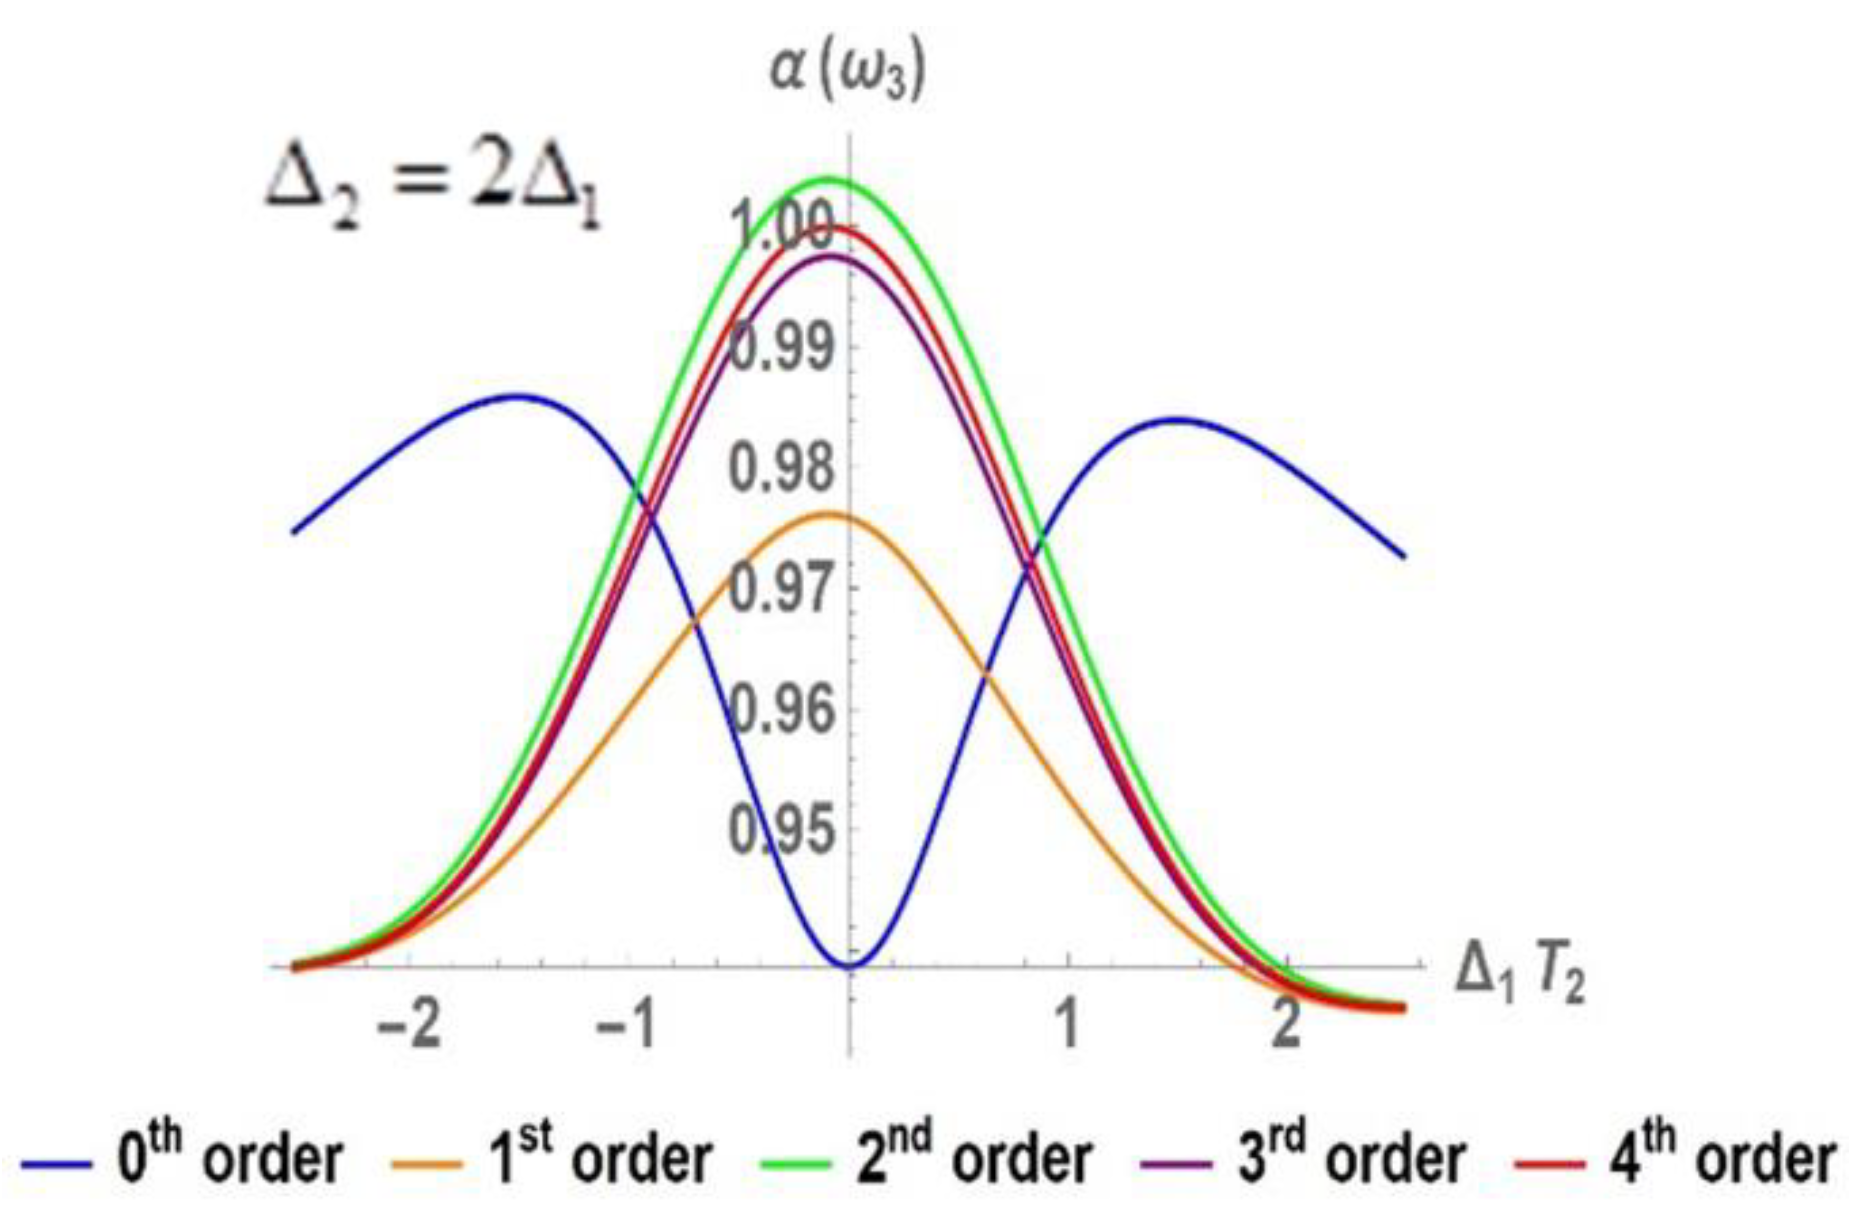
On the other hand, our stochastic considerations of the solvent fundamentally reflected in all the averages of susceptibilities in the set of realizations of the random variable, have fundamentally their origin in the behavior of the component at zero frequencies of the difference of populations ρ D d c between the adiabatic states (eq. 15). To obtain a useful expression of this component, a series development is performed assuming approximation limits subject to the saturation generated by the two beams, but mainly the pumping beam (eq. 16). To carry out convergence studies of such series is extremely complex and not very useful because of the calculation times involved in raising to high orders of perturbation and making representations of the optical properties in the frequency space parameterized by different study variables. Accordingly, we study the effect that the orders have on both the nonlinear refractive index and the nonlinear absorption coefficient. We observe in Figure 32 that for the degenerate and 2 ω 2 ω 1 = ω ˜ 0 tuning processes, we could reach only the first order or even stay at zero order of expansion for our calculations and obtain acceptable results, unlike the FWM process 2 ω 1 ω 2 = ω ˜ 0 , where it is strictly necessary to resort at least to the first order to obtain acceptable results in the expansion of the population difference at zero frequencies.
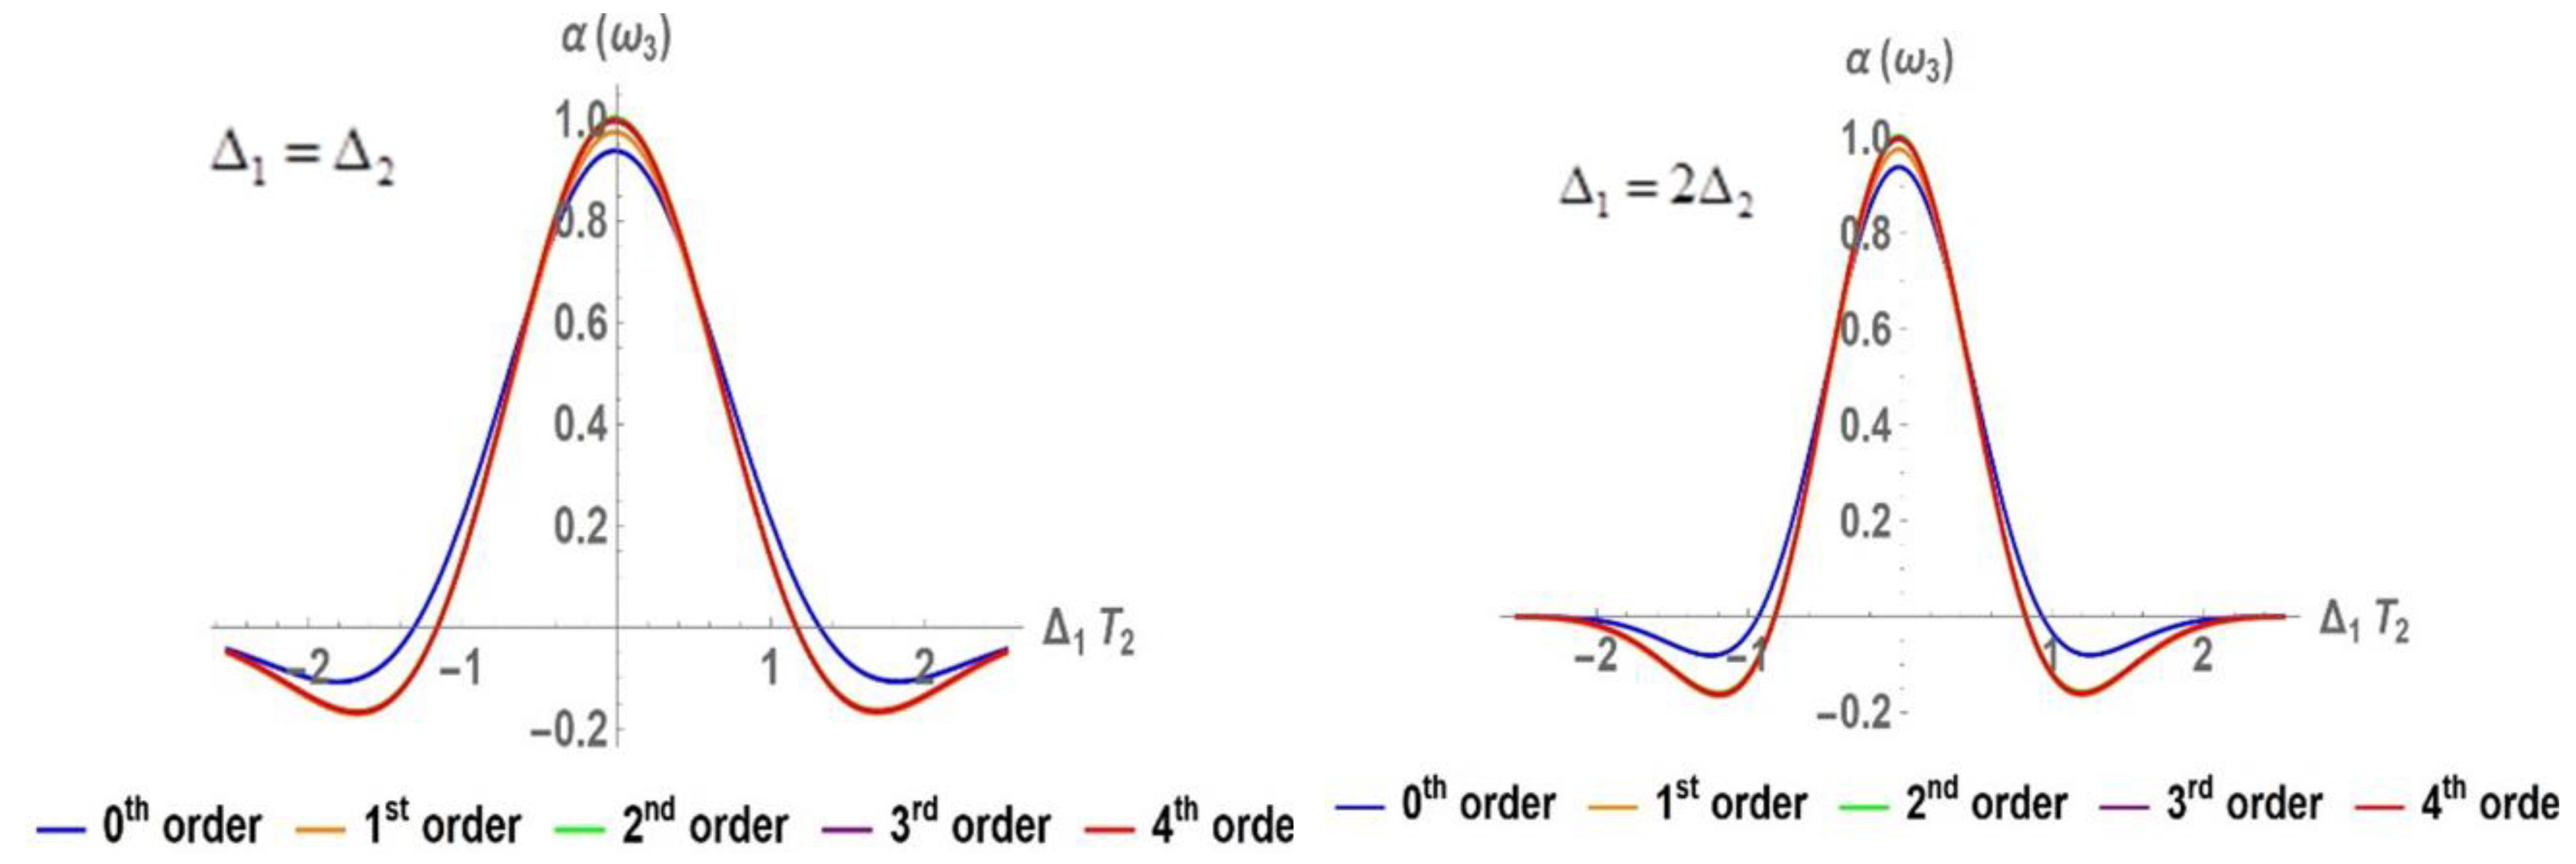
However, for evaluations in the absorption coefficient, we can observe from Figure 33, that almost invariantly in the degenerate and resonance processes of the test beam with the Bohr frequency in the adiabatic states the zero-order in the perturbative development is sufficient to generate reliable data. This indicates that the system is in an equilibrium situation established according to ρ D d c ρ D e q . However, in the process awarded to the FWM signal for the ω 3 = ω ˜ 0 resonance, it is even necessary to scale up to the second order of expansion in the evaluation of the population difference at zero frequencies. This indicates the possibility that with the saturation effects induced by the orders considered, the system remains in situations far out of equilibrium and that the relaxation times T 1 used lead the system to leave equilibrium and probably return to other canonical equilibrium situations, thus losing the memory of the original equilibrium value. We have focused mainly on the behavior of χ c o u p ( ω 3 , z ) and χ c o u p ( ω 2 , z ) as a function of the longitudinal and transverse relaxation times since they are fundamental parameters associated with two dissipation processes intimately linked in the stochastic optical Bloch equations and subject to vibronic effects, but which clearly distinguish different molecular systems of study, preferably organic dyes.

4. Concluding Remarks

We have devised a semiclassical radiation-matter interaction model. This model considers a two-state system and a molecule model based on coupled harmonic potentials with energy and nuclear coordinate shifts. We make use of the Liouvillian scheme for the reduced density matrix with the use of quantum relaxation theory for dissipation processes referring to molecular populations separated from the equilibrium situation, and those where coherence aspects are measured. Furthermore, we consider for the presence of the solvent in a scheme that shifts the Bohr frequency to a stochastic time-dependent function. To simulate the FWM signal, we align our model with experimental facts to represent the high-intensity pumping beam in saturated form and incorporate a low-intensity probe beam according to a perturbative development, which opens up the possibility of new photonic processes linked to the FWM process under study. We have considered as critical variables in the study those derived from the molecular structure, as well as those derived from the optical process in the analysis of the nonlinear absorptive and dispersive properties. As a result, we have found the wide possibilities of study that are opened in the representations of the optical properties in the frequency space and its dependence on the saturation that induce the beams or the duration in time of the relaxation processes. We analyze the refractive indices with possibilities of designs as tools in optical sensors for the possibility of a high change or contrast according to small variations in the frequency detuning of the beams. Dependence of the optical profile on its reduction with increasing intramolecular parameter or sensitivity with the order of test perturbation considered. This study allows us to understand how important is the inclusion of high-order perturbation from low-intensity fields to warrant the measurement of the refractive index or nonlinear absorption coefficient of the employed organic dyes. Both the refractive index and the nonlinear absorption coefficient are affected to a greater or lesser extent with the variation of the molecular and field parameters considered. These variations cause a greater or lesser effect depending on the ratio between the frequencies of the incident electromagnetic fields, finding that the effect generated is significantly lower in the scattering when the frequency of the resulting signal beam is identical to the Bohr frequency of the molecular system under study. Regarding the absorption coefficient for the frequency ratio 2 Δ 1 = Δ 2 , as expected, the absorption is maximized compared to other frequency ratios considered, coinciding only the absorptions in all profiles when the detuning of the incident beams is zero. In the developed model it can also be seen that the dispersion increases the greater the difference between the resulting frequency of the signal and that of the system, while the absorption decreases as this difference increases. The consideration of a second order test beam would not represent a significant contribution to the predicted results, since its percentage contribution is negligible within the model development framework, however, this contribution starts to become relevant mainly with the increase of the ratio between longitudinal and transverse relaxation times.

Author Contributions

Conceptualization, J.L.P. and Y.J.A.; methodology, J.L.P. and M.A.L.; software, J.L.P. and M.A.L.; validation, A.G.S., E.M. and J.R.M.; formal analysis, J.L.P. and Y.A.; investigation, J.L.P. and Y.J.A.; writing—original draft preparation, J.L.P., E.M., J.R.M.; writing—review and editing, J.L.P. and L.G.-P.; visualization, AGS, M.L. and L.G.-P. All authors have read and agreed to the published version of the manuscript.

Funding

This research received no external funding.

Acknowledgments

JLP thanks the Vicerrectorado de Investigacion y Posgrado UNMSM for funding this research through the project PCONFIGI C24071471.

Conflicts of Interest

The authors declare no conflict of interest.

References

  1. Sitkiewicz, S.P.; Rodríguez-Mayorga, M.; Luis, J. M.; and Matito, E. Partition of optical properties into orbital contributions. Phys. Chem. Chem. Phys 2019, 21, 15380–91. [Google Scholar] [CrossRef] [PubMed]
  2. Herrera, F.; Spano, F. C. Theory of Nanoscale Organic Cavities: The Essential Role of Vibration-Photon Dressed States. ACS Photon. 2018, 5, 65–79. [Google Scholar] [CrossRef]
  3. Yu, X.; Yuan, Y.; Xu, J.; Yong, K.; Qu, J.; Song, J. Strong Coupling in Microcavity Structures: Principle, Design, and Practical Application. Laser Photon Rev. 2019, 13, 1800219. [Google Scholar] [CrossRef]
  4. Moncada, F.; Paz, J. L.; Lascano, L.; Costa-Vera, C. Effects of spectral diffusion on the nonlinear optical properties in two- and three-state quantum systems in a four-wave mixing signal. J. Nonlinear Opt. Phys. Mater. 2019, 27, 1850038. [Google Scholar] [CrossRef]
  5. Hesabi, S.; Afshar, D.; Paris, M. G. A. Non-Markovian evolution of a two-level system interacting with a fluctuating classical field via dipole interaction. Opt. Commun. 2019, 437, 377–81. [Google Scholar] [CrossRef]
  6. Sakiroglu, S. Linear and nonlinear optical absorption coefficients and refractive index changes in Morse quantum wells under electric field. Int. J. Mod. Phys. B. 2016, 30, 1650209. [Google Scholar] [CrossRef]
  7. Mukamel, S.; Abramavicius, D. Many-Body Approaches for Simulating Coherent Nonlinear Spectroscopies of Electronic and Vibrational Excitons. Chem. Rev. 2004, 104, 2073–2098. [Google Scholar] [CrossRef] [PubMed]
  8. Pishchalnikov, R. Application of the differential evolution for simulation of the linear optical of photosynthetic pigments. J. Comput. Phys. 2018, 372, 603–615. [Google Scholar] [CrossRef]
  9. Paz, J. L.; Ruiz-Hinojosa, E.; Alvarado, Y.; Lascano, L.; Porras, L.; Fernández, L. Study of the nonlinear optical responses in the Four-wave mixing signal in saturation regimen of a two-level system with intramolecular coupling. J. Mod. Opt. 2020, 67, 1031–1039. [Google Scholar] [CrossRef]
  10. Paz, J. L.; Loroño, M.; Garrido-Schaeffer, A.; González-Paz, L.; Márquez, E.; Vera-Villalobos, J.; Mora, J.; Alvarado, Y. Absorptive and dispersive responses in a two-level molecule with vibronic coupling: Permanent dipole moments effects. Chem. Phys. Lett. 2021, 779, 138885. [Google Scholar] [CrossRef]
  11. Paz, J. L.; Loroño, M.; González-Paz, L.; Márquez, E.; Vera-Villalobos, J.; Mora, J. R.; Alvarado, Y. Nonlinear optical responses of molecular systems with vibronic in fluctuating environments. J. Nonlinear Opt. Phys. Mater. 2021, 31, 215001. [Google Scholar] [CrossRef]
  12. Paz, J. L.; Espinoza-Montero, P. ; Loroño. M.; González-Paz. L.; Márquez, E.; Vera-Villalobos, J.; Mora, J.R.; Alvarado, Y. Solvent randomness and intramolecular considerations of optical responses in four-wave mixing. J. Mod. Opt. 2021, 68, 1083–1093. [Google Scholar] [CrossRef]
  13. Paz, J. L.; Espinoza-Montero, P.; Loroño, M.; Torres, F. J.; González-Paz, L.; Márquez, E.; Vera-Villalobos, J.; Moncada, F.; Alvarado, Y. Propagation and Parametric Amplification in Four-Wave Mixing processes: Intramolecular Coupling and High-Order Effects. Symmetry 2022, 14, 301–321. [Google Scholar] [CrossRef]
  14. Paz, J. L.; Loroño, M.; Torres, F. J.; González-Paz, L.; Márquez, E.; Mora, J. R.; Alvarado, Y.; Mujica, V. A kinetic model for the equilibrium dynamics of absorption and scattering processes in four-wave mixing spectroscopy. AIP Adv. 2022, 12, 065322. [Google Scholar] [CrossRef]
  15. Mincigrucci, R.; Foglia, L.; Naumenko, D.; Pedersoli, E.; Simoncig, A.; Cucini, R.; Gessini, A.; Kiskinova, M.; Kurdi, G.; Mahne, N.; Manfredda, M.; Nikolov, I. P.; Principi, E.; Raimondi, L.; Zangrando, M.; Masciovecchio, C.; Capotondi, F.; Bencivenga, F. Advances in instrumentation for FEL-based four-wave-mixing experiments. Nucl. Instrum. Methods Phys. Res. A: Accel. Spectrom. Detect. Assoc. Equip 2018, 907, 132–48. [Google Scholar] [CrossRef]
  16. Zhang, G.; Lefkidi, G.; Murakami, M.; Hübner, W.; George, T. Introduction to Ultrafast Phenomena: From Femtosecond Magnetism to High-Harmonic Generation. 1st ed. Boca Raton: CRC Press. 2021. [Google Scholar]
  17. Agrawal, G. P. Four-wave mixing. Nonlinear Fiber Optics. 6a ed. Academic Press; 2019.
  18. Noudem, P.; Fouejio, D.; Mveme, C. D.; Nya, F.T.; Zekeng, S. S. Electronic, nonlinear optical, UV–vis and NBO analysis of methyl methacrylate for optoelectronic and optical applications: DFT study and impact of conformation Spectrochim Acta A Mol Biomol Spect. 2023, 303, 123267. [Google Scholar]
  19. Karuppasamy, P.; Kamalesh, T.; Anitha, K.; Senthil, M.; Ramasamy, P.; Verma, S. Design and growth of novel organic molecular Quinoline 4-nitrophenol (QNP) single crystals: For Nonlinear optical (NLO) applications. J. Mol. Struct. 2020, 1210, 128036. [Google Scholar] [CrossRef]
  20. Binish, B.; Mani, R. K. Synergic effects of Sn4+ doping on the nonlinear optical limiting properties of SnxCd1-xMoO4 nanostructures for optoelectronic applications. J Photochem. Photobiol. A: Chem 2023, 439, 114614. [Google Scholar] [CrossRef]
  21. Ebnali-Heidari, A.; Ebnali-Heidari, M.; Emami, H. Application of slow-light engineered chalcogenide and silicon photonic crystal waveguides for double-dimensional microwave frequency identification. Optik 2023, 290, 171331. [Google Scholar] [CrossRef]
  22. Wang, X.; Yuan, J.; Wang, L.; Xiao, L.; Jia, S. Enhanced frequency up-conversion based on four-wave mixing assisted by a Bessel-Gaussian beam in 85Rb atoms. Opt Laser Technol. 2022, 149, 107874. [Google Scholar] [CrossRef]
  23. Hu, S.; Gai, B.; Li, J.; Chen, Y.; Cai, X.; Wang, P.; Liu, J.; Guo, J. W. Competition of collimated ultraviolet lights generated by four-wave mixing process in Cs vapor. Opt. Commun. 2023, 527, 128960. [Google Scholar] [CrossRef]
  24. Chen, J.; Yu, Z.; Wang, T.; Liu, Z.; Gao, S. High-speed modulating retro-reflectors with optical phase conjugation compensation. Opt. Commun. 2022, 507, 127629. [Google Scholar] [CrossRef]
  25. Andrekson, P. A. Applications of nonlinear four-wave mixing in optical communication. Optik 2023, 279, 170740. [Google Scholar] [CrossRef]
  26. Gao, S.; Bao, X. Chalcogenide Taper and Its Nonlinear Effects and Sensing Applications. iScience 2020, 23, 100802. [Google Scholar] [CrossRef] [PubMed]
  27. Al-Saidi, I.A.-D.H.A.; Abdulkareem, S.A.-D. Nonlinear optical properties and optical power limiting effect of Giemsa dye. Opt. Laser. Technol. 2016, 82, 150−156.
  28. Cheng, J. L.; Vermeulen, N.; Sipe, J. E. Third order optical nonlinearity of graphene. New J. Phys. 2014, 16, 053014. [Google Scholar] [CrossRef]
  29. Yao, C-B.; Zhang, Y-D.; Li, J.; Chen, D-T.; Yin, H-T.; Yu, C-Q.; Yuan, P. Study of the nonlinear optical properties and behavior in phenoxy-phthalocyanines liquid at nanosecond laser pulses. Opt. Mater 2014, 37, 80–86. [CrossRef]
  30. Siva, V.; Bahadur, S. A.; Shameem, A. ; Athimoolam. S.; Lakshmi, K. U.; Vinitha, G. Synthesis, structural, vibrational, thermal, dielectric and optical properties of third order nonlinear optical single crystal for optical power limiting applications. J. Mol. Struct 2019, 1191, 110–117. [Google Scholar] [CrossRef]
  31. Naik, V. S.; Patil, P. S.; Wong, Q. A.; Quah, C. K.; Gummagol, N. B.; Jayanna, H. S. Molecular structure, linear optical, second and third-order nonlinear optical properties of two non-centrosymmetric thiophene-chalcone derivatives. J. Mol. Struct. 2020, 1222, 128901. [Google Scholar] [CrossRef]
  32. Dai, H.; Fu, S.; Luo, S. Atomic nonclassicality in the Jaynes-Cummings model. Phys. Lett. A. 2020, 384, 126371. [Google Scholar] [CrossRef]
  33. Zhang, S.; Li, W.; Li, K.; Li, Y.; Mu, F.; Feng, Y.; Liu, Y.; Zhang, Y. Triphoton correlations in six-wave mixing. Ann. Phys 2020, 412, 168000. [Google Scholar] [CrossRef]
  34. Holtum, T.; Bloino, J.; Pappas, C.; Kumar, V.; Barone, V.; Schlücker, S. Ultraviolet resonance Raman spectroscopy of anthracene: Experiment and theory. J. of Raman Spect. 2021, 52, 2292–300. [Google Scholar] [CrossRef]
  35. Li, Z.; Hirst, J.D. Quantitative first principles calculations of protein circular dichroism in the near ultraviolet. Chem Sci 2017, 8, 4318–33. [Google Scholar] [CrossRef] [PubMed]
  36. Patoz, A.; Begušić, T.; Vaníček. J. 2018 On-the-Fly Ab Initio Semiclassical Evaluation of Absorption Spectra of Polyatomic Molecules beyond the Condon Approximation. J. Phys. Chem. Lett. 2018, 9, 2367–72. [Google Scholar] [CrossRef] [PubMed]
  37. Rogers, D. M.; Jasim, S. B.; Dyer, N. T.; Auvray, F.; Réfrégiers, M.; Hirst, J. D. Electronic Circular Dichroism Spectroscopy of Proteins. Chem. 2019, 5, 2751–74. [Google Scholar] [CrossRef]
  38. Colmenares, P.J. Role of a Stochastic Friction Coefficient in Open Channel Noise. J. Theor. Biol. 1993, 161, 175–198. [Google Scholar] [CrossRef] [PubMed]
  39. Mukamel S. Principles of Nonlinear Optical Spectroscopy. 1a ed. New York: Oxford University Press, 1995.
  40. Paz, J. L.; Mastrodomenico, A.; Costa-Vera, C.; Cárdenas-García, J. F.; Rodríguez, L. G. Rotating wave approximation effects on the nonlinear optical responses of complex molecular systems using a four-wave mixing. J. Mod. Opt. 2015, 62, 403–11. [Google Scholar] [CrossRef]
  41. Sancho, J.M.; San Miguel, M.; Katz, S.L.; Gunton, J.D. Analytical and numerical studies of multiplicative noise. Phys. Rev. A 1982, 26, 1589–1609. [Google Scholar] [CrossRef]
  42. Paz, J.L.; Davila, C.; Loroño, A.M.; Gonzalez-Paz, L.; Marquez, E.; Mora, J.R.; Alvarado, Y. Analyzing coherent and incoherent optical susceptibilities in four-wave mixing: stochasticity, symmetry, and intramolecular coupling. Res. Phys. 2024, 61, 107765. [Google Scholar] [CrossRef]
  43. Marcano, O.; García-Golding, F. Power effects in polarization spectroscopy on a water solution of malachite green. J. Chem. Phys 1985, 82, 1242. [Google Scholar] [CrossRef]
  44. Yajima, T.; Souma, H. Study of ultra-fast relaxation processes by resonant Rayleigh-type optical mixing I. Theory. Phys. Rev. A 1978, 17, 309–323. [Google Scholar] [CrossRef]
  45. Yajima, T.; Souma, H.; Ishida, Y. Study of ultra-fast relaxation processes by resonant Rayleigh type optical mixing. II. Experiment on dye solutions. Phys. Rev. A 1978, 17, 324–334. [Google Scholar] [CrossRef]
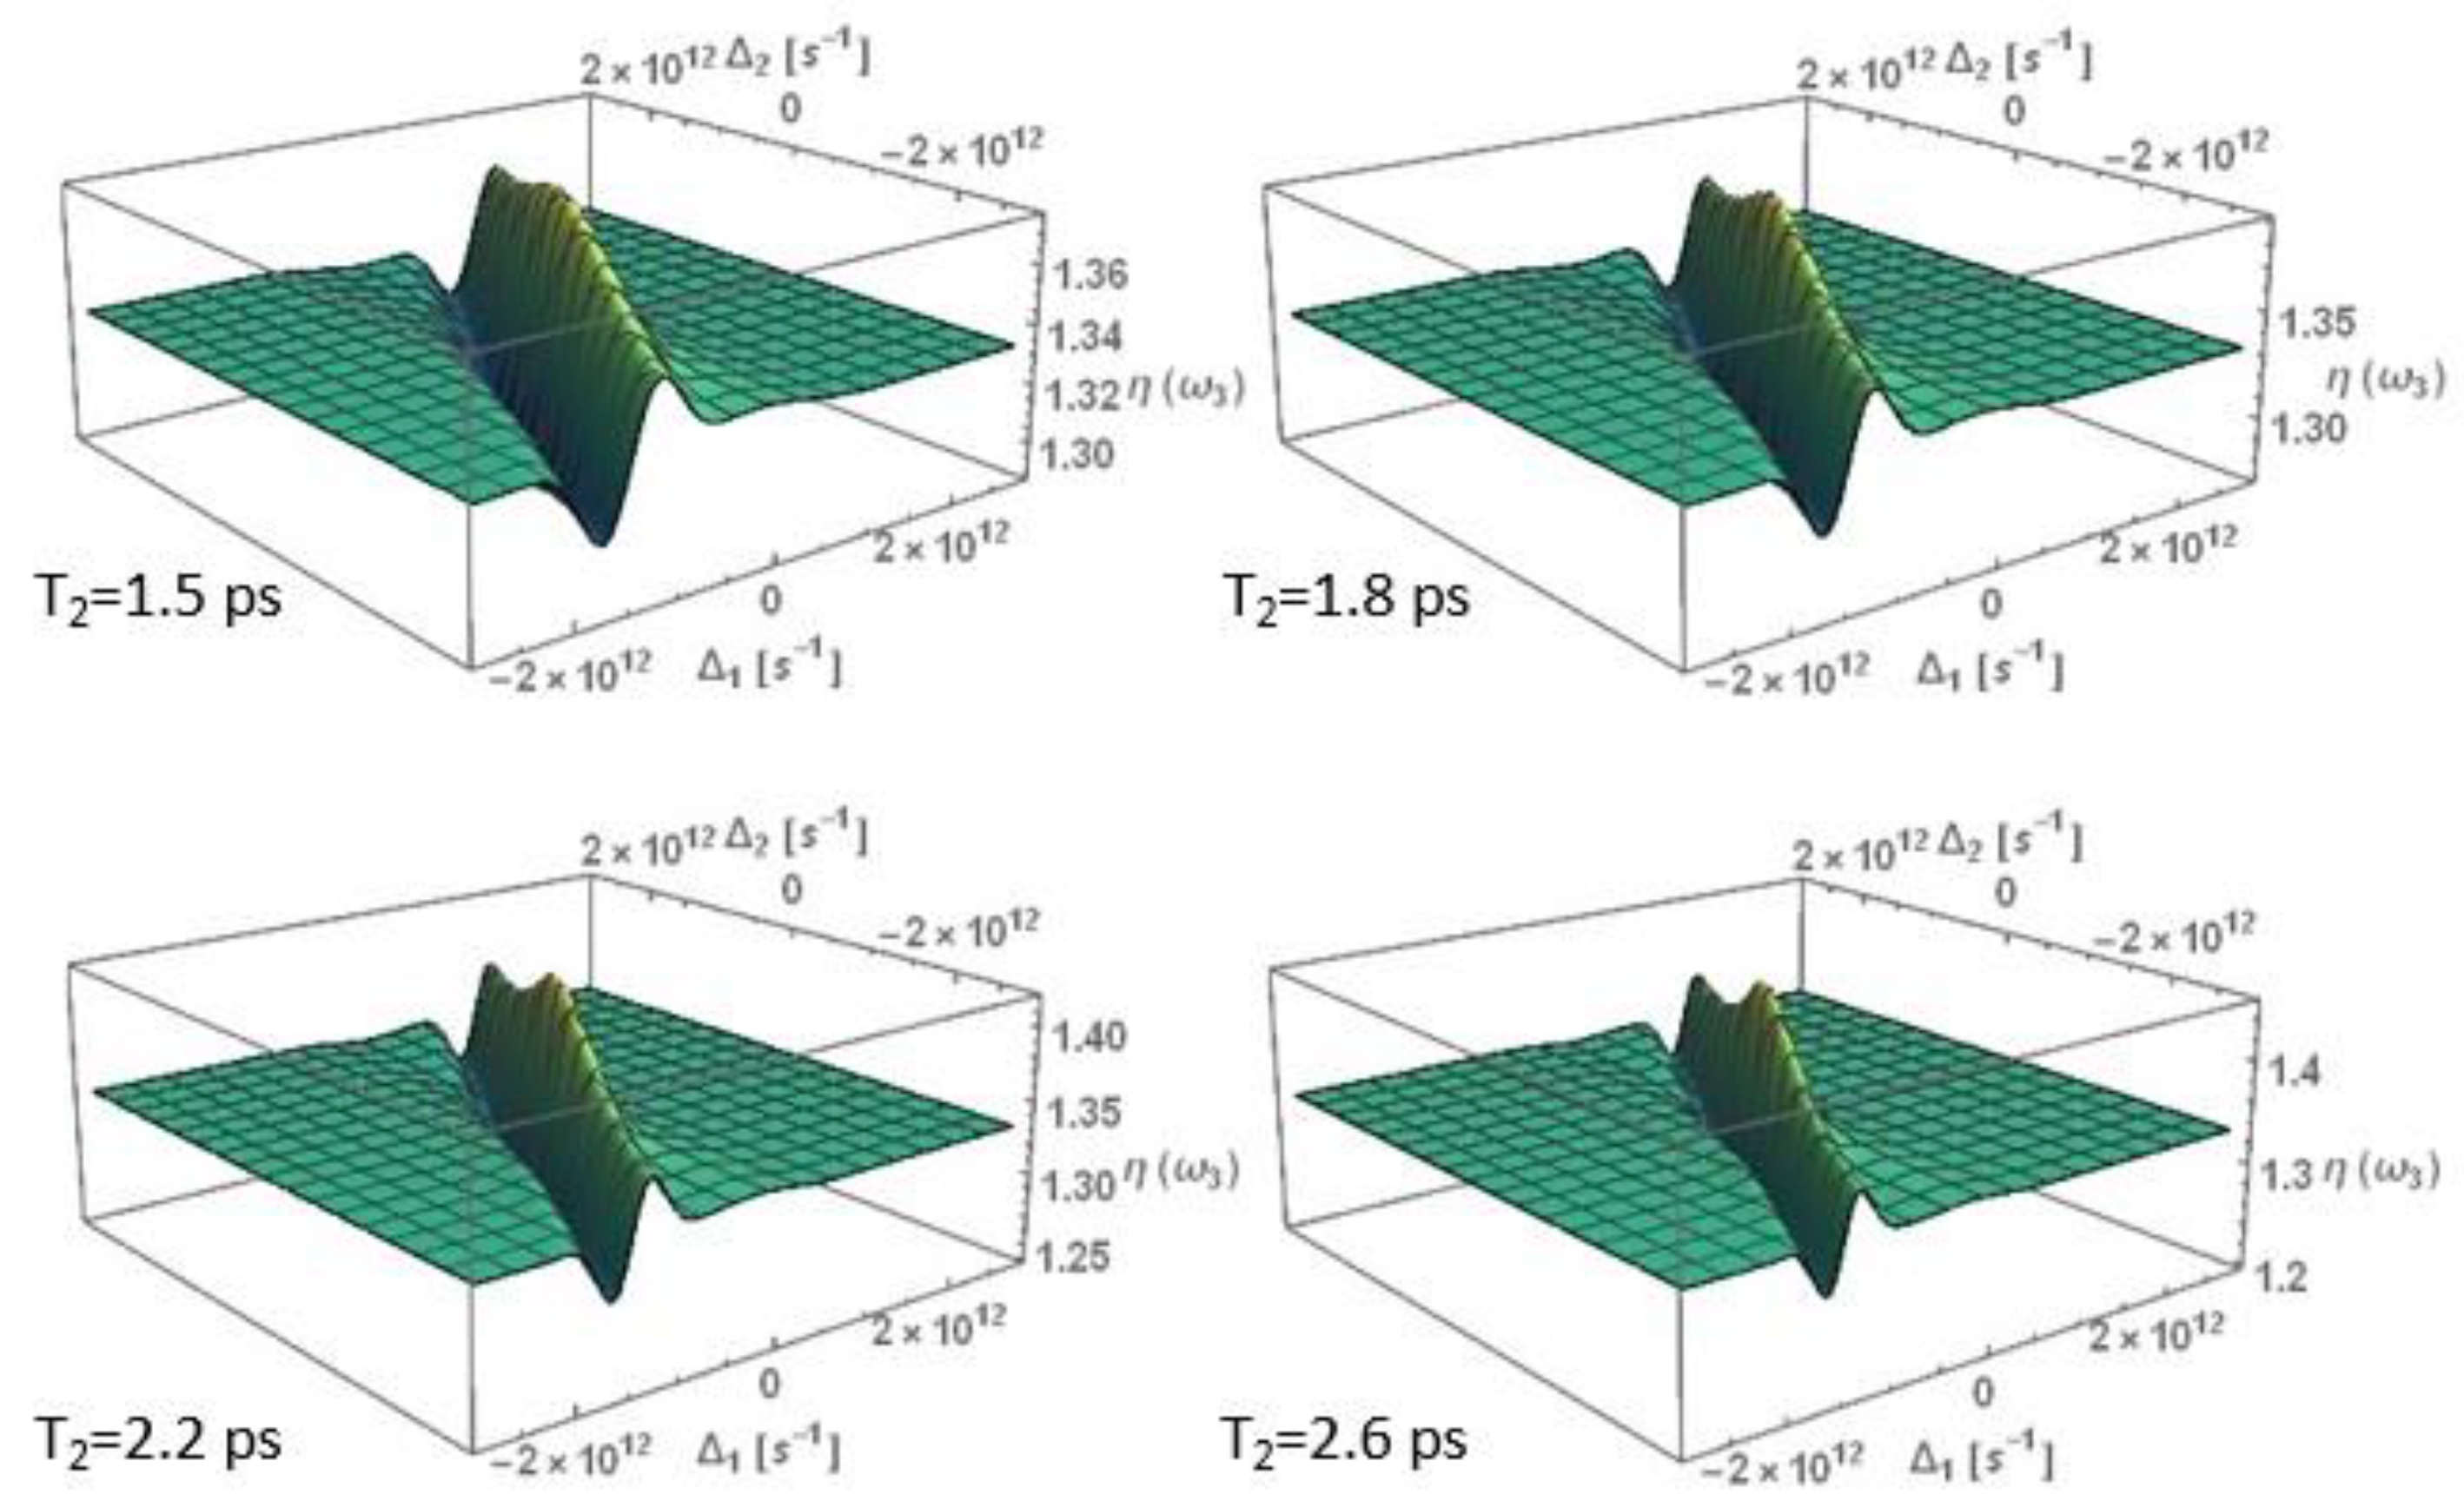
Figure 1. Nonlinear refractive index as a function of pump detuning in frequency space ( Δ 1 , Δ 2 ) ( s 1 ) , considering different transverse relaxation times T 2 ( p s ) .
Preprints 114828 g001
Figure 2. Refraction index as a function of detuning for given frequency ratios Δ 1 and Δ 2 , at different transversal relaxation times.
Preprints 114828 g002
Figure 3. Effect of transverse relaxation time T2 on the nonlinear refractive index for given frequency ratios Δ 1 and Δ 2 (keeping all other parameters constant).
Preprints 114828 g003
Figure 4. Nonlinear refractive index as a function of pump- and probe-detuning, considering different ratios ( T 1 / T 2 ) of relaxation times.
Preprints 114828 g004
Figure 5. Study of dispersive responses with pumping detuning (normalized) for particular processes: ω 2 = ω 1 , 2 ω 2 ω 1 = ω ˜ 0 and 2 ω 1 ω 2 = ω ˜ 0 , as a function of the T 1 / T 2 .
Preprints 114828 g005
Figure 6. Time effect of the ratio of relaxation times T 1 and T 2 (3D) on the nonlinear refractive index for given frequency ratios Δ 1 and Δ 2 .
Preprints 114828 g006
Figure 7. Effect of coupling between the molecular system and the thermal reservoir on the nonlinear refractive index for any ratio of frequencies Δ 1 and Δ 2 .
Preprints 114828 g007
Figure 8. Effect of coupling between the molecular system and the thermal reservoir on the nonlinear refractive index for given frequency ratios Δ 1 and Δ 2 .
Preprints 114828 g008
Figure 9. Effect of coupling between the molecular system and the thermal reservoir (3D) on the nonlinear refractive index for given frequency ratios Δ 1 and Δ 2 .
Preprints 114828 g009
Figure 10. Effect of total saturation S 12 on the nonlinear refractive index for any ratio of frequencies Δ 1 and Δ 2 .
Preprints 114828 g010
Figure 11. Effect of total saturation S 12 (2D) on the nonlinear refractive index for given frequency ratios Δ 1 and Δ 2 , as a function of the pump-probe detuning.
Preprints 114828 g011
Figure 12. Effect of total saturation S 12 (3D) on the nonlinear refractive index for given frequency ratios Δ 1 and Δ 2 .
Preprints 114828 g012
Figure 13. Effect of intramolecular coupling on the nonlinear refractive index for any ratio of frequencies Δ 1 and Δ 2 , as a function of the pump-probe detuning.
Preprints 114828 g013
Figure 14. Effect of intramolecular coupling on the nonlinear refractive index for selected frequency ratios Δ 1 and Δ 2 , as a function of normalized pump detuning.
Preprints 114828 g014
Figure 15. Effect of intramolecular coupling on the nonlinear refractive index for given frequency ratios Δ 1 and Δ 2 , as a function of normalized pump detuning.
Preprints 114828 g015
Figure 16. Nonlinear absorption coefficient as a function of pump-probe detuning in frequency space parameterized by transverse relaxation times.
Preprints 114828 g016
Figure 17. Effect of transverse relaxation time T2 on the nonlinear absorption coefficient as a function of pump detuning in the three processes shown.
Preprints 114828 g017
Figure 18. Effect of transverse relaxation time T2 (3D) on the nonlinear absorption coefficient for any ratio of frequencies Δ 1 and Δ 2 .
Preprints 114828 g018
Figure 19. Effect of the ratio of relaxation times T 1 and T 2 on the nonlinear absorption coefficient for any ratio of frequencies Δ 1 and Δ 2 .
Preprints 114828 g019
Figure 20. Effect of the ratio of relaxation times T 1 and T 2 on the nonlinear absorption coefficient for any ratio of frequencies Δ 1 and Δ 2 .
Preprints 114828 g020
Figure 21. Effect of the ratio of relaxation times T 1 and T 2 on the nonlinear absorption coefficient for any ratio of frequencies Δ 1 and Δ 2 .
Preprints 114828 g021
Figure 22. Effect of coupling between the molecular system and the thermal reservoir on the nonlinear absorption coefficient for any ratio of frequencies Δ 1 and Δ 2 .
Preprints 114828 g022
Figure 23. Effect of coupling between the molecular system and the thermal reservoir on the nonlinear absorption coefficient for any ratio of frequencies Δ 1 and Δ 2 .
Preprints 114828 g023
Figure 24. Effect of coupling between the molecular system and the thermal reservoir on the nonlinear absorption coefficient for any ratio of frequencies Δ 1 and Δ 2 .
Preprints 114828 g024
Figure 25. Effect of total saturation S 12 on the nonlinear absorption coefficient for any ratio of frequencies Δ 1 and Δ 2 .
Preprints 114828 g025
Figure 26. Effect of total saturation S 12 (2D) on the nonlinear absorption coefficient for selected frequency ratios Δ 1 and Δ 2 .
Preprints 114828 g026
Figure 27. Effect of total saturation S 12 (2D) on the nonlinear absorption coefficient for selected frequency ratios Δ 1 and Δ 2 .
Preprints 114828 g027
Figure 28. Effect of intramolecular coupling on the nonlinear absorption coefficient for any ratio of frequencies Δ 1 and Δ 2 .
Preprints 114828 g028
Figure 29. Effect of intramolecular (2D) coupling on the nonlinear absorption coefficient for given frequency ratios Δ 1 and Δ 2 .
Preprints 114828 g029
Figure 30. Effect of intramolecular (3D) coupling on the nonlinear absorption coefficient for given frequency ratios Δ 1 and Δ 2 .
Preprints 114828 g030
Figure 31. Comparison between scattering and absorption profiles at the frequency of interest when considering different ratios between pumping and test beam frequencies.
Preprints 114828 g031
Figure 32. Nonlinear refractive index as a function of pumping beam detuning for the processes Δ 1 = Δ 2 , Δ 1 = 2 Δ 2 , Δ 2 = 2 Δ 1 , considering different orders of perturbation according to eq. 16.
Preprints 114828 g032aPreprints 114828 g032b
Figure 33. Nonlinear absorption coefficient as a function of detuning in processes Δ 1 = Δ 2 , Δ 1 = 2 Δ 2 and Δ 2 = 2 Δ 1 , considering different perturbation treatments (eq. (24)).
Preprints 114828 g033aPreprints 114828 g033b
Disclaimer/Publisher’s Note: The statements, opinions and data contained in all publications are solely those of the individual author(s) and contributor(s) and not of MDPI and/or the editor(s). MDPI and/or the editor(s) disclaim responsibility for any injury to people or property resulting from any ideas, methods, instructions or products referred to in the content.
Copyright: This open access article is published under a Creative Commons CC BY 4.0 license, which permit the free download, distribution, and reuse, provided that the author and preprint are cited in any reuse.
Prerpints.org logo

Preprints.org is a free preprint server supported by MDPI in Basel, Switzerland.

Subscribe

© 2024 MDPI (Basel, Switzerland) unless otherwise stated