Preprint
Article

A Review of the Multiple-Readout Concept and Its Application in an Integrally-Active Calorimeter

Altmetrics

Downloads

66

Views

36

Comments

0

A peer-reviewed article of this preprint also exists.

Submitted:

10 August 2024

Posted:

13 August 2024

You are already at the latest version

Alerts
Abstract
A comprehensive multi-jet physics program is anticipated for experiments at future colliders. Key physics processes necessitate detectors that can distinguish signals from W and Z bosons and the recently discovered Higgs boson. Typical examples include channels with W^{+}W^{-} or Z^{o}Z^{o} pairs and processes involving New Physics, in those cases where neutral particles must be disentangled from charged ones due to the presence of W or Z bosons in their final states. Such a physics program demands calorimetric energy resolution at or beyond the limits of traditional calorimetric techniques. Multiple-readout calorimetry, which aims to reduce fluctuations in energy measurements of hadronic showers, is a promising approach. The first part of this article reviews dual and triple readout calorimetry within a mathematical framework describing the underlying compensating mechanism. The second part proposes a potential implementation using an integrally active and total absorption detector. This model serves as the basis for several Monte Carlo studies, illustrating how the response of a multiple-readout calorimeter depends on construction parameters. Among the layouts considered, one configuration operating in triple-readout mode shows the potential to achieve an energy resolution approaching 20\%/\sqrt{E}.
Keywords: 
Subject: Physical Sciences  -   Nuclear and High Energy Physics

1. Introduction

The physics program envisaged for the experiments at future Lepton and Hadron colliders will be dominated by studies of processes involving multi-jet events. In such an environment, calorimeters will play a fundamental role as particle detectors. A broad-based R&D and Monte Carlo simulation activity is in progress within the High Energy community (see, for example, Ref. [1,2] and references therein). Funding agencies have also recognized the urgency of considerably improving the performance of hadronic calorimeters intended for future HEP experiments [3]. A clear pattern has emerged from those studies: disentangling the experimental signatures of processes where the W and Z bosons appear in the final states is crucial to achieving successful physics results. A straightforward example is represented by the study of the following two processes: e + e H Z W + W x and e + e H Z Z o Z o x . These processes can, in fact, be distinguished only upon the successful reconstruction and identification of the W ± and of the Z 0 bosons in the final state of the decay chain. A consensus has been established on the fact that the minimum hadronic energy resolution of calorimetric systems needed to distinguish the W from the Z signal is σ ( E ) / E 30 % / E [4]. Such a resolution is unprecedented in the history of experiments at High Energy colliders where the resolution of conventional calorimeters is limited, among other sources, by the fluctuation in the electromagnetic content of the hadronic shower and by the unequal response of such devices to the electromagnetic(em) and hadronic components of the shower itself [8] (i.e., e h 1 ).In the past, nearly perfect compensation has been reached only by very massive compensating calorimeters intended for fixed-target experiments, where e h 1 is achieved by construction with a small volume ratio between passive and active materials [5]. The large volume needed to contain the showers in such compensating calorimeters, which is a consequence of the relatively low density of these systems, makes them impractical in experiments with colliding beams. Therefore, it would be challenging to achieve inadequate compensation with such a technique and, at the same time, a sufficient shower containment.
In recent years, an alternative technique has been developed to suppress the above effects: dual-readout calorimetry [9], based on an event-by-event evaluation of the electromagnetic fraction of the shower. Such a technique relies on the simultaneous measurements of signals generated by different detection mechanisms of the underlying hadronic shower, thus providing complementary information on the composition of the shower itself. The fundamental principles of dual-readout calorimetry are extensively discussed in the scientific literature, and a large-size prototype has been successfully assembled and operated by the DREAM Collaboration since 2004 [9].
Dual read-out calorimetry falls under two broad categories: sampling and integrally active. A short discussion of the main differences between the two categories is presented in Section 2.1. The sampling dual-readout techniques have been extensively investigated by the DREAM [9] and 4th Concept Collaborations [13]. In recent years, there has been renewed interest in the technique from the IDEA collaboration [14,15]. Results from several test beams and extensive simulations indicate that these techniques can provide excellent energy resolution at very reasonable costs. However, compared to the integrally active techniques, sampling calorimetric techniques introduce two new and non-negligible sources of fluctuations: Poisson fluctuations in the Čerenkovsignal, induced by the typically low photo-electron statistics, and sampling fluctuations, induced by the unobserved energy deposited in the passive absorber. Such fluctuations do not only impair the energy resolution of hadronic showers, but, also, have detrimental consequences on the detection of purely electromagnetic showers, due to the smaller size of the latter, most often comparable to the characteristic pitch of the active regions of the hadron calorimeter. Consequently, the energy measurement of high-energy jets, where sizable contributions of electromagnetic particles are present, is similarly affected. The obvious, and almost universally adopted, solution to such problem relies on designing a detector with two distinguished regions: a front electromagnetic section and a rear hadronic section. The drawback of such approach is that the two sections most often consists of media with very different properties and, consequently, different detector responses, which impairs the energy resolution of hadronic particles and jets. This is due to the introduction of an extra spatial fluctuation affecting those showers whose development encompasses both sections.
Conversely, an integrally active dual-readout calorimeter, where both the Čerenkovand the scintillation sections are active, lacks the above limitations. Therefore, not only the energy resolution of hadronic showers is improved, but also the calorimeter is capable of detecting electromagnetic showers with a resolution comparable to that of dedicated devices. An immediate consequence is that there is no need for two separate calorimetric sections and all kinds of showers, electromagnetic as well as hadronic, can be detected with the same device.
Integrally active dual-readout was pioneered by the DREAM/RD52 collaboration [17] which successfully demonstrated that the mixture of scintillation and Čerenkov light generated by charged particles in the bulk of a crystal, can be separated with various methods. Further studies indicated that the performance of a purely crystal-based dual-readout calorimeter is inferior to that of a sampling dual-readout calorimeter [18], mainly because of the low efficiency in collecting the Čerenkov signal. Another reason for the above is that absorption bands in the crystal can absorb a fraction of the Čerenkov light (which covers all the spectrum) and re-emit it as scintillation light. The inherently stochastic process would introduce another fluctuation in the components of the shower, nullifying, in part, the compensating effect of dual-readout. More recently, a hybrid dual-readout calorimeter has been proposed [19], consisting of a crystal-based front section and a sampling (fiber-based) rear section.
A different approach to integrally active dual-readout calorimetry is offered by theADRIANO technique, based on signals produced in optically separated glasses (C signals) and scintillating fibers (S signals). The latter is discussed in great detail in the second part of this paper.
This paper is organized as follows. In Section 2, we make general considerations on the dual-readout technique and provide the formulae and the guidelines for designing of a dual-readout calorimeter. In Section 3 we extend the previous concept to triple-readout. Section 4, Section 5 and Section 6 introduce theADRIANO calorimeter and the algorithms used to estimate its detector response. Performance studies are presented in Section 7.
Section 8 discusses our results, leading to the conclusions presented in Section 9.

2. The Dual-Readout Concept

This section will briefly summarize a few peculiar points related to the dual-readout concept; they will be crucial in setting the mathematical formulae and guidelines for its implementation in an actual detector.
A typical hadronic shower is composed of electromagnetic (electrons and positrons from γ -particles and from π o decays) and hadronic particles (such as p, n, π ± ). Such electromagnetic and hadronic particles induce a different response in a detector. In other words, if an electromagnetic and a hadronic particle deposits the same energy, the device would return a different signal. Stochastic fluctuations between the electromagnetic and the hadronic components in the process of shower generation are responsible for the most significant uncertainties in the energy measurement, unfavorably affecting the performance of hadronic calorimeters. The dual-readout technique is based on measuring independently the signal produced by the relativistic particles, corresponding to the electromagnetic component of the hadronic shower and the signal produced by all charged particles.
In all practical respects, a dual-readout calorimeter comprises two independent calorimeters sharing the same absorber. The energy of a shower that develops in the absorber is measured in each device, thus providing two independent measurements of the same physics process. If one of such calorimeters is predominantly sensitive to em particles (for example, one based on the Čerenkoveffect) while the second is sensitive to all ionizing particles (for example, a calorimeter based on scintillating plastics), then, those two independent measurements would provide complementary information from the shower. In some respects, dual-readout could be considered as having a binocular view of the shower parameters, as compared with a monocular view obtained with conventional, single readout devices. In practice, the two independent measurements performed on a shower can be employed, for example, to compensate the energy measurement of the impinging particle by mitigating the effect of the fluctuation, to improve the linearity of the calorimeter and to obtain information on the particle ID.
The basic principles for achieving such compensation are summarized in the following formulas. The two responses of each component of a dual-readout detector are defined as:
C = [ f e m + 1 f e m η C ] E
S = [ f e m + 1 f e m η S ] E .
where E is the unknown energy we want to measure, S and C are, respectively, the scintillating and Čerenkovresponses of the device, f e m is the em fraction of the shower and:
e h C η C and e h S η S
are two calibration constants describing the response of the two dual-readout elements of the calorimeter. In general (but not necessarily), the latter depends on the energy of the impinging particle.
As long as Eqs. 1 and 2 are independent, the system can be solved for the unknowns f e m and E, directly determining the shower energy compensated for the em fraction fluctuations. As already remarked by D. Groom [11] and R. Wigmans [12], Eqs. 1 and 2 can be solved to obtain:1
E c o r r = S t a n ( θ c / S ) C 1 t a n ( θ C / S )
where t a n ( θ C / S ) = 1 1 / η C 1 1 / η S . The variance of E c o r r is, in first approximation:
σ E c o r r 2 = 1 1 t a n ( θ C / S ) 2 σ S 2 + t a n ( θ C / S ) 1 t a n ( θ C / S ) 2 σ C 2
where σ S and σ C are the standard deviations of, respectively, S and C.
If t a n ( θ C / S ) 1 , then σ E c o r r 2 is smaller than either σ S 2 and σ C 2 and the net effect is an improvement of the energy resolution of the device. Since S and C are measured for each shower and t a n ( θ C / S ) depends exclusively on the design of the detector, the compensation for the em fluctuations occurs on an event-by-event basis. We will show it in Section 6.2 that an unexpected (and excellent) consequence of the mechanism of compensation is that E c o r r follows a Gaussian distribution (rather than a skewed one, as for the case of S and C) and that the behavior of the detector response function is linear.

2.1. Active regions

As mentioned in Section 1, dual-readout calorimeters are grouped into two broad categories: sampling and integrally (or totally) active calorimeters. The former uses a passive absorber to help stop the impinging particle, as the shower is sampled by the S and C active elements interspersed with the absorber. In integrally active calorimeters, the absorber is also an active material responsible for the production of one or both S and C signals. A very informed review of the two methodologies can be found in Reference [8]. In the following, we discuss the most relevant differences among them.
Sampling calorimeters.
The most popular sampling dual-readout calorimeters employ scintillating and clear fibers embedded in a passive absorber [9,14,15]. The two kinds of fibers provide the S and C signals separately. The main advantage of sampling calorimeters is that the absorber can be made relatively inexpensive and dense, minimizing the cost and size of the detector simultaneously. On the other hand, all these advantages come at the cost of introducing sampling fluctuations in the measurements (cfr. Section 1 above). This consequence is because the development of em and hadronic showers is governed by two distinct parameters: X o and λ I , respectively, which, for a typical absorber material, differ by about one order of magnitude. As a consequence, the process of designing a calorimeter for detecting, at the same time, em and hadronic particles usually requires severe compromises, resulting in a device with either poor em performance (when optimized for hadrons) or impractical to build because of its large size (when optimized for em particles). An example of the large sampling fluctuations expected for em showers in a typical sampling dual-readout calorimeter with a brass absorber is shown in Figure 1. The two plots show the number of photoelectrons expected from scintillating and quartz fibers for 40 GeV electrons impinging at different positions on the surface of a fiber calorimeter. Such fluctuations alone contribute about 4% to the stochastic term of the energy resolution. As mentioned in Section 1, an obvious solution to the above problem would be designing a detector with a front em section and a rear hadronic section. This solution will have a cost in terms of a further deterioration of the hadronic energy resolution due to the introduction of another fluctuation, namely the fraction of the energy deposited across the two sections. The situation becomes especially problematic in the case of experiments aiming at detecting high-energy jets. Those jets consist of em and hadronic particles (in general with unknown and fluctuating abundances) spread across areas comparable to the granularity of the detector. The corresponding sampling fluctuations induce a significant contribution to the stochastic term, resulting in an inferior performance of the device compared to the case where individual particles are detected. A thorough investigation of the matter was performed by the 4th Concept collaboration[13].
Integrally active calorimeters The unfavorable effect of sampling fluctuations disappears or it is significantly reduced, in the case of integrally active dual-readout calorimeters. In this case, the absorber is an active material, and the S and C signals generated by the shower are integrally detected (with the apparent exceptions of leakage and punch-through). Most often, such detectors are homogeneous. Consequently, their performance for em showers is expected to be excellent.
Dual-readout hadronic calorimeters using homogeneous materials like crystals have already been discussed in Section 1, along with their limitations in terms of energy resolution.That technique has been abandoned in favor of a hybrid layout, with a front section made of crystals and a rear section based on a sampling dual-readout detector.
Another possible integrally active technique is based on a non-homogeneous layout, using, for example, lead glass for the Čerenkov and scintillating plastic for the second component. That strategy overcomes most of the limitations of both the sampling and the integrally active homogeneous techniques described above. An implementation of that, A D R I A N O , will be discussed in the second part of this article.

2.2. Methods for Separating the Scintillation and Čerenkov Light Components

Currently, two techniques are being used to separate the scintillation and Čerenkov components of a shower. In one method, the scintillation and Čerenkov photons are generated in physically separate media, and read out by distinct photo-detectors[9,13,24]. Each medium is chosen to optimize the corresponding light production and t a n ( θ C / S ) (see above). Plastic scintillators are used to generate the scintillation signal and transparent materials with high refractive index are chosen to produce Čerenkovsignals (like quartz, lead glass, and lead fluoride, among others). This method has the advantage that scintillation and Čerenkovlight are well distinguished, with minimal or no cross-talk.
The second method is mainly adopted in integrally active homogeneous calorimeters, where the absorber consists of a homogeneous active medium capable of simultaneously generating scintillation and Čerenkov light [17]. The two signals are separated by the different nature of their production mechanisms, such as, fluorescence of specific molecules in one case and Čerenkoveffect in the other. The light produced in these two cases exhibit peculiar properties regarding, for example, its directionality (isotropic vs directional), time structure (presence of one or more decay constants vs. prompt), and light spectrum (narrow emission curve vs. 1/ λ 3 behavior). Any combination of these can be exploited to obtain some separation of the two signals.
A comparison of the separation power for the above methodologies has been published by the DREAM/RD52 Collaboration (see, for example, ref. [25,26]). The superiority of the technique where physically separate media are used for the production of the scintillation and Čerenkovsignals is straightforward, resulting in contamination between the S and C signals at the few percent level. This technique was chosen for the design of A D R I A N O . Other similar integrally active techniques are presently being investigated by other groups, where plastic scintillators are replaced by single crystalline fibers[27,28].

2.3. Figures of Merit of a Dual-Readout Calorimeter

The most critical parameters affecting a dual-readout calorimeter’s (stochastic) performance are light yield and the θ C / S angle. They are briefly discussed below.
  • Light yield. From general principles of calorimetry, it is well known that the concomitant effects of fluctuations in the development and detection of a particle shower are at the origin of the stochastic term in the energy resolution function. Therefore, experimentalists devote considerable effort to keeping those fluctuations at the smallest possible level. Of course, these arguments apply to both the Čerenkovand scintillation components for a dual-readout calorimeter. Since a hadronic shower has irreducible fluctuations related to the intrinsic fluctuation of the nuclear processes occurring between the shower particles and the detector, we want to keep stochastic fluctuations small compared to the latter. The theoretical limit for the stochastic term due to nuclear effect is ≈10-15% (corresponding to about 30-45 pe/GeV).
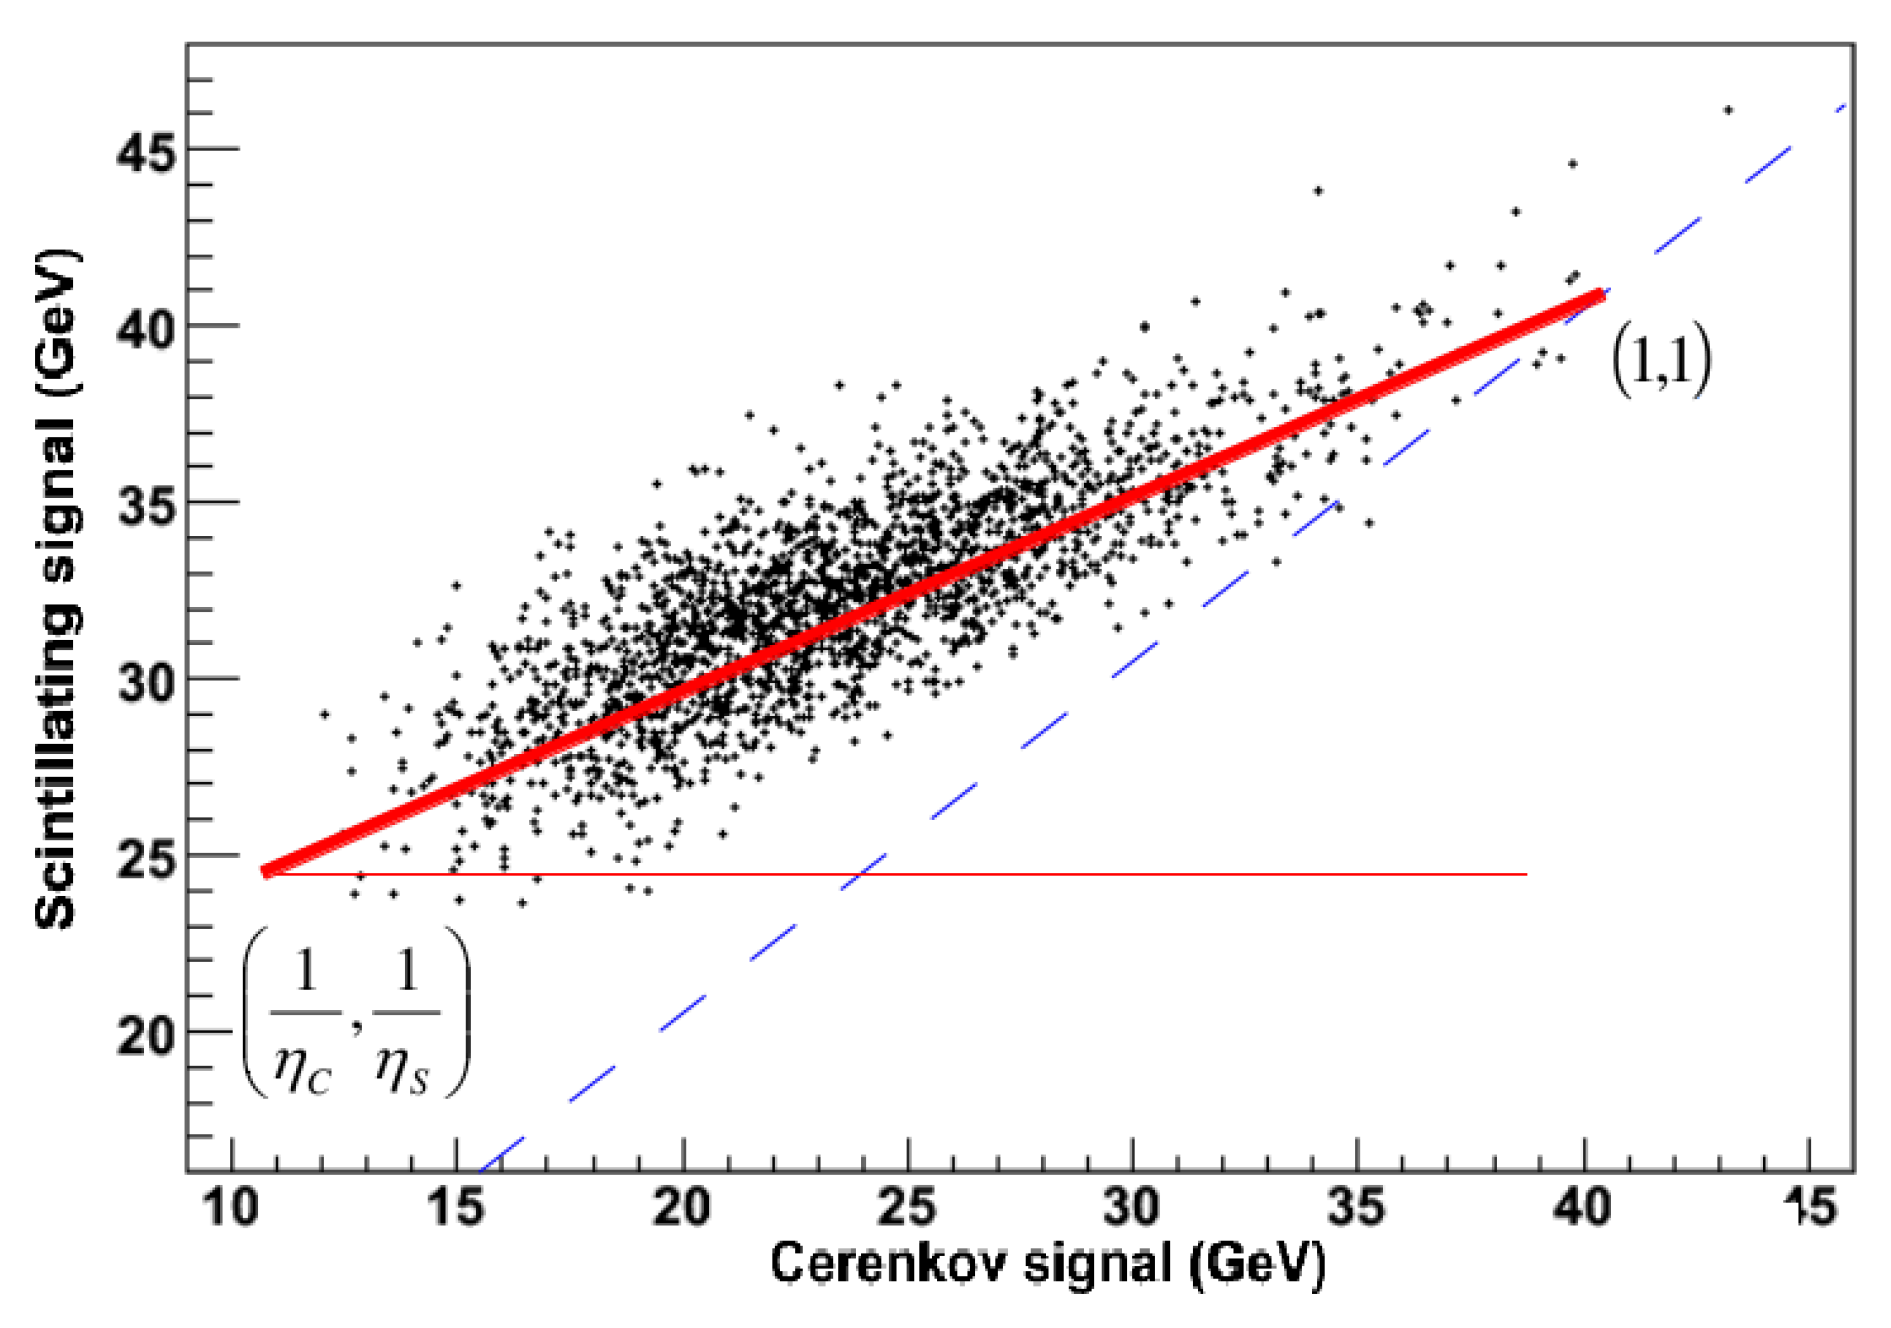
  • The θ C / S angle. The requirement for the system of Eqs. (1,2) to have a solution is that η C and η S have different values. In that case, it can be solved for f e m and E c o r r on an event-by-event basis. In practice, the scintillation and Čerenkov signals provide complementary information regarding the same EM or hadronic shower, which can be exploited to improve energy measurements. If η C = η S that complementarity is lost as the two readouts do not provide independent information. This is shown graphically in Figure 2 for a 40 GeV π 1 meson impinging onto a typical sampling calorimeter with a brass absorber, and scintillating and quartz fibers spaced by 1 mm. The point of the plot with coordinates ( 1 , 1 ) corresponds to the cases where the primary particles decay predominantly via EM processes (essentially, π 0 and η particles). In contrast, the point (1/ η C ,1/ η S ) corresponds to the opposite extreme case of a shower mostly populated by particles decaying non-electromagnetically. When the above points lie on the C / S = 1 line the determinant of Eqs. 1 and 2 is null and the systems cannot be solved. On the other hand, the larger the angle θ C / S the segment(1/ η C ,1/ η S )- ( 1 , 1 ) forms with the S axis, the more precise is the determination of E c o r r , since its variance σ E c o r r 2 decreases correspondingly (cfr. Eq. 5). Therefore, θ C / S can be considered as a figure of merit of the compensation power of a dual-readout calorimeter: as already noted in Section 1, the larger θ C / S , the more compensating is the calorimeter. From Figure 2, we can express θ C / S in terms of η C and η S through the following relationship:
    t a n ( θ C / S ) = 1 1 / η C 1 1 / η S .
From the practical point of view, a significant value of θ C / S corresponds to a large skewness of the response function of the Čerenkov readout for EM and hadronic particles. It can be obtained, for example, by choosing a Čerenkovradiator with a low value of the refractive index n D . The lower n D , the fewer are the hadronic particles in the shower above the Čerenkovthreshold.
We stress again that the light yield and θ C / S depend exclusively on the detector’s layout. Those values need to be as large as possible for a properly designed calorimeter.

3. Triple-Readout Calorimetry

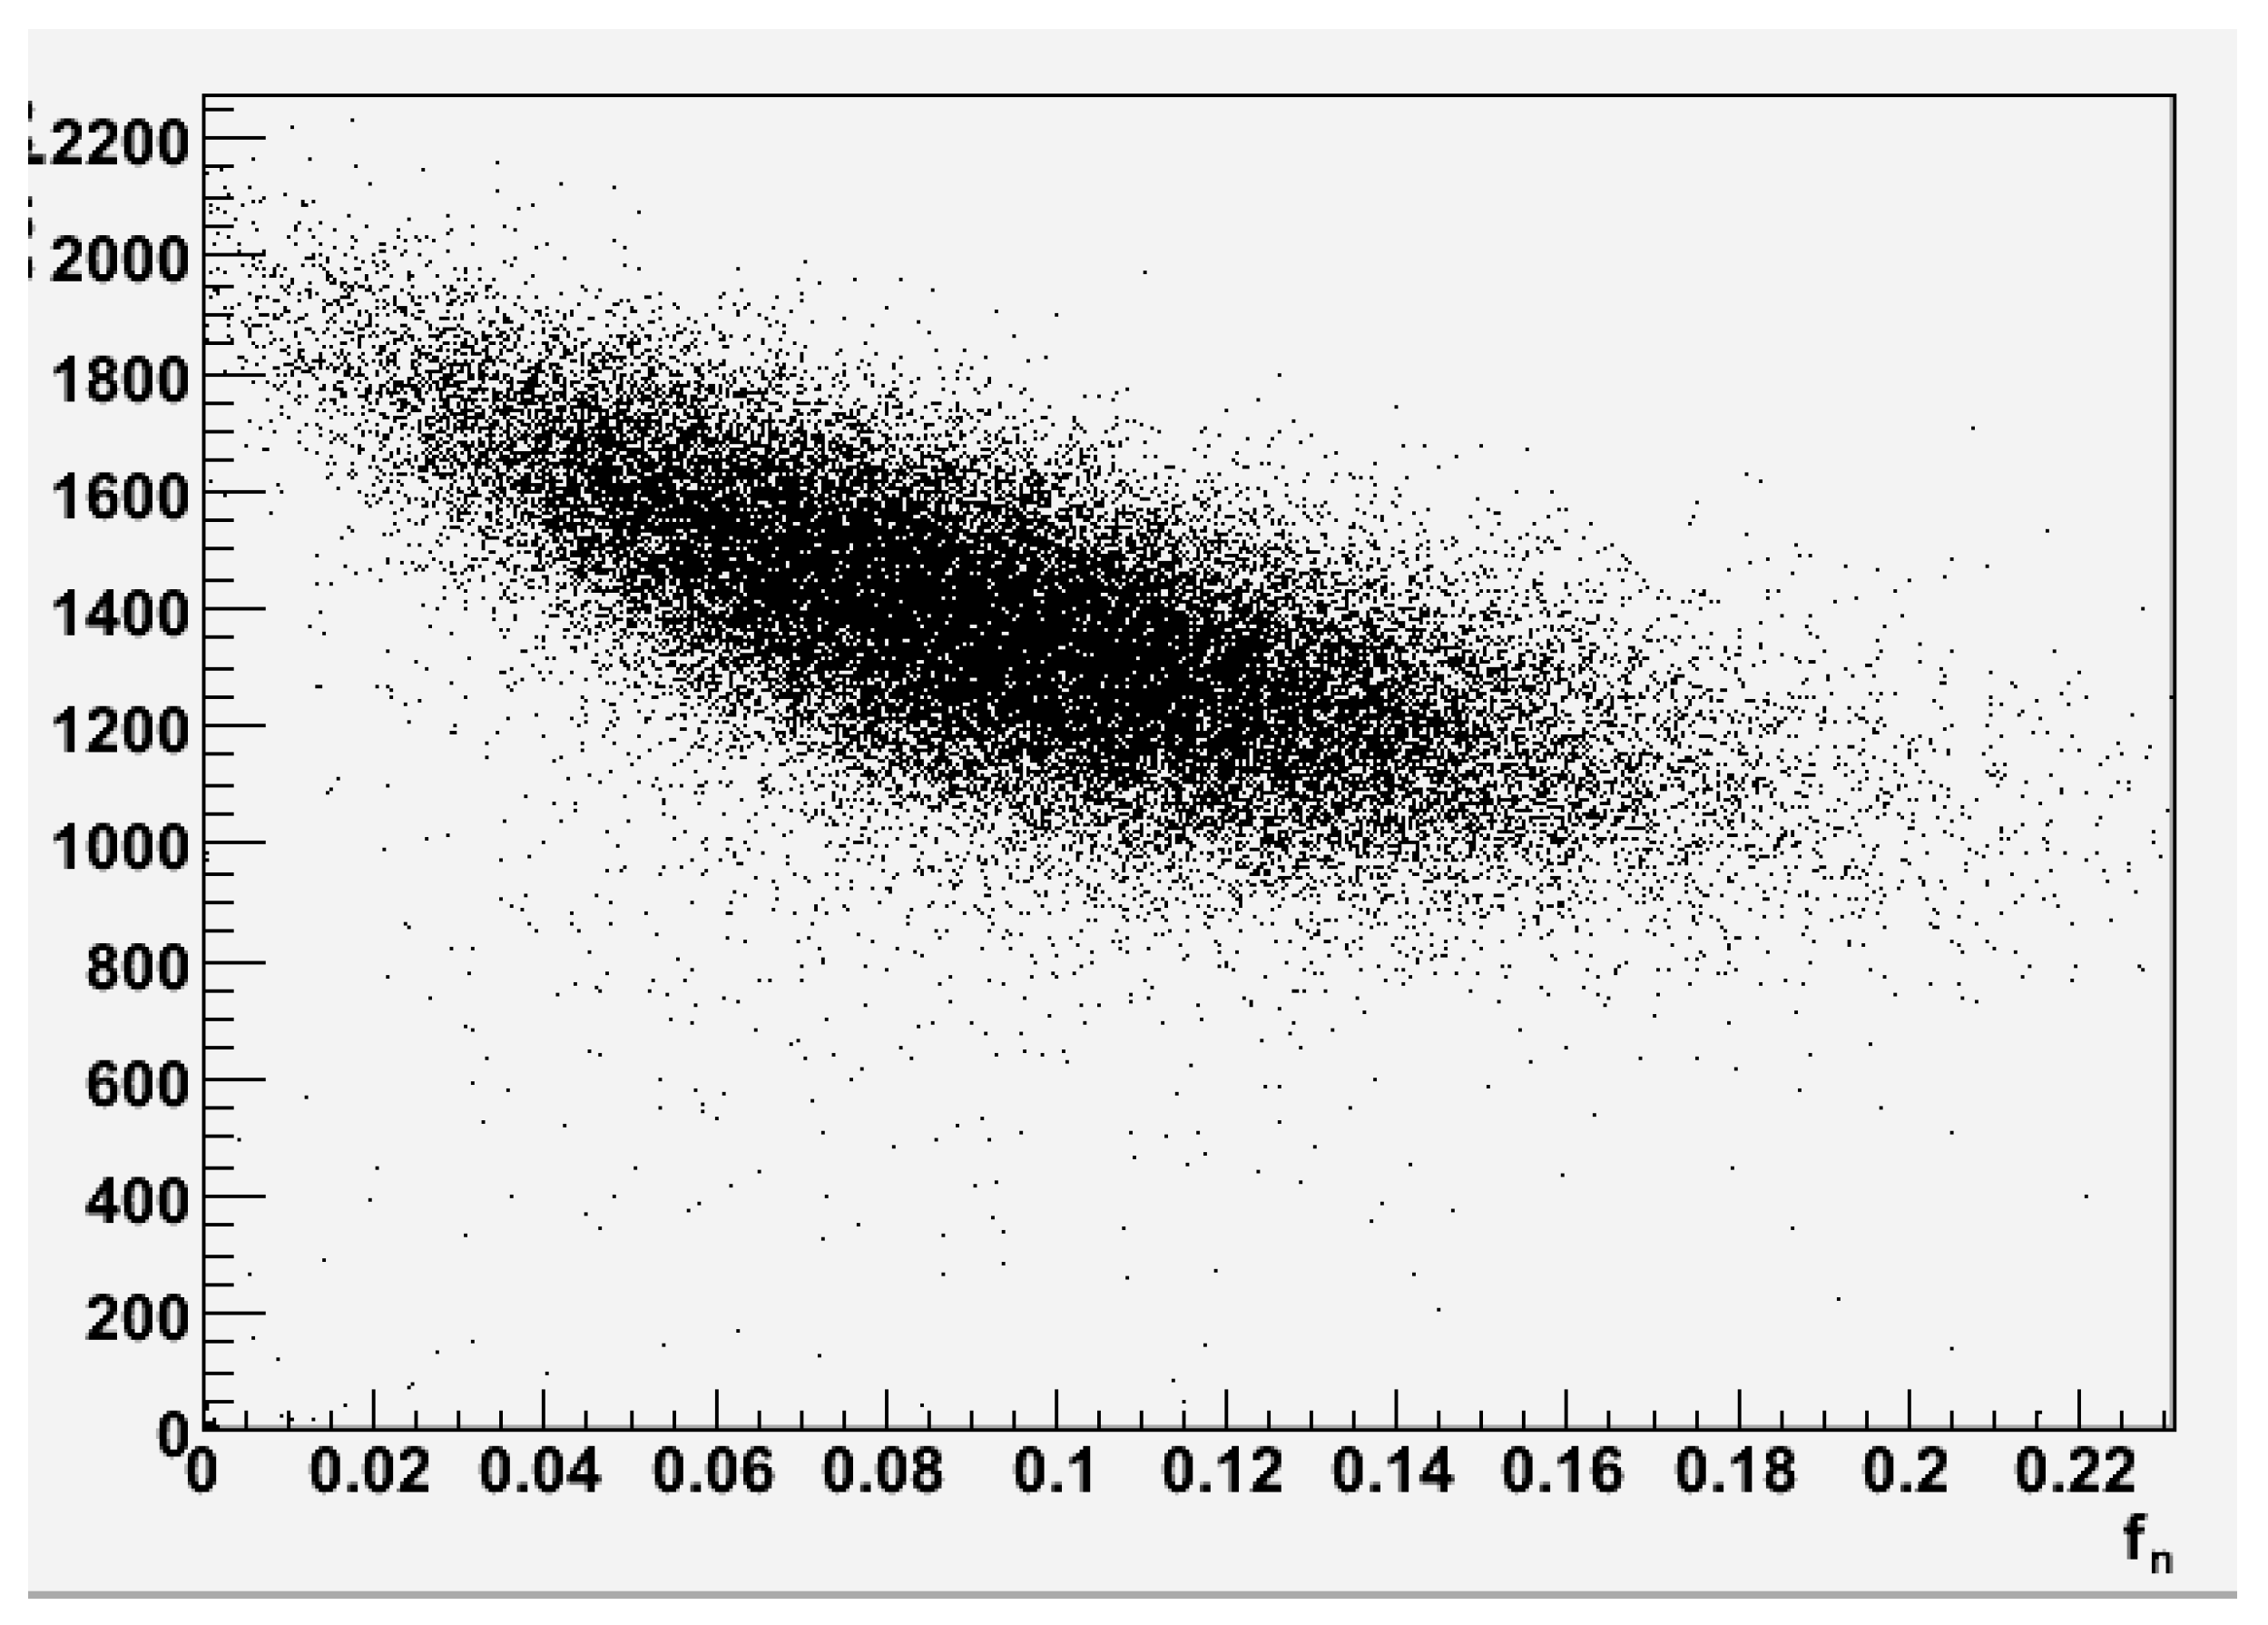
Even if a dual-readout calorimeter is a promising detector to improve the energy resolution for neutral hadrons, there are still margins for improvement. In fact, the components of an hadronic shower inducing a different response in the calorimeter are, in fact, three: a) the electromagnetic, b) the non-neutron hadronic, c) the neutron component. Figure 3 shows the scatter plot of the Čerenkov signal (A.U.) and the fraction of energy deposited by neutrons in a shower generated by a 45 GeV π in a dual readout calorimeter (ILCroot simulation using Geant4).Such large fluctuation will affect the final energy resolution of the device and cannot be compensated with simple dual-readout methods.
Therefore, to further improve the energy resolution of a hadron calorimeter, the third component, namely the neutron component, must be measured separately from the previous two. A detector with such properties would be a triple-readout calorimeter.

3.1. Neutrons Related Fluctuations

The next most significant contribution to the fluctuations in the observable energy of a shower is due to the binding energy losses in a nuclear break-up. The latter is proportional to the number of neutrons with kinetic energy of 1-2 MeV produced during the shower’s final development. Therefore, a calorimeter that can distinguish the signals generated from thermal neutrons can be used to correct the fluctuations of the binding energy losses. Neutrons in this energy range are most easily measured with a hydrogenous medium, usually a hydrocarbon, by detecting the proton elastic recoils from the n p n p scatters. The kinematics of equal-mass elastic scattering are such that the neutron loses one-half of its kinetic energy per collision, i.e., the recoiling proton is in the MeV energy range, and it can easily be detected in, for example, a plastic scintillator which has a high hydrogen content. A viable way to achieve the separation between the signals produced by neutrons and those from the remaining particles is by considering the time development of the shower since the neutron component has much longer tails.
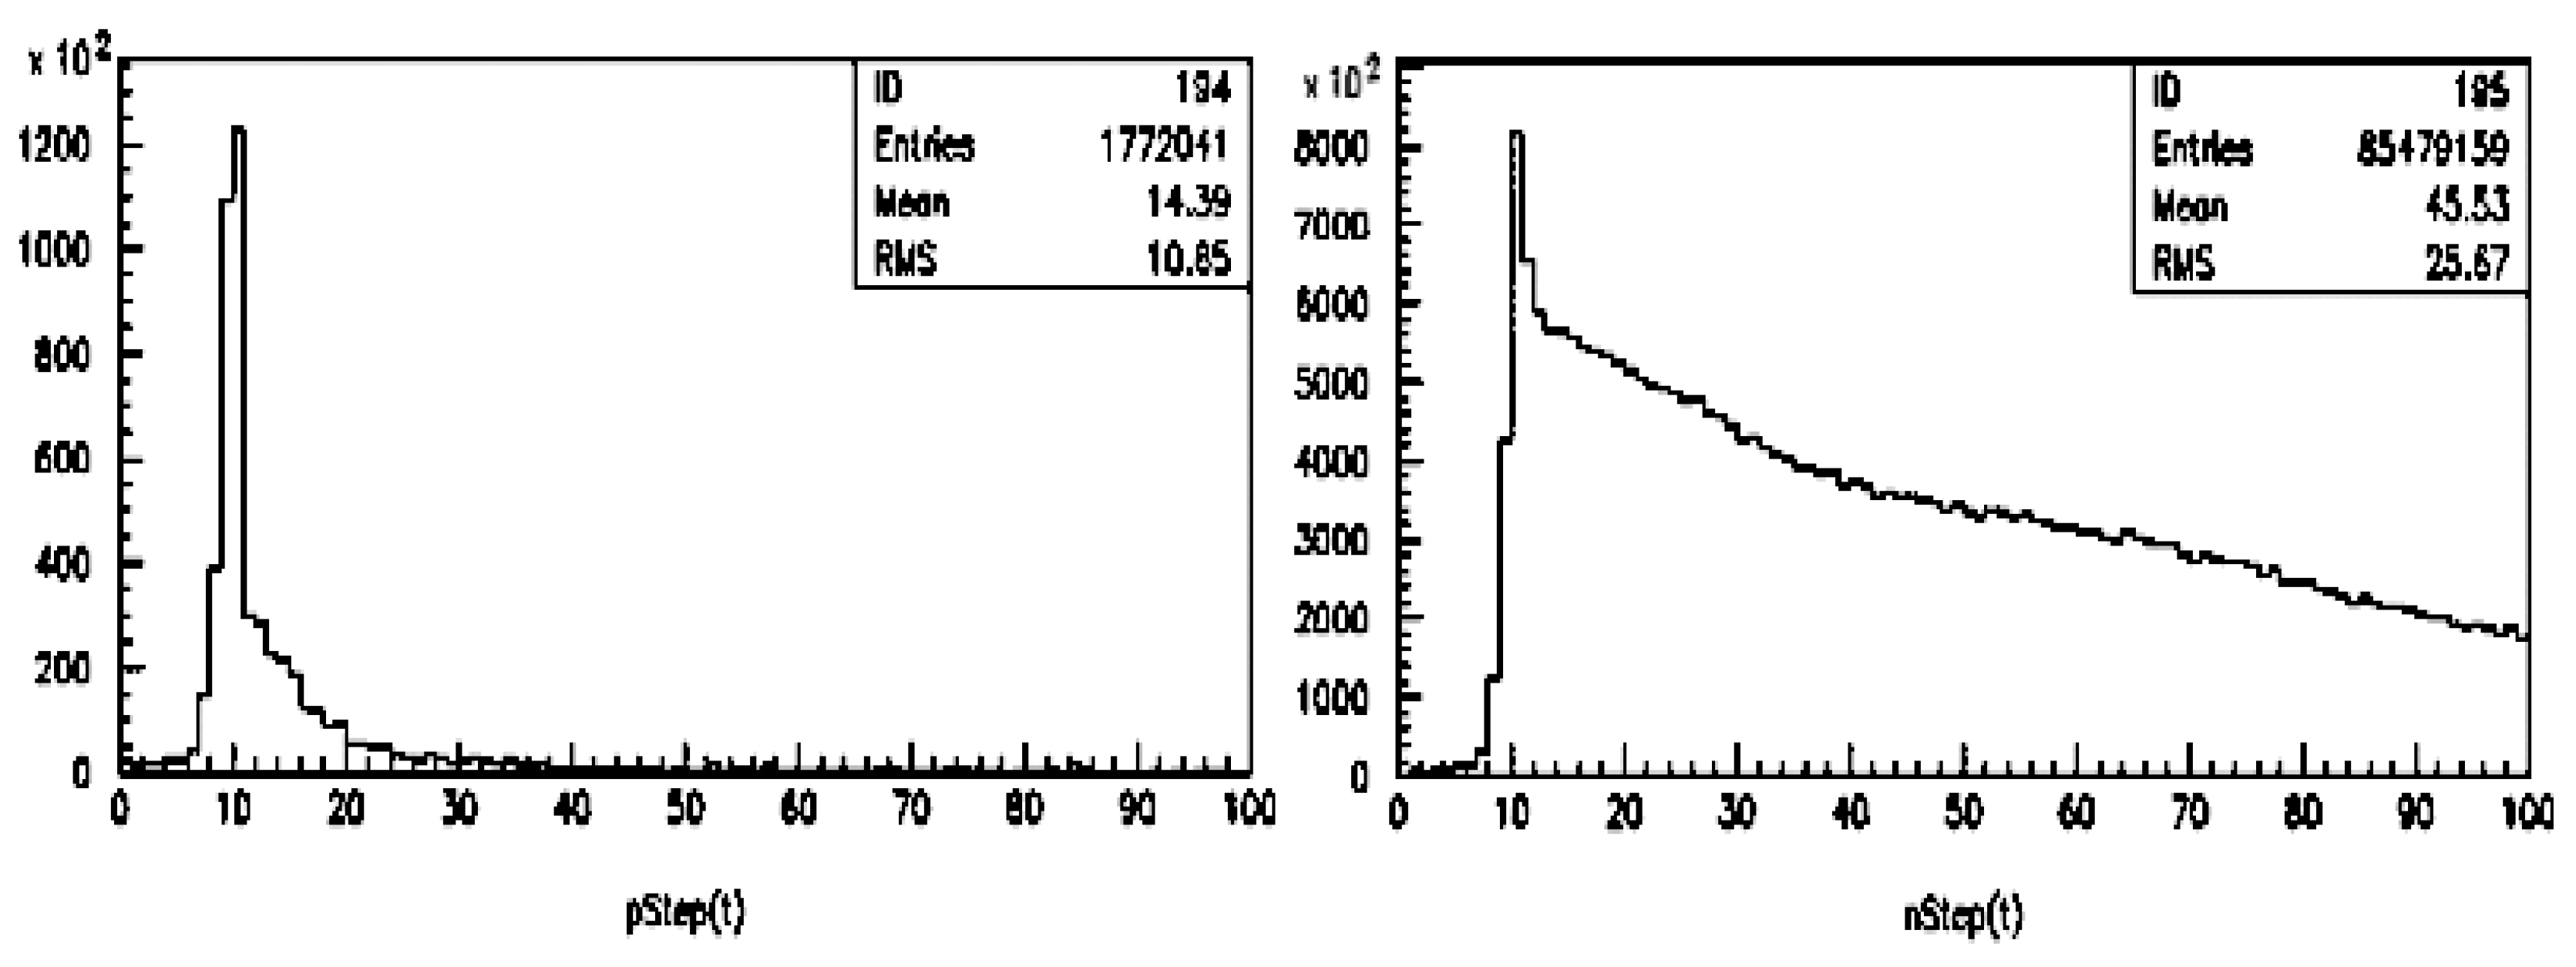
To demonstrate the significance of this technique, we show in Figure 4 the simulated time distribution of the light generated in the scintillating fibers by the protons (left) and the neutrons (right) of a 100 GeV π impinging onto a sampling fiber calorimeter. This simulation serves as a powerful illustration of the technique’s application and its potential impact on our understanding the dual-readout calorimeter. [29].
The long tail of the time distribution is, in fact, primarily due to the neutron component: a measurement of the latter can easily be obtained through a waveform analysis of the scintillation signal. Conversely, the Čerenkovsignal produced by the thermal neutrons is expected to be non-existent since the scattered protons are far below the Čerenkovthreshold. From the practical point of view, comparing the waveforms of the S and the C signals in a dual-readout calorimeter will give straightforward information on the neutron fraction of a shower. Furthermore, the time history of the prompt Čerenkovwould serve several other purposes; among the others, it can be used to tag electromagnetic late light not due to neutrons, tag energy deposits from overlapping events, monitor the calorimeter for energetic activity between beam crossings, serve as a calibration monitor. An application of the above technique is discussed in the second part of this article.
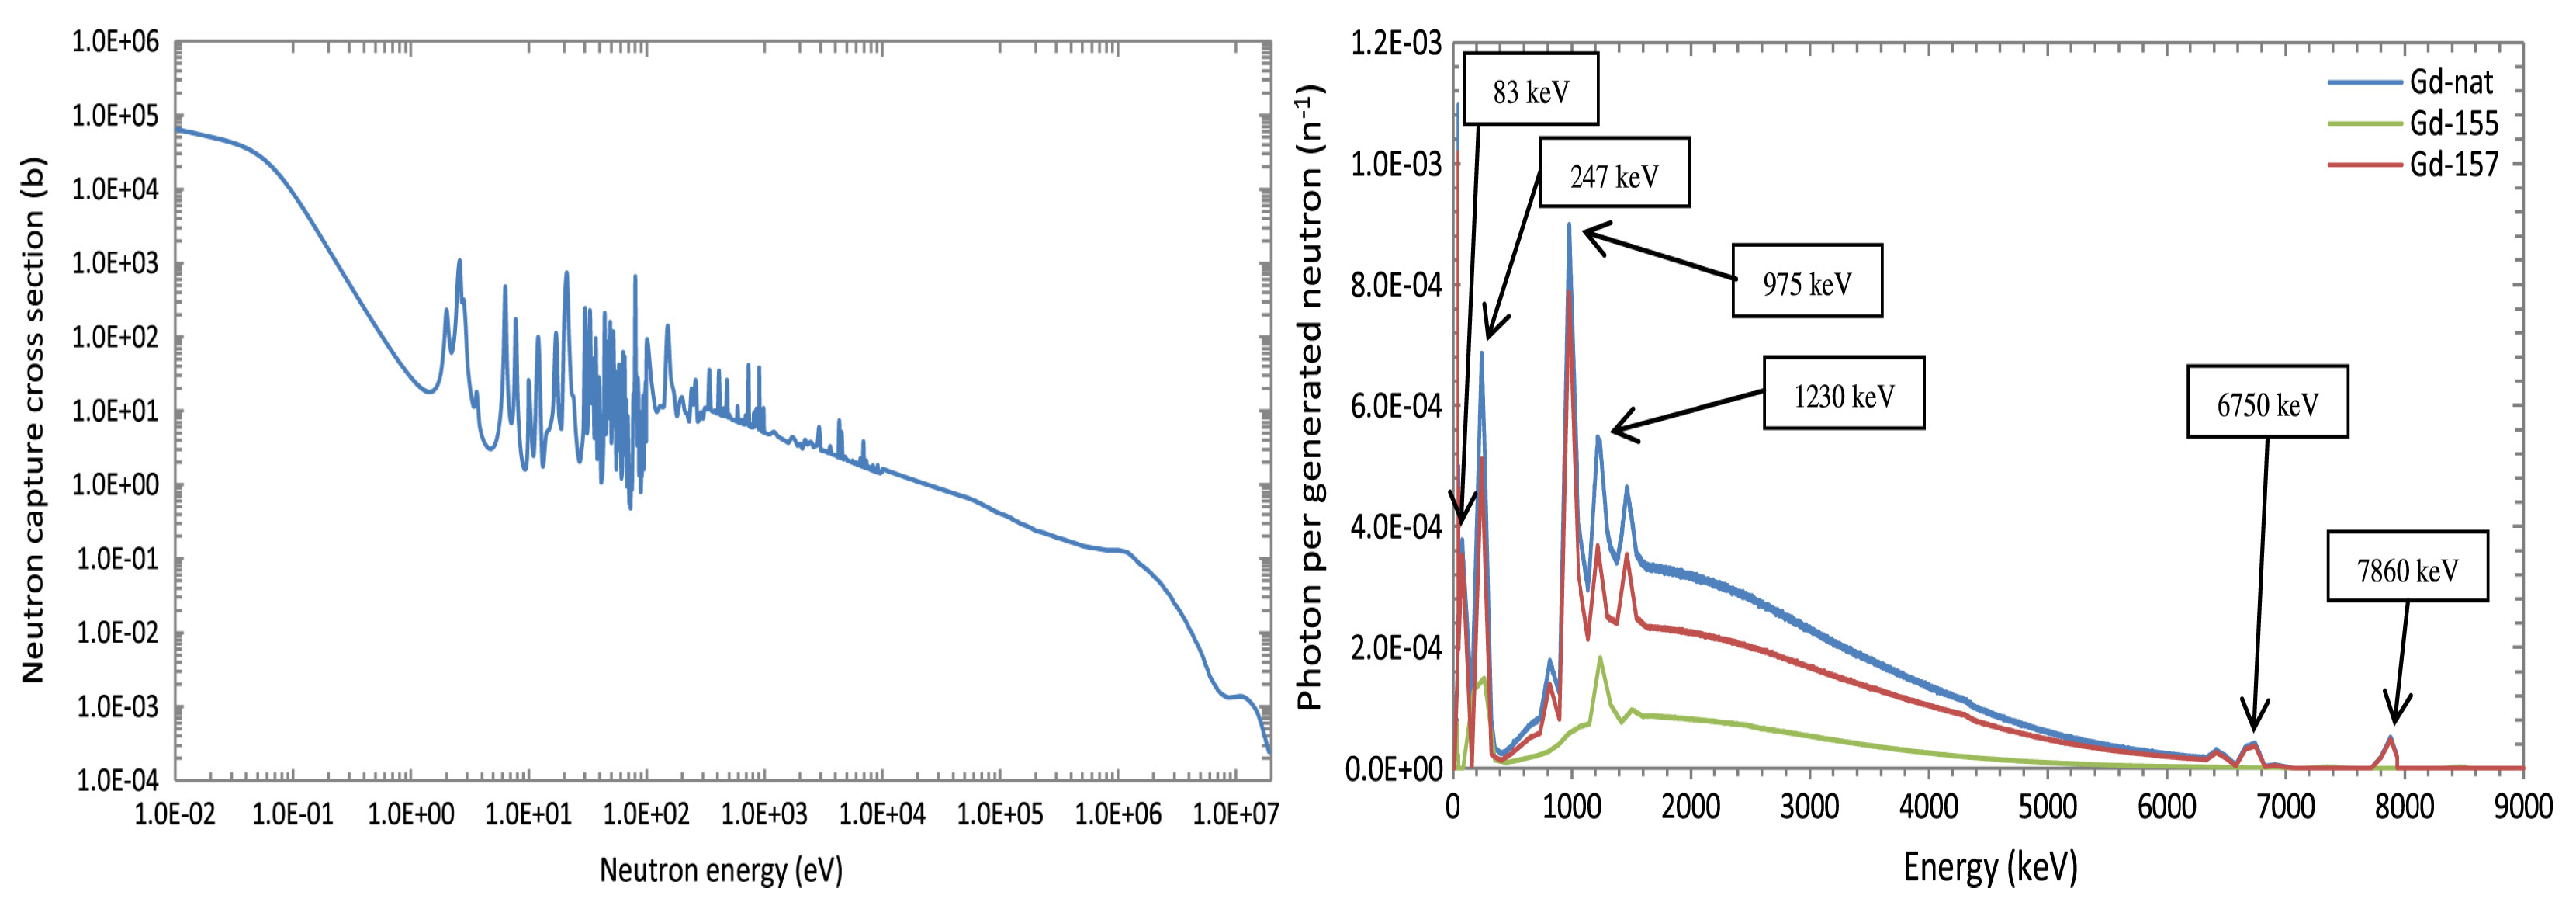
Another way to independently measure the neutron component of a shower is by a capture process by a Gd-155 or Gd-157 resulting in an isotopic change of the Gd nucleus followed by radiative dis-excitation of the latter (155 G d ( n , γ ) and reactions157 G d ( n , γ ) ) [21].
The capture cross section is shown in Figure 5. The energy region of interest for hadron calorimetry is between 0.1 and few MeV. The radiative photon is emitted with an energy in the range of 83 keV and 8 MeV. It can be detected with high efficiency with, for example, gaseous detectors. A new R&D initiative exploiting the above technique has been recently started [23].

4. The A D R I A N O Calorimeter

In the remaining part of this article we apply the guidelines discussed above and introduce a realistic implementation of a integrally active, non-homogeneous dual-readout calorimeter. The detector response of that model will be analyzed with Monte Carlo simulations and the energy resolution will be evaluated as a function of the detector layout and construction parameters. A triple-readout implementation will also be discussed, along with the projected improvement in terms of energy resolution. In spite of using a particular detector model, the results are general enough to be applied to other multiple-readout detectors.
The conceptual design of A D R I A N O (ADual-Readout,IntegrallyActive andNon-homogeneousOption) calorimeter follows the considerations done in Section 2.3 as well as few general criteria applied when designing a realistic detector for a 4 π experiment. Such criteria take into account at least two more factors, namely: a) the total number of readout channels and b) the ratio between the active area of the photo-detectors and the total calorimeter area. The first criterium is essentially intended to reduce the cost of the apparatus and to assure that the detector can be reliably calibrated. The second criterium is related to the constraints imposed by the available space for instrumenting a calorimeter in a typical 4 π experiment and to the physical size of presently available photodetectors. The other requirements we have established for the conceptual design of A D R I A N O are the following:
  • The scintillation and Čerenkovcomponents are produced in distinguished volumes of the calorimeter, with no cross-talk between them. The light generated in each region is individually transported and read-out by individual photo-detectors.
  • The calorimeter is integrally active, with minimal passive material. The latter should be limited to thin walls needed to physically separate the scintillating and Čerenkovregion or to optically shield and protect the outer boundary of a cell.
  • It is highly desirable that the volume of the Čerenkovregion be much larger than the scintillation volume. In that case, the detector can be operated also as an EM calorimeter, with no need for a dedicated EM section in front of the hadron calorimeter. This choice is somehow complementary to the latest proposed dual-readout calorimeters (see, for example, Ref. [15]). Another advantage of having a large Čerenkovvolume is in the larger f e m since the EM component of an hadronic shower develops mostly in a narrow core along the direction of the primary particle.
  • Scintillation and Čerenkovlight yield need to be at least 150 pe/GeV, namely a factor 4 compared to the equivalent intrinsic nuclear fluctuation (see above) . In the case of Čerenkovsignal, this could be easily obtained with materials with refractive index greater than 1.8. The scintillation light is generated in plastic plates or fibers with volume sufficiently large to yield the required number of photo-electrons. As explained in Section 3.1, this choice will also make the detector sensitive to neutrons and, with a proper front-end electronics, it would allow it to operate in triple-readout mode.
  • In order to improve the compensating power of A D R I A N O , η C / η S ratio must be maximized (discussed in Section 2.3). This is most effectively obtained by increasing η C as much as possible, since, in plastic scintillators, η S has a narrow range of variation around values of the order of unity. On the other hand, η C can be easily increased by suppressing the collection of light generated by charged pions with an appropriate choice of the refractive index of the absorber and the critical angle of the light collection system. This mechanism will be discussed in details in the next Section.
  • The calorimeter is designed to be not longitudinally segmented, leading to a 2-D device. The rational behind is that, while a segmented calorimeter provides extra longitudinal information on the shower profile, it also spoils the homogeneity of the calorimeter as it requires extraneous materials (such as sensors, electronics, cables, etc.) in the inner volume of the detector. On the other hand, we can apply for A D R I A N O a correction mechanism for shower leakage based on estimating the Center of Gravity ( C o G ) of the shower by a light division method (see Section 7.3 below). A non-segmented calorimeter has a much lower cost of a segmented version. The number of readout channels is much lower with a consequent easier calibration. Construction is also greatly simplified. A non-segmented calorimeter, built using modular, projective towers, is a convenient choice for experiments at colliding beam where showers are predominantly generated by jets. A High-Granularity implementation of A D R I A N O is also under study, in either dual-readout and triple-readout configuration. See, for example, Ref. [22,23] and references therein.
  • The last requirement is related to the total surface of photo-detector needed to instrument a realistic calorimeter for an experiment at a collider. It becomes impractical (and expensive) to build a detector where the ratio R p d between the active surface of all photo-detector and the total detector surface exceeds few percent. This is especially relevant when the light collection system of such detector is based on optical fibers, as they have to be grouped in separate bunches and routed to their respective photo-detectors. This usually requires that the fibers extend several tens of cm beyond the end of the calorimeter, increasing the complexity of coupling them to the photo-detector. Our goal for the A D R I A N O calorimeter is to keep R p d smaller than 10%. For comparison, we have estimated a R p d value of about 21% for the calorimeter proposed by the 4 t h C o n c e p t Collaboration[13] and about 24% for DREAM prototype[9].

4.1. Detector Layout

The guidelines established above are rather generic and leave ample margins for layouts aimed at specific applications. In the following, we will adopt a particular implementation which has the further advantage of being flexible and easy to optimize.
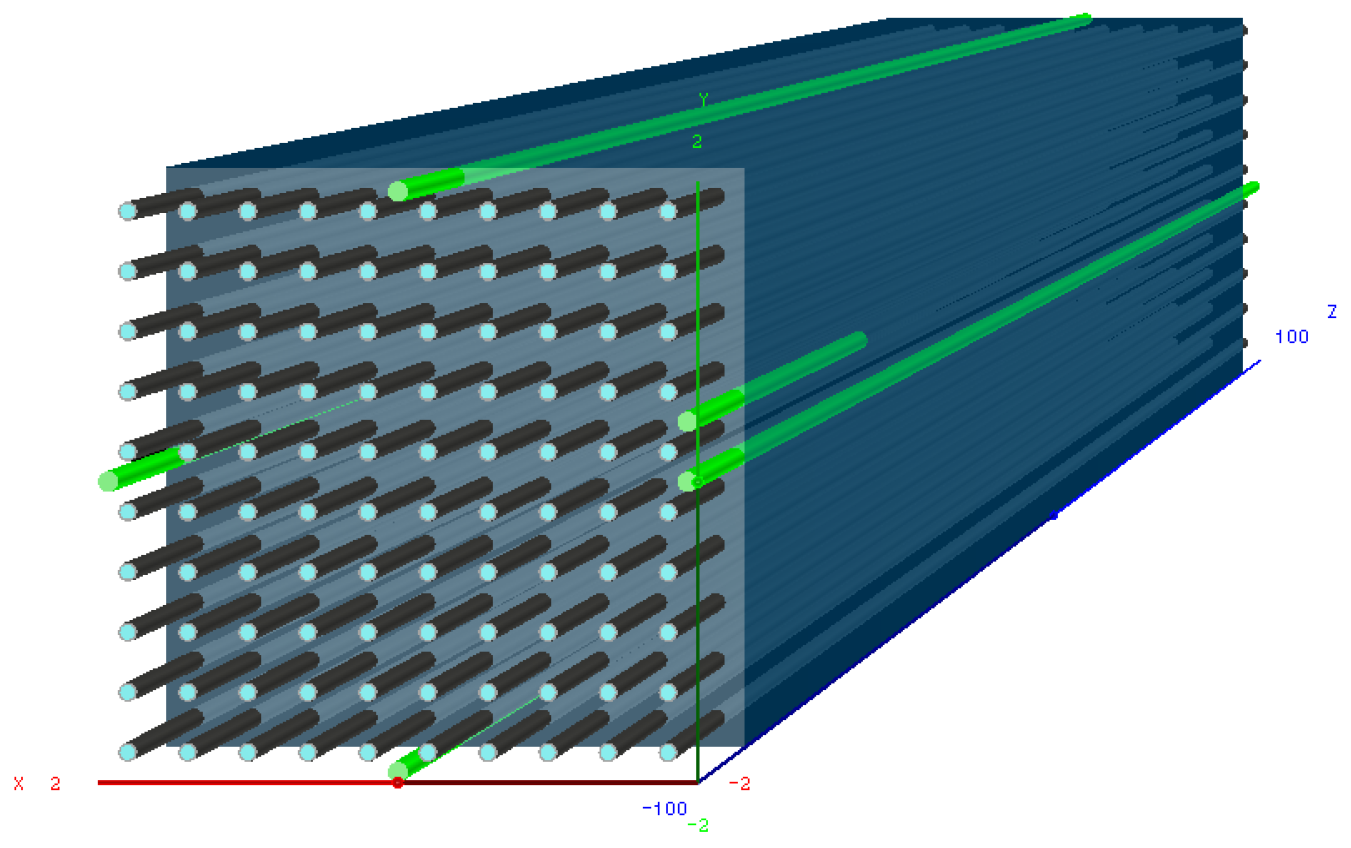
The A D R I A N O layout considered here has a modular structure, with each module consisting of a cell of rectangular shape with 40 × 40 m m 2 cross-section and 1800 m m length. In case of a 4 π detector the cell would be longitudinally tapered with an angle of about 1.4 °. Roughly 84,000 cells with a projective geometry are necessary to cover the entire solid angle, up to θ m i n 4 o . Each cell consists of a block of high density, optical grade heavy glass which acts, at the same time, as an absorber and as an active medium, producing almost exclusively Čerenkovlight2. The scintillating section consists of scintillating fibers interspersed in the heavy glass and sitting in longitudinal grooves along the cell. More details of the two sections are given below.
The Čerenkov section. For the studies reported in this article, we have assumed that the Čerenkovradiator is made with SF57HHT[37] super-flint glass produced by Schott Industries. This choice, supported by the results of the simulations discussed later (cfr Section 5.2 and Section 6), has been made for several reasons:
  • SF57HHT is a heavy lead glass with a radiation length X o of about 1.2 c m and a Moliére radius of about 1.9 c m . In the HEP community the lead glass is often used as active medium of homogeneous electromagnetic calorimeters because of its excellent energy resolution and relatively low costs. This imply that it is also well suited for measuring the electromagnetic component of an hadronic shower.
  • The hadronic interaction length of SF57HHT glass is about 21 c m bringing to a compact longitudinal module and and a detector with fine lateral granularity.
  • The SF57HHT glass is produced using a continuous melting technique. Therefore, long slabs up to a few meters in length can easily be obtained for the construction of cells.
  • The Čerenkovlight production mechanism depends only on the refractive index of the medium, which is insensitive to changes in ambient parameters. As opposite to crystals, the light yield is also far more insensitive to inhomogeneities, impurities or defects of the medium. As a consequence, manufacturing of lead glass cells is a much more reproducible process than that of crystals;
  • The SF57HHT is a glass produced for the optical industries. Therefore, it is a highly transparent medium and, even more important, optically homogeneous. The latter property guarantee than non-uniformity in the light transmission are very low, with corresponding lower contributions to the constant term of the energy resolution function.
  • Lead glass is among the cheapest active media available for a calorimeter.
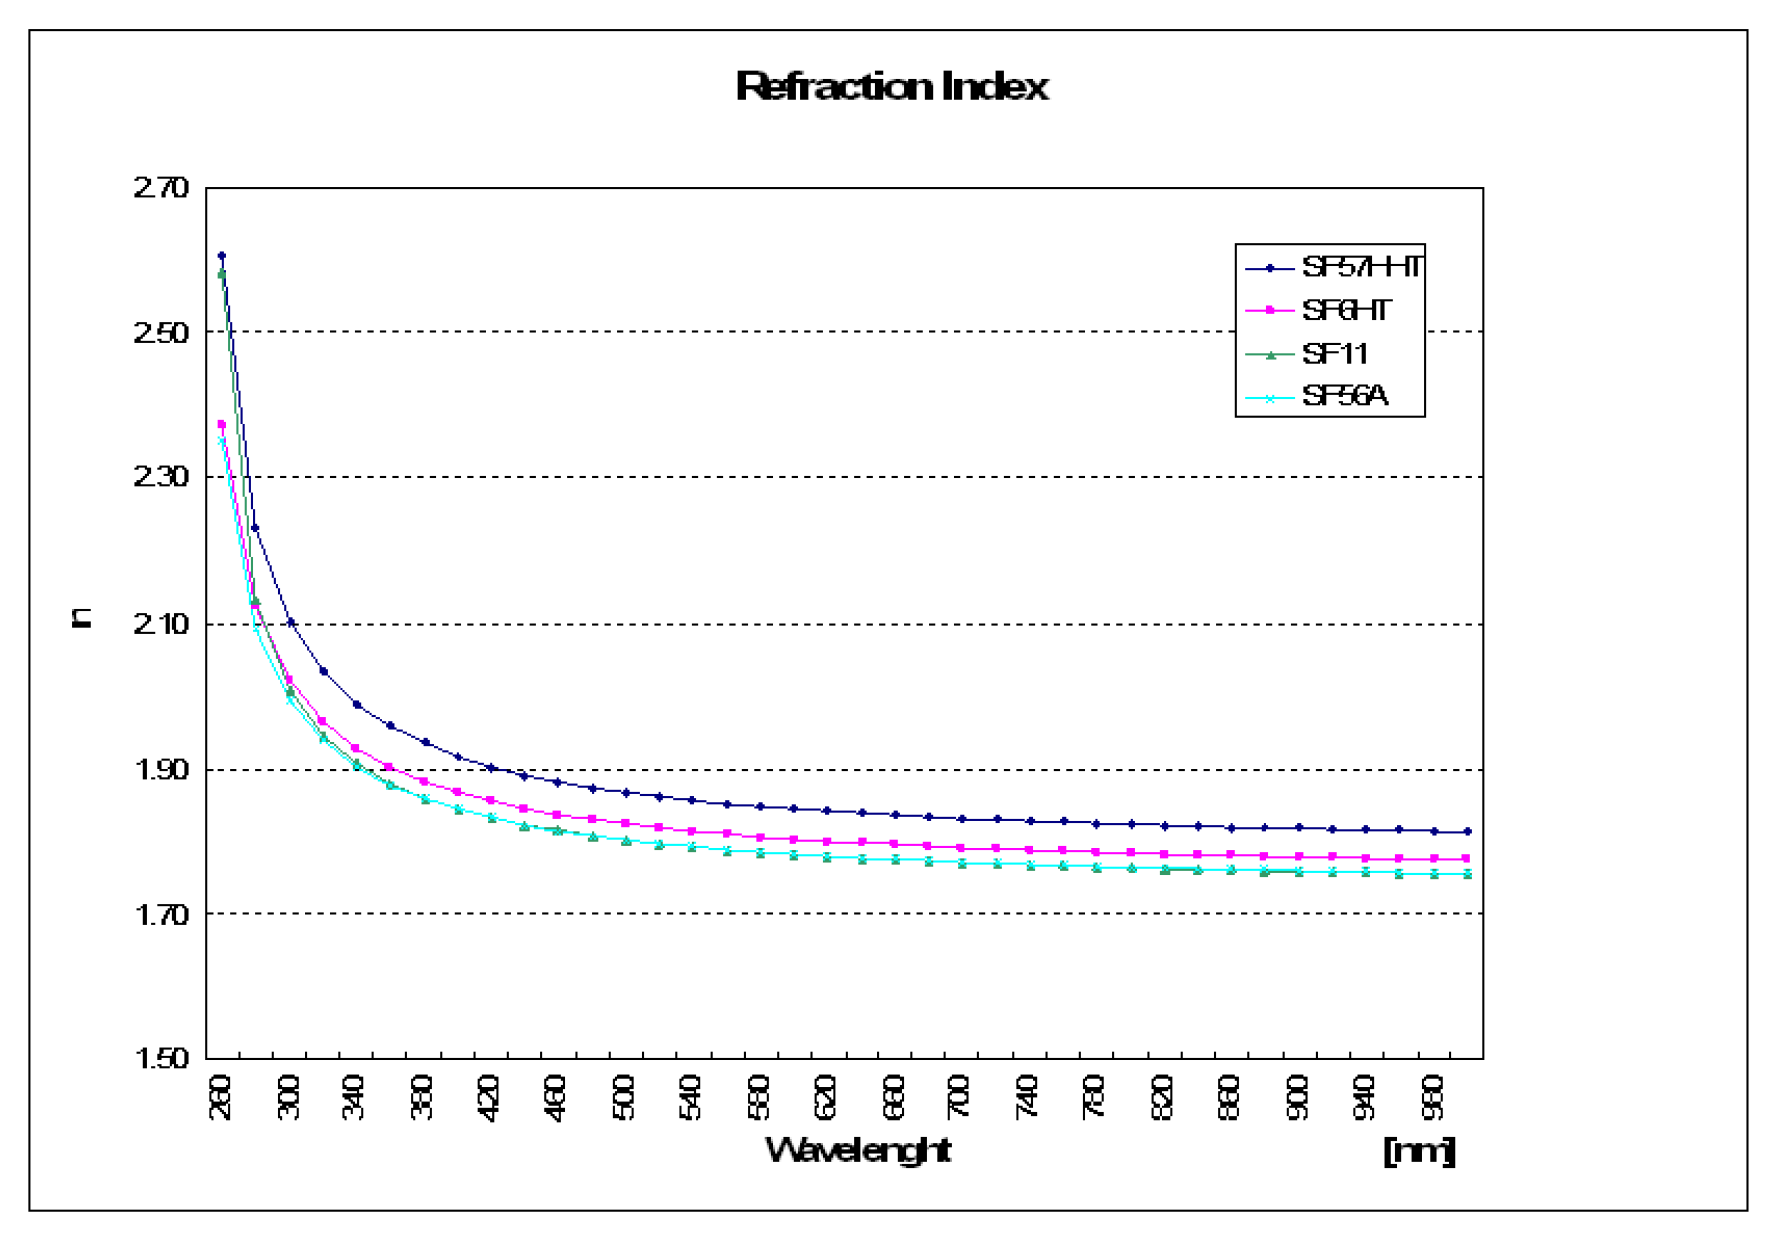
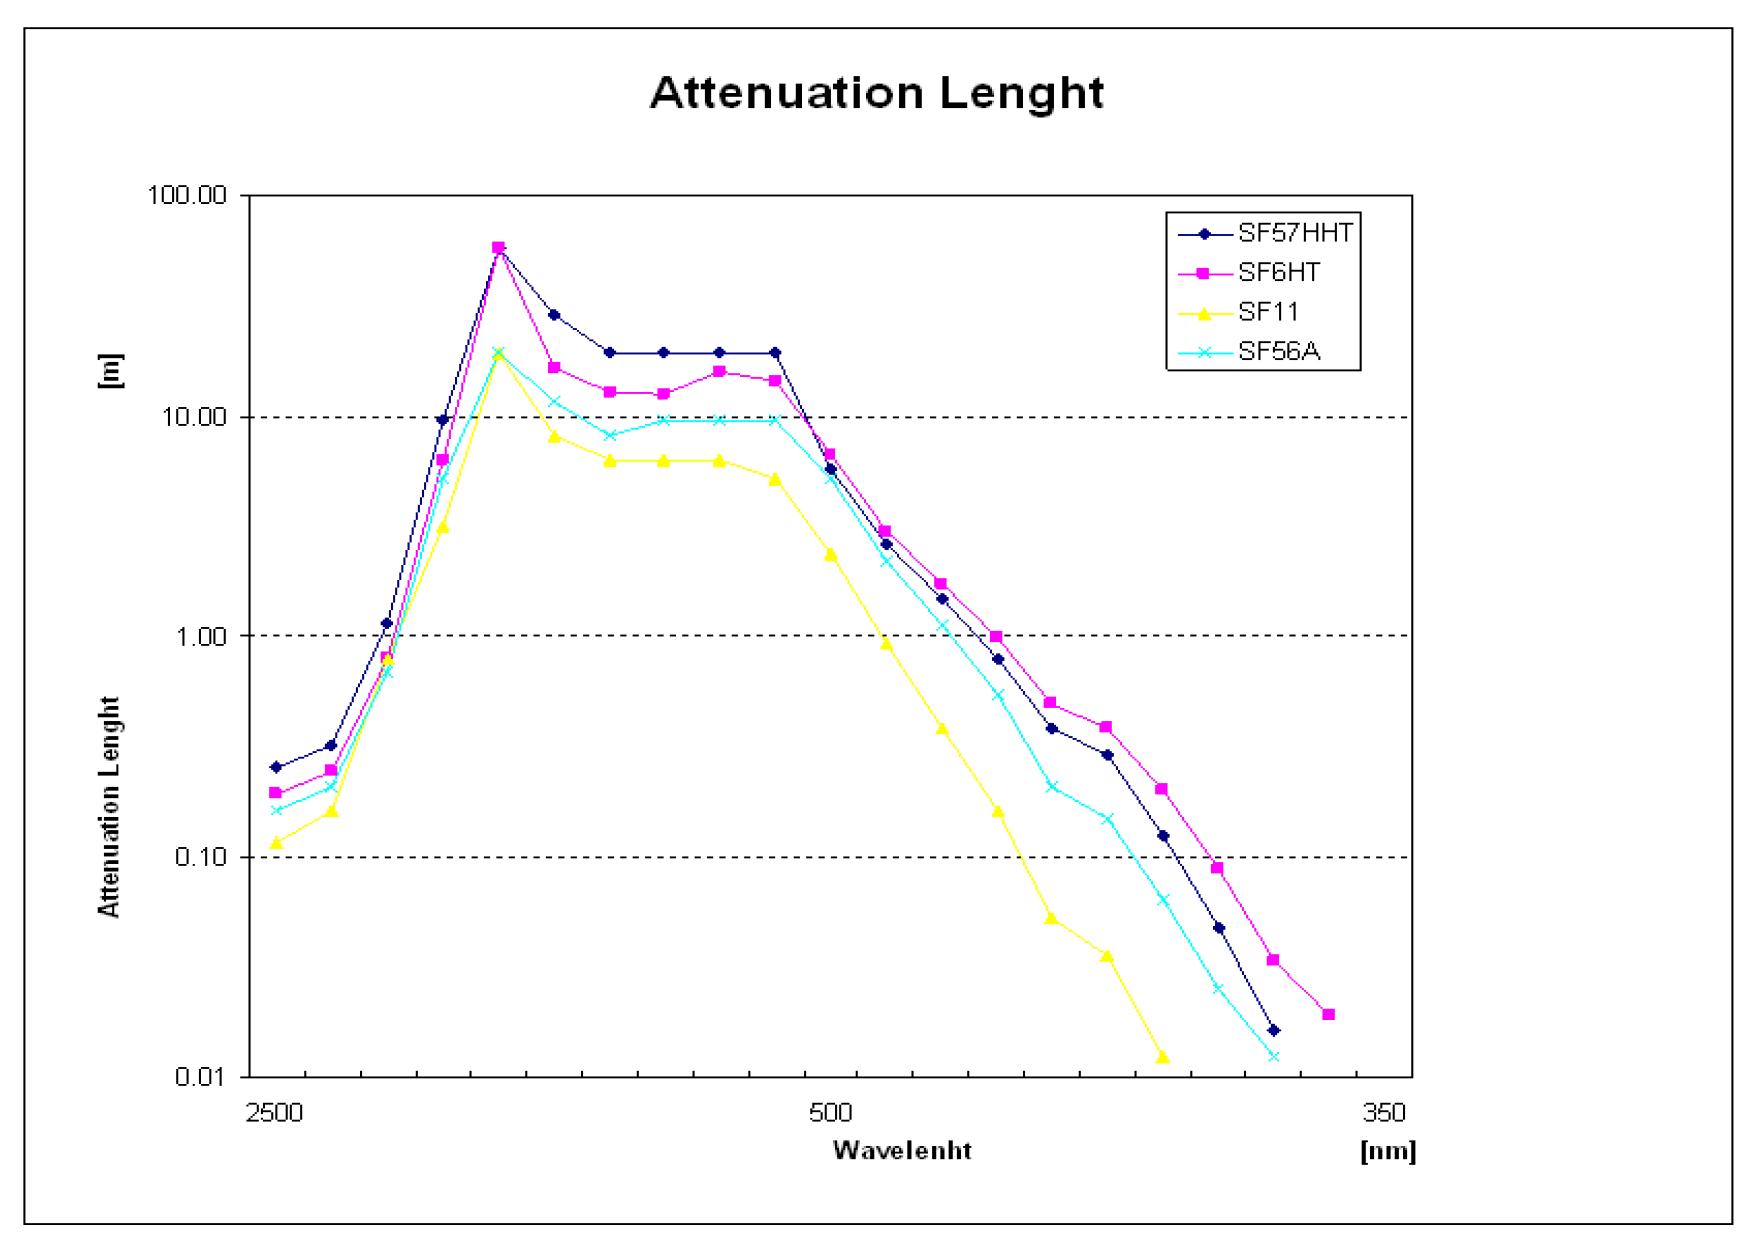
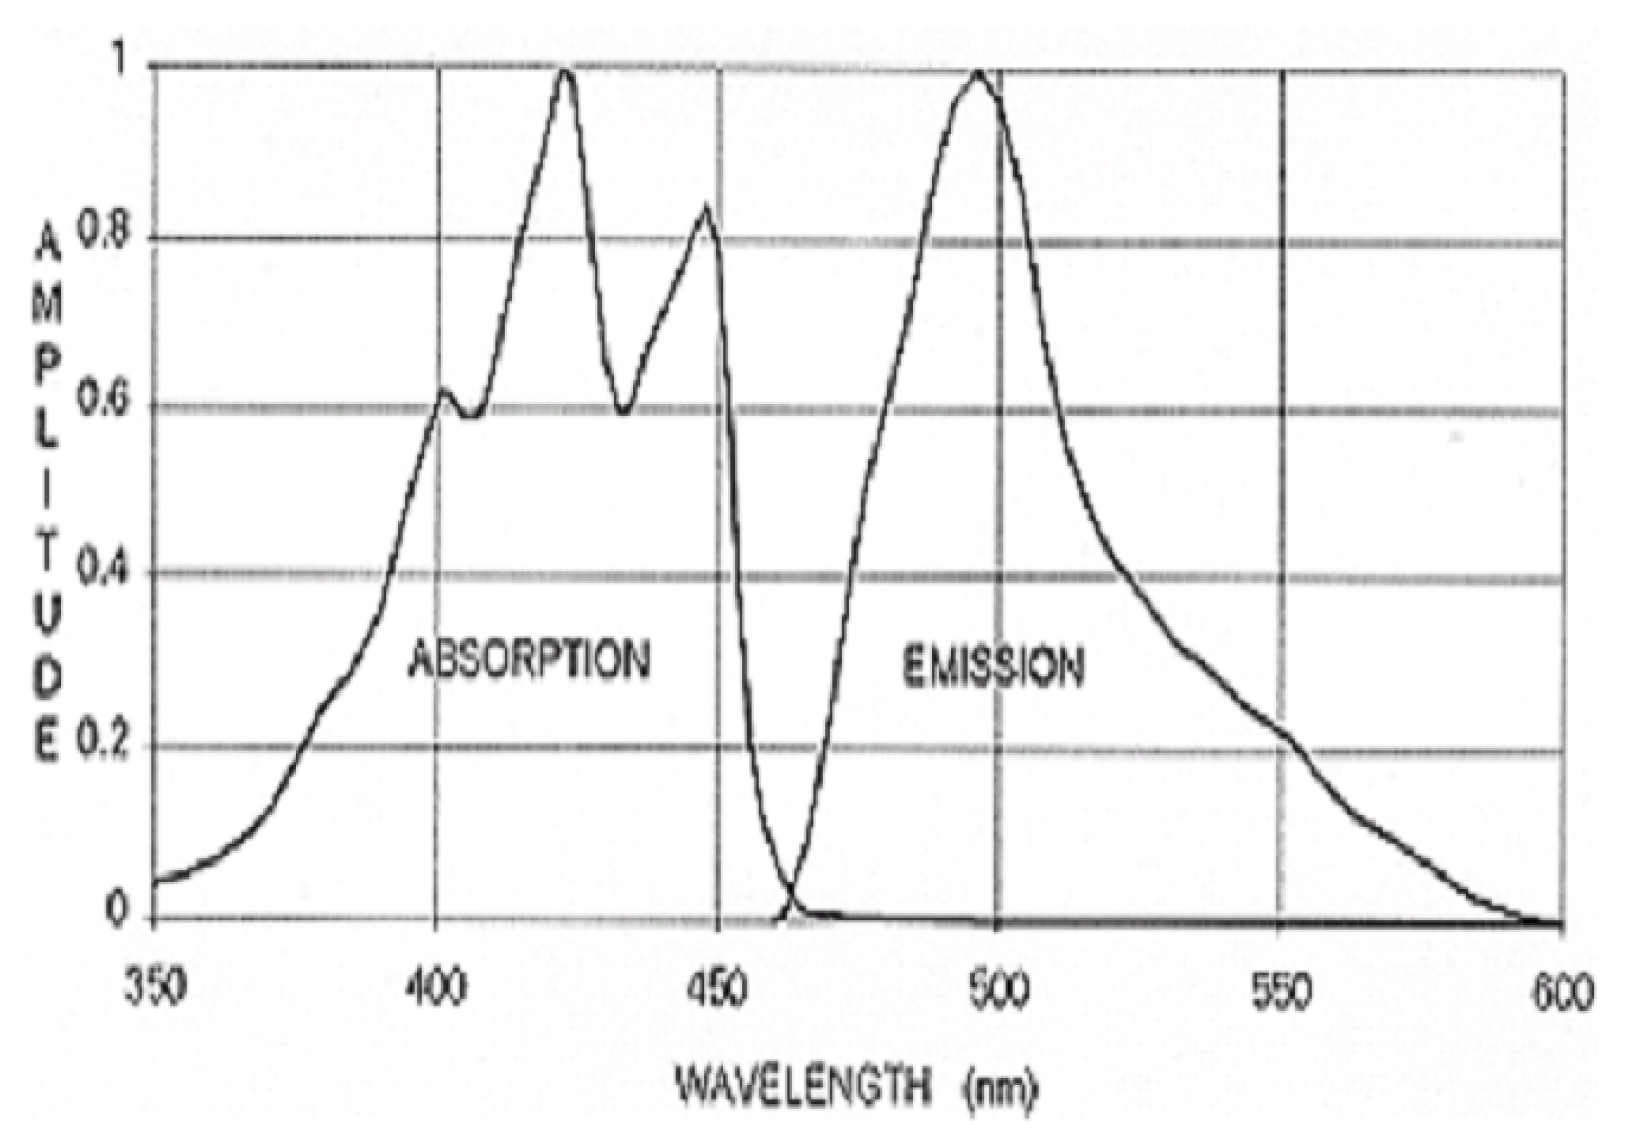
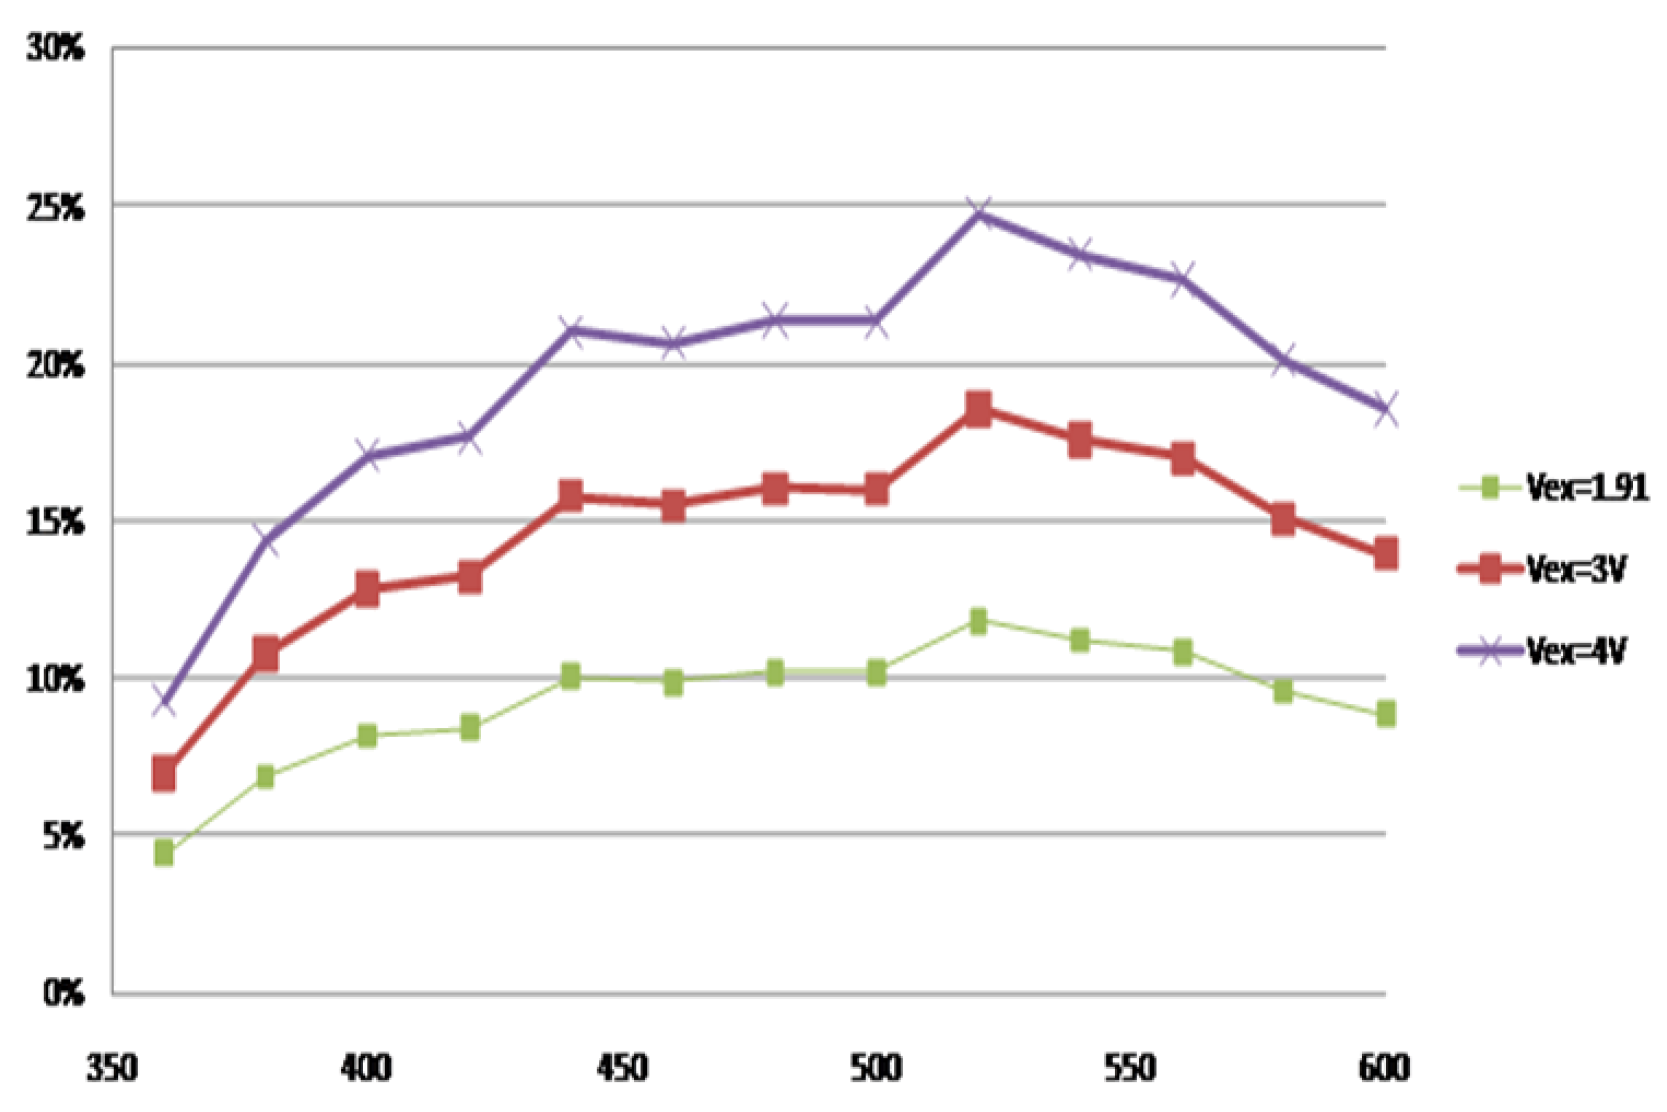
Figure 6 shows the refractive index curve of SF57HHT and those of several similar lead glasses we have considered for the A D R I A N O project. For wavelengths corresponding to the absorption curve of most commercially available WLS fibers, the refractive index ranges in the [1.85,1.91] interval. Therefore, the Čerenkovthreshold occurs at β = 0.53 , 23% below the Čerenkovthreshold of typical quartz fibers used in sampling dual-readout calorimeters, with a correspondingly larger photostatistics.With a GEANT4 simulation, we estimated that the number of Čerenkovphotons with a wavelength in the [ 360 n m 600 n m ] interval being generated by a 40 GeV charged pion showering inside SF57HHT is of the order of 10 6 . However, because of the short attenuation length of the glass (shown in Figure 7), most of those photons are re-absorbed before reaching the photodetector if the latter, as in traditional lead glass calorimeters, is located at one end of each glass block. In order to minimize this problem, the Čerenkovlight of A D R I A N O is collected with a system of wavelength shifting (WLS) fibers embedded in the glass and optically coupled to it. Studies reported here are based on a light collection with four Bicron BCF92 fibers having 2.2 mm diameter, running along the longitudinal axis of each cell (cfr. Figure 8).
It is worth noting that the optical coupling between the WLS fibers and the absorber further suppresses the Čerenkovlight produced by the slower hadrons. This filtering mechanism is based on Snell’s law and on the fact that slower hadrons emit Čerenkovphotons at a smaller angle than faster electrons. According to this law, the minimum angle, θ m i n , that the Čerenkovphoton must have with respect to the WLS fiber in order to penetrate the cladding of the latter, is defined by the following relation:
s i n ( θ m a x ) = ( n a b s 2 n c l 2 ) 1 / 2 n f i b .
where n a b s , n c l and n f i b are the refractive indexes of, respectively, the lead glass, the cladding-glue systems and the core of the fiber. For the case of A D R I A N O and a typical single clad fiber, θ m i n ranges between 45.0° and 49.2° for a photon wavelength in the [ 360 n m 600 n m ] range. This will limit the acceptance of Čerenkov photons emitted by charged particles with β < 0.74 . The net effect is an increase of η C and, consequently, of θ C / S (cfr. Eq. 6) corresponding to an improvement of A D R I A N O compensation power (cfr. Section 2.3). The effect described above becomes more significant when double-clad fibers are employed.
The scintillating section. Several construction methodologies are being investigated to embed the scintillating fibers in the glass and will be discussed in a future article. The studies reported here assume that a matrix of 100 thin stainless-steel capillary tubes is embedded in the lead-glass. All tubes run parallel to one another along the module axis, arranged in a square transverse pattern with a spacing of 4 mm from center to center. A plastic scintillating fiber is inserted into each tube. The fibers are bundled together and read-out by a photodetector from both sides. The pitch between nearby fibers is sufficiently narrow compared to the detector’s nuclear hadronic interaction length, so the shower sampling fluctuations are kept small. The CoG of the shower can be determined with light division methods applied to the front and rear scintillating signals. These methods, successfully adopted in existing experiments [30,31], allow for the correction of eventual shower leakage on an event-by-event basis. The performance of this method is discussed in Section 6
The scintillating-fiber-to-lead glass volume ratio for the proposed layout was approximately 0.05:1. This represents a reasonable compromise between good energy resolution of the detector (requiring as many fibers as possible) and easy of construction. The ratio R p d for the proposed layout is less than 8%, well within our goals, as discussed in Section 4. The hadronic interaction length of the cell, calculated with a GEANT4 simulation, is about 24cm. Therefore, a 180 c m long calorimeter would corresponds to about 7.5 λ I . Scintillating fibers and Čerenkovfibers of each cell are grouped in separate bunches and are readout by individual photodetectors. Therefore, a cell with a footprint of 40 × 40 m m 2 represents the smallest sensitive region regarding detector granularity.
A sketch of the base cell is shown in 6. The granularity of the calorimeter could be further improved by grouping the fibers in smaller bundles and increasing the number of photodetectors accordingly. Larger modules can be assembled by mounting several cells in a mechanical support structure.
As already noted, one key feature of A D R I A N O calorimeter is that it is integrally active, but, on the other hand, the scintillation and Čerenkov signal are produced in physically separated media, avoiding any contamination among them. The individual cells are not segmented longitudinally; therefore, the performance of the calorimeter is not degraded by inactive material residing between segments. Although the calorimeter is non-homogeneous, it has a uniform detector/absorber structure throughout the entire volume; hence, we expect no degradation in the energy resolution, most often observed when combining two different devices with different media.
The baseline layout and the choice of active materials, as described above, will be further justified in the remainder of this article. These decisions are not arbitrary, but the result of an ongoing and intense R&D program [32,33,34] by the T1015 Collaboration.
Detection of electromagnetic showers. In principle, the A D R I A N O calorimeter can detect electromagnetic particles in dual-readout mode (namely, by measuring scintillation and the Čerenkovand combining them into Eq. 4). However, as already observed for the passive dual-readout case, the energy resolution would be sub-optimal compared to a dedicated EM calorimeter.
On the other hand, because of the small volume ratio of scintillating fibers to lead glass, the EM showers develop primarily in the active absorber, where the lead glass offers excellent electron and photon energy resolution. A more effective way to detect EM showers is to operate the device as a traditional calorimeter, using only the information provided by the lead glass radiator. That would require an identification of the incoming particle to disentangle EM from hadronic showers. Therefore, we implemented in A D R I A N O such a technique based on two observables: a) the ratio between the total Čerenkov and scintillating lights produced and b) the amount of Čerenkov light generated in the foremost 20 cm of lead glass. The latter is justified by the fact that, for A D R I A N O , X o / λ I 5 % , therefore an EM shower would deposit most of its energy in the front section of the apparatus (as opposite to the case of hadronic showers which extend much further longitudinally). In order to estimate such initial energy deposit, we added, along the cell, special WLS fibers (from here on referred to as Q 20 ), which are black painted for the entire length except for the foremost 20 cm, to obtain information on the fraction of the shower developing near the entrance of the calorimeter. This technique, already considered in the previous experiments [35], will be thoroughly discussed in Section 7.5.

5. Monte Carlo Simulation of an A D R I A N O Calorimeter

Monte Carlo simulations of a hadronic shower propagating through a detector are traditionally regarded as complex, with results often influenced by the underlying software and user-defined parameters. The following section details the simulation framework employed for the subsequent studies, along with the specific parameters used.

5.1. Monte Carlo Simulation Tools

The simulations of A D R I A N O were conducted using the ILCroot software framework[38] . ILCroot is interfaced with several Monte Carlo frameworks using the Virtual Monte Carlo package (VMC)[41]. Among the currently supported frameworks, we selected GEANT4 [40] due to its large developer community and versatility. The GEANT4 simulation framework offers various interaction models, known as p h y s i c s l i s t s , to simulate particle interactions with matter. The choice of model depends on the particle type, energy range, and target material. Another significant advantage of ILCroot is its capability to rerun the same simulation using any Monte Carlo framework available through the VMC interface.
The studies presented in this article utilized two different physicslists : QGSP_BERT and QGSP_ BERT_HP [42] (the High Precision version). Both lists use the B e r t i n i i n t r a n u c l e a r cascade model for hadron-nucleus interactions. The High Precision version, which is more accurate but requires significantly more computing resources, was used for all neutron-related studies, while the standard version was used for most other studies.

5.2. Detector Geometry

The studies presented in this article focus on two A D R I A N O modules, which differ only in their total length. Both modules have a parallelepiped shape with a front face of 100 × 100 c m 2 and consist of 625 cells, each with a cross-section of 4 × 4 c m 2 . The lengths of the two modules are 180 and 400 c m , respectively. The studies on the longer module aim to utilize the multiple-readout technique without the influence of detector size-related effects. In contrast, the shorter module’s performance is impacted by punch-through and leakage effects, making it representative of a more realistic detector. The longer module, being essentially free of leakage at all the energies considered here, is used to estimate the intrinsic limits of the A D R I A N O technology. The simulation also includes the capillaries housing the scintillation fibers. We have studied several configurations of the A D R I A N O module, differing for the pitch and diameter of the scintillating fibers and the thickness and the material of the capillaries. The nomenclature adopted to distinguish the configurations considered is summarized in Table 1.
The values of the photon capture efficiencies used in the simulation for fibers of different diameters and pitch are related by the following scaling relation:
P 1 1 P 2 1 P 2 P 1 = w 1 d 1 d 2 w 2 ,
where w i and d i are the pitch and diameter of the fibers in the i-th layout, while P i is the corresponding capture probability. (3)

5.3. Simulation of Detector Response

Čerenkov section. To appropriately reproduce the optical response of the Čerenkovradiator, we implemented several custom simulation routines in ILCroot. Shower particles are tracked throughout the absorber by the underlying Monte Carlo framework, considering all physics processes until the particle loses its identity or is absorbed. The generation of Čerenkovphotons is treated according to the classical Čerenkoveffect theory[43]. The spectral distribution of emitted photons is given by:
d 2 N / d L d λ = 2 α π z 2 s i n 2 θ c h λ 2 ,
where α is the fine structure constant, θ c h is the Čerenkovcone opening angle, λ is the photon wavelength and L is the path length of the particle with charge z traversing the medium. This process depends on the refractive index of the medium, expressed as a function of s i n 2 θ c h , which is obtained from the Sellmeier series equation:
n 2 ( λ ) = 1 + B 1 λ 2 λ 2 C 1 + B 2 λ 2 λ 2 C 2 + B 3 λ 2 λ 2 C 3 ,
All glass-specific parameters in the Sellmeier equation are provided by the manufacturer. The photon propagation through the medium assumes no anisotropy in the refractive index. The self-absorption mechanism of the light is accounted for by a wavelength-dependent lookup table, also provided by the glass manufacturer. The refractive index and absorption length of the glass used for A D R I A N O are shown in Figure 6 and Figure 7, respectively along with several other lead glasses that we have considered for this study. For wavelengths corresponding to non-zero values of the WLS fibers absorption curve (cfr. Figure 9), the refractive index ranges in the [ 1.85 1.90 ] interval.
The propagation of the Čerenkov light through the absorber was simulated using a simplified ray-tracing algorithm, assuming a 93% efficiency for internal reflection at the cell boundaries. The algorithm includes the probabilistic effect that a Čerenkovphoton, with a specific wavelength, position, and direction, crosses the glue-cladding boundary and is trapped and transported to both ends of the WLS fiber. The wavelength-dependent light attenuation length of the fibers is parameterized through a lookup table. For angles smaller than θ m i n defined in Eq. 7 total internal reflection occurs at the fiber surface, preventing photon capture.
The simulations also account for the Photon Detection Efficiency (PDE) of the photodetector and its coupling to the WLS fibers. The PDE of a commercial device [44] used in this study is shown in Figure 10. To limit computing time and storage, all studies are restricted to a wavelength interval between 300 and 600 nm. All calculations were performed in 5 nm wide bins. To address a few secondary instrumental effects that might have been neglected in our simulations, we normalized the overall photo-statistics obtained with the above algorithms using experimental data reported in Ref. [45], which were also replicated in ILCroot. Although this methodology has the potential to introduce systematic bias in the studies, the large photo-electron statistics involved ensure that the impact on the results is minimal.
Scintillating fibers. The scintillating fibers simulated in the studies presented in this article correspond to Kuraray SCSF82. These fibers were chosen due to their excellent response time and widespread use in the high-energy physics (HEP) community. The fast response time is crucial for separating the neutron-induced fraction of the scintillating light, as this is achieved by analyzing the time structure of the signal (see Section 7.2). The extensive use of SCSF82 fibers in the HEP community also facilitates the normalization of our simulations, given the large volume of available experimental data.
The photon detection efficiency of the photodetector [44] and its coupling to the SCSF82 fibers are included in the simulations. The algorithms used to simulate light production, propagation in the fibers, and absorption by the photodetector are based on publicly available libraries. Additionally, Birk’s saturation effect was accounted for in the materials used. To ensure accuracy, we normalized the total scintillating light yield to the experimental results published by the DREAM collaboration by replicating their setup and experimental conditions in ILCroot.
Other systematic effects. In addition to the mechanisms related to the generation, collection, and readout of the photoelectrons, other effects could potentially degrade the detector’s performance. Most of these are related to the digitization of the signals. The following effects were included in our studies:
  • Excess Noise Factor (ENF): An ENF of F=1.106 was considered in the simulation of the photodetector. Due to the statistical nature of the multiplication process in a SiPM, a non-negligible ENF induces additional fluctuations in the measured signal, contributing to the stochastic term of the energy resolution function. Although this contribution is very small in ADRIANO due to the large number of primary photoelectrons (estimated to be less than 1% at 40 GeV), the ENF could be relevant in the light division mechanism used for correcting shower leakage (see Section 7.3).
  • Non-Uniformity of Scintillating Fiber Response: A non-uniformity of 0.6% was considered for the scintillating fiber response. This parameter value includes contributions from the intrinsic non-uniformity in the production of scintillation light and the non-uniformity in the self-attenuation of the fibers. This figure is derived from measurements performed by the CHORUS Collaboration with a calorimeter prototype employing identical fibers and a layout similar to A D R I A N O [5].
  • Signal Threshold: A signal threshold of 3 photoelectrons was applied to the simulated electronics response to keep the dark counting rate below 50 kHz.
  • Finite Bin Size of ADC: The effect of the finite bin size of a 14-bit ADC was considered when digitizing the front-end electronics (FEE) signals. This effect corresponds to an uncertainty of about 3 photoelectrons, independent of the measured energy. A non-negligible contribution to the constant term of the energy resolution function is expected from this effect.

6. Application of the Dual-Readout Principles to A D R I A N O Detector

In this section, we apply the principles of dual-readout presented in Section 2 to A D R I A N O and compare the detector response for several detector layouts. The discussion includes the procedures used to calibrate the scintillation and Čerenkovcomponents and to extract the corrected energy. We also compare the plots obtained for A D R I A N O with those obtained for a sampling dual-readout calorimeter of identical dimensions, where the active regions correspond to a 2-mm pitch matrix of alternating scintillating and quartz fibers. At the same time, the passive absorber is made of brass. We assume that the light readout of the latter would be from one end of the fibers, while the opposite side is aluminized. The simulation algorithms for the two detectors are identical. In the rest of this article, we will refer to the dual-readout sampling model as DRS.
The development of a typical shower, induced by a 40 GeV pion in an A D R I A N O calorimeter, is shown in Figure 11. Figure 12 shows the distribution of, respectively, the longitudinal (left) and lateral (right) CoG of the scintillation light. The exponential decrease in Figure 12 (left) occurring after the shower maximum is fitted with a straight line. The slope of the latter corresponds to a nuclear interaction length of 36 cm. Analogously, from Figure 12 (right), we estimate that 95% of the CoG of the shower is contained in a cylinder with a radius of 12 cm.

6.1. Raw Detector Response

The raw (uncalibrated) A D R I A N O response of the scintillating component evaluated from an ILCroot simulation is shown in Figure 13 for, respectively, 40 GeV pions (left) and electrons (right) impinging onto the surface of the module with an angle θ 2 o .
The blue histogram corresponds to the hadronic component of the shower, while the red histogram corresponds to the EM component. The ratio of the two distributions provides a direct estimate of η S . The sum of the two components is shown on the right hand side of each plot (black curve).
Analogously, Figure 14 represents the electromagnetic and hadronic distributions for the Čerenkovcomponent collected via the WLS fibers coupled to the glass. In this case, the ratio between the blue and red histograms directly estimates η C .
We repeated the above study for the DRS module. The corresponding plots are shown in Figure 15 for the scintillating signal (left) and for the Čerenkov signal (right).
The differences between the integrally active and the sampling calorimeters are straightforward, especially for the Čerenkov component of the devices, resulting in a factor of 1.2 and 50, respectively in the ratio of the scintillating and Čerenkov light yield between the A D R I A N O and the sampling detectors. We explain the 20% difference in scintillation response between ADRIANO and the DRS because the former is read out from both ends. At the same time, the latter is read from one end only, with the other end of the fibers being aluminized. The longer path the photons need in the DRS to reach the photodetector is responsible for light losses due to the finite attenuation length of the scintillating fibers.
To quantify the effect on the light yield due to the ratio between the scintillation and the Čerenkov components of A D R I A N O we repeated the study above for several layouts where the diameter or the pitch between the fibers was varied.
The raw response for the various detector configurations is summarized in the Table 2. Table 1 summarizes the nomenclature of the various configurations. Results for a DRS module, published by the 4 t h C o n c e p t Collaboration, are included for reference.4.
The first six columns in Table 2 correspond to the average scintillation and Čerenkov photoelectrons expected from a 1 GeV pion. The contributions from the shower’s purely hadronic and EM components are shown separately, along with their sum. As noted above, their ratio is a direct measurement of η C and η S : the corresponding values of the latter are listed in the last two columns of Table 2. Analogously, the 7th and 8th columns refer to the average photoelectrons expected for a 1 GeV electron. It is worth noting that while the Čerenkov light yield is mostly constant across the various configurations, the scintillation yield varies considerably from one to another. This effect is reflected into similar variations of the parameter η S . It indicates, as expected, that different layouts of A D R I A N O have, indeed, different compensation power (cfr. Eq. 6 and the related discussion). The different response among the configurations is explained by observing that the Čerenkov section corresponds to the bulk of the detector volume. Therefore, the energy deposited therein is mostly unaffected by variations in the number of plastic fibers. On the other hand, the opposite is true for the scintillation section, where the sampling fluctuations become important and contribute non-negligibly to the detector’s energy resolution. Regarding the DRS module, the lower refractive index of the quartz fibers, as compared to lead-glass, is responsible for a considerably larger value of η C . Consequently, a DRS has intrinsically a higher compensation power than A D R I A N O . However, this comes at the cost of a much lower light yield, potentially degrading the dual-readout mechanism.

6.2. Detector Calibration

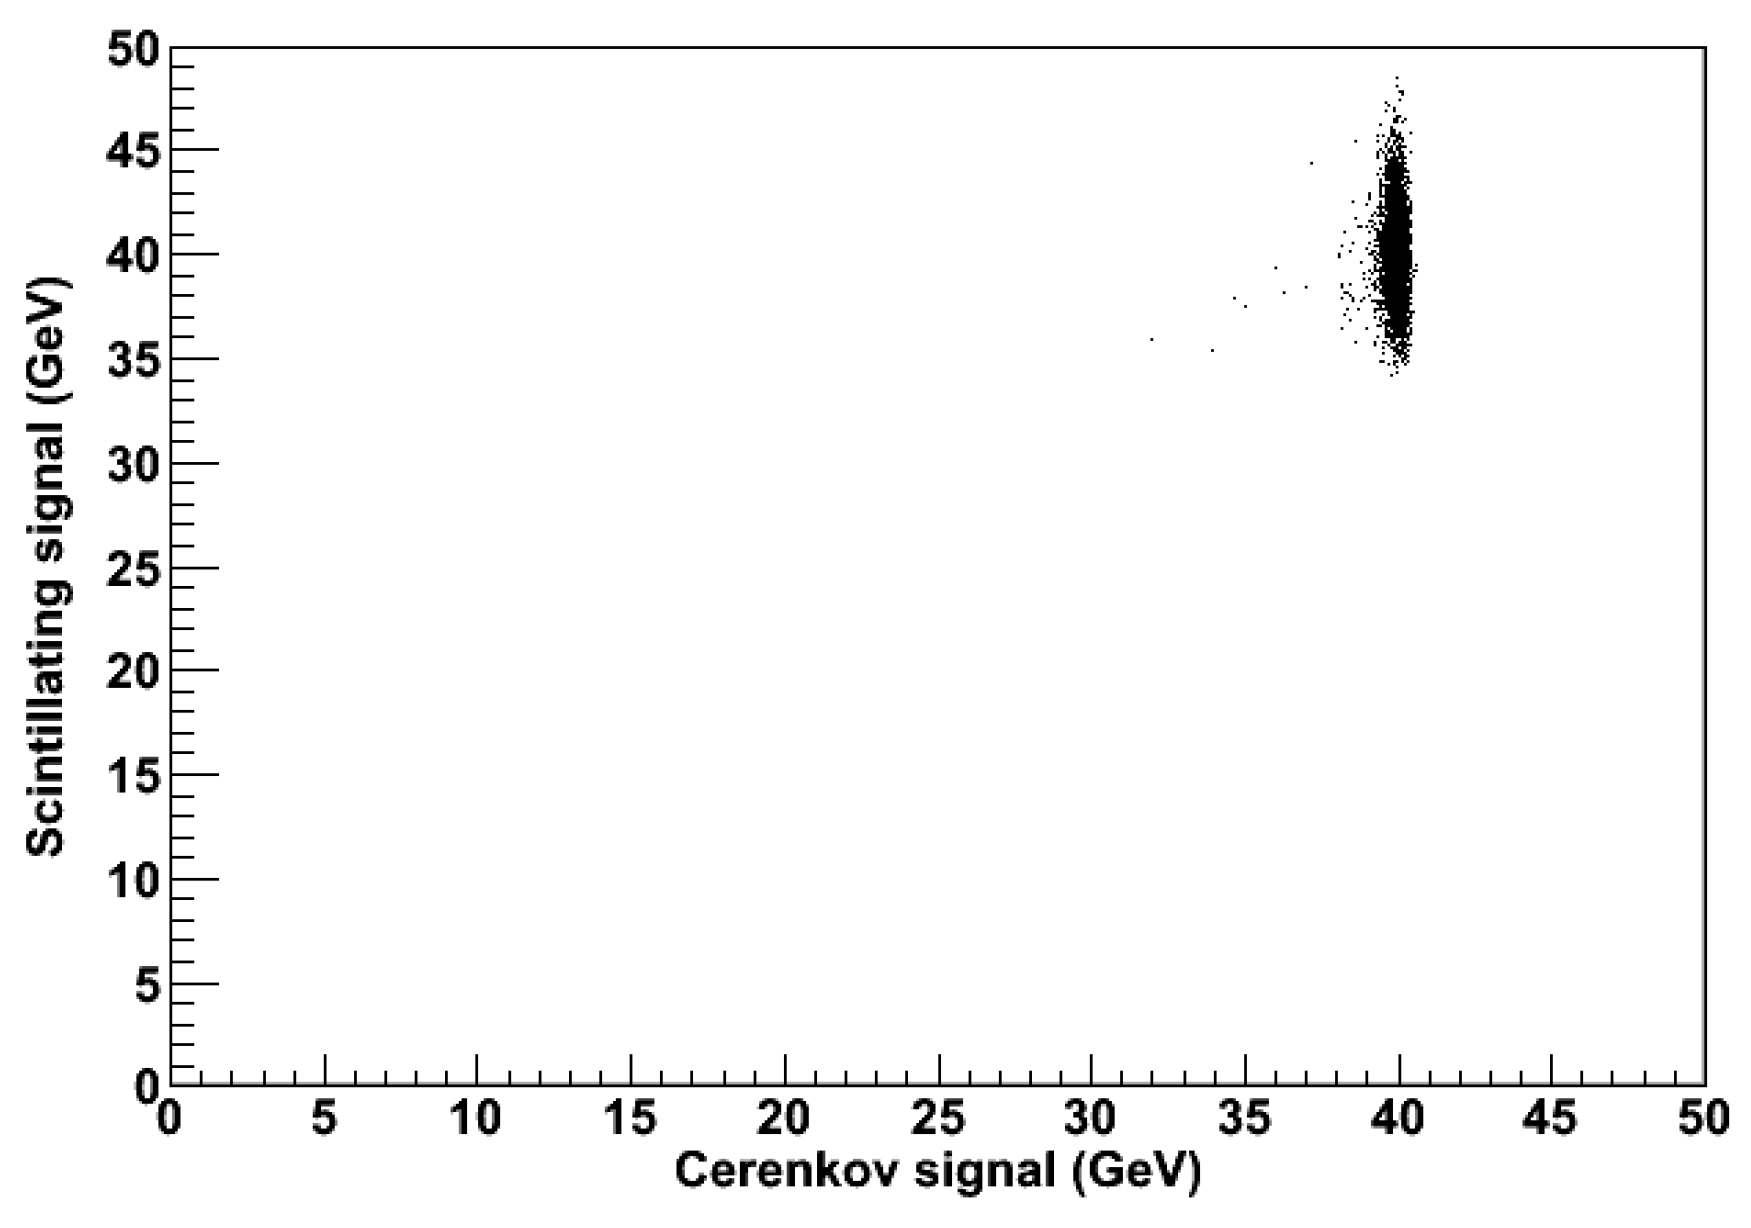
In order to determine the energy resolution of A D R I A N O , we need to implement a calibration procedure for the parameters η S and η C defined in Eqs. 1 and 2. That requires two separate steps, as expected, since we are, in practice, dealing with two independent detectors. In the first step, the photoelectrons are converted into an energy value by evaluating the S and C signals for electrons with known energy (40 GeV in this work). The shower produced in this case is purely E M in nature, with only E M fluctuations (i.e., f e m 1) as is shown in Figure 17, and the energy response of the two systems is consistent with such circumstances.
Therefore, for the first calibration step, we set:
S = C = 40 G e V
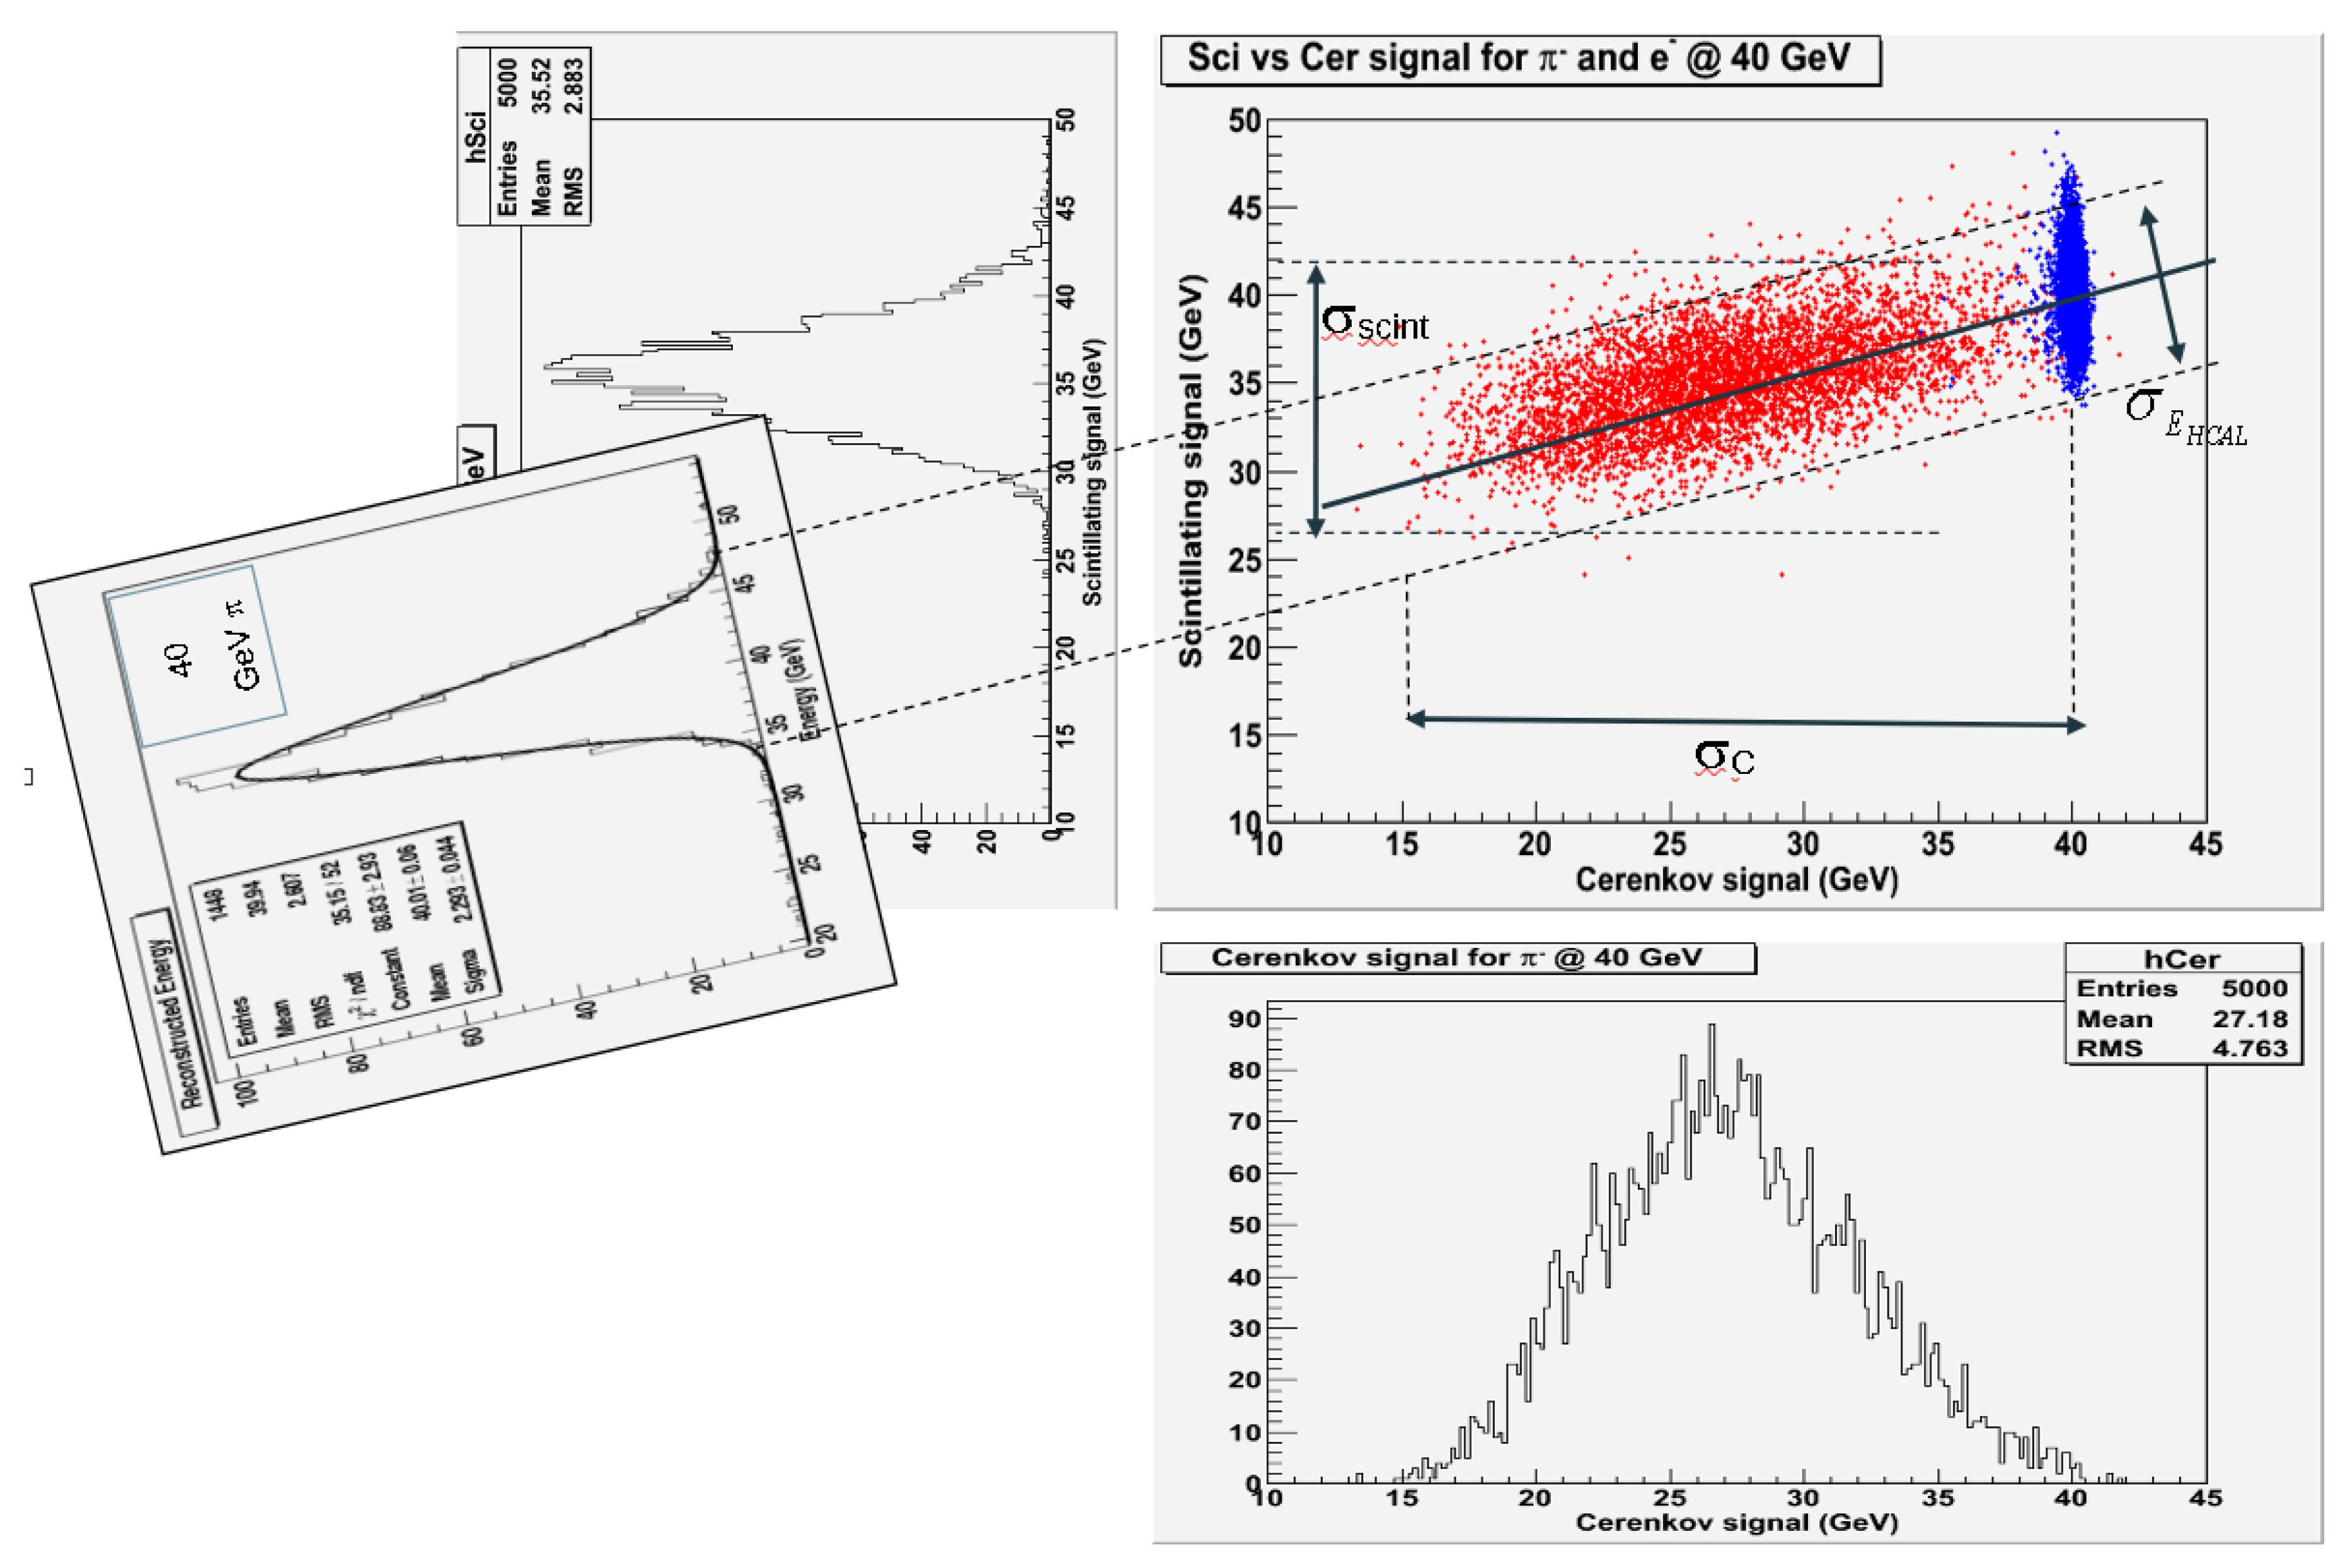
In the second calibration step, we consider the detector’s response to hadrons of known energy, shown in Figure 18 (left) for a 40 GeV pion impinging onto the center of A D R I A N O ’s front face (left). In this case, we have:
S t a n ( θ C / S ) C 1 t a n ( θ C / S ) = 40 G e V
For comparison, the analogous distribution for the DRS detector is plotted in Figure 18 (right). The line connecting the event loci of the two distributions have considerably different slopes, indicating that t a n ( θ C / S ) (or, alternatively, η C and η S ) are different, as expected, for the two detectors. From Eqs. 11, 12 and 6, we are, then, able to extract the two calibration constants: η S and η C .
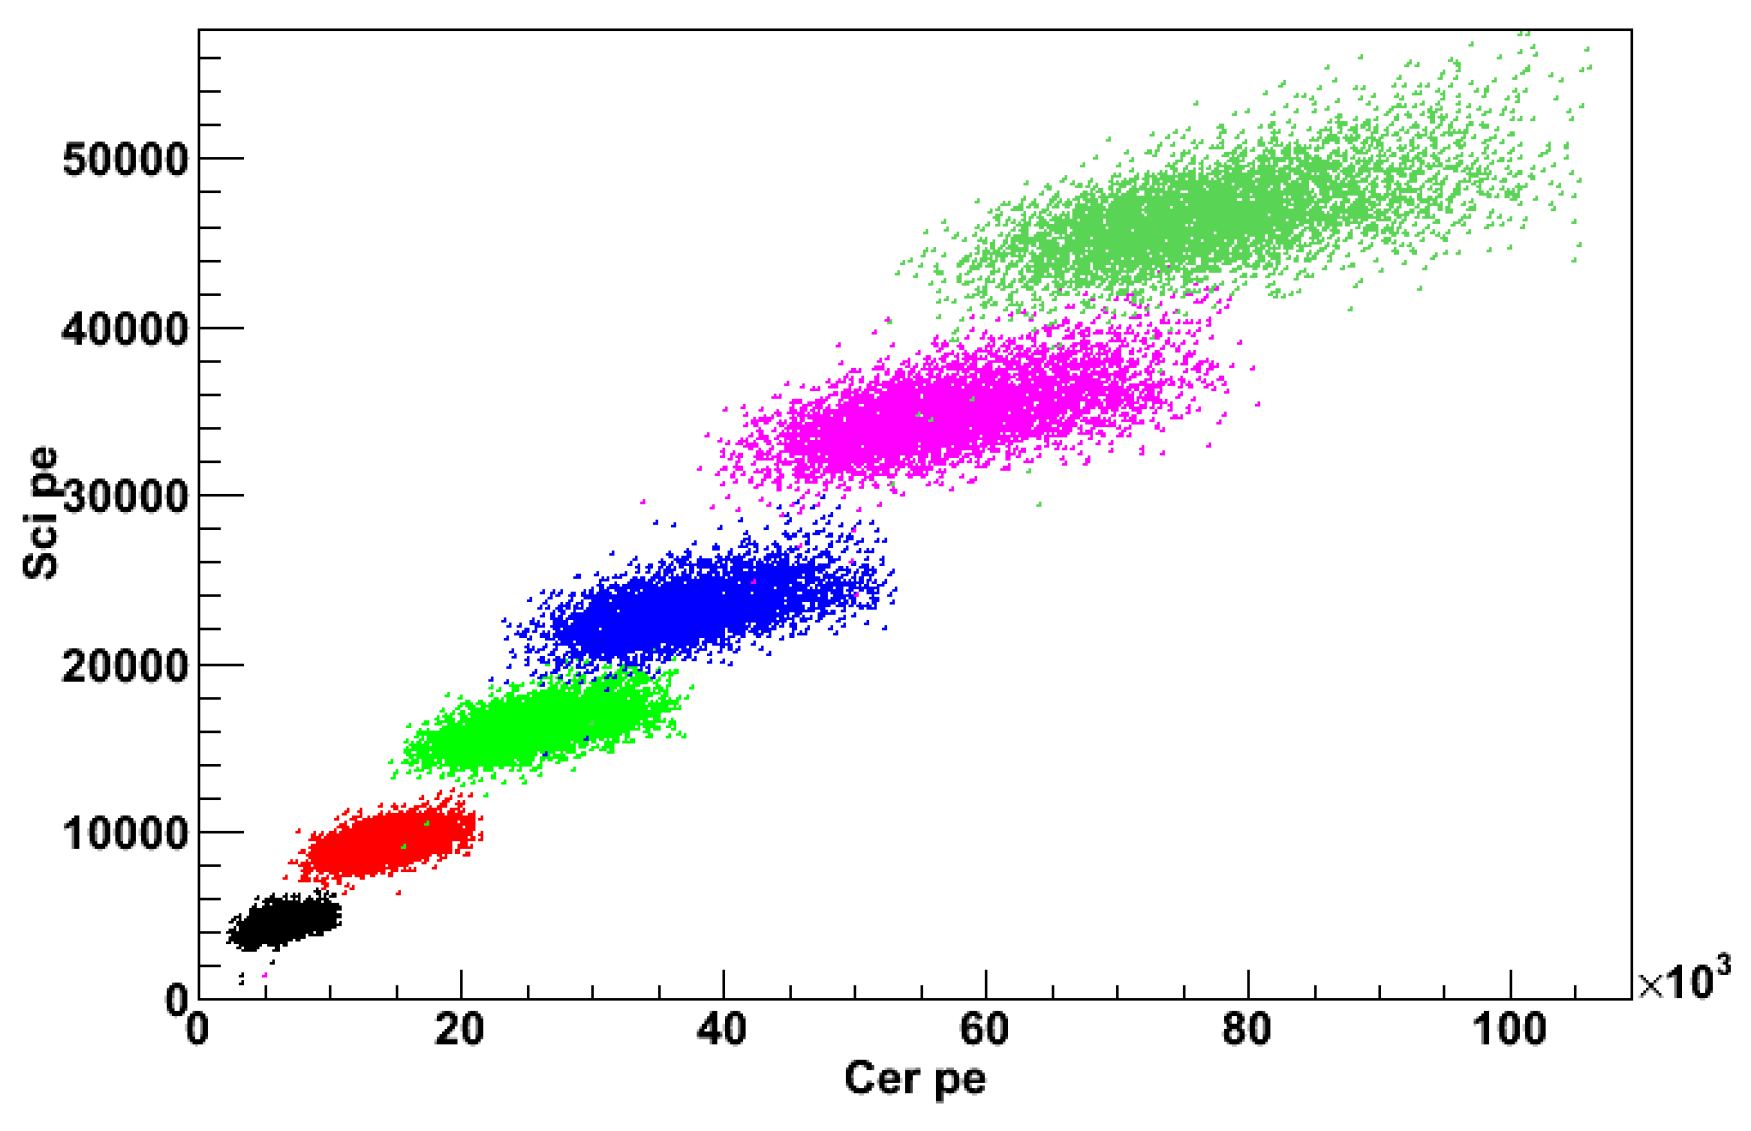
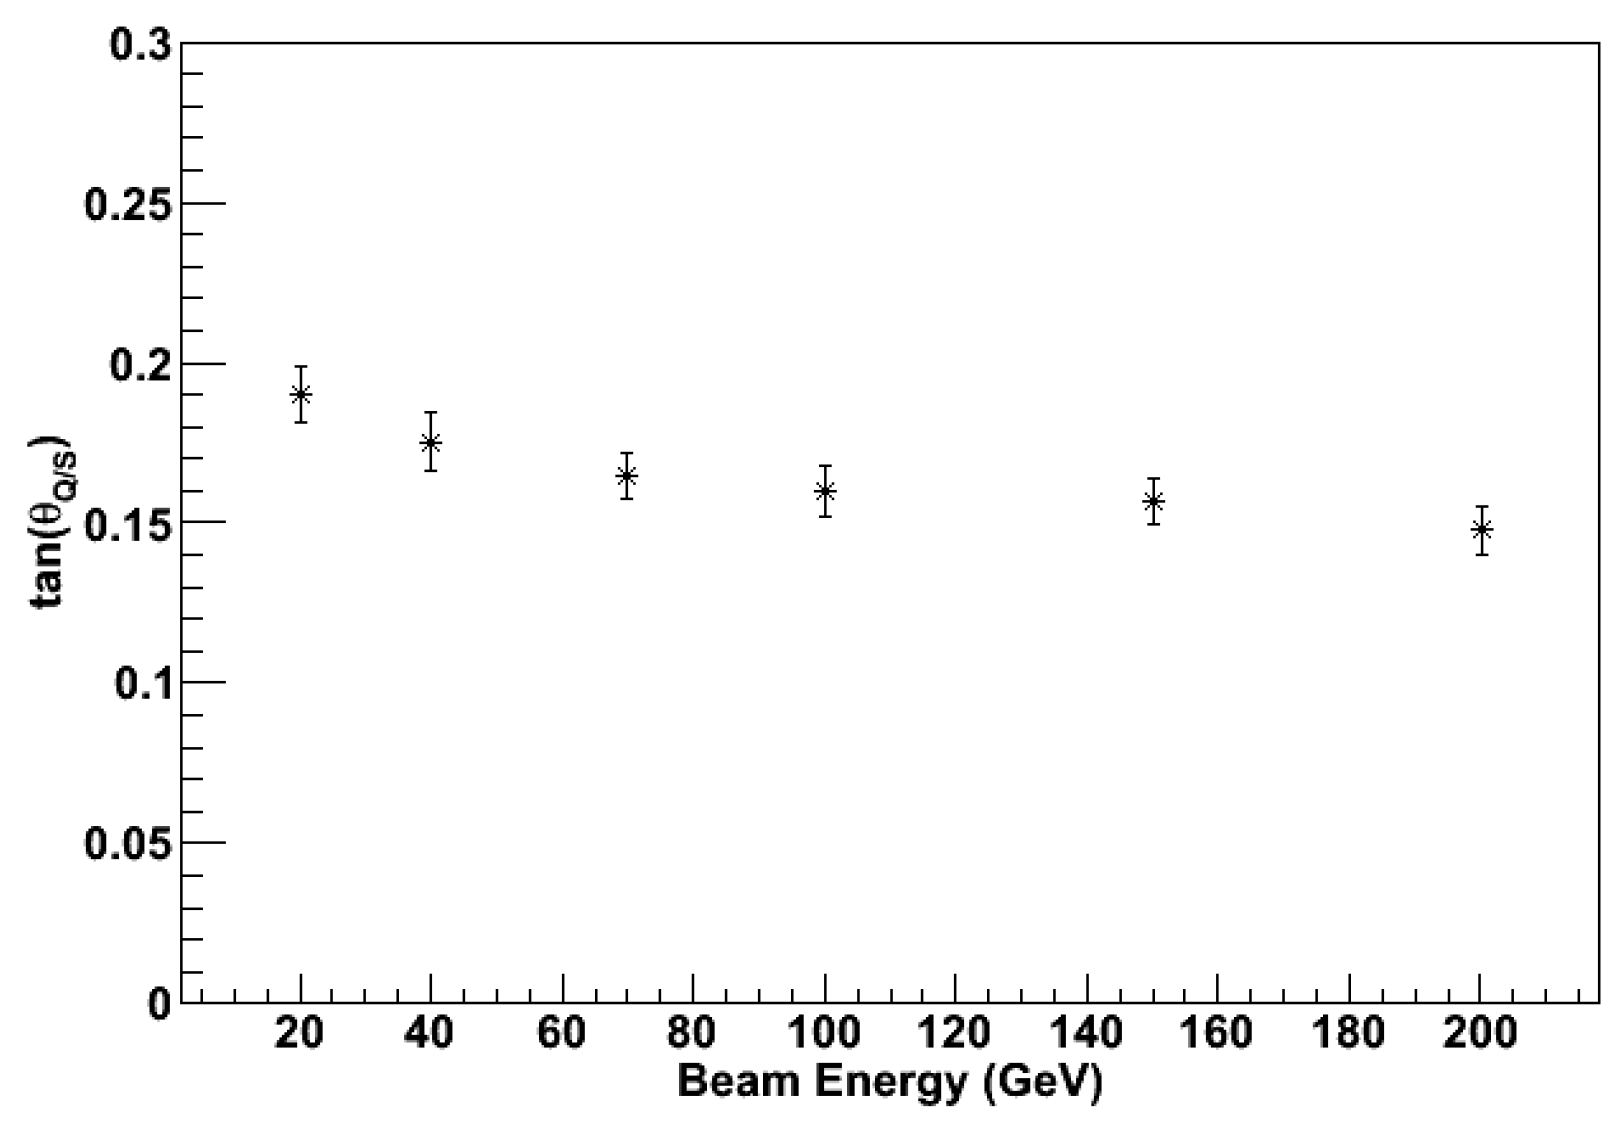
It is worth noting that the calibration method discussed above is applicable if and only if the parameters η S and η C are energy-independent. This is shown, in fact, in Figure 19, where S is plotted vs. C for different values of impinging particle energy and in Figure 20, where the corresponding values of t a n ( θ C / S ) are plotted. The behavior of t a n ( θ C / S ) is practically constant except at the lowest energies considered, where we observe a variation of t a n ( θ C / S ) of the order of 10%. A fit to the points in Figure 20 could eventually be used for a second-order correction, in cases where a more precise energy measurement is required.
For comparison, the t a n ( θ C / S ) value for a 40 GeV pion impinging onto the DRS detector is ∼30% larger than in ADRIANO.

6.3. Detector Calibration with Pion-Only Samples

There could be situations where a clean electron sample of adequate statistics is unavailable to the experimenter. In this case, we devised a calibration scheme based on an event sample, including pions with different (but otherwise known) energies. This technique would be helpful in those cases, as in a 4 π detector at a collider accelerator, where it is impossible or impractical to impinge a particle beam on the detector or when the statistics for electrons and pion of fixed energy are limited. An advantage of a calibration scheme that does not require electrons stems from the fact that, in most practical cases, the latter might have to go through other detectors before reaching the surface of the calorimeter to be calibrated, where they could initiate a shower and lose energy. Therefore, that control sample will no longer be monochromatic, suffering from long tails and lower-than-expected. On the other hand, larger samples of isolated pions whose momentum has been measured with sufficient accuracy from, for example, a tracking system are generally available with abundance and higher purity. In order to calibrate the detector with samples of pions of known energy, we rewrite Eq. 4 in the following form:
S ^ i E i = α β C ^ i E i .
where S ^ i and C ^ i are, respectively, the scintillating and Čerenkov responses of the uncalibrated calorimeter for showers induced by pions of energy E i and belonging to a control sample of population n. Assuming that t a n ( θ C / S ) is mainly independent of the shower energy (cfr. Section 6.2), α and β inherit the same property. Their values can be estimated from the set of n relations (13) with simple linear regression methods. More specifically:
β = 1 n ( C ^ i / E i ) ( S ^ i / E i ) 1 / n 1 n ( C ^ i / E i ) 1 n ( S ^ i / E i ) 1 n ( C ^ i / E i ) 2 1 / n ( 1 n C ^ i / E i ) 2
α = 1 / n 1 n ( S ^ i / E i ) β / n 1 n ( C ^ i / E i )
To compare the two calibration techniques discussed above, we can apply the set of Eqs. (13)-(15) to a control sample containing, for sake of simplicity, pions of only two energies, 40 GeV and 70 GeV.
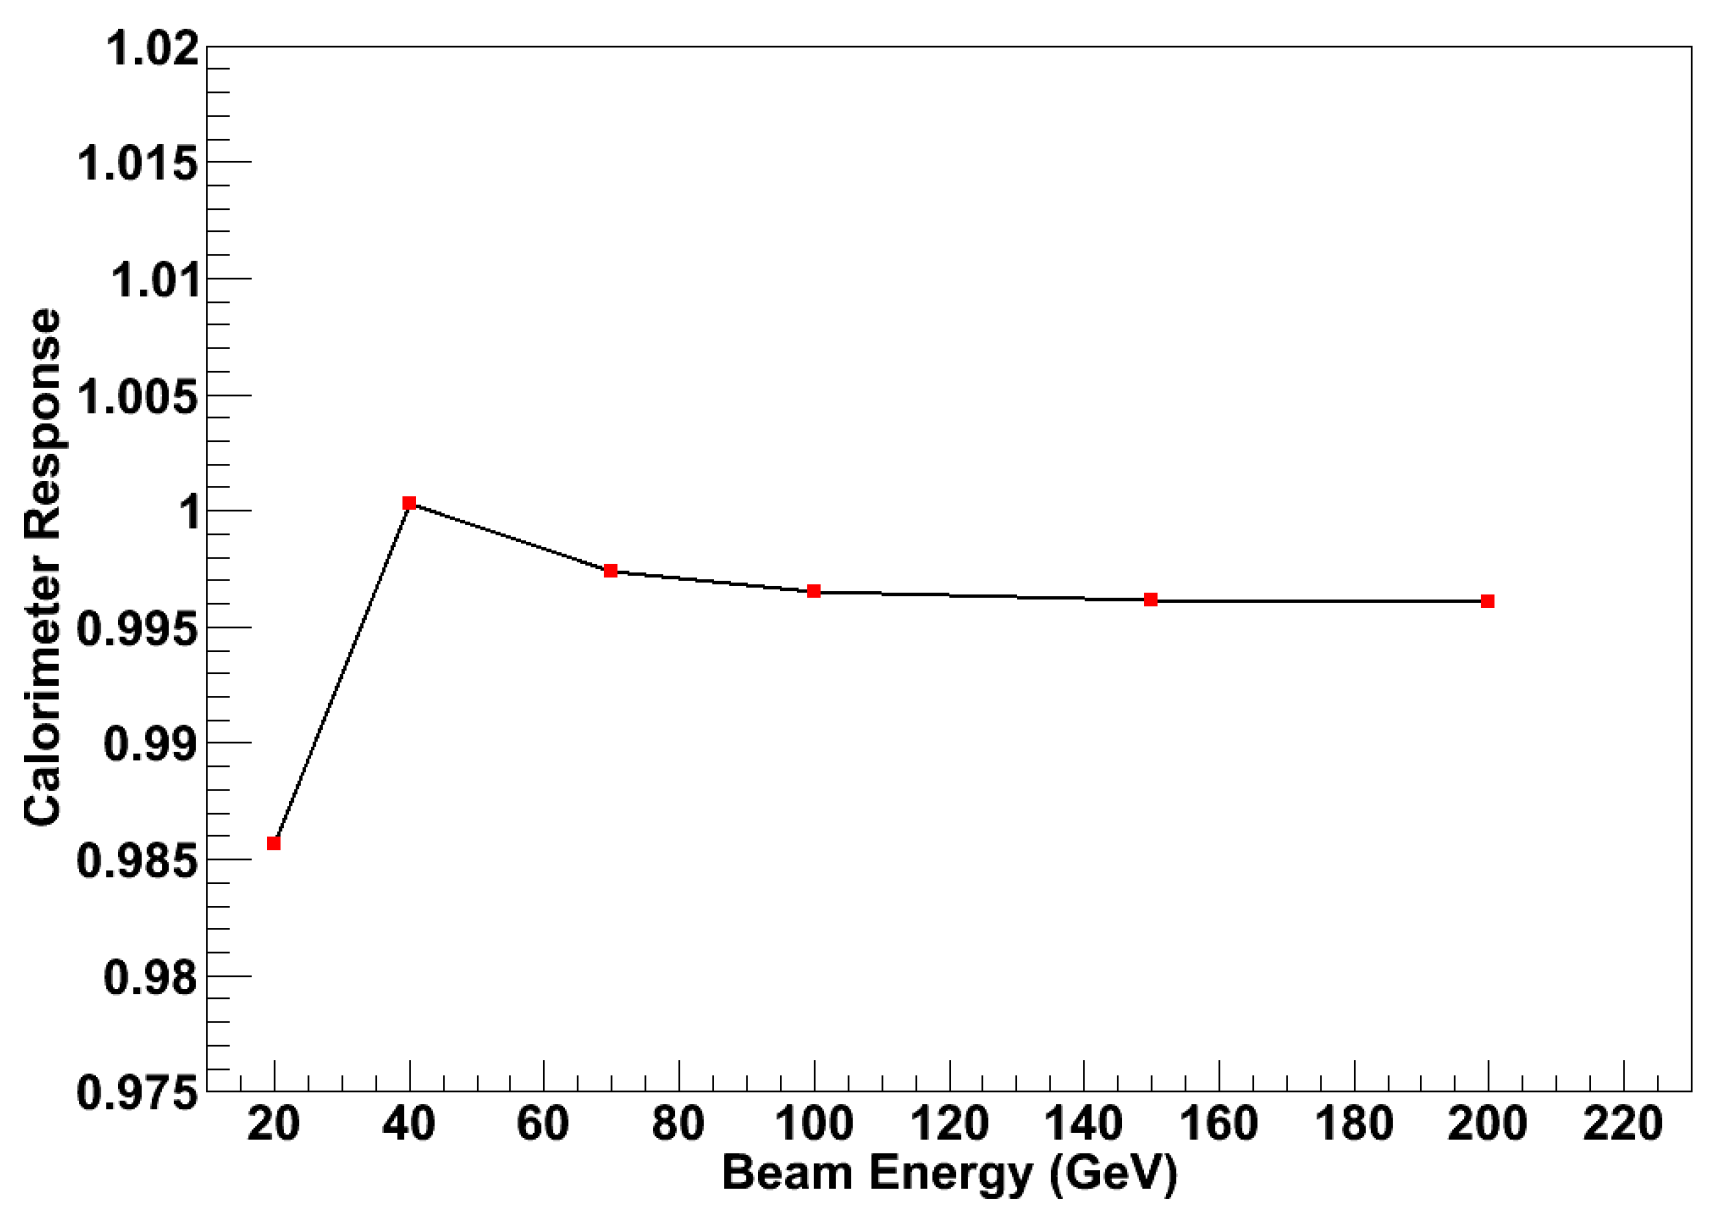
The distribution of the corrected energy E c o r r obtained with this method is indistinguishable (within statistical uncertainties) from that shown in Figure 21 indicating that the two calibration techniques are, in fact, equivalent. The deviation from linearity of the response is shown in Figure 25, confirming our speculation that α and β , to a large extent, do not depend on the shower energy.

6.4. Energy compensation with dual-readout

Once t a n ( θ C / S ) has been obtained for one particular energy, then E c o r r for any energy is obtained by applying Eq. 4. We note that Eq. 4 corresponds to a coordinate rotation by the angle θ C / S of the coordinate system ( C , S ) to the new axes ( C , S ) , where the C axis is parallel to the line connecting the two event loci. Therefore, the uncertainties on E c o r r , which are equal to the minor axis of the ellipse in Figure 18 , are smaller than the widths of the projections of the unrotated ellipse onto the C and S axis. The above effect is shown graphically in Figure 23.
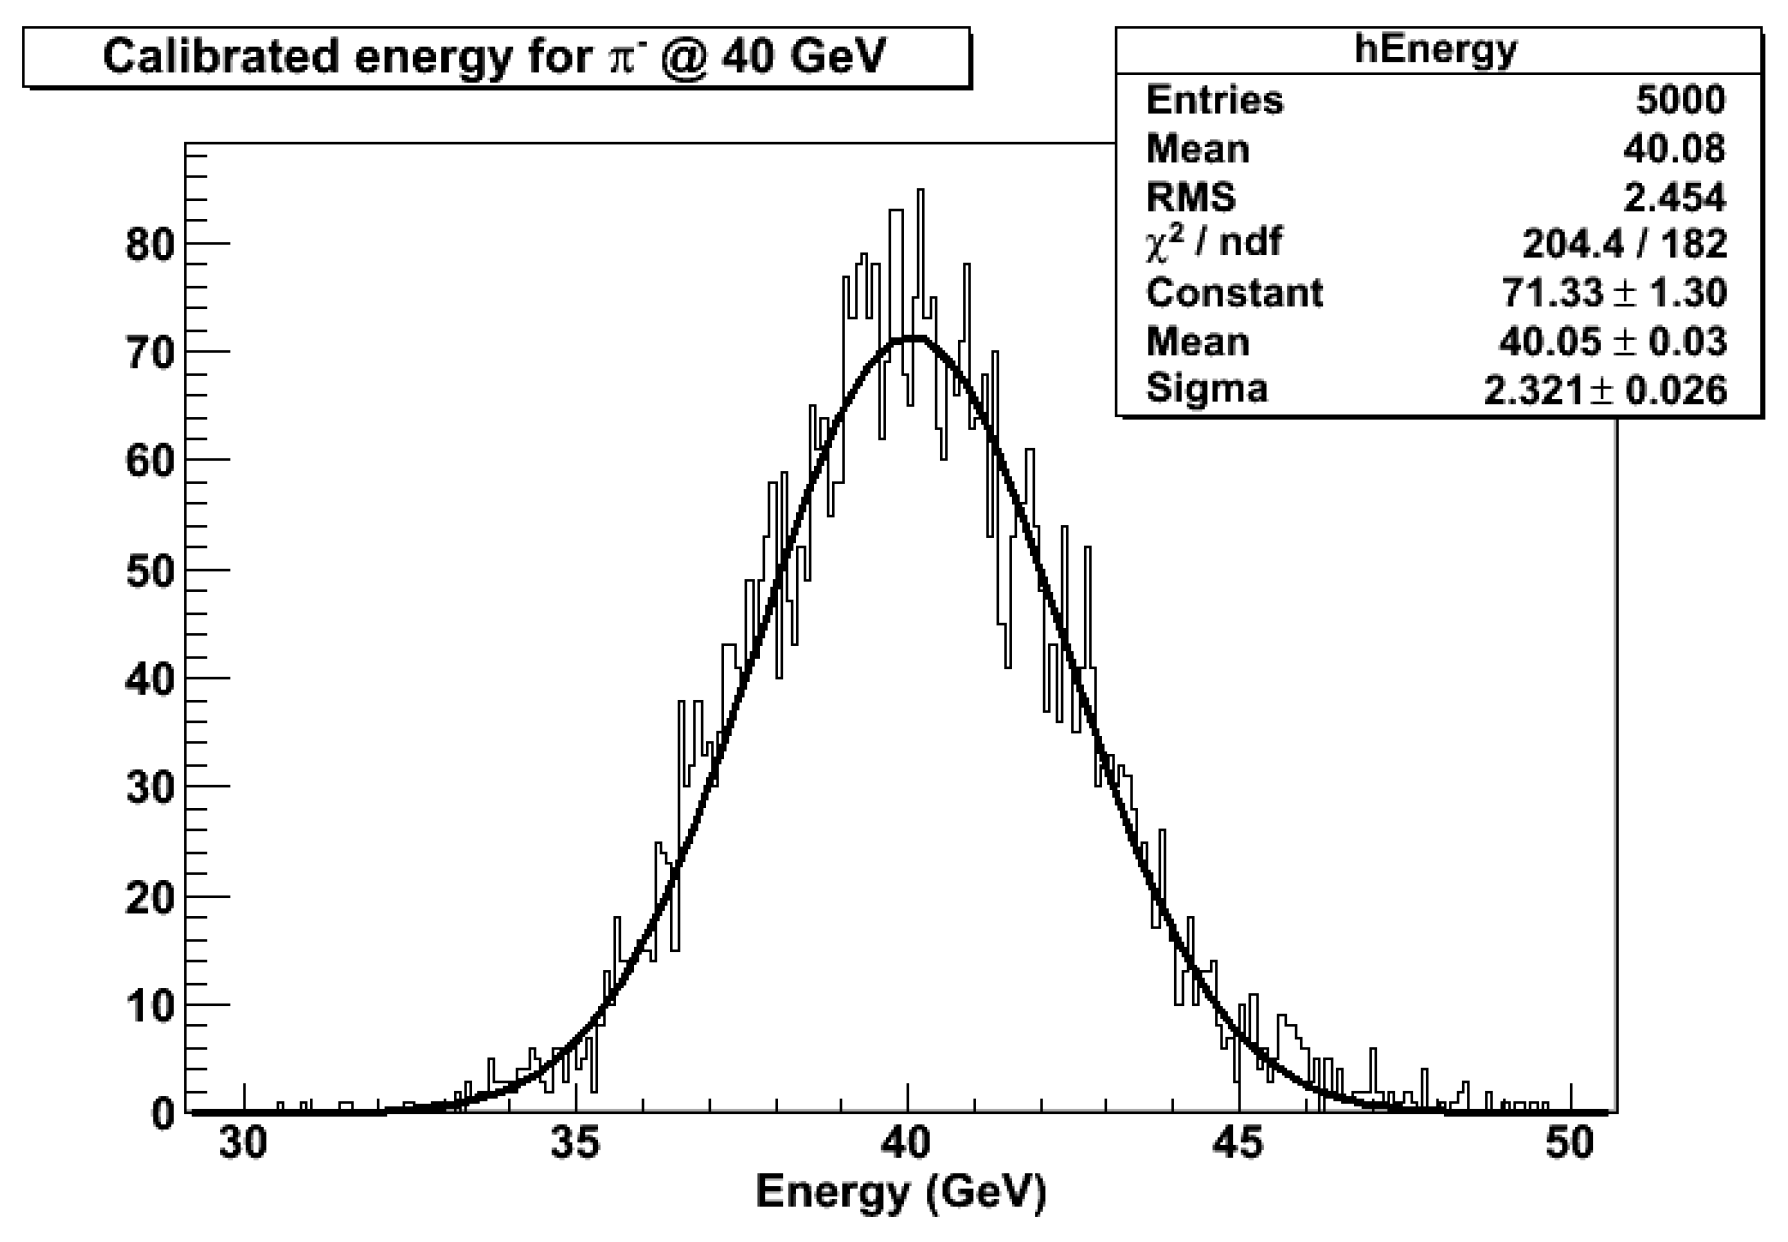
It has been noted by Groom[11] that the projection of the event distribution onto the S axis is of minimal width and, consequently, that E c o r r has a smaller uncertainty compared to the cases where either C or S are used separately. This effect is clearly apparent in Figs. Figure 21 and Figure 23, where we plot E c o r r (or, equivalently S ) for a 40 GeV negative pions impinging on A D R I A N O . A value of σ = 2.3 G e V is obtained from a Gaussian fit to the plot, corresponding to a net decrease of the stochastic term in the energy resolution of about 5%. The fit normalized χ 2 is close to unity. That indicates that the corrected energy is normally distributed, unlike a non-compensated calorimeter, where the energy resolution function is usually a curve skewed toward higher values.

7. Performance of A D R I A N O detector

This section presents the results of A D R I A N O performance studies for the eight layouts considered in Section 6. The studies are repeated two-fold: in the first case, we assume that A D R I A N O is operated in dual-readout mode, while, in the second, a triple-readout approach has been considered.

7.1. Performance in Dual-Readout Mode

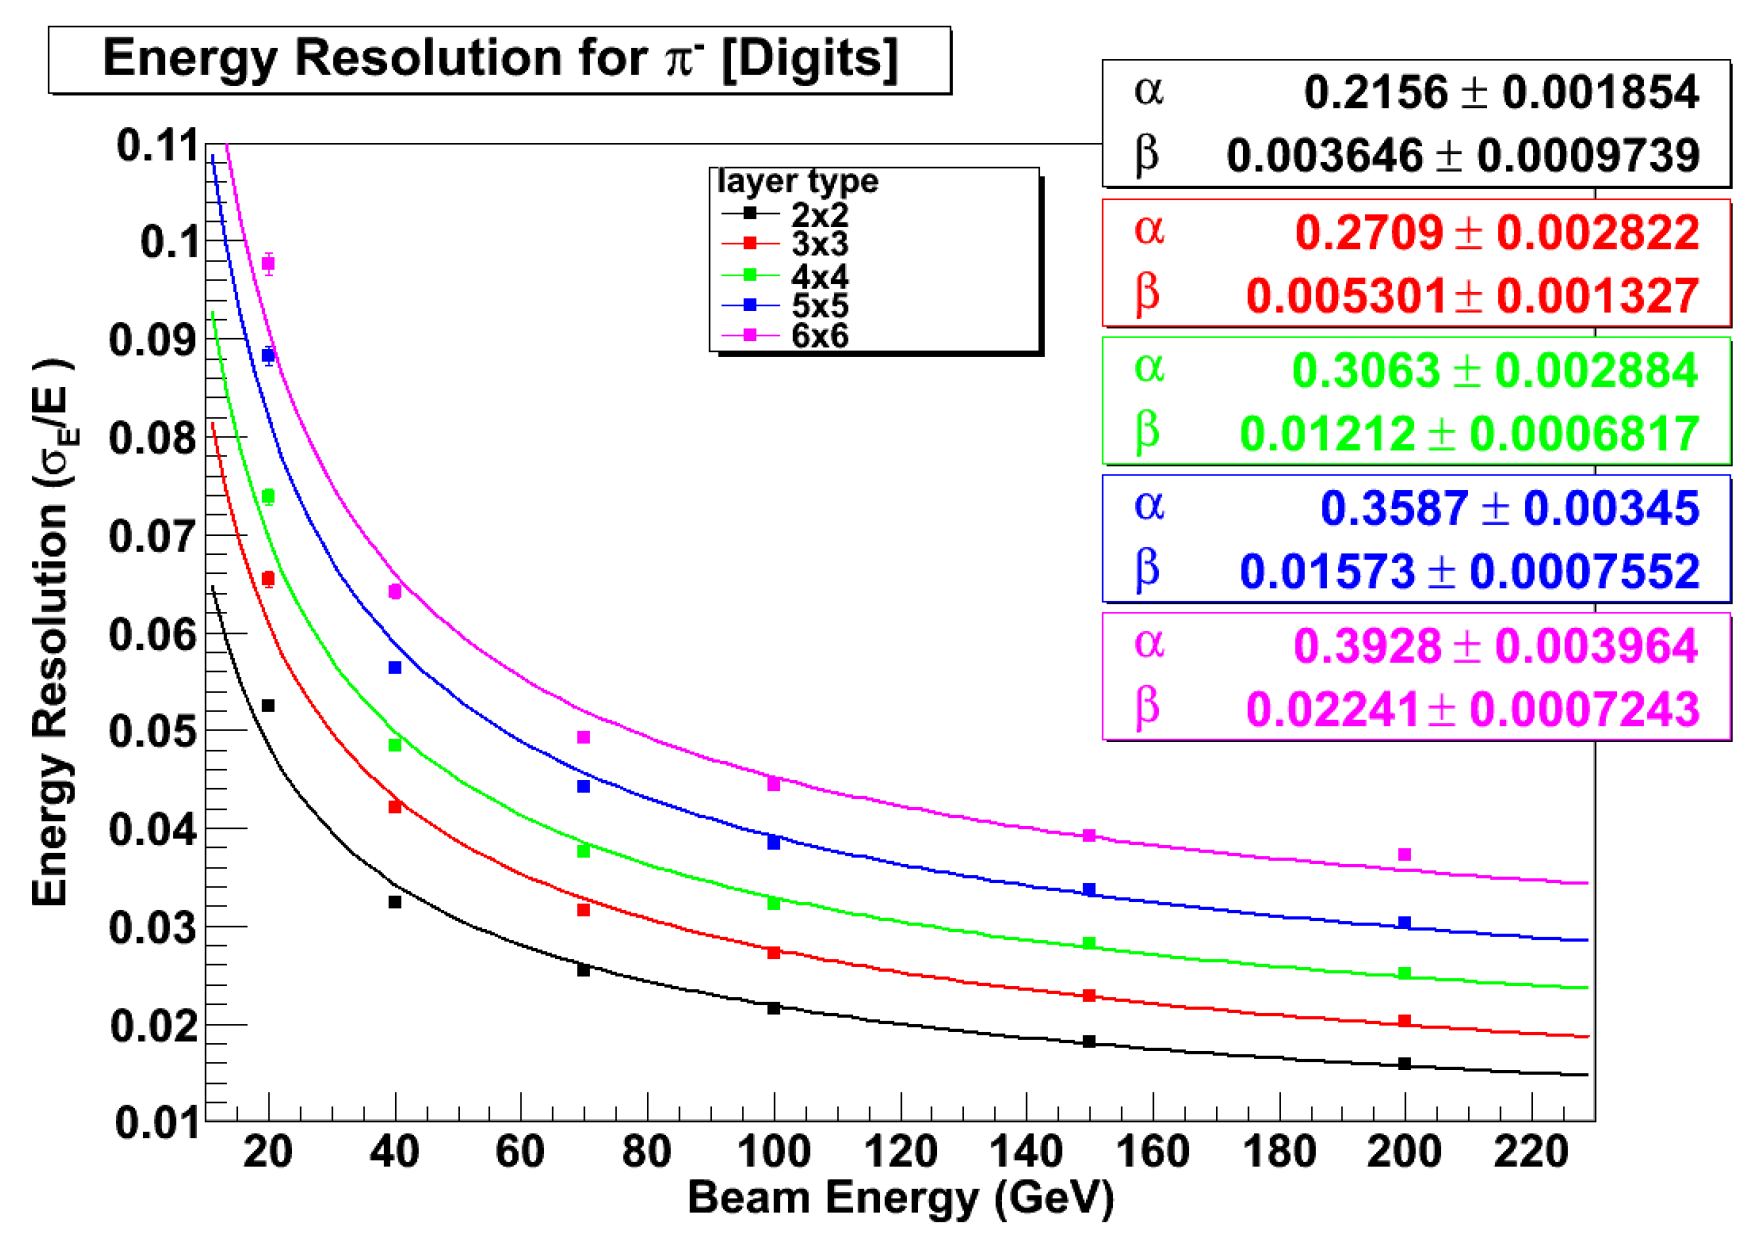
Once the calibration procedure presented in Section 6.2 and Section 6.3 is completed, the pair of calibration constants ( η S , η C ) is available for the layouts listed in Table 1. At this point, the corrected energy E c o r r can be obtained for different values of the beam energies E. The energy resolution σ E c o r r E c o r r for five ADRIANO configurations is shown in Figure 24. The standard deviations are obtained by a Gaussian fits to E c o r r E . The distributions are well described by the following expression:
σ E c o r r E = α E β ,
indicating that the non-Poisson fluctuations of f e m , responsible for the known departure of the energy resolution of non-compensated calorimeters from the E 1 / 2 scaling law, are almost completely eliminated by the dual-readout compensation mechanism. The stochastic ( α ) and constant term ( β ) from a fit of Eq. 16 to the data for the detector layouts considered are summarized in Table 3, along with the reduced χ 2 .
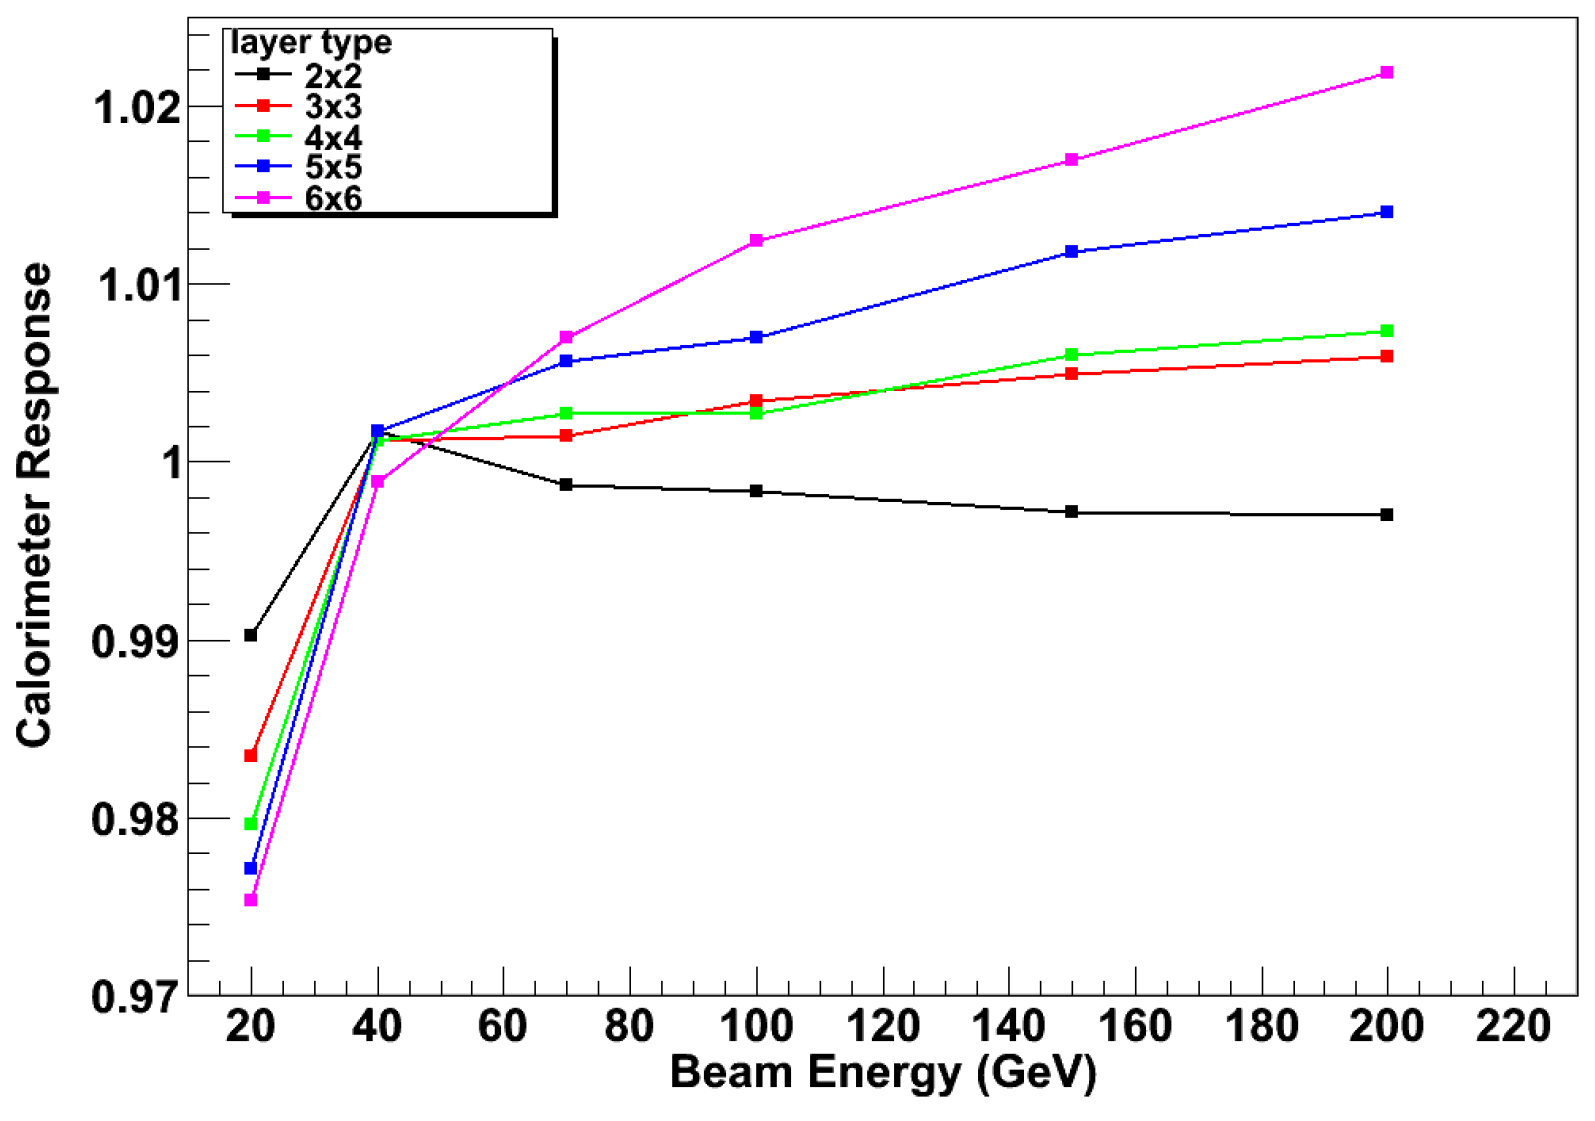
The ratio E b e a m / E c o r r vs E b e a m for a fully calibrated A D R I A N O detector and for different layouts is shown in Figure 25. We note that the deviations from perfect response is smaller than 2.5% in the energy range considered here.

7.2. Performance in Triple-Readout

As noted in Section 3.1 the energy resolution of A D R I A N O could be further improved by operating the device in triple-readout mode. The method for extracting the neutron component of the shower is based on the time history of the scintillating signal. The technique is described in more detail in Section 3.1.
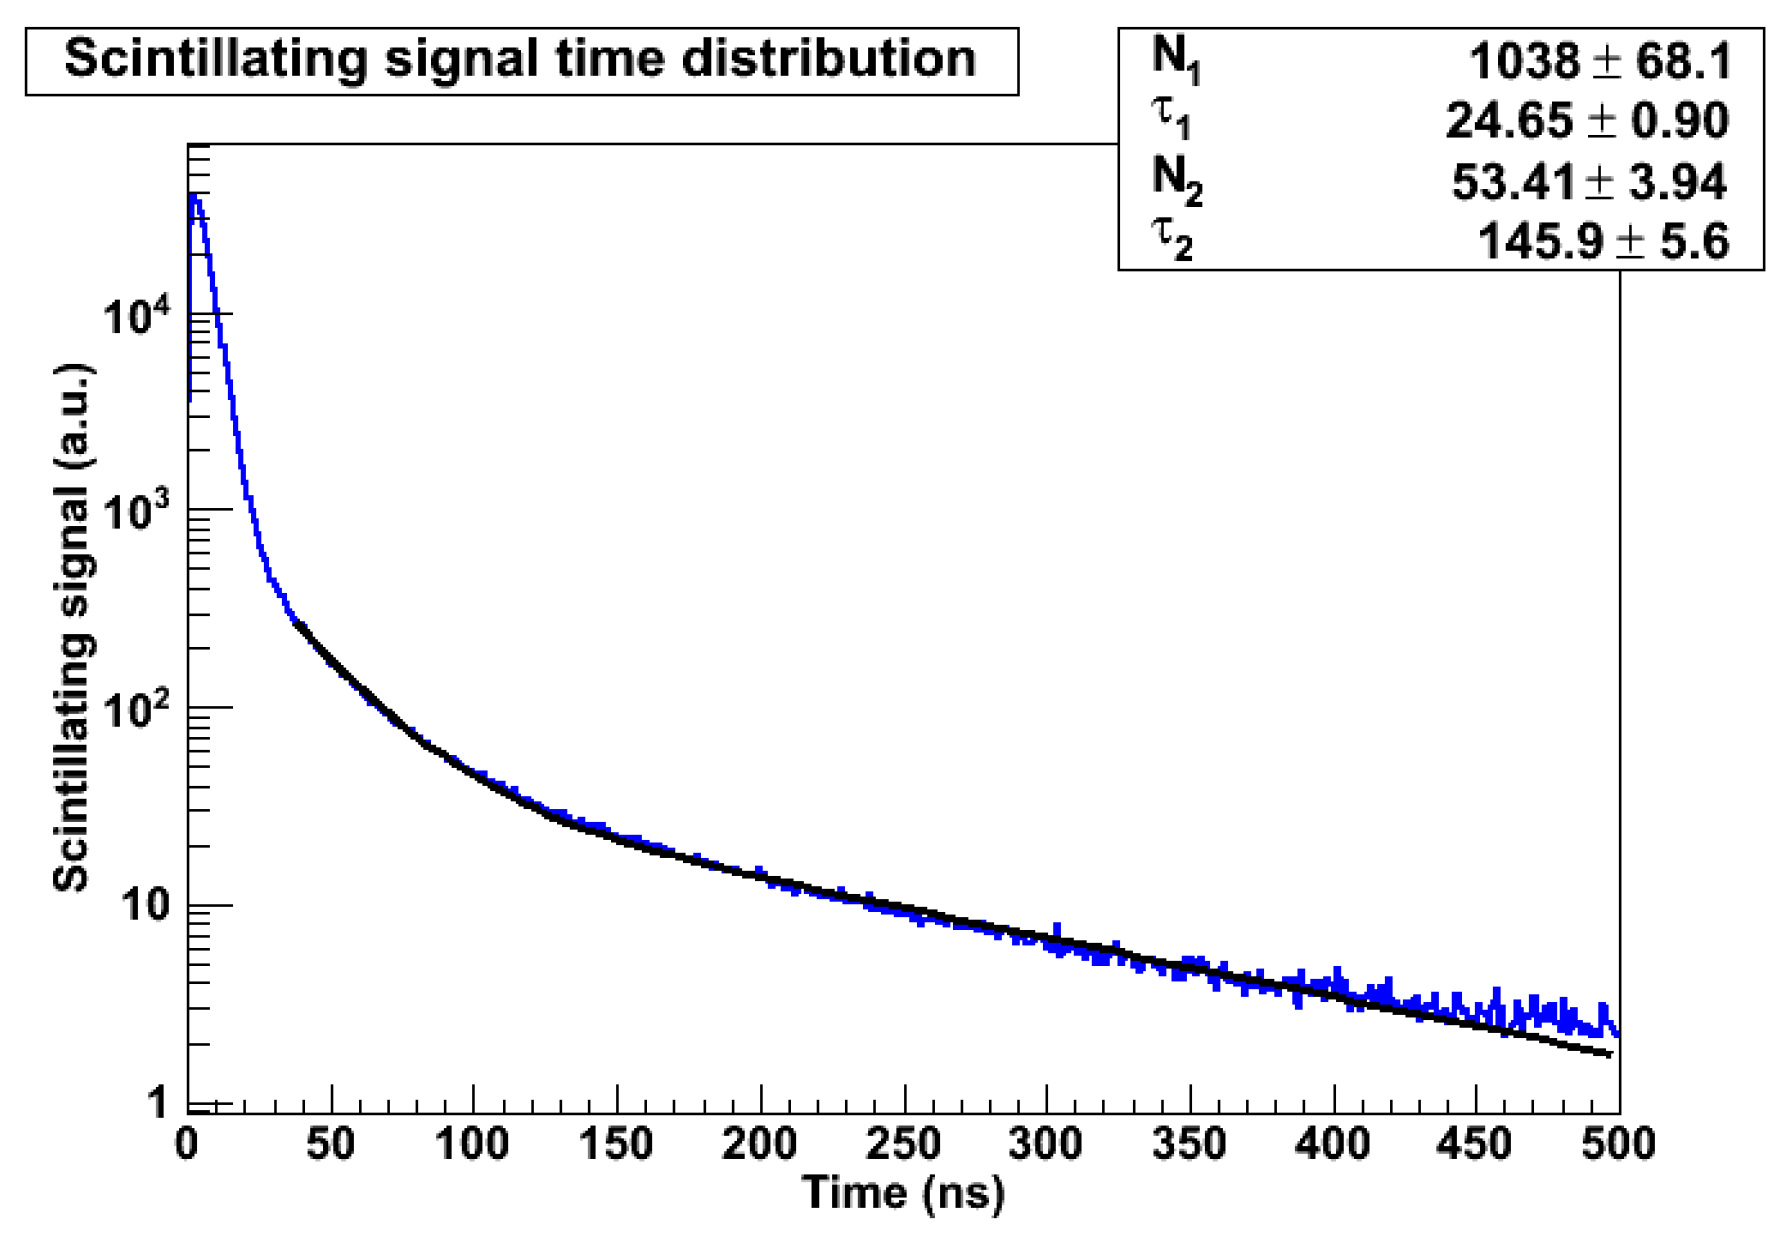
The average time distribution of the scintillating signal for 40 G e V π impinging in the center of the A D R I A N O module is shown in Figure 26. As already noted, the neutrons interacting with the calorimeter materials are responsible for the long tails of the time distribution. The exponential fit superimposed to the distribution has two different characteristic times, corresponding to a faster component due to all particles except the neutrons and a slower, neutron-related component. In all practical respects, the scintillating light collected after 40 nsec from the starting time of the shower is due almost entirely to neutrons. In order to calibrate the detector in triple-readout mode, we rewrite Eq. 4 in the following form:
E c o r r T R = α S f a s t + β C + γ S s l o w
where C is the Čerenkov signal, S s l o w is the neutron component of the scintillating signal, S f a s t is the remaining part of the scintillating signal, α , β and γ are the new calibration parameters. Once the latter are evaluated, using a technique equivalent to that described in Section 6.3, then Eq. 17 can be used to measure the calorimetric energy.
We, then, repeated the studies presented in Section 6.2 and extracted E c o r r T R using Eq. 17. The corresponding standard deviations, obtained from Gaussian fits to E c o r r T R , are shown in Figure 27. Event in the triple-readout case, the distributions are well described by Eq. 16 and the fit parameters for five different A D R I A N O layouts are summarized in Table 4 .
It is worth noting that a and b are systematically lower than those obtained in dual-readout mode, indicating that the energy resolution of the calorimeter has improved, as expected, through the stochastic term and the constant term. For the baseline layout ( A D R I A N O 4 x 4 ) the improvement is larger than 10% for a and about 50% for the b.

7.3. Effects of leakage

The results presented in Section 7 refer to an A D R I A N O module of 4 meters long (or about 16.5 λ I ). The leakage and punch-through estimated by the Monte Carlo analysis are expected to be negligible for such a device in the energy range considered. Although a calorimeter of such size poses no problems in fixed target or passive experiments, it is unlikely to be employed in a 4 π detector at a future collider. In order to preserve its energy resolution, the calorimeter must be located inside the magnetic solenoid, which imposes relatively tight dimensional constraints. This section will consider the effects of longitudinal shower leakage and punch-through expected in an A D R I A N O module of 180 cm length (in that case, that includes both the E M and hadronic sections), which is closer to the dimension of a typical collider experiments. The results of such studies, for one of the detector layouts considered above, are presented below.

7.4. Performance of a 180 cm long A D R I A N O module

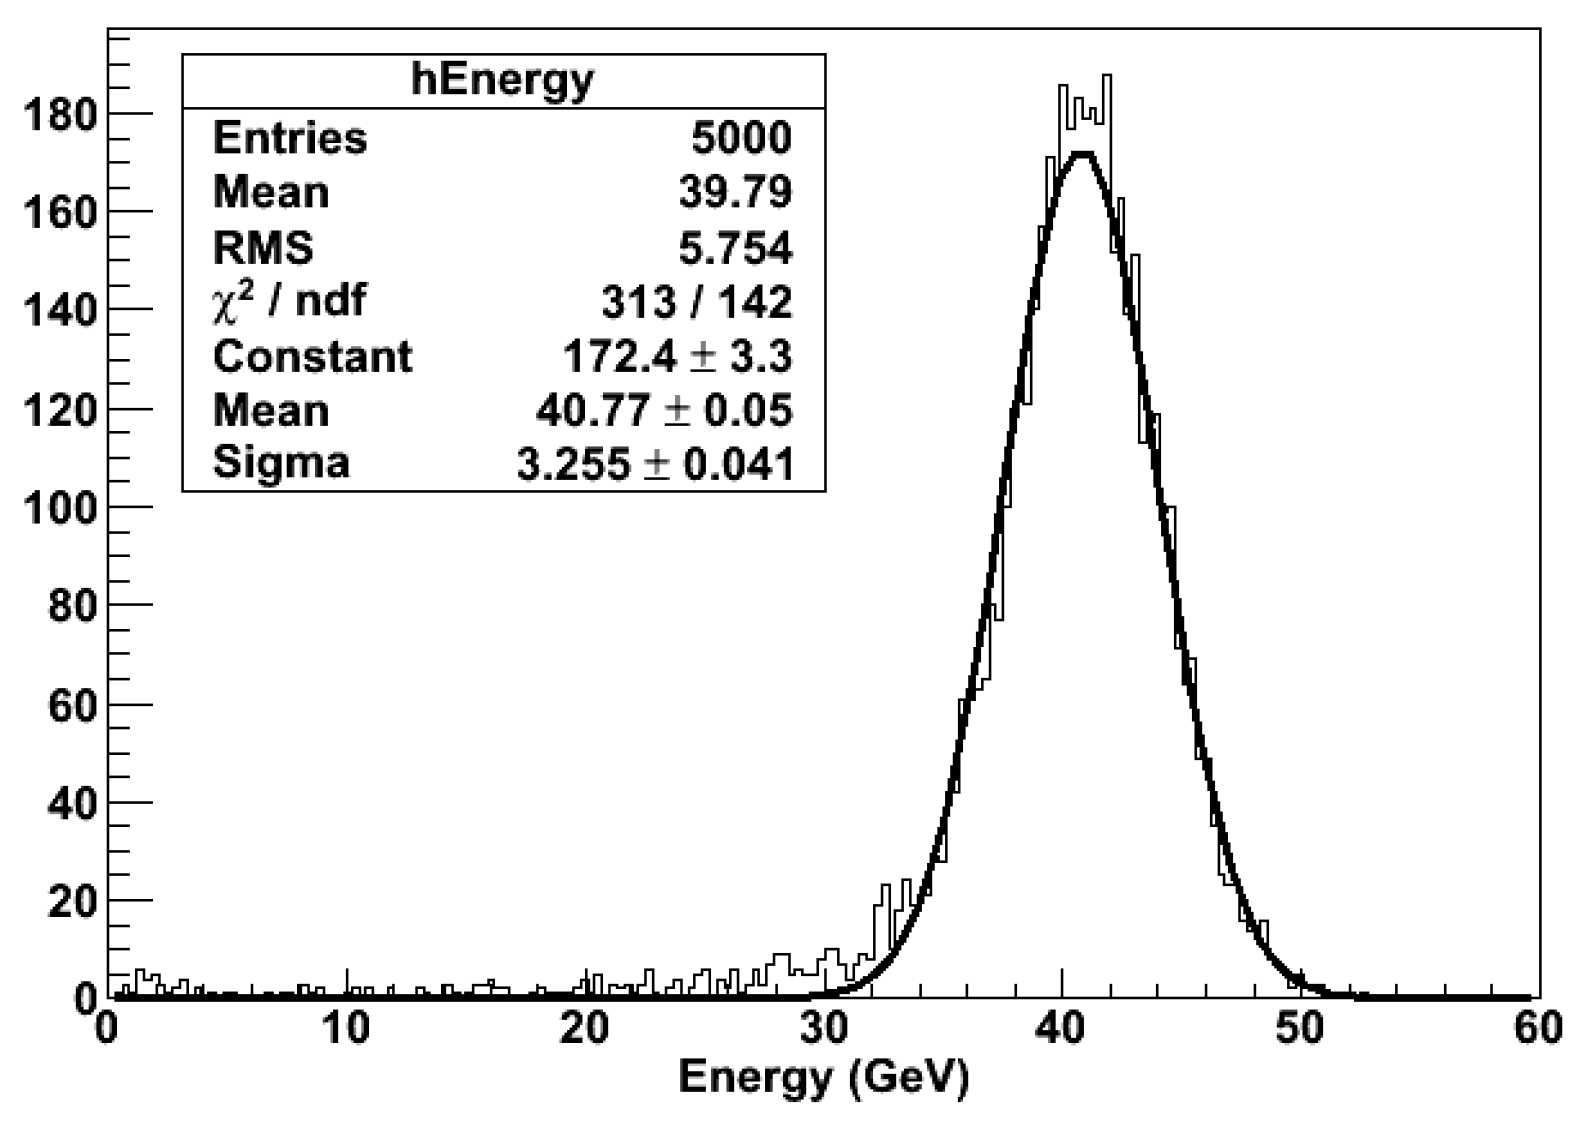
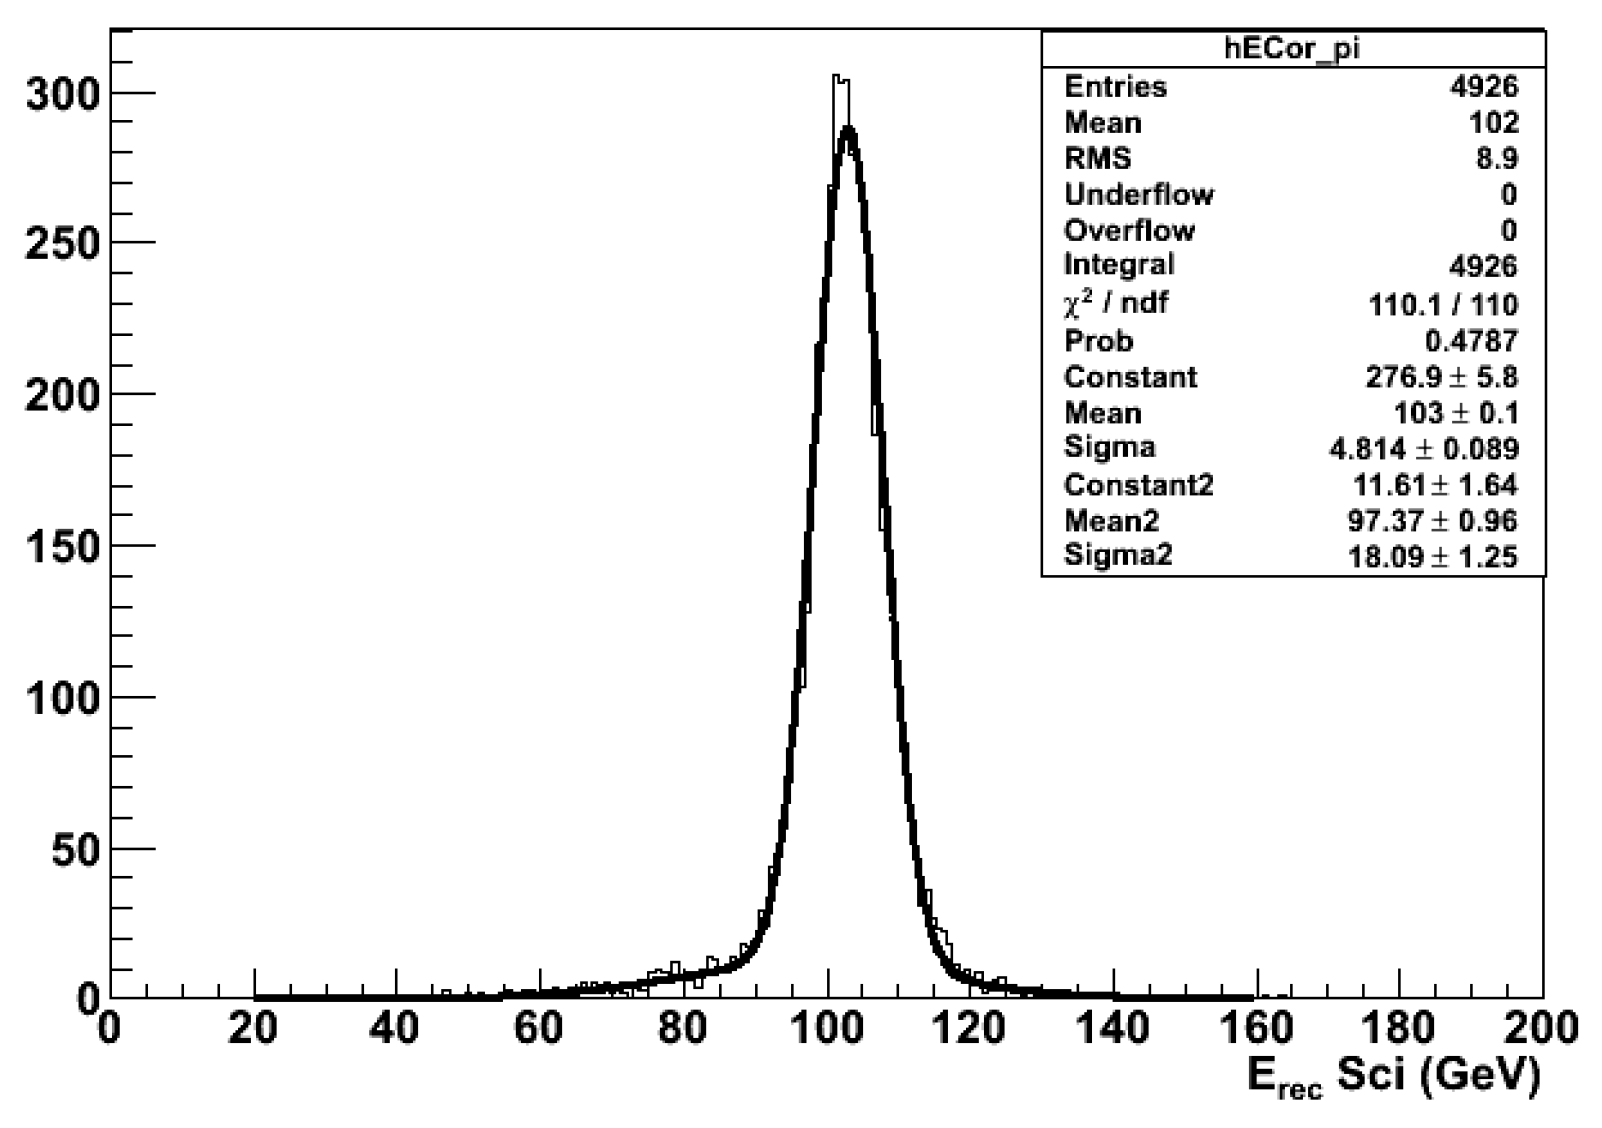
The distribution of the corrected energy E c o r r obtain for a 180 cm long A D R I A N O module with baseline layout (4x4mm2 fiber pitch) for showers induced by a 40 GeV π beam is shown in Figure 28. The effects of the shower leakage for the shortened module are already evident at this energy, as a longer tail at lower energy is observed. We expect that the leakage is strongly correlated with the shower’s Center of Gravity (CoG) since the closer the latter is to the backward end of the calorimeter, the larger the leakage is expected to be.
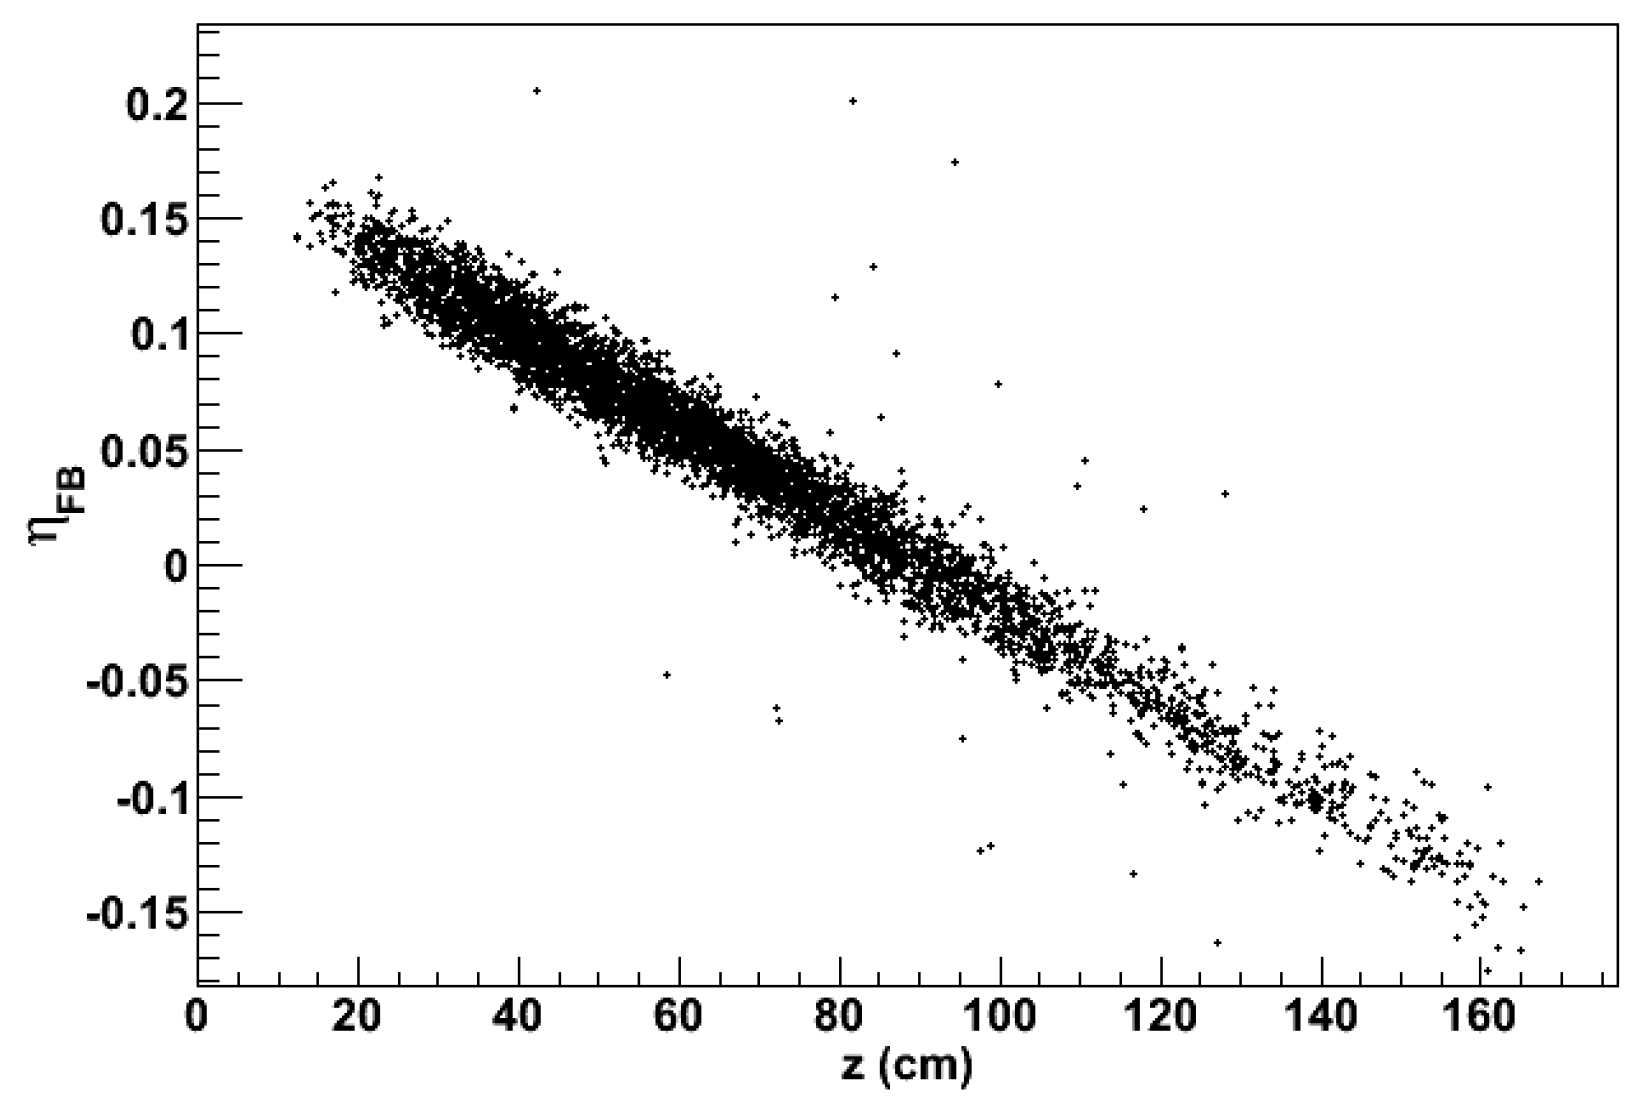
Therefore, an estimate of the shower CoG could be used to correct the energy measurement for eventual leakage. In order to do that, we exploit the fact that the self attenuation of the light propagating in the scintillating fibers depends exponentially on the length traveled by the photons toward both ends of the fiber. Consequently, the photodetectors equipping the front and back side of the module will register an amount of light whose ratio would depends on the position along the fiber where the energy had been lost. This effect is demonstrated in Figure 29 where we plot the quantity η F B = ( E f o r w a r d E b a c k w a r d ) / ( E f o r w a r d + E b a c k w a r d ) versus the CoG of showers induced by 40 GeV negative pions. For sake of completeness, the simulation algorithms include also the following effects:
  • a non-uniformity in the light attenuation process in the fiber equal to 0.8% ;
  • a contribution of 0.3% to the fluctuations in the PDE of the photodetector;
  • a contribution of 1 photoelectron from electronic noise;
  • the finite size of binning of a 14 bits FADC.
The correlation between the two quantities is straightforward, and η F B appears to be only slightly affected by the leakage process. Therefore, it can be used, to a good approximation, to estimate the position of the CoG of the shower in the calorimeter.
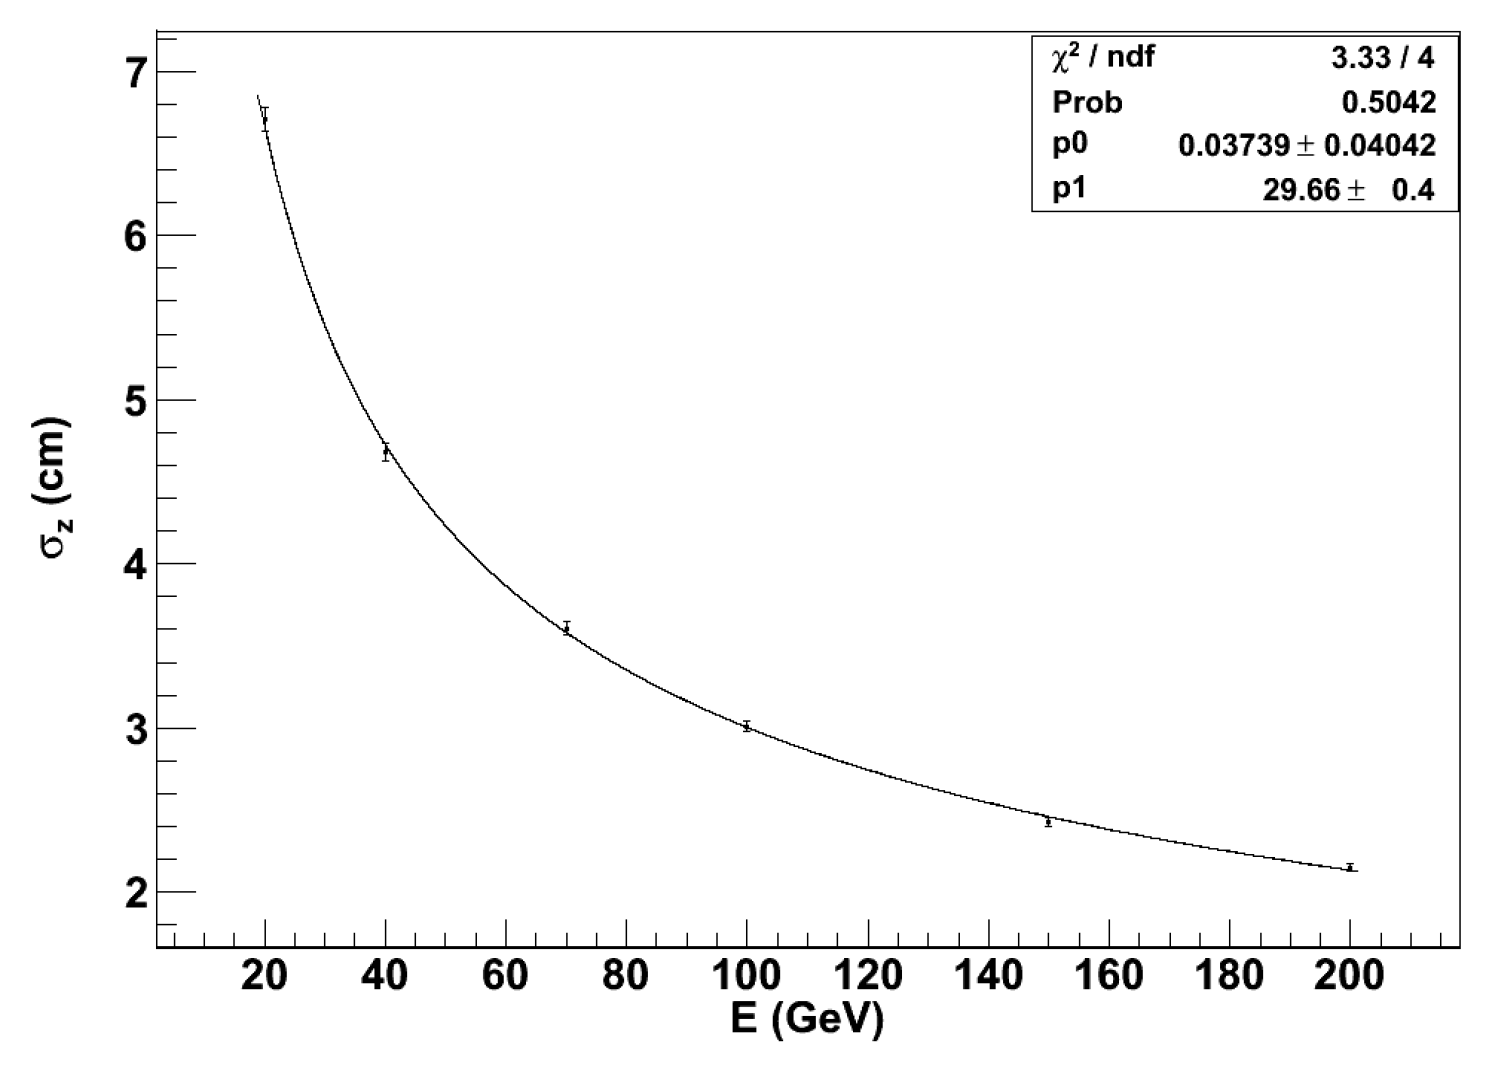
The resolution on the estimate of CoG depends on n p e , the number of photoelectrons collected, with a contribution proportional to λ s c i / n p e , where λ s c i is the attenuation length of the fibers. Consequently, the uncertainty on CoG depends on the shower energy, as Figure 30, shows. The observed distribution is well described by the following expression:
δ C O G ( c m ) = 29.66 / E + 0.04
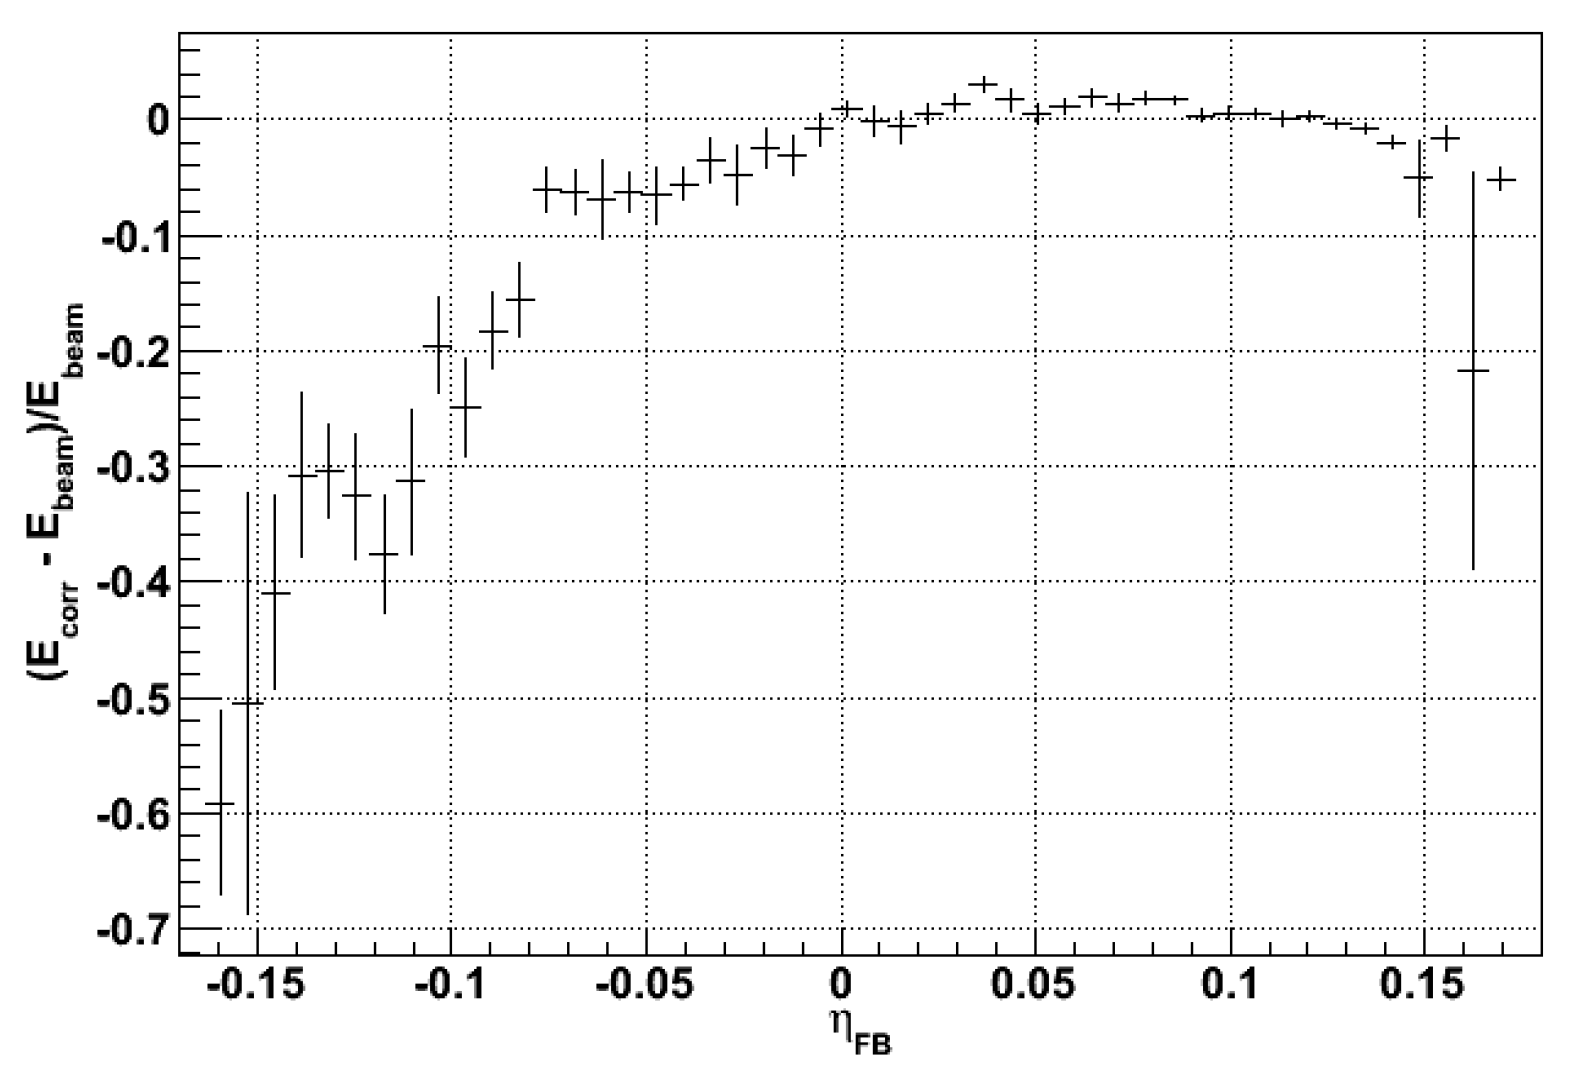
where E is in GeV units, demonstrating the stochastic nature of the underlying processes. Once η F B has been estimated, late starting showers, which have increased probability of sizeable longitudinal leakage, can be tagged and the energy can be corrected. An analysis of the visible energy as a function of η F B demonstrates a strong correlation between the two quantities. This is shown in Figure 31 where we plot the expression ( E c o r r E b e a m ) / E b e a m vs η F B for 40 GeV negative pions. The shower leakage becomes evident for values of η F B lower than -0.08, corresponding to a depth larger than about 130 cm. The correction algorithm is based on the known logarithmic dependence of the shower profile. The expression used is shown in Eq. 19:
E c o r r l e a k = a 1 . b ( η F B + c ) + b ( 0.1 + c ) d ( η F B + c ) 2 + d ( 0.1 + c ) 2
where the parameters a , b , c and d are obtained from a fit to the plot shown in Figure 31.
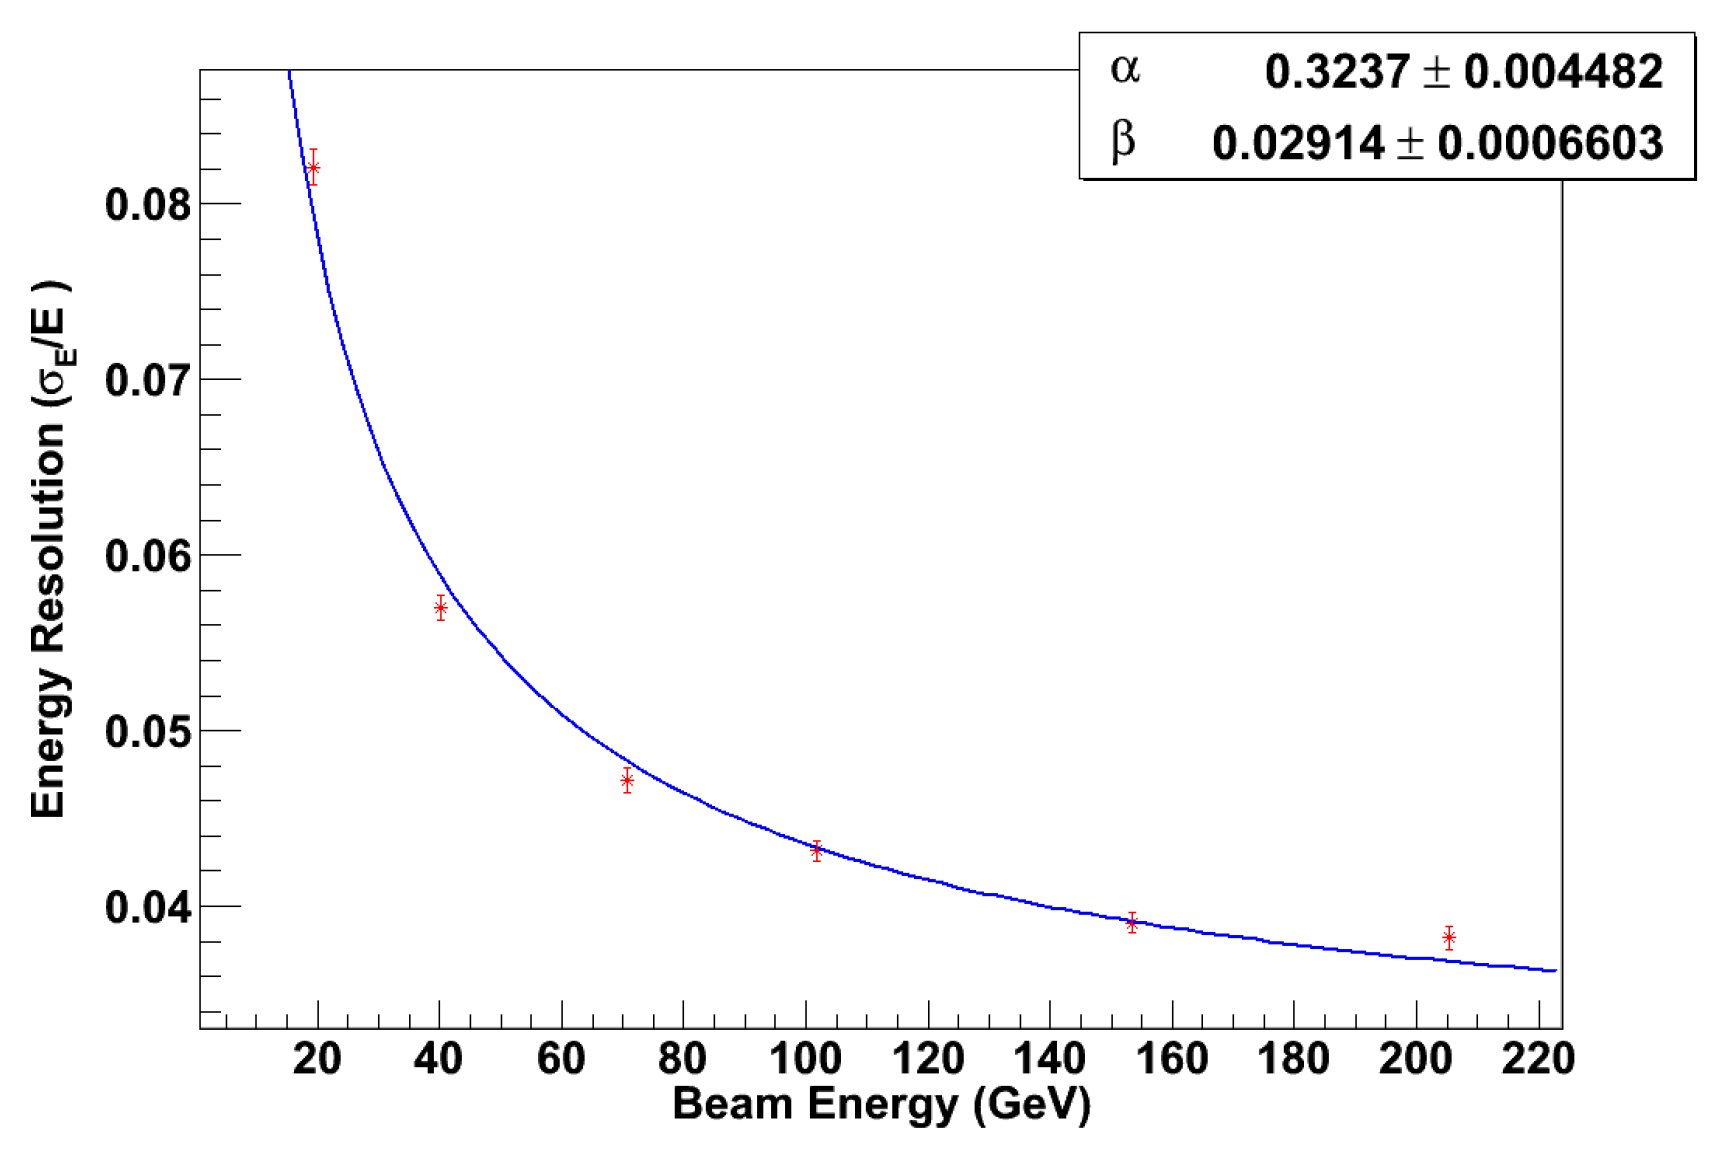
We repeated the above correction by operating the shortened A D R I A N O module in triple-readout mode. In this case, the energy resolution achieved after corrections for longitudinal leakage, is shown in Figure 32. The improvement obtained with the light division technique compared to the uncorrected plot of Figure 28 is straightforward. The values obtained from a Gaussian fit to E c o r r E b e a m for several values of E b e a m and the baseline A D R I A N O layout are shown in Figure 33. A fit to the plot indicates that described by the following expression:
σ E = 32.4 E 2.9
When comparing the above result with the values of a and b listed in Tab. Table 4 for a 400 cm long A D R I A N O module, we conclude that the longitudinal leakage of the shower, when appropriately corrected, affects the performance of a 7.5 λ I detector only marginally.

7.5. A D R I A N O Performance with electrons

In this section we will discuss the performance of A D R I A N O with electron induced showers. As noted in Section 4.1, in this case, the showers develop according to the parameters characteristic of a purely EM shower ( X 0 and ρ M ) and a different methodology is required for an optimal determination of the shower energy. The scatter plot of S vs C for 40 GeV electrons impinging with an angle of 3 o onto the center face of A D R I A N O is shown in Figure 17. The distribution, as expected, looks very different than that observed in the case of a pion beam (cfr. Figure 18) with the width of C considerably narrower than S. This should not come as a surprise, as the lead glass active absorber behaves for EM showers as an (almost) homogeneous calorimeter and the shower is fully contained therein. On the other hand, the matrix of scintillating fibers sample the shower particles very inefficiently since the pitch, optimized for hadronic showers, is too coarse in the electromagnetic case. Consequently, although the methodology adopted in Section 6.2 is still applicable, we expect that the dual-readout energy resolution for electrons will be sub-optimal.
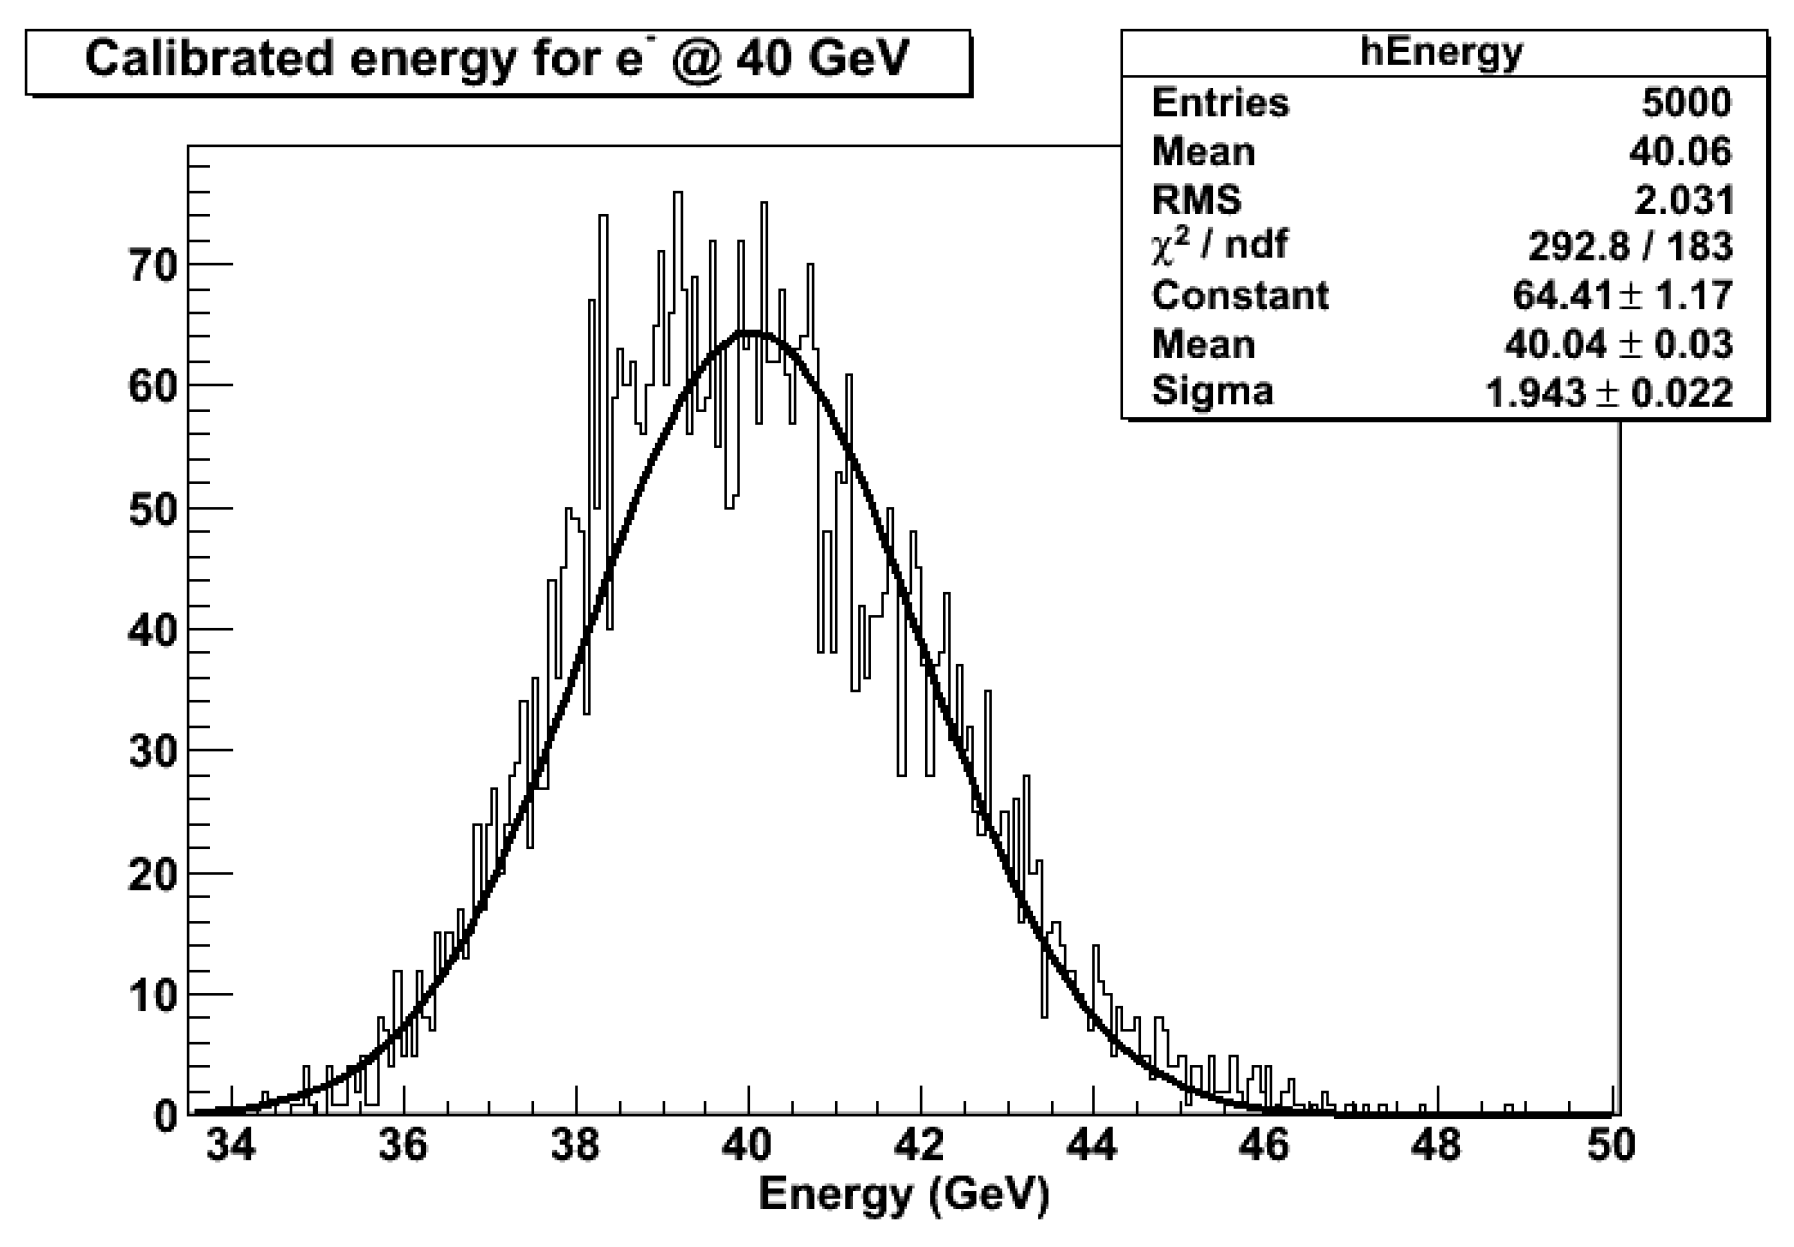
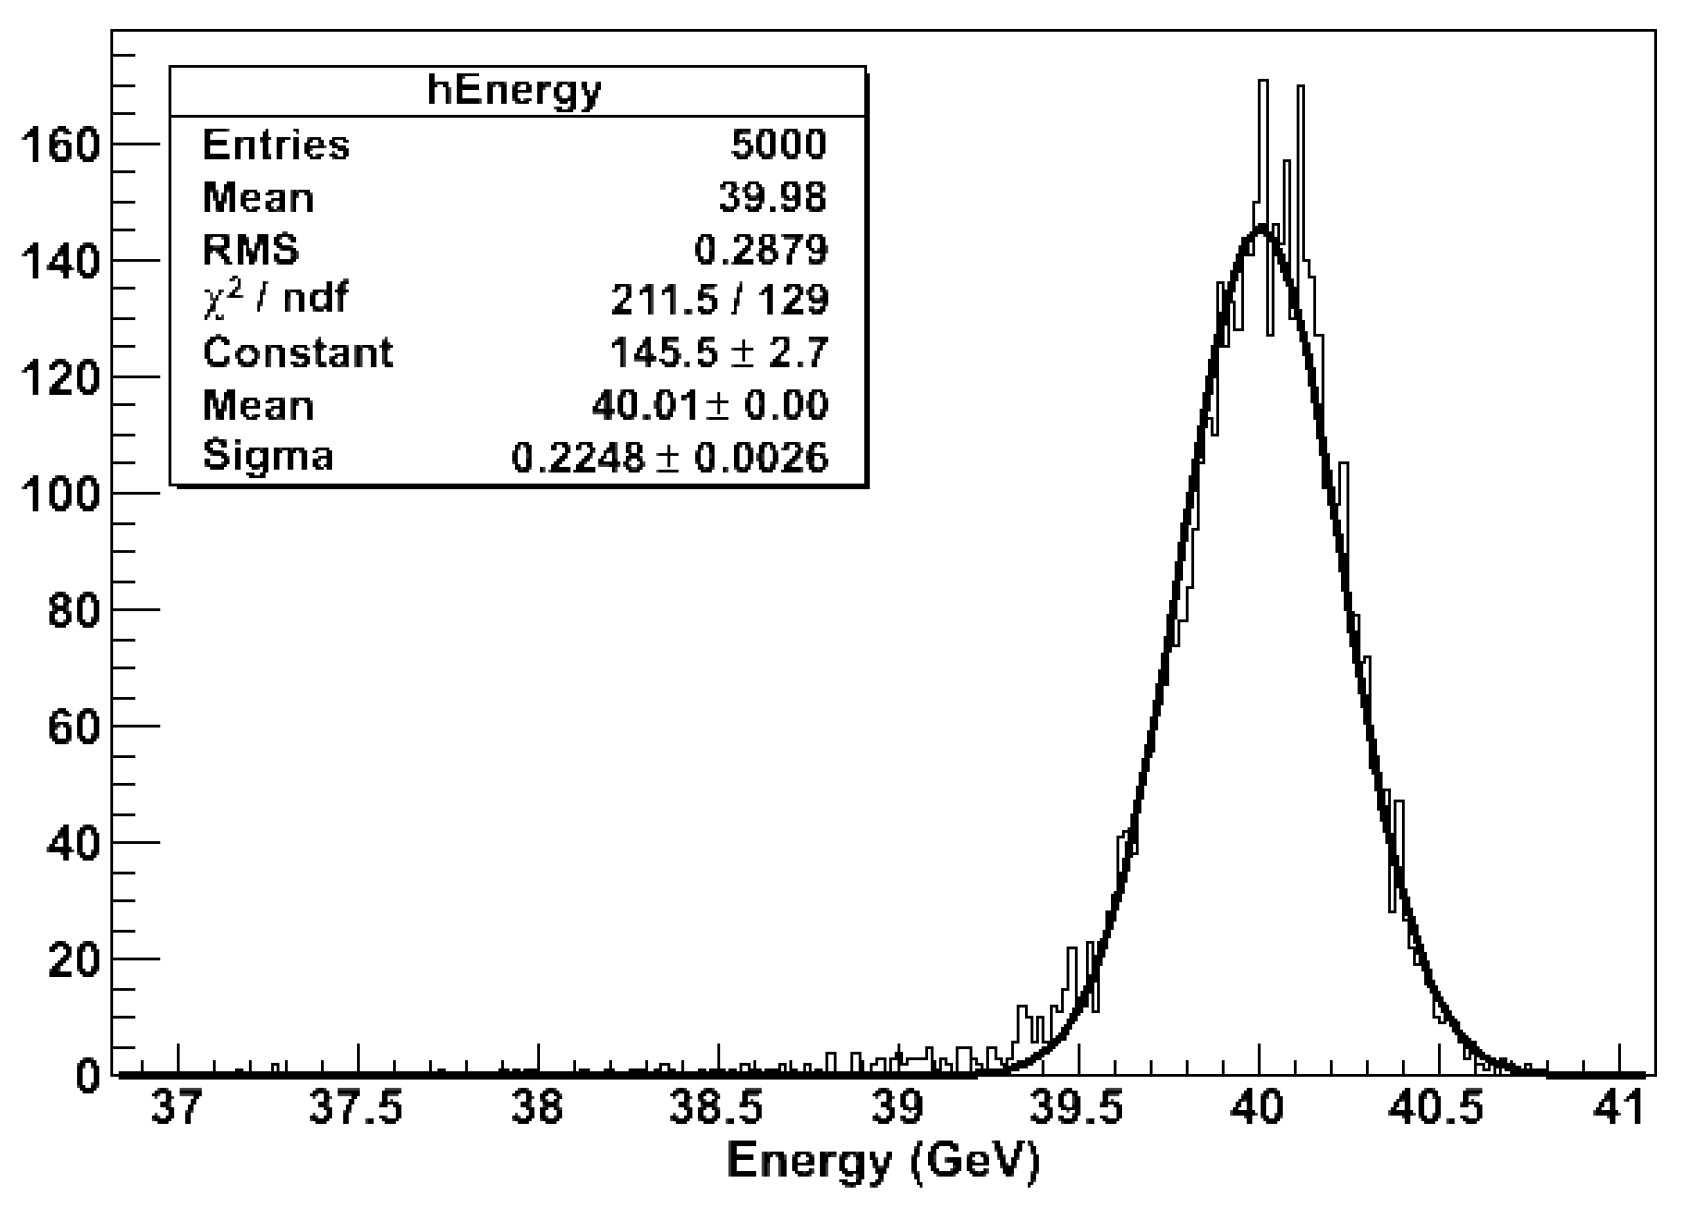
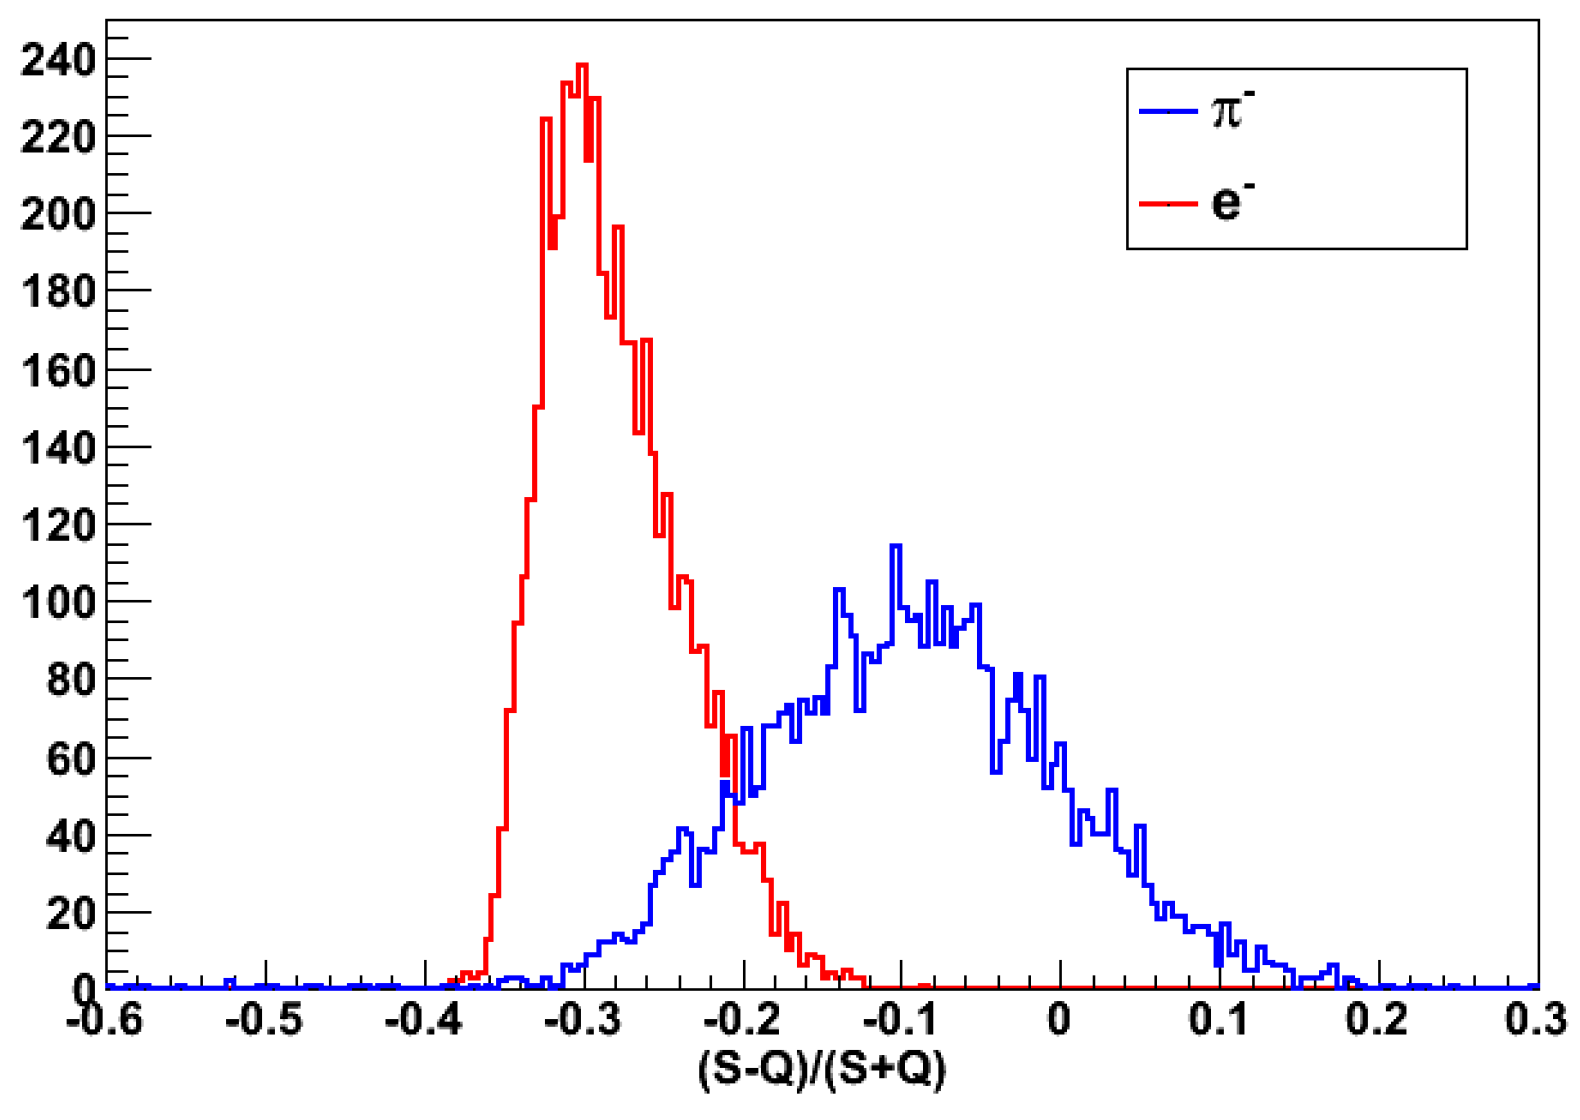
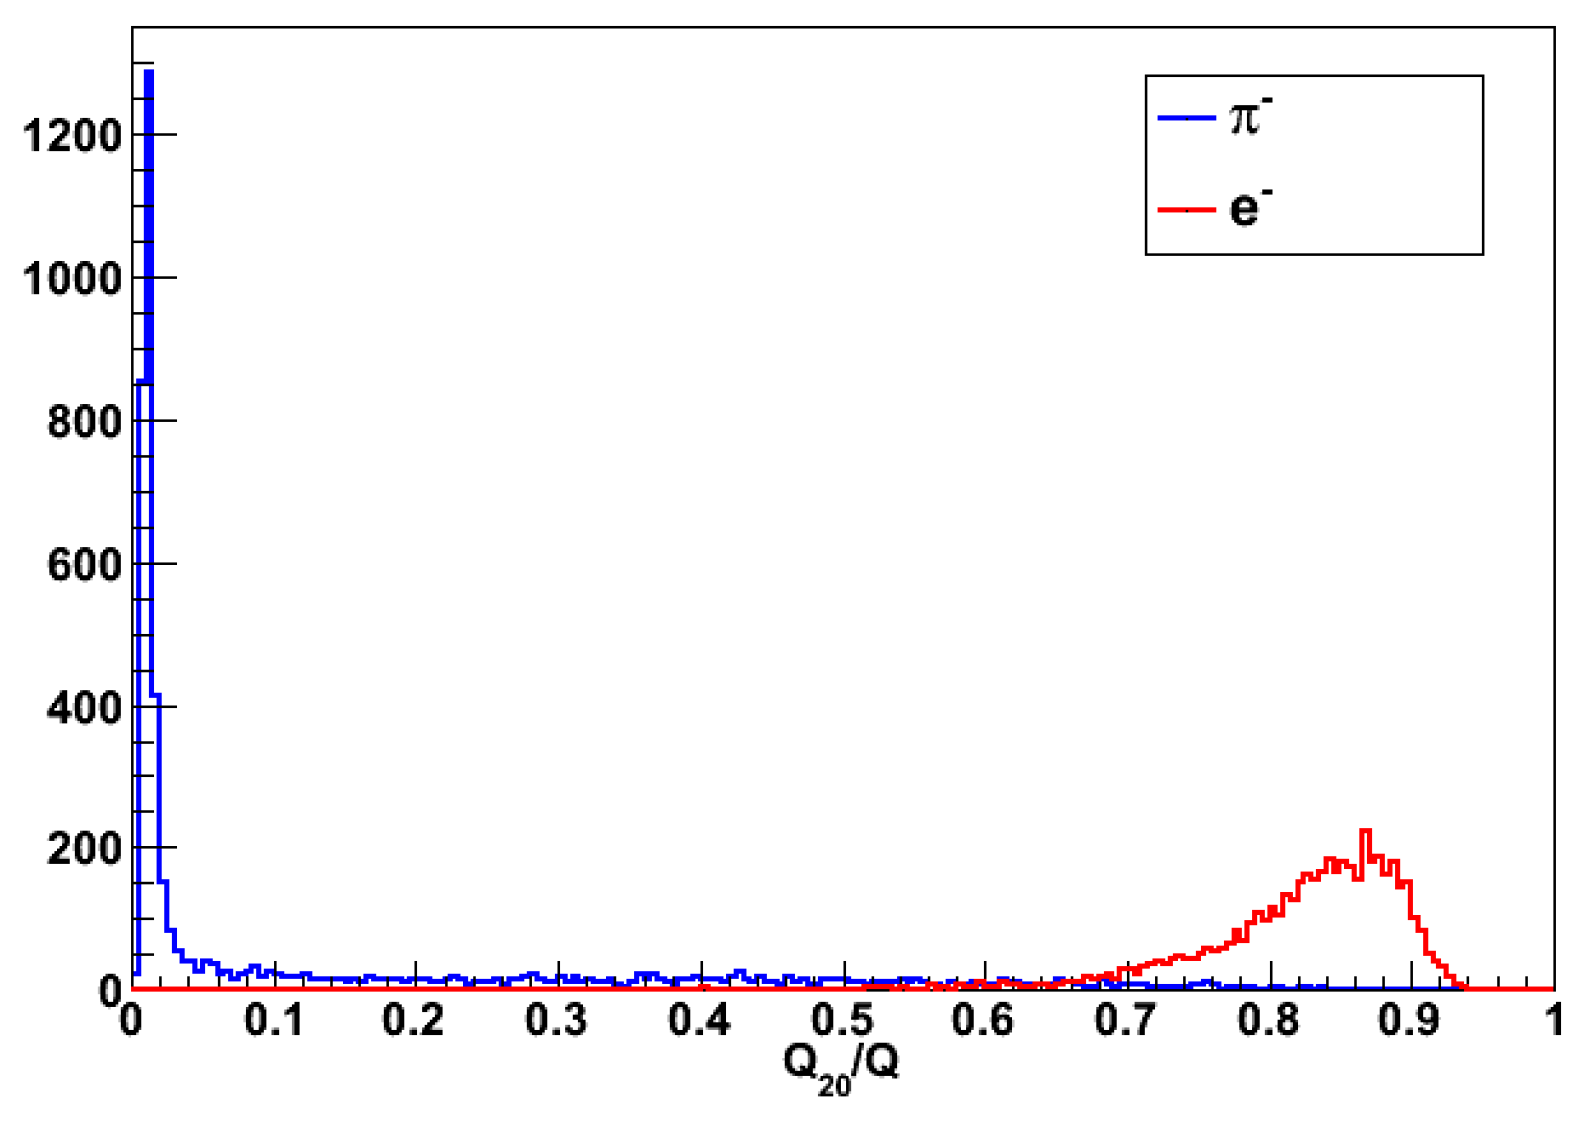
This is confirmed by the plot in Figure 34 showing E c o r r for a 40 GeV electron beam reconstructed using the formula (4). The value of σ E c o r r obtained from a Gaussian fit corresponds to an energy resolution of 30 % / E , which is typical of an hadronic shower. On the other hand, the projection of the plot in Figure 17 on the C axis is much narrower (cfr. Figure 35) than that observed for hadronic showers and corresponds to an energy resolution of 3.6 % / E . Therefore, with an efficient identification of EM particles, we could recover an energy resolution typical of an homogeneous EM calorimeters by considering only the C component of A D R I A N O . A quite efficient electromagnetic-hadronic discrimination is accomplished by using the following two variables:
  • The ratio R 20 = C 20 / C of the light collected in the foremost 20 c m of the lead glass and the whole Čerenkov signal;
  • The normalized difference R C S = C S C + S of the total scintillating and Čerenkov signal.
The variable R 20 is correlated to fraction of the Čerenkov light generated in the foremost region of A D R I A N O . The attenuation length of SF57HHT glass for the, mostly blue, Čerenkov photon is about 10 c m . Therefore, the Čerenkov light is captured by the closest WLS fiber only when it travels for short distances from the point where it has been generated. Conversely, a depth of 20 c m for an A D R I A N O detector corresponds to about 13 X o and 0.8 λ I . Therefore, the special C 20 fibers will be able to collect a considerable fraction of the light generated by an EM shower, but only a small fraction of an hadronic shower. Similarly, from Eqs. 1 and 2 we have that C / S 1 for EM showers and C / S ( e / h ) < 1 for hadronic showers. Therefore, R C S is expected to reflect such different conditions.
R 20 and R C S are shown respectively in Figure 36 anf for 40 GeV electrons (red) and negative pions (blue). By requiring that:
R 20 > 0.51 a n d R Q S < 0.1553
we are able achieve an electron identification efficiency of 98.96% with 97% purity. The energy resolution for electrons selected with the requirements (21) is shown in Figure 38. The points are well described by Eq.16 with α = 5.3 and β = 0.4 , indicating that the good energy resolution for EM particles is almost completely recovered.

8. Discussion of the Results

The studies presented in this article rely heavily on the simulation algorithms we have implemented in ILCroot. These are well understood for the case of the scintillation component of A D R I A N O , which is very similar to several existing experimental setups with a large availability of real data. Conversely, while the mechanism of Čerenkovlight production and transport in diffractive glasses is well understood and reproduced by most available Monte Carlo packages, the technique of collecting that light with WLS fibers optically coupled to glass is fairly new. We found only another experimental setup for comparing our simulation algorithms[45]. This fact suggests that A D R I A N O ’s Čerenkov light yield evaluated with ILCroot has a large uncertainty. We are confident that such an uncertainty, primarily related to the efficiency of light transfer from the glass to the WLS fiber, is reduced to an overall, energy independent, normalization scale. Consequently, the dual-readout compensation mechanism and the leakage corrections we have developed in the sections above, are largely unaffected (the latter relying only on the scintillation section).
Although A D R I A N O is an integrally active calorimeter, with no passive regions (except for the thin capillaries housing the scintillating fibers) the S component is based on a sampling technique, with all the implications on the overall performance. All the layouts considered in this study show hadronic energy resolutions in the range [23%- 48%]/ E . Sampling fluctuations are well contained in all cases, with minimal impact on detector performance. As already noted, this is because the 2 m m ÷ 6 m m pitch of the scintillating fibers matrix is substantially narrower than the characteristic dimensions associated to hadronic showers (i.e. a range of about 1 cm for 50 ÷ 100 M e V typical spallation protons and several centimeters for neutrons). From the practical point of view, Tab. Table 3 and Table 4 provide a solid guideline when designing an A D R I A N O -style calorimeter and aiming at a specific energy resolution.

9. Conclusions and Outlook

We have reviewed the concept of dual and triple-readout calorimetry and established a mathematical framework to describe the mechanism of energy compensation quantitatively. These formulae are useful for designing new multiple-readout calorimeters.
These principles have been applied to a novel dual-readout calorimetric technique, A D R I A N O , which uses an active absorber made of heavy optical glass and scintillating fibers. This technique marks a significant advancement in particle detection by offering a fully active and non-longitudinally segmented detector. The active absorber primarily detects electromagnetic (EM) showers through Čerenkov signals, while the scintillating fibers are sensitive to all ionizing particles. This dual-readout approach allows A D R I A N O to function effectively as both an electromagnetic and hadronic calorimeter, potentially eliminating the need for separate sections in many experiments.
Our Monte Carlo studies suggest that A D R I A N O has excellent energy performance as both an electromagnetic and a hadronic calorimeter, with energy resolution described by σ E = α E β within the energy range of 20 to 200 GeV. The stochastic term a varies between 23% and 48% across different layouts, and the detector’s deviation from linear response is expected to be less than 2.5%. This high level of performance demonstrates A D R I A N O ’s capability to accurately measure energy in particle detection applications.
The methodology used allows for the effective discrimination between electromagnetic and hadronic showers by detecting Čerenkov light generated in the foremost 20 cm of the detector. Electrons and pions are identified with 98% accuracy. Once an EM shower is identified, the module can operate purely as an EM calorimeter, achieving an energy resolution of σ E = 5.3 % E 0.4 % (including the most relevant instrumental effects). Although A D R I A N O is non-longitudinally segmented, we studied the possibility of estimating the Center of Gravity (CoG) of the shower using a light division technique. The results show that this method can achieve resolutions of δ C O G ( c m ) = 29.66 / E . This CoG estimate can be used to correct measured energy for longitudinal leakage and punch-through. Our results indicate that we can recover missing energy with an efficiency of about 95% for a detector with a longitudinal dimension of 7.5 λ I (or 180 cm) within the 20 to 200 GeV energy range.
An intense program of detector R&D is in progress within the T1015 Collaboration. One of the goals is to accurately measure the Čerenkov light yield for various A D R I A N O modules. Once this parameter is available, the simulation apparatus we have developed can be used to accurately predict the performance of more complex layouts and for further detector optimization studies.
In summary, the A D R I A N O multiple-readout calorimetric technique presents a significant advancement in particle detection, offering excellent energy resolution for both electromagnetic and hadronic showers. Its ability to operate as an integrally active, non-longitudinally segmented detector makes it a versatile and powerful tool for future particle physics experiments. The ongoing R&D efforts promise to refine and enhance its capabilities, paving the way for more efficient and accurate particle detection systems.

Acknowledgments

This manuscript has been authored by Fermi Research Alliance, LLC under Contract No. DE-AC02-07CH11359 with the U.S. Department of Energy, Office of Science, Office of High Energy Physics.

Notes

1
The quoted authors use, respectively, 1/R and χ in place of t a n ( θ C / S ) . The reason for the nomenclature introduced in the present article will become clear in Section 2.3.
2
Most dense and high refractive glasses are reported by their maufacturers to produce a faint fluorescence light when subject to excitation. The lower the purity of the glass, the more intense is such effect. In the following, we will disregard this effect and assume that only Čerenkovlight is produced.
3
Eq. 8, derived from the known relations for the capture of a photon striking a WLS fiber of diameter d in a square cell of length w and average wall reflectivity R, is expressed as: P = ( 1 + ( 1 R ) w / d ) 1 .
4
An in-depth study of a DSR module is reported in Ref. [13]. The results therein are obtained with the same framework and algorithms discussed in Section 5

References

  1. ILC Reference Design Report, 2007.
  2. S. Eno et.al., Dual-Readout Calorimetry for Future Experiments Probing Fundamental Physics.(2022) https://arxiv.org/ abs/2203.04312. [CrossRef]
  3. B. Fleming, I. B. Fleming, I. Shipsey, et.al., Basic Research Needs for High Energy Physics Detector Research & Development: Report of the Office of Science Workshop on Basic Research Needs for HEP Detector Research and Development: -14, 2019 (2019). 11 December. [CrossRef]
  4. R. Poschl, Recent results of the technological prototypes of the CALICE highly granular calorimeters, Nucl. Instrum. Meth. A 958 (2020) 162234, proceedings of the Vienna Conference on Instrumentation 2019. [CrossRef]
  5. S. Buontempo et al., “Construction and test of calorimeter modules for the CHORUS experiment”, Nucl. Instr. and Meth. A 349 (1994), p. 250. [CrossRef]
  6. https://journals.aps.org/rmp/abstract/10.1103/RevModPhys.90.025002, section on calorimetry).
  7. https://www.sciencedirect.com/science/article/abs/pii/016890029190062U?via%3Dihub.
  8. R. Wigmans, Calorimetry energy measurement in particle physics, in: International Series of Monographs on Physics, vol. 107, Oxford University Press, Oxford, 2000.
  9. All DREAM papers are accessible at http://www.phys.ttu.edu/dream, and also http://highenergy.phys.ttu.edu.particle physics, in: International Series of Monographs on Physics, vol. 107, Oxford University Press, Oxford, 2000.
  10. https://www.linearcollider.org/ https://clic−study.web.cern.ch/clic−study/.
  11. D. E. Groom, Energy flow in a hadronic cascade: Application to hadron calorimetry, Nucl. Instr. and Meth. A 572 (2007), p. 633. [CrossRef]
  12. R.Wigmans,“EnergymeasurementattheTeVscale”,NewJournalofPhysics 10 (2008), 025003.
  13. 4th Concept Collaboration - Letter of Intent from the Fourth Detector (4th) Collaboration at the International Linear Collider, 2009 also at: http://www.4thconcept.org/4LoI.
  14. M. Antonelloetal2020JINST15C06015. 6015.
  15. M.T. Lucchini et al 2022 JINST 17 P06008. [CrossRef]
  16. I. Pezzotti, et. al. [CrossRef]
  17. N. Akchurin, et. al, New Crystals for Dual-Readout Calorimetry, Nucl. Instr. Meth. A604(2007)512-526. [CrossRef]
  18. G. Gaudio 2012 J. Phys.: Conf. Ser. 404 012064.
  19. M.T. Lucchini et al 2020 JINST 15 P11005. [CrossRef]
  20. R. Instr. Meth. A( 2009. [CrossRef]
  21. J. Dumazert et. al., Gadolinium for neutron detection in current nuclear instrumentation research: A review, Nucl. Instrum. And Meth. A 882, 53, 2018. [CrossRef]
  22. C. Gatto et.al, Preliminary Results from ADRIANO2 Test Beams Instruments 6 (2022) 4, 49. [CrossRef]
  23. B. Bilki, et. The ADRIANO3 Triple-Readout Calorimetric Technique, Submitted to IEEE-2024 conference.
  24. T. Zhao, et al., A Calorimeter Based on Scintillator and Cherenkov Radiator Plates Readout by SiPMs - A University Program of Accelerator and Detector Research for the International Linear Collider (vol. IV) FY 2006 also at: http://www.hep.uiuc.edu/LCRD/LCRD_UCLC_proposal_FY06/Zhao_UW-FNAL_Calorimeter _Proposal_122705.
  25. R. Wigmans, “Recent results from the DREAM project”, Journal of Physics: Conference Series 160 (2009) 012018. [CrossRef]
  26. S. Franchino, “Recent results from the DREAM project”, SocietáItaliana di Fisica - XCIV Congresso Nazionale also at: http://www.pv.infn.it/ franchino/miei_talk/DREAM_Genova.
  27. K Pauwels et. al, ”Single crystalline LuAG fibers for next generation calorimeters ”, presented at CHEF2013 (2013) also at: https://indico.in2p3.fr/getFile.py/access?contribId=16&sessionId=6&resId=0&materialId =slides&confId=7691.
  28. K Pauwels, et. al, ”Single crystalline LuAG fibers for homogeneous dual-readout calorimeters”, JINST 8 P09019 (2013) also at: http://m.iopscience.iop.org/1748-0221/8/09/P09019. [CrossRef]
  29. V. Di Benedetto, “Dual Readout Calorimetry as a technique for detectors at future Colliders.”, Universitá del Salento. Ph.D. Thesis (2011).
  30. M.G. Albrow et al., Nucl. Instr. Meth. A 256 (1987) 23.
  31. ZEUS Collaboration, A Forward Plug Calorimeter for the ZEUS Detector, DESY-PRC-97-02.
  32. C. Gattoetal, ADRIANO: A Dual-readout Integrally Active Non-segmented Option for future colliders, presentedat: 2nd International Conferenceon Technology and Instrumentation in Particle Physics (TIPP 2011)8-14 June 2011, Chicago, USA.also at:http://indico.cern.ch/contributionDisplay.py?contribId=34&confId=102998.
  33. C. Gatto et al, Preliminary Results from a Test Beam of ADRIANO Prototype, in: XVth International Conference on Calorimetry in High Energy Physics (CALOR2012) 4–8 June 2012, Santa Fe, USA, published in Journal of Physics: Conference Series Volume 404 2012. also at: http://iopscience.iop.org/1742-6596/404/1/012030;jsessionid=8B5D98DEAD55D7DB573654920CE2E734. [CrossRef]
  34. T1015 Collaboration, http://www-ppd.fnal.gov/FTBF/TSW/PDF/T1015_mou_signed.pdf (2011).
  35. L. Hu et al., Radiation Damage of Tile/Fiber Scintillator Modules for the SDC Calorimeter, FERMILAB-TM-1769 (1992). [CrossRef]
  36. R. Wigmans, et al., Dual-Readout Calorimetry for the ILC - A University Program of Accelerator and Detector Research for the International Linear Collider (vol. III) FY 2005 - FY 2007 also at: http://www.hep.uiuc.edu/LCRD/LCRD _UCLC_proposal_FY05/6_16_Wigmans_LCRD1.
  37. The glass proposed for this project is SF57HHT produced by Schott Glasswerke (Mainz, germany). All simulations have been performed using the corresponding chemical and optical parameters as provided by the manifacturer.
  38. C. Gatto, “The software system for the 4th Concept experiment”. 4th Concept Collaboration internal document, 2006.
  39. http://aliweb.cern.ch/Offline.
  40. S. Agostinelli et al., Nucl. Instr. and Meth. A 506 (2003), p. 250.
  41. http://root.cern.ch/drupal/content/vmc.
  42. M.P. Guthrie, R.G. Alsmiller and H.W. Bertini, Nucl. Instr. and Meth. 66 (1968), p. 29.
  43. J. V. JELLEY,Čerenkovradiation and its applications, Br. J. Appl. Phys. 6 (1955),p. 227.
  44. We simulated the SiPM’s produced at FBK, Trieste, in 2010. They kindly which provided the PDE tables.
  45. Investigation of a Crystal Calorimeter Technology with longitudinal Segmentation, Diploma thesis, Humbolt University at BERLIN, 2004.
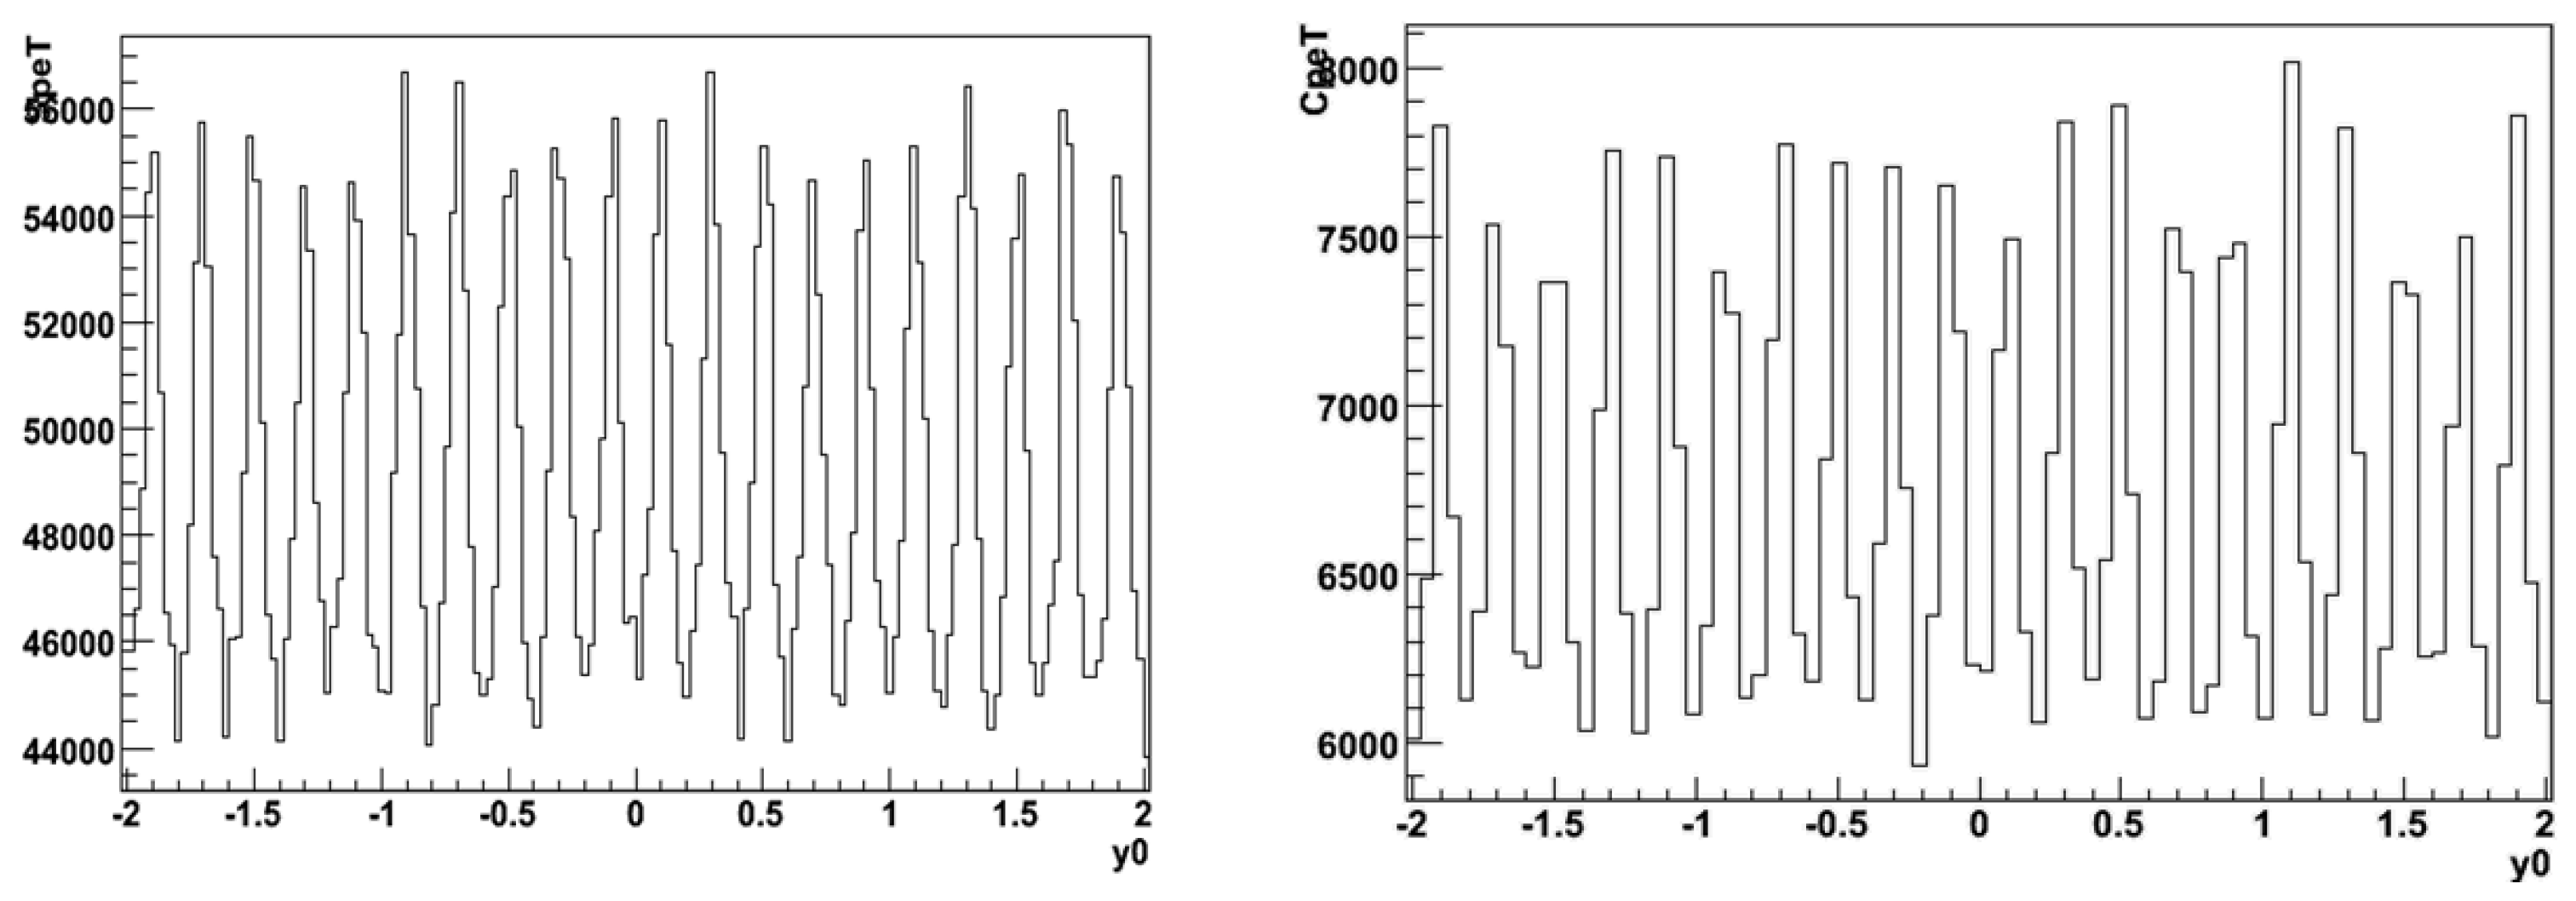
Figure 1. Number of photoelectrons from scintillating (left) and quartz (right) fibers vs impinging point for 40 GeV electrons in a brass based sampling dual-readout calorimeter with 1 mm fiber spacing (ILCroot simulation).
Preprints 114891 g001
Figure 2. Scatter plot of Čerenkov and scintillating signals for 40 GeV π in a brass-based sampling dual-readout calorimeter with 1 mm fiber spacing (ILCroot simulations). Refer to text for explanation of the symbols.
Preprints 114891 g002
Figure 3. Scatter plot of the Čerenkov signal (A.U.) and the fraction of energy deposited by neutrons in a shower generated by a 45 GeV π  (ILCroot simulation).
Preprints 114891 g003
Figure 4. Time distribution of scintillating light of protons (left plot) and neutrons (rigth plot) for a 100 GeV π impinging onto a fiber calorimeter. The x-axis is in nsec[29].
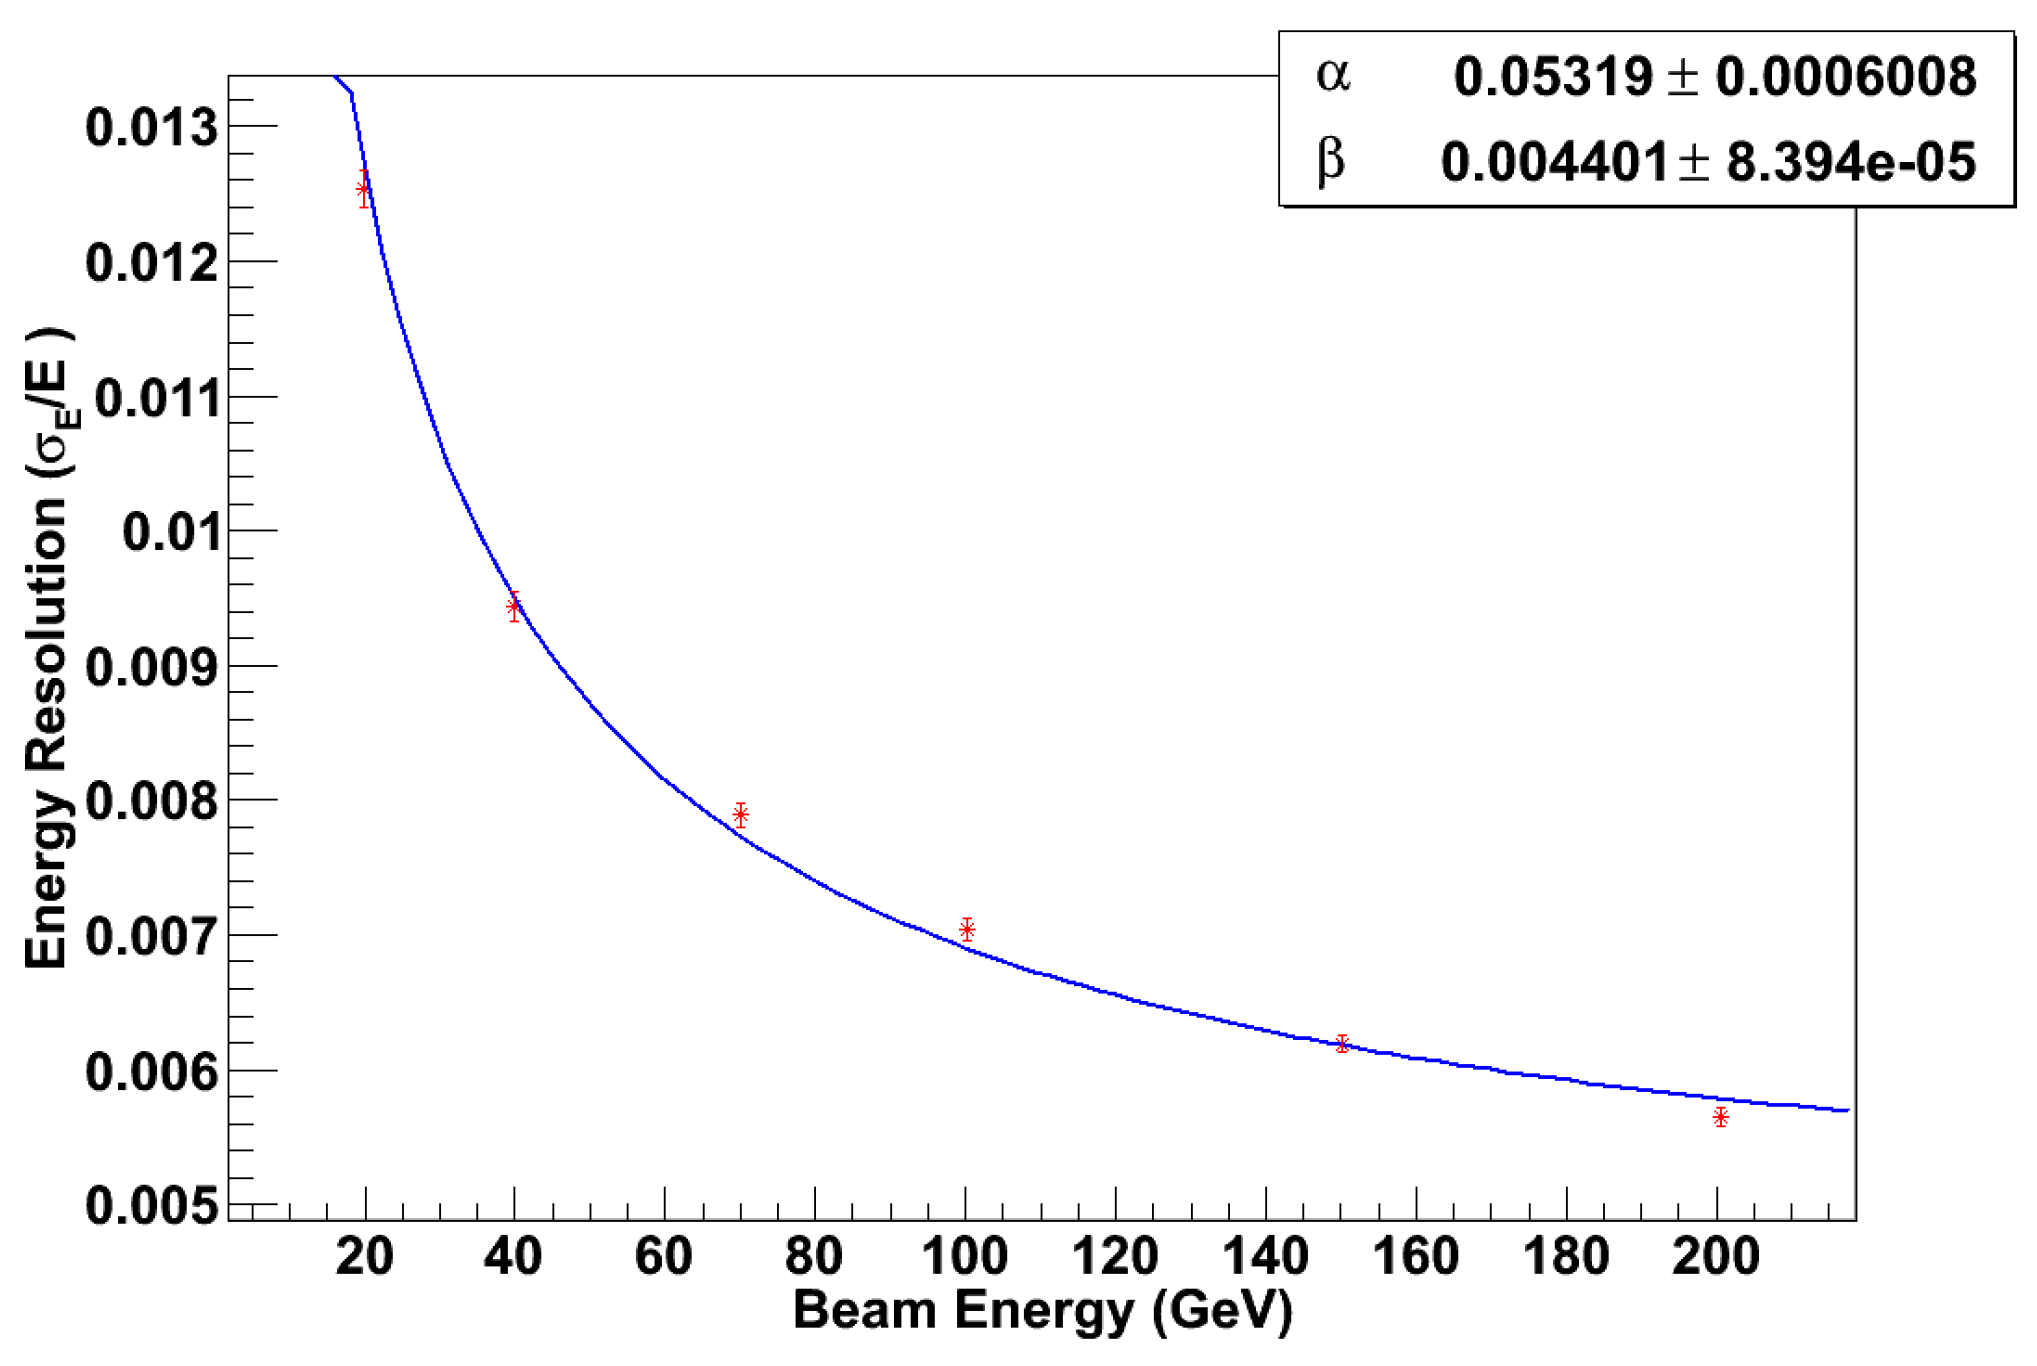
Preprints 114891 g004
Figure 5. Neutron capture cross section vs energy for natural Gd (IRDFF 1.0) (left) and radiative photon spectrum (from Ref. [21])
Preprints 114891 g005
Figure 6. Refractive index of several lead glasses candidates as active absorber for A D R I A N O .
Preprints 114891 g006
Figure 7. Attenuation length of several lead glasses candidates as active absorber for A D R I A N O .
Preprints 114891 g007
Figure 8. Individual module layout of the A D R I A N O module.
Preprints 114891 g008
Figure 9. Absorption and emission spectra of BCF-92A WLS fibers.
Preprints 114891 g009
Figure 10. Quantum efficiency of the BKF SiPM simulated in ILCroot.
Preprints 114891 g010
Figure 11. Development of a typical shower induced by a 40 GeV pion impinging on the A D R I A N O calorimeter.
Preprints 114891 g011
Figure 12. Longitudinal (left) and lateral (right) development of the center of gravity of the scintillating light for a typical shower induced by a 40 GeV pion in the ADRIANO calorimeter.
Preprints 114891 g012
Figure 13. Hadronic (blue) and EM (red) scintillation signal (A.U.) for showers induced by 40 GeV pion (left) and electrons (right) in the A D R I A N O calorimeter. The black histogram corresponds to the sum of the two components.
Preprints 114891 g013
Figure 14. Hadronic (blue) and EM (red) Čerenkov signal for showers induced by 40 GeV pion (left) and electrons (right) in the A D R I A N O calorimeter. The black histogram corresponds to the sum of the two components.
Preprints 114891 g014
Figure 15. Hadronic (blue) and EM (red) Čerenkov signal (A.U.) for showers induced by 40 GeV pion (left) and electrons (right) in the A D R I A N O calorimeter. The black histogram corresponds to the sum of the two components.
Preprints 114891 g015
Figure 16. Hadronic (blue) and EM (red) Čerenkov signal (A.U.) for showers induced by 40 GeV pion (left) and electrons (right) in a DRS fiber calorimeter. The black histogram corresponds to the sum of the two components.
Preprints 114891 g016
Figure 17. Scatter plot of simulated Čerenkov and scintillating signals for 40 GeV electrons in the A D R I A N O calorimeter.
Preprints 114891 g017
Figure 18. Scatter plots of S vs C for the A D R I A N O (red) and the DRS (blue) detector for 40 GeV pions.
Preprints 114891 g018
Figure 19. Scatter plots of S vs C for the A D R I A N O detector for pions with different energies impinging in the center of the module.
Preprints 114891 g019
Figure 20. t a n ( θ C / S ) values form fit to the profile of S vs C for the A D R I A N O detector for pions with different energies impinging in the center of the module.
Preprints 114891 g020
Figure 21. Corrected energy E c o r r for showers induced by 40 GeV negative pions and version (4x4) of detector layout.
Preprints 114891 g021
Figure 22. Plots of E b e a m / E c o r r for negative pions with different energies. The detector has been calibrated with two samples of pions at 40 GeV and 70 GeV.
Preprints 114891 g022
Figure 23. Coordinate rotation of the reference by the angle system ( C , S ) by the angle θ C / S . σ s c i n t and σ C are the uncertainties of the original SandC while σ E H C A L is the uncertainty on the rotated distribution.
Preprints 114891 g023
Figure 24. Energy resolution of five ADRIANO layouts for showers induced by negative pions of different energies. Several detector layouts are considered. Fits with formula 16 are superimposed to individual points.
Preprints 114891 g024
Figure 25. Plots of E b e a m / E c o r r in A D R I A N O for negative pions with different energies. Several detector layouts are considered.
Preprints 114891 g025
Figure 26. Average time distribution of the scintillating signal for 40 GeV negative pions. The exponential fit superimposed to the distribution has two different characteristic times.
Preprints 114891 g026
Figure 27. Standard deviation of corrected energy E c o r r T R for showers induced by negative pions with different energies. Several detector layouts are considered. Fits to curves described by Eq. 16 are superimposed to individual points.
Preprints 114891 g027
Figure 28. Estimated energy E c o r r for showers induced by 40 GeV negative pions in a 180 cm long A D R I A N O module.
Preprints 114891 g028
Figure 29. ( E f o r w a r d E b a c k w a r d ) / ( E f o r w a r d + E b a c k w a r d ) plotted versus the center of gravity of the light produced in showers induced by 40 GeV negative pions.
Preprints 114891 g029
Figure 30. Uncertainty on the CoG of a shower estimated with the light division method for different energies of the pion.
Preprints 114891 g030
Figure 31. ( E c o r r E b e a m ) / E b e a m vs η F B for 40 GeV negative pions impinging on a 180 cm long ADRIANO module.
Preprints 114891 g031
Figure 32. E c o r r E b e a m vs η F B for 100 GeV negative pions for a 180 cm long detector module after correction for longitudinal leakage.
Preprints 114891 g032
Figure 33. Hadronic energy resolution for a 180 cm long ADRIANO triple-readout module after correction for longitudinal leakage. The individual points are fitted with curve described in formula 20
Preprints 114891 g033
Figure 34. E c o r r for 40 GeV electrons impinging with an angle of 3 o on a 180 cm long module.
Preprints 114891 g034
Figure 35. C signal for 40 GeV electrons impinging with an angle of 3 o on a 180 cm long module.
Preprints 114891 g035
Figure 36. C S 20 for 40 GeV electrons (red) an negative pions (blue) in a 180 cm long module.
Preprints 114891 g036
Figure 37. R 20 for 40 GeV electrons (red) an negative pions (blue) in a 180 cm long A D R I A N O module.
Preprints 114891 g037
Figure 38. Energy resolution for electrons after PID selection in a 180 cm long detector module after correction for longitudinal leakage. The individual points are fitted with curve described in formula 16. See text for further details.
Preprints 114891 g038
Table 1. Layout details of the A D R I A N O modules studied in the text.
Detector SciFib SciFib WLS WLS Capillary Capillary
Layout diam. pitch diam. pitch Mat. thick
[mm] [mm] [mm] [mm] [ μ m]
A D R I A N O 2x2 1.0 2.0 1.4 4.0 steel 150
A D R I A N O 3x3 1.0 3.0 1.4 4.0 steel 150
A D R I A N O 4x4 1.0 4.0 1.4 4.0 steel 150
A D R I A N O 5x5 1.0 5.0 1.4 4.0 steel 150
A D R I A N O 6x6 1.0 6.0 1.4 4.0 steel 150
A D R I A N O 4x4_2 1.0 4.0 1.4 4.0 steel 200
A D R I A N O 4x4_3 1.4 4.0 1.4 4.0 steel 150
A D R I A N O 4x4_4 2.0 4.0 1.4 4.0 steel 150
Table 2. Summary of raw detector response (average photoelectrons/GeV) for different layouts of an A D R I A N O module. Results for a DRS module are included for comparison. See text for details.
Detector hadr EM Tot hadr EM Tot Tot Tot η S η C
Layout p e S π p e S π p e S π p e C π p e C π p e C π p e S e p e C e
A D R I A N O 2x2 630.6 424.8 1055.4 265.7 60.6 326.3 1109.7 479.4 1.485 4.384
A D R I A N O 3x3 251.3 180.5 431.8 287.6 66.8 354.3 447.9 511.7 1.392 4.308
A D R I A N O 4x4 146.1 109.2 255.3 285.1 68.3 353.4 279.2 513.2 1.338 4.176
A D R I A N O 5x5 93.0 70.6 163.6 282.8 69.1 351.9 178.7 507.9 1.317 4.094
A D R I A N O 6x6 70.3 54.3 124.5 279.7 68.5 348.2 137.2 498.3 1.296 4.081
A D R I A N O 4x4_2 139.7 107.9 247.6 273.6 66.4 340.0 261.4 493.2 1.295 4.122
A D R I A N O 4x4_3 296.5 211.7 508.3 282.6 67.1 349.7 527.5 509.4 1.400 4.208
A D R I A N O 4x4_4 648.8 442.0 1090.8 270.5 63.9 334.5 1132.7 497.2 1.468 4.230
DRS Ref.[13] 126.5 79.8 206.3 6.4 1.1 7.4 231.7 11.3 1.584 5.944
Table 3. Fit parameters to Eq. 16 for different A D R I A N O layouts. See text for details.
Detector Fit. par. Fit. par. Fit. par.
Layout α β χ n o r m 2
A D R I A N O 2x2 0.23 0.014 14.37
A D R I A N O 3x3 0.29 0.022 4.95
A D R I A N O 4x4 0.35 0.022 2.53
A D R I A N O 5x5 0.43 0.022 2.08
A D R I A N O 6x6 0.48 0.028 1.58
A D R I A N O 4x4_2 0.36 0.020 5.89
A D R I A N O 4x4_3 0.31 0.018 7.33
A D R I A N O 4x4_4 0.27 0.020 1.42
Table 4. Fit parameters to Eq. 16 for several A D R I A N O layouts operated in triple-readout mode. See details in the text.
Detector Fit. par. Fit. par.
Layout a b
A D R I A N O 2x2 0.22 0.004
A D R I A N O 3x3 0.27 0.005
A D R I A N O 4x4 0.31 0.012
A D R I A N O 5x5 0.36 0.016
A D R I A N O 6x6 0.39 0.022
Disclaimer/Publisher’s Note: The statements, opinions and data contained in all publications are solely those of the individual author(s) and contributor(s) and not of MDPI and/or the editor(s). MDPI and/or the editor(s) disclaim responsibility for any injury to people or property resulting from any ideas, methods, instructions or products referred to in the content.
Copyright: This open access article is published under a Creative Commons CC BY 4.0 license, which permit the free download, distribution, and reuse, provided that the author and preprint are cited in any reuse.
Prerpints.org logo

Preprints.org is a free preprint server supported by MDPI in Basel, Switzerland.

Subscribe

© 2024 MDPI (Basel, Switzerland) unless otherwise stated