
Submitted:
10 August 2024
Posted:
12 August 2024
You are already at the latest version
Abstract
Expansins are cell wall (CW) proteins that mediate the CW loosening and regulate salt tolerance in a positive or negative way. The transcription of Populus trichocarpa expansin A6 (PtEXPA6) was downregulated upon prolonged duration of salt stress (48 h) after a transient increase induced by NaCl (100 mM). The role of PtEXPA6 in salt tolerance was determined by transferring the PtEXPA6 gene into the hybrid species Populus alba × P. tremula var. glandulosa clone 84K (84K) and Populus tremula × P. alba INRA '717-1B4' (717-1B4). The PtEXPA6-transgenic poplars of 84K and 717-1B4 showed a greater reduction in photosynthesis, stem height and diameter growth under salt stress and a reduced capacity for ROS scavenging by antioxidant enzymes, which is associated with excessive Na+ accumulation in roots and shoots. NMT flux recordings showed that the radial translocation of Na+ salt into the root xylem and real-time Na+ translocation from roots to leaves were greater in PtEXPA6-transgenic poplars than in wild-type poplars. Analysis of comparative contractility and comparative extensibility of intact root tips indicated that PtEXPA6 increased the CW loosening in the transgenic poplars of 84K and 717-1B4. Noteworthy, the PtEXPA6-promoted CW loosening was shown to facilitate radial and longitudinal transport of Na+ in transgenic poplars. We conclude that overexpression of PtEXPA6 leads to CW loosening that facilitates radial translocation of Na+ into the root xylem and subsequent Na+ translocation from roots to leaves, resulting in excessive Na+ accumulation and consequently reduced salt tolerance in transgenic poplars.
Keywords:
Populus
; expansin
; cell wall loosening
; comparative contractility
; comparative extensibility
; Na+ fluxes
; photosynthesis
; SOD
; POD
; CAT
1. Introduction
The cell wall proteins expansins (EXPs) mediate cell wall loosening by breaking the hydrogen bonds between cellulose microfibrils and matrix polymers [1,2]. In addition to regulating wall extension during plant growth, expansins are also involved in plant responses to various environmental stresses such as cold, drought, salt and osmotic stress [3]. Much attention has been paid to the role of expansins in stress physiology, and there is now considerable experimental evidence that expansins may mediate the plant response to salinity. When wheat plants were exposed to salt stress, TaEXPA3-A, TaEXPB2-A, TaEXPB4-A, TaEXPB10-A, and TaEXPA9-A were upregulated in leaves, and TaEXPB4-A, TaEXPB10-A, and TaEXPA6-A showed significantly upregulated expression in roots [4]. Overexpression of tobacco NtEXPA4 was shown to confer salt and drought tolerance, while RNAi mutants exhibited increased hypersensitivity to salinity [5]. The grass AstEXPA1 gene improved performance of transgenic tobacco plants under salt stress [6]. Similarly, AtEXP2 overexpression may confer greater tolerance to salt and osmotic stress in Arabidopsis seed germination [7]. Recently, the expansin gene SmEXPA23 from Salix matsudana and the expansin gene PttEXPA8 from Populus tomentosa also increase the salt tolerance of plants [8,9].
There is increasing evidence that expansins modulate morphological and anatomical features to confer salt tolerance in various species. NtEXPA11-overexpressed plants had significantly larger pith and parenchyma cells compared to the wild type (WT) [10]. Overexpression of RhEXPA4 leads to several changes in the epidermal structure of leaves that respond to abiotic stress, e.g. smaller, compact cells, fewer stomata and midvein vascular patterning in leaves [11]. In addition, OsEXPA7 overexpression increases cell size and number in the leaf and elongation of metaxylem cells in the root, which may be involved in improving CW loosening and salt tolerance [12]. Similarly, RhEXPA4-transgenic plants had more lateral roots and longer primary roots under salt stress [11]. It is assumed that the expansin-mediated CW loosening and cell elongation reduces Na+ concentration in the cytoplasm and vacuoles, due to the increased water uptake [12]. Expansins have been shown to increase salt tolerance by improving the plant water status, ionic relationships and ROS homeostasis under saline conditions. For example, overexpression of TaEXPB23 in tobacco improved salt tolerance by decreasing osmotic potential and increasing water retention ability [13]. The Ectopic expression of wheat expansin gene TaEXPA2 in tobacco improved salt tolerance by regulating water status, antioxidant defence, and Na+/K+ balance [14]. Chenopodium quinoa expansin 50 (CqEXPA50) could promote the accumulation of photosynthetic pigment and activating enzymatic and non-enzymatic antioxidant systems [15]. Similarly, OsEXPA7 overexpression resulted in a reduction of Na+ and ROS, and an accumulation of K+ in the leaves and roots under salt stress [12].
In contrast to the increase in salinity tolerance, there is also evidence that expansins negatively influence the response of plants to salinity. Overexpression of two typical Arabidopsis α- and β-expansin genes, AtEXP3 and AtEXPβ1, resulted in increased sensitivity to salt stress. Although an increased peroxidase activity was observed in both AtEXP3- and AtEXPβ1-overexpressed seedlings, their overexpression can lead to deleterious defects in growth and development [16]. It has also been shown that excessive AtEXPA1 expression could disrupt cell wall organisation and lead to growth reduction, which facilitates plant adaptation to environmental stress [17]. In addition, the expression of Festuca arundinacea EXPA7 decreased by 74-82% in the fast-growing genotype ‘K-310' and the slow-growing genotype 'Bonsai' under salt stress [18]. It is therefore possible that salinised plants downregulate the transcription of expansins to reduce CW loosening and plant growth under unfavourable conditions. However, this needs to be clarified by further investigations.
In this study, we observed a downregulated transcription of expansin A6 (PtEXPA6) in Populus trichocarpa after a prolonged duration of salt stress. The role of PtEXPA6 in salt tolerance was determined by transferring the PtEXPA6 gene into the hybrid species, Populus alba × P. glandulosa var. glandulosa (84K) and Populus tremula × P. alba INRA '717-1B4'. Our results showed that overexpression of PtEXPA6 reduced plant growth and photosynthetic capacity, which is associated with excessive Na+ accumulation and reduced ability for ROS scavenging. Using NMT microelectrodes, the radial translocation of Na+ salt into the root xylem and the real-time translocation kinetics of Na+ from roots to leaves were investigated in wild-type and transgenic poplars. Moreover, the PtEXPA6-promoted cell wall loosening and the relevance to apoplastic Na+ transport was examined using the root tips of WT and transgenic poplars. We hypothesize that overexpression of PtEXPA6 leads to loosening of the cell walls, facilitating radial translocation of Na+ into the root xylem and subsequent Na+ translocation from roots to leaves, resulting in excessive Na+ accumulation and reduced salt tolerance in transgenic poplars of 84K and 717-1B4.
2. Results
2.1. Expression of PtEXPA6 in Root and Shoot of Populus trichocarpa
The transcription level of PtEXPA6 in P. trichocarpa fluctuated during the observation period of salt stress (100 mM NaCl, 48 h). The expression of PtEXPA6 was transiently upregulated in the leaves and peaked after 6 hours of salt treatment, followed by a rapid decrease to a level below that of the controls after 24 hours (Figure 1). PtEXPA6 expression then stabilised at the end of the salt treatment (48 hours) and remained below the pre-treatment level (Figure 1). In the roots and stems, the NaCl-altered transcription of PtEXPA6 was similar to that in the leaves, with an initial upregulation at 3 hours, followed by a significant decrease at 6 hours, and stabilised at a level lower than that of the controls (Figure 1).
2.2. Homologous Sequence Analysis of PtEXPA6
The coding sequence (CDS) of PtEXPA6 is 789bp in length, encoding 266 amino acids. The translated protein sequence has a molecular weight of 28.38 kDa and an isoelectric point of 9.79 (Figure 2A). Phylogenetic analysis revealed that PtEXPA6 is evolutionarily closely related to PeEXPA6 in P. euphratica, but more distantly related to AtEXPA6 in Arabidopsis thaliana (Figure 2B).
2.3. Overexpression of PtEXPA6 in Poplars
The downregulation of PtEXPA6 following NaCl treatment suggests that it is involved in the response of P. trichocarpa to salt stress. To investigate the regulatory effects of PtEXPA6 under saline conditions, we overexpressed PtEXPA6 in hybrid poplars of 84K and 717-1B4. PCR assay revealed different expression of PtEXPA6 in transgenic lines of 84K and 717-1B4 (Figure 3A). Western blot analysis confirmed five transgenic lines of 84K and six transgenic lines of 717-1B4 with higher expression levels, three of which were selected for further investigation, i.e. L11, L12 and L13 for 84K poplar and L9, L15 and L16 for 717-1B4 poplar (Figure 3).
2.4. Effect of Salinity on Shoot Growth of PtEXPA6-Overexpressed Poplars
The NaCl effects on stem height and diameter growth were investigated by exposing WT and PtEXPA6-overexpressed poplars to 100 mM NaCl for 15 days. Under normal growth conditions, there was no significant difference in plant height and ground diameter between wild type and transgenic lines (Figure 4A). However, the WT and transgenic lines of 84K and 717-1B4 showed significantly reduced growth after salt treatment, with the growth of the transgenic lines being more suppressed (Figure 4B,C). In comparison, the transgenic poplars of 717-1B4 showed a greater reduction in plant height and ground diameter under salt stress than the transgenic poplars of 84K (Figure 4).
2.5. Effect of Salinity on Photosynthesis of PtEXPA6-Overexpressing Poplars
The salt-restricted growth of the transgenic poplars was related to the reduced photosynthetic capacity. Leaf gas exchange and chlorophyll fluorescence were analysed in the WT and transgenic lines of 84K and 717-1B4. After 15 days of salt stress, the net photosynthetic rate (Pn) decreased more in the transgenic lines of 84K (L11, L12, L13) and 717-1B4 (L9, L15, L16) compared to the WT (Figure 5A). The decrease of transpiration rate and stomatal conductance were also more pronounced in the transgenic lines than in the WT (Figure 5). Chlorophyll fluorescence measurements showed a decrease in relative electron transport rate (ETR), actual photosynthetic quantum yield (YII) and maximum photochemical PSII efficiency (Fv/Fm) due to NaCl stress; however, the decrease was less pronounced in WT compared to the transgenic poplars, in particular, the 717-1B4 (Figure 6).
2.6. The Activity and Transcription of Antioxidant Enzymes
The ability to control ROS is critical for plant adaptation to saline environments. The activities of superoxide dismutase (SOD), peroxidase (POD), and catalase (CAT) were examined in WT and transgenic lines of 84K and 717-1B4 under salt stress. Activities of the antioxidant enzymes increased significantly in all genotypes tested under salt stress (100 mM NaCl), although the increase was lower in the transgenic lines than in WT (Figure 7A–C). In addition, the relative electrolyte leakage (REL) of each genotype was evaluated under control and salt treatments. The REL showed no significant difference between the genotypes tested under normal conditions, but a significant increase in the transgenic lines compared to WT after salt treatment (Figure 7D).
In this study, we analysed the transcription of SOD[Cu-Zn], CAT1 and PODa2 in leaves of WT and transgenic poplars. After salt treatment, the transcript levels of CAT1 and PODa2 increased significantly in WT poplars and the transgenic lines of 84K and 717-1B4, although the up-regulation of CAT1 and PODa2 was not as pronounced as observed in WT poplars (Figure 8). Conversely, the transcription level of SOD[Cu-Zn] was decreased in the salt-exposed poplars (Figure 8). And the transgenic lines 84K and 717-1B4 showed a greater decrease than the WT under the salt treatment (Figure 8).
2.7. Na+ Content in Roots, Stems and Leaves of Transgenic Poplars
Maintaining the Na+ homeostasis is crucial for poplar adapting to salt stress [19]. The content of Na+ ions in roots, stems and leaves was analysed in the WT and transgenic poplars of 84K and 717-1B4. Under salt-free conditions, the Na+ content in roots, stems and leaves of the 84K poplar was low, with no significant difference between the WT and transgenic lines (Figure 9). However, Na+ content increased significantly in roots, stems and leaves of 84K poplars after salt treatment, and the PtEXPA6-trangenic lines, L11, L12 and L13, had significantly higher Na+ content than the WT (Figure 9). Similar trends were observed in 717-1B4 poplar, where Na+ content in roots, stems and leaves of PtEXPA6-trangenic lines L9, L15 and L16 was higher than that of WT under salt stress (Figure 9). In comparison, Na+ accumulation in the transgenic 717-1B4 poplar was 10-20% higher than in the transgenic poplar of 84K (Figure 9).
2.8. Comparative Contractability and Comparative Extensibility of Root Cell Walls
Expansins are cell wall (CW) proteins to mediate CW loosening by breaking the hydrogen bonds between cellulose microfibrils and matrix polymers [1,2]. The PtEXPA6-promoted CW loosening was determined by measuring comparative contractability and comparative extensibility using intact root tips of WT and transgenic poplars [20,21]. The comparative contractility of intact root tips was measured after exposure to 300 mOsmol kg-1 mannitol treatment (-0.75 MPa-1) and expressed in µm min−1 0.75 MPa−1. Comparative root extensibility values were obtained for intact roots by determining the initial (1 min) increase in root elongation rate induced by an 0.1 MPa osmotic jump [20,21]. Our results show that overexpression of PtEXPA6 in 84K and 717-1B4 led to an increased root contractability (8.1-8.7 μm min-1 0.75MPa-1), compared to the WT (6.0-6.8 μm min-1 0.75MPa-1). Moreover, PtEXPA6 overexpression in also increased the root comparative extensibility (7.3-7.9 μm min-1 0.1MPa-1), compared to the WT (5.4-6.0 μm min-1 0.1MPa-1) (Figure 10). Therefore, the elevated comparative contractability and comparative extensibility indicates PtEXPA6 increased cell wall loosening in transgenic poplars.
2.9. Na+ Flux of Root Xylem and the Response to Osmotic Jump
The greater Na+ accumulation in transgenic poplars mainly results from the salt uptake a transport in roots and the root-to-shoot salt transport [19,22]. The restriction of salt radial translocation in roots is crucial to control root-to-shoot salt transport [23,24,25]. Using NMT microelectrodes the Na+ flux of root xylem was measured in the salt-stressed poplars, as the Na+ flow in root xylem can reflect the radial transport of Na+ in roots. After a short-term salt exposure, the xylem Na+ efflux of the two poplars drastically increased with higher flux rate in PtEXPA6-overexpressing lines (Figure 11). Under no-salt control conditions, the Na+ flux in root xylem of 84K and 717-1B4 was very low or undetectable, and there is no significant difference between the WT and transgenic lines (Figure 11). The greater Na+ efflux in the xylem indicates that transgenic poplars exhibited a lower capacity to restrict radial translocation of Na+ salt to the xylem under saline conditions. Noteworthy, we observed that the PtEXPA6-promoted CW loosening facilitated the radial translocation of Na+ in roots. The PtEXPA6-promoted radial translocation of Na+ in roots were marked restricted by the addition of 300 mOsmol kg-1 mannitol (osmotic potential is -0.75 MPa-1, Figure 11), which induces contraction and hardens the cell walls (Figure 10) [26,27]. We noticed that the Na+ flux of xylem in the contracted roots was resumed after an 0.1 MPa osmotic jump (Figure 11), which induces extension of the cell walls (Figure 10) [26,27]. This Na+ kinetics upon an osmotic jump demonstrated that CW loosening favours the radial Na+ transport, while a CW contraction restricts the Na+ transport in poplar roots.
2.10. Na+ Flux of Leaf Petiole Vascular Bundles and the Response to Osmotic Jump
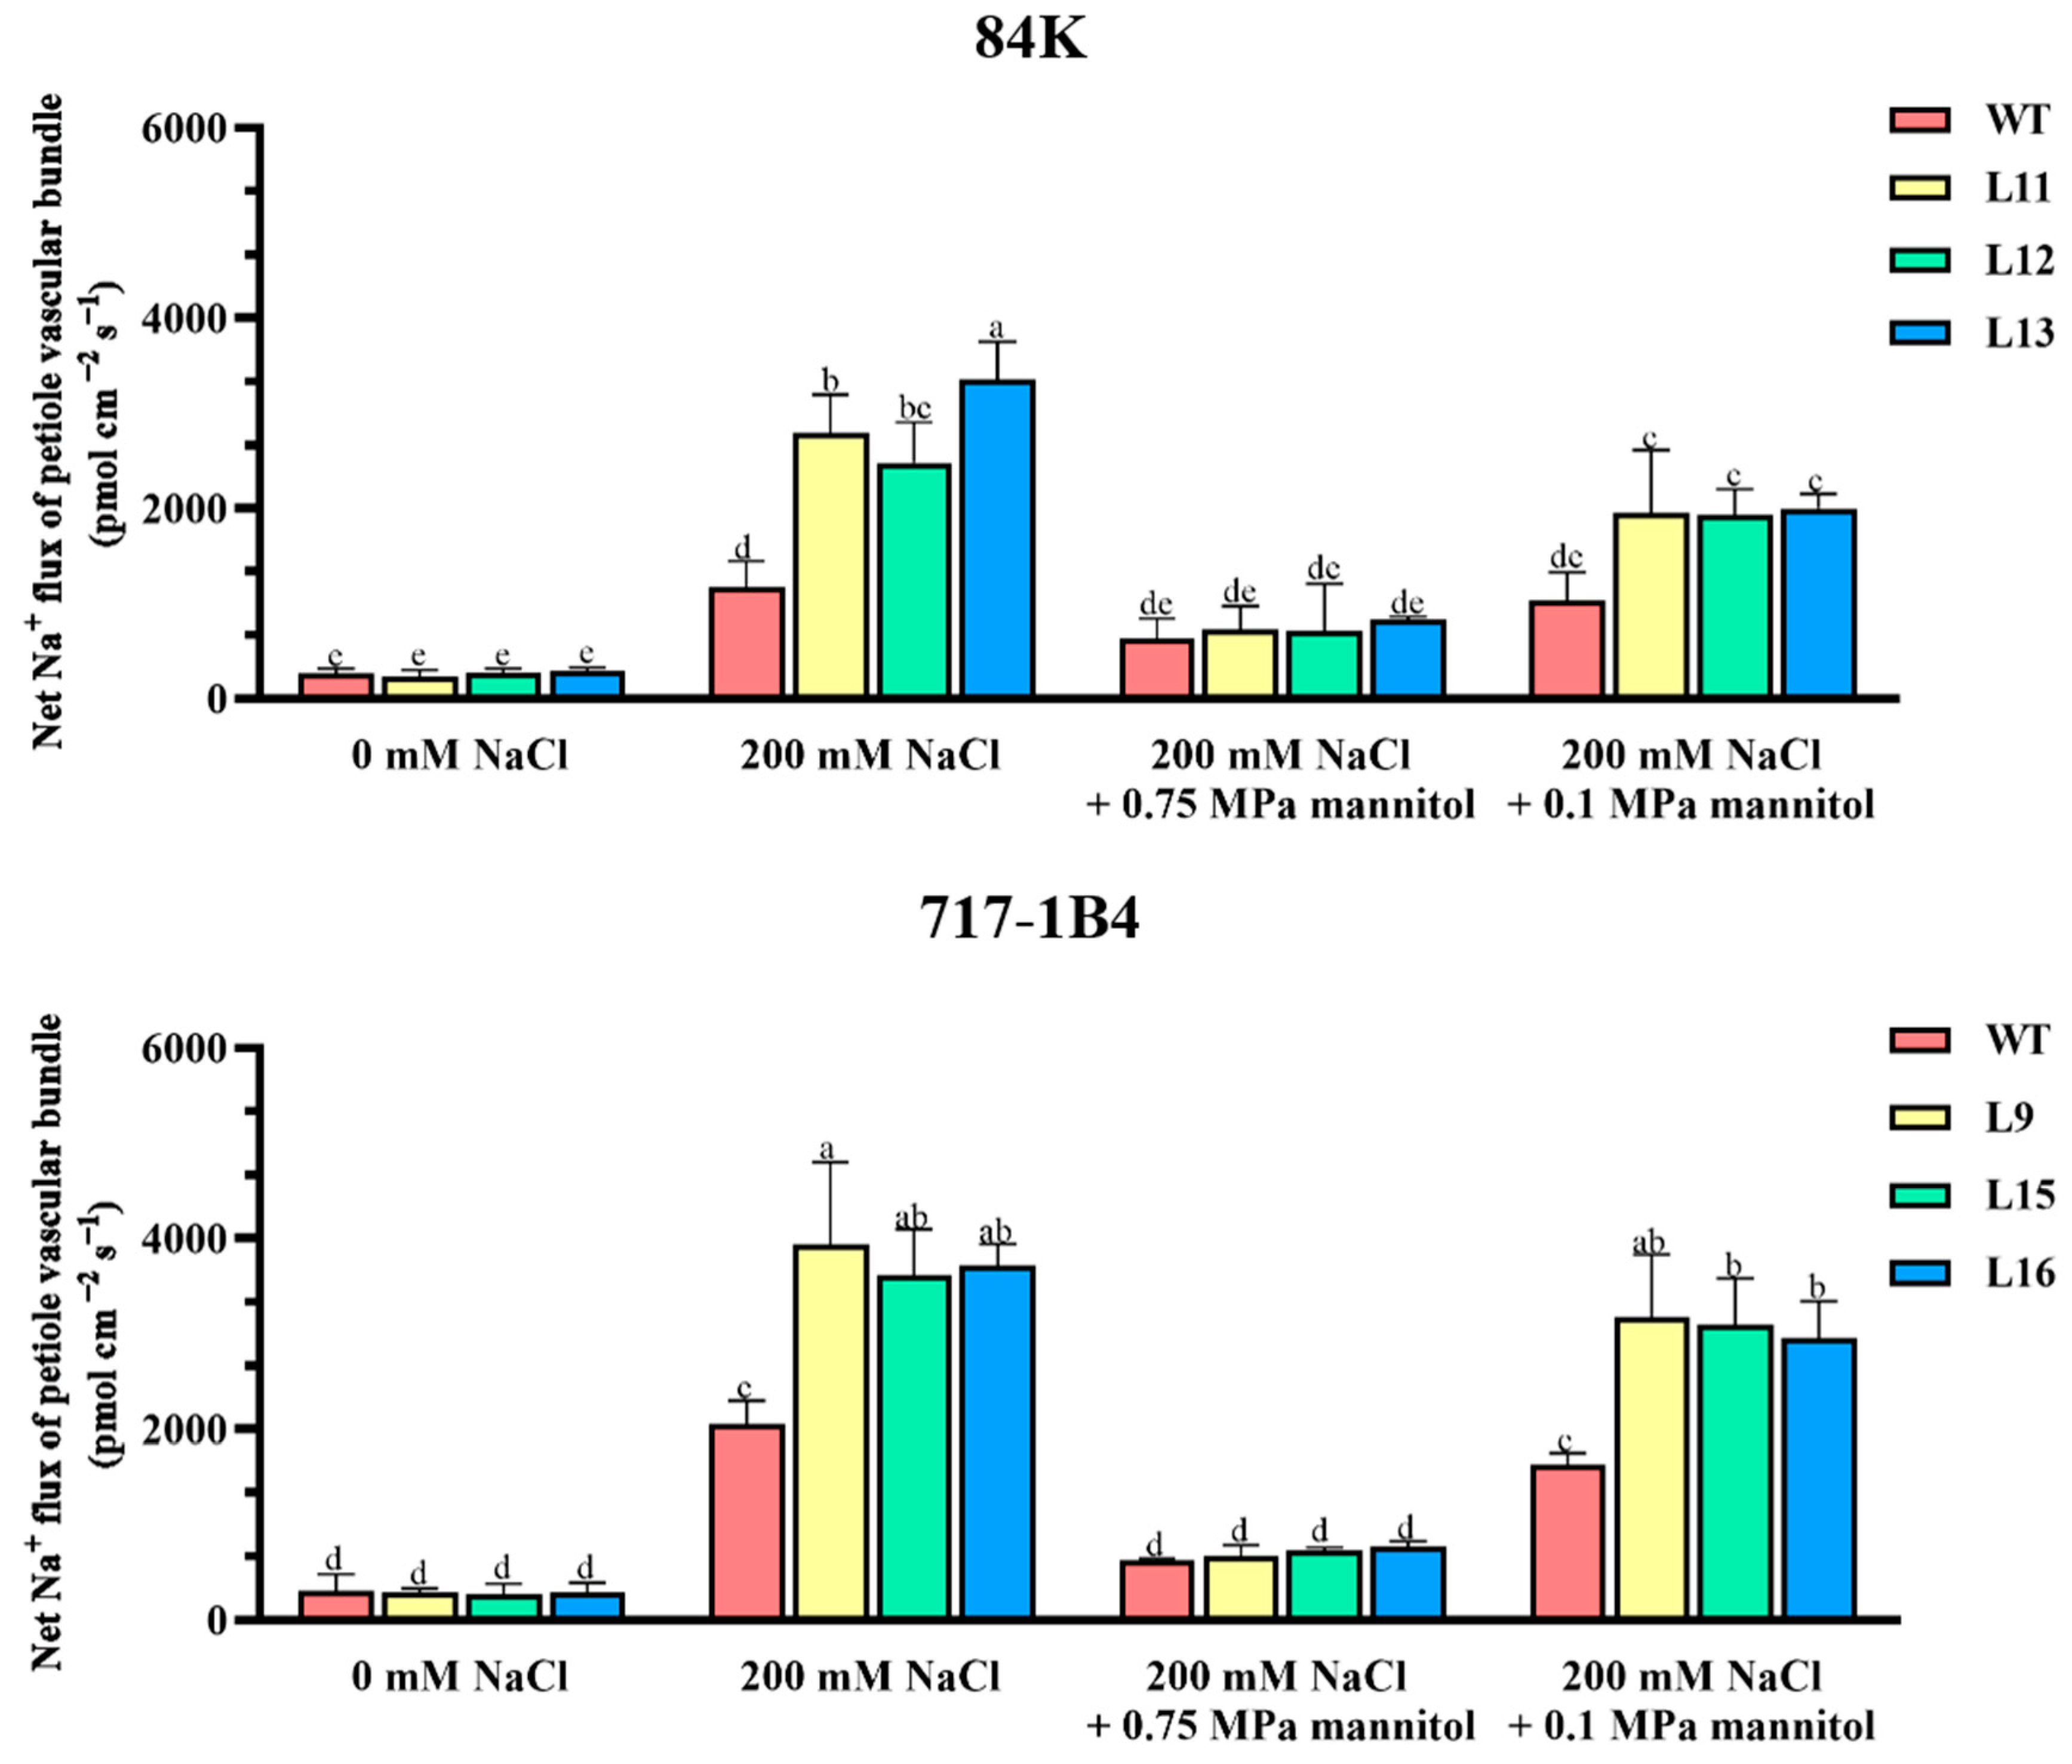
Radial translocation of Na+ salt to the xylem would result in a higher rate of salt transport to the shoots. Thus, the Na+ flux of vascular bundles in the leaf petiole was examined to determine the real-time Na+ translocation kinetics from the roots to the leaves [28]. The roots of intact plants were subjected to a short-term salt exposure, the leaf petiole was immobilized in the measuring chamber after leaf blade was removed. The Na+ flux of vascular bundles in the leaf petiole was immediately measured with NMT microelectrodes. The xylem Na+ efflux of vascular bundles drastically increased in the two salinized poplars with higher flux rate in PtEXPA6-overexpressing lines (Figure 12). Under no-salt control conditions, the Na+ flux in leaf vascular bundles of 84K and 717-1B4 was very low or undetectable, and there is no significant difference between the WT and transgenic lines. We also found that the PtEXPA6-promoted cell wall loosening facilitated the root-to-shoot Na+ transport. The Na+ flux of vascular bundles in the leaf petiole were restricted by 300 mOsmol kg-1 mannitol, while the Na+ flux was markedly recovered upon an 0.1 MPa osmotic jump (Figure 12). The real-time Na+ translocation kinetics upon an osmotic jump demonstrated that CW loosening favours the Na+ transport from the roots to the leaves, while a CW contraction restricts the root-to-shoot Na+ transport.
3. Discussion
3.1. PtEXPA6 Negatively Regulates Salt Tolerance in Transgenic Poplars
PtEXPA6 transgenic lines of 84K and 717-1B4 showed a more pronounced reduction in stem height and diameter growth compared to WT poplars after 15 days of exposure to 100 mM NaCl (Figure 4). The salt-reduced growth was associated with a drastic reduction in the photosynthetic capacity of the transgenic poplars (Figure 5). Thus, PtEXPA6 increases the salt sensitivity of the transgenic poplars of both 84K and 717-1B4. This is consistent with the Arabidopsis expansin genes, AtEXP3 and AtEXPβ1, which resulted in increased sensitivity to salt stress [16]. However, these results are inconsistent with the finding that overexpression of NtEXPA4 [5], AstEXPA1 [6], AtEXP2 [7], SmEXPA23 [8], PttEXPA8 [9] and CqEXPA50 [15] increased the salt tolerance of the transgenic plants. These contrasting results suggest that expansin proteins play different roles in regulating plant responses to salinity. The pattern of PtEXPA6 transcription contrasts with that of salt-induced expansins in wheat leaves and roots, such as TaEXPB2-A, TaEXPA3-A, TaEXPB4-A, TaEXPA6-A, TaEXPA9-A and TaEXPB10-A (Figure 1) [4]. Thus, the down-regulation of PtEXPA6 favours the adaptation of Populus trichocarpa to saline conditions (Figure 1). The suppression of salt tolerance by PtEXPA6 is mainly due to excessive Na+ accumulation, which resulted in a reduced ability to maintain photosynthesis and ROS homeostasis in the transgenic poplars (Figure 5, Figure 6, Figure 7 and Figure 8).
3.2. PtEXPA6 Increases Na+ Transport from Root to Shoot under Salt Stress
PtEXPA6-overexpressing lines of 84K and 717-1B4 showed greater Na+ accumulation in roots, stems and leaves compared to WT poplars (Figure 9). The accumulation of Na+ ions was due to increased radial salt translocation in the roots and subsequent salt transport from the root to the shoot. The NMT data showed that the Na+ efflux of the root xylem increased dramatically in the PtEXPA6-overexpressing lines of both poplars (Figure 11). This indicates that the transgenic poplars had a reduced ability to limit the radial translocation of Na+ into the xylem under salt stress. The increased radial translocation of Na+ salt into the xylem would lead to a higher rate of salt transport to the shoots, as the Na+ flux of vascular bundles in the petiole increased significantly under salt conditions (Figure 12). The PtEXPA6-stimulated Na+ translocation in roots and shoots was probably due to the CW loosening, which facilitated Na+ transport in the apoplast. In accordance, overexpression of PtEXPA6 increased the CW extensibility in poplar roots (Figure 10). The CW loosening would lead to an increase in CW volume and hydraulic conductivity, stimulating the flow of solution with high Na+ concentration. This probably increases the radial translocation of Na+ salt into the xylem and subsequent salt transport to the shoots. The apoplastic pathway has been shown to be responsible for up to 50% of the total Na+ and Cl- uptake by the root [29,30]. It is noting that the PtEXPA6-promoted radial translocation of Na+ in roots and root-to-shoot transport were both restricted by the application of 300 mOsmol kg-1 mannitol (Figure 11 and Figure 12), which induces contraction and hardening of the cell walls (Figure 10) [26,27]. Furthermore, the Na+ transport was resumed when the contracted roots were exposed to an 0.1 MPa osmotic jump (Figure 11 and Figure 12), which induces extension of the cell walls (Figure 10). Collectively, this transient Na+ kinetics in response to an 0.1 MPa osmotic jump demonstrated that CW loosening favours the apoplastic Na+ transport, while a CW contraction restricts the radial translocation of Na+ in roots and root-to-shoot transport. The wild type 84K and 717-1B4 showed a lower contractibility and extensibility than the transgenic lines, this could benefit the salt-stressed poplars to restrict radial and longitudinal transport of sodium ions (Figure 10, Figure 11 and Figure 12). Consistent with this, the long-term salt-stimulated CW stiffening, observed at high solution ionic strength, contributes to the decrease in CW swelling capacity [31]. The resulting decrease in CW volume and hydraulic conductivity restricts the flow of solution with high Na+ concentration. This probably allows the root cells to adapt to the stress conditions and prevents Na+ and Cl- from entering the xylem [32]. In our study, the Na+ transport stimulated by PtEXPA6 contradicts the findings that wheat TaEXPA2 and rice OsEXPA7 lead to a reduction of Na+ in the leaves and roots under salt stress [12,14]. These contrasting results suggest that expansin proteins play different roles in regulating the ionic relations and salt tolerance of salinised plants. It has been suggested that expansins confer this ability to remodel cell wall composition and maintain cell wall flexibility in roots under NaCl stress, contributing to improved root architecture and salt tolerance [11]. In the OsEXPA7-OX rice plants, the longer metaxylem cells in the primary roots showed that cell elongation occurs through expansin-mediated cell wall loosening [12]. Similarly, transgenic RhEXPA4 plants had longer primary roots and more lateral roots under salt stress [11]. It is assumed that the longer metaxylem cells could take up more water than the WT plants, thus reducing Na+ concentration in both the cytoplasm and vacuoles [12]. However, our results show that overexpression of PtEXPA6 leads to a loosening of the cell wall, which facilitates the radial translocation of Na+ into the root xylem and subsequent Na+ translocation from the roots into the leaves (Figure 10, Figure 11 and Figure 12). Therefore, down-regulation of PtEXPA6 would result in restriction of Na+ transport and favour Populus trichocarpa in maintaining photosynthesis and ROS homeostasis under saline conditions (Figure 5, Figure 6, Figure 7 and Figure 8).
3.3. PtEXPA6 Influences ROS Scavenging Capacity under Salt Stress
NaCl caused significant activation of antioxidant enzymes, POD, SOD, and CAT, in the WT and transgenic poplars (Figure 7). This was mainly due to the salt increased transcripts of SOD[Cu-Zn], CAT1 and PODa2 (Figure 8). However, in the salt-stressed poplars, the activity and transcription of antioxidant enzymes were typically lower in the PtEXPA6-overexpressing lines (Figure 7 and Figure 8). The less stimulated activity and transcription of antioxidant enzymes resulted in the inability to efficiently remove salt-induced ROS during long-term salinity, which enhanced the process of lipid peroxidation in the membranes. As a result, REL was significantly higher in transgenic 84K and 717-1B4 than in WT poplars (Figure 4). Our results are consistent with the finding that overexpression of wheat TaEXPA2 or Chenopodium quinoa CqEXPA50 improves the salt tolerance of transgenic plants by enhancing the enzymatic antioxidant system [14,15]. Apparently, the lower activation of antioxidant enzymes in PtEXPA6-overexpressing lines was at least partly the result of excessive accumulation of salt ions, which led to increased ROS production and decreased photosynthesis [33,34,35,36]. Consistent with this, we previously found that salt exposure in P. popularis leaves increased the activity of ascorbate peroxidase (APX), CAT, and glutathione reductase (GR) [33,34]. However, the salt-produced ROS exceeded the antioxidant capacity of the enzymatic system, leading to oxidative damage in the salt-sensitive poplars [33,34].
4. Materials and Methods
4.1. Total RNA Isolation, PtEXPA6 Cloning and Sequence Analysis
Total RNA was isolated from the leaves of Populus trichocarpa using the E.Z.N.A.TM Plant RNA Kit (Omegabiotek). The removal of genomic DNA and synthesis of the first strand of cDNA were performed using the reverse transcriptase kit HiFiScript gDNA Removal RT Master Mix (CoWin Biotech, Taizhou, China). PtEXPA6 was cloned by PCR amplification and the reaction mixture (50 µl) contained 2 µl cDNA product, 25 µl KOD One™ PCR Master Mix (TOYOBO, OSAKA, JAPAN) and 1 µl specific primers (10 µM), 5'-ATGGCAATGAGCAGTTTAA-3’ (forward) and 5'-GACCCTGAAATTCTTGCCGG-3' (reverse). Multiple sequence alignments of the EXPA proteins were performed using ClustalW (http: //www.genome.jp/tools/clustalw/, EMBL-EBI, Hinxton, Cambridgeshire, UK, accessed 18 August 2020). The phylogenetic tree was created using the software MEGA11 (http://www.megasoftware.net, the Centre for Evolutionary Medicine and Informatics, Tempe, AZ, USA, accessed 16 February 2023). The accession numbers of the expansin orthologues used for the multiple sequence alignment and phylogenetic analysis are listed in Supplementary Table 1.
4.2. Western Blotting
Western blotting of PtEXPA6 was performed as previously described [37]. In brief, total protein was isolated from leaf samples with extraction buffer (50 mM Tris-MES, pH 7.5, 80 mM NaCl, 10 mM MgCl2, 10% glycerol, 0.2% NP-40, 1 mM EDTA, 1 mM PMSF and protease inhibitor cocktail [Roche, Basel, Switzerland]). SDS-PAGE and subsequent immunoblotting were performed according to standard procedures. PtEXPA6 protein immunoblots were performed using mouse monoclonal anti-FLAG antibody (Abclonal, Wuhan, China, cat no: AE005) at 1:5000 dilution. Actin (26F7) mAb for PLANTs (Abmart, Shanghai, China, cat no: M20009L) was used to detect endogenous actin protein, which served as a loading control. Secondary HRP-conjugated Goat anti-Mouse IgG (H+L) (Abclonal, Wuhan, China, cat no: AS003) was used at 1:5000 for detection via the eECL Western Blot Kit (CoWin Biosciences, Beijing, China, cat no: CW0049S). Protein gel blots were imaged by the ChemiDoc MP system (Bio-Rad Laboratories, Inc., Hercules, CA, USA).
4.3. Comparative Extensibility and Contractility of Root Tips
To determine the loosening of the cell wall promoted by PtEXPA6, the comparative extensibility and contractility of intact root tip tissue were measured according to [20,21]. The comparative contractility was determined by assessing the initial root contraction elongation rate (1 min) induced by 300 mOsmol kg-1 mannitol (-0.75 MPa). The comparative elongation capacity of the growing tip tissue was then directly determined by an osmotic jump method. Briefly, wild-type and PtEXPA6-overexpressing lines of 84K (L11, L12, L13) and 717-1B4 (L9, L15, L16) were grown hydroponically in 1/2 MS culture medium for one week. The primary root of an intact plant was fixed on a petri dish before the addition of 300 mM mannitol (-0.75 MPa). Osmotically induced changes in the position of the growing tip began within 20 s of the addition of mannitol, and determination of the initial rate of mannitol-induced contraction was completed after 20-30 s to minimize deviation from initial conditions. The comparative contractility is the difference between the root apex length and the initial root apex length per unit time after mannitol treatment and is expressed in µm min−1 0.75 MPa−1. Comparative extensibility was then determined by assessing the 1-min initial increase in root elongation rate induced by an osmotic jump of 0.1 MPa [20]. The comparative elongation rate is the difference between the length of the apical site per unit time of elongation and the length of the initial apical site, expressed in µm min−1 0.1 MPa−1. Changes in root tip position were observed using an ML31 biomicroscope (Mshot, Guangzhou, China) and determined using an Mshot Image Analysis System. Three root tips were measured for each plant, and three independent individuals were biologically replicated for each treatment.
4.4. Phenotype Test of Salt Tolerance
4.4.1. Measurement of Growth
Uniform plants of the wild type (WT) and PtEXPA6 overexpressing lines of 84K (L11, L12, L13) and 717-1B4 (L9, L15, L16) were treated with NaCl saline (0 or 100 mM) for 15 days. Shoot height and stem diameter were measured at the end of experiment. For the WT and transgenic lines of two poplars, six individual plants were established for the control and salt treatment.
4.4.2. Measurement of the Relative Electrolyte Leakage (REL)
The upper leaves of the shoot (3rd to 8th from the top) were sampled from the WT and PtEXPA6-overexpressing lines of 84K (L11, L12, L13) and 717-1B4 (L9, L15, L16) after 15 days of NaCl treatment (0 or 100 mM). The REL was calculated from the initial relative conductivity (EC1) before boiling and the final conductivity (EC2) after boiling: REL (%) = (EC1/EC2) × 100% [7].
4.4.3. Measurement of Leaf Gas Exchange and Chlorophyll Fluorescence
Leaf gas exchange and chlorophyll fluorescence were measured after WT poplar and PtEXPA6 overexpressing lines of 84K (L11, L12, L13) and 717-1B4 (L9, L15, L16) were treated with NaCl (0 or 100 mM) for 15 days. The net photosynthetic rate (Pn), transpiration rate (E) and stomatal conductance (Cleaf) of the upper mature leaves (6th-8th from the top) were measured using a portable open gas exchange system, the LI-6400 (Li-Cor, Inc., Lincoln, NE, USA). The maximum photochemical efficiency of PSII (Fv/Fm), the actual photosynthetic quantum yield (YII) and the relative electron transport rate (ETR) were analysed with a pulse amplitude modulated (PAM) chlorophyll fluorometer, the JUNIOR-PAM (HeinzWalz GmbH, Effeltrich, Germany) [38].
4.5. Determination of Antioxidant Enzyme Activity
The WT and PtEXPA6 overexpressing lines of 84K (L11, L12, L13) and 717-1B4 (L9, L15, L16) were salinised with NaCl (0 or 100 mM) for 15 days. Samples were taken from the leaves (3rd to 8th from the top) and used to measure the total activity of antioxidant enzymes. POD, SOD and CAT activity was analysed using assay kits for POD (BC0090), CAT (BC0205) and SOD (BC0175), respectively (Beijing Solarbio Science & Technology, Beijing, China) [38].
4.6. Na+ Concentration in the Roots, Leaves and Stems
Roots, stems and leaves were collected from soil-cultured WT and PtEXPA6-overexpressing lines of 84K (L11, L12, L13) and 717-1B4 (L9, L15, L16) after 15 days of salt treatment (0 or 100 mM NaCl). The oven-dried samples (60 °C, 5 days) were digested with H2SO4-H2O2 and used for Na+ determination with an atomic absorption spectrometer (Varian SpectrAA 220FS, Palo Alto, CA, USA) [38].
4.7. Flux Records of Na+ in the Root Xylem and Leaf Petiole Vascular Bundle
The net Na+ flux in the root xylem was recorded using a non-invasive micro-test system (NMT) [39]. After short-term salt exposure (100 mM, 4 h), roots with tips and mature zones of approximately 10-15 cm in length were collected from control and salt-stressed poplars of WT and PtEXPA6-overexpressing lines 84K (L11, L12, L13) and 717-1B4 (L9, L15, L16). The roots were equilibrated for 30 minutes in a measuring solution (0.1 mM NaCl, 0.1 mM CaCl2, 0.1 mM MgCl2 and 0.5 mM KCl, pH 5.7). The selective microelectrodes for Na+ were calculated and used to monitor the net flux of Na+ in the xylem of the maturation zone. Continuous recordings were made at each measurement point for 5–8 min and the average flux at each point was calculated. Three to four individual plants of each genotype were used for flux recording. The response of root xylem Na+ flux to osmotic jump was also examined in WT and transgenic poplars. After NaCl treatment as described above, 300 mOsmol kg-1 mannitol (-0.75 MPa) was added to a measuring solution, and real-time Na+ flux was recorded in the root xylem. Thereafter, the concentration of mannitol in measuring solution was diluted to 40 mOsmol kg-1 (-0.10 MPa), and Na+ flux kinetics was immediately measured in the root xylem.
Real-time translocation kinetics of Na+ flux from vascular bundles in the petiole was performed as described previously [28]. In brief, the entire root system of intact plants was exposed to a short-term salt stress (200 mM NaCl, 2 h). Then, the petiole was immobilised in the measurement chamber after the leaf blade was removed. The Na+ flux of the vascular bundles in the petiole was immediately measured with NMT microelectrodes as described above. The response of Na+ flux in leaf petiole vascular bundles to osmotic jump was also examined in WT and transgenic poplars. After 300 mOsmol kg-1 mannitol was added to the NaCl-treated roots, and Na+ flux kinetics was observed in the leaf petiole vascular bundle. Thereafter, the concentration of mannitol was diluted to 40 mOsmol kg-1 (-0.10 MPa), and Na+ flux kinetics was immediately measured in the leaf petiole vascular bundles.
4.8. RT-qPCR Analysis
P. trichocarpa was subjected to treatment with 0 or 100 mM NaCl for 48 hours. Roots, stem and mature leaves in the upper shoot were collected after 0, 3, 6, 12, 24 and 48 hours of NaCl treatment and used for RT-qPCR analysis of PeEXPA6. The transcripts of PODa2, SOD[Cu-Zn] and CAT1 in the WT and transgenic poplars were analysed under the control and NaCl treatments (100 mM, 15 days). RNA isolation from P. trichocarpa, 84K and 717-1B4 was performed using the E.Z.N.A.TM Plant RNA Kit (Omegabiotek). Subsequently, the RNA (1 µg) was used for reverse transcription with Moloney murine leukaemia virus (M-MLV) reverse transcriptase and an oligo (dT) primer (Promega, Madison, WI, USA) according to the manufacturer's recommended protocol. RT-qPCR was performed using the LineGene 9600 Plus (Bioer Technology, Hangzhou, China) and UBQ served as an internal control for P. trichocarpa, 84K and 717-1B4 [40]. Three individual biological replicates were generated for each treatment.
4.9. Data Analysis
Na+ fluxes were calculated using JCal V3.2.1, a free MS Excel spreadsheet developed by Yue Xu (http://www.xuyue.net/, accessed 5 May 2024). All experimental data were statistically analysed using SPSS version 19.0 (IBM Corporation, Armonk, NY, USA). The one-way ANOVA method was used to compare mean values between treatments. p < 0.05 or p < 0.01 was considered a significant difference unless otherwise stated.
5. Conclusions
In summary, overexpression of PtEXPA6 reduces plant growth and photosynthetic capacity, which is due to the excessive Na+ accumulation and reduced ROS scavenging capacity. PtEXPA6-transgenic poplars exhibited a more pronounced increase in radial translocation of Na+ salt into the root xylem and translocation of Na+ from roots to leaves under salt stress. Moreover, PtEXPA6 increased the root contractability and extensibility in transgenic poplars. Therefore, we hypothesize that overexpression of PtEXPA6 results in cell wall loosening, which lead to an increase in CW volume and hydraulic conductivity, stimulating the flow of solution with high Na+ concentration. As a result, the radial translocation of Na+ into the root xylem and subsequent Na+ translocation from roots to leaves were consequently increased under salt stress, resulting in excessive Na+ accumulation and reduced salt tolerance. Therefore, the downregulation of PtEXPA6 in NaCl-treated Populus trichocarpa would lead to a restriction of Na+ accumulation, thus favouring the maintenance of photosynthesis and ROS homeostasis under saline conditions.
Supplementary Materials
TThe following supporting information can be downloaded at the website of this paper posted on Preprints.org, Table S1: Primers used for quantitative real-time PCR; Table S2: Accession numbers of EXPA orthologs.
Author Contributions
Z.L.: investigation, data curation, validation, visualization, writing—original draft. K.Y.: investigation, validation, data curation, visualization. Y.Z.: investigation, methodology, visualization. C.Y.: investigation, methodology, visualization. Z.Z.: investigation, methodology, visualization. J.L. (Jing Li): investigation, methodology. Y.L.: investigation, methodology. B.F.: investigation, methodology. R.Z.: investigation, methodology. J.L. (Jian Liu): investigation, methodology. K.D.: investigation, methodology. J.Y.: investigation, methodology. N.Z.: methodology, resources. X.Z.: resources. S.C.: conceptualization, supervision, funding acquisition, project administration, writing—review and editing. All authors have read and agreed to the published version of the manuscript.
Funding
The research was supported jointly by the National Natural Science Foundation of China (grant nos. 32371828, 32071730, and 31770643).
Institutional Review Board Statement
Not applicable.
Informed Consent Statement
Not applicable.
Data Availability Statement
The raw data supporting the conclusions of this article will be made available by the authors on request.
Conflicts of Interest
The authors declare no conflicts of interest. The funders had no role in the design of the study; in the collection, analyses, or interpretation of data; in the writing of the manuscript, or in the decision to publish the results.
References
- McQueen-Mason, S.J.; Durachko, D.M.; Cosgrove, D.J. Two endogenous proteins that induce cell wall extension in plants. Plant Cell 1992, 4, 1425–1433. [Google Scholar]
- McQueen-Mason, S.J.; Cosgrove, D.J. Disruption of hydrogen- bonding between plant cell wall polymers by proteins that induce wall extension. Proc. Natl. Acad. Sci. USA 1994, 91, 6574–6578. [Google Scholar] [CrossRef] [PubMed]
- Tenhaken, R. Cell wall remodeling under abiotic stress. Front. Plant Sci. 2015, 5, 771. [Google Scholar] [CrossRef] [PubMed]
- Han, Z.S.; Liu, Y.L.; Deng, X.; Liu, D.M.; Hu, Y.K.; Yan, Y.M. Genome-wide identification and expression analysis of expansin gene family incommon wheat (Triticum aestivum L.). BMC Genomics 2019, 20, 101. [Google Scholar] [CrossRef] [PubMed]
- Chen, L.J.; Zou, W.S.; Fei, C.Y.; Wu, G.; Li, X.Y.; Lin, H.H.; Xi, D.H. α-Expansin EXPA4 positively regulates abiotic stress tolerance but negatively regulates pathogen resistance in Nicotiana tabacum. Plant Cell Physiol. 2018, 59, 2317–2330. [Google Scholar] [CrossRef] [PubMed]
- Zhang, H.; Xu, Q.; Xu, X.; Liu, H.B.; Zhi, J.K.; Xu, J.C. Transgenic tobacco plants expressing grass AstEXPA1 gene show improved performance to several stresses. Plant Biotechnol. Rep. 2017, 11, 331–337. [Google Scholar]
- Yan, A.; Wu, M.J.; Yan, L.M.; Hu, R.; Ali, I.; Gan, Y.B. AtEXP2 is involved in seed germination and abiotic stress response in Arabidopsis. PLoS ONE 2014, 9, 1. [Google Scholar] [CrossRef] [PubMed]
- Yang, R.X.; Yang, L.H.; Wang, X.; Wang, Y.; Zhang, J.K.; Xu, J.C. Over-expression of the Salix matsudana expansin gene SmEXPA23 enhances plant salt tolerance. Plant Cell Tissue Organ Cult. 2023, 152, 309–316. [Google Scholar] [CrossRef]
- Zhang, H.; Liu, H.B.; Yang, R.X.; Xu, X.; Liu, X.; Xu, J.C. Over-expression of PttEXPA8 gene showed various resistances to diverse stresses. Int. J. Biol. Macromol. 2019, 130, 50–57. [Google Scholar] [CrossRef]
- Marowa, P.; Ding, A.M.; Xu, Z.C.; Kong, Y.Z. Overexpression of NtEXPA11 modulates plant growth and development and enhances stress tolerance in tobacco. Plant Physiol. Biochem. 2020, 151, 477–485. [Google Scholar] [CrossRef]
- Lü, P.T.; Kang, M.; Jiang, X.Q.; Dai, F.W.; Gao, J.P.; Zhang, C.Q. RhEXPA4, a rose expansin gene, modulates leaf growth and confers drought and salt tolerance to Arabidopsis. Planta 2013, 237, 1547–1559. [Google Scholar] [CrossRef] [PubMed]
- Jadamba, C.; Kang, K.; Paek, N.C.; Lee, S.I.; Yoo, S.C. Overexpression of rice expansin7 (OsEXPA7) confers enhanced tolerance to salt stress in rice. Int. J. Mol. Sci. 2020, 21, 454. [Google Scholar] [CrossRef] [PubMed]
- Han, Y.Y.; Li, A.X.; Li, F.; Zhao, M.R.; Wang, W. Characterization of a wheat (Triticum aestivum L.) expansin gene, TaEXPB23, involved in the abiotic stress response and phytohormone regulation. Plant Physiol Biochem. 2012, 54, 49–58. [Google Scholar] [CrossRef] [PubMed]
- Chen, Y.H.; Han, Y.Y.; Kong, X.Z.; Kang, H.H.; Ren, Y.Q.; Wang, W. Ectopic expression of wheat expansin gene TaEXPA2 improved the salt tolerance of transgenic tobacco by regulating Na+/K+ and antioxidant competence. Physiol. Plant. 2017, 159, 161–177. [Google Scholar] [CrossRef] [PubMed]
- Sun, W.J.; Yao, M.; Wang, Z.; Chen, Y.; Zhan, J.Y.; Yan, J.; Jiang, S.Q.; Jian, S.S.; Chen, H.; Bu, T.L.; et al. Involvement of auxin-mediated CqEXPA50 contributes to salt tolerance in Quinoa (Chenopodium quinoa) by interaction with auxin pathway genes. Int. J. Mol. Sci. 2022, 23, 8480. [Google Scholar] [CrossRef]
- Kwon, Y.R.; Lee, H.J.; Kim, K.H.; Hong, S.W.; Lee, S.J.; Lee, H. Ectopic expression of Expansin3 or Expansinβ1 causes enhanced hormone and salt stress sensitivity in Arabidopsis. Biotechnol. Lett. 2008, 30, 1281–1288. [Google Scholar] [CrossRef]
- Gao, X.; Liu, K.; Lu, Y.T. Specific roles of AtEXPA1 in plant growth and stress adaptation. Russ J Plant Physl. 2010, 57, 254–259. [Google Scholar] [CrossRef]
- Xu, Q.; Burgess, P.; Xu, J.C.; Meyer, W.; Huang, B.R. Osmotic stress- and salt stress-inhibition and gibberellin-mitigation of leaf elongation associated with up-regulation of genes controlling cell expansion. Environ. Exp. Bot. 2016, 131, 101–109. [Google Scholar] [CrossRef]
- Chen, S.L.; Polle, A. On the salty side of life: Molecular, physiological and anatomical adaptation and acclimation of trees to extreme habitats. Plant Cell Environ. 2015, 38, 1794–1816. [Google Scholar]
- Neumann, P.M.; Leon, D. Physical restraints underlying short-term inhibition by auxin of root elongation in intact maize seedlings. J. Plant Growth Regul. 1992, 11, 119–123. [Google Scholar] [CrossRef]
- Neumann, P.; Azaizeh, H.; Leon, D. Hardening of root cell walls: A growth inhibitory response to salinity stress. Plant Cell Environ. 1994, 17, 303–309. [Google Scholar] [CrossRef]
- Chen, S.L.; Polle, A. Salinity tolerance of Populus. Plant Biol. 2010, 12, 317–333. [Google Scholar] [CrossRef] [PubMed]
- Chen, S.; Li, J.; Wang, S.; Hüttermann, A.; Altman, A. Salt, nutrient uptake and transport, and ABA of Populus euphratica; a hybrid in response to increasing soil NaCl. Trees. 2001, 15, 186–194. [Google Scholar] [CrossRef]
- Chen, S.L.; Li, J.K.; Fritz, E.; Wang, S.S.; Hüttermann, A. Sodium and chloride distribution in roots and transport in three poplar genotypes under increasing NaCl stress. For. Ecol. Manage 2002, 168, 217–230. [Google Scholar] [CrossRef]
- Chen, S.L.; Li, J.K.; Wang, S.S.; Fritz, E.; Hüttermann, A.; Altman, A. Effects of NaCl on shoot growth, transpiration, ion compartmentation, and transport in regenerated plants of Populus euphratica and Populus tomentosa. Can. J. For. Res. 2003, 33, 967–975. [Google Scholar] [CrossRef]
- Kuzmanoff, K.M.; Evans, M.L. Kinetics of adaptation of osmotic stress in lentil (Lens culinaris Med.) roots. Plant Physiol. 1981, 68, 244–247. [Google Scholar] [CrossRef] [PubMed]
- Hsaio, T.C.; Jing, J. Leaf and root expansive growth in response to water deficits. Physiology of cell expansion during plant growth 1987, 180–192. [Google Scholar]
- Sun, J.; Wang, R.G.; Liu, Z.Q.; Ding, Y.Z.; Li, T.Q. Non-invasive microelectrode cadmium flux measurements reveal the spatial characteristics and real-time kinetics of cadmium transport in hyperaccumulator and nonhyperaccumulator ecotypes of Sedum alfredii. J. Plant Physiol. 2013, 170, 355–359. [Google Scholar] [CrossRef]
- Kronzucker, H.J.; Britto, D.T. Sodium transport in plants: A critical review. New phytol. 2011, 189, 54–81. [Google Scholar] [CrossRef]
- Shi, Y.; Wang, Y.; Flowers, T.J.; Gong, H. Silicon decreases chloride transport in rice (Oryza sativa L.) in saline conditions. J. Plant Physiol. 2013, 170, 847–853. [Google Scholar] [CrossRef]
- Meychik, N.R.; Yermakov, I.P.; Khonarmand, S.D.; Nikolaeva, Y.I. Ion-exchange properties of cell walls in chickpea cultivars with different sensitivities to salinity. Russ J Plant Physl. 2010, 57, 620–630. [Google Scholar] [CrossRef]
- Meychik, N.; Nikolaeva, Y.; Kushunina, M. The significance of ion-exchange properties of plant root cell walls for nutrient and water uptake by plants. Plant Physiol. Biochem. 2021, 166, 140–147. [Google Scholar] [CrossRef]
- Wang, R.G.; Chen, S.L.; Zhou, X.Y.; Shen, X.; Deng, L.; Zhu, H.J.; Shao, J.; Shi, Y.; Dai, S.X.; Fritz, E.; et al. Ionic homeostasis and reactive oxygen species control in leaves and xylem sap of two poplars subjected to NaCl stress. Tree Physiol. 2008, 28, 947–957. [Google Scholar] [CrossRef]
- Wang, R.G.; Chen, S.L.; Deng, L.; Fritz, E.; Hüttermann, A.; Polle, A. Leaf photosynthesis, fluorescence response to salinity and the relevance to chloroplast salt compartmentation and anti-oxidative stress in two poplars. Trees 2007, 21, 581–591. [Google Scholar] [CrossRef]
- Li, N.Y.; Chen, S.L.; Zhou, X.Y.; Li, C.Y.; Shao, J.; Wang, R.G.; Fritz, E.; Hüttermann, A.; Polle, A. Effect of NaCl on photosynthesis, salt accumulation and ion compartmentation in two mangrove species, Kandelia candel and Bruguiera gymnorhiza. Aquat. Bot. 2008, 88, 303–310. [Google Scholar] [CrossRef]
- Li, N.Y.; Zhou, X.Y.; Wang, R.G.; Li, J.K.; Lu, C.F.; Chen, S.L. Salt compartmentation and antioxidant defense in roots and leaves of two non-salt secretor mangroves under salt stress. In Mangrove Ecosystem Ecology and Function 2018, 81–104. [Google Scholar]
- Zhang, H.L.; Deng, C.; Wu, X.; Yao, J.; Zhang, Y.L.; Zhang, Y.N.; Deng, S.R.; Zhao, N.; Zhao, R.; Zhou, X.Y. Populus euphratica remorin 6.5 activates plasma membrane H+-ATPases to mediate salt tolerance. Tree Physiol. 2020, 40, 731–745. [Google Scholar] [CrossRef] [PubMed]
- Li, J.; Zhao, R.; Liu, J.; Yao, J.; Ma, S.; Yin, K.; Zhang, Y.; Liu, Z.; Yan, C.; Zhao, N.; et al. Populus euphratica GRP2 interacts with target mRNAs to negatively regulate salt tolerance by interfering with photosynthesis, Na+, and ROS homeostasis. Int. J. Mol. Sci. 2024, 25, 2046. [Google Scholar] [CrossRef]
- Sun, J.; Dai, S.X.; Wang, R.G.; Chen, S.L.; Li, N.Y.; Zhou, X.Y.; Lu, C.F.; Shen, X.; Zheng, X.J.; Hu, Z.M.; et al. Calcium mediates root K+/Na+ homeostasis in poplar species differing in salt tolerance. Tree Physiol. 2009, 29, 1175–1186. [Google Scholar] [CrossRef]
- Shen, Z.D.; Sun, J.; Yao, J.; Wang, S.J.; Ding, M.Q.; Zhang, H.L.; Qian, Z.Y.; Zhao, N.; Sa, G.; Zhao, R.; et al. High rates of virus-induced gene silencing by tobacco rattle virus in Populus. Tree Physiol. 2015, 35, 1016–1029. [Google Scholar] [CrossRef]
Figure 1.
Transcription profile of PtEXPA6 in roots, stems and leaves of Populus trichocarpa during the period of salt stress. Uniform plants of P. trichocarpa were treated with NaCl saline (0 or 100 mM) for 48 hours. Fine roots, stems and upper leaves (3rd to 8th from shoot tip) were sampled at 0, 3, 6, 12, 24, and 48 hours, respectively. For RT-qPCR analysis, the primer sequences for PtEXPA6 and the reference gene, PtUBQ, are shown in Supplementary Table S1. Data are means ± SD (n = 3), and bars with asterisks indicate significant differences, *: p < 0.05, **: p < 0.01.
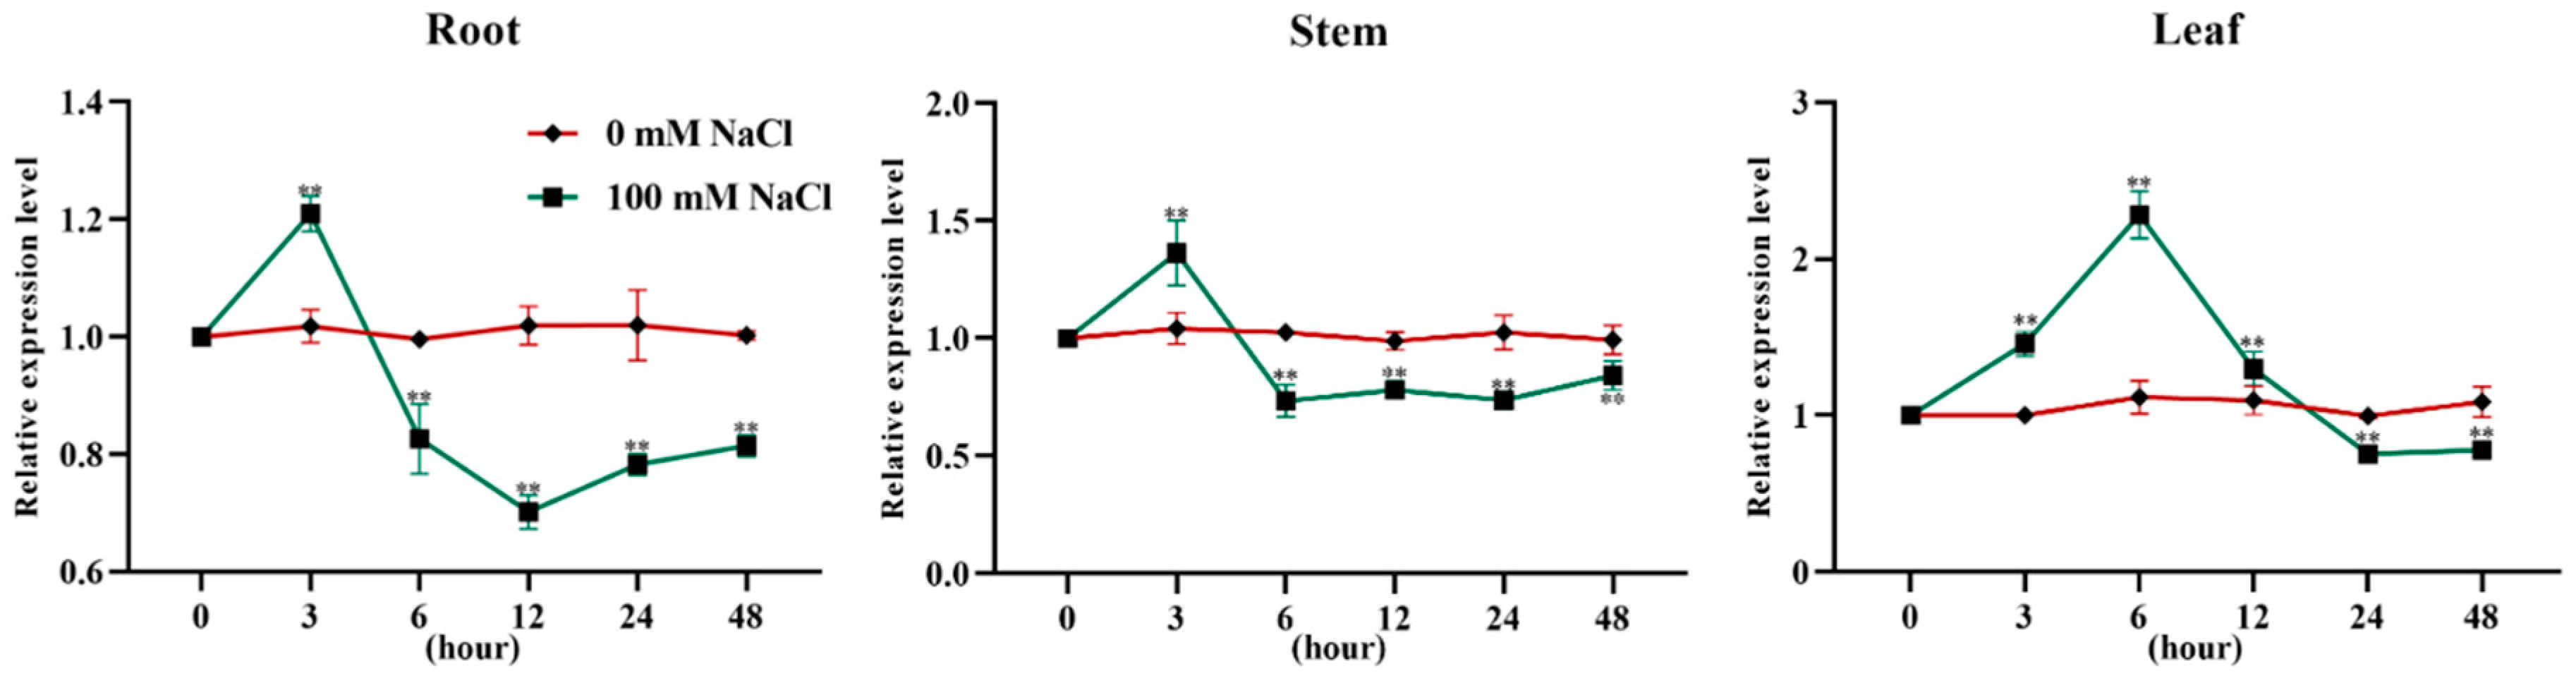
Figure 2.
Sequence and phylogenetic analysis of Populus trichocarpa PtEXPA6. (A) Multiple sequence alignment of EXPA and expansin family from Populus and other species. Black shading indicates identical amino acid residues, blue and pink shadings indicate conserved amino acids, respectively. (B) Phylogenetic analysis of expansin from various species. Populus euphratica (Pe), Populus trichocarpa (Pt), Populus tremula × Populus tremuloides (Ptt), Populus alba (Pa), Arabidopsis thaliana (At), Zea mays (Zm), Nicotiana tabacum (Nt), and Oriza sativa (Os), Glycine max (Gm), Salix viminalis (Sv), Morus notabilis (Mn), Rosa rugosa (Rr), Prunus persica (Pp), Pistacia vera (Pv), Ziziphus jujuba (Zj), Cucumis melo (Cm), Gossypium arboreum (Ga), Nicotiana sylvestris (Ns), Syzygium oleosum (So), Hibiscus syriacus (Hs), Pistacia vera (Pv), Salix purpurea (Sp). Supplementary Table S2 lists the accession numbers of the EXPA orthologues.
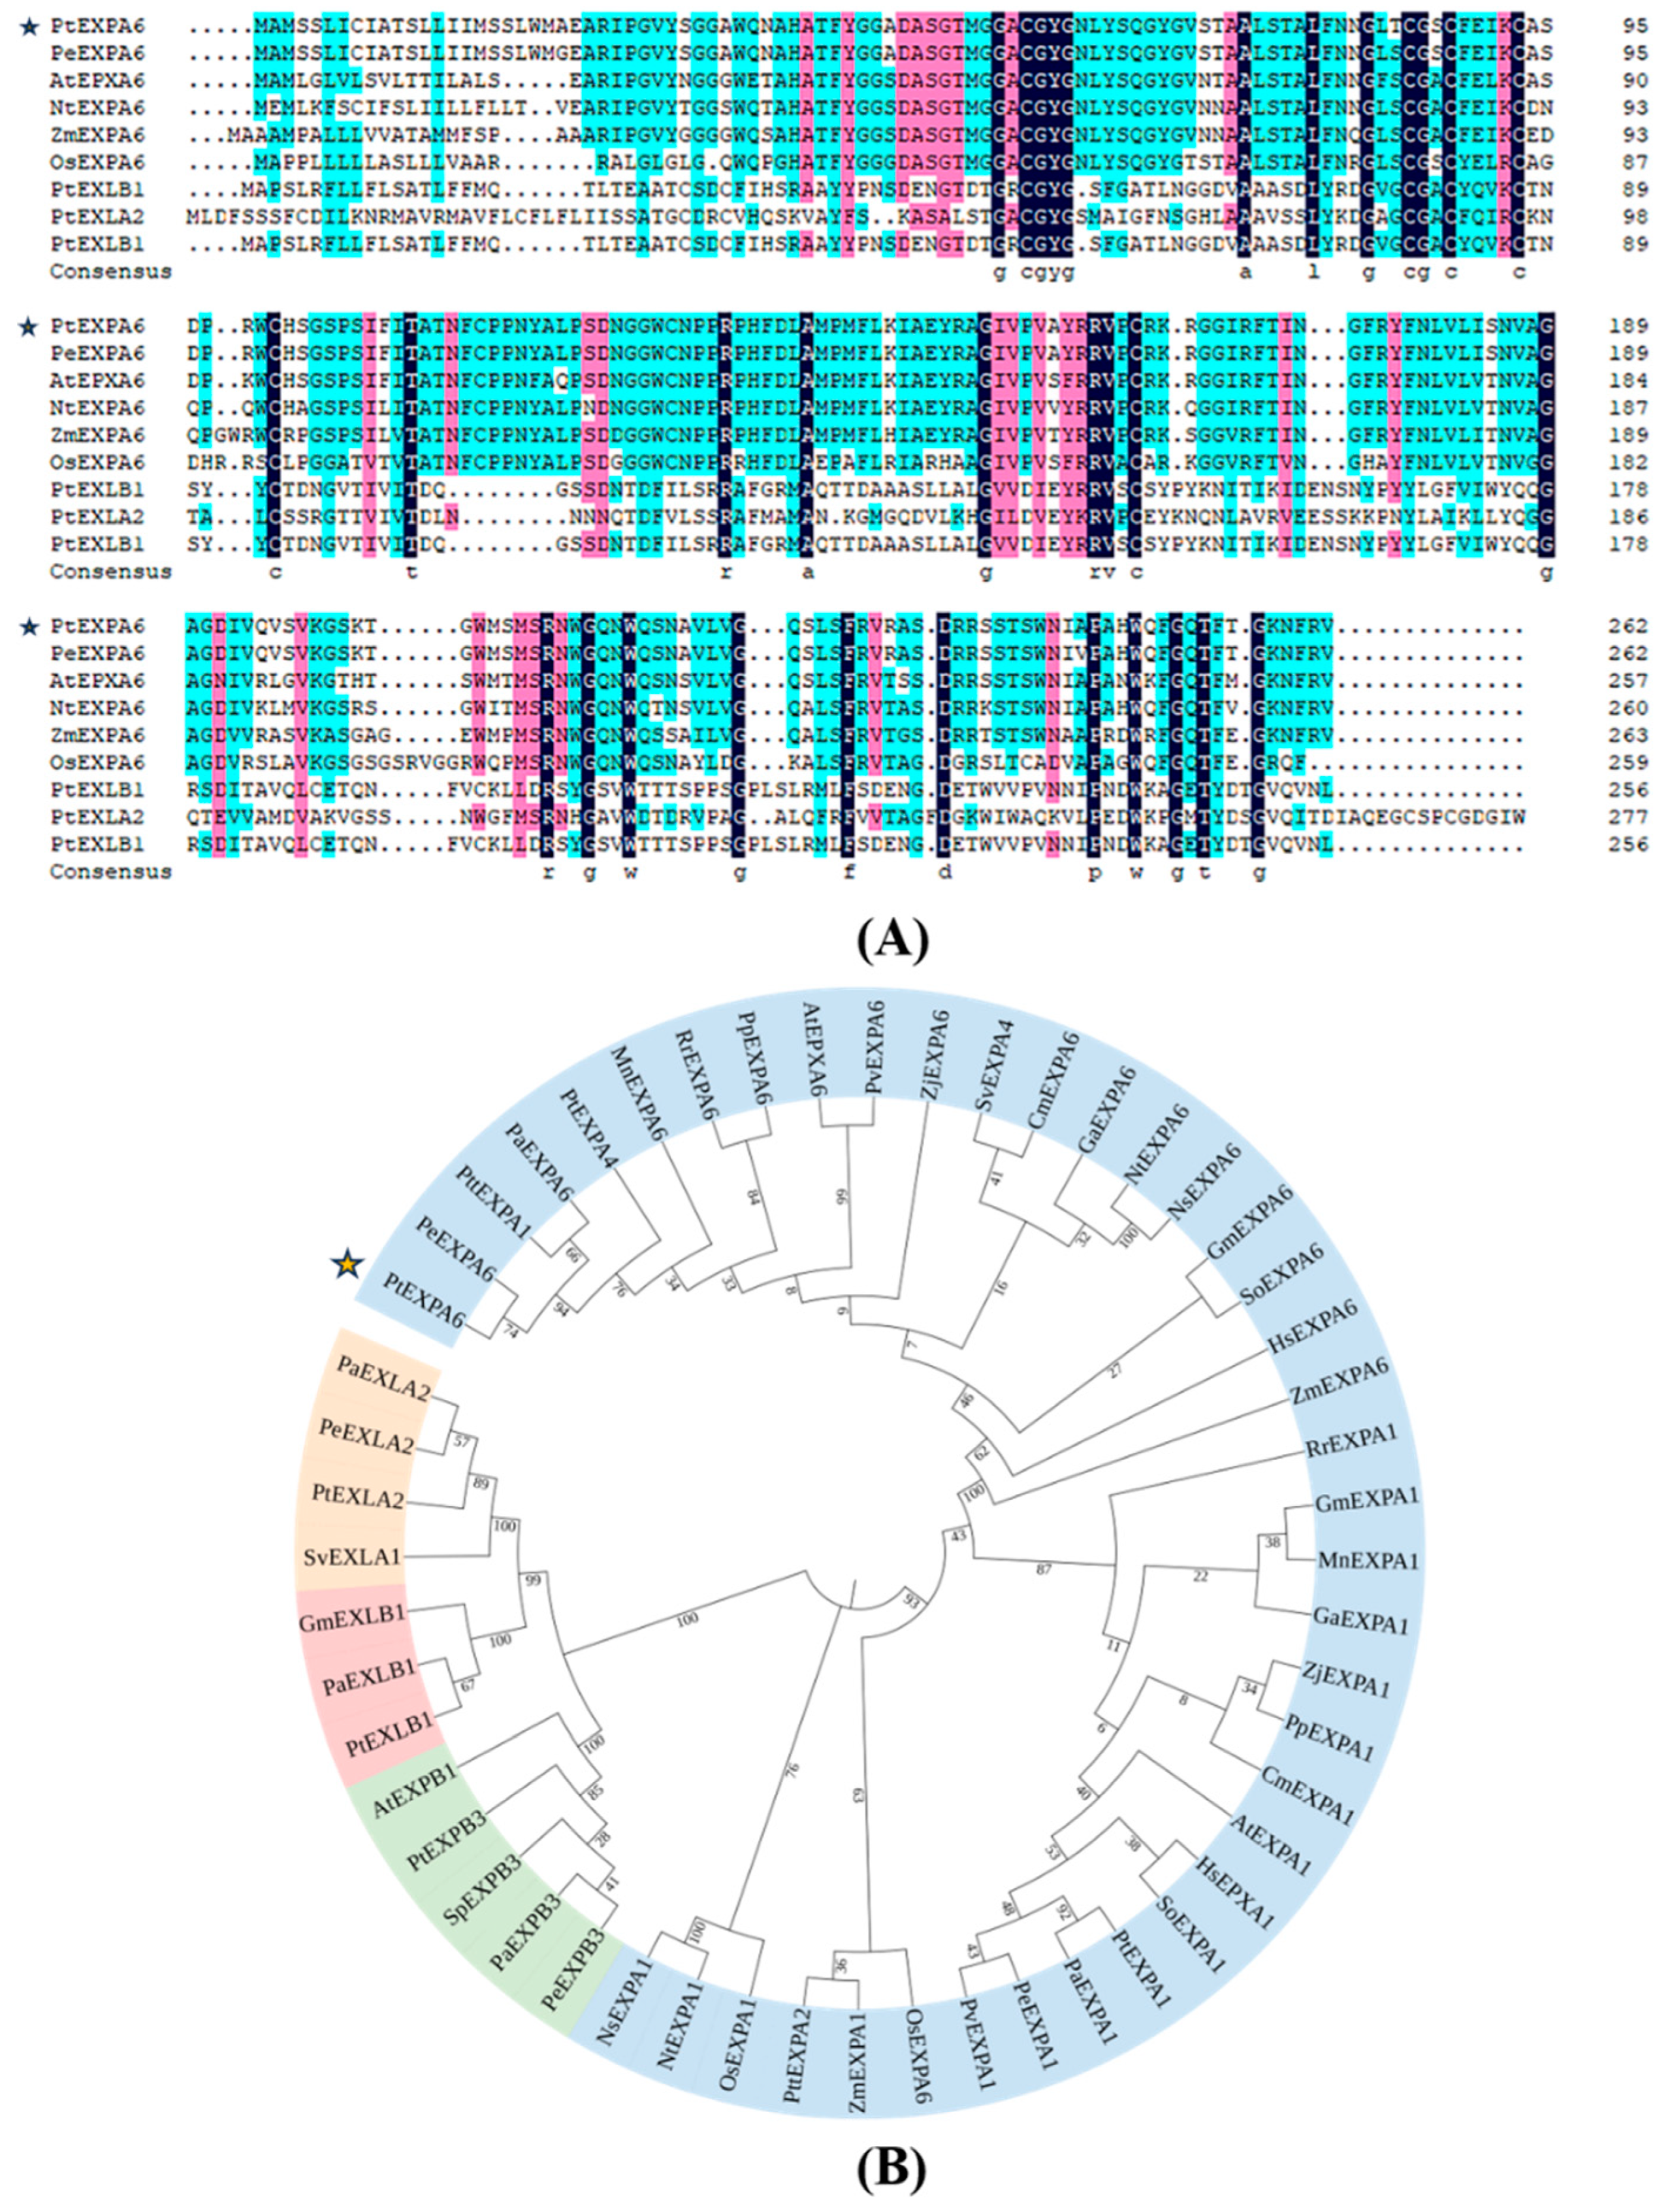
Figure 3.
Molecular verification of transgenic lines overexpressing P. trichocarpa PtEXPA6 in 84K and 717-1B4. (A) PCR assay of transgenic poplars. The primer sequences for PtEXPA6 are shown in Supplementary Table S1. WT: negative control (wild type); CK: blank control; P: positive control. (B) Western blot of transgenic lines. Western blot analysis performed with anti-MYC specific antibody for PtEXPA6.
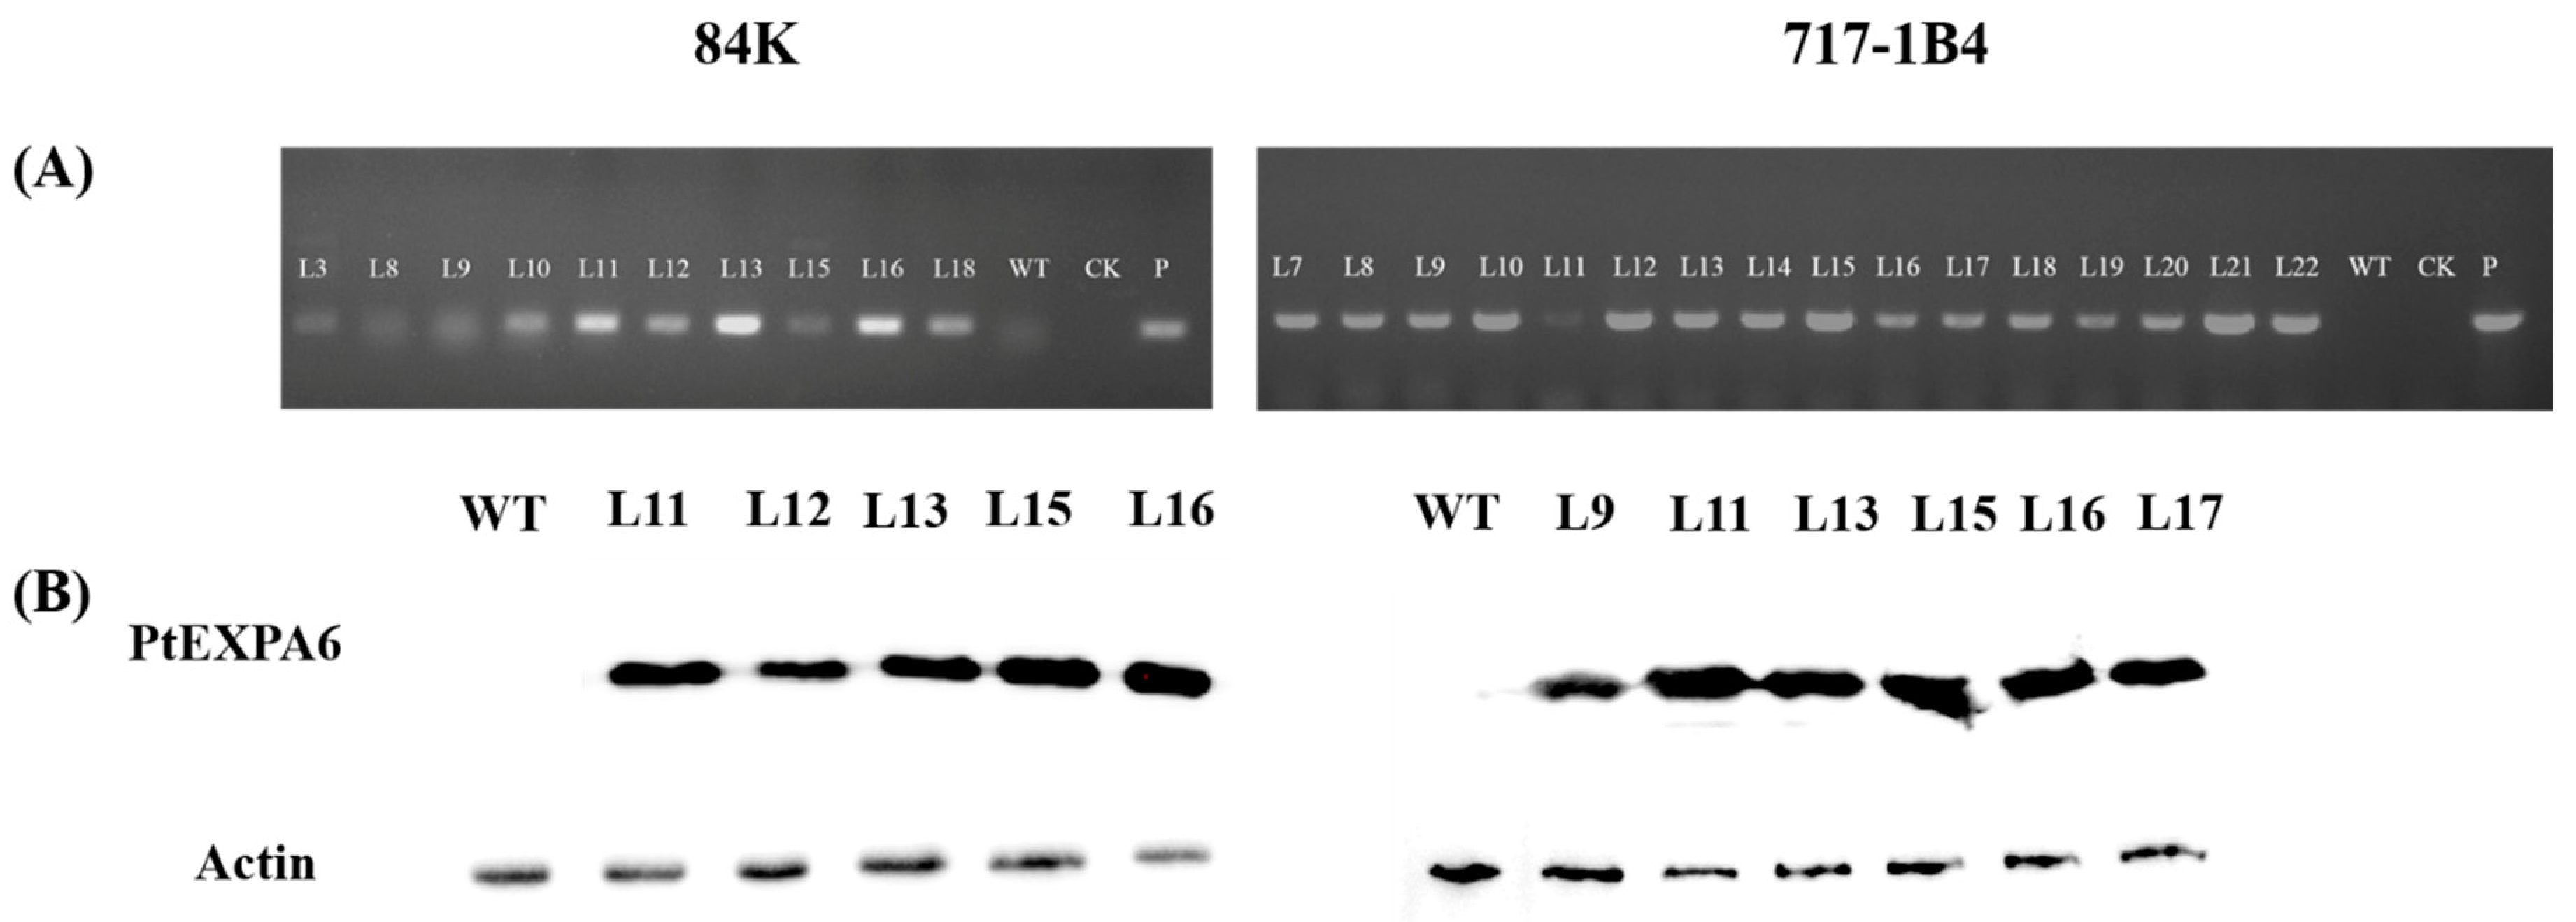
Figure 4.
Phenotypic tests of wild-type (WT) and PtEXPA6-overexpressing lines of 84K and 717-1B4 under long-term salt stress. PtEXPA6-overexpressing lines of 84K (L11, L12, L13) and 717-1B4 (L9, L15, L16), and wild-type (WT) were exposed to NaCl with 0 or 100 mM for 15 days. (A) Representative images showing plant performance after salt treatment. Scale bars = 5 cm. (B) Stem height increment. (C) Stem diameter increment. Data are means ± SD (n = 3), and bars with different letters indicate significant differences (p < 0.05).
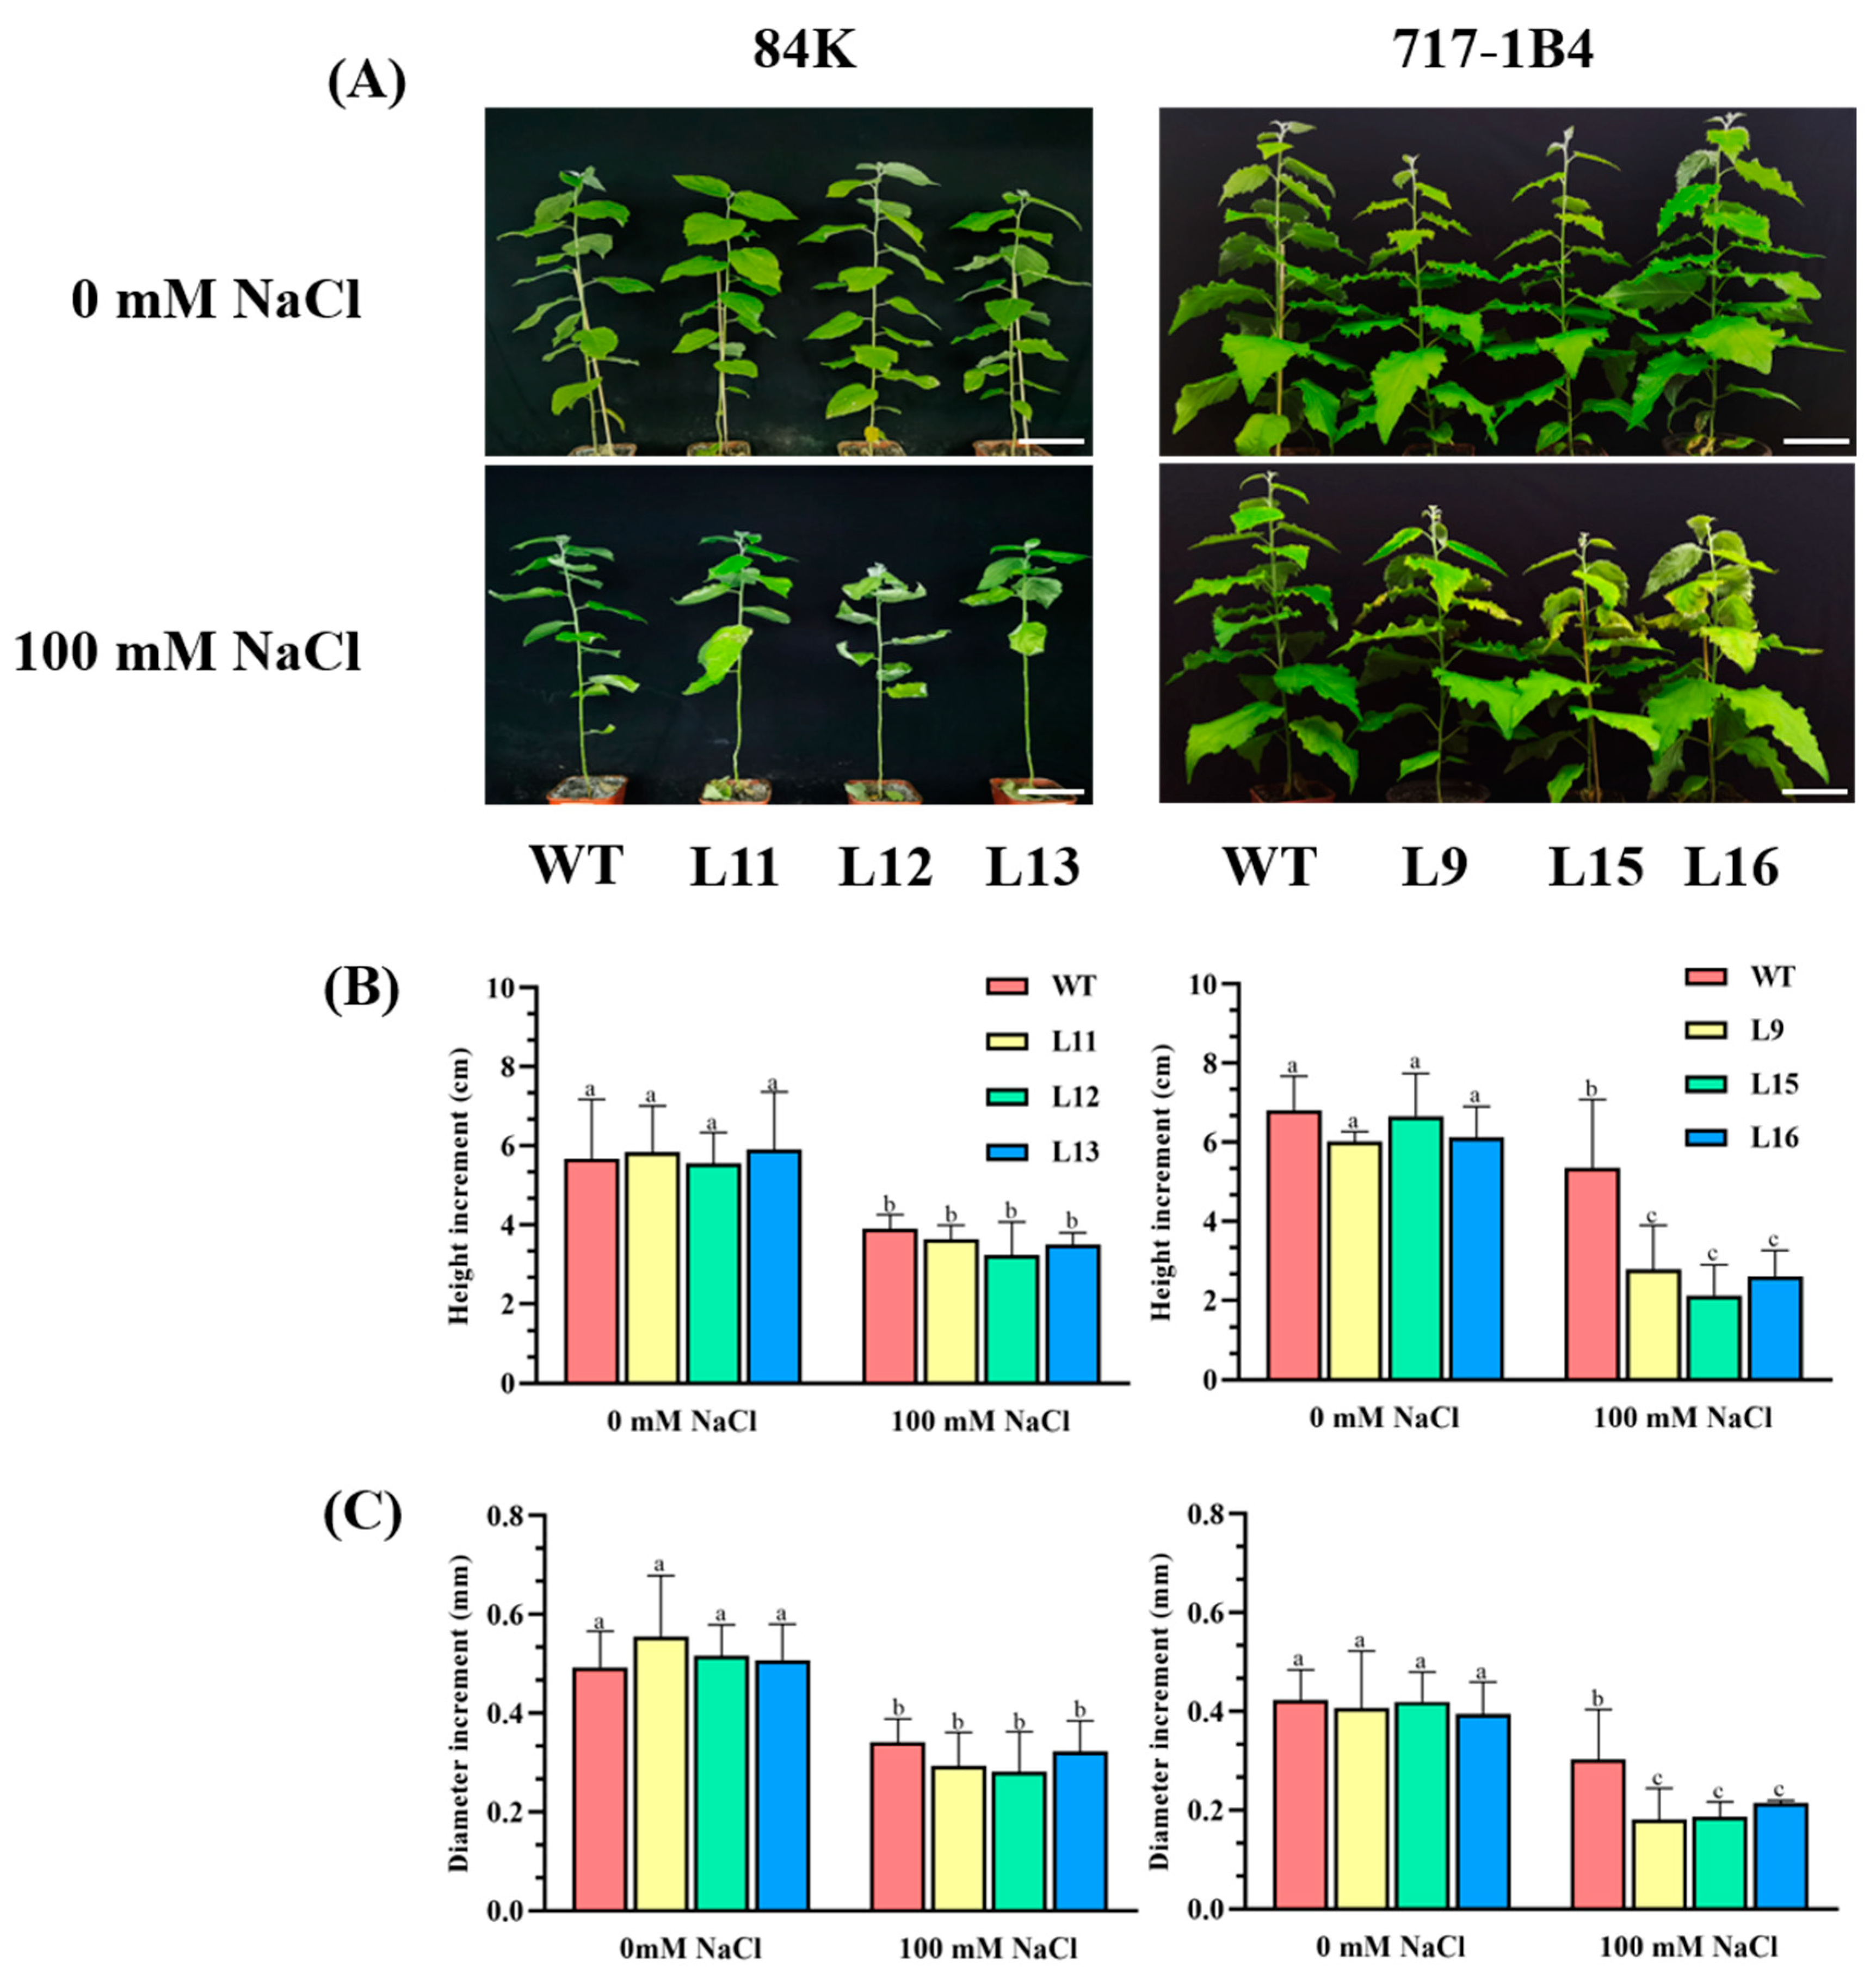
Figure 5.
Effect of NaCl on leaf gas exchange in wild type and PtEXPA6-overexpressing lines of 84K and 717-1B4. PtEXPA6-overexpressing lines of 84K (L11, L12, L13) and 717-1B4 (L9, L15, L16), and wild-type (WT) were exposed to NaCl with 0 or 100 mM for 15 days. (A) Net photosynthetic rate (Pn). (B) Transpiration rate (E). (C) stomatal conductance (Cleaf). Data are means ± SD (n = 3), and bars with different letters indicate significant differences (p < 0.05).
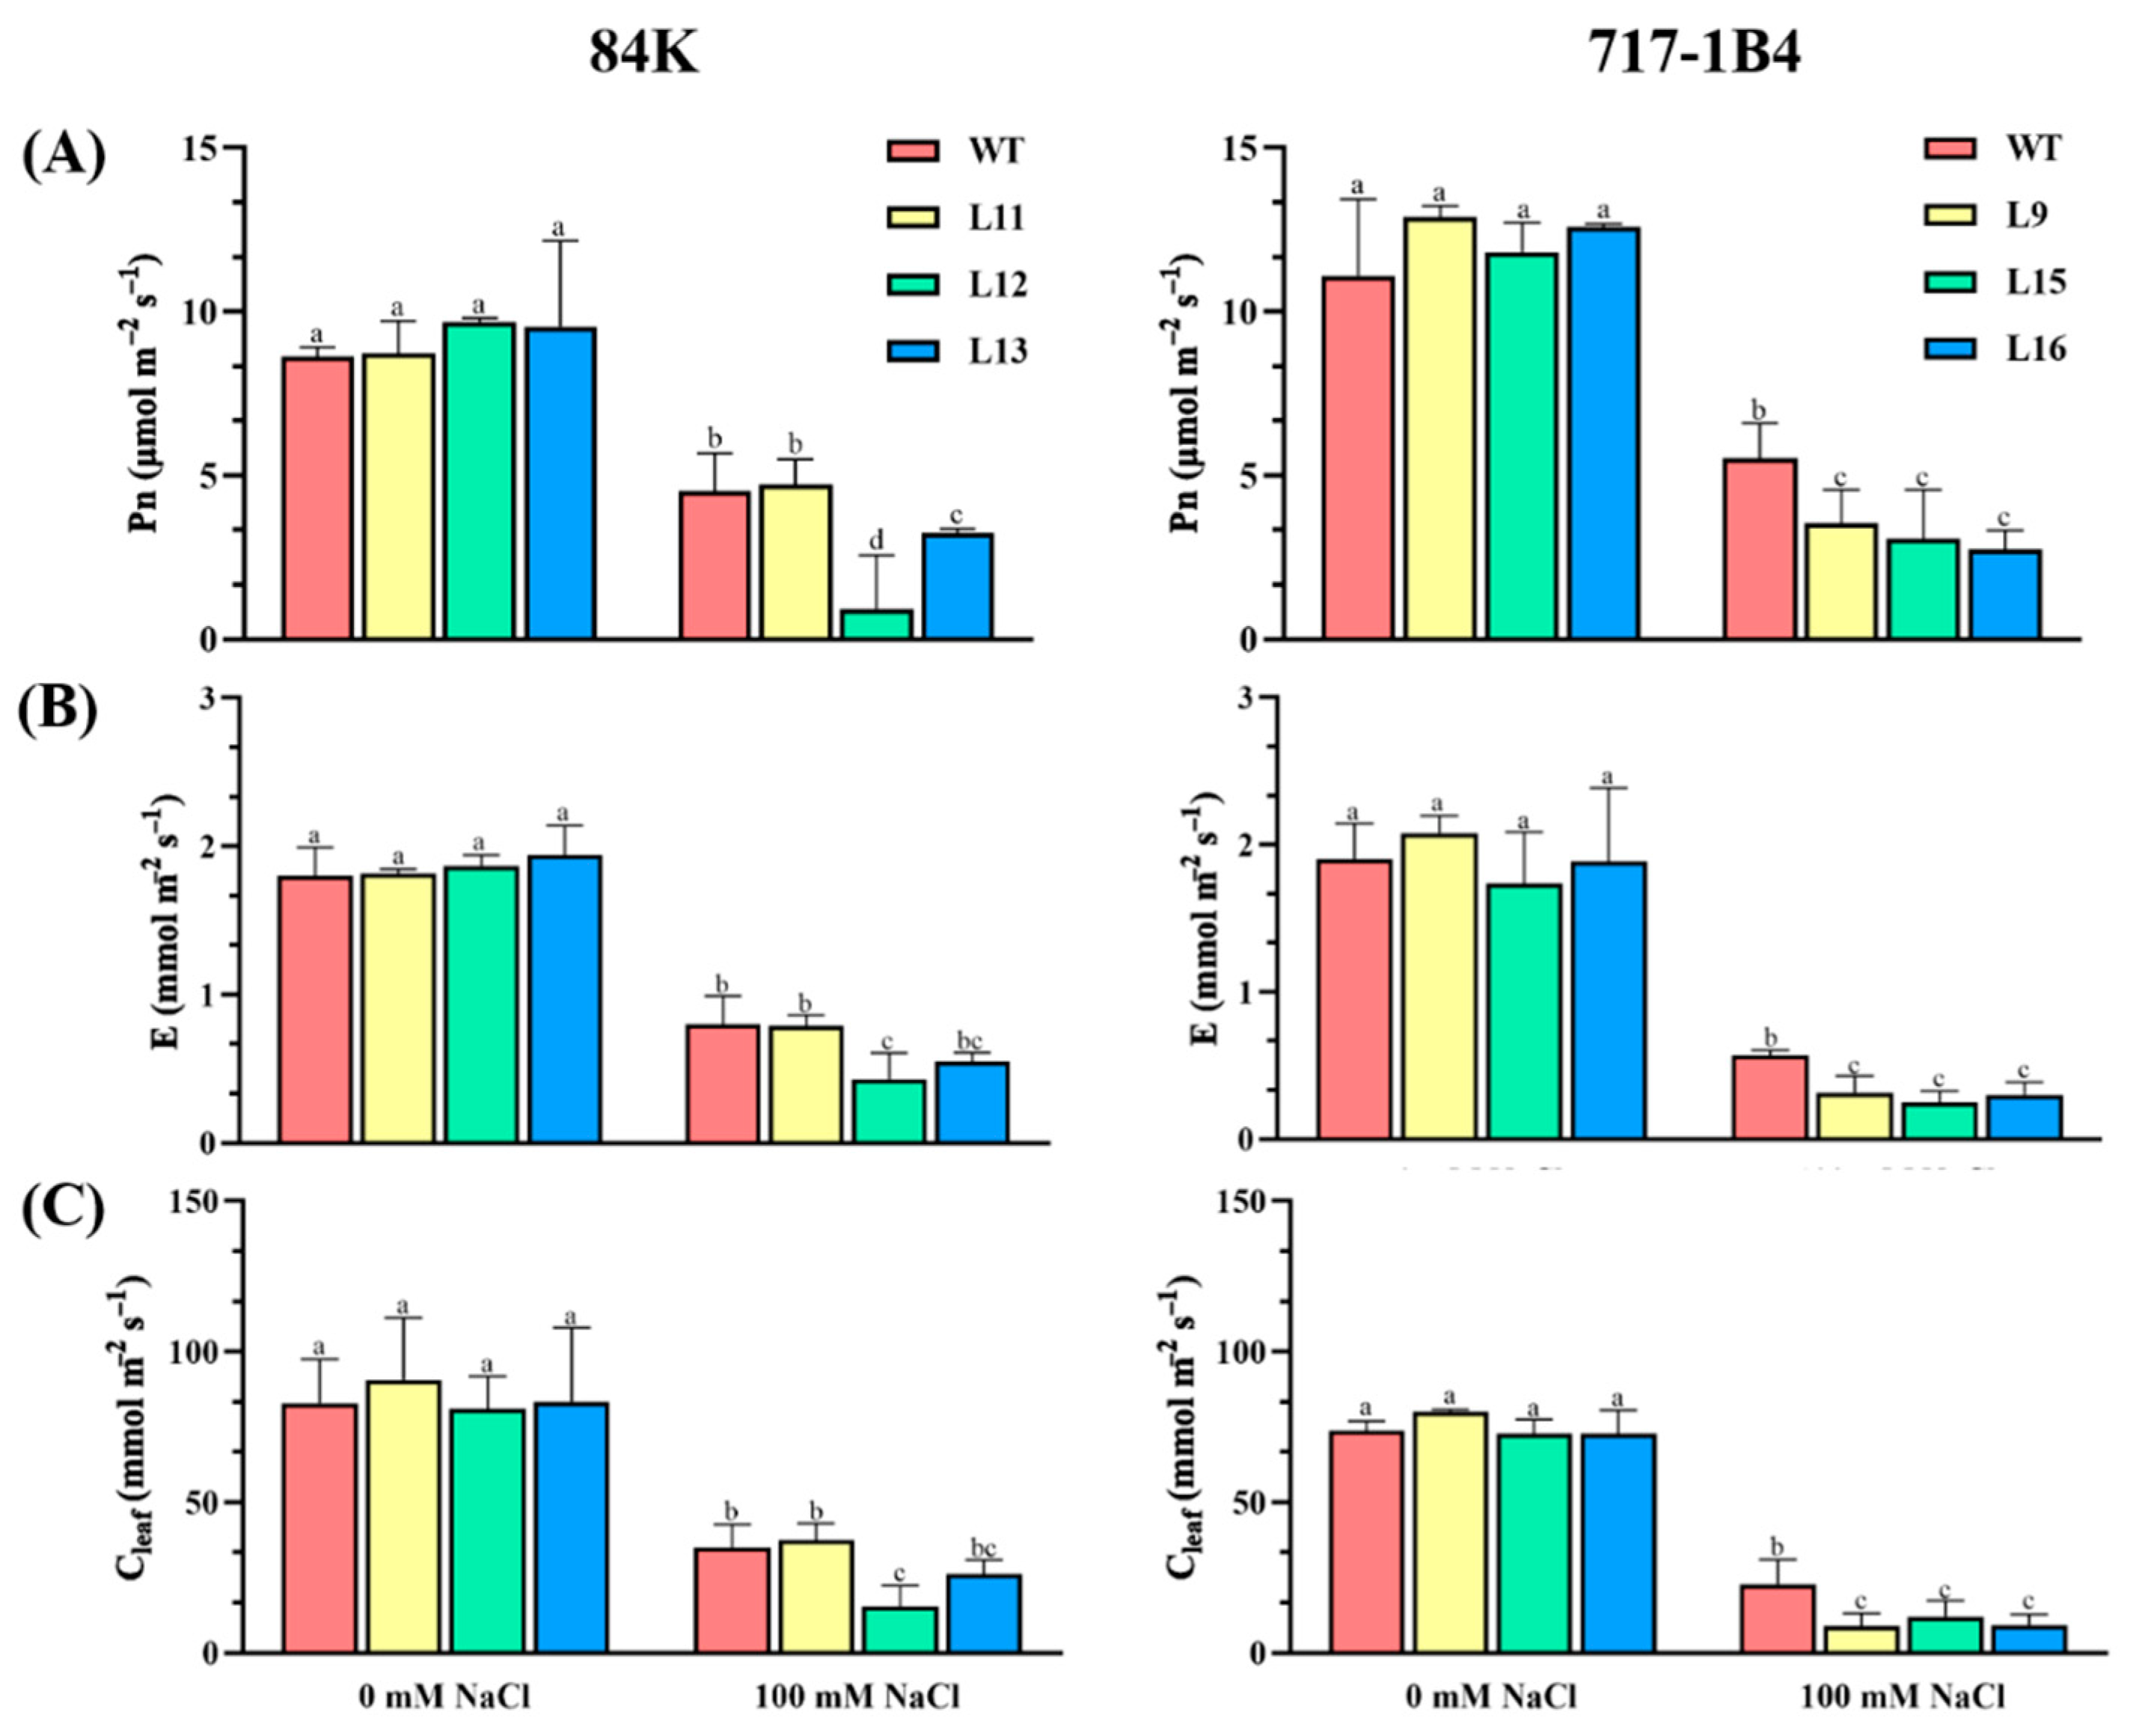
Figure 6.
Effect of NaCl on chlorophyll fluorescence in wild type and PtEXPA6-overexpressing lines of 84K and 717-1B4. PtEXPA6-overexpressing lines of 84K (L11, L12, L13) and 717-1B4 (L9, L15, L16), and wild-type (WT) were exposed to NaCl with 0 or 100 mM for 15 days. (A) The relative electron transport rate (ETR). (B) The actual photosynthetic quantum yield (YII). (C) The maximum photochemical efficiency of PSII (Fv/Fm). Data are means ± SD (n = 3), and bars with different letters indicate significant differences (p < 0.05).
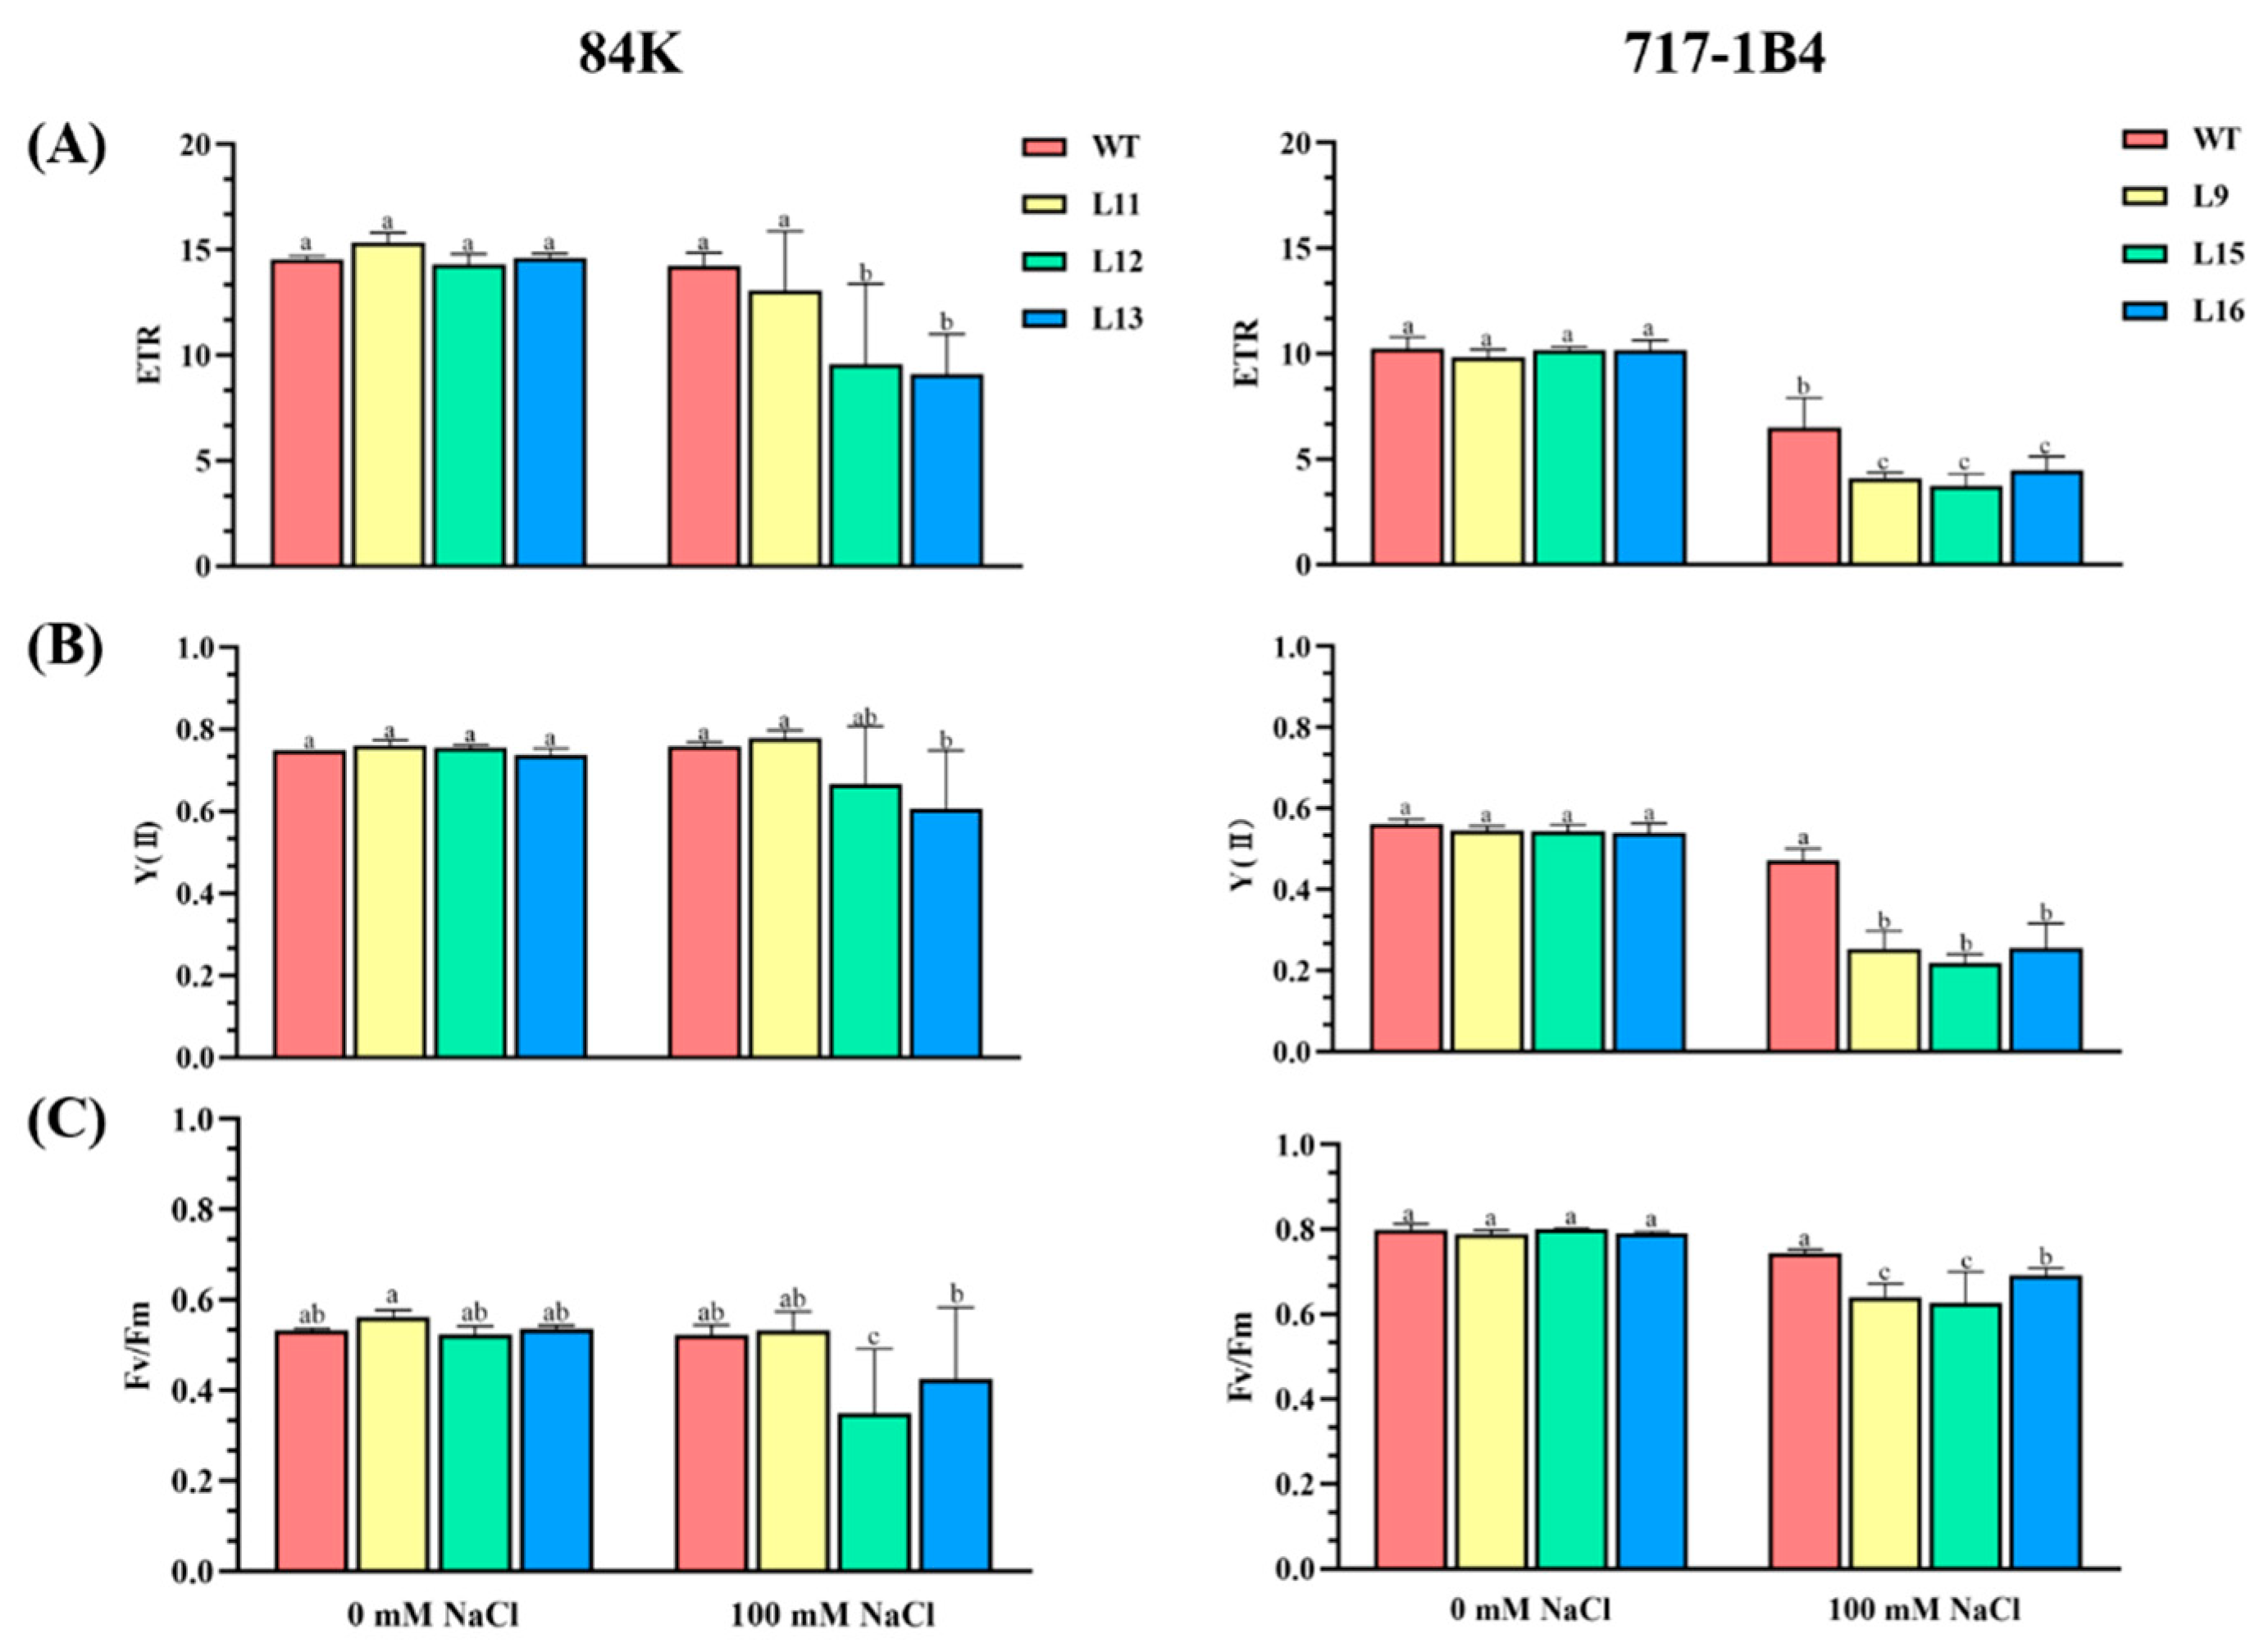
Figure 7.
Effect of NaCl on antioxidant enzyme activity in wild type and PtEXPA6-overexpressing lines of 84K and 717-1B4. PtEXPA6-overexpressing lines of 84K (L11, L12, L13) and 717-1B4 (L9, L15, L16), and wild-type (WT) were exposed to NaCl with 0 or 100 mM for 15 days. The activity of superoxide dismutase (SOD), peroxidase (POD) and catalase (CAT), and relative electrolyte leakage were measured in the leaves of no-salt control and salinized plants. (A) POD activity. (B) SOD activity. (C) CAT activity. (D) Relative electrolyte leakage. Data are means ± SD (n = 3), and bars with different letters indicate significant differences (p < 0.05).

Figure 8.
Effect of NaCl on the transcript levels of antioxidant enzyme in wild type and PtEXPA6-overexpressing lines of 84K and 717-1B4. PtEXPA6-overexpressing lines of 84K (L11, L12, L13), 717-1B4 (L9, L15, L16), and wild-type (WT) were exposed to NaCl with 0 or 100 mM for 15 days. Relative expression of antioxidant enzyme genes such as peroxidase a2 (PODa2), superoxide dismutase [Cu-Zn] (SOD [Cu-Zn]), and catalase 1 (CAT1) were examined in WT and PtEXPA6 overexpressing poplars. (A) PODa2. (B) SOD[Cu-Zn]. (C) CAT1. The primer sequences of PODa2, SOD[Cu-Zn], CAT1 and the reference actin gene, PtUBQ, are shown in Supplementary Table S1. Data are means ± SD (n = 3), and bars with different letters indicate significant differences (p < 0.05).
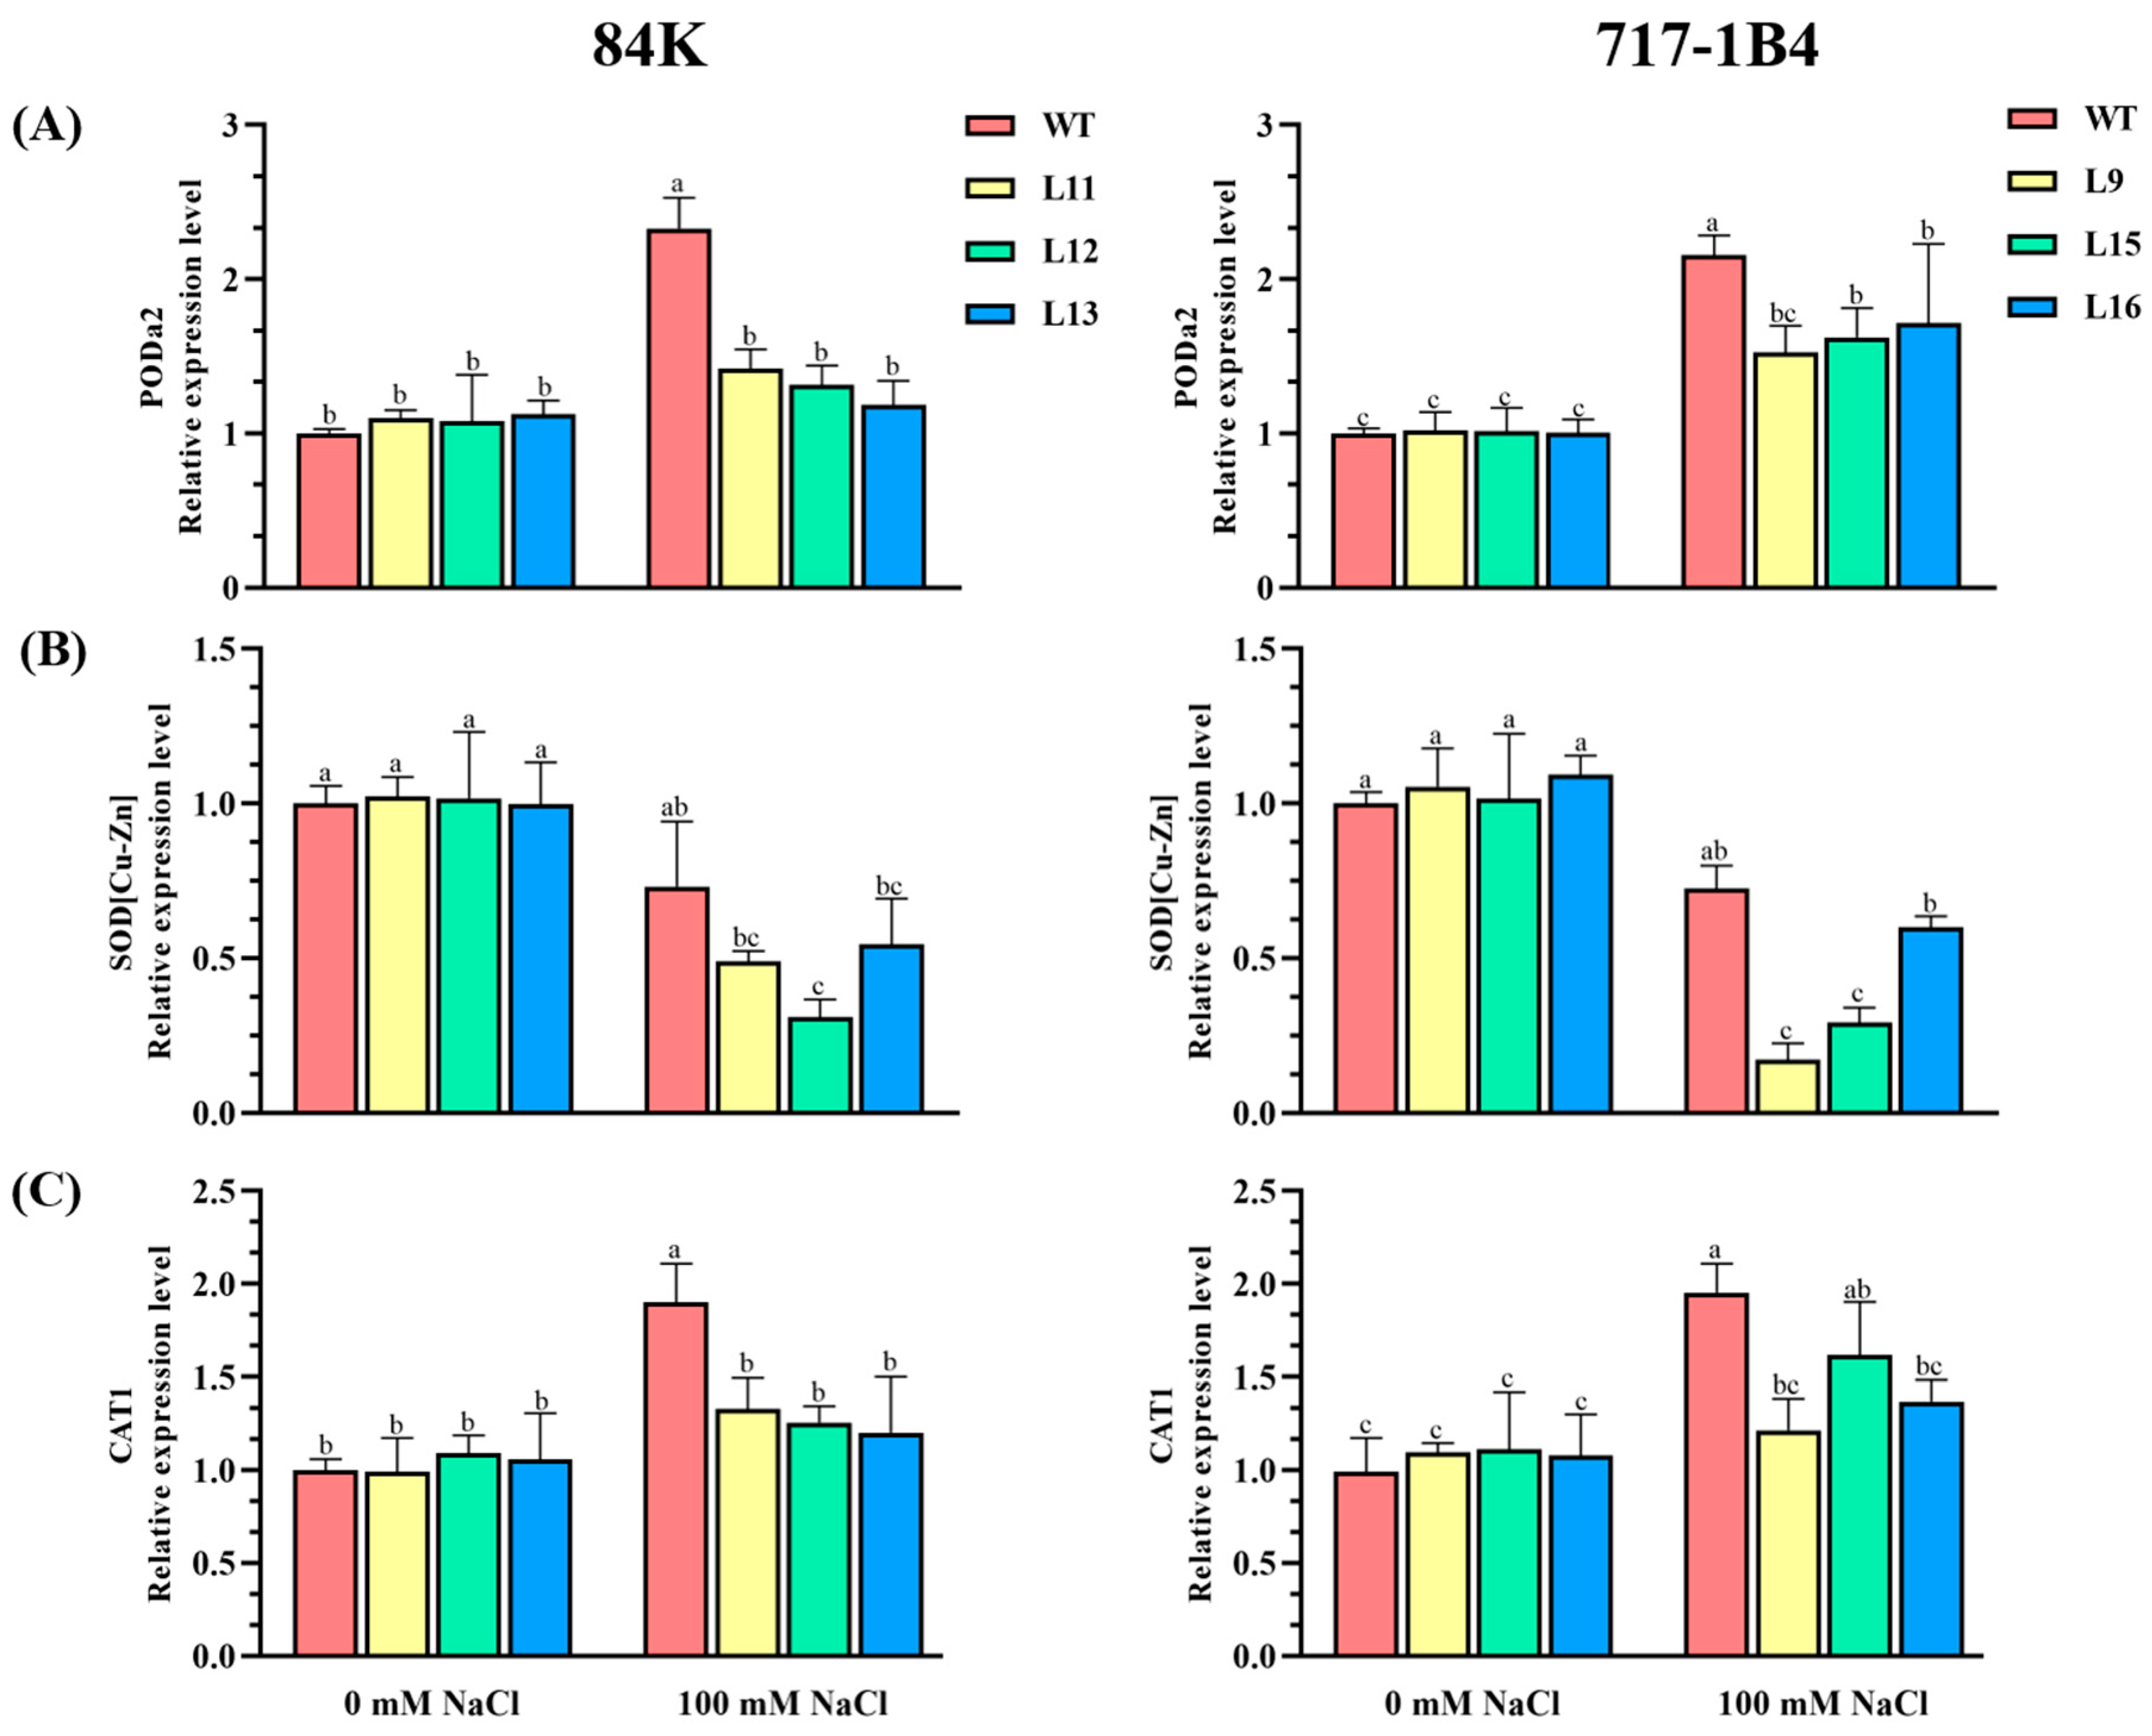
Figure 9.
Na+ content in roots, stems and leaves of wild type and PtEXPA6-overexpressing lines of 84K and 717-1B4 under long-term salt stress. PtEXPA6-overexpressing lines of 84K (L11, L12, L13) and 717-1B4 (L9, L15, L16), and wild-type (WT) were exposed to NaCl with 0 or 100 mM for 15 days. Data are means ± SD (n = 3), and bars with different letters indicate significant differences (p < 0.05).
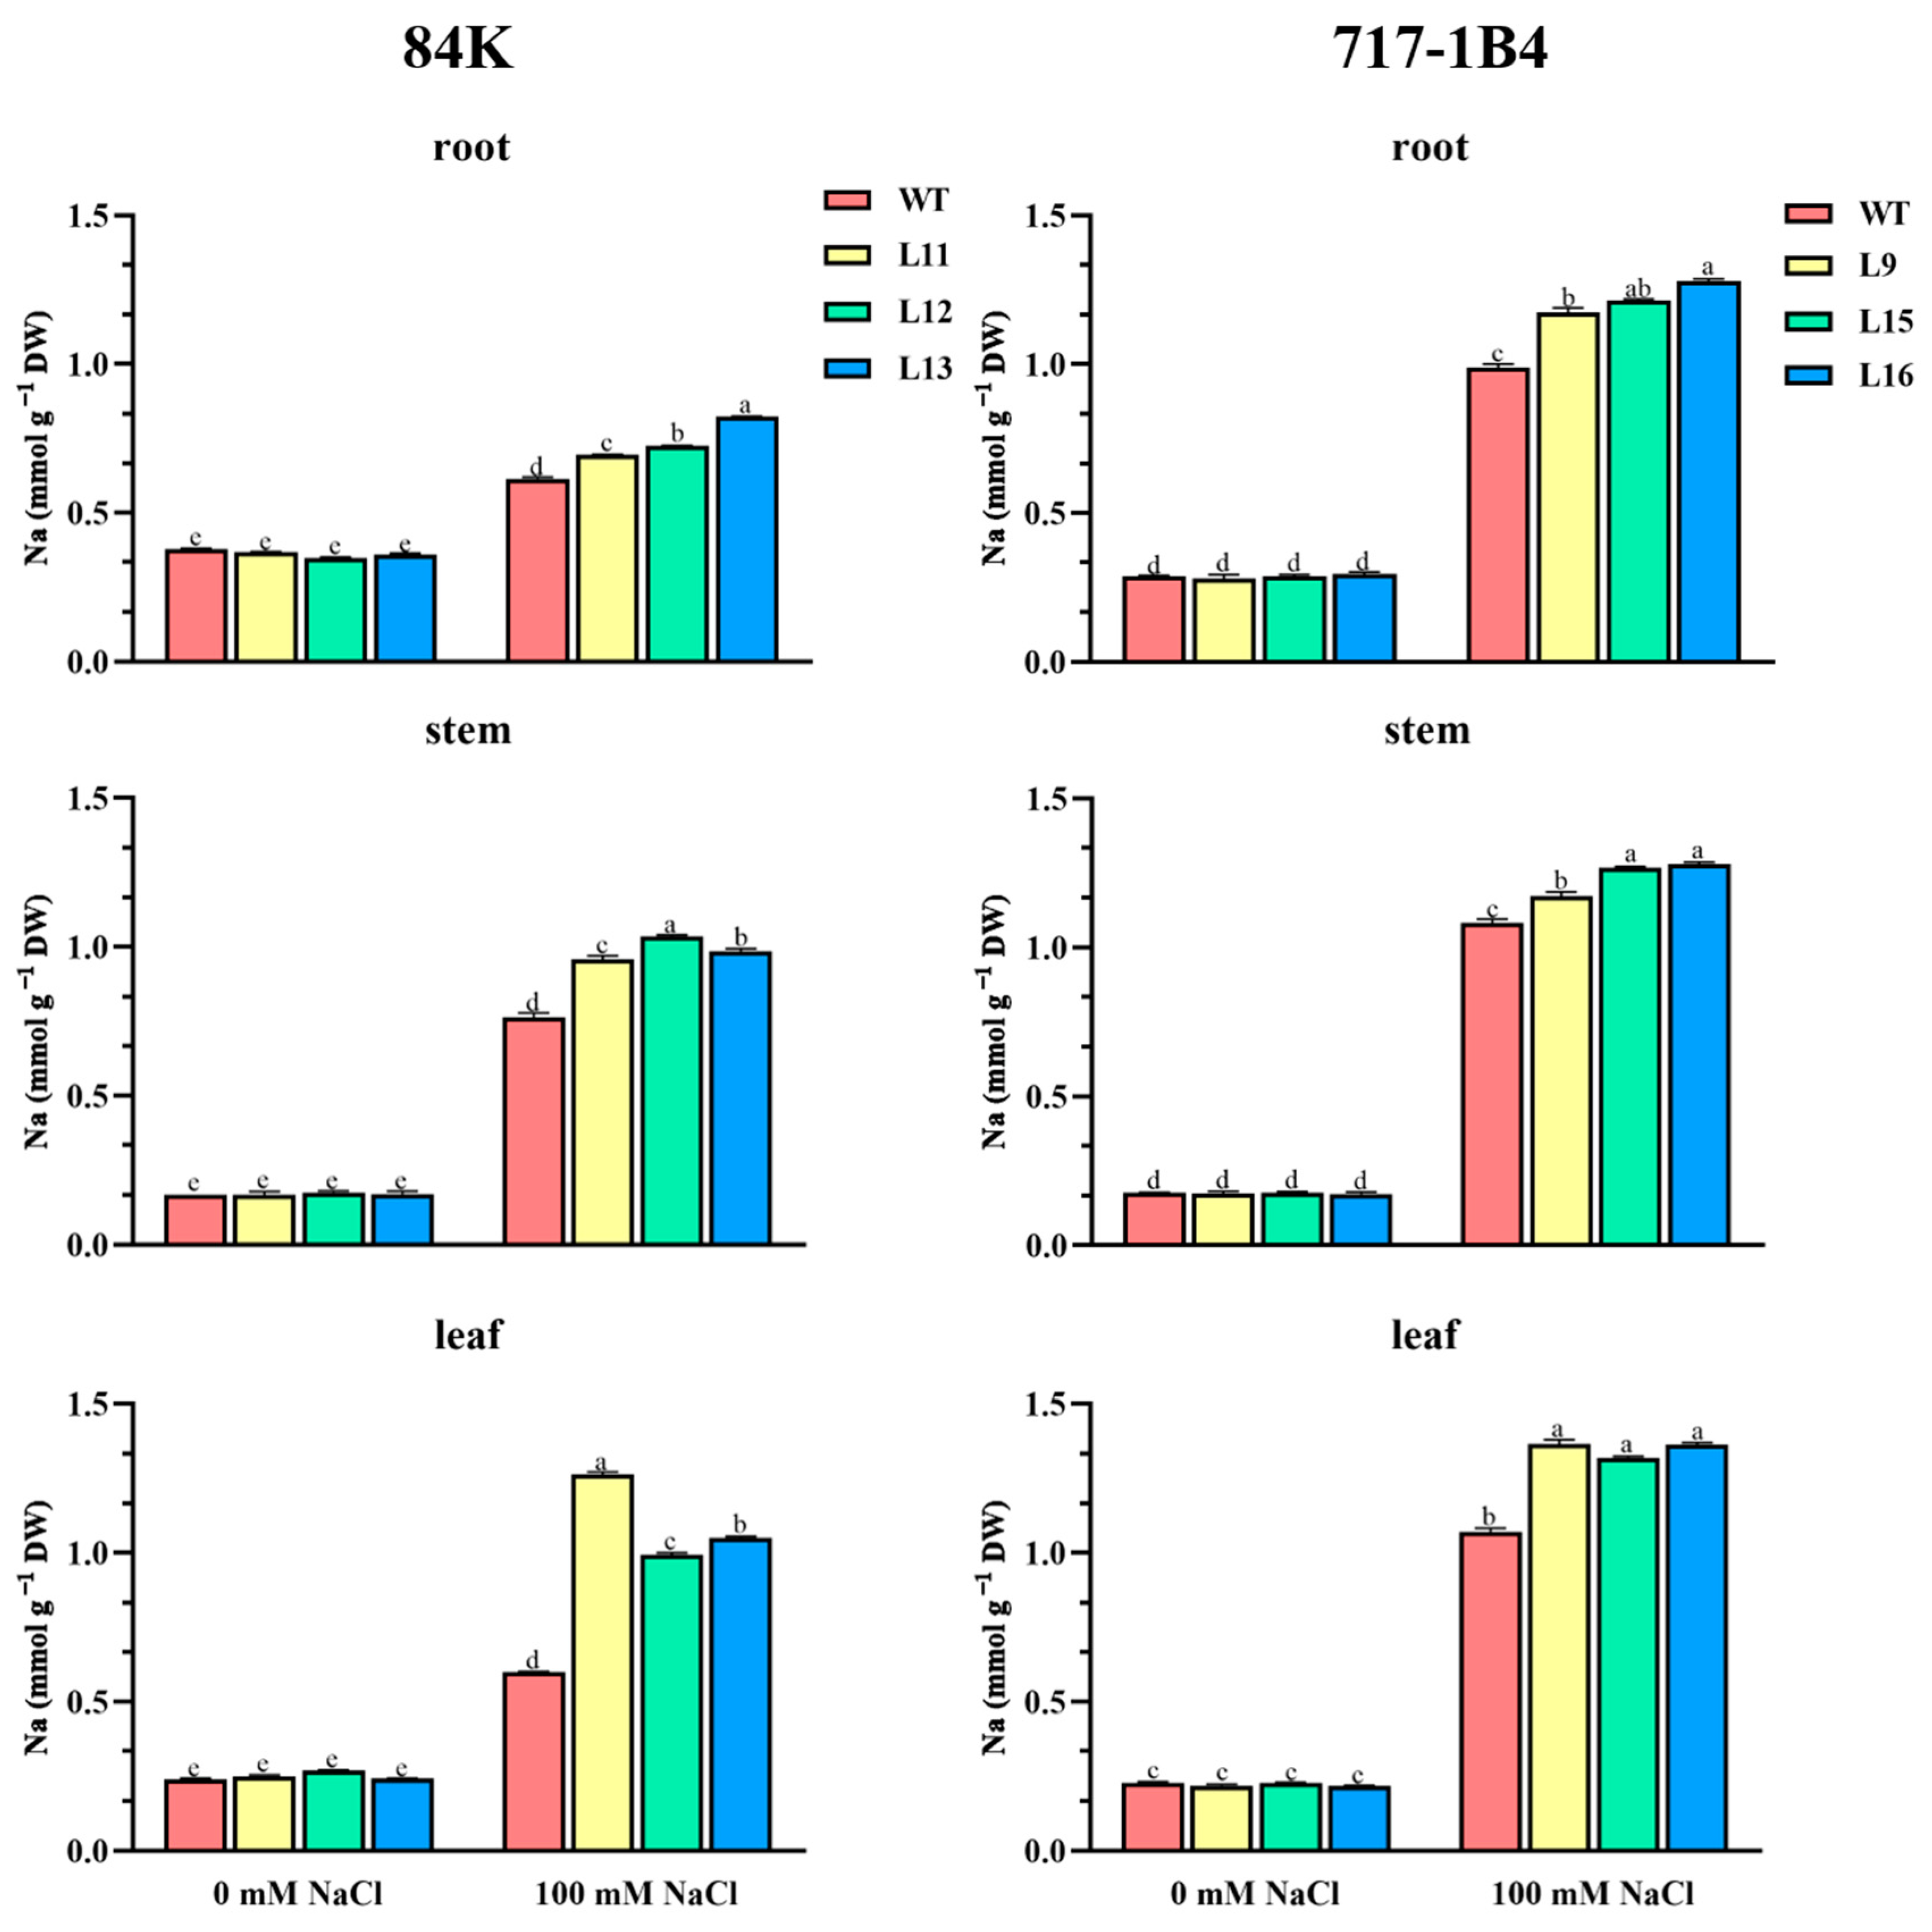
Figure 10.
Comparative contractability and comparative extensibility of intact root tip sites in wild type and PtEXPA6-overexpressing lines of 84K and 717-1B4. Comparative contractability of PtEXPA6-overexpressing lines of 84K (L11, L12, L13) and 717-1B4 (L9, L15, L16), and wild-type (WT) was measured after the intact root tips were expose to 300 mOsmol kg-1 mannitol (-0.75 MPa). Then comparative extensibility of intact root tip was measured after an 0.1 MPa osmotic jump. Data are means ± SD (n = 3), and bars with different letters indicate significant differences (p < 0.05).
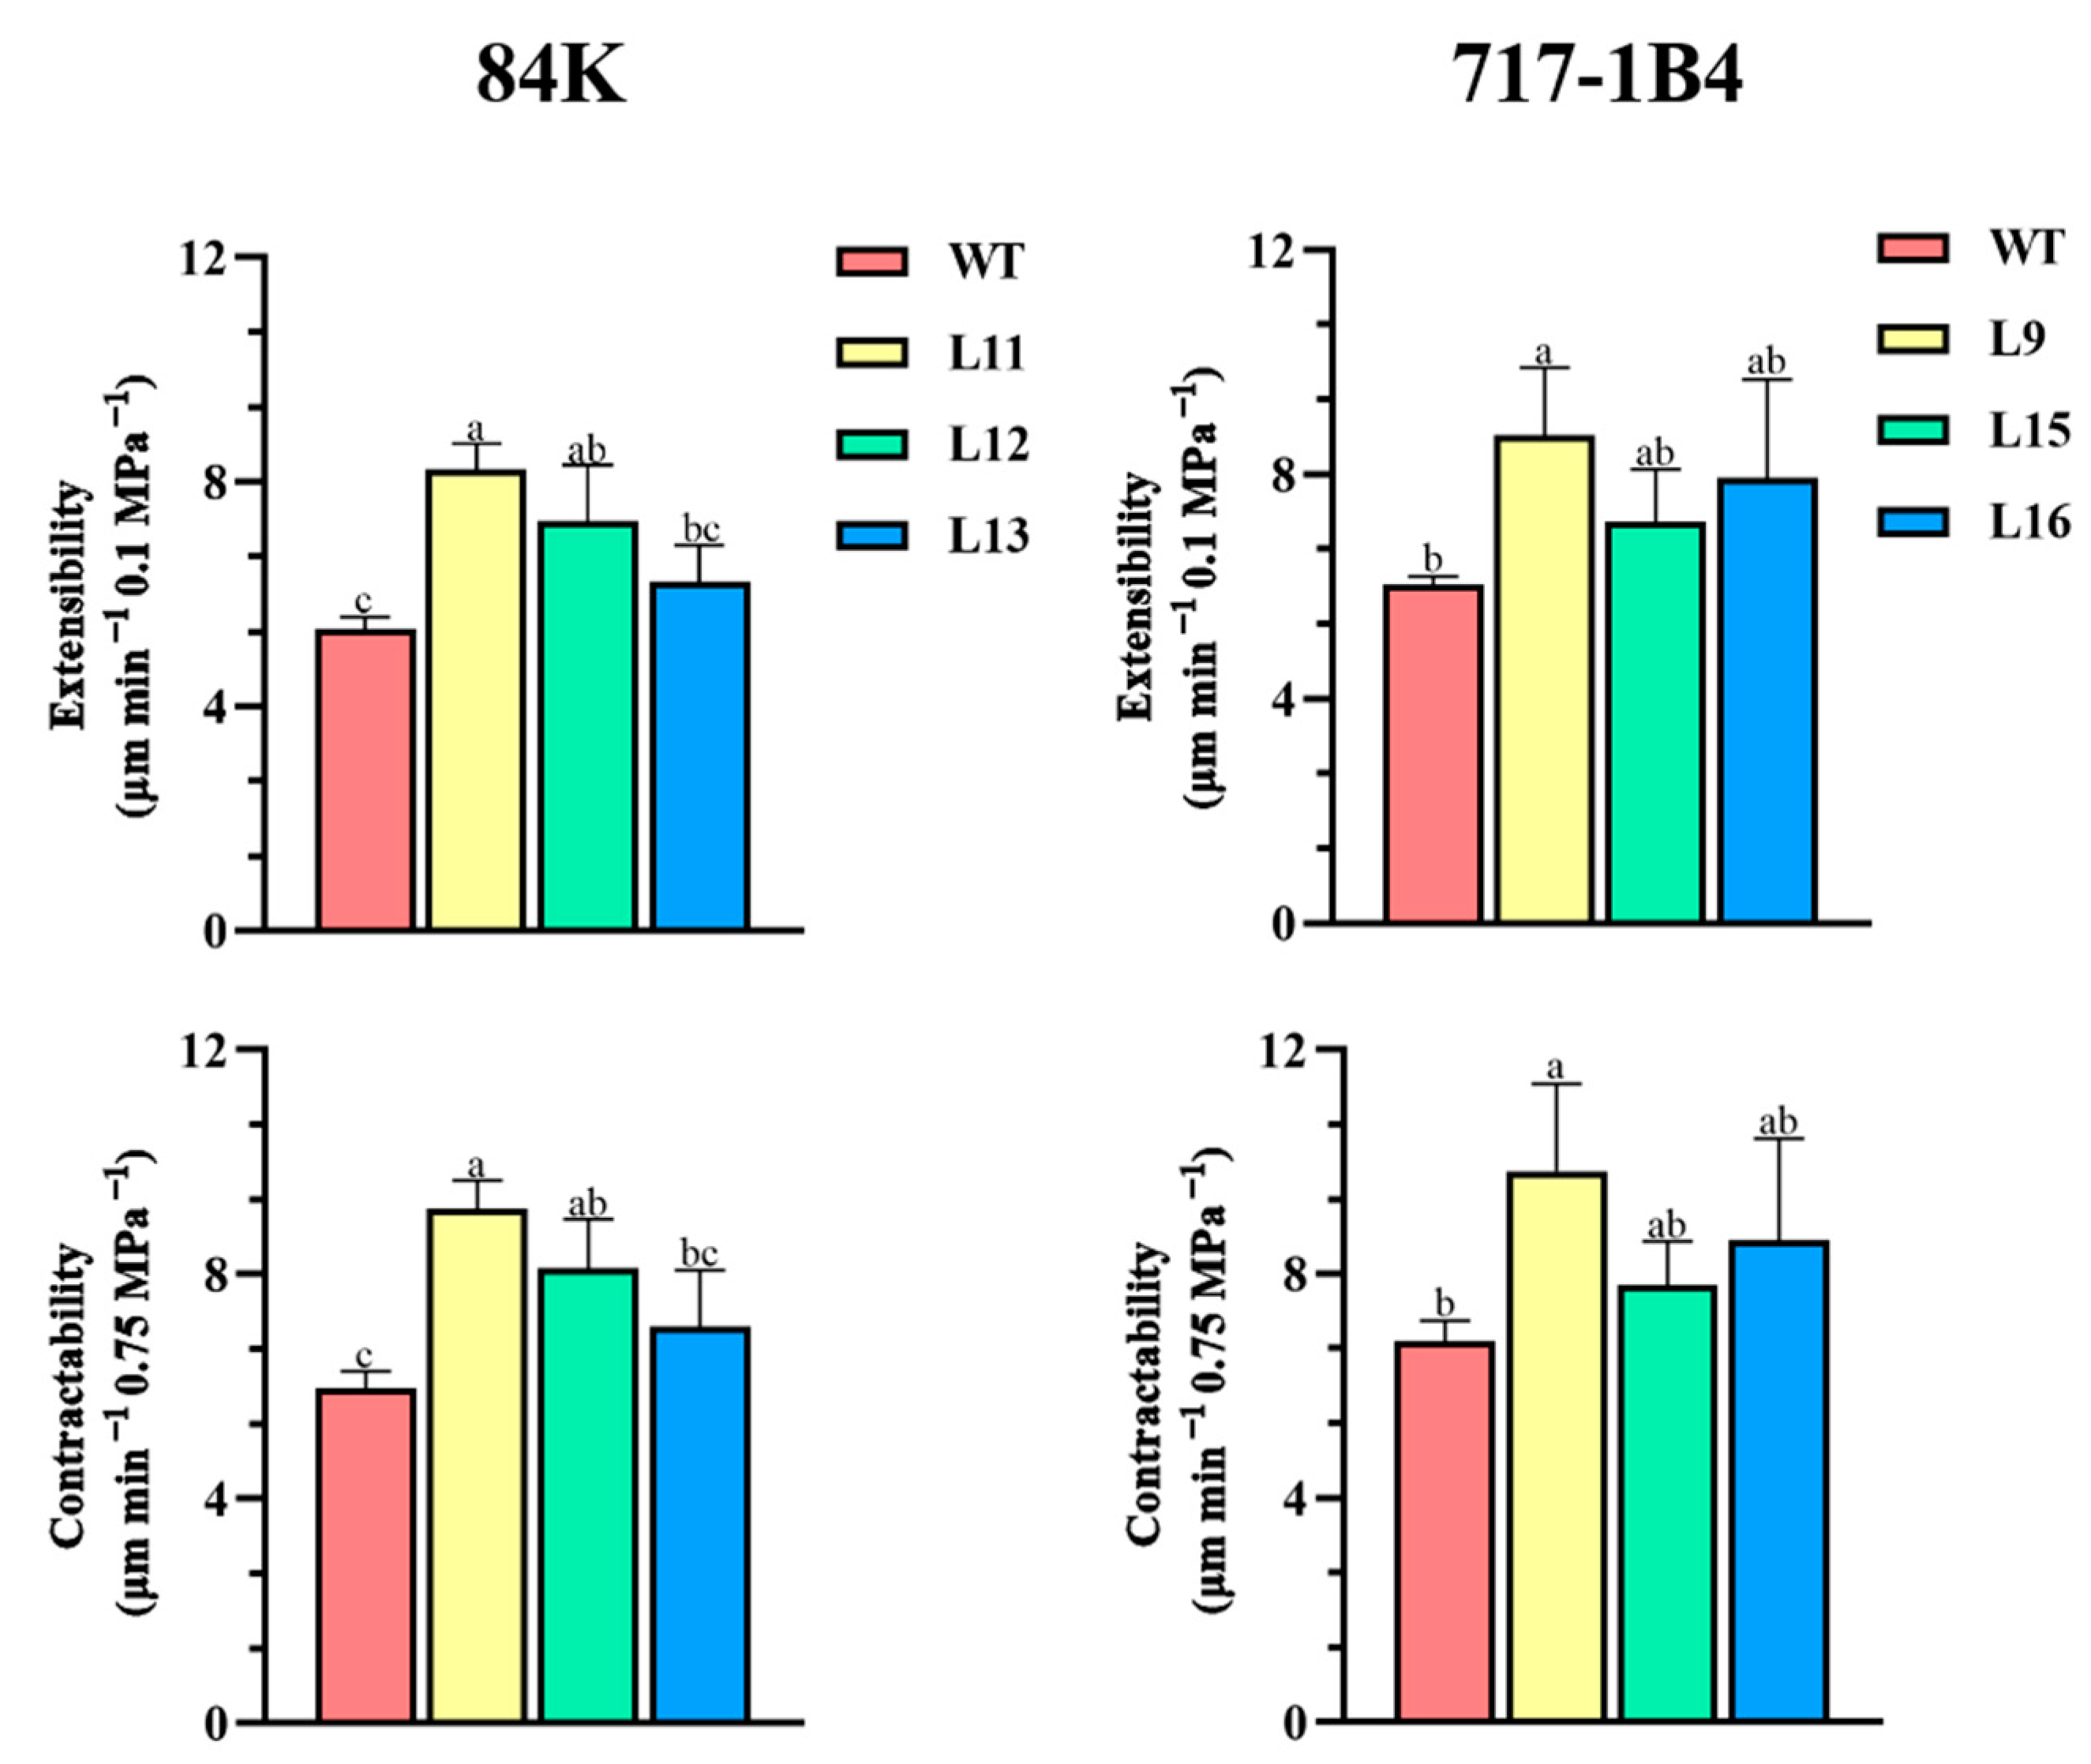
Figure 11.
Na+ flux of root xylem and the response to osmotic jump in wild type and PtEXPA6-overexpressing lines of 84K and 717-1B4. After exposure to 200 mM NaCl for 4 hours, intact root tips of 84K (L11, L12, L13) and 717-1B4 (L9, L15, L16), and wild-type (WT) were expose to 300 mOsmol kg-1 mannitol (-0.75 MPa), followed by an 0.1 MPa osmotic jump. Net Na+ flux of root xylem was measured before and after the addition of mannitol, and the subsequent 0.1 MPa osmotic jump. Data are means ± SD (n = 3), and bars with different letters indicate significant differences (p < 0.05).
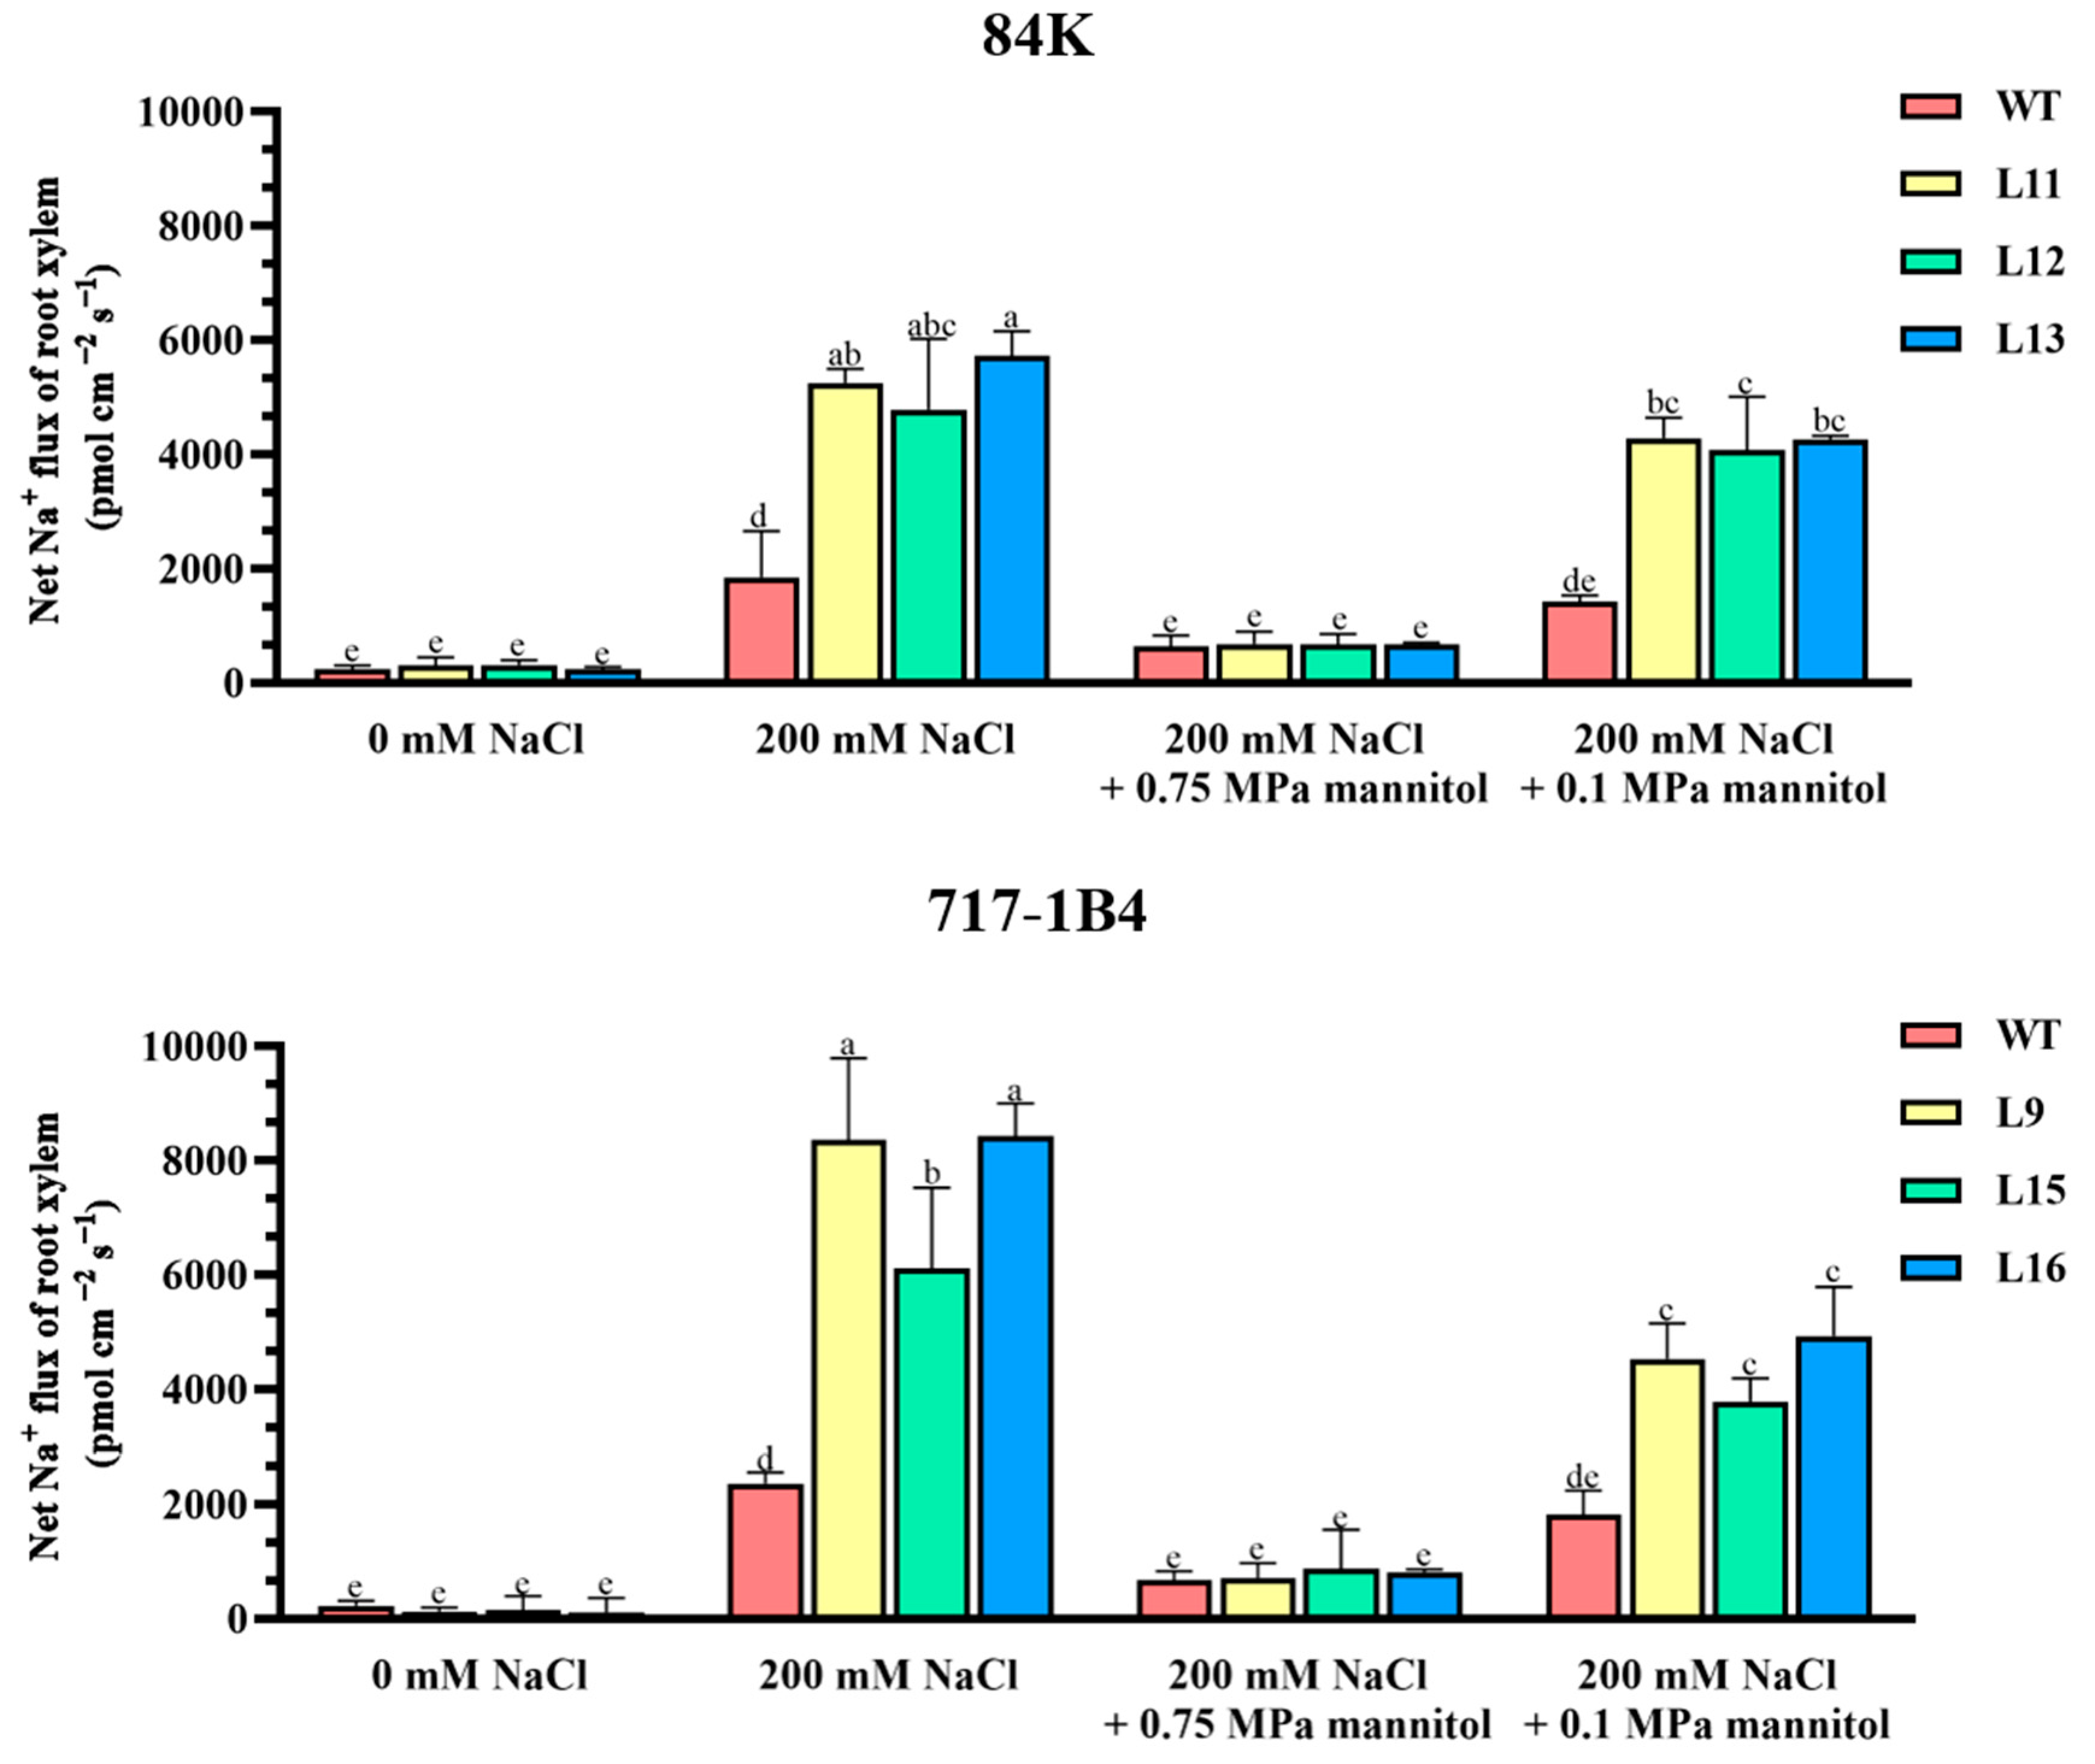
Figure 12.
Na+ flux of petiole vascular bundle and the response to osmotic jump in wild type and PtEXPA6-overexpressing lines of 84K and 717-1B4. After exposure to 200 mM NaCl for 4 hours, intact root tips of 84K (L11, L12, L13) and 717-1B4 (L9, L15, L16), and wild-type (WT) were expose to 300 mOsmol kg-1 mannitol (-0.75 MPa), followed by an 0.1 MPa osmotic jump. Net Na+ flux of petiole vascular bundle was measured before and after the addition of mannitol, and the subsequent 0.1 MPa osmotic jump. Data are means ± SD (n = 3), and bars with different letters indicate significant differences (p < 0.05).
Disclaimer/Publisher’s Note: The statements, opinions and data contained in all publications are solely those of the individual author(s) and contributor(s) and not of MDPI and/or the editor(s). MDPI and/or the editor(s) disclaim responsibility for any injury to people or property resulting from any ideas, methods, instructions or products referred to in the content. |
© 2024 by the authors. Licensee MDPI, Basel, Switzerland. This article is an open access article distributed under the terms and conditions of the Creative Commons Attribution (CC BY) license (http://creativecommons.org/licenses/by/4.0/).
Copyright: This open access article is published under a Creative Commons CC BY 4.0 license, which permit the free download, distribution, and reuse, provided that the author and preprint are cited in any reuse.


