Preprint
Article

Metabolite Profiling and Identification of Sweet/Bitter Taste Compounds in the Growth of Cyclocarya paliurus Leaves Using Multiplatform Metabolomics

Altmetrics

Downloads

113

Views

33

Comments

0

A peer-reviewed article of this preprint also exists.

Submitted:

10 August 2024

Posted:

12 August 2024

You are already at the latest version

Alerts
Abstract
Cyclocarya paliurus tea, also known as "sweet tea", a health substitute tea with Cyclocarya paliurus leaves as raw material, is famous for its unique nutritional benefits and flavor. However, due to the unique "bittersweet" of Cyclocarya paliurus tea, it is still unable to fully satisfy consumers' high-quality taste experience and oral pleasure. The taste and sensory quality of Cyclocarya paliurus tea are mainly determined by secondary metabolites. Therefore, this study aimed to explore the metabolites in Cyclocarya paliurus leaves during their growth process, particularly the composition and variation of sweet and bitter taste compounds, by combining multi-platform metabolomics analysis with an electronic tongue system and molecular docking simulation technology. The results indicated that there were significant differences in the contents of total phenols, flavonoids, polysaccharides and saponins of C. paliurus leaves in different growing months, among which the bioactive components in leaves harvested in July were the highest, and the best balance between sweetness and bitterness was achieved. A total of 575 secondary metabolites were identified as potential active metabolites related to sweet/bitter taste using nontargeted metabolomics based on UHPLC-MS/MS analysis. Molecular docking technology was utilized to study the interactions between candidate metabolites and the sweet receptor T1R2/T1R3 and the bitter receptor T2R4/T2R14. Six key compounds with high sweetness and low bitterness were successfully identified by using computational simulation analysis, including cis-Anethole, Gluconic acid, beta-D-Sedoheptulose, Asparagine, Proline, and Citrulline, which may serve as candidates for taste modification in Cyclocarya paliurus leaves. These findings provide a new perspective for understanding the sweet and bitter taste characteristics metabolites that contribute to the distinctive sensory quality of Cyclocarya paliurus leaves.
Keywords: 
Subject: Biology and Life Sciences  -   Food Science and Technology

Introduction

Cyclocarya paliurus (Batalin) Iljinskaja (C. paliurus), also known as the “the giant panda”, “sweet tea tree” and “the third tree” in traditional Chinese medicine, is a deciduous tree belonging to the genus Cyclocarya Iljinskaja (Juglangdaceae) and is widely distributed in south China, such as Hunan, Hubei, Sichuan, Guangdong, and other southern cities [1]. As a traditional edible and medicinal plant, C. paliurus leaves taste sweet, often as a “sweet tea” daily drinking in the folk, has a history of more than 500 years, and its safety and flavor have long been recognized [2]. As a traditional Chinese medicine, the leaves of C. paliurus are rich in flavonoids, terpenoids, sterols, acids, glycosides, and trace elements [3]. Many studies have reported that C. paliurus leaves have bioactivities for the treatment of hyperlipidemia, coronary heart disease and hyperglycemia or to improve immunity [3-5]. In 2013, C. paliurus leaves were approved as a new food ingredient by the National Health and Family Planning Commission, which can be eaten or drunk as ordinary food, and stipulated that its consumption method was “brewing” [6]. Recently, the tea processed from C. paliurus leaves has been industrialized and has become the first health tea approved by the US Food and Drug Administration in China, which has broad market prospects [7]. However, despite the many reputations and valuable effects of C. paliurus leaves, due to the widespread coexistence of "sweetness and bitterness" (slow sweeting, continuous aftertaste, and bitterness during the oral processing), it is still unable to fully satisfy consumers' high-quality taste experience and oral pleasure, resulting in limited product market recognition, which is not conducive to the development and promotion of the entire industry of C. paliurus [8]. In fact, the research on the processing and utilization of C. paliurus leaves mainly focuses on volatile compounds and biological activities, while the research on sweet and bitter substances in C. paliurus leaves has not been reported [9]. Therefore, exploring the potential "sweet and bitter" substances in the leaves of C. paliurus, and further screening out the key taste substances, will definitely contribute to the expansion of the application field of the whole industrial chain of C. paliurus, which has important social value and economic benefits.
"Bitterness" and "sweetness" are often functionally and metaphorically opposed and this antagonism is complicated by the fact that some compounds are both sweetness and bitterness. In fact, the sweet/bitter substances in plants were mainly composed of terpenoids (diterpenoids or triterpenes), flavonoids, glycosides, sweet/bitter amino acids, and phenolic acid [10, 11]. The detection of sweet/bitter compounds in foods or food homologous plants had traditionally relied on sensory-guided fractionation via preparative chromatography, however, the use of this method has been limited because it is time-consuming and laborious [12]. Thus, there is an urgent need to use faster and more efficient methods to screen sweet/ bitter/sweetbitter substances in plants. Moreover, few studies have been conducted on the core flavor metabolites that influence the sensory qualities of C. paliurus leaves.
As a rapid and repeatable high-throughput detection technology, metabolomics analysis can identify a wide variety of metabolites in biological samples and has been widely used to investigate the formation and transformation of various intracellular metabolisms and compounds in plants [13]. The combination of gas chromatography-mass spectrometry (GC–MS) and liquid chromatography-mass spectrometry (LC-MS) techniques is particularly powerful in achieving accurate, precise, and comprehensive metabolite profiling [14]. The electronic tongue system, as an intelligent instrument that simulates human taste, has been reported to be able to quantitatively and qualitatively analyze the taste of different Chinese herbs and food homologous plants [15, 16]. Generally, nontargeted metabolomics has been used to assess the relationship between metabolites and sensory quality, such as identifying key taste compounds in food, combined with traditional sensory evaluation and intelligent taste analysis [12]. In addition, databases related to food flavor have also been established in recent years, such as VirtualTaste, and BitterDB [17, 18]. Thus, LC-MS-based nontargeted metabolomics combined with electronic tongue analysis is an excellent method to establish the relationship between C. paliurus leaves’ core metabolites and sweet/bitter/bittersweet compounds.
According to previous reports, a growing number of studies have focused on the binding interactions between key taste compounds and taste receptors [19]. Sweet/bitter receptors play an irreplaceable role in the process of taste perception, and the research on their structure and function has become a research hotspot [20]. The perception of bitterness and sweetness stems from complex interactions between compounds and receptors. Sweetness begins with the interaction between the sweet-active substance and a special receptor (T1R2/T1R3) located on the taste buds. Therefore, the perception of sweetness was extremely low when T1R2 or T1R3 is present alone, while once the two monomers were combined, taste receptor cells can directly convert the information content of chemical stimulation into neural signals and transmit them to the brain, which can perceive almost all sweet tastes[21, 22]. Bitterness receptors belong to class A G protein-coupled receptors (GPCRs), and a total of 25 hT2Rs bitterness receptors have been identified. Bitter taste receptors (hT2R4 and hT2R14) were known to be activated by a large number of compounds originating from different chemical category [23, 24]. In fact, silico molecular modeling techniques have been successfully used to screen and evaluate the binding mechanisms of interesting compounds to taste receptors with the development of computer technology and molecular biology, including sweet and bitter receptors [19, 22].
The chemical composition, metabolites, and taste of C. paliurus leaves may vary somewhat depending on its growth period. Therefore, the present study aimed to investigate the flavor-related metabolites that contribute to the sweet/bitter/bittersweet taste of C. paliurus leaves for different growing months by using multi-platform metabolomics analysis combined with the electronic tongue system. Three analytical platforms were used, including the electronic tongue system, ultra-performance liquid chromatography/tandem mass spectrometry (UHPLC-MS/MS), and molecular docking for metabolite profiling. To select the potent sweet/bitter metabolites compounds, partial least square regression (PLSR) analyses were conducted using LC-MS-based nontargeted metabolomics combined with electronic tongue analysis. Then, molecular docking was performed to understand the interactions between the candidate sweet/bitter/bittersweet substances and homology models of the ligand-binding domain of T1R2/ T1R3 and T1R4/ T1R14. To the best of our knowledge, this study is the first to profile core taste metabolites in the C. paliurus leaves and discover its sweet bitterness-related metabolites and will provide new insight into the sweet/bitter components of the C. paliurus leaves. Moreover, successful application of the nontargeted metabolomics approach and silico molecular modeling techniques to screen plant samples for sweet/bitter compounds, which can be exploited as novel natural flavoring ingredients for plant-based foods was proved.

Materials and methods

2.1. Reagents and Chemicals

The samples of C. paliurus leave from various growth months were procured from Hunan Yueling Junshan Agroforestry Technology Co., Ltd. (Hunan, China). Folin-Ciocalteu's phenol reagent was obtained from Hefei Bomei Biotechnology Co., Ltd. (Hefei, China). Anhydrous ethanol was acquired from Anhui Ante Food Co., Ltd. (Anhui, China). Phenol was purchased from Guangdong Guanghua Technology Co., Ltd. (Guangdong, China). Sulfuric acid and perchloric acid were obtained from Hunan Huihong Reagent Co., Ltd. (Hunan, China). Gallic acid, rutin solution, glucose, and oleanolic acid were guaranteed reagents provided by Chengdu Lemeitian Pharmaceutical Technology Co., Ltd. (Chengdu, China). Anhydrous sodium carbonate, sodium nitrite, aluminum nitrate, vanillin, and glacial acetic acid were sourced from Sinopharm Chemical Reagent Co., Ltd. (Shanghai, China).

2.2. Cyclocarya paliurus Samples

All samples of C. paliurus leaves were collected from the Huping Mountains in
Shimen County, Hunan, P.R. China.(110.773665° N, 29.94036696° E). To investigate the cumulative dynamics of substances in the leaves of C. paliurus throughout its growing period, approximately 200±0.50 g of fresh, fully mature leaves was collected at four-week intervals, starting from May and ending in September 2024 (3 May, 1 June, 3 July, 6 August, and 1 September). These samples were randomly gathered from three trees with similar canopy characteristics and mixed to create a pool representing each month. All samples were dried in an oven at 60°C until a constant weight was achieved. Subsequently, the C. paliurus leaves samples were ground into powder and stored at immediately −20 ◦C for further analysis.

2.3. Electronic Tongue Analysis for C. paliurus Sample

Taste attributes (saltiness, bitterness, sourness, umami, umami aftertaste, astringency, bitter aftertaste, astringency aftertaste) of the five different growth months of C. paliurus leave samples were determined using TS-sa402b electronic tongue system (INSENT Inc., Japan) with wide area selection specific artificial lipid membrane sensors. The taste attribute index for the tested samples were calculated based on the absolute value of the lipid membrane potential for each artificial sensor, referenced against the potential of the solution. The output value of the reference solution was considered the tasteless point, set at 0 for different taste components, and values bigger than these tasteless points were considered meaningful. A precisely weighed (2.00 ± 0.05) g C. paliurus leave sample was steeped in 150 mL of boiling water for 1 hour. Subsequently, the broth was filtered through three layers of gauze and allowed to cool to 25 °C before undergoing analysis using the TS-sa402b electronic tongue system. Each sample was cycled 4 times, and the mean values of the last three cycles were used for statistical analysis using TS-sa402b Library search software (INSENT, Japan).

2.4. Determination of Total Phenolic Content (TPC), Total Flavonoid Content (TFC), Total Polysaccharide Content (TP) and Total Saponin Content (TSC)

To determine total polyphenols, total flavonoids, total polysaccharide, and total saponin, 6.0 ± 0.01 g of each C. paliurus leave powder sample was mixed with 120 mL of distilled water in a 250 mL round-bottomed flask and extracted at 90 ◦C for 40 minutes in a water bath. After extraction, each extracted solution was centrifuged at 4,500 rpm for 5 minutes. Then, all the resulting water extract was filtered through three layers of gauze three times to obtain the filtrate. The filtrate was concentrated under reduced pressure (75 kPa) and a temperature of 65°C, followed by freeze-drying using a freeze dryer (Xinzhi freeze-drying equipment Co., LTD, Ningbo, China). After drying, the lyophilized C. paliurus powder (hereinafter referred to as sample) was obtained, sealed, and stored at immediately −20 ◦C for further analysis.
The total phenolic content (TPC) in the C. paliurus leave samples was determined by the Folin-Ciocalteu method, as described by Xiao et al [25]. The results were recorded as gallic acid equivalents per gram of sample (mg GAE/g). The total flavonoid content (TFC) was assayed using aluminum nitrate colorimetry in accordance with Yang et al [26]. A standard curve was prepared using different concentrations of Rutin solution, and the results were expressed as mg rutin equivalents per gram of sample (mg RE/g). The total polysaccharide content (TP) was analyzed using the phenol-sulfuric acid method [27], and the results were expressed as mg glucose equivalents per gram of sample (mg GE/g). The detection method for TP was referred to by Zhaohu [28]. Additionally, a standard curve was prepared using different concentrations of oleanolic acid, and the results were expressed as mg oleanolic acid equivalents per gram of sample (mg OAE/g).

2.5. Nontargeted Metabolomics Analysis by UHPLC-MS/MS

2.5.1. Metabolite Extraction

Fifty milligrams of each C. paliurus leave sample were accurately weighed. Metabolites were extracted using 1 mL precooled mixtures of methanol, acetonitrile, and water (v/v/v, 2:2:1) and then placed for 1 h ultrasonic shaking in ice baths. Following sonication, the mixture was placed at -20 °C for 1 h and centrifuged at 14,000 g for 20 min at 4 °C. The supernatants were carefully recovered and concentrated to dryness under vacuum conditions. To prepare the samples for mass spectrometry, 150 µL of precooled methanol-water (4:1, v/v) solution was added to redissolve the dried sample. The resulting mixture was centrifuged at 20,000 x g for 20 minutes at 4 °C and the supernatant was collected for further analysis.

2.5.2. UHPLC-MS/MS Analysis

The metabolomics profiling was conducted using a UPLC-ESI-Q-Orbitrap-MS system (UHPLC, Shimadzu Nexera X2 LC-30AD, Shimadzu, Japan) coupled with a Q-Exactive Plus instrument (Thermo Scientific, San Jose, USA).
For liquid chromatography (LC) separations, samples were analyzed using an ACQUITY UPLC® HSS T3 column (2.1×100 mm, 1.8μm). The flow rate was 0.3 mL/min and the mobile phase consisted of: A: 0.1% FA in water and B: 100% acetonitrile (ACN). The gradient was 0% buffer B for 2 min and was linearly increased to 48% in 4 min, and then up to 100% in 4 min and maintained for 2 min, before decreasing to 0% buffer B in 0.1 min.
For mass spectrometry (MS) data acquisition, electrospray ionization (ESI) with positive and negative modes were applied separately. The following HESI source conditions were set: Spray Voltage: 3.8kV (positive) and 3.2kV (negative); Capillary Temperature: 320 ℃; Sheath Gas (nitrogen) flow: 30 arb (arbitrary units); Aux Gas flow: 5 arb; Probe Heater Temp: 350 ℃; S-Lens RF Level: 50. The instrument was set to acquire data over the m/z range of 70-1050 Da for full MS scans. Full MS scans were acquired at a resolution of 70,000 at m/z 200, with a maximum acquisition time of 100 ms for MS scans and 50 ms for MS/MS scans. The isolation window for MS2 was set to 2 m/z and the normalized collision energy (stepped) was set as 20, 30, and 40 for fragmentation.

2.5.3. Metabolome Data Preprocessing

The raw mass spectrometry (MS) data were processed using MS-DIAL for peak alignment, retention time correction, and peak area extraction. The identification of metabolites was based on accurate mass (tolerance < 10 ppm) and MS/MS data (tolerance < 0.02 Da) matched against databases such as HMDB (https://hmdb.ca/), MassBank (https://massbank.eu/MassBank/), and other public repositories. Only features with more than 50% nonzero measurement values in at least one group were retained for further analysis. In addition, The sweet bitterness-related metabolites were identified through the screening process conducted by BitterDB (https://bitterdb.agri.huji.ac.il/dbbitter.php) and VirtualTaste (https://insilico-cyp.charite.de/VirtualTaste). Based on the predicted results, these core taste metabolites were selected for further molecular docking analysis.

2.6. Computational Study of Sweet/Bitter Compound Binding to T1R2/T1R3 and T1R4/T1R14 Receptors

The core sweet bitterness-related differentially expressed metabolites were selected. Molecular docking analysis was used to clarify key sweet/bitter/bittersweet substances using a T1R2/T1R3 model and a T1R4/T1R14 model. Homology modeling was employed to generate the three-dimensional (3D) structures of human T1R2/T1R3 and T2R4/T2R14 receptors, as their structures were not available. The amino acid sequences of the sweet taste receptors hT1R2 and hT1R3, and the bitter taste receptors hT2R4 and hT2R14, were retrieved from the protein database (NCBI, http://www.ncbi.nlm.nih.gov/protein/) with accession numbers NP_689418.2, NP_689414.1, NP_058640.1, and NP_076411 [28]. Using protein sequences, 3D structures were constructed and evaluated for quality using ERRAT, Ramachandran plots, and C-scores. The best model was selected for molecular docking, with the DoGSiteScorer website (https://proteins.plus/) predicting docking sites for the receptor models [29]. Sweet /bitter/bittersweet compounds were docked into the predicted sites using AutoDock Vina, generating 20 poses for each ligand to interact with the protein binding site [30].

2.7. Statistical Analysis

The taste attributes obtained via electronic tongue analyses is expressed as means ± standard deviation and was subjected to a one-way analysis of variance (ANOVA) with Duncan’s test using SPSS (25.0, IBM) software. Hierarchical clustering analysis was performed using TBtools software (TBtools, Guangzhou, China), while SIMCA-P 14.1 multivariate statistical software (Umetrics, Umea, Sweden) was used for generating radar plots, principal component analysis (PCA), and orthogonal partial least squares discriminant analysis (OPLS-DA) along with other visual representations. The molecular docking results were visualized using PyMOL 2.2.0 software (PyMOL, DeLano Scientific LLC).

Results & Discussion

3.1. Electronic Tongue Analysis and Correlation Analysis

The taste attributes of C. paliurus leaves in five different months were measured by the electronic tongue system, as shown in Table 1. The tasteless points for all indices were set at 0, and values exceeding these tasteless points were deemed meaningful [31,32]. As depicted in Figure 1A, the electronic tongue taste sensor responded to the taste of each sample, albeit with varying sensitivities. The taste values for astringency, bitter aftertaste, and astringency aftertaste were slightly close to the tasteless point, implying that these five tastes were not the main taste indexes of C. paliurus leaves, while the three taste indexes of sweetness, bitterness, and umami all had values higher than the tasteless points (p <0.05), signifying that these were the effective sensory indices for C. paliurus leave in different months. As a new food raw material, C. paliurus tea has gradually entered the field of view of more consumers. However, C. paliurus tea has both widespread coexistence sweetness and bitterness, which cannot meet the oral pleasure of consumers, resulting in a low market recognition of C. paliurus tea products. Therefore, this study primarily focused on the sweetness and bitterness of the five different growth mouths of C. paliurus leaves. As illustrated in Figure 1B, the sweetness of C. paliurus leaves harvested in July was slightly higher than that in other months, while the bitterness was significantly lower than that in other months. According to previous reports [33], the sweetness and bitterness of health substitute tea was mostly determined by chemical composition, such as flavonoids, polyphenols, polysaccharides, and saponins. Hence, further main active compounds analysis and nontargeted metabolomics analysis of the five different growth mouths of C. paliurus leaves were carried out.
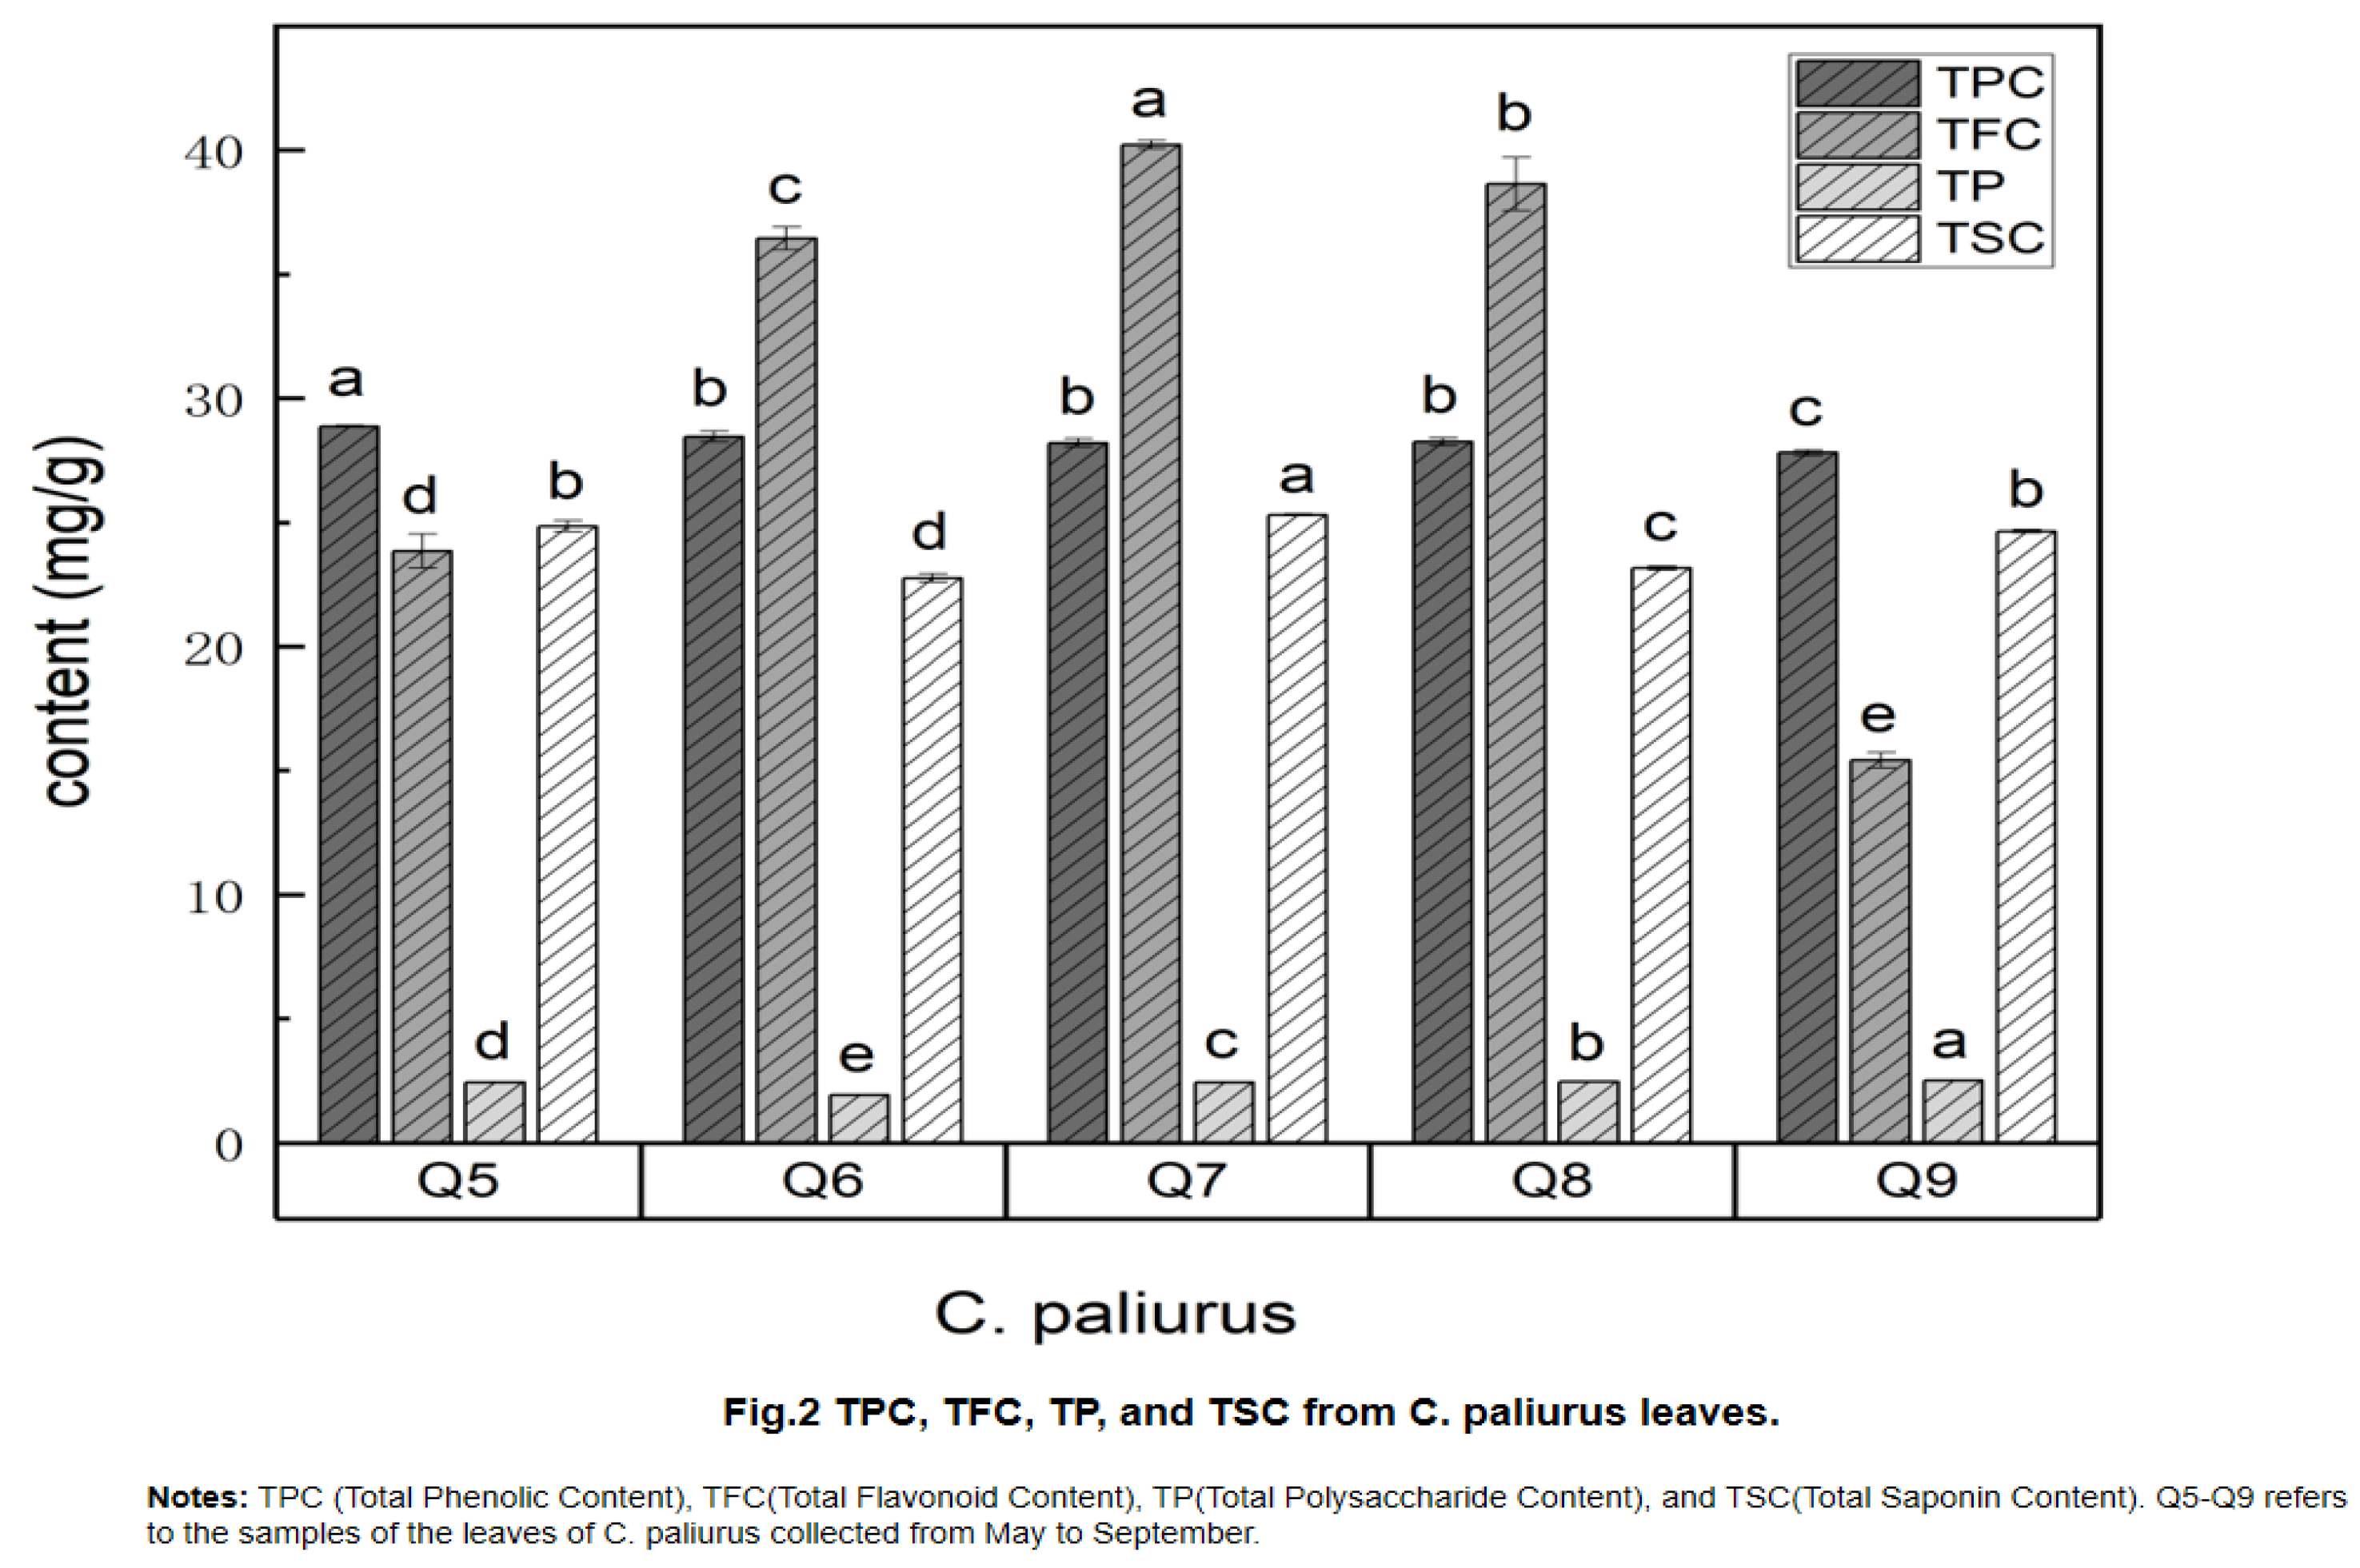
Flavonoids, polyphenols, polysaccharides, and saponins were widely present in C. paliurus leaves. The TPC, TFC, TP, and TSC of C. paliurus leaves in different growth mouths were presented in Figure 2. The TPC of C. paliurus leaves in different growth mouths was exhibited a consistent decline, suggesting a stable or negative progression, while the TFC was demonstrated a fluctuating pattern, initially rising before falling. In term of the TP and TSC, a reversal was observed in the TP of C. paliurus leaves in different growth periods, where an initial decline was succeeded by an upward movement, indicating a potential turning point or recovery. Moreover, the TSC of C. paliurus leaves of with diffierent growth mouths was displayed periodic fluctuations, which could be associated with seasonal factors. In fact, phenolic acids were responsible for C. paliurus tea's distinctive color and taste, and the bioactive components contribute to its antibacterial, antiviral, antioxidation, antihypertension, and hypolipidemic activities [3, 34-35]. Previous studies on chemical composition showed that C. paliurus leaves contain rich phenolic acid compounds, especially flavonoids [4, 36-37]. As shown in Figure 2, the active components of C. paliurus exhibit dynamic seasonal variations,which indicate that the highest content of the TFC, TP, and TSC was found in the C. paliurus leaves harvesting in July. Moreover, correlation analysis showed that there are no significant relationship between sweet and bitter tastes and TPC, TFC, TP, and TSC (Figure 7). Nevertheless, previous research has suggested that a higher polyphenol content contributes to increased bitterness [33]. The bitterness induced by polyphenols is influenced not only by their overall content but also by the specific composition of the polyphenols, their bitterness thresholds, and the effective concentrations at which they were present. Furthermore, empirical evidence suggested that the perceived intensity of bitterness does not exhibit a direct linear correlation with the concentration of these compounds [38]. Consequently, nontargeted metabolomics and molecular docking technology were employed to further analyze the intrinsic relationship between sweet /bitter/bittersweet substances.

3.3. Nontargeted Metabolomics Analysis of C. paliurus Leaves

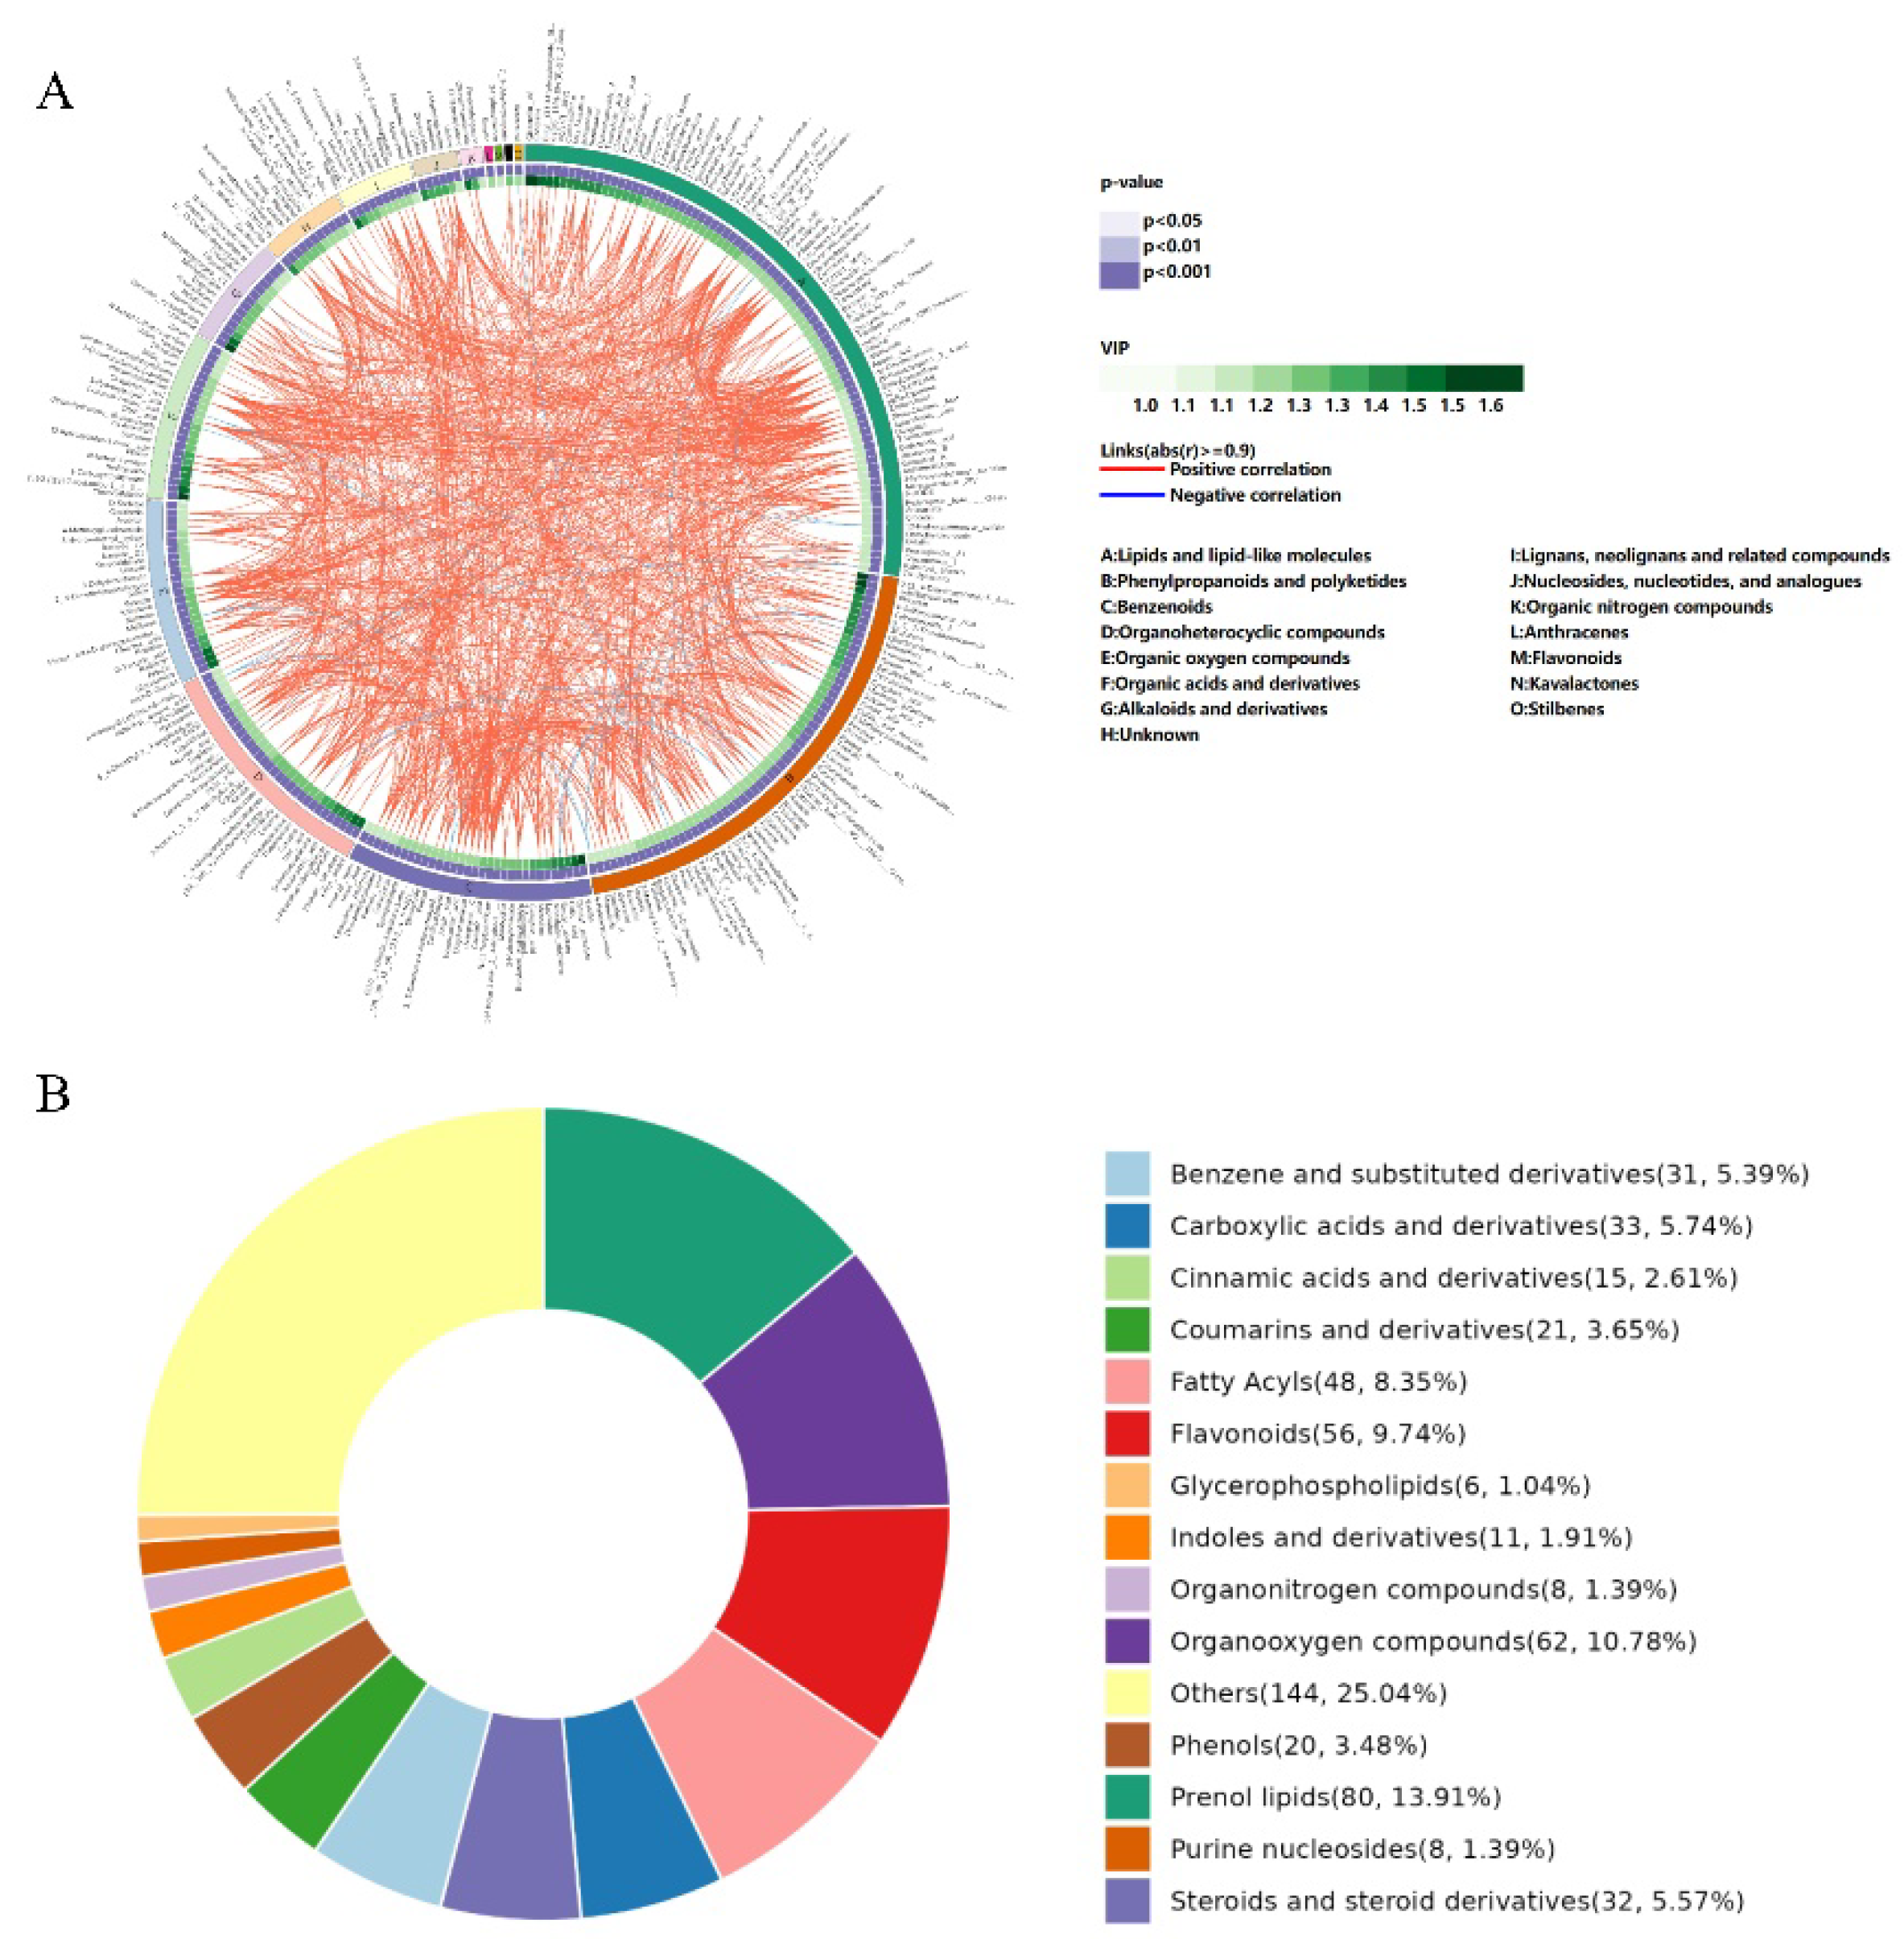
The initial investigation revealed that C. paliurus leaves possessed notable bitterness in addition to their sweetness, factors that significantly affect their sensory quality. In this study, nontargeted metabolomics based on UHPLC-MS/MS analysis was undertaken to identify the potential sweet and bitter components within C. paliurus leaves. Utilizing the PRIMe database (PRIMe: Platform for RIKEN Metabolomics) for search and metabolite analysis, a total of 1571 secondary metabolites were successfully characterized from the C. paliurus leaves, with both positive and negative patterns detected. The circus plot was used to analyze the association between differential metabolites and classification. Metabolite name, HMDB classification of metabolite, p-value, VIP from OPLS-DA analysis, and correlation line were listed from outside to inside. As shown in Figure 3A, These different metabolites included 603 positive correlation (38.4%), 441 negative correlation (28.1%). Of these, 575 differential metabolites were identified and systematically categorized into 15 distinct classes (Figure 3B). These categories included 80 Prenol lipids (13.91%), 62 Organooxygen compounds (10.78%), 56 Flavonoids (9.74%), 48 Fatty Acyls (8.35%), 33 Carboxylic acids and derivatives (5.74%), 32 Steroids and steroid derivatives (5.57%), 31 Benzene and substituted derivatives (5.39%), 21 Coumarins and derivatives (3.65%), 20 Phenols (3.48%), 15 Cinnamic acids and derivatives (2.61%), 11 Indoles and derivatives (1.91%), 8 Organonitrogen compounds (1.39%), 8 Purine nucleosides (1.39%), 6 Glycerophospholipids (1.04%), and 144 other undefined compounds (25.04%).
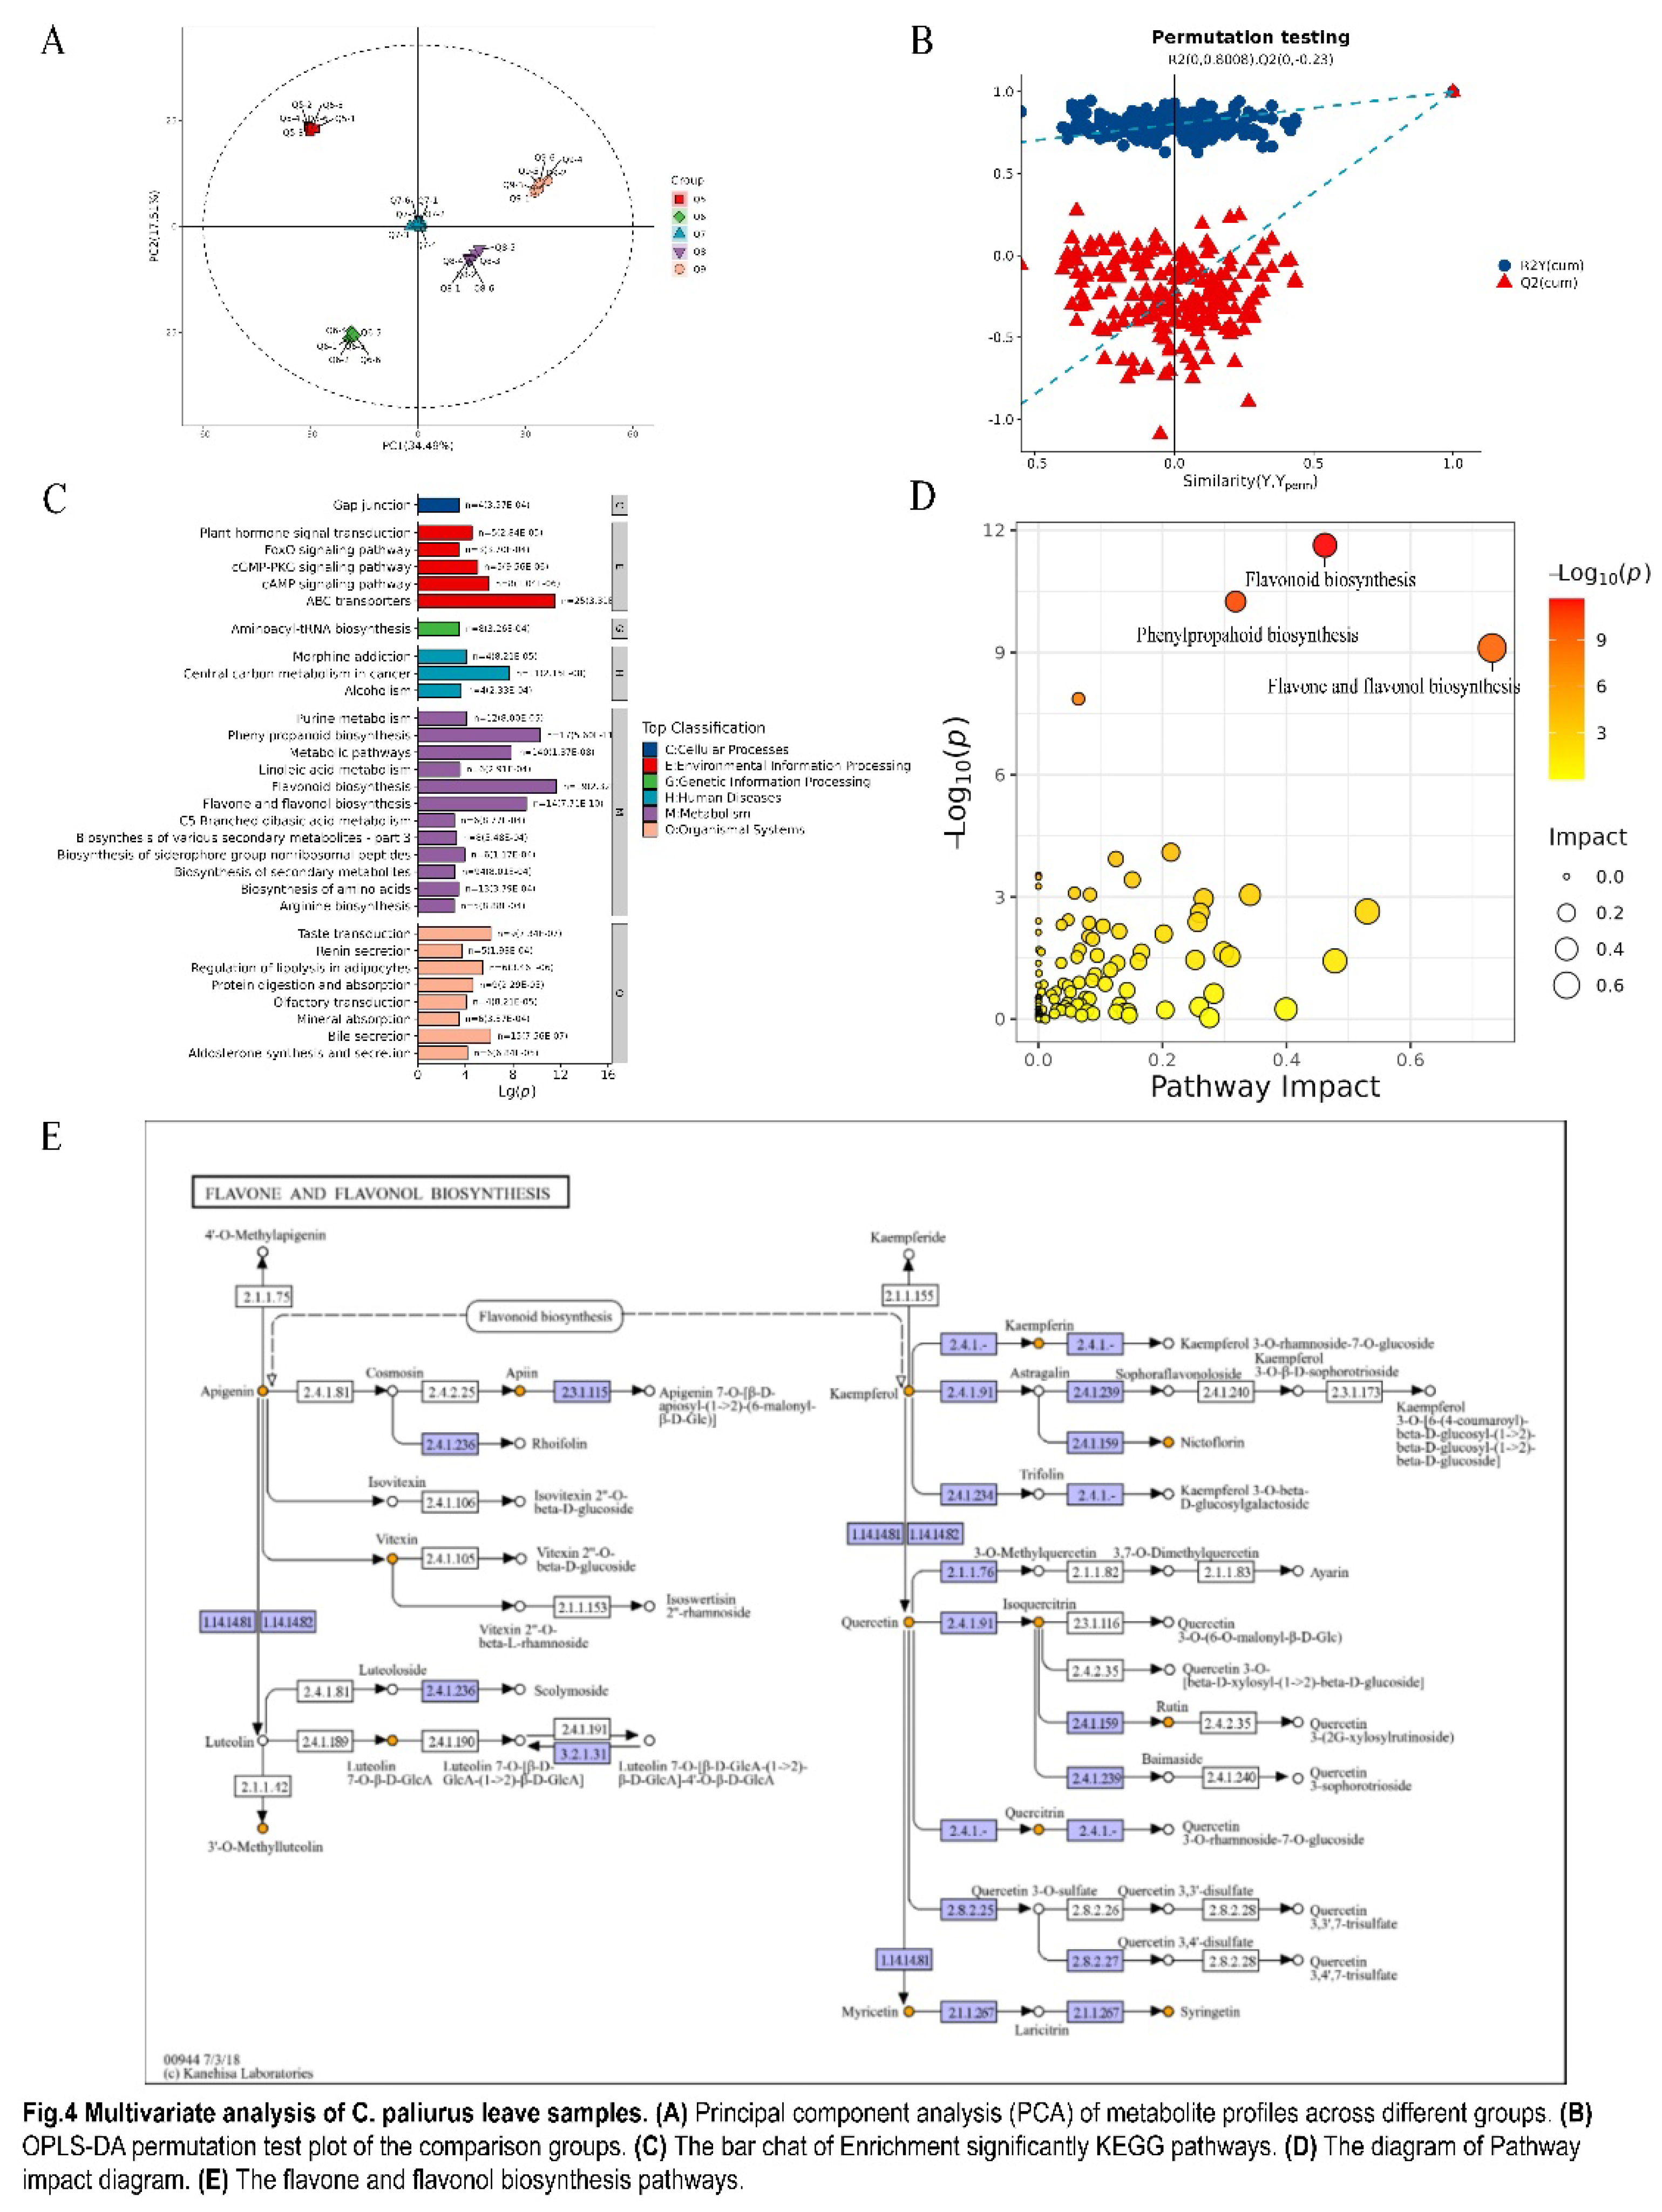
The principal component analysis (PCA), partial least squares discriminant analysis (PLS-DA), and orthogonal projections to latent structures discriminant analysis (OPLS-DA) had been used to pinpoint metabolite combinations that explain the highest variance and to illustrate the clustering patterns of tea samples [39]. All metabolites were subjected to multivariate analysis using SIMCA-P 14.1 multivariate statistical software. The results of the PCA (Figure 4A) illustrated that PC1 and PC2 accounted for 34.49% and 17.51% of the total variation, respectively. In addition, five samples were completely separated in the PCA map, which indicated that there were significant differences in the metabolite content of samples from different growth months. The OPLS-DA utilizes a predictive principal component (t1) for group difference detection and multiple orthogonal components for intra-group variability. Therefore, to obtain a higher level of population separation and better understand the differences between C. paliurus leaves in different months, the OPLS-DA was used for classification (Figure 4B). Permutation test cross-validation confirmed the robustness of the OPLS-DA model, exhibiting R2 and Q2 intercepts of 0.999 and 0.9975, respectively (Table 2), which was proved that the model had good prediction ability.
Since different metabolites coordinate their biological functions, the Kyoto Encyclopedia of Genes and Genomes (KEGG) pathway-based analysis would be instrumental in further elucidating their roles [40]. Fisher's Exact Test was used to analyze and calculate the significance level of metabolite enrichment in each pathway to identify the metabolic and signal transduction pathways that are significantly affected. The KEGG enrichment pathway map was presented in Figure 4C. The x-axis represents the negative logarithm of the p-values, while the y-axis indicated the specific pathways. The color of the bars was assigned based on the KEGG pathway level 1 classification.
As shown in Figure 4D, the majority of differentially expressed metabolites were primarily associated with biosynthetic pathways, such as flavonoid and flavonol biosynthesis, flavonoid biosynthesis, phenylpropanoid biosynthesis, and other pathways highlighted by the KEGG enrichment analysis, all of which exhibit statistical significance (p < 0.05). As the most significant pathway impact pathway, the flavone and flavonol biosynthesis pathways had been extensively studied in C. paliurus [41]. Given the visual representation of the pathway in Figure 4E, the complex network of synthesis and transformation of key flavonoid components such as apigenin, luteolin, and their glycosides and derivatives was revealed. The diagram captured the interplay between these compounds and their conversion into various forms. Additionally, it highlighted the synthesis and transformation of three flavonol components: kaempferol, quercetin, and myricetin, as well as their derivatives. Flavonols belong to the class of flavonoids, which mainly exist as glycosides in C. paliurus leaves, and have a certain contribution to the taste quality of tea, especially bitterness [42]. In this study, the data of nontargeted metabolomics analysis showed a correlation with the taste index of the electronic tongue analysis, in which the luteolin (VIP=1.22) and apigenin (VIP=1.14) had the core contribution to the difference between these C. paliurus leave samples as indicated by high VIP values, which were responsible for tea infusion's bitterness [42]. During the growth of C. paliurus leaves in different months, the concentration of luteolin exhibited a pattern of initial increase followed by a decrease, peaking in June. In contrast, the concentration of apigenin followed an inverse trend, initially declining and then rising, with the lowest concentration observed in June. Overall, the core bitterness-related metabolic (luteolin and apigenin) variation between the C. paliurus leaves growth stages was revealed via nontargeted metabolomics analysis. However, as a unique "sweet-bitterness" new food raw material, C. paliurus leaves have both widespread coexistence sweetness and bitterness, and the key metabolites of potential "sweet-bitterness" in C. paliurus leaves have not been reported. Therefore, a deeper investigation into the differential metabolites that contribute to the characteristic sweet-bitterness of C. paliurus leaves was carried out.
To identified the differential metabolites that may be related to the sweet/bitter taste of C. paliurus, the 575 different metabolites were further screened by BitterDB (https://bitterdb.agri.huji.ac.il/dbbitter.php) and related literature, and using VirtualTaste (https://insilico-cyp.charite.de/VirtualTaste) to predict the sweet and bitter taste. A total of 68 metabolites predicted to be active in sweetness. The Variable Importance for the Projection (VIP) score measures metabolite expression patterns' impact on sample classification, identifying key discriminative. Therefore, the core metabolites with VIP≥1 were selected from VirtualTaste and were used to predict important explanatory variables for sweet and bitter substances. Detailed information about these metabolites was provided in Table S1. These metabolites included 20 Phenylpropanoids and polyketides (29.0%), 17 Lipids and lipid-like molecules(24.6%), 12 Organic oxygen compounds(17.4%), 8 Organic acids and derivatives(11.6%), 6 Benzenoids(8.7%), 2 Lignans, neolignans and related compounds(2.9%), 1 Kavalactones(1.4%), 1 Organic nitrogen compounds(1.4%), 1 Organoheterocyclic compounds(1.4%),1 Superclass(1.4%).

3.4. Molecular Docking of Candidate Sweet/Bitter Substances with the T1R1/ T1R3、T2R4/T2R14 Receptors

To investigate the potential sweet/bitter/bittersweet substances, molecular docking analysis was conducted to evaluate the stability of and the interaction between these substances and the human sweet receptors (T1R1/TIR3) and bitter receptors (T2R4/T2R14). The 68 core sweetness metabolites predicted as active by sweetness were further screened (Sweet Prediction > 0.7, Bitter Prediction > 0.7) and categorized into four groups for detailed analysis: Category 1 included bitter substances identified in BitterDB with active Bitter Predictions in VirtualTaste; Category 2 comprised bitter substances listed in BitterDB but predicted as inactive in VirtualTaste; Category 3 encompassed non-bitter substances according to BitterDB with active Bitter Predictions in VirtualTaste; Category 4 consisted of bitter substances found in BitterDB but rated as inactive in VirtualTaste (Table S2).
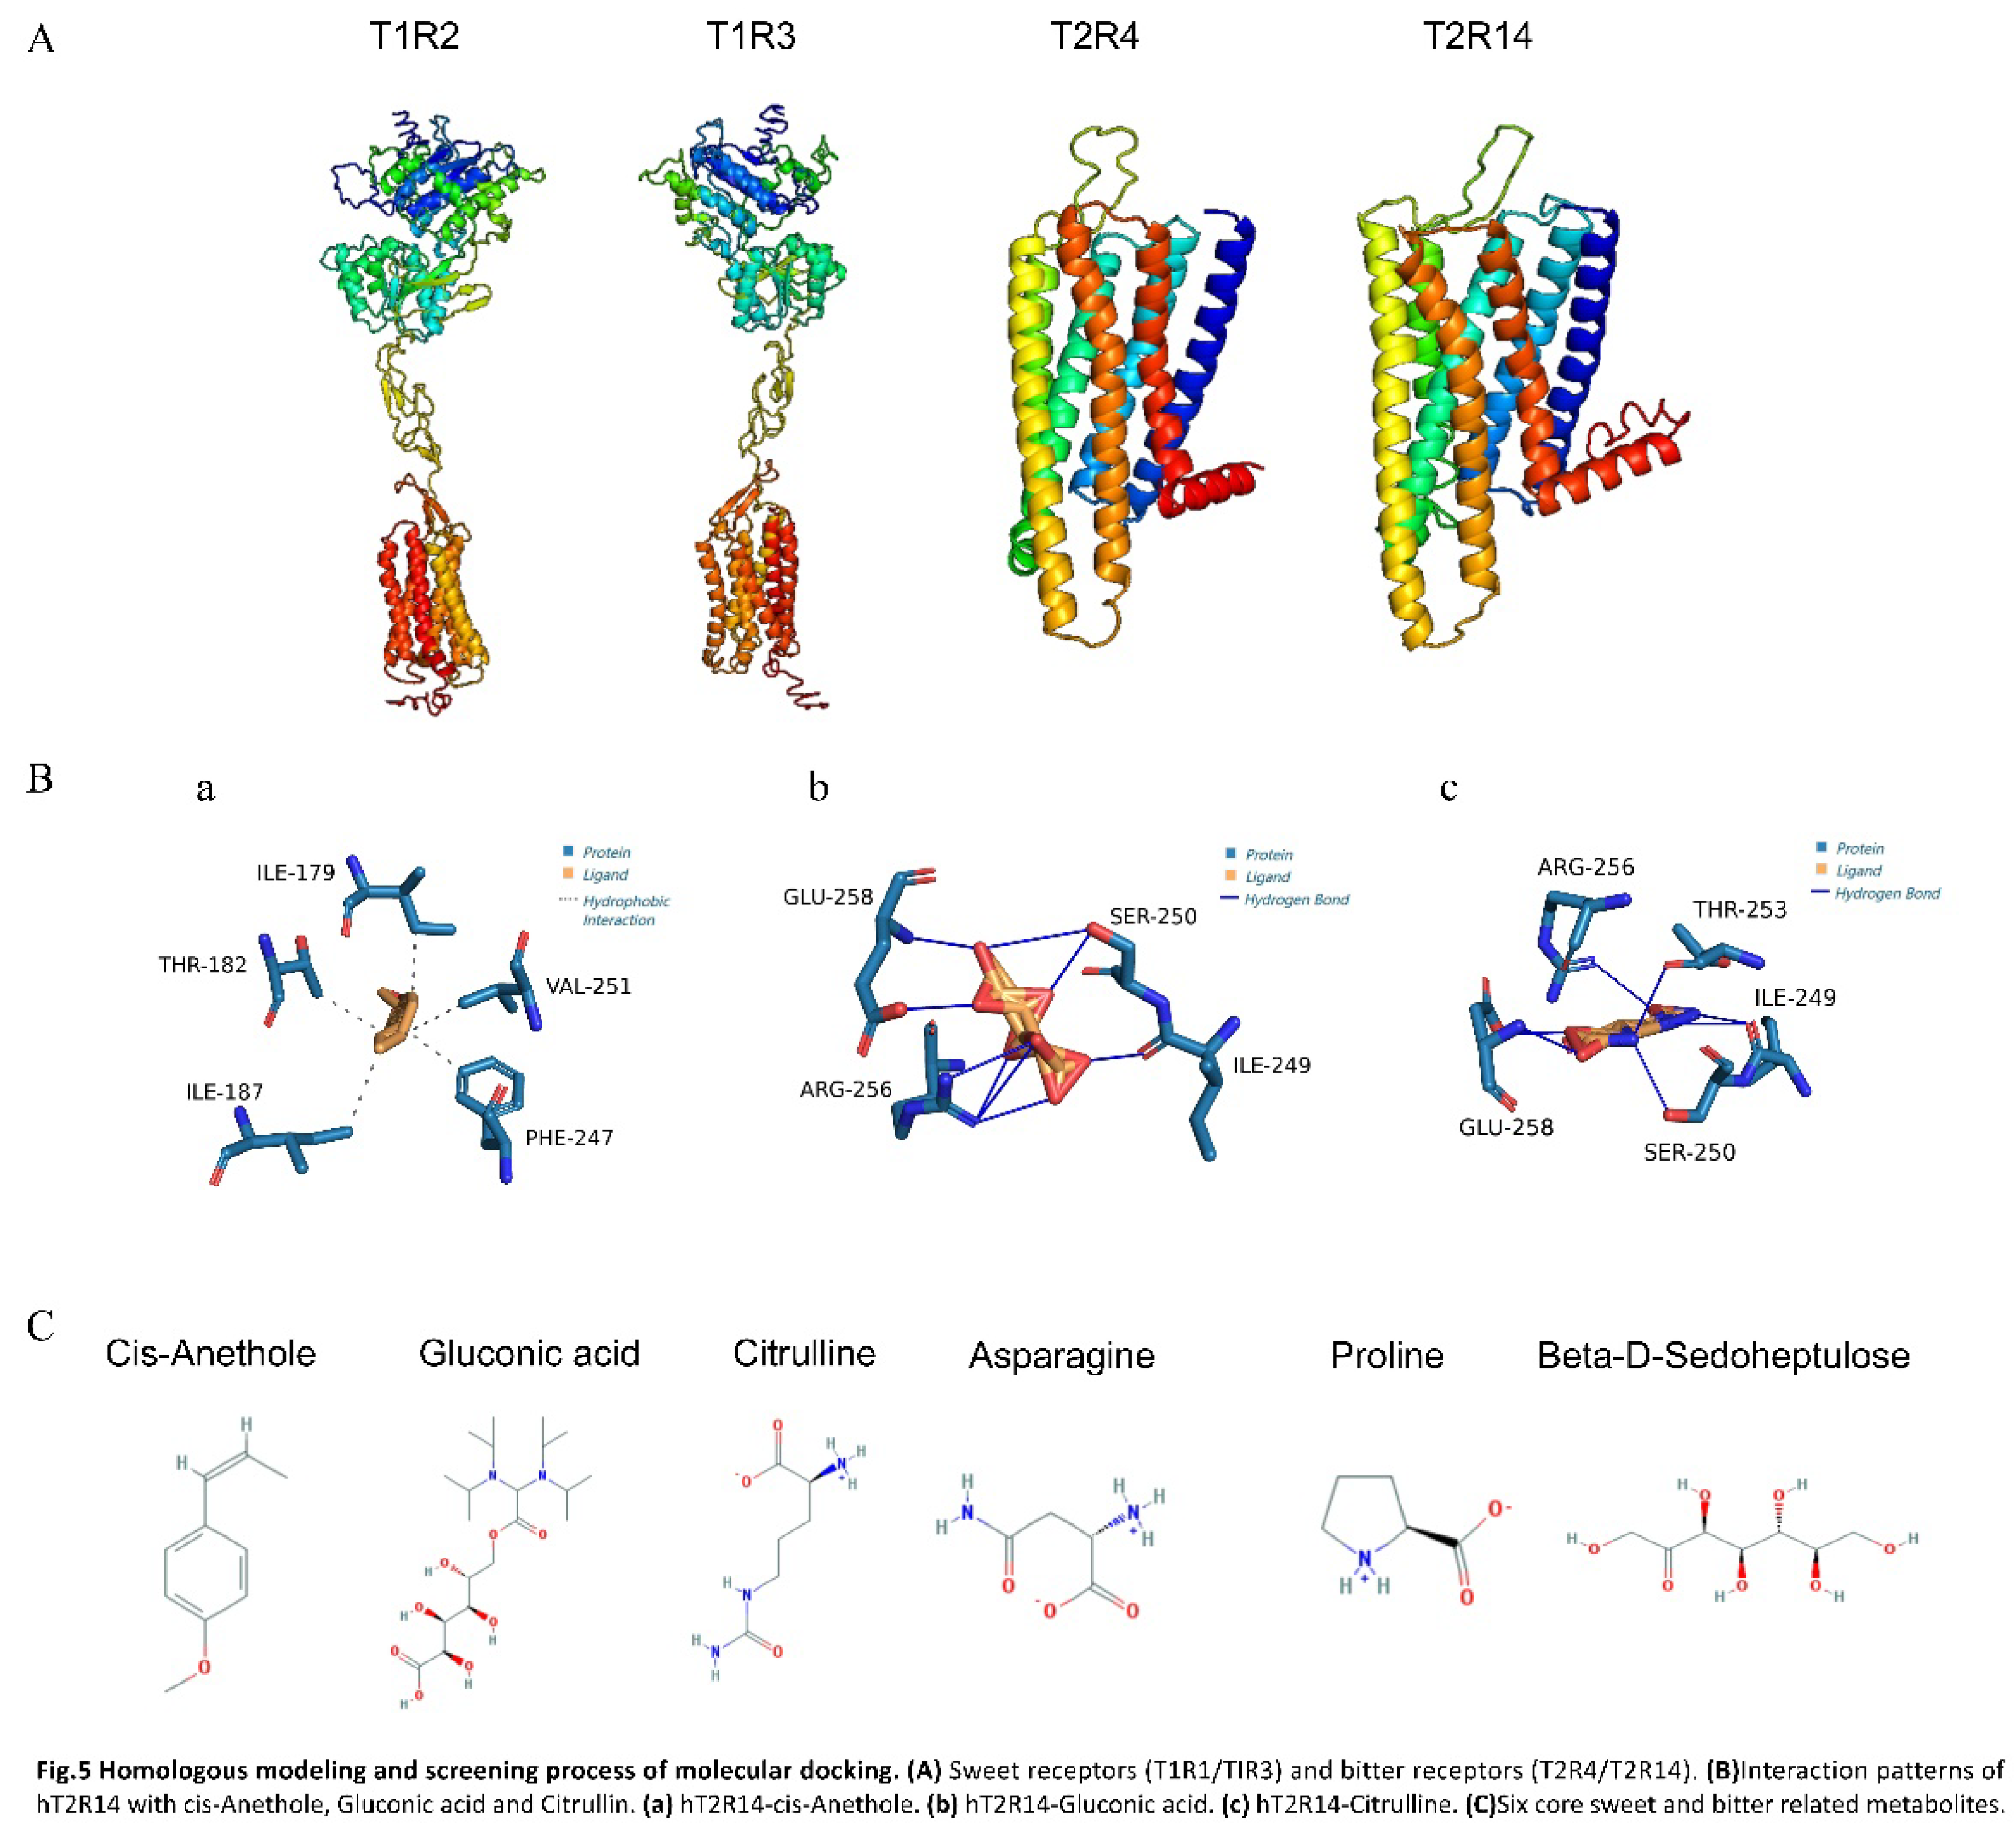
The amino acid sequences of sweet taste receptors hT1R2 and hT1R3, and bitter taste receptors hT2R4 and hT2R14 (IDs NP_689418.2, NP_689414.1, NP_058640.1, NP_076411.1, respectively) were downloaded from the NCBI database (Figure S1). Each sequence was submitted individually to the I-TASSER online modeling server, which employed the LOMETS multi-threaded method to identify structural templates in the PDB database. The server selected the top-scoring template from each of the 10 threaded programs based on Z-score, a measure of template alignment quality. Following template selection, I-TASSER constructs a full-length protein model by assembling contiguous segments derived from the threaded alignment through a Monte Carlo simulation that replicates an exchange process. This computational approach generated comprehensive 3D protein models suitable for further analysis and molecular docking studies [43]. The quality of the resulting models was assessed using ERRAT, Ramachandran plots, and C-score to select the optimal model for subsequent molecular docking (Figure 5A).
The DoGSiteScorer (https://proteins.plus/) website was utilized to predict docking sites for hT1R2, hT1R3, hT1R4, and hT1R14 proteins. Sweet taste receptor binding sites (hT1R2 and hT1R3) were identified in the Venus Flytrap Module (VFTM), situated in the central cleft between two larger lobes. In contrast, bitter taste receptor binding sites (hT1R4 and hT1R14) were located in the central cavity formed by seven transmembrane helices, consistent with prior research on docking sites of sweet and bitter taste receptors with various ligands [44, 45].
The small molecules, after undergoing pre-treatment, were subjected to docking simulations with four pre-processed receptor models using the Vina software. The binding energy (Affinity) of the ligand conformation is defined as a key parameter in the process of molecular docking, which is a lower binding energy indicates a more stable ligand conformation. This stability correlates with a stronger binding affinity to the protein receptor, suggesting a potentially higher inhibitory effect on the receptor's activity [46]. Given the direct correlation between the sweetness of a ligand and its interaction energy with sweetness receptors, the hT1R2 and hT1R3 are capable of independently yet synergistically generating sweetness signals. This dual capacity facilitates a cumulative effect, wherein the combined action of these receptors can significantly amplify the perceived sweetness [47]. To elucidate the differential effects on taste perception, an analysis comparing the binding affinities of the sweet and bitter taste receptors was conducted. Specifically, this study calculated the sum of the lowest binding energies (denoted as As) for the binding sites of the sweet taste receptors hT1R2 and hT1R3. At the same time, the sum of the lowest binding energies of the bitter receptors hT2R4 and hT2R14 (expressed as Ab) was also predicted. This comparative approach allowed us to assess the relative inhibitory potential of the ligands on the receptors responsible for sweet and bitter taste sensations. The relevant docking results were shown in Table 3. The data of correlation analysis pointed out that a positive correlation between the sum of the lowest binding energies of the sweet receptor (As) and the Sweet Predict scores, indicating that the likelihood of the ligand being perceived As sweet increased with the increase in As. Conversely, a negative correlation was observed between the sum of the lowest binding energies for the bitter taste receptors (Ab) and the Bitter Predict scores, indicating that higher Ab values were linked to a reduced likelihood of bitterness perception. Thus, As≥-15 and Ab≥-15 were identified as thresholds for the identification of high sweetness and low bitterness metabolites. Finally, six compounds (cis-Anethole, Gluconic acid,beta-D-Sedoheptulose, Asparagine, Proline, Citrulline) were selected to match the conditions ( As≥-15 and Ab≥-15) (Figure 5C). Among them cis-Anethole belongs to Benzenoids, Gluconic acid, and beta-D-Sedoheptulose belongs to Organic oxygen compounds. Asparagine, Proline, and Citrulline belong to Organic acids and derivatives. Based on the average standardized peak area data from Table S3, the levels of the six metabolites in C. paliurus leaves remained high from May to September. Sedoheptulose exhibited the highest content, with significant fluctuations across different months. In contrast, the levels of the other five metabolites were relatively consistent during June, July, and August. Therefore, these six core metabolites with high sweetness and low bitterness, which could be potential candidates for taste modulation in C. paliurus leaves. The findings suggested that by selectively enriching these compounds or by employing targeted breeding and genetic modification strategies, it may be possible to enhance the palatability of C. paliurus products. In addition, this method enabled the targeted identification of compounds that are likely contributors to the sweet and bitter, thereby deepening our comprehension of the molecular underpinnings of taste perception within this specific context.
Currently, the hT2R14 receptor was recognized as one of the most broadly responsive bitterness receptors, capable of detecting a wide array of bitter compounds [48, 49]. The potency of these bitter substances can be significantly mitigated through the inhibition of the hT2R14 receptor, offering a potential strategy for modulating bitterness intensity in various applications. The THR (threonine), ASP (aspartic acid) and PHE (phenylalanine) were identified as the key amino acids responsible for the docking of bitter taste blocker with hT2R14 in molecular docking calculation [50]. The interaction between the hT2R14 receptor and cis-Anethole, Gluconic acid, and Citrulline was assessed using the PLIP web service(Protein-Ligand Interaction Profiler, https://projects.biotec.tu-dresden.de/plip-web/plip/index), which provides an online platform for predicting and analyzing protein-ligand interactions. The results of this prediction were then imported into PyMOL, a molecular visualization tool, to render a three-dimensional representation of the complex. According to Figure 5B, the analysis of the ligand's interaction with the hT2R14 model at the docking site revealed distinct binding characteristics for the core metabolites from C. paliurus leaves. Cis-Anethole was demonstrated no interaction with ASP but formed hydrogen bonds with THR-182 and PHE-247. Citrulline was found to engage in hydrophobic interactions with THR-253. In contrast, Gluconic acid did not create any significant bonds with the amino acids THR, ASP, or PHE. The differential binding profiles of these metabolites to the hT2R14 receptor were reflected in their respective binding energies (Ab), with cis-anethole showing the lowest, followed by Citrulline, and Gluconic acid exhibiting the highest. This order of binding energies (cis-Anethole < Citrulline < Gluconic acid) suggests a potential inverse relationship between the binding strength to the receptor and the perceived bitterness of the metabolites. This methodological approach, therefore, offers a promising strategy for predicting the bitterness intensity of differential metabolites in C. paliurus leaves. By identifying metabolites that exhibit weaker binding to the hT2R14 receptor, it may be possible to select or modify compounds that contribute favorably to the taste profile of C. paliurus tea, enhancing their palatability and potential health benefits. Furthermore, the identification of key amino acids involved in the binding of bitter compounds to the hT2R14 receptor opens up avenues for developing taste blockers or modifiers that can reduce the bitterness of C. paliurus extracts. This could involve the design of small molecules that can competitively inhibit the binding of bitter compounds to the receptor, thereby reducing their perceived bitterness.
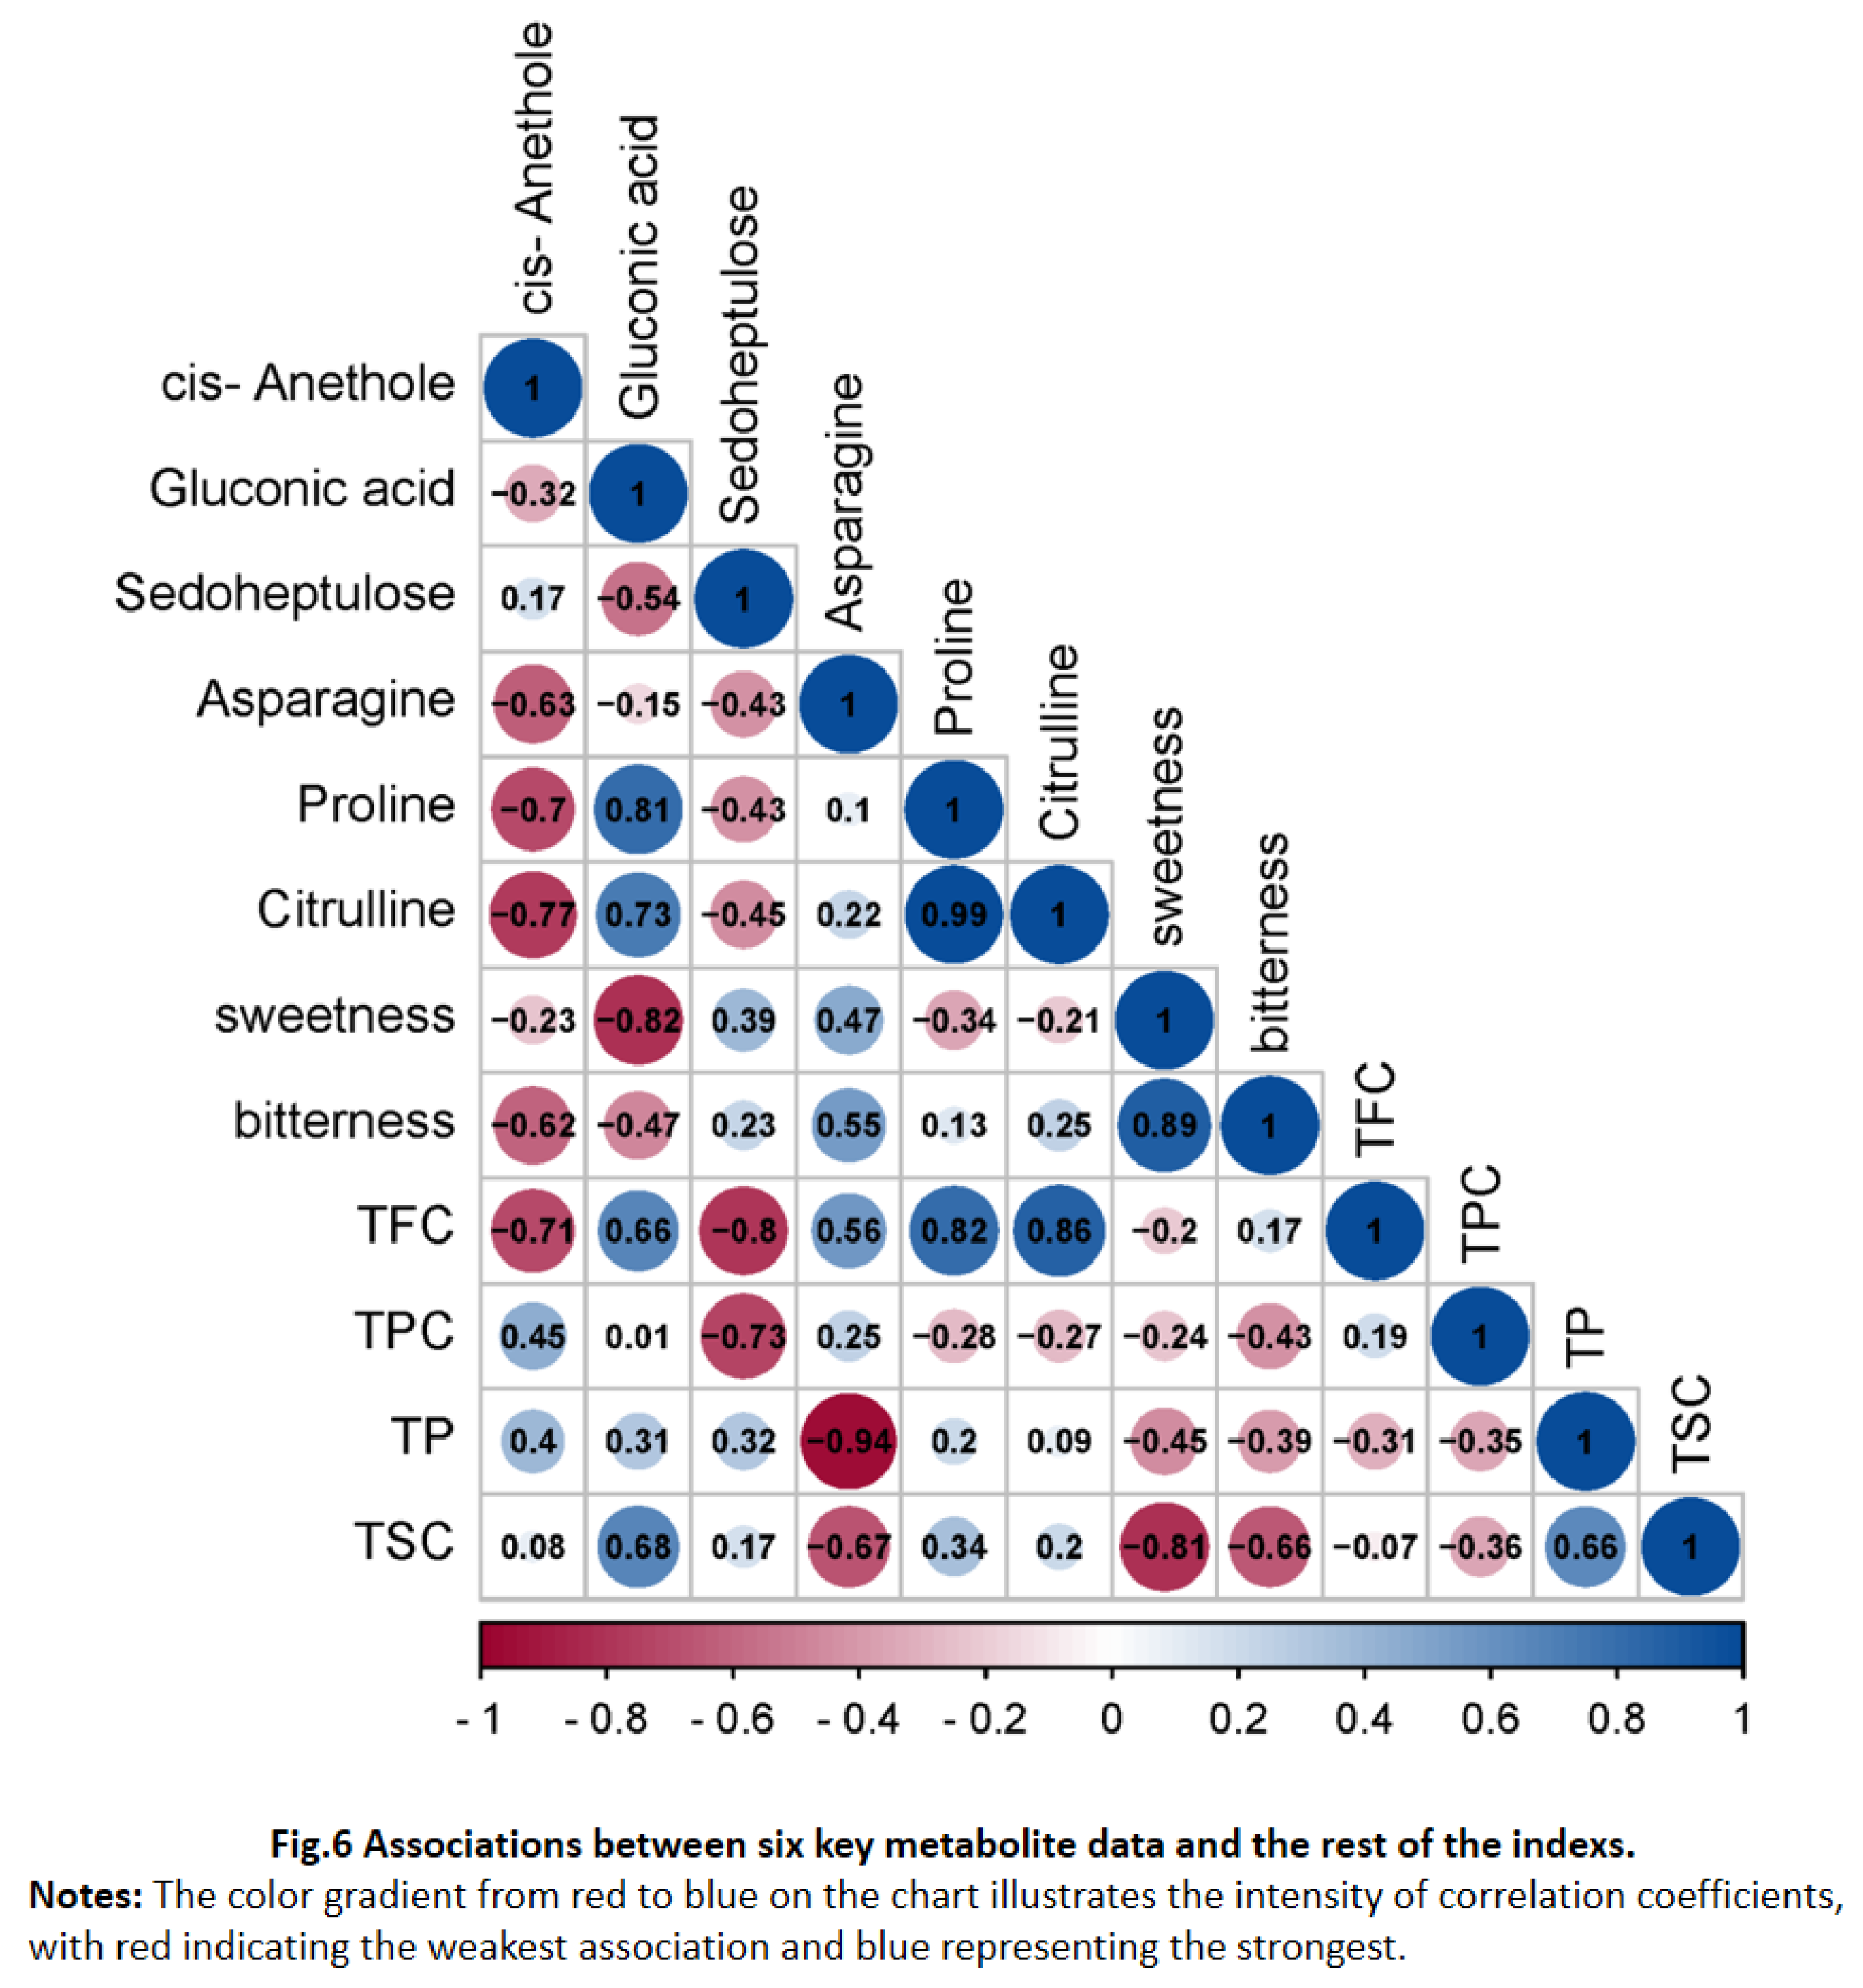
To statistically calculate the relationship between core metabolites compound and taste intensity, spearman's correlation analysis coefficient was utilized in Figure 6. There was a significant correlation between sensory characteristics (sweetness and bitterness) and six core metabolites. Sedoheptulose robustly correlates with total flavonoids content (TFC), while Asparagine shows a strong linkage with total phenolic content (TPC). Additionally, cis-Anethole demonstrates a marked correlation with TFC, Sedoheptulose with total flavonoids content (TFC) and total phenolic content (TPC). These correlations hinted at a fascinating interaction between the metabolite profile and the taste profiles of C. paliurus leaves. It was reasonable to deduce that the concentrations of cis-Anethole and Sedoheptulose could significantly influence the bitterness intensity of the leaf samples, considering their direct associations with TFC and TPC, respectively. In fact, bitterness were generally undesirable, still, they were important for providing the complex sensory perceptions of C. paliurus teas. Conversely, as showed in Figure 6, its pronounced negative correlation with the TSC, the concentration of Asparagine in C. paliurus leaves was likely a significant determinant of the sweetness intensity. Therefore, this study advanced our understanding of metabolic changes, sweetness and bitterness taste in different growth mouths of C. paliurus leaves and these data provided a theoretical basis for the control of sensory quality.

4. Conclusion

This study explored the differential metabolites in C. paliurus leaves from different growth months contributing to the sweet and bitter taste using a multiplatform metabolomics approach, including UHPLC-MS/MS, electronic tongue assay, and molecular docking approaches. In this study, the taste characteristic values of bitterness and sweetness, as well as the contents of bioactive substances such as TPC, TFC, TP and TSC showed different changes among C. paliurus leaves of maturation stages. These data collectively suggested that the C. paliurus leaves, particularly those from the July harvest, were endowed with an intensified sweetness. Then, nontargeted metabolomics revealed 1,571 differential metabolites, with 575 identified as key metabolites based on VIP values. Molecular docking studies were crucial in elucidating the complex interactions between the candidate compounds and the receptors responsible for sweetness (hT1R2/hT1R3) and bitterness (hT2R4/hT2R14). A significant positive correlation was observed between the binding affinities of sweetness for sweet receptors and their perceived sweetness, contrasting sharply with the negative correlation for bitterness and their receptors. The quantitative assessment, based on binding energy calculations, was instrumental in identifying metabolites that amplify sweetness and reduce bitterness. By establishing clear thresholds for these binding energies, the study successfully identified six core metabolites (cis-Anethole, Gluconic acid, beta-D-Sedoheptulose, Asparagine, Proline, and Citrulline) that had the inherent potential to related to the "sweet-bitterness" of C. paliurus leaves for the first time. This discovery highlighted that the effectiveness of the integrated analytical and in computer simulation screening method in uncovering and characterizing compounds critical to the taste profiles of food products. Moreover, this study provided a roadmap for the targeted enhancement of taste attributes in C. paliurus leaves, offering a means to refine the taste characteristics of its products, thereby increasing their marketability and satisfying consumers' high-quality taste experience. In fact, further studies are ongoing in the author’s lab, focusing on the formation mechanism of the key sweet-bitterness related components in C. paliurus leaves. We hope to report more about these advancements in the future.

CRediT authorship contribution statement

Liang Chen: Conceptualization, Methodology, Formal analysis, Investigation, Writing - original draft, Writing - review & editing. Dai Lu: Methodology, Formal analysis, Data curation. Yaqian Zuo: Formal analysis, Investigation, Writing - original draft. Ruiyi Zhang: Formal analysis, Investigation. Tao Zhou: Methodology, Data curation. Bin Long: Methodology, Conceptualization, Data curation. Kangming Zhu: Visualization, Data curation. Wei Wang: Supervision, Writing - review & editing, Funding acquisition. Xing Tian: Supervision, Writing - review & editing, Funding acquisition.

Acknowledgments

This study was supported by “Hunan Natural Science Foundation Program” (Project No. 2023JJ30445, 2024JJ6337), “Hunan Provincial Department of Education Outstanding Youth Project” (Project No.22B0378), “Hunan Province Traditional Chinese Medicine Research Project” (Project No. B2024012), “Hunan University of Chinese Medicine "Double First-class" construction discipline project” (Project No.2022ZYT029), “The State-sponsored Postdoctoral Researcher Program of China” (Project No.GZB20230206). The authors thank Hunan Yueling Junshan Agriculture and Forestry Technology Co., Ltd. providing the Cyclocarya paliurus leave raw materials support.

Declaration of Competing Interest

The authors declare that they have no known competing financial interests or personal relationships that could have appeared to influence the work reported in this paper.

References

  1. Shu, R. G.; Xu, C. R.; Li, L. N.; Yu, Z. L. Cyclocariosides II and III: two secodammarane triterpenoid saponins from Cyclocarya paliurus. Planta Med.. 1995, 61, 551–553. [Google Scholar] [CrossRef] [PubMed]
  2. Fang, S.; Sun, D.; Shang, X.; Fu, X.; Yang, W. Variation in radial growth and wood density of Cyclocarya paliurus across its natural distribution. NEW FORESTS. 2020, 51, 453–467. [Google Scholar] [CrossRef]
  3. Xie, J.; Xie, M.; Nie, S.; Shen, M.; Wang, Y.; Li, C. Isolation, chemical composition and antioxidant activities of a water-soluble polysaccharide from Cyclocarya paliurus (Batal.) Iljinskaja. Food Chem. 2010, 119, 1626–1632. [Google Scholar] [CrossRef]
  4. Zhang, J.; Shen, Q.; Lu, J.; Li, J.; Liu, W.; Yang, J.; Li, J.; Xiao, K. Phenolic compounds from the leaves of Cyclocarya paliurus (Batal.) Ijinskaja and their inhibitory activity against PTP1B. Food Chem. 2010, 119, 1491–1496. [Google Scholar] [CrossRef]
  5. Wu, Z.; Gao, T.; Zhong, R.; Lin, Z.; Jiang, C.; Ouyang, S.; Zhao, M.; Che, C.; Zhang, J.; Yin, Z. Antihyperlipidaemic effect of triterpenic acid-enriched fraction from Cyclocarya paliurus leaves in hyperlipidaemic rats. Pharm Biol. 2017, 55, 712–721. [Google Scholar] [CrossRef]
  6. Xie, J.; Wang, Z.; Shen, M.; Nie, S.; Gong, B.; Li, H.; Zhao, Q.; Li, W.; Xie, M. Sulfated modification, characterization and antioxidant activities of polysaccharide from Cyclocarya paliurus. Functional Hydrocolloids: A Key to Human HealthFood Hydrocolloids. 2016, 53, 7–15. [Google Scholar] [CrossRef]
  7. Wang, J.; Wang, K. Fatigue-alleviating effect of polysaccharides from Cyclocarya paliurus (Batal) Iljinskaja in mice. African Journal of Microbiology Research. 2012, 6, 5243–5248. [Google Scholar]
  8. Rong, L. J. Q. Research Progress on the Effects of Cyclocarya Paliurus on Decreasing Blood Glucose and lts Application Prospect in the Development of Auxiliary Hypoglycemic Substitute Tea. Journal of Tea Communication. 2021, 48, 606–611. [Google Scholar]
  9. Shen, Y.; Peng, Y.; Zhu, X.; Li, H.; Zhang, L.; Kong, F.; Wang, J.; Yu, D. The phytochemicals and health benefits of Cyclocarya paliurus (Batalin) Iljinskaja. Front Nutr. 2023, 10, 1158158. [Google Scholar] [CrossRef]
  10. Zhang, S.; Nie, L.; Zhao, W.; Cui, Q.; Wang, J.; Duan, Y.; Ge, C. Metabolomic analysis of the occurrence of bitter fruits on grafted oriental melon plants. PLoS ONE. 2019, 14, e0223707. [Google Scholar] [CrossRef]
  11. Kim, S. S.; Kwak, H. S.; Kim, M. J. The effect of various salinity levels on metabolomic profiles, antioxidant capacities and sensory attributes of doenjang, a fermented soybean paste. Food Chem. 2020, 328, 127176. [Google Scholar] [CrossRef] [PubMed]
  12. Shiga, K.; Yamamoto, S.; Nakajima, A.; Kodama, Y.; Imamura, M.; Sato, T.; Uchida, R.; Obata, A.; Bamba, T.; Fukusaki, E. Metabolic Profiling Approach To Explore Compounds Related to the Umami Intensity of Soy Sauce. Journal of Agricultural and Food ChemistryJournal of Agricultural and Food ChemistryJ. Agric. Food Chem.. 2014, 62, 7317–7322. [Google Scholar] [CrossRef]
  13. Sumner, L. W.; Mendes, P.; Dixon, R. A. Plant metabolomics: large-scale phytochemistry in the functional genomics era. Plant MetabolomicsPhytochemistry. 2003, 62, 817–836. [Google Scholar] [CrossRef]
  14. Zeki, Ö. C.; Eylem, C. C.; Reçber, T.; Kır, S.; Nemutlu, E. Integration of GC–MS and LC–MS for untargeted metabolomics profiling. J Pharm Biomed Anal. 2020, 190, 113509. [Google Scholar] [CrossRef] [PubMed]
  15. Zhang, L.; Cao, Q.; Granato, D.; Xu, Y.; Ho, C. Association between chemistry and taste of tea: A review. Trends Food Sci Technol. 2020, 101, 139–149. [Google Scholar] [CrossRef]
  16. Tian, X.; Wang, H.; Chen, L.; Yuan, H.; Peng, C.; Wang, W. Distinct Changes in Metabolic Profile and Sensory Quality with Different Varieties of Chrysanthemum (Juhua) Tea Measured by LC-MS-Based Untargeted Metabolomics and Electronic Tongue. Foods. 2024, 13, 1080. [Google Scholar] [CrossRef] [PubMed]
  17. Fritz, F.; Preissner, R.; Banerjee, P. VirtualTaste: a web server for the prediction of organoleptic properties of chemical compounds. Nucleic Acids Res.. 2021, 49, W679–W684. [Google Scholar] [CrossRef]
  18. Dagan-Wiener, A.; Di Pizio, A.; Nissim, I.; Bahia, M. S.; Dubovski, N.; Margulis, E.; Niv, M. Y. BitterDB: taste ligands and receptors database in 2019. Nucleic Acids Res.. 2019, 47, D1179–D1185. [Google Scholar] [CrossRef]
  19. Yu, Z.; Kang, L.; Zhao, W.; Wu, S.; Ding, L.; Zheng, F.; Liu, J.; Li, J. Identification of novel umami peptides from myosin via homology modeling and molecular docking. Food Chem. 2021, 344, 128728. [Google Scholar] [CrossRef]
  20. Acevedo, W.; Ramírez-Sarmiento, C. A.; Agosin, E. Identifying the interactions between natural, non-caloric sweeteners and the human sweet receptor by molecular docking. Food Chem. 2018, 264, 164–171. [Google Scholar] [CrossRef]
  21. Hutasingh, N.; Chuntakaruk, H.; Tubtimrattana, A.; Ketngamkum, Y.; Pewlong, P.; Phaonakrop, N.; Roytrakul, S.; Rungrotmongkol, T.; Paemanee, A.; Tansrisawad, N.; et al. Metabolite profiling and identification of novel umami compounds in the chaya leaves of two species using multiplatform metabolomics. Food Chem. 2023, 404, 134564. [Google Scholar] [CrossRef] [PubMed]
  22. Spaggiari, G.; Di Pizio, A.; Cozzini, P. Sweet, umami and bitter taste receptors: State of the art of in silico molecular modeling approaches. Trends Food Sci Technol. 2020, 96, 21–29. [Google Scholar] [CrossRef]
  23. Hellfritsch, C.; Brockhoff, A.; Stähler, F.; Meyerhof, W.; Hofmann, T. Human psychometric and taste receptor responses to steviol glycosides. J. Agric. Food Chem.. 2012, 60, 6782–6793. [Google Scholar] [CrossRef] [PubMed]
  24. Meyerhof, W.; Batram, C.; Kuhn, C.; Brockhoff, A.; Chudoba, E.; Bufe, B.; Appendino, G.; Behrens, M. The molecular receptive ranges of human TAS2R bitter taste receptors. Chem. Senses. 2010, 35, 157–170. [Google Scholar] [CrossRef] [PubMed]
  25. Xiao, Y.; He, C.; Chen, Y.; Ho, C.; Wu, X.; Huang, Y.; Gao, Y.; Hou, A.; Li, Z.; Wang, Y.; et al. UPLC–QQQ–MS/MS-based widely targeted metabolomic analysis reveals the effect of solid-state fermentation with Eurotium cristatum on the dynamic changes in the metabolite profile of dark tea. Food Chem. 2022, 378, 131999. [Google Scholar] [CrossRef] [PubMed]
  26. Yang, R.; Huang, H.; Guo, X. Memristive Synapses and Neurons for Bioinspired Computing. Advanced Electronic MaterialsAdvanced Electronic MaterialsAdvanced Electronic Materials. 2019, 5, 1900287. [Google Scholar] [CrossRef]
  27. Wu, L.; Gao, Y.; Ren, W. C.; Su, Y.; Li, J.; Du, Y. Q.; Wang, Q. H.; Kuang, H. X. Rapid determination and origin identification of total polysaccharides contents in Schisandra chinensis by near-infrared spectroscopy. Spectrochim Acta A Mol Biomol Spectrosc. 2022, 264, 120327. [Google Scholar] [CrossRef] [PubMed]
  28. Biswas, T.; Dwivedi, U.N. Plant triterpenoid saponins: biosynthesis, in vitro production, and pharmacological relevance. Protoplasma. 2019, 25, 1463–1486. [Google Scholar] [CrossRef] [PubMed]
  29. Volkamer, A.; Kuhn, D.; Grombacher, T.; Rippmann, F.; Rarey, M. Combining Global and Local Measures for Structure-Based Druggability Predictions. Journal of Chemical Information and ModelingJournal of Chemical Information and ModelingJ. Chem. Inf. Model.. 2012, 52, 360–372. [Google Scholar] [CrossRef]
  30. Eberhardt, J.; Santos-Martins, D.; Tillack, A. F.; Forli, S. AutoDock Vina 1.2.0: New Docking Methods, Expanded Force Field, and Python Bindings. J Chem Inf Model. 2021, 61, 3891–3898. [Google Scholar] [CrossRef]
  31. Gharibzahedi, S.; Barba, F. J.; Zhou, J.; Wang, M.; Altintas, Z. Electronic Sensor Technologies in Monitoring Quality of Tea: A Review. Biosensors (Basel). 2022, 12, 356. [Google Scholar] [CrossRef]
  32. Liu, Y.; Meng, F.; Tang, P.; Huang, D.; Li, Q.; Lin, M. Widely Targeted Metabolomics Analysis of the Changes to Key Non-volatile Taste Components in Stropharia rugosoannulata Under Different Drying Methods. Front Nutr. 2022, 9, 884400. [Google Scholar] [CrossRef]
  33. Osakabe, N.; Shimizu, T.; Fujii, Y.; Fushimi, T.; Calabrese, V. Sensory Nutrition and Bitterness and Astringency of Polyphenols. Biomolecules. 2024, 14, 234. [Google Scholar] [CrossRef]
  34. Wei, L. The effect of cyclocarya flavonoids extrat on the liver insulin resistance of db/db mices and the Pi3K/AKT /FOXO1 pathway. Beijing University Of Chinese Medicine. 2021. [CrossRef]
  35. Gong, X.; Ji, M.; Xu, J.; Zhang, C.; Li, M. Hypoglycemic effects of bioactive ingredients from medicine food homology and medicinal health food species used in China. Crit Rev Food Sci Nutr. 2020, 60, 2303–2326. [Google Scholar] [CrossRef]
  36. Li, J.; Lu, Y.; Su, X.; Li, F.; She, Z.; He, X.; Lin, Y. A Norsesquiterpene Lactone and a Benzoic Acid Derivative from the Leaves of Cyclocarya paliurus and their Glucosidase and Glycogen Phosphorylase Inhibiting Activities. Planta Med.. 2008, 74, 287–289. [Google Scholar] [CrossRef] [PubMed]
  37. Xie, M.; Wang, Y.; Yi, X.; Wang, X. A study on the structure and contents of flavonoids in the leaves of Cyclocarya paliurus (Batal.) Iljinsk. Fenxi Huaxue. 2004, 32, 1053–1056. [Google Scholar] [CrossRef]
  38. Chen, L.; Cao, H.; Xiao, J. 2 - Polyphenols: Absorption, bioavailability, and metabolomics. 2018, 45-67. [CrossRef]
  39. Fraser, K.; Lane, G. A.; Otter, D. E.; Hemar, Y.; Quek, S.; Harrison, S. J.; Rasmussen, S. Analysis of metabolic markers of tea origin by UHPLC and high resolution mass spectrometry. Tea – from bushes to mugs: composition, stability and health aspectsFood Research International. 2013, 53, 827–835. [Google Scholar] [CrossRef]
  40. Nakaya, A.; Katayama, T.; Itoh, M.; Hiranuka, K.; Kawashima, S.; Moriya, Y.; Okuda, S.; Tanaka, M.; Tokimatsu, T.; Yamanishi, Y.; et al. KEGG OC: a large-scale automatic construction of taxonomy-based ortholog clusters. Nucleic Acids Res.. 2013, 41, D353–D357. [Google Scholar] [CrossRef]
  41. Xi, H.; Xu, W.; He, F.; Liu, Z.; Wang, Y.; Xie, J. Spatial metabolome of biosynthesis and metabolism in Cyclocarya paliurus leaves. Food Chem. 2024, 443, 138519. [Google Scholar] [CrossRef]
  42. Li, Q.; Jin, Y.; Jiang, R.; Xu, Y.; Zhang, Y.; Luo, Y.; Huang, J.; Wang, K.; Liu, Z. Dynamic changes in the metabolite profile and taste characteristics of Fu brick tea during the manufacturing process. Food Chem. 2021, 344, 128576. [Google Scholar] [CrossRef] [PubMed]
  43. Zheng, W.; Zhang, C.; Li, Y.; Pearce, R.; Bell, E. W.; Zhang, Y. Folding non-homologous proteins by coupling deep-learning contact maps with I-TASSER assembly simulations. Cell Reports Methods. 2021, 1, 100014. [Google Scholar] [CrossRef]
  44. Singla, R.; Jaitak, V. Synthesis of rebaudioside A from stevioside and their interaction model with hTAS2R4 bitter taste receptor. Phytochemistry. 2016, 125, 106–111. [Google Scholar] [CrossRef] [PubMed]
  45. Servant, G.; Kenakin, T.; Zhang, L.; Williams, M.; Servant, N. The function and allosteric control of the human sweet taste receptor. Advances in pharmacology (San Diego, Calif.). 2020, 88, 59–82. [Google Scholar] [CrossRef] [PubMed]
  46. Joseph Naguib, M.; Moustafa Kamel, A.; Thabet Negmeldin, A.; Elshafeey, A. H.; Elsayed, I. Molecular docking and statistical optimization of taurocholate-stabilized galactose anchored bilosomes for the enhancement of sofosbuvir absorption and hepatic relative targeting efficiency. Drug Deliv. 2020, 27, 996–1009. [Google Scholar] [CrossRef] [PubMed]
  47. Han, P.; Keast, R. S. J.; Roura, E. Salivary leptin and TAS1R2/TAS1R3 polymorphisms are related to sweet taste sensitivity and carbohydrate intake from a buffet meal in healthy young adults. Br. J. Nutr.. 2017, 118, 763–770. [Google Scholar] [CrossRef] [PubMed]
  48. Singh, N.; Shaik, F. A.; Myal, Y.; Chelikani, P. Chemosensory bitter taste receptors T2R4 and T2R14 activation attenuates proliferation and migration of breast cancer cells. Mol. Cell. Biochem.. 2020, 465, 199–214. [Google Scholar] [CrossRef]
  49. Xu, Q.; Singh, N.; Hong, H.; Yan, X.; Yu, W.; Jiang, X.; Chelikani, P.; Wu, J. Hen protein-derived peptides as the blockers of human bitter taste receptors T2R4, T2R7 and T2R14. Food Chem. 2019, 283, 621–627. [Google Scholar] [CrossRef]
  50. Yu, Z.; Wang, Y.; Zhao, W.; Li, J.; Shuian, D.; Liu, J. Identification of Oncorhynchus mykiss nebulin-derived peptides as bitter taste receptor TAS2R14 blockers by in silico screening and molecular docking. Food Chem. 2021, 368. [Google Scholar] [CrossRef]
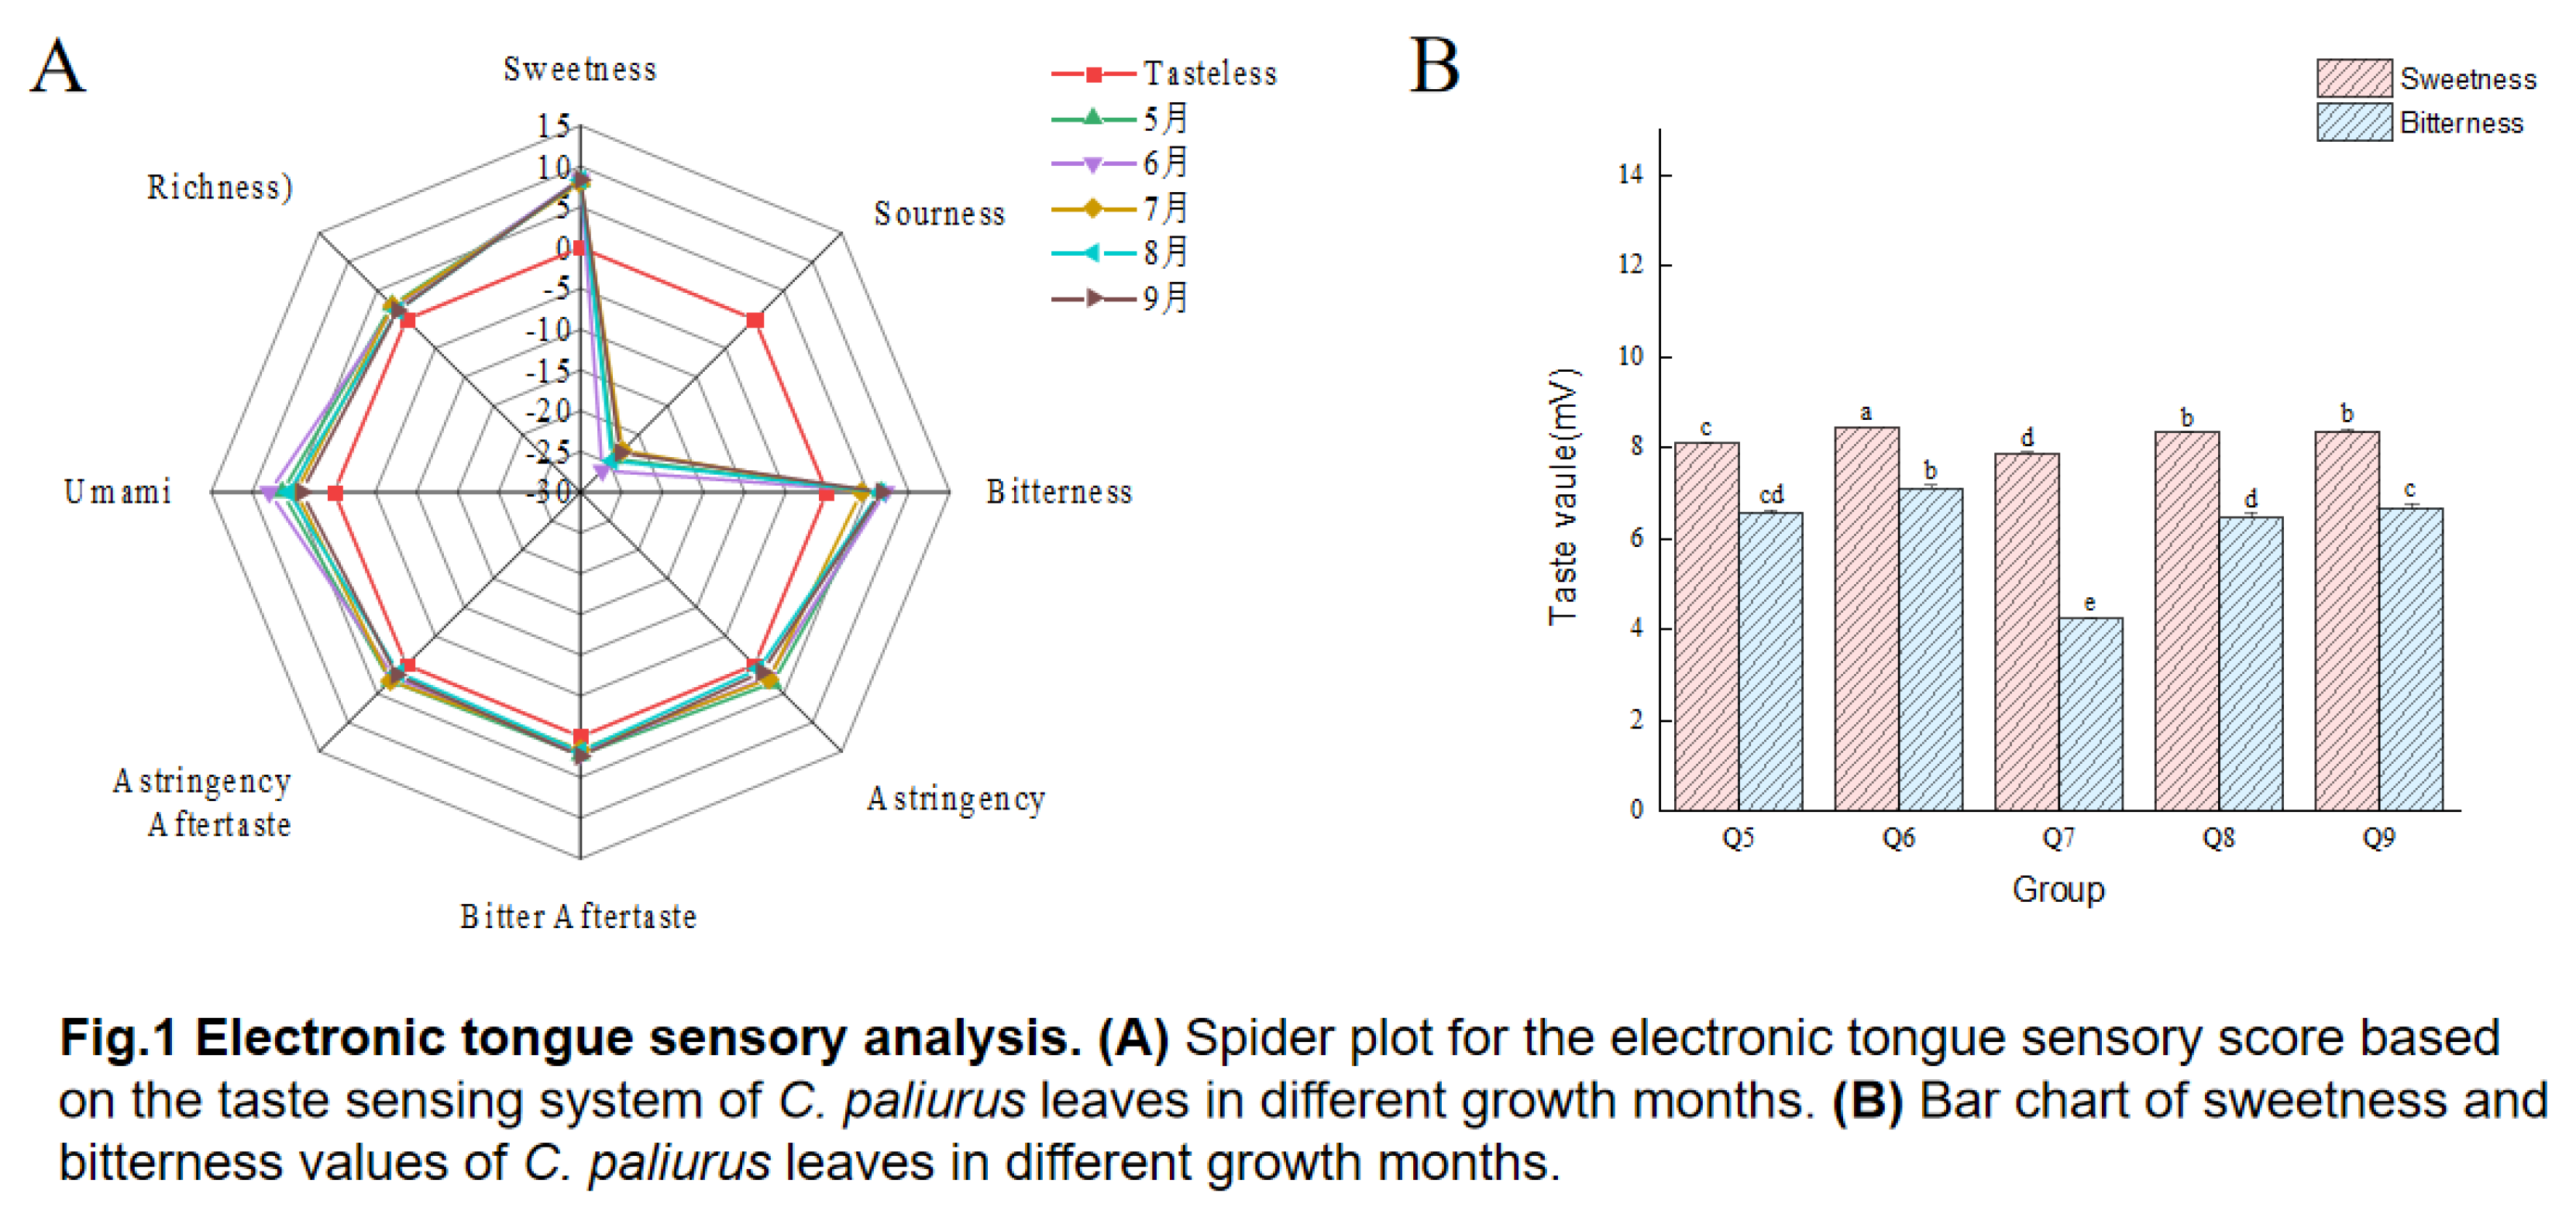
Figure 1. Electronic tongue sensory analysis. (A) Spider plot for the electronic tongue sensory score based on the taste sensing system of C. paliurus leaves in different growth months. (B) Bar chart of sweetness and bitterness values of C. paliurus leaves in different growth months. Changes in TPC, TFC, TP and TSC of C. paliurus leaves in different growth periods
Preprints 114878 g001
Figure 2. TPC, TFC, TP, and TSC from C. paliurus leaves. Notes: TPC (Total Phenolic Content), TFC(Total Flavonoid Content), TP(Total Polysaccharide Content), and TSC(Total Saponin Content). Q5-Q9 refers to the samples of the leaves of C. paliurus collected from May to September.
Preprints 114878 g002
Figure 3. Nontarget metabolomics analysis. (A) The circos plots of differential metabolites. Notes: Circos circle plots are arranged from the outside inwards in the following order: metabolite names, HMDB classifications of metabolites, p-values, VIP from PLS-DA analysis, and correlation lines. Arcs connecting any two points on the circle are called chords, indicating a correlation between the two points. (B) The proportion of various metabolites in C. paliurus leave samples.Notes: Various color-coded sections denote items categorized under distinct chemical groups, with the corresponding percentages indicating the proportion of items within each chemical category. The proportion of metabolites is calculated as a fraction of the total metabolites detected. Those metabolites lacking a defined chemical classification are categorized as "undefined.".
Preprints 114878 g003
Figure 4. Multivariate analysis of C. paliurus leave samples. (A) Principal component analysis (PCA) of metabolite profiles across different groups. (B) OPLS-DA permutation test plot of the comparison groups. (C) The bar chat of Enrichment significantly KEGG pathways. (D) The diagram of Pathway impact diagram. (E) The flavone and flavonol biosynthesis pathways..
Preprints 114878 g004
Figure 5. Homologous modeling and screening process of molecular docking. (A) Sweet receptors (T1R1/TIR3) and bitter receptors (T2R4/T2R14). (B)Interaction patterns of hT2R14 with cis-Anethole, Gluconic acid and Citrullin. (a) hT2R14-cis-Anethole. (b) hT2R14-Gluconic acid. (c) hT2R14-Citrulline. (C)Six core sweet and bitter related metabolites..
Preprints 114878 g005
Figure 6. Associations between six key metabolite data and the rest of the indexs. Notes: The color gradient from red to blue on the chart illustrates the intensity of correlation coefficients, with red indicating the weakest association and blue representing the strongest..
Preprints 114878 g006
Table 1. Determination of taste characteristics of different months of C. paliurus by electronic tongue.
Taste Characteristic Samples of C. paliurus
Q5 Q6 Q7 Q8 Q9
Sweetness 8.09±0.02c 8.45±0.00a 7.86±0.04d 8.33±0.01b 8.36±0.04b
Sourness -24.2±0.15c -26.25±0.06e -22.77±0.23a -24.55±0.11d -23.12±0.13b
Bitterness 6.57±0.05cd 7.12±0.06b 4.23±0.04e 6.46±0.1d 6.67±0.10c
Astringency 3.1±0.23a 2.21±0.24c 2.46±0.16bc 0.67±0.31e 1.24±0.24d
Bitter Aftertaste 2.26±0.06c 2.09±0.05d 1.59±0.04f 1.85±0.05e 2.4±0.08b
Astringency Aftertaste 2.76±0.15a 2.13±0.11b 2.74±0.16a 1.39±0.09d 1.7±0.11c
Umami 6.35±0.19b 7.9±0.17a 4.65±0.21d 5.55±0.19c 3.98±0.20e
Richness 2.48±0.23b 2.08±0.14c 2.33±0.12bc 1.5±0.07d 1.56±0.19d
Standard error of means (n = 3). a–f Means within the same row with different superscripts differ significantly (p < 0.05).
Table 2. The evaluation parameters of OPLS - DA model.
parameters R2X(cum) R2Y(cum) Q2(cum) RMSEE pre ort pR2Y
Total 0.576 0.999 0.997 0.0238 1 2 0.005
R2X and R2Y represent the model's interpretation rate of X matrix and Y matrix. Q2: represents the predictive ability of the model; R2 and Q2 more closer to 1 indicating that the model is more stable and reliable, Q2 > 0.5 says the model has good prediction ability, Q2 is less than 0.5, shows that the model prediction ability is poor; RMSEE: root mean square error of the estimate; pre represents the predicted group score used for modeling, and ort represents the orthogonal group score used for modeling. pR2Y: p value for R2Y, pQ2: p value for Q2.
Table 3. Relevant metabolites screened for molecular docking.
Metabolite name hT1R2 hT1R3 hT1R4 hT1R14 As Ab
Category 1
Ganoderic Acid B -13.0 -11.9 -12.3 -11.7 -24.9 -24.0
Deoxycholic acid -10.9 -10.8 -11.7 -10.7 -21.7 -22.4
Indole-3-acetyl-valine -9.2 -8.9 -8.6 -7.9 -18.1 -16.5
Category 2
Ginsenoside Rf -10.1 -12.7 -10.6 -10.4 -22.8 -21.0
FA 18:3;O -6.8 -8.7 -7.9 -7.0 -15.5 -14.9
cis-Anethole -5.8 -5.6 -5.8 -5.6 -11.4 -11.4
Icariside F2 -10.1 -9.7 -8.4 -9.0 -19.8 -17.4
Forsythoside E -10.3 -10.7 -8.0 -8.7 -21.0 -16.7
Gluconic acid -5.7 -5.6 -5.0 -5.1 -11.3 -10.1
Olivil 4'-O-Glucoside -9.2 -10.6 -9.2 -8.7 -19.8 -17.9
Category 3
Centaurein -10.5 -10.0 -8.4 -9.1 -20.5 -17.5
Iridin -9.2 -10.0 -8.8 -8.0 -19.2 -16.8
Syringetin -9.9 -9.6 -8.3 -8.3 -19.5 -16.6
Dihydromelilotoside -8.6 -8.5 -7.8 -7.1 -17.1 -14.9
Lamiide -10.3 -10.1 -8.6 -8.0 -20.4 -16.6
Category 4
Sedoheptulose -7.0 -6.8 -5.8 -6.6 -13.8 -12.4
Hematoxylin -10.5 -9.3 -9.4 -8.9 -19.8 -18.3
Asparagine -5.1 -5.4 -4.6 -5.2 -10.5 -9.8
Proline -5.2 -5.3 -5.0 -5.4 -10.5 -10.4
Citrulline -5.7 -5.8 -5.1 -5.7 -11.5 -10.8
Gaultherin -9.6 -9.0 -7.8 -8.1 -18.6 -15.9
Apiopaeonoside -9.7 -9.3 -8.5 -8.2 -19.0 -16.7
the sum of the lowest binding energies for the sweet taste receptors (As); the sum of the lowest binding energies for the bitter taste receptors (Ab).
Disclaimer/Publisher’s Note: The statements, opinions and data contained in all publications are solely those of the individual author(s) and contributor(s) and not of MDPI and/or the editor(s). MDPI and/or the editor(s) disclaim responsibility for any injury to people or property resulting from any ideas, methods, instructions or products referred to in the content.
Copyright: This open access article is published under a Creative Commons CC BY 4.0 license, which permit the free download, distribution, and reuse, provided that the author and preprint are cited in any reuse.
Prerpints.org logo

Preprints.org is a free preprint server supported by MDPI in Basel, Switzerland.

Subscribe

© 2024 MDPI (Basel, Switzerland) unless otherwise stated