
Submitted:
11 August 2024
Posted:
14 August 2024
You are already at the latest version
Abstract
This study investigates resource adequacy and renewable energy integration in the United States, European Union, and Pakistan amid global energy market liberalization and greenhouse gas re-duction efforts. It explores how these regions are adapting to the surge in renewable sources like wind and solar, which, despite their financial and environmental benefits, challenge resource adequacy and the economic viability of traditional energy sources. In the US and EU, significant improvements have been introduced in wholesale electricity markets and capacity accreditation mechanisms, which enhanced the large-scale deployment of renewables. This shift has prompted a reevaluation of resource adequacy, leading to increased deployment of battery storage and demand response. Presently, gas-based generation is largely upholding resource adequacy, however, future trends indicate a move towards greater consumer participation, energy efficiency, and utility-scale storage, with a decline in fossil fuel use. Pakistan aims to adopt a liberalized market structure by balancing competitive markets with legacy contracts. Public pressure is driving a shift from costly fossil-based generation to renewables. Similarly, a trend in the rise of behind-the-meter solar generation can be witnessed. In future, Pakistan may also experience resource adequacy challenges. It will likely need to implement battery storage, demand response, and modern capacity accreditation tools, by drawing lessons from developed markets.
Keywords:
Resource Adequacy
; Capacity Accreditation
; Competitive Trading Bilateral Contract Market (CTBCM)
; Renewable energy
; Demand response
; Battery Storage
; Capacity remuneration
1. Introduction
As power grids globally shift towards decarbonization and the integration of variable renewable energy (VRE) sources, ensuring resource adequacy has become crucial for grid reliability. Resource adequacy measures a power system's capacity to consistently meet electricity demands throughout the year, especially during peak periods, by evaluating the likelihood of outages due to insufficient capacity and considering the impact of failures in components like generators and transmission infrastructure, along with uncertainties in generation and load [1]. Market liberalization, declining Levelized Cost of Electricity (LCOE) for VRE, and policies such as green certificates, feed-in tariffs, tax credits, and greenhouse gas reduction initiatives in the US and EU have significantly influenced the generation mix and successfully facilitated VRE deployment. The rise of VRE has led to lower wholesale electricity prices and reduced reliance on conventional technologies, making fossil-fueled capacities economically unviable [3,4]. Successful integration of VRE requires precise short-term price formation, increased demand-side participation, and a shift from technology-specific subsidies to carbon pricing.
The intermittent nature of VRE raises uncertainty in firm capacity estimation, leading to higher reserve requirements and potential generation-load mismatches, which increase costs related to power balancing and re-dispatch [10,11,12]. Addressing these issues involves improving forecasting, implementing fast dispatch practices, and managing reserves effectively. Balancing long-term bilateral contracts with short-term trading mechanisms, interconnecting distributed resources, employing Battery Energy Storage Systems (BESS), and utilizing wind-solar hybrid systems can mitigate intermittency impacts and reduce curtailment. Demand Response (DR) mechanisms improve system flexibility and cost efficiency during peak load hours [5,13].
The increasing reliance on VRE sources like wind and solar, combined with the retirement of fossil fuel generators, underscores the importance of energy storage and load flexibility. The BESS and DR offer competitive alternatives to traditional combustion turbines for addressing shortfall events [2]. As VRE deployment increases, the need for BESS grows to store cheap generation during the day and to discharge during the evening peak load hours where the highest resource adequacy risk lies. The need for BESS depends on system size and conventional resource flexibility in terms of ramp rates and low power operation. However, if the conventional generation resources are less adaptable, enhanced BESS deployment is vital for managing fluctuations and ensuring resource adequacy [6]. This transition should also be supported by adequate long-term policy frameworks and constant guidance from the regulators. Combining technological advancements with policy measures is essential to address performance gaps and improve system flexibility [7,8,9]. In microgrids, decentralized VRE combined with BESS and DR reduces reliance on the main grid, alleviates congestion, and increases investment efficiency in infrastructure. Decentralized VRE provide valuable grid services and can potentially offset high infrastructure costs [14].
Pakistan is pursuing deregulation under the Competitive Trading Bilateral Contract Market (CTBCM), inspired by the US and EU's Security-Constrained Economic Dispatch (SCED) model. This approach aims to establish short-term dispatch and trading markets, integrate long-term contracts, and transition to an annual capacity market, promoting efficient dispatch, investment in modern technologies, and the retirement of uneconomical capacity [15]. However, this transition poses resource adequacy risks to Pakistan's fragile grid infrastructure because the conventional generation fleet is highly rigid and cannot cater to the modern needs of system flexibility. The Country is also facing high public pressure due to high fossil-based generation prices, and exploring ways to accommodate more and more solar generation in the grid. Ensuring resource adequacy in Pakistan will require enhancing the flexibility of conventional generation, improving ramp rates, implementing DR mechanisms, and deploying BESS.
2. Aims and Objectives
This study aims to explore recent trends in ensuring resource adequacy and integrating renewables in modern power systems like those in the US and EU. It examines common problems both regions face in the post-deregulation era regarding resource adequacy and the renewable drive. By investigating these challenges and lessons learned, the study provides insights for developing countries like Pakistan, which is transitioning from a single-buyer model to the Competitive Trading Bilateral Contract Market (CTBCM). Given Pakistan’s increasing share of renewables, it is likely to encounter similar resource adequacy challenges. This paper evaluates the resource adequacy mechanisms in the US, EU, and Pakistan, trends in VRE generation, challenges faced by market participants, and responses to these challenges. For Pakistan, the study assesses renewable deployment goals and the evolving liberalized market model, drawing potential solutions from established markets like the US and EU. It suggests future pathways for Pakistan's energy sector to align with its goal of indigenizing the energy mix with a higher share of clean energy, following international best practices [16]. This study contributes to Pakistan's future green vision by utilizing qualitative data from various sources, including government reports, review papers, research studies, journals, books, publications, and newspapers.
3. Literature Review
The integration of Variable Renewable Energy (VRE) sources like wind and solar into the U.S. electricity grid poses significant challenges. As highlighted in [1,75], the increasing penetration of VRE complicates grid reliability, making traditional methods like Loss of Load Probability (LOLP) insufficient. This necessitates a reevaluation of resource adequacy, incorporating demand response (DR) and Battery Energy Storage Systems (BESS). The inherent variability of VRE, influenced by weather conditions, impacts both energy supply and demand, requiring adaptive strategies to manage high-risk scenarios, such as low VRE generation and droughts, as discussed in [76]. This variability calls for a dynamic approach to reserve margins and resource adequacy assessments, emphasizing the importance of considering economic and policy objectives in determining optimal reserve margins, whether through energy-only or capacity market designs [34].
The complexity of capacity markets is further exacerbated by the need to address potential "missing money" gaps, where generators may struggle to cover fixed costs, and by variations in market designs, including demand curves and reference technologies [38]. High VRE penetration can depress wholesale energy prices, increasing reliance on capacity payments and necessitating regulatory intervention and market rule adjustments to ensure adequate generator revenues. Report [88] discusses the evolving accreditation processes for wind, solar, and storage resources, advocating for standardized and transparent methods that link accreditation to operational performance. The integration of VRE also demands substantial storage investments to maintain grid reliability, especially in the face of climate change, as underscored in [20]. Studies [17,18] propose DR as a critical tool for grid management and enhancing renewable integration, highlighting the significant impact of weather on resource adequacy costs. Additionally, integrating power system and meteorological methods is essential to address resource adequacy challenges in high renewable power systems, as emphasized in [19].
In Europe, the European Union (EU) is actively working to integrate VRE while ensuring resource adequacy. The study in [21] discusses the EU's legal framework, which supports VRE integration through capacity mechanisms and support schemes, vital for maintaining grid reliability and achieving energy policy objectives. Reports [29,87] define adequacy and its application in EU countries, aiming to establish a unified methodology and model for evaluating adequacy, along with metrics to measure adequacy levels across the EU. Similarly, [22] emphasizes the importance of a coordinated regional approach to capacity investment and grid interconnection, including strategies to prevent the premature retirement of existing plants, enhance demand-side management, and develop cost-effective energy storage solutions for the long term.
The report in [89] underscores the need for systemic, efficient, and fair improvements in the EU energy system to support significant decarbonization and the doubling of renewable electricity generation by 2030. It highlights the necessity of enhancing flexibility resources, regional cooperation, and interconnectors to manage the variability of weather-dependent renewable output and meet future energy needs. Report in [92] further stresses the need for bold renewable energy designs and advanced storage technologies to support Europe’s deep electrification and decarbonization goals, emphasizing that a combination of local and interconnected storage solutions, along with strategic overbuilding of generation resources, is essential to managing variability and ensuring economic and environmental viability, with wind energy playing a dominant role. These efforts collectively aim to create a resilient, efficient, and sustainable energy system across the EU, capable of meeting future energy demands and climate objectives.
The potential benefits of expanding VRE in Pakistan are discussed in [23], including increased security of supply, diversity, and reduced reliance on imported fossil fuels. The analysis in [24] shows that renewables-based energy systems are the most cost-effective and optimal solution for Pakistan. By 2050, as noted in [25], solar PV is expected to dominate installed capacity and electricity generation, providing the majority of energy production due to its cost efficiency and widespread availability. Utility-scale and prosumer batteries will meet 99% of electricity storage needs, enabling efficient use of solar energy throughout the day. Pakistan's transition towards renewable energy is crucial for addressing its energy security and climate change challenges, as highlighted in [27], which emphasizes the need for robust policy frameworks and capacity-building measures to support the integration of renewable energy sources in Pakistan's evolving power sector. The establishment of renewable portfolio standards is identified in [26] as an effective regulatory tool to enhance the participation of renewables.
Pakistan's current single-buyer electricity market faces challenges related to affordability and supply due to rising capacity payments. An analysis in [15] examines the new Competitive Trading Bilateral Contract Market (CTBCM) model, suggesting it could improve resource adequacy and efficiency, despite potential short-term price increases, by leveraging competitive market mechanisms and optimal technology deployment. These efforts are essential for ensuring a sustainable and resilient energy future for Pakistan, focusing on maximizing the potential of VRE and modernizing the energy infrastructure.
4. Estimating Resource Adequacy
A key metric for measuring reliability is Loss-Of-Load Expectation (LOLE). This refers to the average number of hours per year that demand exceeds available supply, leading to blackouts or controlled load shedding (where some consumers are forced to reduce their usage).
Measurement of resource adequacy or reliability standard is a complex process. It involves estimating the Value of Lost Load (VoLL), which quantifies the economic impact of electricity supply interruptions on consumers and the Cost of New Entry (CONE), which refers to the expense required to build and operate a reference generation technology, typically a peaking power plant, capable of ensuring reliability. Additionally, it also includes calculating the Loss of Load Expectation (LOLE), which measures the number of hours per year during which the electricity supply is expected to be insufficient to meet demand. The Value of Lost Load (VOLL) is measured by considering several key parameters. These parameters should accurately reflect typical load-shedding events, taking into account factors such as the duration of outages and whether consumers receive advance notice. Additionally, they incorporate observed patterns of energy not being supplied, highlighting the most significant causes and effects of outages. By using these representative parameters, the VOLL calculation estimates the economic consequences for different consumer types under various conditions, ensuring a comprehensive and realistic assessment of power outage impacts. The best estimate of the sectoral VOLL for a given consumer type under specific VOLL parameters is expressed in € or $/MWh. Moreover, the weighting for each consumer type under these VOLL parameters is included to provide an accurate and detailed analysis [28]. For example, the single national VoLL calculated in some countries of EU as well as in US and Pakistan are given in Figure 1.
The fixed cost of new entry (CONEfixed) of the reference technology is the expected revenue a new generation source should receive to cover its annualized capital costs as well as fixed costs. The reference technology is different for different countries, however, most of the times Open Cycle Gas Turbine (OCGT) is used as reference technology in US, EU and Pakistan keeping in view low fixed costs. The fixed cost of new entry along with reference technology for certain EU countries is given in Figure 2
The variable cost of new entry is the marginal cost of reference generation plant. It is mainly comprised of fuel costs. It also reflects the price at which a generation resource will bid in the energy market.
The Loss of Load Expectation (LOLE) threshold or LOLERT, is set for new energy projects or renewals when their costs are lower than the Value of Lost Load (VOLL) and the market will also be considered perfectly efficient. This threshold helps balance the cost of new capacity with the expected reduction in power outages. LOLERT measures the point where the cost of adding new capacity equals the benefit from reduced outages. This process assumes that more capacity is needed to reduce outages and that these reductions are specific to certain areas. By considering both fixed and variable costs of new capacity, the approach ensures that reliability standards are optimized economically and regionally, enhancing the overall efficiency and reliability of the energy system. Once VoLL, CONEfixed, CONEvar is computed, following equation 1 calculates the LOLERT:
Where:
- LOLERT: The Loss of Load Expectation threshold for the reference new entry, measured in hours. Threshold represents the point where the cost of adding new capacity (both fixed and variable costs) is equal to the value of avoiding an hour of lost load.
- CONEfixed: The best estimate of the fixed Cost of New Entry, expressed in local currency per MW, according to established guidelines.
- VOLLRS: The best estimate of the single Value of Lost Load for reliability standards, measured in local currency per MWh, as per established guidelines.
- CONEvar: The best estimate of the variable Cost of New Entry, expressed in local currency per MWh. If the CONEvar is negligible compared to VOLLRS, it can be disregarded.
The LOLE threshold is determined by balancing the marginal cost of adding new capacity (CONE) or renewing/prolonging existing capacity (CORP) with the marginal reduction in Expected Energy Not Supplied (EENS), calculated as LOLE multiplied by VOLLRS (Value of Lost Load for Reliability Standards). The EENS quantifies outage severity in terms of lost energy. Optimality is achieved when these two values are equal meaning the cost of adding one unit of energy is equal to benefit achieved by equal reduction in VoLL. If marginal benefit is less than marginal cost then investment in expansion is not efficient. The reduction in EENS can be directly linked to LOLE, meaning that for each unit of installed capacity, EENS decreases by LOLE. Moreover, additional capacity is necessary to reduce EENS. The calculation of the LOLE threshold provides a precise economic balance between cost and reliability.
The values of LOLE for different countries in the EU are given in Figure 3.
5. Estimating Reserve Margin
The LOLE is the total sum of Loss of Load Probabilities (LOLPs) over a specified study period, such as one year. It is defined as follows:
Factors such as peak load and forced outage are directly proportional to LOLE [32]. As the peak load and Forced outage rate increase, the value of LOLE increases. In order to achieve that reliability standard in terms of LOLE, an optimal reserve margin is estimated.
In the United States, reliability metrics for power systems commonly use a standard of "one day in 10 years," equating to a Loss of Load Probability (LOLP) of 0.1 for peak hours annually. Key metrics include Expected Energy Not Served (EENS), and time-dependent metrics such as Loss of Load Frequency (LOLF) and Loss of Load Duration (LOLD), reflecting the frequency and duration of outages. Unlike other North American power systems, the Electric Reliability Council of Texas (ERCOT) does not adhere to a formal resource adequacy standard or reserve margin requirement but targets a minimum reserve margin of 13.75% of peak demand. ERCOT performs a biennial Probabilistic Risk Assessment, reporting various reliability metrics to the North American Electric Reliability Corporation (NERC), including Expected Unserved Energy (MWh), Loss of Load Hours (hours/year), and Expected Unserved Energy as a percentage of Net Energy for Load, with projections for two and four years ahead. [33]
In the US, the administratively set LOLP criteria of one event in ten years translates into varying reserve margins across different regions, with values ranging from 13.0% to 18.5%. This is often higher than economically optimal reserve margins, which can range from less than 6% to 16.5%, reflecting a trade-off between reliability standards and economic efficiency. Meeting stringent reliability criteria like 0.1 LOLE can lead to higher reserve margins and increased costs without proportional economic benefits as shown in Figure 4. Balancing reliability with economic efficiency requires careful consideration of system characteristics, including transmission intertie sizes and the integration of demand response and storage solutions.
In case of Pakistan, the reliability criterion is administratively set at 1% per year [35] with the reserve margin of 10%, however, value of efficient level of reserves based on least cost solution is 35% [36] Which is calculated as per equation 3.
Note: Installed capacity in year Y is the total capacity, which minimizes the total costs of the system.
Capacity-based reliability criteria, such as "loss of load" or "reserve margin," are becoming fairly outdated, stemming from an era of monopolistic electricity businesses favoring large, central-station generation for lower costs and higher returns. Historically, reserve capacity was the only option to address demand, weather, and generation uncertainties due to the lack of electricity storage and control technologies. Today, with the advent of competitive small generators, smart grids, and advanced control devices, there are more cost-effective solutions for handling supply failures, reducing the need for expensive reserve generation. Modern energy-based criteria, such as "loss of energy expectation (LOEE)" and "expected unserved energy (EUE)," offer a more accurate assessment of meeting consumer energy demand. These criteria enhance planning and configuration of power supply and delivery to minimize energy losses. For Pakistan, transitioning to a competitive wholesale electricity market requires understanding the costs and value of supply reliability linked to generation dynamics and demand patterns. The integration of renewable technologies and BESS complicates resource adequacy but also offers opportunities to avoid costly peaking plants. [37]
6. Resource Adequacy Framework in US, EU and Pakistan
Central to ensuring resource adequacy is the creation of a secondary market dedicated to securing future electricity supply. This market can take various forms, including capacity payments, capacity auctions, reliability options, or strategic reserves. Each of these mechanisms plays a role in ensuring that sufficient resources are available to meet demand and maintain grid reliability. The mechanism employed in the US, EU and Pakistan are briefly described below.
In regulated utilities, Integrated Resource Planning (IRP), supported by government regulators, helps manage reserve margins. Utilities like those in the Southwest Power Pool (SPP), Southeast Reliability Corporation (SERC), and the Western Electricity Coordinating Council (WECC) can raise customer rates to recover costs for new power plants or generation capacity. Conversely, the "missing money" problem in wholesale markets is tackled by imposing adequacy standards on Load Serving Entities (LSEs), ensuring they secure enough capacity to cover peak load plus a reserve margin. If LSEs fail to meet their capacity obligations by a specified deadline, ISOs/RTOs in centralized capacity markets procure the shortfall on their behalf. This is enforced in capacity markets like NYISO, ISO-NE, PJM, SPP, MISO, and California. In California, LSEs rely solely on self-supply and bilateral procurement for capacity. In MISO, most capacity is procured by LSEs before centralized auctions, whereas in PJM, ISO-NE, and NYISO, restructured regions with retail competition, capacity obligations are often met through centralized auctions. These auctions enhance competition, efficiency, and transparency, with the equilibrium value representing the " Net Cost of New Entry (Net CONE)," It represents the minimum payment needed for new power generation entrants to recover their investment costs. It is a critical metric in capacity markets, ensuring that new generation capacity is financially viable. So overall, as the market evolves from regulated to deregulated, the capacity procurement practice also moves from administrative measures to competitive measures. Centralized capacity auctions employ demand curves to procure right amount of capacity with the right incentive by keeping in view the market principle like demand and supply. As demand increase so does the price. The demand curves employed in ISOs/RTOs can be seen in the Figure 5.
In most capacity market demand curves, the price cap is not reached at the required reliability level, but higher prices can still be achieved when reliability falls below the target, rewarding generators during these periods. Conversely, building more generation is discouraged by lowering prices below net Cost of New Entry (CONE) levels, thus deterring new power plant construction. Currently, all markets use a peaking plant, typically an Open Cycle Gas Turbine (OCGT), as the benchmark for determining net CONE. Capacity procurement can be planned months to years in advance, depending on market demand and local requirements, with the shape of the demand curve affecting reserve levels and the benefits of participating in capacity markets. The price cap in capacity markets should be high enough to signal investment when reserve margins tighten, ensuring markets maximize signals before using backup mechanisms. RTOs design demand curves to meet reserve margin targets and should set price caps to balance low prices during surplus conditions, enabling investors to earn Net CONE on average.
The Electric Reliability Council of Texas (ERCOT) manages the electricity market for most of Texas. Unlike other U.S. markets that have a capacity market where generators are paid simply for having the ability to provide power, ERCOT relies solely on an energy-only market. Here, generators are only compensated for the electricity they actually produce and sell in energy as well as ancillary markets. This market is designed to be dynamic, with prices adjusting based on supply and demand. When demand is high, scarcity pricing kicks in, driving prices up to incentivize generators to produce more or bring new capacity online.
The EU Electricity Regulation (EU/2019/943) mandates strict guidelines for capacity remuneration mechanisms (CRMs) to ensure their effective and appropriate use. CRMs should be introduced only to address residual adequacy issues that cannot be solved through market reforms alone. Initially, countries must attempt market-based solutions and reforms. CRMs must comply with state aid rules to avoid distorting competition and the internal market, ensuring they are temporary and targeted. CRMs must be technology-neutral, open to all capacity providers, including demand response, storage, and cross-border participation, promoting a level playing field. Emission limits require new capacity providers receiving CRM support not to exceed 550g of CO2 per kWh, aligning with the EU’s climate goals. Additionally, member states are required to monitor and report annually on the implementation and effectiveness of CRMs to the European Commission. [39]
Capacity payments, Strategic reserves and reliability options (Table 1) are mechanisms used in the European electricity market to ensure reliability and address capacity concerns. Strategic reserves are used as a last-resort measure, activated only when transmission system operators (TSOs) face the risk of exhausting their balancing resources. These reserves operate outside the regular market, preventing market distortions and preserving price signals. They are secured through competitive tendering and are not remunerated from wholesale markets. The 2016 Commission Sector Inquiry in [40] identified strategic reserves as the most suitable mechanism for addressing temporary or local adequacy concerns. Reliability options, on the other hand, function like market-based insurance policies, where power plants enter into option contracts with TSOs or large consumers to provide additional electricity at a predetermined strike price if needed. This incentivizes power plants to maintain future capacity. Compared to these nuanced approaches, capacity payments are simpler but potentially more expensive, ensuring adequate electricity capacity in Europe's market.
Almost two-third of electricity demand have capacity mechanism with some countries yet to set their reliability standards. Cross border participation is still lagging. Clean technologies are beginning to be contracted; however, 57% capacity mechanism support still goes to fossil-based generation. [42]
Pakistan's power sector has relied on the "Take or Pay" model since the 1990s, where long-term power purchase agreements with Independent Power Producers (IPPs) were indexed to inflation and currency exchange rates, while heavily relying on imported oil. While initially effective due to stable foreign reserves and controlled inflation, the model has faced increased challenges in the early 2020s, in the form of surging generation costs due to currency devaluation and rising interest rates, coupled with declining electricity consumption from shrinking economy. The "Take or Pay" model ensures generators are paid annual fixed charges regardless of actual energy provision, leading to financial strain without competitive pricing mechanisms or market signals. This model, compounded with lack of investment in transmission and distribution infrastructure, results in high-capacity charges for consumers as shown in Figure 6 and frequent power outages.
From the Figure 6, it is evident that the cost of capacity mechanism in Pakistan, having significantly smaller generation capacity, is comparable to that of EU. The EU employs various capacity mechanisms such as strategic reserves, reliability options, and targeted capacity payments, designed to be more flexible and market-responsive. These mechanisms aim to minimize market distortions and optimize costs, contrasting with Pakistan's more rigid “Take or Pay” approach.
In 2018, significant amendments were introduced to the National Electric Power Regulatory Authority (NEPRA) Act to foster a deregulated and competitive electricity market in Pakistan, known as the Competitive Trading Bilateral Contract Market (CTBCM) [46]. This model is primarily inspired from the modern competitive markets such as US and EU and will be sharing basic features like security constrained economic dispatch (SCED), independent system operator from transmission owners, “pay as clear” pricing on the basis of marginal costs, balancing mechanism for energy and capacity. This market framework established new licenses alongside existing ones for system operator, market operator, special purpose agent (for legacy contracts), transmission service providers, metering service providers, transmission as well as distribution wheeling charges, competitive generation (participating in competitive market), independent auction administrator (for future balancing capacity auctions), competitive traders, distribution network services providers, bulk power consumers (primarily industries consuming more than 1 MW). [47] It also introduced/amended codes like Grid Code-2023, Market Commercial Code-2022 to guide the market participants. In phase-I, All Bulk Power Consumer (BPC) having sanctioned load more than 1 MW will have a choice to either enter into bilateral agreements with power producers, get supply through competitive traders or keep connected with distribution companies (suppliers of last resort). In phase-II, a retail market will be established and threshold of 1MW will be decreased further until all consumers have choice to choose their competitive supplier.
In terms of resource adequacy under CTBCM Model, all market participants need to procure 100% capacity for 3 years (starting from present year), 80% for 4th year and 60% (BPC, Suppliers of Last Resort-SLR), 50% (Competitive Supplier) for 5th year. Levelized fixed cost of reference technology (Net Cost of New Entry) will be equal to the difference between profit earned from the energy balancing market during 50 critical hours (when system was in stress during lowest reserves) in previous year and levelized investment cost of that technology. Reference technology will be that of lowest levelized fixed cost. [36]
Under CTBCM, there will be Yearly Balancing Market for Capacity for Market participants who have not sold/acquired their capacity in Bilateral agreement. All plants before CTBCM will be paid through Legacy Capacity Contracts distributed as per their share of supply to Distribution companies as shown in Figure 7
Source: Author’s own illustrations based on [36]
In post-CTBCM era, capacity will be traded either through bilateral contracts or competitive capacity auctions on balancing market for capacity. The suppliers with their negative capacity balance and generation companies with their positive capacity balances will participate in auction based competitive market to procure/sell their capacity. The Figure 8 illustrates the determination of capacity prices using a combination of supply and demand curves. The demand curve consists of two segments: the mandatory capacity segment (red line from A to B) and the efficient capacity segment (green line from B to C). The supply curve (green line) represents the capacity surplus offered by market participants. The intersection points indicate different price levels for the capacity market. At point A, the price is set at $75209, twice the levelized fixed cost of the reference technology (Gas Turbine). Point B indicates the total capacity deficit, where the price drops to $37604, equivalent to the levelized fixed cost. Point C represents the efficient capacity price at $30083, and point D reflects the price at 80% of the levelized fixed cost. The mandatory reserve margin is set at 10% with a Loss of Load Probability (LOLP) of 1%, while the efficient reserve margin is 35%, aligning with the least-cost solution as per IGCEP. This model aims to balance reliability and cost-efficiency by setting appropriate price levels for capacity while considering both mandatory and efficient reserves.
7. Rise of Renewables
7.1. Background
Initially, during the post-deregulation of electricity markets in the US (1990s) and the EU (2000s), the focus was on structural reform and establishing instruments to make the markets more transparent and competitive. In the US, this was driven by FERC Orders 719, 888, 889, 890, and 2000, while the EU implemented the First and Second Energy Packages. The aim was to enhance market efficiency and integration, particularly within the EU, which sought greater cohesion among member states' energy policies. In the 2010s, after the foundational rules were established, attention shifted towards enhancing transmission infrastructure and regional integration. This phase saw the issuance of US FERC Orders 825 and 1000, alongside the EU's Third Energy Package. These initiatives aimed to improve grid reliability and support the seamless transmission of electricity across regions. By the late 2010s, the focus further evolved to prioritize the integration of renewables and other green solutions. This was marked by US FERC Orders 841 and 2222 and the EU's Clean Energy Package, reflecting a global commitment to reducing carbon emissions and promoting sustainable energy sources. During this period, the US transitioned from coal to gas as the primary source of generation [49], while the EU maintained a diverse mix of electricity sources, including nuclear, coal, gas, and hydropower, varying across countries due to geographical, policy, and historical factors. [50]
In Pakistan, the partial deregulation of the electricity sector began in the 1980s, transitioning from a monopoly to multi-generation players. Significant milestones included The Water and Power Development Authority (WAPDA) privatization plan in 1992 and the establishment of National Electric Power Regulatory Authority (NEPRA) in 1997 to regulate the market. The formation of the Central Power Purchasing Agency (CPPA) by the National Transmission and Despatch Company (NTDC) in 2002 for procurement and billing evolved into the Central Power Purchasing Agency (Guarantee) Limited (CPPA-G) in 2009, which the NEPRA recognized as the Market Operator in 2017. In 2019, NEPRA approved the Competitive Trading Bilateral Contract Market (CTBCM) to enhance market efficiency. Additionally, Pakistan introduced the Alternative and Renewable Energy (ARE) Policy 2019, focusing on competitive bidding for renewable generation and procurement based on the least cost, aligned with the Indicative Generation Expansion Plan (IGCEP).
After the Paris Agreement in 2015 [51], renewable-based resources started gaining significant attention, leading to the deployment of renewable plants in the US, EU, and Pakistan. This trend accelerated further after 2020 when the levelized cost of electricity from renewable sources dropped significantly. Additionally, the prices of fossil-based resources increased in the EU due to the Russia-Ukraine war and in Pakistan due to currency depreciation and rising inflation. Both Pakistan and the EU experienced a rise in behind-the-meter solar generation installations in response to high electricity tariffs, while the US saw major investments in utility-scale solar projects.
7.2. Stages of Renewable Integration
Renewable energy auctions, a competitive process for procuring electricity generated from renewable sources, evolve through distinct stages as depicted in [52].
In the initial stage, simple energy-only auctions focus on awarding power purchase agreements (PPAs) based on the lowest energy bid to demonstrate market interest and facilitate price discovery, often transitioning from administratively set feed-in tariffs (FITs) to competitive bidding. The US and EU have utilized these early-stage auctions to attract investment into the power sector, starting with small capacity quotas, similar to Pakistan's current phase.
The second stage addresses grid integration challenges by adding requirements related to energy output timing and desired renewable locations, with significant investments in modernizing and digitizing grids. For example, the US identifies specific geographic zones for renewable capacity, sometimes necessitating new transmission infrastructure, while the EU stipulates energy supply during particular times of the year and specific hours of the day. Renewables-plus-storage solutions are increasingly adopted to enhance dispatchability and improve energy value.
In the third stage, renewable energy is integrated into electricity markets using mechanisms like feed-in premiums (FIP) and contracts for difference (CFD), requiring renewable generators to sell directly into wholesale markets and participate in ancillary services and balancing markets. This approach, seen in various EU countries, minimizes public subsidies and provides clear market signals for renewable energy.
The fourth stage involves commercial and industrial (C&I) power purchase agreements (PPAs), where C&I consumers procure power directly from renewable plants. In the US and EU, corporations are motivated by climate commitments, hedging against market fluctuations, and supply security. Auctions are used to secure the best prices, with both state utility and corporate auctions impacting competition levels and pricing. This stage benefits from technical assistance and supportive regulatory environments to facilitate corporate auctions.
Recent Initiatives
In September 2023, EU Parliament endorsed a new goal to achieve 42.5% of energy from renewable sources by 2030, while EU member states are encouraged to aim for 45%, a target also supported by the Commission as part of its REPowerEU initiative [53]. Recent initiatives include REPowerEU (May 2022), Net-Zero Industry Act (March-2023), Critical Raw Materials Act (March-2023), EU electricity market design reforms to boost Renewables (march 2023) [54], and The European Green Deal (March 2023) [55] all aiming at promoting clean technologies enhancing manufacturing capacity for technologies crucial to the clean energy transition.
From the US, different states have varying target years and percentages for renewable energy goals, as shown in Table 2. This diversity in standards and goals reflects the varied approaches and timelines states are adopting to transition towards renewable and clean energy. [56]
Renewable Portfolio Standards (RPS) and Clean Energy Standards (CES) are regulatory mechanisms that mandate specific percentages of energy to come from renewable or clean sources, with RPS focusing primarily on renewable energy and CES encompassing a broader range of clean energy technologies. Both RPS and CES are legally binding, with clear targets and penalties for non-compliance. In contrast, Clean Energy Goals are typically aspirational targets that set broad, long-term objectives for achieving a cleaner energy mix but may lack the strict legal enforceability of RPS and CES. The primary purpose of RPS and CES is to directly drive the integration of clean energy into the grid, whereas Clean Energy Goals provide a strategic vision for future energy transitions.
FERC Order No. 2023 [57] aims to streamline the connection process for renewable energy projects to the transmission system, enhance certainty in interconnection procedures managed by multiple transmission providers nationwide, and ensure equitable access for new technologies to the grid. FERC Order No. 2222 [58] focuses on facilitating the participation of distributed energy resources (DERs) in regional electricity markets administered by grid operators.
Recently Pakistan has also introduced various policies to facilitate the smooth transitioning to the clean and affordable generation technologies. National Electricity Plan 2023-2027 envisage renewable generation capacity of 40% of total generation capacity by FY-2025 and 60% of total generation capacity by FY-2030. Also, it establishes policy guidelines for promotion of hybrid renewable based generation to tackle intermittency, future participation of distributed renewable based generation, regional interconnectivity, transmission and distribution expansion and digitalization [59]. Fast Track Solar PV Initiatives 2022 [60] promotes solar PV Generation on 11 kV Feeders and solarization of Public Buildings.
In 2022, Pakistan introduced microgrid policy which paved the way for the establishment of microgrids in Pakistan with the power rating up to 5MW. This policy is inspired from the "the Alternative and Renewable Energy Policy 2019" which envisages the development of microgrids in the country to provide renewable based power to the far-flung isolated communities. [61]
Renewable based generation trends
The US power market is undergoing substantial changes, driven by the increasing integration of renewable energy sources and adjustments in fossil-based generation. From 2014 to 2028, wind and utility-scale PV generation capacities have shown significant growth. Wind capacity increased from 64,303.9 MW in 2014 to an operational capacity of 155,900.2 MW by April 2024, with planned projects pushing it to 171,867.2 MW by 2028. Utility-scale PV capacity exhibited rapid growth, rising from 8,988 MW in 2014 to 128,950.9 MW by April 2024, and is projected to reach 182,111.9 MW by 2028. Net-metering PV also showed substantial growth from 7,096.83 MW in 2014 to 47,000 MW by 2023. These trends can be seen in Figure 9.
Between 2020 and 2024, there were significant fossil-based retirements amounting to 62,339.4 MW, with fossil-based additions totaling 31,668.3 MW. These changes reflect the ongoing transition from traditional fossil fuels to cleaner energy sources as depicted in Figure 10. Additional fossil fuel-based plant additions are projected: 7,044 MW in 2025, 4,574.7 MW in 2026, 3,487.3 MW in 2027, and 1,101.5 MW in 2028. These additions indicate continued investments in fossil-based generation, albeit at a reduced rate compared to renewable energy investments. CAISO and ERCOT are leading the market in terms of renewable based generation.
Similar trend can be overserved in case of EU. In 2023, the EU electricity market experienced notable changes, highlighted by a 3.4% decrease in electricity demand due to high gas prices. Despite the 2022 energy crisis setbacks, the transition to clean energy gained momentum, driven by the REPowerEU commitment and the new 2030 renewable energy target of 44.5%. Renewable energy generation reached 1,200 TWh, surpassing fossil fuel generation at 788 TWh and accounting for 45% of total electricity generation. This growth was powered by an 18% surge in solar power and wind energy surpassing gas and coal generation for the first time as shown in Figure 11.
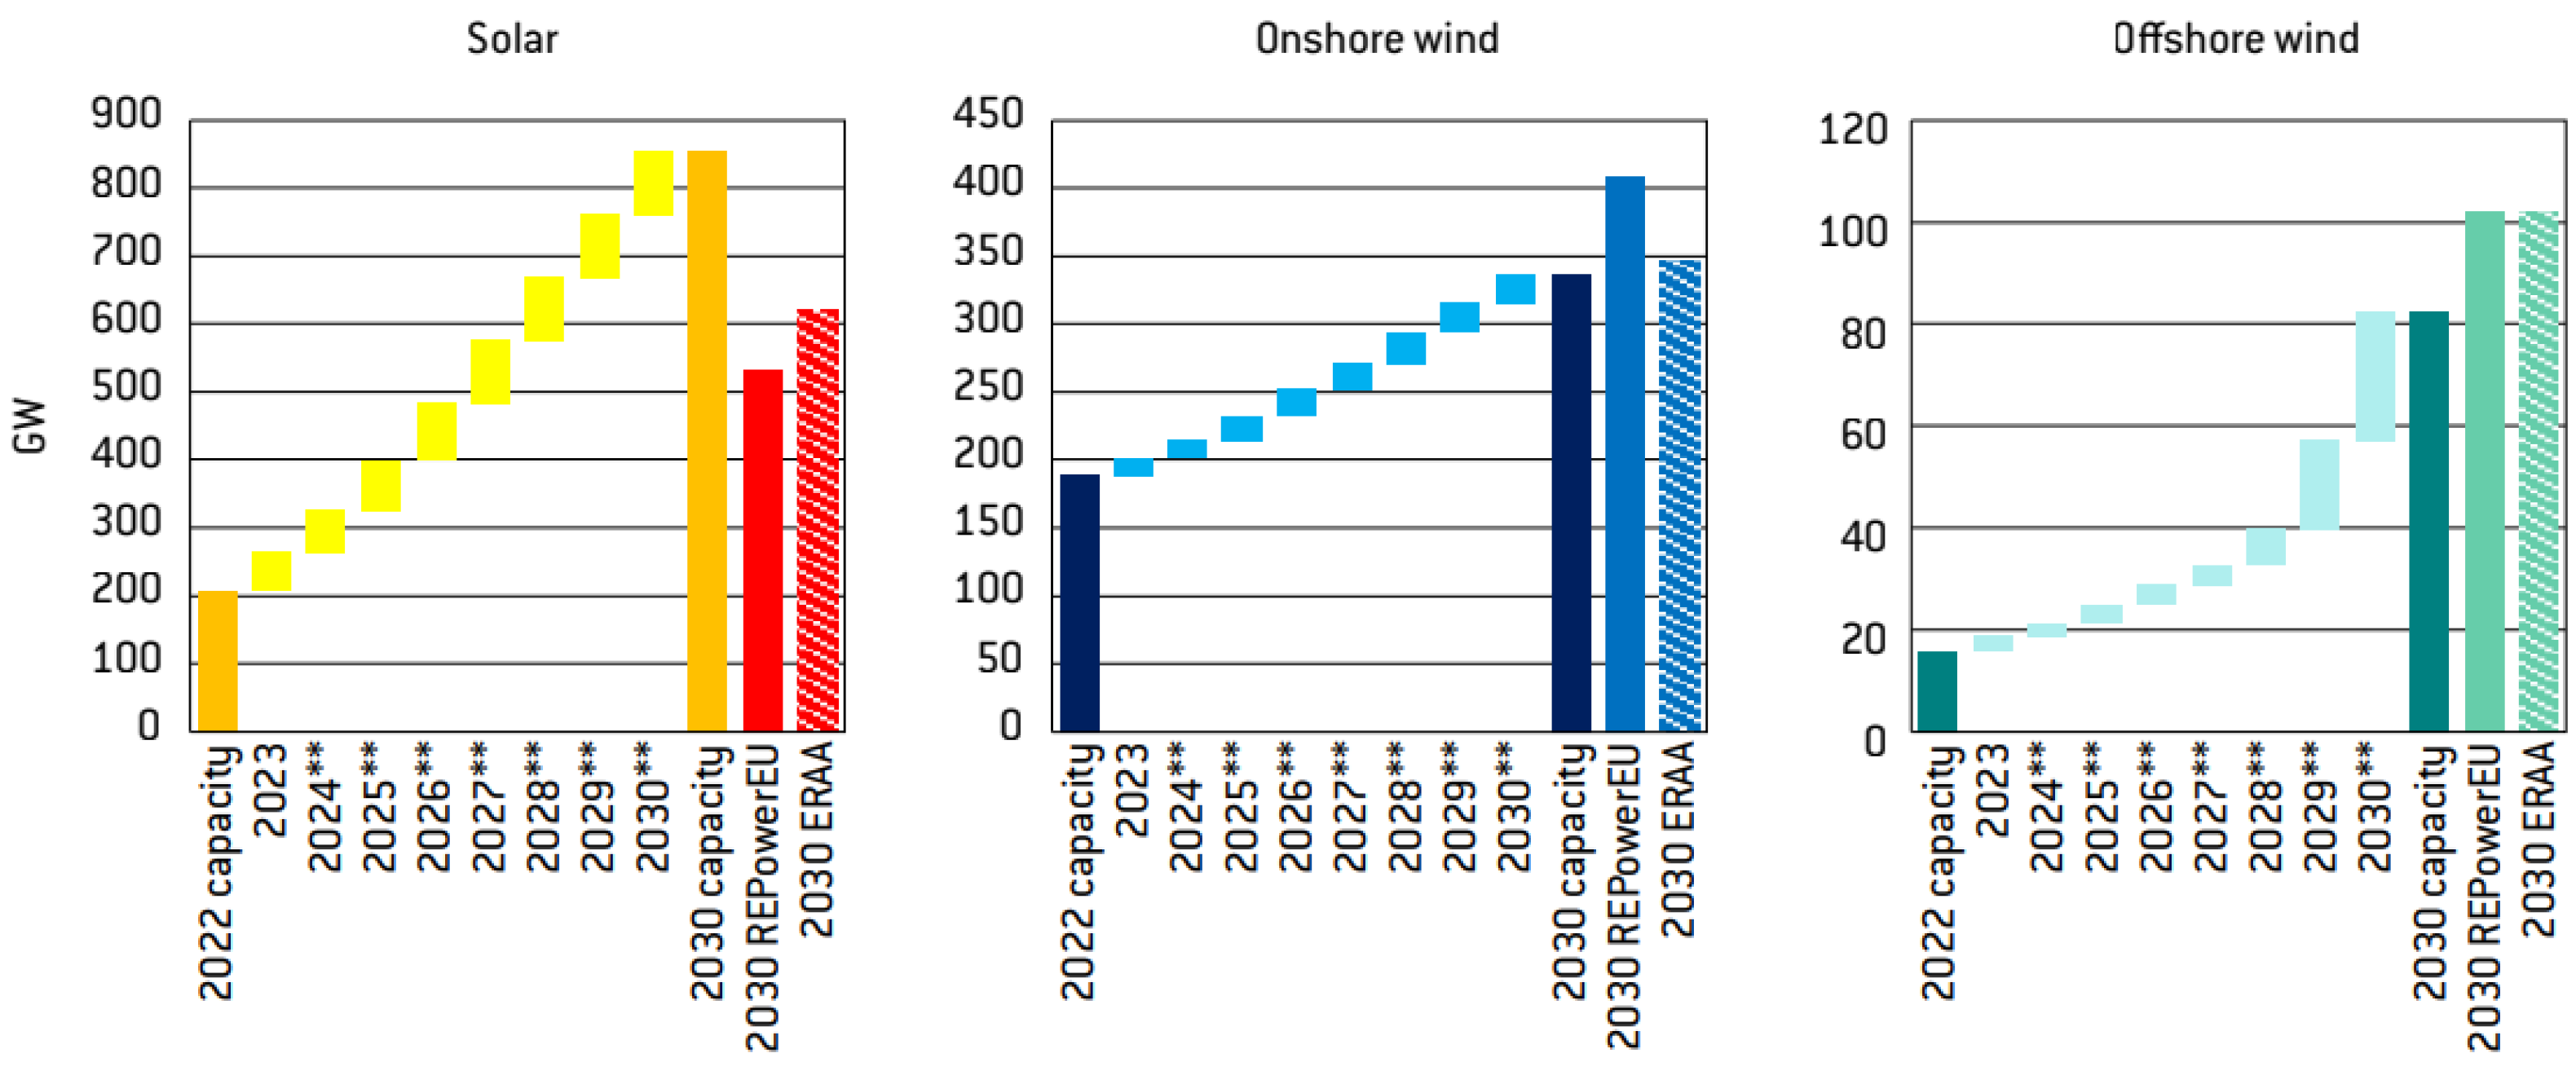
The EU has seen substantial growth in the installation of solar photovoltaic (PV) and wind systems, with a rapid acceleration in capacity over the past two decades. Countries like Germany, Spain, and Italy have been leading expansion in solar while Germany, Sweden and Netherlands leading the wind energy expansion. Projections indicate that this growth will continue especially in solar, driven by supportive policies and technological advancements, leading to higher shares of wind and solar power in the overall energy mix as depicted in Figure 12.
Figure 12.
EU Future outlook for solar and wind cumulative installed capacity [66].
Figure 12.
EU Future outlook for solar and wind cumulative installed capacity [66].
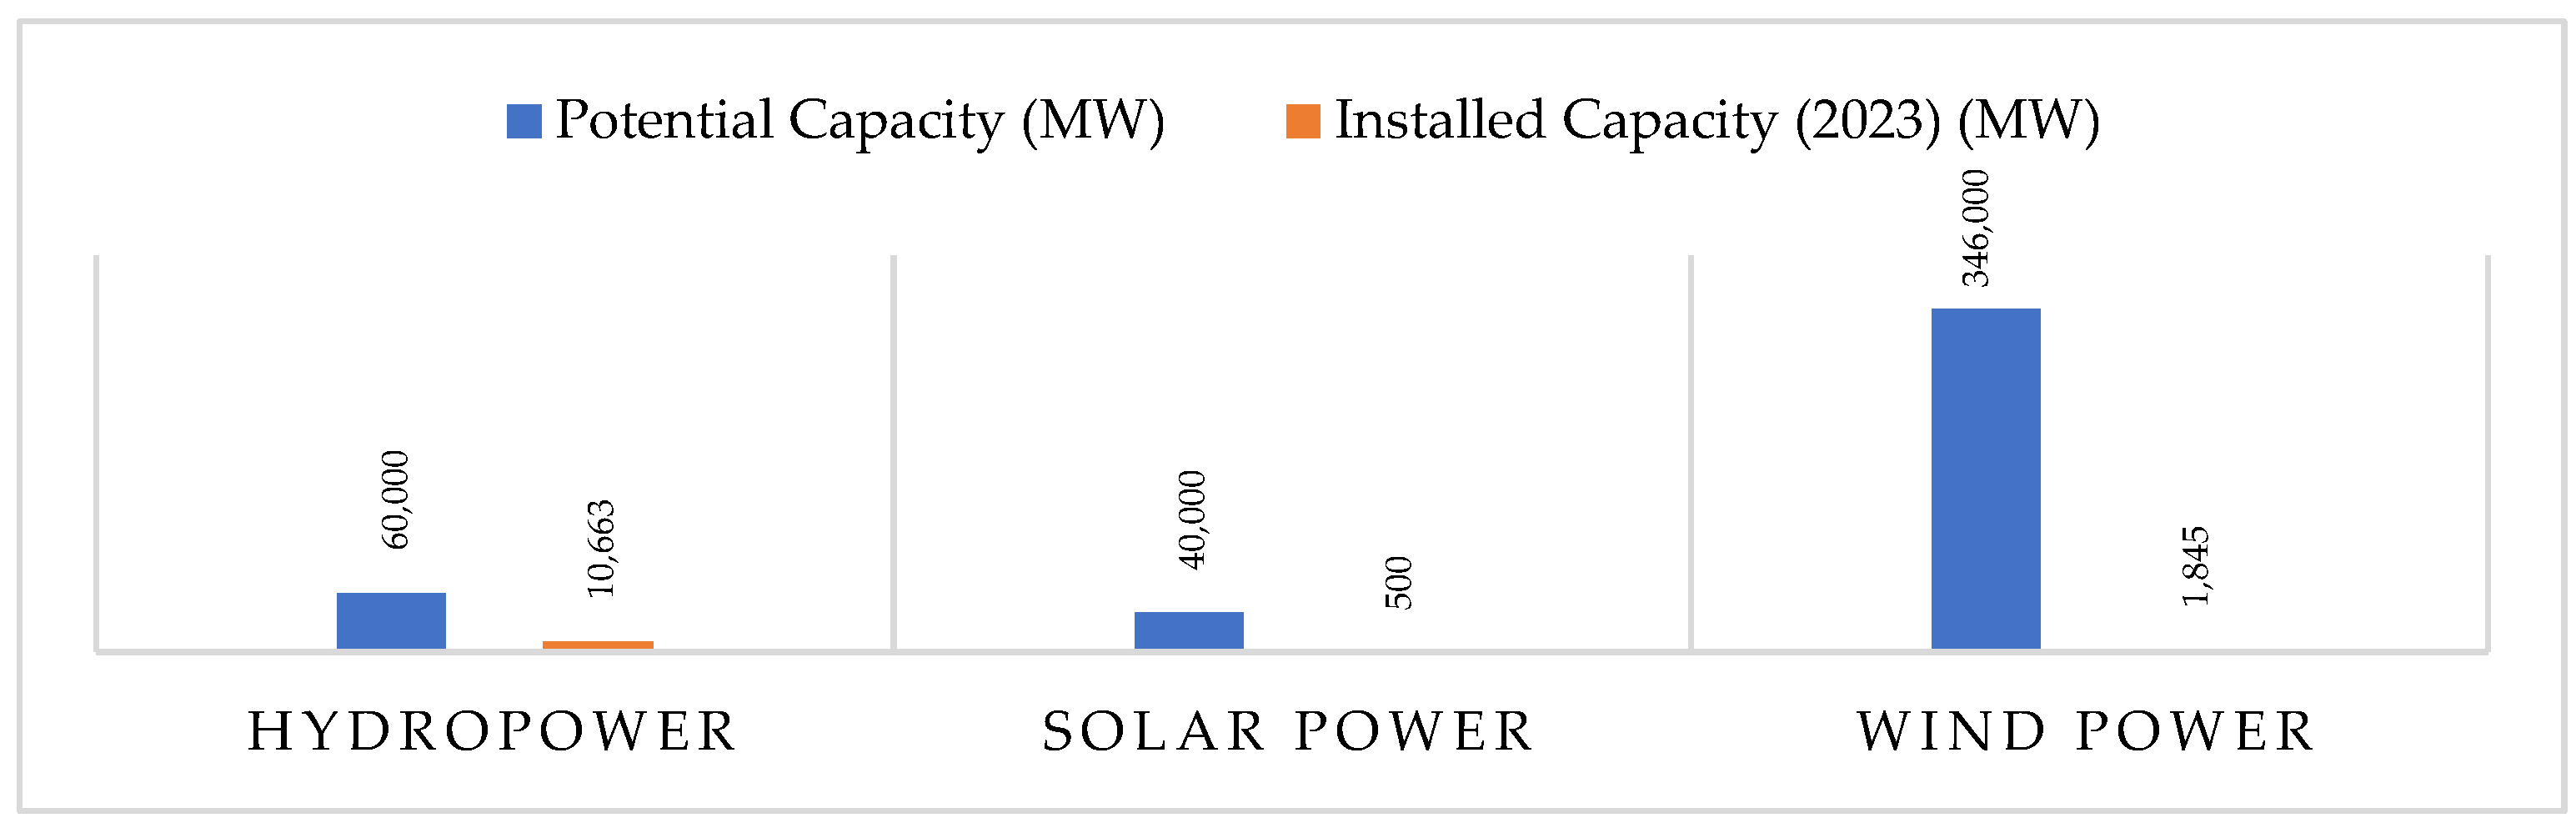
As of 2023, Pakistan's renewable energy potential remains significantly underutilized as shown in Figure 13. The country has an installed capacity of 10,663 MW from hydroelectric sources, 1,555 MW from solar power (including net-metering), and 1,845 MW from wind energy.
Figure 13.
Utility scale renewable generation potential vs installed capacity (2023).
Due to shrinkage of demand in recent years as observed in figure 6, the future scenario fell short of accommodating more renewables such as solar and wind. As the projected future demand is low so the requirements for the new RE based generation may not be increasing at high pace in future. However, government is actively planning to get rid of imported fossil-based generation due to fiscal constraints and gradually introducing incentives for solar generation [68]. If the demand for power increases in future, the requirements for penetration of solar also increase many folds. This phenomenon can be seen in Figure 14, which presents the year 2033-34 scenario in Pakistan. The distinction among base, medium and high demand is largely based on future GDP growth targets of Pakistan.
Source: Authors own illustrations based on [16]
To meet future demand, hydel generation in Pakistan is progressing well and can significantly contribute to decarbonization goals. However, it has limitations due to site issues, lack of foreign investment, and seasonal variability. Hydel generation is abundant during summer peak demand but low in winter, which is not problematic due to reduced demand. However, as winter demand increases due to gas supply limitations, rising gas prices, and industrialization, Pakistan may need to rely more on solar and wind energy as solar and wind poses lowest tariffs in Pakistan (Figure 15)
The net-metering scheme, introduced in 2015, has accelerated due to high electricity tariffs. By June 2023, net-metering-based solar installations reached 63,703, with a total capacity of 1,055.03 MW, and are anticipated to exceed 4 GW by 2033-34 [16,69]. However, the shift to solar and wind energy is hindered by inadequate financial incentives and inflexible power generation contracts. Current ramp rates for power plants are below international standards, limiting their adaptability to variable renewable energy sources (VRE) and their technological potential. Revising these ramp rates is essential for stable system operation, adapting to changing loads, and enhancing reserve power capacity [31]. Additionally, speculation about switching from net-metering to gross metering to manage the capacity cost of decreasing demand from the national grid has caused confusion among small-scale investors.
Historically, till 2018, Pakistan was effectively trying to deploying renewable based generation as indicated by renewable energy country attractiveness index (RECAI) where Pakistan ranked among the top 40 countries in terms of country’s attractiveness for renewable energy investment and deployment [70,71,72] but later on, the rate of deployment couldn’t keep pace with the rate observed in US and EU. This phenomenon can be observed from the Figure 16.
Although VRE currently contribute about 5% of Pakistan's electricity generation mix, solar energy is crucial for addressing the needs of the 25% of the population lacking grid access. The private sector, particularly in rural areas, is actively deploying solar solutions, with projects like solarizing tube wells and rural electrification gaining traction. A recent 30% decline in PV module prices since Q4 2023 has enhanced solar cost-competitiveness, facilitating wider adoption of solar energy in Pakistan. [74]
Implementing a Competitive Trading Bilateral Contract Market (CTBCM) in Pakistan can significantly address existing challenges and facilitate VRE deployment. By introducing a day-ahead market, generation companies can better project revenues and respond to competitive pressures, fostering a dynamic market environment with clear price signals that attract renewable energy investments. This competitive framework promotes efficiency and innovation, enabling renewable sources to compete equally with conventional generation. Lessons from the EU and US indicate that such competitive markets enhance the integration of VRE by providing financial incentives and encouraging technological advancements. Relying solely on long-term contracts may hinder renewable energy progress, underscoring the need for CTBCM adoption.
8. Renewable induced Resource Adequacy Challenges
In competitive energy markets, renewables offer advantages such as zero fuel costs and low emissions, which drive their deployment. However, their intermittency requires grid operators to rely on flexible generation sources to complement them for reliable service. Intermittent supply based on natural resources such as wind, solar and run of the river generation may create scarcity in their absence which necessitate dispatchable installed capacity to bridge the gap and abundance in their presence which led to curtailment especially during low demand. This situation impact system stability and pose a challenge to long-term resource adequacy. US Department of Energy in [75] highlighted several challenges expected to be faced in future in electricity markets. It is to be noted that most of top priority challenges are associated with integration of renewables as shown in Table 3.
8.1. Diminished Reserve Margins
The US Seasonal Risk Scenario (On-Peak Reserve Margins assessment for summer 2024) [76] highlights the variability and reliability challenges faced by the U.S. power grid as renewable energy sources become more prominent. Regions like MISO, NPCC-New York, and PJM exhibit significantly reduced reserve margins during higher demand, outages, and extreme conditions, with some margins turning negative. This underscores the critical need for robust resource adequacy planning and integration strategies that account for the intermittency of renewables such as wind and solar. Traditionally calculated reserve margins, based on Loss of Load Expectation (LOLE) metrics, become compromised under extreme conditions, revealing vulnerabilities not accounted for in standard models. Diminished reserve margins while taking into account extreme conditions such as low renewables, high demand and drought conditions can be seen as per Figure 17.
Source: Authors own illustrations based on [76]
8.2. Negative Pricing
The increased participation of renewables in the energy mix has increased the incidence of negative prices in the wholesale market. The phenomena of negative prices are peculiar to renewable subsidies such as state renewable portfolio standards (RPS). Eligible renewable generators can take a 2.2 cents/kWh or $22/MWh production tax credit (PTC) on electricity sold in the US. This means that some generators, primarily those operating wind turbines, may be willing to sell their output at negative prices to continue producing power. Though negative prices may not be occurring solely due to subsidized renewables in the market but they do contribute largely to this phenomenon. With the rise of negative prices, the generation revenues of other plants (fossil based) decrease which discourage the future investment in dispatchable Peaker plants, resulting in decreased adequacy. [77] In case of EU, the negative pricing in the spot market has increased 12-folds. Northern Europe witnessed the highest number of negative pricing occurrences due to low demand and high renewable generation. The historical trend of negative pricing in wholesale energy markets can be seen in the Figure 18 & Figure 19.
8.3. Shifting of Net-Peak Demand and Enhanced Flexibility Requirements
In many regions of the US, EU, and especially Pakistan, the peak electricity demand traditionally occurred during hot summer days. However, recent trends indicate a shift of net peak demand towards the evening hours when solar generation ceases, necessitating other resources to meet the net load.[80] with this shift the resource adequacy risk has also shifted to evening hours where dispatchable generation has to fulfill the huge scarcity of power. This phenomenon can be observed in both US markets such as CAISO and ERCOT, which are leading the renewable deployment. In CAISO, it exacerbates "duck curve" effect, requiring dispatchable plants to ramp up or down more steeply and frequently, which is both costly and inefficient. [81] This phenomenon can be observed in Figure 20 & Figure 21. In CAISO, with each passing years, the duck curve is getting deeper, thus creating high ramping requirements for dispatchable plants and necessitating the installation of BESS.
This transition places significant pressure on other generation facilities to be more flexible and fulfill the demand, increasing the risk of load shedding during these solar-deprived hours.
Similarly in EU, the daily flexibility requirements are also expected to increase as shown in Figure 22 due to increased participation of renewables.
8.3. Market Design
The deregulation of electricity markets introduced competition, shifting the focus to market forces to determine the generation mix. This change incentivized renewable energy due to its zero marginal cost and growing environmental concerns. However, it also introduced challenges, particularly in ensuring resource adequacy. In deregulated markets, where generators earn revenue based on electricity sales and ancillary services, underinvestment in capacity can occur due to depressed market prices, especially when renewable energy drives prices down. This leads to the "missing money" problem as shown in Figure 23, Factors contributing to this issue include: [85]
- Market regulations that cap prices below the Value of Lost Load (VoLL), restricting revenue needed to cover fixed costs.
- Overly stringent reliability criteria, leading to excess generation capacity and lower market clearing prices, which can deter new investment.
As the current deregulated market design in EU and US is competitive essentially working on the principle of demand and supply, so high reserve margins or excess generation in the market means no scarcity condition and hence no scarcity rent or pricing. In order to maintain that excess generation, some form of reward for maintaining resource adequacy for existing generation or some form of incentive to attract new generation is provided in the form of capacity market, reliability options or scarcity rents. However, keeping in view the present design of reliability mechanisms prevalent in different regions of US and EU, they do create missing money problems due to increased supply from renewables.
As Pakistan is also transitioning to competitive market, it may also experience missing money issue with increased participation of renewables in future.
The VRE additions push the supply curve to the right side as shown in Figure 24, resultantly decreasing capacity clearing price as well as capacity clearance from fossil-based generation, thus creating the missing money problem for more fossil-based generation.
9. Enhancing Integration of Renewables
Policies supporting low-carbon generation have significantly increased VRE production, displacing thermal generation due to the low operational costs of renewables. This shift, along with the economic crisis's impact on power demand, has led to a sharp decline in thermal plant load levels investment in new fossil-based dispatchable resources. The reduced use of flexible thermal generation, which is essential for managing renewable production fluctuations, poses a challenge for maintaining grid stability. Ensuring grid adequacy now requires the addition of new flexible resources to complement wind and solar power, which are subject to significant and sometimes sudden fluctuations. To balance these changes in electricity supply and demand, it is essential to deploy fast-acting generation, release stored electricity, or adjust consumption in response. Therefore, market incentives must be established to encourage investment in and retention of system flexibility, which is critical for the ongoing transformation of the electricity system. [87]
9.1. Tackling Intermittency
The combination of wind and solar PV along with BESS has the advantage that they complement each other since the peak operating times for each system occur at different times of the day and year. The power generation of such a hybrid system including BESS, is more continuous i.e., fluctuates less in terms of time and frequency if these are developed and operated jointly. [16] If solar is linked with appropriate storage its dispatchability enhances and combined capacity value exceeds individual capacities offered by solar and BESS due to diversity benefit. This phenomenon can be seen in Figure 25.
Technological complementarity involves integrating solar and wind generation profiles, both on a project and local level, considering their distinct peak and off-peak times. This integration results in a more consistent and less variable generation compared to individual technology profiles. As a result, there is a reduced requirement for flexibility resources to bridge the gap between variable renewable generation and demand. Combining wind and solar electricity supply has the potential to decrease short-term generation variability by approximately 30% in the EU.[89]
9.2. Improving Capacity Accreditation
Capacity accreditation methods are crucial for assessing a generator's ability to supply electricity during critical shortages, using capacity credits to represent each generator's contribution to resource adequacy. These credits are important for capacity market offers and competitive procurements. While a megawatt-hour (MWh) of energy is uniform, a megawatt (MW) of capacity varies in reliability based on availability. As resource mixes change and reliability risks shift to periods of lower demand with reduced resource availability due to weather or fuel disruptions, accurately evaluating each resource’s reliability is vital for grid stability.
Measuring firm capacity for variable resources, influenced by factors like insolation and wind speed, is challenging due to their unpredictability. Capacity contribution factors can impact resource contribution, future procurement decisions, and the choice of reference technology and capacity remuneration. The net CONE to be recovered through the capacity market fluctuates with renewable capacity support. Incorrect capacity values can significantly affect the net CONE value. The relationship between capacity value and net-CONE is shown in Figure 26.
Source: Author’s own illustration based on [90]
As the capacity value decreases, the net cost of that resource type also increases thus making it unsuitable to be cleared in the capacity market. This phenomenon discourages the participation of variable generation in capacity market.
Currently in Pakistan, the net capacity of a generation plant is determined based on the Initial Dependable Capacity (IDC) Test conducted at the Commercial Operation Date (COD) and repeated annually. Each unit's de-rated capacity is recorded and remunerated accordingly. However, this capacity accreditation method will change in the post-CTBCM era. For dispatchable generation units commissioned before CTBCM, the Market Operator will determine Initial Firm Capacity based on the actual Available Capacity during System Peak Hours over the past three years. For non-dispatchable generation units, it will be based on the average hourly energy injected into the Grid System during System Peak Hours over the past three years. These peak hours consist of 50 critical hours during periods of extreme system stress. For new generation units commissioned after CTBCM, the Market Operator will calculate Initial Firm Capacity based on the technology used, multiplying the Installed Net Capacity by Equivalent Availability Factors (EAF), provided the unit shows full availability during System Peak Hours as outlined in Figure 27.
Source: Author’s own illustration based on [36]
This approach mirrors the Effective Load Carrying Capability (ELCC) method used in the U.S., which dynamically measures the reliability contribution of resources in the capacity market. In Pakistan, capacity accreditation is based on EAF, assigning flat percentage rates to each type of generation based on reliability—92% for conventional sources like hydro, thermal, and bagasse, and lower rates for variable sources like wind (30%) and solar PV (22%). While straightforward, this method may not fully capture grid dynamics and the intermittent nature of renewables.
The U.S. ELCC approach evaluates each generating technology's contribution to overall system reliability during peak demand periods. It adjusts dynamically to specific regional challenges and storage solutions, offering a nuanced understanding of resource adequacy. For instance, solar with storage can have higher ELCC values, indicating more reliable grid contributions compared to solar alone. This method acknowledges the critical timing and location of energy generation.
Using ELCC, regions in the U.S. can tailor capacity accreditation to better reflect actual reliability under varying conditions as shown in Figure 28, leading to a more efficient and realistic capacity market where VRE sources are integrated effectively with advanced technologies like storage. In contrast, Pakistan's more generalized method underscores the need for sophisticated measures as grids evolve with more intermittent renewable energies.
Source: Author’s own illustration based on [91]
The ELCC method, also gaining traction in the EU, provides a more practical and accurate measure of resource adequacy than traditional de-rated capacity methods. As Pakistan introduces more variable generation resources, it may adopt the ELCC method to account for intermittency and local conditions more accurately.
9.3. Effective Forecasting
Accurate predictions of energy output from wind, solar, and other renewable sources enable grid operators to manage supply and demand effectively, minimizing the risk of blackouts and ensuring a continuous power supply. By anticipating periods of high and low renewable generation, utilities can better plan the integration of complementary energy sources such as hydro and Energy Storage Systems (ESS), which help mitigate the variability and intermittency inherent in renewables. This proactive approach not only optimizes the utilization of available resources but also reduces the need for costly and carbon-intensive backup generation, supporting the transition to a more sustainable and resilient energy infrastructure. In case of US, the expected contribution of various renewables during summer-2024 can been seen in the figure given below:
Figure 29.
Forecasted contributions of renewables and battery storage during Peak Hours.
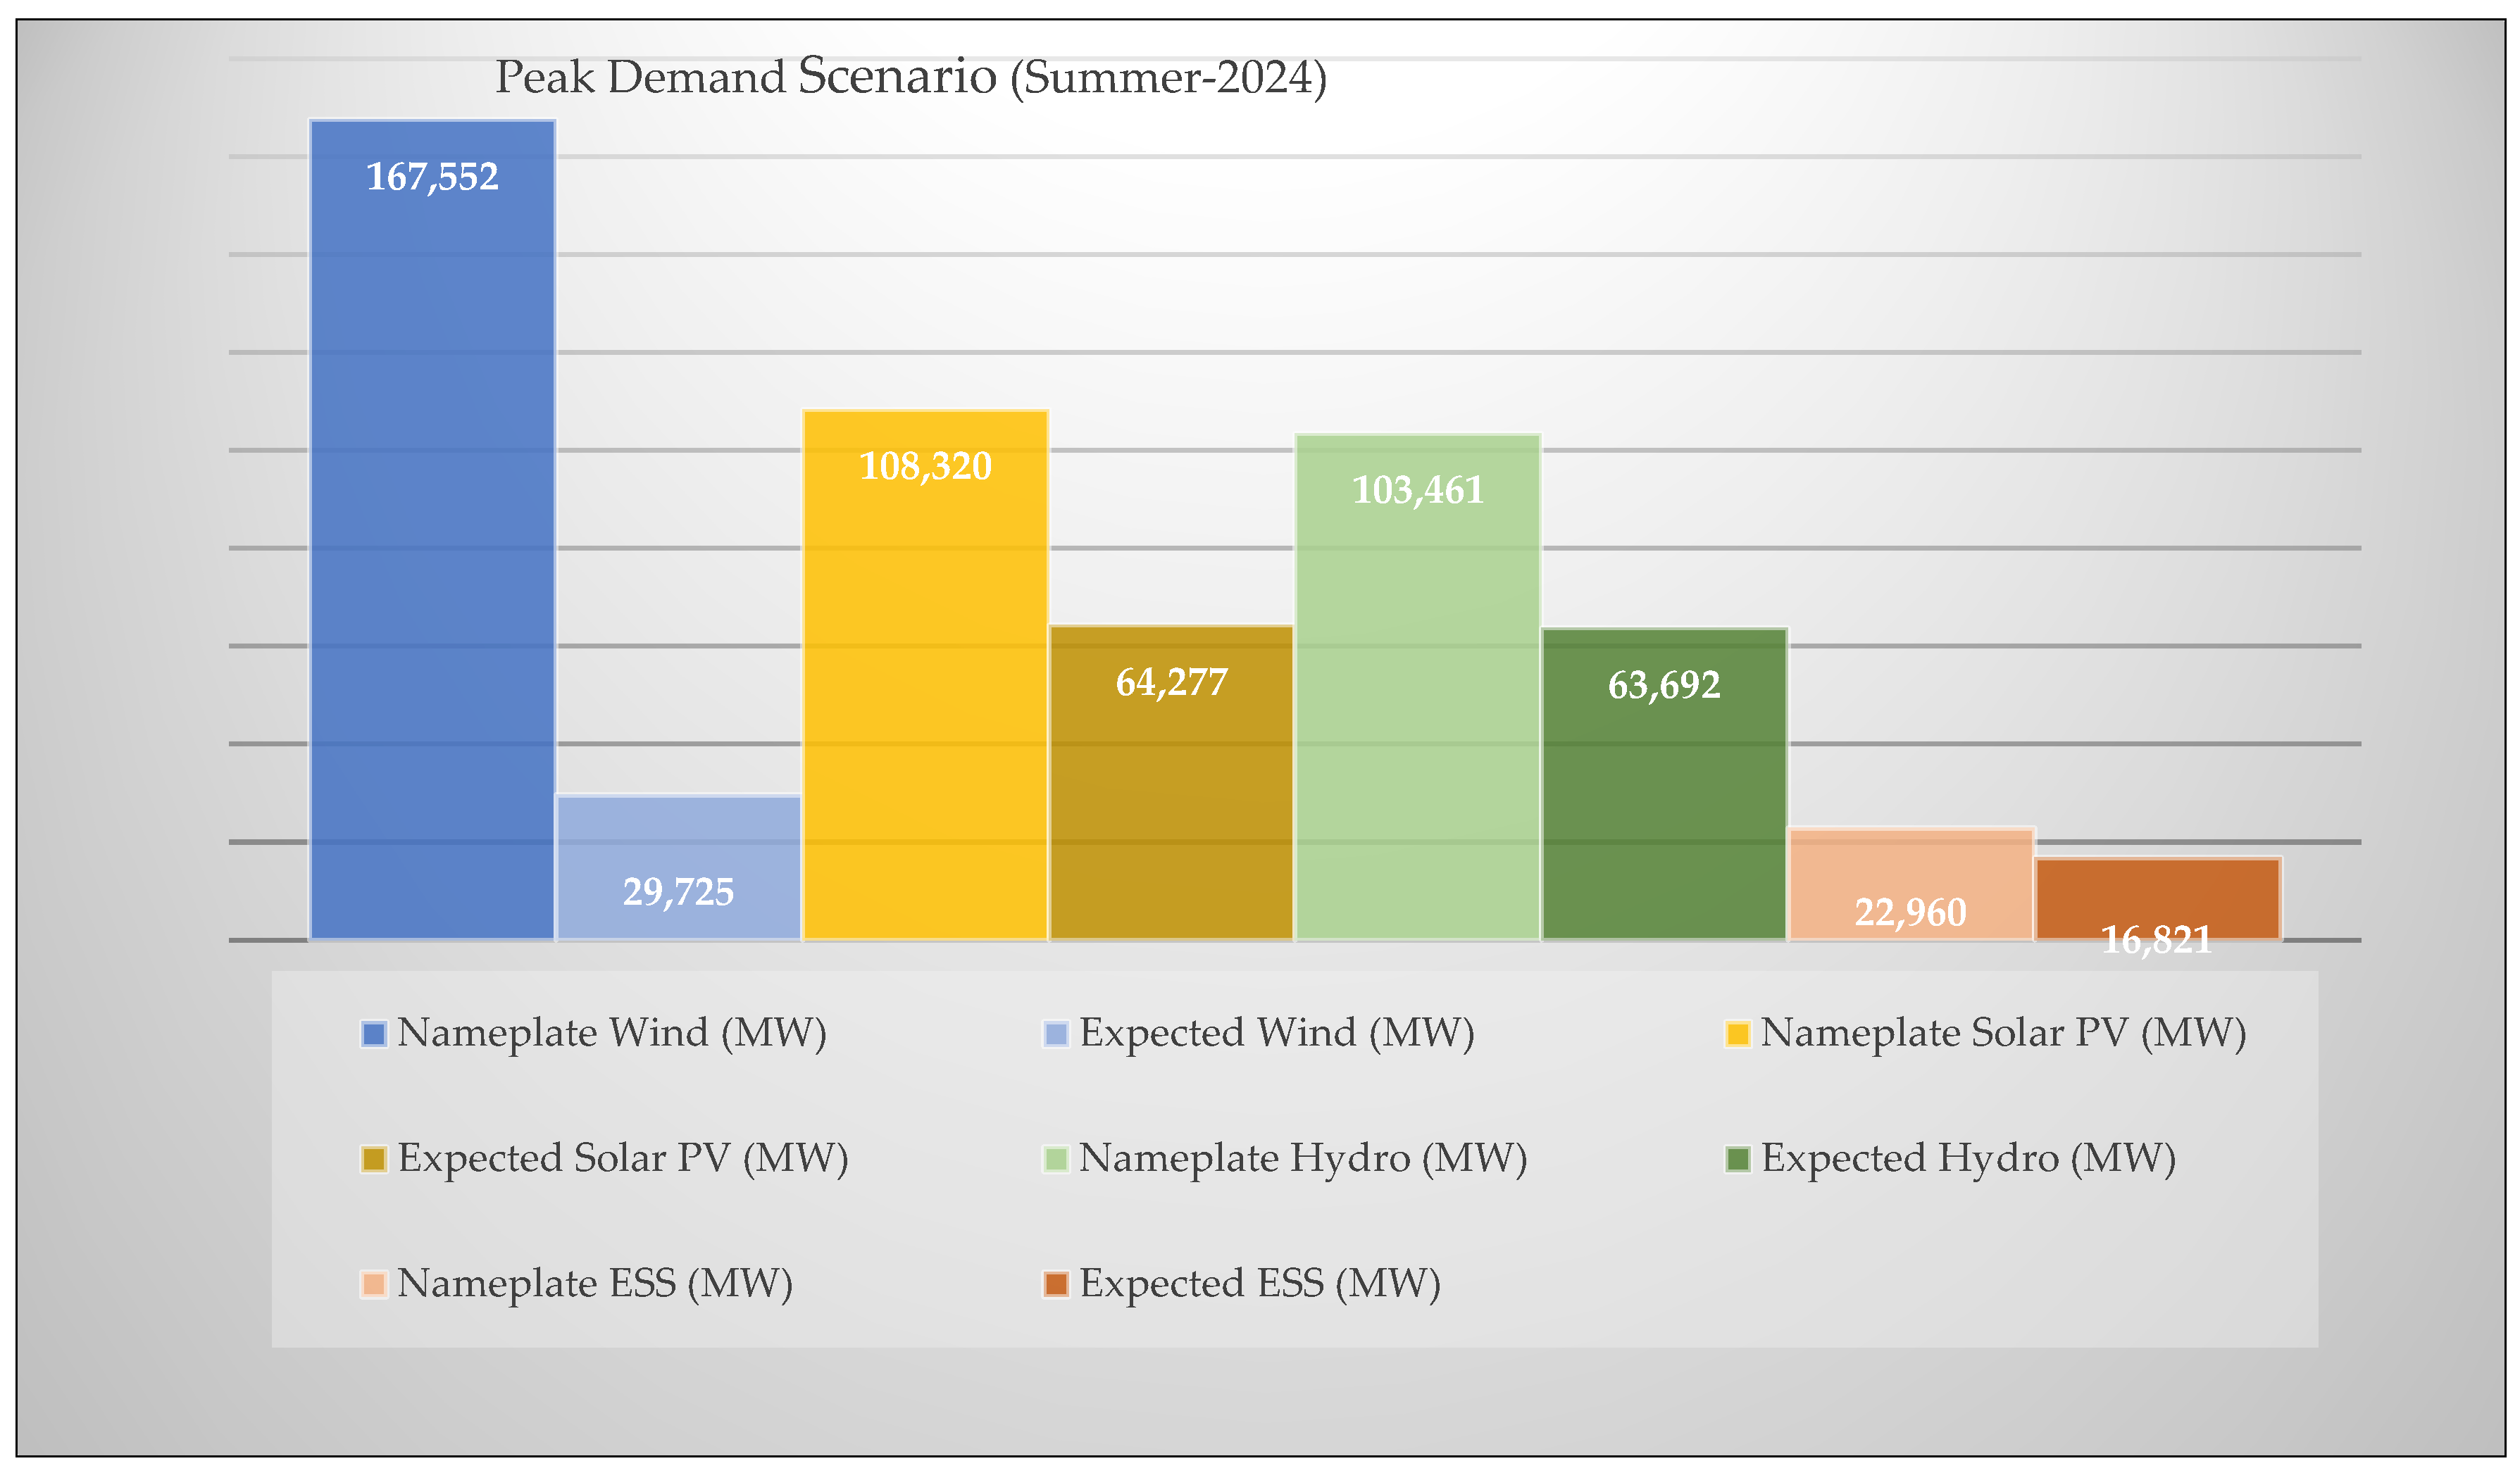
Source: Author’s own illustrations based on [76]
Wind energy, with a nameplate capacity of 167,552 MW, has an expected contribution of only 29,725 MW during peak demand, reflecting just 18% of its nameplate capacity due to its variability and dependence on weather conditions. Solar PV shows a higher expected performance, contributing 64,277 MW out of its 108,320 MW nameplate capacity, representing 59%. Hydro energy demonstrates greater reliability with an expected contribution of 63,692 MW from its 103,461 MW nameplate capacity, accounting for 62%. Energy Storage Systems (ESS) exhibit the highest reliability, contributing 16,821 MW from a 22,960 MW nameplate capacity, or 73%. This highlights the importance of ESS, which plays vital roles in balancing the intermittency of wind and solar power, thereby supporting the integration of VRE into the grid.
9.4. Battery Storage
The high variability caused by extensive renewable energy installations, particularly PV systems, results in significant intra-hour power load fluctuations that must be managed by fast-response batteries. Oversizing capacity to ensure constant balance between consumption and production necessitates substantial investments in generation infrastructure and leads to frequent curtailment. However, integrating electricity storage dramatically reduces the need for over-provisioning solar and wind capacity, cutting overcapacity by half within the European power grid. The continuous decline in technology costs, as shown in Figure 30, is paving the way for new, cost-effective storage solutions beyond traditional pumped hydro storage. The development of robust and affordable future energy systems based on renewable generation hinges on the ability to store substantial amounts of electricity over both short and long timescales. [92]
Historically, utility scale batteries were deployed for the provision of ancillary services, however, this role is transforming to ensuring resource adequacy through energy shifting and providing peaking capacity as shown in Figure 31.
Note:
- Ancillary services: Includes services such as frequency regulation, voltage control, reactive power support, and reserve capacity.
- Energy arbitrage: Trading electricity for profit from demand price discrepancies.
- Capacity market: Offers guaranteed power availability, boosting grid reliability.
- Others: Includes energy trading, power backup, firming, and ramp control.
BESS provides reliable dispatchable capacity to meet peak electricity demand, ensuring a stable and consistent power supply. By discharging during peak hours, BESS reduce the need for additional secure capacity from sources like gas turbines. As utility-scale BESS become increasingly competitive with other dispatchable capacity sources, their share in total dispatchable power capacity is expected to rise significantly. Currently, conventional unabated fossil fuel power plants dominate, accounting for 70% of available dispatchable capacity, with hydropower and nuclear contributing a combined quarter. In scenarios aimed at achieving Net Zero Emissions (NZE) by 2030, BESS are projected to constitute one-eighth of total dispatchable capacity, while unabated fossil fuels' share is expected to fall below 50%. By 2050, BESS are anticipated to become the primary global source of dispatchable capacity, with installed capacity exceeding 4 TW, as illustrated in Figure 32.
In the United States, the Inflation Reduction Act offers a federal tax credit of up to 50% for storage projects, while nine states have set storage targets totaling over 50 GW within the next 20 years. The Act also provides a 30% tax credit for residential clean energy equipment, including behind-the-meter battery storage systems with a minimum capacity of 3 kWh. Additionally, states like California, Arizona, Massachusetts, Hawaii, Colorado, and New York have introduced further incentives for behind-the-meter storage, such as time-of-use tariffs and dedicated storage incentives. [94]
Historically, pumped storage dominated the electricity markets until recently battery storage has experienced significant growth in US as shown in Figure 33 & Figure 34. This rapid expansion is driven by advancements in battery technology, decreasing costs, and the need for flexible storage solutions to support renewable integration. Batteries offer rapid response times, essential for balancing short-term fluctuations in renewable generation. They also play a critical role in peak shaving, storing excess renewable energy during low-demand periods and releasing it during peak demand, thereby enhancing resource adequacy. Additionally, batteries contribute to grid stability by providing ancillary services such as frequency regulation and voltage support, which are crucial in a grid increasingly powered by variable renewable sources. However, the usage factor, which peaked at 6.8% in 2017, has fluctuated and settled around 5.7% in 2023. This disparity between rapid capacity growth and inconsistent usage factors suggests potential integration challenges and underutilization issues.
As CAISO and ERCOT have massively deployed renewables especially solar so these ISOs have also been deploying battery storage on massive scale. California’s strong policy support and high renewable penetration, combined with Texas’s market-driven approach and need for grid resilience, position these regions as leaders in the battery storage market.
Battery storage can successfully operate during the evening peak hours when solar generation fall. Moreover, it can take advantage of the low or near zero prices during the day to charge while discharge during the evening peak hours. With the participation of battery, renewables curtailment rate also drops as battery takes advantage of the excess generation and store it. The enhanced participation of battery in future scenarios in US can be seen from the Figure 35.
In the European Union, member states plan to deploy approximately 45 GW of storage by 2030 as outlined in their National Energy and Climate Plans. Support for BESS includes reforms in Sweden, Spain, Italy, and Germany to eliminate double taxation and grid tariffs, along with long-term remuneration mechanisms in Greece and Italy. The EU also finances BESS projects through the Innovation Fund and Recovery and Resilience Facility. In countries like Germany and France, BESS are crucial providers of frequency response and reserves, driven by market reforms. BESS also enhance system adequacy and congestion management, with initiatives like Germany's grid boosters easing transmission bottlenecks. Utility-scale BESS are primarily used for energy shifting and peaking capacity. Germany, Italy, and other EU states encourage behind-the-meter storage through subsidies such as grants, low-interest loans, and tax rebates, though Italy has recently phased out its Superbonus tax credit, which had spurred much of the growth in behind-the-meter storage. Overall, EU member states are increasingly promoting self-consumption and moving away from feed-in tariffs and net metering schemes for solar PV, thereby encouraging the adoption of behind-the-meter BESS. [94]
The European Commission has issued recommendations in [98] to enhance the deployment of energy storage, emphasizing its crucial role in decarbonizing the EU energy system. These recommendations highlight that storage allows excess electricity to be saved and used later, improving the integration of VRE. The document underscores the flexibility storage provides, enabling the electricity system to adapt to changing demands, lower prices during peak times, and support consumer energy management. Additionally, storage technologies aid in the electrification of sectors like buildings and transport, and contribute to decarbonizing heating and cooling. The Commission advises EU countries to consider the unique aspects of energy storage in network charges and tariffs, streamline permit processes, and maximize storage potential in network design and operation. It also addresses the need for long-term revenue visibility to attract financing, encourages research and development, and calls for data publication to support investment decisions.
In terms of financing, the recommendation suggests measures to enhance revenue predictability for storage operators, including remuneration for services provided. It also encourages the use of competitive bidding procedures within state aid rules and improvements in capacity mechanism design to achieve the requisite flexibility. The accompanying Staff Working Document underscores storage's critical role in the energy transition, emphasizing its contribution to decarbonization targets. It provides insights into global storage deployment trends and outlines best practices for integration, with a particular focus on battery storage. Goals for 2030 and 2050 center around enhancing the integration of renewables and achieving greater flexibility in the energy system. [99]
The demand for energy storage in Europe is advancing at fast pace. In 2023 alone, a staggering 10 gigawatts (GW) of new storage capacity was installed, with 7 gigawatts (GW) being Behind-the-Meter (BtM) and 3 gigawatts (GW) being Front-of-Meter (FoM) storage power capacity. This impressive growth is fueled by two main drivers: government programs that support storage development and an overall improvement in market conditions for these systems. Interestingly, the trend is shifting towards storage solutions that can hold energy for longer periods. Previously, most projects involved systems that could store energy for 2 hours, but 4-hour systems are becoming increasingly popular. Experts even predict that storage with even longer durations will be commonplace in the near future. When it comes to the leading markets for energy storage, Germany and Italy remain the frontrunners for both BtM and FoM storage capacity. This dominance by these both countries is expected to continue for the foreseeable future. [100]
The latest projections as per shows a parabolic trend. The projections are given in Figure 36 & Figure 37.
Note: The European Resource Adequacy Assessment (ERAA) is crucial to European energy policy, helping policymakers ensure secure, affordable, and sustainable energy. It provides a comprehensive, pan-European evaluation of power system resource adequacy, projecting up to 10 years into the future.
In Pakistan, the development of viable business models for battery storage is hindered by a lack of an adequate regulatory framework. Though recently, 20MW BESS pilot project in Pakistan was deployed for the provision of ancillary services and few other projects involving battery storage in the feasibility stage. Merchant risk and uncertainty over long-term revenues also impede investment. Most importantly, short-term price signals are absent. Even after the introduction of CTBCM with adequate short-term price signals in place, Pakistan may still face significant barrier in the form of double taxation or double charging of grid tariffs, where BESS is taxed both when charging and discharging due to their dual nature as both generation and load. This results in a systemic disadvantage compared to other technologies, and storage systems can be subject to withdrawal tariffs for each charging cycle. As Pakistan move towards more and more renewables in response to future increased demand as well as more aggressive installation of Behind the meter solar generation, Pakistan may need to establish additional mechanisms for resource adequacy and BESS can play a greater role in that sense. Moreover, it can also be financially viable to go for batteries as well as meeting clean energy goals. As the delta between peak and off-peak rates increases, the battery installation start making sense [102]. The BESS, when paired with solar and wind power, have the potential to reduce electricity prices to as little as 6-8 cents per unit in Pakistan and can also provide reliable power to communities located far from the national grid. [103]
The WB study [31] evaluated various scenarios for future generation expansion in Pakistan keeping in view the reliability criteria, reserve margin requirements, existing generation contracts, trends, regulations and government policies for introduction of renewables. Possible scenarios along with their ranking are given in Table 4.
The analysis of various energy scenarios highlights that both the Battery and Low Demand scenarios, especially when combined with demand-side management (DSM), offer optimal solutions for Pakistan's future energy planning. The Battery scenario is cost-efficient, demonstrating lower total costs and significant emission reductions, making it a strong option for balancing economic and environmental goals. The Low Demand scenario shows the most significant cost and emission reductions, and when enhanced with DSM, it optimizes energy usage, reduces peak demand pressures, and improves overall grid reliability. Together, these strategies support the integration of VRE resources, maintaining competitive shares of wind and solar energy.
The BESS significantly enhance the power system's integration of VRE sources like wind and solar by increasing VRE absorption, reducing conventional capacity, delaying hydropower expansion, encouraging higher VRE installation, and minimizing curtailment. Several factors could support an even faster rate of least-cost VRE deployment, potentially enabling Pakistan to approach a 100% carbon-free electricity sector in the future. The adoption of new technologies such as BESS, DR, and other "smart grid" solutions, particularly if they become more affordable, would be crucial in this transition.
9.5. Demand Response
Demand response (DR) steps in as a crucial tool to address the challenges posed by variable renewable generation. DR programs incentivize consumers and businesses to adjust their electricity consumption patterns in response to grid conditions. During periods of high demand, DR can encourage reduced consumption, helping to balance the system and potentially avoiding the need for expensive backup generation.
In US, formal Demand Response (DR) programs have seen significant growth, particularly those involving commercial and industrial customers who have agreements with their load-serving entities to curtail load during high demand periods. Furthermore, some entities have introduced programs targeting retail customers, providing operator-controlled demand-side management capabilities. Examples of such programs include those implemented by the ERCOT in Texas, which demonstrate how DR programs can contribute to operating reliability and resource adequacy during the summer months. The quantum of DR in US can be seen in Figure 38.
The DR is also gaining traction in EU. On May 8, 2024, the European Distribution System Operators Entity (EU DSO Entity) and the European Network of Transmission System Operators for Electricity (ENTSO-E) submitted a joint proposal to the European Union Agency for the Cooperation of Energy Regulators (ACER) for the Network Code on DR. This regulation adheres to principles of non-discrimination and technology neutrality, while considering the specific requirements of demand response, energy storage, distributed generation, demand curtailment, and aggregation, and the potential need for adapting current and future rules. [104]
In Italy, the pilot project for mixed-enabled virtual units allowed small-scale units, including DR providers, to aggregate and establish a virtual power plant, offering ancillary services to the system operator. Embracing different forms of aggregation not only promotes a competitive atmosphere that lowers costs for end users but also presents a feasible business prospect for proactive consumers.
The DR participation in France is incentivized through dedicated measures, supporting the electricity system by reducing consumption during peak hours. This approach provides quick and environmentally friendly flexibility to the system. France enhances consumer participation in balancing and wholesale markets with specific capacity payments. Temporarily, DSR providers are remunerated through regular, competitive tenders. The contracted volume from these tenders is subtracted from the market-wide capacity mechanism's requirements. The remuneration for DR-specific auctions is generally higher than that of the market-wide mechanism, reflecting the additional incentives needed to encourage consumer participation. During the COVID-19 pandemic, the auction price cap was raised from 35,000 to 60,000 euros per MW to contract a higher volume as shown in Figure 39. Consequently, contracted volumes and their remuneration approximately doubled, although they still fell short of the target.
Author’s own illustration based on [29]
Demand response faces multiple barriers, including difficulties accessing markets, lack of national regulations, and retail prices that don't reflect system needs. While each barrier might seem minor individually, together they create significant obstacles that impact the overall market. Overcoming these barriers requires substantial effort. A certain degree of price volatility, including occasional negative wholesale prices, is crucial for signaling and activating demand response. However, policies that dampen these signals may hinder the transition to a more dynamic, responsive, and renewables-ready system. Key barriers include the absence of a proper legal framework for distributed energy resources to access electricity markets and provide services, lack of incentives for flexibility, restrictive requirements for participating in balancing and congestion management services, limited competitive pressure in the retail market, and public interventions in retail electricity prices. Additionally, other issues such as insufficient cross-border electricity capacity, bidding zones not reflecting structural congestions, and administrative and financial requirements also impact distributed energy resources.
In future, managing VRE deficit situations will be crucial for resource planning as they pose a risk to supply security if not handled properly. Between 2021 and 2030, the demand for non-VRE generation is expected to decrease substantially in most hours, totaling nearly half (46%), equivalent to the annual output of 182 baseload thermal power plants in EU. However, despite the overall decrease in the need for non-VRE generation, high VRE deficit situations are expected to persist. These instances occur during limited hours in a year when VRE generation is significantly lower than demand. [89]
Overall, there will still be a small number of hours annually where a significant amount of flexibility resources will be required to compensate for the shortfall in VRE generation. Flexibility requirements will shift from a 'high capacity - high volume' scenario suited for gas generators to a 'high capacity - low volume' scenario, increasingly feasible with carbon-free alternatives. Demand response measures like peak shaving and demand shifting, along with storage solutions, will be essential in addressing these peak events.
10. Recommendations
Based on the extensive analysis provided, several tailored recommendations can enhance resource adequacy and VRE integration in the power sectors of the United States, European Union, and Pakistan. For the United States, improving market design is essential to address the "missing money" problem by refining capacity market designs and implementing scarcity pricing that reflects the true cost of reliability. Investments in BESS should be accelerated to enhance grid flexibility and reliability, utilizing incentives like the Inflation Reduction Act’s federal tax credit and state-specific storage targets. Expanding demand response initiatives across regions will help manage peak load and integrate more VRE, encouraging participation from commercial, industrial, and residential sectors through regulatory support and financial incentives. Advanced forecasting technologies should be invested in to better predict VRE generation and manage grid operations effectively. Additionally, promoting hybrid renewable systems that combine solar, wind, and storage can mitigate intermittency and enhance overall generation reliability.
In the European Union, implementing robust CRMs is crucial to address residual adequacy issues, ensuring they are technology-neutral, open to all capacity providers, and compliant with state aid rules. Expanding battery energy storage systems through the Innovation Fund and Recovery and Resilience Facility will support system adequacy and congestion management. Enhancing regulatory frameworks to facilitate demand response and flexibility resources will promote market participation from distributed energy resources (DERs), including through the implementation of the Network Code on Demand Response. The integration of renewables should be prioritized through policies like the REPowerEU initiative and Net-Zero Industry Act, supporting both local and interconnected storage solutions and the strategic overbuilding of generation resources. Developing advanced forecasting and capacity accreditation methods, such as Effective Load Carrying Capability (ELCC), will improve the predictability of renewable generation and grid management.
For Pakistan, resolving costly fossil fuel contracts is a priority to create financial space for VRE investments. Implementing the Competitive Trading Bilateral Contract Market (CTBCM) model will promote market efficiency and VRE integration, with robust capacity procurement practices and clear regulatory guidelines. As VRE penetration is expected to increase in future, investments in BESS are essential to support grid reliability and manage renewable energy variability, while promoting demand response programs will stabilize the grid during peak load hours. Upgrading grid infrastructure to accommodate increased VRE sources and ensure a stable power supply is necessary, with a focus on digitalization and smart grid technologies. Attracting foreign investment and exploring innovative financing options like green bonds and renewable portfolio standards, alongside additional fiscal incentives for VRE projects such as tax exemptions and duty relaxations, will be crucial. Adopting advanced capacity accreditation methods, transitioning to ELCC or similar methods, will accurately measure the contribution of VRE sources to resource adequacy. Promoting hybrid renewable systems that combine solar, wind, and storage can enhance generation reliability and reduce intermittency. Additionally, investing in effective forecasting tools to better predict r generation and manage grid operations will be vital, integrating weather data with grid management systems for more accurate predictions. Finally, making conventional generation more adaptable by improving ramp rates and low power operation will further enhance the resource adequacy in near future.
11. Study Limitation and Future Research
This study examines the latest trends in the power markets of developed economies like the EU and US, providing a roadmap for Pakistan to achieve resource adequacy through modern and clean solutions such as battery storage and demand response. Future research should focus on quantifying the appropriate size of energy storage and demand response needed to integrate more renewable generation in Pakistan, and exploring alternative storage techniques beyond BESS. While this study emphasizes the technical aspects of the power market, it does not address political and financial issues in the US, EU, and Pakistan. Unique challenges in Pakistan, such as outdated transmission infrastructure, circular debt, high losses, and frequent power interruptions are also beyond this study's scope but are critical to consider for a successful energy transition.
Author Contributions
Conceptualization, M.S. and K.C; data collection, writing and editing, M.S.; review, K.C. All authors have read and agreed to the published version of the manuscript.
Funding
This work was supported by the 2024 Research Fund of the KEPCO International Nuclear Graduate School (KINGS), the Republic of Korea.
Data Availability Statement
All relevant data are within the paper.
Conflicts of Interest
The authors declare no conflicts of interest.
References
- National Renewable Energy Laboratory (NREL). Resource Adequacy. Available online: https://www.nrel.gov/research/resource-adequacy.html (accessed on July 15, 2024).
- Energy Systems Integration Group. Redefining Resource Adequacy for Modern Power Systems. December 2021. p. 1-4. Available online: https://www.esig.energy/wp-content/uploads/2022/12/ESIG-Redefining-Resource-Adequacy-2021-b.pdf. (Accessed July 15, 2024.).
- Agency for the Cooperation of Energy Regulators (ACER). European Resource Adequacy Assessment: Executive Report. 2023. Available online: https://www.acer.europa.eu/sites/default/files/documents/en/Electricity/European_Resource_Adequacy_Assessment/ERAA_2023_Executive_Report.pdf (accessed on July 15 2024).
- Auer, H. Resource Adequacy with Increasing Shares of Wind and Solar Power: A Comparison of European and U.S. Electricity Market Designs. 2018. Available online: https://ceepr.mit.edu/wp-content/uploads/2021/09/2018-008.pdf (accessed on July 15, 2024).
- Chandler, H. Harnessing Variable Renewables: A Guide to the Balancing Challenge. Paris: International Energy Agency, 2011. Pages 18–19, 33. Available online:https://iea.blob.core.windows.net/assets/2e0cb0c2-d392-4923-b092-ac633531db2b/Harnessing_Variable_Renewables2011.pdf (accessed on July 15 2024).
- Weitemeyer, S., Kleinhans, D., Vogt, T., & Agert, C. “Integration of Renewable Energy Sources in Future Power Systems: The Role of Storage.” Renewable Energy 75 (2015): 14–20. [CrossRef]
- Allard, S., Debusschere, V., Mima, S., Quoc, T. T., Hadjsaid, N., & Criqui, P. “Considering Distribution Grids and Local Flexibilities in the Prospective Development of the European Power System by 2050.” Applied Energy 270 (2020): 114958. [CrossRef]
- Das, P., Mathuria, P., Bhakar, R., Mathur, J., Kanudia, A., & Singh, A. “Flexibility Requirement for Large-Scale Renewable Energy Integration in Indian Power System: Technology, Policy and Modeling Options.” Energy Strategy Reviews 29 (2020): 100482. [CrossRef]
- Suman, S. “Hybrid Nuclear-Renewable Energy Systems: A Review.” Journal of Cleaner Production 181 (2018): 166–177. [CrossRef]
- Batalla-Bejerano, J., & Trujillo-Baute, E. “Impacts of Intermittent Renewable Generation on Electricity System Costs.” Energy Policy 94 (2016): 411–420. [CrossRef]
- Cailliau, M., Ogando, J. A., Egeland, H., Ferreira, R., Feuk, H., Figel, F., et al. Integrating Intermittent Renewable Sources into the EU Electricity System by 2020: Challenges and Solutions. Brussels: Union of the Electricity Industry [EURELECTRIC], 2010. Available online:https://www.eurelectric.org/media/2075/2020_integrating_intermittent_renewable_sources.pdf (accessed on July 15 2024).
- Liebensteiner, M., & Wrienz, M. “Do Intermittent Renewables Threaten the Electricity Supply Security?” Energy Economics 87 (2020): 104499. [CrossRef]
- Vidyanandan, K. V. Grid Integration of Renewables: Challenges and Solutions. P 157–158. Available online: https://www.researchgate.net/profile/Kv-Vidyanandan/publication/363484222_Grid_integration_of_renewables_challenges_and_solutions/links/63a7da44a03100368a282a74/Grid-integration-of-renewables-challenges-and-solutions.pdf.
- European Commission, Directorate-General for Energy, Lise, W., Ansarin, M., De Haas, V., et al. Study on Promoting Energy System Integration through the Increased Role of Renewable Electricity, Decentralised Assets and Hydrogen – Final Report. Publications Office of the European Union, 2024. Available online: https://data.europa.eu/doi/10.2833/560304 (accessed on July 15, 2024).
- Hussain, I., and Malik, A. Ensuring Low-Cost Generation and Resource Adequacy: The Case of Pakistan’s New Competitive Trading Bilateral Contract Market (CTBCM) Model. 2023. Available online: https://www.oxfordenergy.org/wpcms/wp-content/uploads/2023/12/EL51-Ensuring-low-cost-generation-and-resource-adequacy.pdf (accessed on July 15 2024).
- National Transmission and Dispatch Company (NTDC). Indicative Generation Capacity Expansion Plan (IGCEP) 2024-34. 2024. Available online: https://nepra.org.pk/Admission%20Notices/2024/05%20May/IGCEP%202024-34%20Report.pdf (accessed on July 15, 2024).
- Chantzis, Georgios, Effrosyni Giama, Sandro Nižetić, and Agis M. Papadopoulos. "The Potential of Demand Response as a Tool for Decarbonization in the Energy Transition." Energy and Buildings 296 (2023): 113255. P 1-3 . [CrossRef]
- Sun, Yinong and Guo, Nongchao and Frew, Bethany and Anwar, Muhammad Bashar, Impacts of Capacity Remuneration Mechanisms on Generation Investments and Resource Adequacy under Different Weather Conditions (June 26, 2024). P 22 Available at SSRN: https://ssrn.com/abstract=4896921 or. [CrossRef]
- Sundar, S., Craig, M.T., Payne, A.E. et al. Meteorological drivers of resource adequacy failures in current and high renewable Western U.S. power systems. Nat Commun 14, 6379 (2023) P 6-11. [CrossRef]
- Ho, Clifford K., Erika L. Roesler, Tu Nguyen, and James Ellison. "Potential Impacts of Climate Change on Renewable Energy and Storage Requirements for Grid Reliability and Resource Adequacy." Journal of Energy Resources Technology 145, no. 10 (2023) P 9-10 . [CrossRef]
- Kozlova, Mariia, Kaisa Huhta, and Alena Lohrmann. "The interface between support schemes for renewable energy and security of supply: Reviewing capacity mechanisms and support schemes for renewable energy in Europe." Energy Policy 181 (2023): 113707. P 8 . [CrossRef]
- Larsen, Erik, and Ann van Ackere. "Importing from? Capacity adequacy in a European context." The Electricity Journal 36, no. 1 (2023): 107236. P 6-7 . [CrossRef]
- Xin, Y.; Bin Dost, M.K.; Akram, H.; Watto, W.A. Analyzing Pakistan’s Renewable Energy Potential: A Review of the Country’s Energy Policy, Its Challenges, and Recommendations. Sustainability 2022, 14, 16123. p. 15 . [CrossRef]
- Nicholas, S., Buckley, T.: Pakistan’s Power Future: Renewable Energy Pro-vides a More Diverse, Secure and Cost-effective Alternative, Institute for Energy Economics and Financial Analysis (IEEFA), Islamabad (2018) P 22-25,34 Available online: https://ieefa.org/resources/pakistans-power-future-renewable-energy-provides-more-diverse-secure-and-cost-effective (accessed on July 15, 2024).
- Sadiqa, A., Gulagi, A., Bogdanov, D., Caldera, U., Breyer, C.: Renewable energy in Pakistan: Paving the way towards a fully renewables-based energy system across the power, heat, transport and desalination sectors by 2050. IET Renew. Power Gener. 16, 177–197 (2022). P 186-187 . [CrossRef]
- Yar, Muhammad Asfand, Dr. Aneel Salman, and Dr. Iftikhar Ahmed. "Pakistan’s Alternative and Renewable Energy Policy: Step Towards Energy Security." (2022). P 20, Available online: https://ipripak.org/wp-content/uploads/2022/07/Renewable-Energy-Paper-AS.pdf (accessed on July 15, 2024).
- Jamal, N. "A Renewable Electricity Supply System in Pakistan by 2050." Europa Universität, 2016. https://www.zhb-flensburg.de/fileadmin/content/spezial-einrichtungen/zhb/dokumente/dissertationen/jamal/phd-thesis.pdf. P-147-151.
- Agency for the Cooperation of Energy Regulators (ACER). Methodology for Calculating the Value of Lost Load, the Cost of New Entry and the Reliability Standard. 2020. Available online: https://www.acer.europa.eu/sites/default/files/documents/Individual%20Decisions_annex/ACER%20Decision%2023-2020%20on%20VOLL%20CONE%20RS%20-%20Annex%20I_1.pdf (accessed on July 15, 2024).
- Agency for the Cooperation of Energy Regulators (ACER). Security of EU Electricity Supply in 2021: Report on Member States Approaches to Assess and Ensure Adequacy. 2021. Available online: https://acer.europa.eu/sites/default/files/documents/Publications/ACER_Security_of_EU_Electricity_Supply_2021.pdf (accessed on July 15, 2024).
- PJM Interconnection. Energy and Reserve Price Capping in Other ISOs. 2022. Available online: https://www.pjm.com/-/media/committees-groups/task-forces/epfstf/2022/20220420/20220420-item-04-energy-and-reserve-price-capping-in-other-isos.ashx (accessed on July 15, 2024).
- World Bank. Variable Renewable Energy Integration and Planning Study. 2021. Available online: https://documents1.worldbank.org/curated/en/884991601929294705/pdf/Variable-Renewable-Energy-Integration-and-Planning-Study.pdf (accessed on July 15, 2024).
- Zafir, Siti & Muhamad Razali, Noor & Tengku, Juhana. (2016). Relationship between loss of load expectation and reserve margin for optimal generation planning. 2016. Jurnal Teknologi 78 (5-9). [CrossRef]
- Söder, Lennart, Egill Tómasson, Ana Estanqueiro, Damian Flynn, Bri-Mathias Hodge, Juha Kiviluoma, Magnus Korpås, Emmanuel Neau, António Couto, Danny Pudjianto, Goran Strbac, Daniel Burke, Tomás Gómez, Kaushik Das, Nicolaos A. Cutululis, Dirk Van Hertem, Hanspeter Höschle, Julia Matevosyan, Serafin von Roon, Enrico Maria Carlini, Mauro Caprabianca, and Laurens de Vries. “Review of Wind Generation within Adequacy Calculations and Capacity Markets for Different Power Systems.” Renewable and Sustainable Energy Reviews 119 (2020): 2–3. [CrossRef]
- Federal Energy Regulatory Commission (FERC). Resource Adequacy Requirements: Reliability and Economic Implications. 2014. Available online: https://www.ferc.gov/sites/default/files/2020-05/02-07-14-consultant-report.pdf (accessed on July 15, 2024).
- National Electric Power Regulatory Authority (NEPRA). Grid Code 2023-7. 2023. Available online: https://nepra.org.pk/Legislation/6-Codes/6.2%20The%20Grid%20Code%202023/Grid%20Code%202023.PDF (accessed on 30 July 2024).
- National Electric Power Regulatory Authority (NEPRA). Market Commercial Code-8: Market Commercial Code (2022). 2022. Available online: https://nepra.org.pk/Legislation/6-Codes/6.5%20Market%20Commercial%20Code/Market%20Commercial%20Code%2003-06-2022.pdf (accessed on 30 July 2024).
- Saeed, M. Electricity Resource Planning in Pakistan: Correcting the Fundamentals. 2021. Available online: https://www.pakistangulfeconomist.com/2021/07/26/electricity-resource-planning-in-pakistan-correcting-the-fundamentals/ (accessed on 30 July 2024).
- Milligan, M.; Frew, B.; Bloom, A.; Clark, K.; Denholm, P.; O'Connell, M.; Levin, T. Capacity Payments in Restructured Markets under Low and High Penetration Levels of Renewable Energy. Available online: https://www.nrel.gov/docs/fy16osti/65491.pdf (accessed on July 15 2024).
- The European Parliament and The Council of the European Union. Electricity Regulation (EU/2019/943) of the European Parliament and of The Council of 5 June 2019 on the Internal Market for Electricity. 2019. Available online: https://eur-lex.europa.eu/legal-content/EN/TXT/PDF/?uri=CELEX:32019R0943&from=EN (accessed on July 15, 2024).
- The European Commission. Final Report of the Sector Inquiry on Capacity Mechanisms. 2016. Available online: https://eur-lex.europa.eu/legal-content/EN/TXT/PDF/?uri=CELEX:52016DC0752 (accessed on July 15 2024).
- European Commission. Capacity Mechanisms. Available online: https://energy.ec.europa.eu/topics/markets-and-consumers/capacity-mechanisms_en#:~=Capacity%20mechanisms%20are%20temporary%20support,term%20security%20of%20electricity%20supply (accessed on July 15 2024).
- Agency for the Cooperation of Energy Regulators (ACER). Security of EU Electricity Supply. Available online: https://acer.europa.eu/media/charts/security-eu-electricity-supply (accessed on July 15, 2024).
- National Electric Power Regulatory Authority (NEPRA). State of Industry Report 2023. Available online: https://www.nepra.org.pk/publications/State%20of%20Industry%20Reports/State%20of%20Industry%20Report%202023.pdf (accessed on July 15, 2024).
- Papandreou, V. Resource Adequacy Framework and Capacity Mechanisms. Available online: https://www.energy-community.org/dam/jcr:0d0e3fb7-4e57-4bd4-9bfa-832ab57105eb/TAIEX_WS_Mr_Vasilis_PAPANDREOU_Resource%20adequacy%20framework%20and%20Capacity%20Mechanisms.pdf (accessed on July 15, 2024).
- PACIFIC Exchange Rate Service. Available online: https://fx.sauder.ubc.ca/etc/USDpages.pdf (accessed on 31 July 2024).
- Riaa Barker Gillette. Alternate Energy and Power 2023. Available online: https://riaabarkergillette.com/pk/assets/uploads/2023/11/2.-Chambers-Alternative-Energy-and-Power-2023.pdf (accessed on July 15, 2024).
- National Electric Power Regulatory Authority (NEPRA). CTBCM Detail Design Report. Available online: https://nepra.org.pk/Admission%20Notices/2020/03%20Mar/Detailed%20Design%20of%20CTBCM.pdf (accessed on July 15, 2024).
- Asian Development Bank (ADB). TA-9672 PAK: Developing Electricity Market in Pakistan (52323-001) CTBCM Detail Design Report. Available online: https://www.nepra.org.pk/Admission%20Notices/2020/03%20Mar/Detailed%20Design%20of%20CTBCM.pdf (accessed on July 15, 2024).
- U.S. Energy Information Administration (EIA). U.S. Electricity Generation by Major Energy Source, 1950-2019. Available online: https://int.nyt.com/data/documenttools/generation-major-source-1950-2020/ed4a9abd89b178cd/full.pdf (accessed on July 15, 2024).
- World Economic Forum. Where does Europe's electricity come from? Available online: https://www.weforum.org/agenda/2023/02/europe-electricity-renewable-energy-transition/ (accessed on July 15, 2024).
- UNFCCC-United Nations Framework Convention on Climate Change: Adoption of The Paris Agreement - Paris Agreement text English, Paris (2015). Available online: https://unfccc.int/sites/default/files/english_paris_agreement.pdf (accessed on July 15, 2024).
- USAID. Stages of Renewable Energy Auctions. Available online: https://www.usaid.gov/energy/auctions/stages-of-auctions (accessed on July 15, 2024).
- European Parliament. Renewable Energy: Setting Ambitious Targets for Europe. Available online: https://www.europarl.europa.eu/topics/en/article/20171124STO88813/renewable-energy-setting-ambitious-targets-for-europe (accessed on July 15, 2024).
- European Commission. Commission Proposes Reform of the EU Electricity Market Design to Boost Renewables, Better Protect Consumers and Enhance Industrial Competitiveness. Available online: https://ec.europa.eu/commission/presscorner/api/files/document/print/en/ip_23_1591/IP_23_1591_EN.pdf (accessed on July 15, 2024).
- European Commission. The European Green Deal: A Growth Strategy that Protects the Climate. Available online: https://ec.europa.eu/stories/european-green-deal/ (accessed on July 15, 2024).
- Database of State Incentives for Renewables & Efficiency (DSIRE). Renewable & Clean Energy Standards. November 2022. Available online: https://ncsolarcen-prod.s3.amazonaws.com/wp-content/uploads/2022/11/RPS-CES-Nov2022.pdf (accessed on July 15, 2024).
- Federal Energy Regulatory Commission (FERC). Improvements to Generator Interconnection Procedures and Agreements (Issued July 28, 2023). Available online: https://www.ferc.gov/media/order-no-2023 (accessed on July 15, 2024).
- Federal Energy Regulatory Commission (FERC). FERC Order No. 2222 Explainer: Facilitating Participation in Electricity Markets by Distributed Energy Resources. Available online: https://www.ferc.gov/ferc-order-no-2222-explainer-facilitating-participation-electricity-markets-distributed-energy (accessed on July 15, 2024).
- Government of Pakistan. National Electricity Plan 2023-2027. Available online: https://power.gov.pk/SiteImage/Policy/National%20Electricity%20Plan%202023-27.pdf (accessed on July 15, 2024).
- Government of Pakistan. Fast Track Solar PV Initiatives 2022. Available online: https://power.gov.pk/SiteImage/Policy/Framework_Guidelines___Fast_Track_Solar_PV_Initiatives_2022.pdf (accessed on July 15, 2024).
- National Electric Power Regulatory Authority (NEPRA). National Electric Power Regulatory Authority Licensing (Microgrid) Regulations, 2022. Available online: https://nepra.org.pk/Legislation/3-Reg/3.29%20NEPRA%20Microgrid%202022%20Regulations/S.R.O%20994%20(I)-2022%20dated%2006-07-2022.PDF (accessed on July 15, 2024).
- U.S. Energy Information Administration (EIA). Form EIA-860, 'Annual Electric Generator Report' and Form EIA-860M, 'Monthly Update to the Annual Electric Generator Report. Available online: https://www.eia.gov/electricity/data/eia860m/ (accessed on July 15, 2024).
- U.S. Energy Information Administration (EIA). Table 4.10. Net Metering Customers and Capacity by Technology Type, by End Use Sector, 2012 through 2022. Available online: https://www.eia.gov/electricity/annual/xls/epa_04_10.xlsx (accessed on July 15, 2024).
- Federal Energy Regulatory Commission (FERC). 2023 State of the Markets Report. Available online: https://www.ferc.gov/sites/default/files/2024-03/24_State-of-the-market_0320_1715.pdf (accessed on July 15, 2024).
- Agency for the Cooperation of Energy Regulators (ACER). ACER Market Monitoring Report-2024. Available online: https://www.acer.europa.eu/sites/default/files/documents/Publications/ACER_2024_MMR_Key_developments_electricity.pdf (accessed on July 15, 2024).
- Heussaff, C. and G. Zachmann (2024) ‘The changing dynamics of European electricity markets and the supply-demand mismatch risk’, Policy Brief 14/2024, Bruegel. Available online:https://www.bruegel.org/sites/default/files/2024-07/PB%2014%202024_0.pdf (accessed on July 15, 2024).
- Abbas, Y.; Aslam, R.A. Potential of Untapped Renewable Energy Resources in Pakistan: Current Status and Future Prospects. Eng. Proc. 2023, 56, 108. [CrossRef]
- Aaj News. Punjab to Provide Solar Panels to Consumers Using up to 500 Units of Electricity. Available online: https://english.aaj.tv/news/330368861/punjab-to-provide-solar-panels-to-consumers-using-up-to-500-units-of-electricity (accessed on July 15, 2024).
- Private Power and Infrastructure Board (PPIB). Net-Metering. Available online: https://www.ppib.gov.pk/brief-on-net-metering/#:~=As%20of%20June%202023%2C%20the,cumulative%20capacity%20of%201055.03%20MW (accessed on July 15, 2024).
- Ernst & Young (EY). RECAI Renewable Energy Country Attractiveness Index November 2018, Issue 52. Available online: https://assets.ey.com/content/dam/ey-sites/ey-com/en_gl/topics/power-and-utilities/ey-recai-52-nov-2018.pdf (accessed on July 15, 2024).
- Ernst & Young (EY). RECAI Renewable Energy Country Attractiveness Index May 2019, Issue 53. Available online: https://assets.ey.com/content/dam/ey-sites/ey-com/es_mx/topics/power-and-utilities/ey-recai-index-53-scores-ladder.pdf (accessed on July 15, 2024).
- Ernst & Young (EY). RECAI Renewable Energy Country Attractiveness Index November 2019, Issue 54. Available online: https://assets.ey.com/content/dam/ey-sites/ey-com/en_gl/topics/power-and-utilities/ey-recai-54-nov-2019.pdf (accessed on July 15, 2024).
- Ember. Electricity Data Explorer. Available online: https://ember-climate.org/data/data-tools/data-explorer/ (accessed on July 15, 2024).
- Solar Power Europe. Global Market Outlook for Solar Power 2024. Available online: https://api.solarpowereurope.org/uploads/Global_Market_Outlook_for_Solar_Power_2024_a083b6dcd5.pdf (accessed on July 15, 2024).
- Millstein, D.; Cappers, P.; Barbose, G.; Bird, L.; Callaway, D.; Elmallah, E.; Golden, M.; Kazachkov, I.; Malin, B.; Matross, R.; Mills, A.; Wang, J. Research Priorities and Opportunities in United States Competitive Wholesale Electricity Markets. National Renewable Energy Laboratory (NREL). Available online: https://www.nrel.gov/docs/fy21osti/77521.pdf (accessed on July 15, 2024).
- North American Electric Reliability Corporation (NERC). 2024 Summer Reliability Assessment. Available online: https://www.nerc.com/pa/RAPA/ra/Reliability%20Assessments%20DL/NERC_SRA_2024.pdf (accessed on July 15, 2024).
- Electric Power Research Institute (EPRI). Evaluation of Negative Prices in U.S. Electricity Markets. Available online: https://www.epri.com/research/products/000000003002011828 (accessed on July 15, 2024).
- Millstein, D.; O'Shaughnessy, E.; Wiser, R. 2024. Renewables and Wholesale Electricity Prices (ReWEP) Tool. Lawrence Berkeley National Laboratory. Version 2024.1. Available online: https://emp.lbl.gov/renewables-and-wholesale-electricity-prices-rewep (accessed on July 15, 2024).
- Agency for the Cooperation of Energy Regulators (ACER). Key Developments in EU Electricity Wholesale Markets: 2024 Market Monitoring Report. Available online: https://www.acer.europa.eu/sites/default/files/documents/Publications/ACER_2024_MMR_Key_developments_electricity.pdf (accessed on July 15, 2024).
- PJM Interconnection. Reliability in PJM: Today and Tomorrow. Available online: https://www.pjm.com/-/media/library/reports-notices/special-reports/2021/20210311-reliability-in-pjm-today-and-tomorrow.ashx (accessed on July 15, 2024).
- California Independent System Operator (CAISO). What the Duck Curve Tells Us About Managing a Green Grid. Available online: https://www.caiso.com/Documents/FlexibleResourcesHelpRenewables_FastFacts.pdf (accessed on July 15, 2024).
- Millstein, D.; O'Shaughnessy, E.; Wiser, R. Exploring Wholesale Energy Price Trends, The Renewables and Wholesale Electricity Prices (ReWEP) Tool, Version 2024.1. Lawrence Berkeley National Laboratory. Available online: https://live-etabiblio.pantheonsite.io/sites/default/files/rewep-2024update_tech-brief_20240429.pdf (accessed on July 15, 2024).
- U.S. Energy Information Administration (EIA). As Solar Capacity Grows, Duck Curves Are Getting Deeper in California. Available online: https://www.eia.gov/todayinenergy/detail.php?id=56880# (accessed on July 15, 2024).
- Agency for the Cooperation of Energy Regulators (ACER). Demand Response and Other Distributed Energy Resources: What Barriers Are Holding Them Back? 2023 ACER Market Monitoring Report. Available online: https://www.acer.europa.eu/sites/default/files/documents/en/The_agency/Documents/Presentation_TTE_Council_lunch_Barriers_to_DR.pdf (accessed on July 15, 2024).
- Philippe Vassilopoulos & Elies Lahmar, 2022. "The Trading of Electricity," Springer Books, in: Manfred Hafner & Giacomo Luciani (ed.), The Palgrave Handbook of International Energy Economics, chapter 0, pages 407-437, Springer. Available online: https://link.springer.com/content/pdf/10.1007/978-3-030-86884-0.pdf.
- SPEES, KATHLEEN, SAMUEL A. NEWELL, and JOHANNES P. PFEIFENBERGER. “Capacity Markets—Lessons Learned from the First Decade.” Economics of Energy & Environmental Policy 2, no. 2 (2013): 1–26. http://www.jstor.org/stable/26189454.
- European Commission. Identification of Appropriate Generation and System Adequacy Standards for the Internal Electricity Market. Available online: https://energy.ec.europa.eu/system/files/2016-07/Generation%2520adequacy%2520Final%2520Report_for%2520publication_0.pdf (accessed on July 15, 2024).
- Energy Systems Integration Group. Ensuring Efficient Reliability: New Design Principles for Capacity Accreditation. A Report of the Redefining Resource Adequacy Task Force. Reston, VA. 2023. Available online: https://www.esig.energy/new-design-principles-for-capacity-accreditation (accessed on July 15, 2024).
- European Environment Agency (EEA) and Agency for the Cooperation of Energy Regulators (ACER). Flexibility Solutions to Support a Decarbonized and Secure EU Electricity System. Available online: https://www.acer.europa.eu/sites/default/files/documents/Publications/EEA-ACER_Flexibility_solutions_support_decarbonised_secure_EU_electricity_system.pdf (accessed on July 15, 2024).
- PJM Interconnection. Periodic Review of Default CONE and ACR Values. Available online: https://www.pjm.com/-/media/committees-groups/committees/mic/2022/20221006/item-13a---periodic-review-of-default-cone-and-acr-values.ashx (accessed on July 15, 2024).
- Lazard. Lazard’s Levelized Cost. Available online: https://www.lazard.com/media/2ozoovyg/lazards-lcoeplus-april-2023.pdf (accessed on July 15, 2024).
- García-Navarro, J.; Dominguez, I.; Brutti, S.; Afanasyev, V.; & Jossen, A. The Critical Role of Electricity Storage for a Clean and Renewable European Economy. Energy & Environmental Science. 2023. Available online: https://pubs.rsc.org/en/content/articlehtml/2023/ee/d3ee02768f (accessed on July 15, 2024).
- Solar Power Europe. European Market Outlook for Battery Storage 2024-2028. Available online: https://www.solarpowereurope.org/insights/thematic-reports/european-market-outlook-for-battery-storage-2024-2028 (accessed on July 15, 2024).
- International Energy Agency (IEA). Batteries and Secure Energy Transitions. Available online: https://iea.blob.core.windows.net/assets/cb39c1bf-d2b3-446d-8c35-aae6b1f3a4a0/BatteriesandSecureEnergyTransitions.pdf (accessed on July 15, 2024).
- EY. Four Factors to Guide Investment in Battery Storage. Available online: https://www.ey.com/en_uk/recai/four-factors-to-guide-investment-in-battery-storage (accessed on July 15, 2024).
- S&P Global. Capacity Surpasses 14.6 GW in Q3, 3.5 GW Planned in Q4. Available online: https://www.spglobal.com/commodityinsights/en/market-insights/latest-news/electric-power/111423-us-battery-storage-capacity-surpasses-146-gw-in-q3-35-gw-planned-in-q4 (accessed on July 15, 2024).
- U.S. Energy Information Administration. Annual Energy Outlook 2023 (AEO2023). Available online: https://www.eia.gov/outlooks/aeo/ (accessed on July 15, 2024).
- European Commission. Commission Recommendation of 14 March 2023 on Energy Storage – Underpinning a decarbonized and secure EU energy system 2023/C 103/01. Available online: https://eur-lex.europa.eu/legal-content/EN/TXT/PDF/?uri=CELEX:32023H0320(01) (accessed on July 15, 2024).
- European Commission. Energy storage. Available online: https://energy.ec.europa.eu/topics/research-and-technology/energy-storage_en#eu-initiatives-on-batteries (accessed on July 15, 2024).
- EASE. EMMES 8.0 - March 2024. Available online: https://ease-storage.eu/publication/emmes-8-0-march-2024/ (accessed on July 15, 2024).
- ACER. Explore the Datasets Behind the European Resource Adequacy Assessment. Available online: https://acer.europa.eu/media/charts/explore-datasets-behind-european-resource-adequacy-assessment (accessed on July 15, 2024).
- Dawn. A Case for Solar with Battery Storage. Available online: https://www.dawn.com/news/1782973 (accessed on July 15, 2024).
- Dawn. Batteries with Renewables Can Cut Power Costs: Study. Available online: https://www.dawn.com/news/1832126 (accessed on July 15, 2024).
- ENTSO-E. Network Code on Demand Response. Available online: https://eepublicdownloads.blob.core.windows.net/public-cdn-container/clean-documents/Network%20codes%20documents/NC%20DR/NCDR_DSO%20ENTITY_ENTSO-E.pdf (accessed on July 15, 2024).
Figure 1.
VoLL values in euros/MWh.
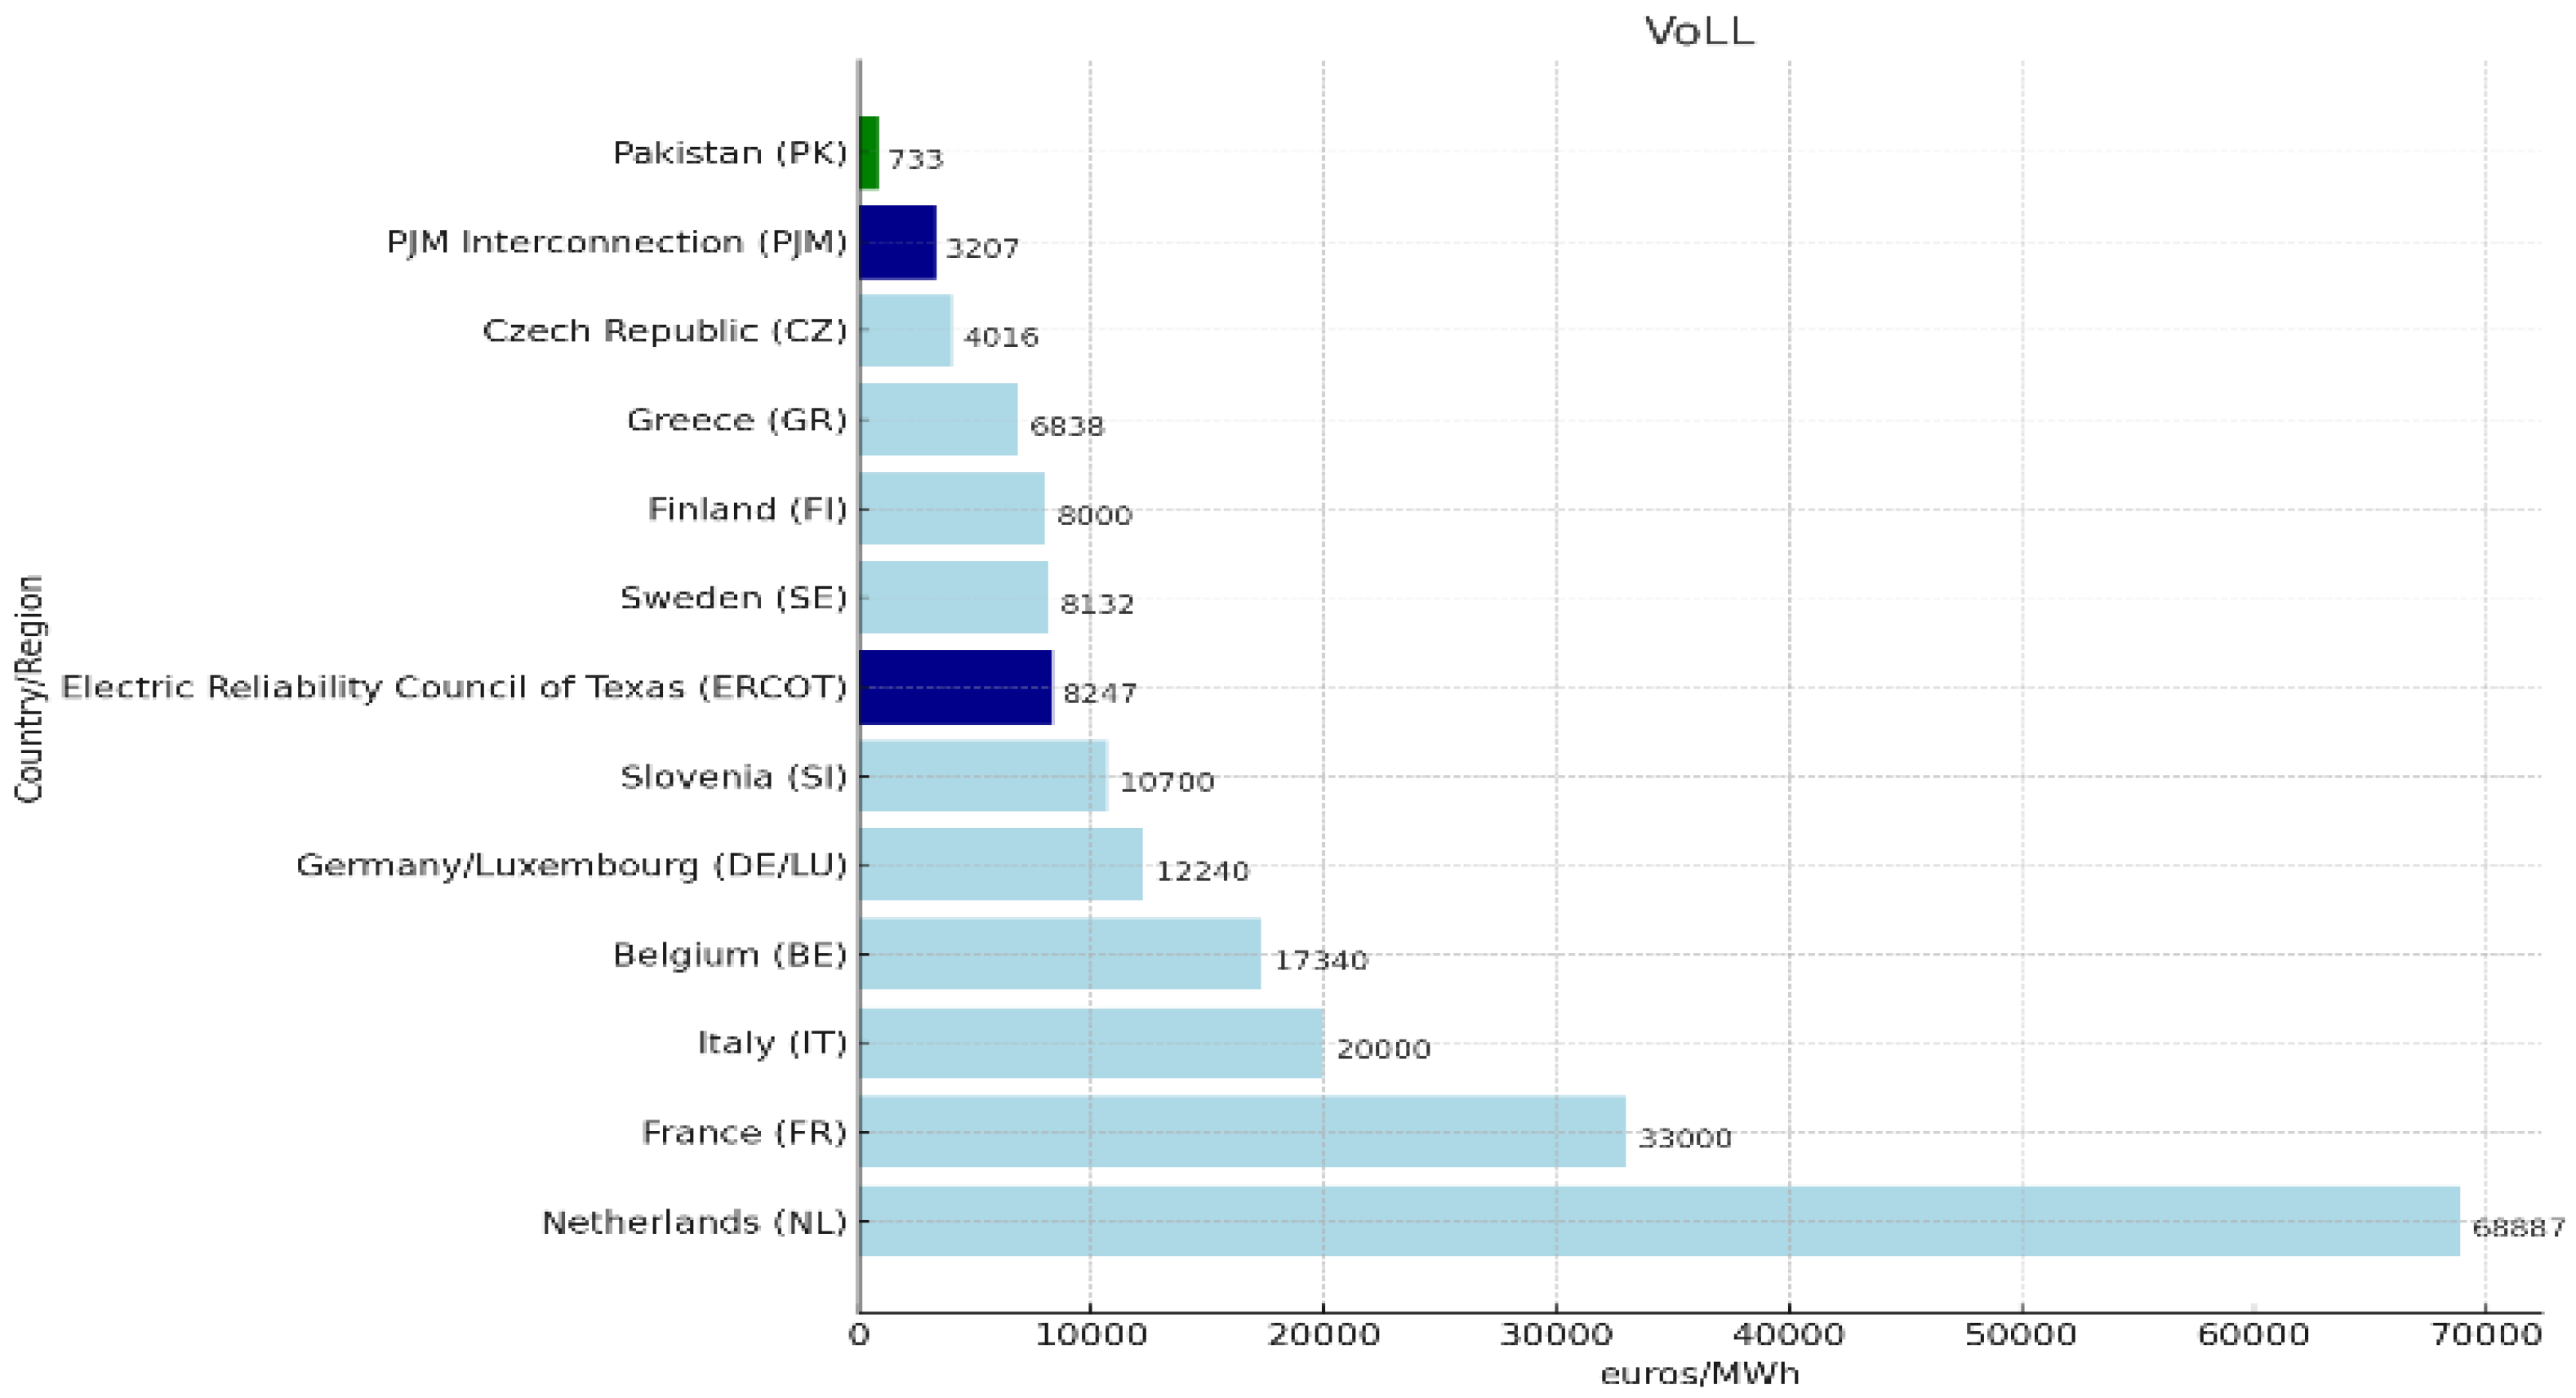
Figure 2.
CONEfixed and technology defining the reliability standard in certain EU Countries [29].
Figure 2.
CONEfixed and technology defining the reliability standard in certain EU Countries [29].
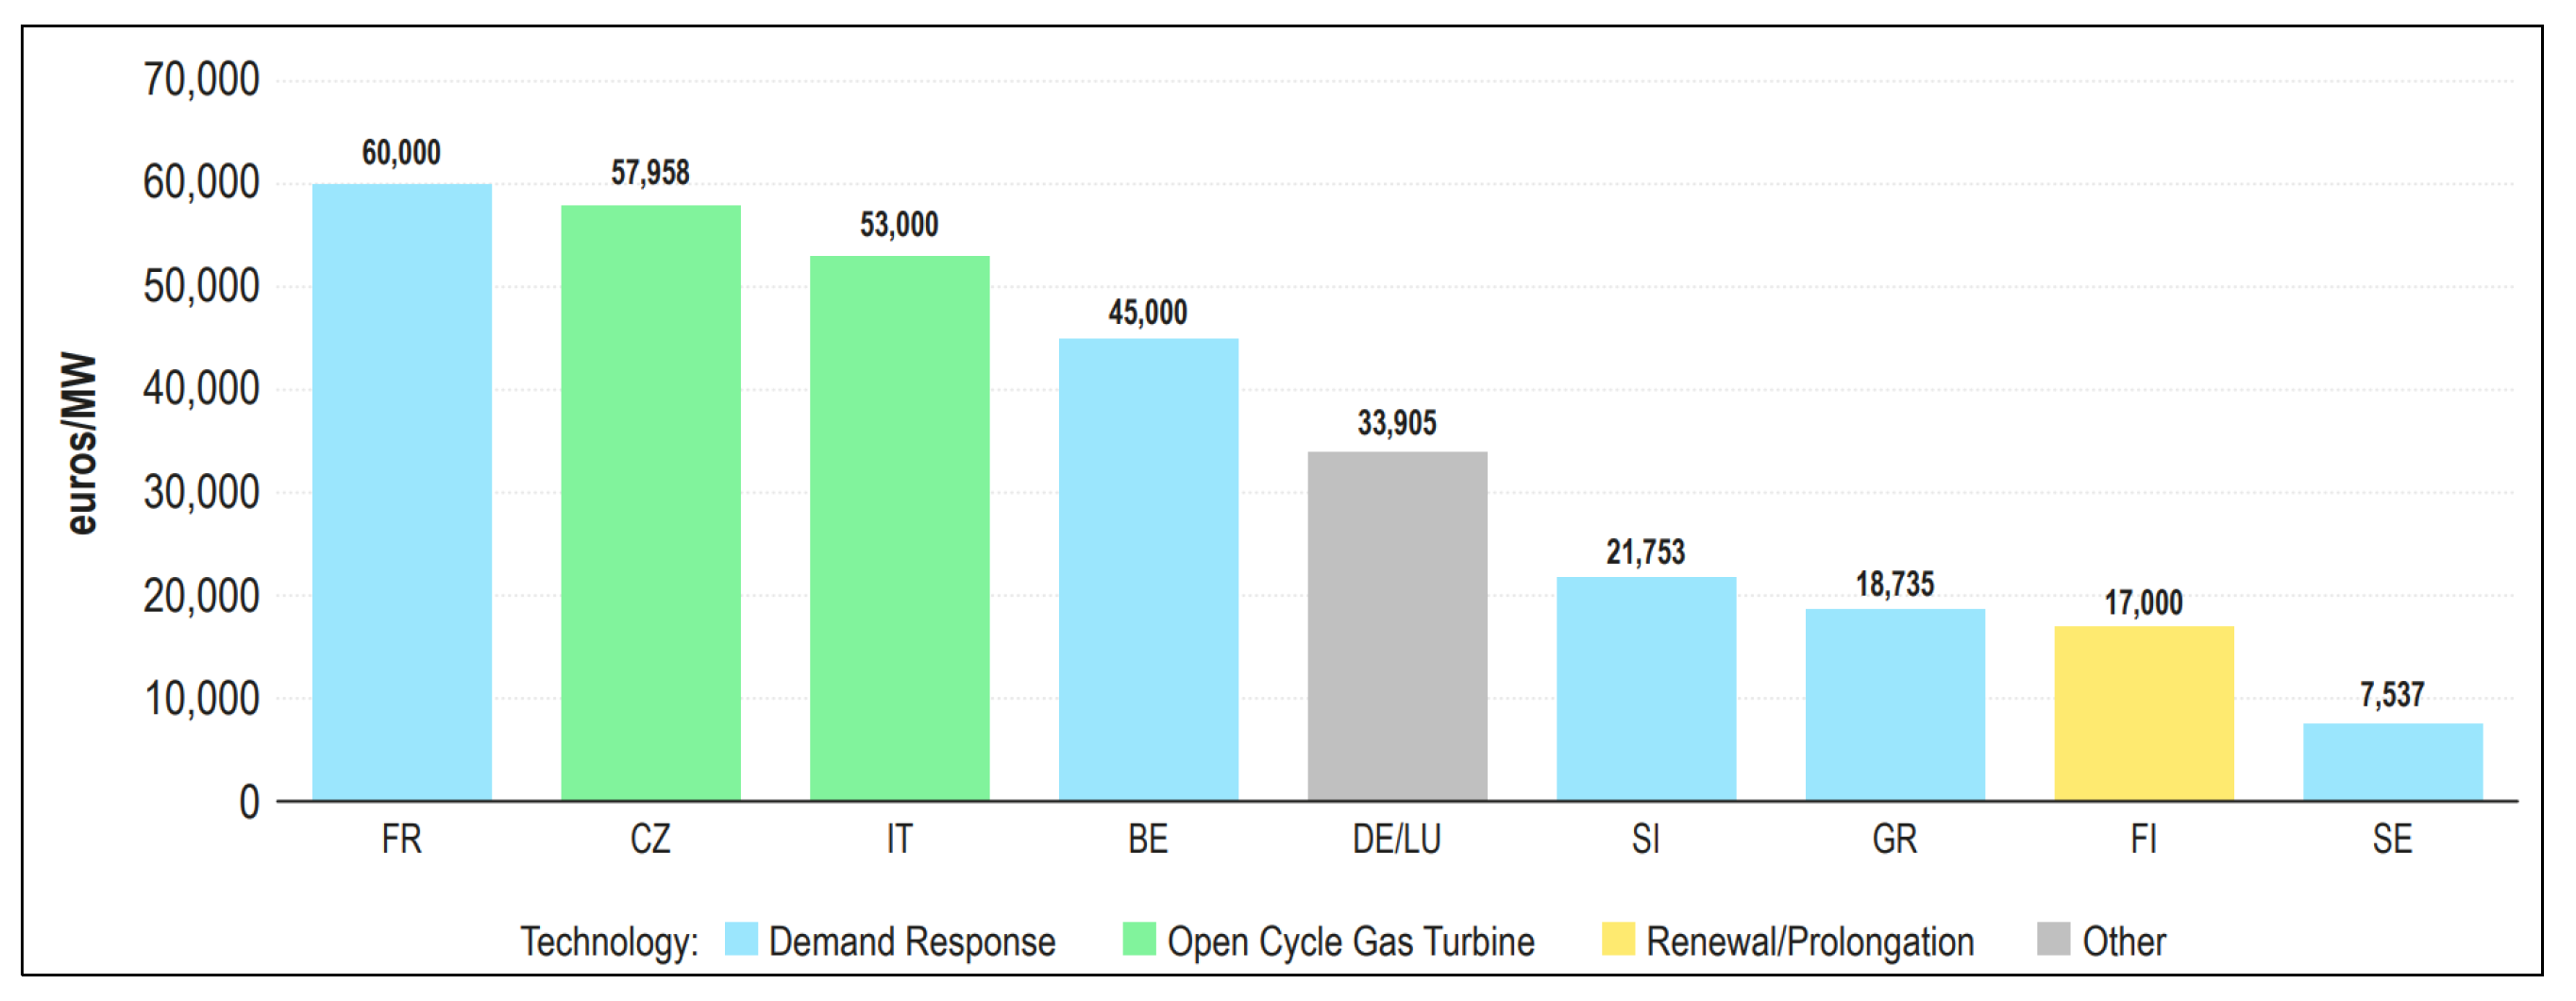
Figure 3.
Reliability standard as LOLE [29].
Figure 3.
Reliability standard as LOLE [29].
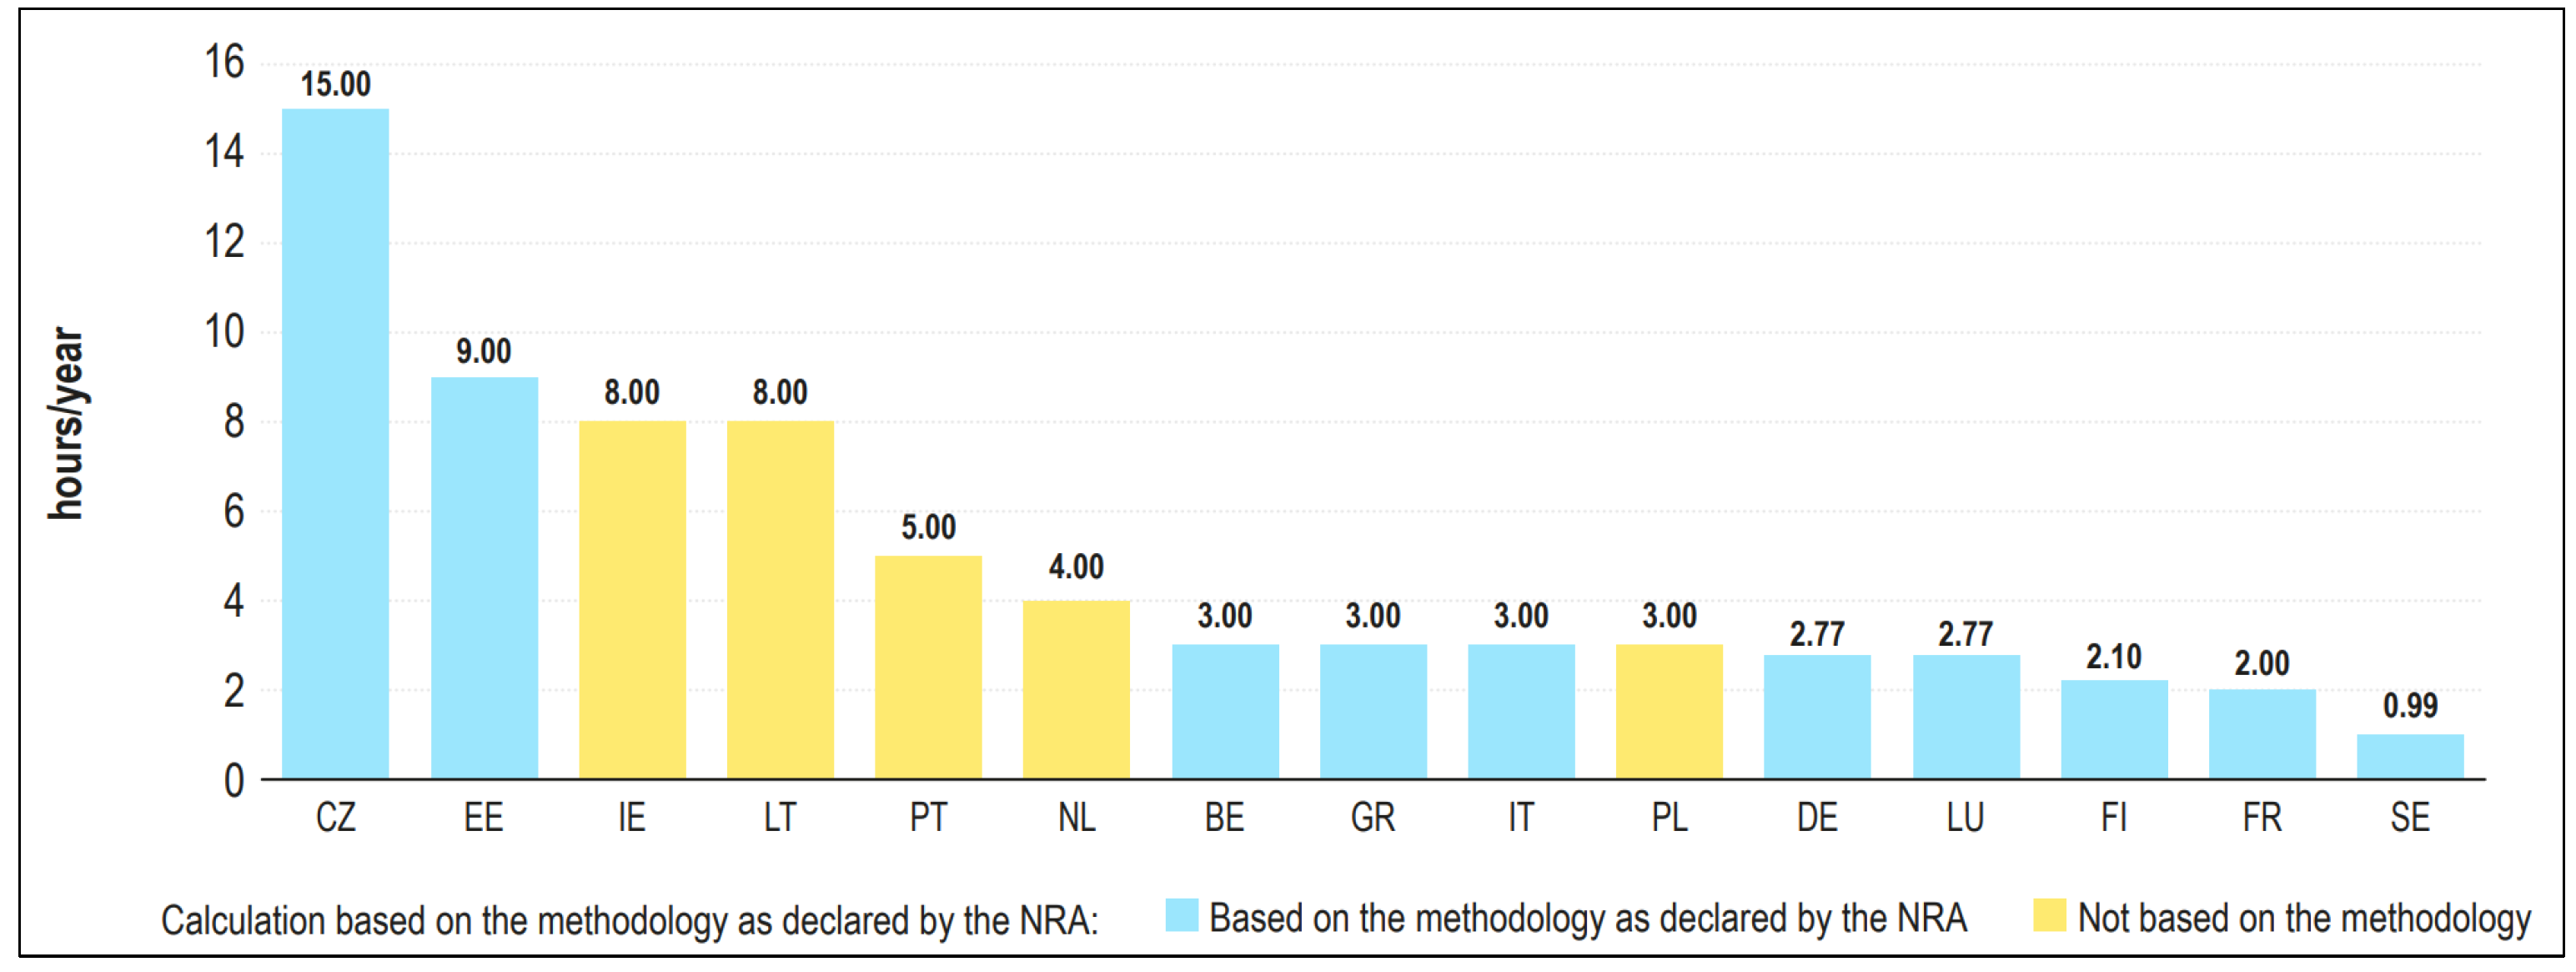
Figure 4.
Optimum reserve margin vs. cost to provide reliable supply [34].
Figure 4.
Optimum reserve margin vs. cost to provide reliable supply [34].
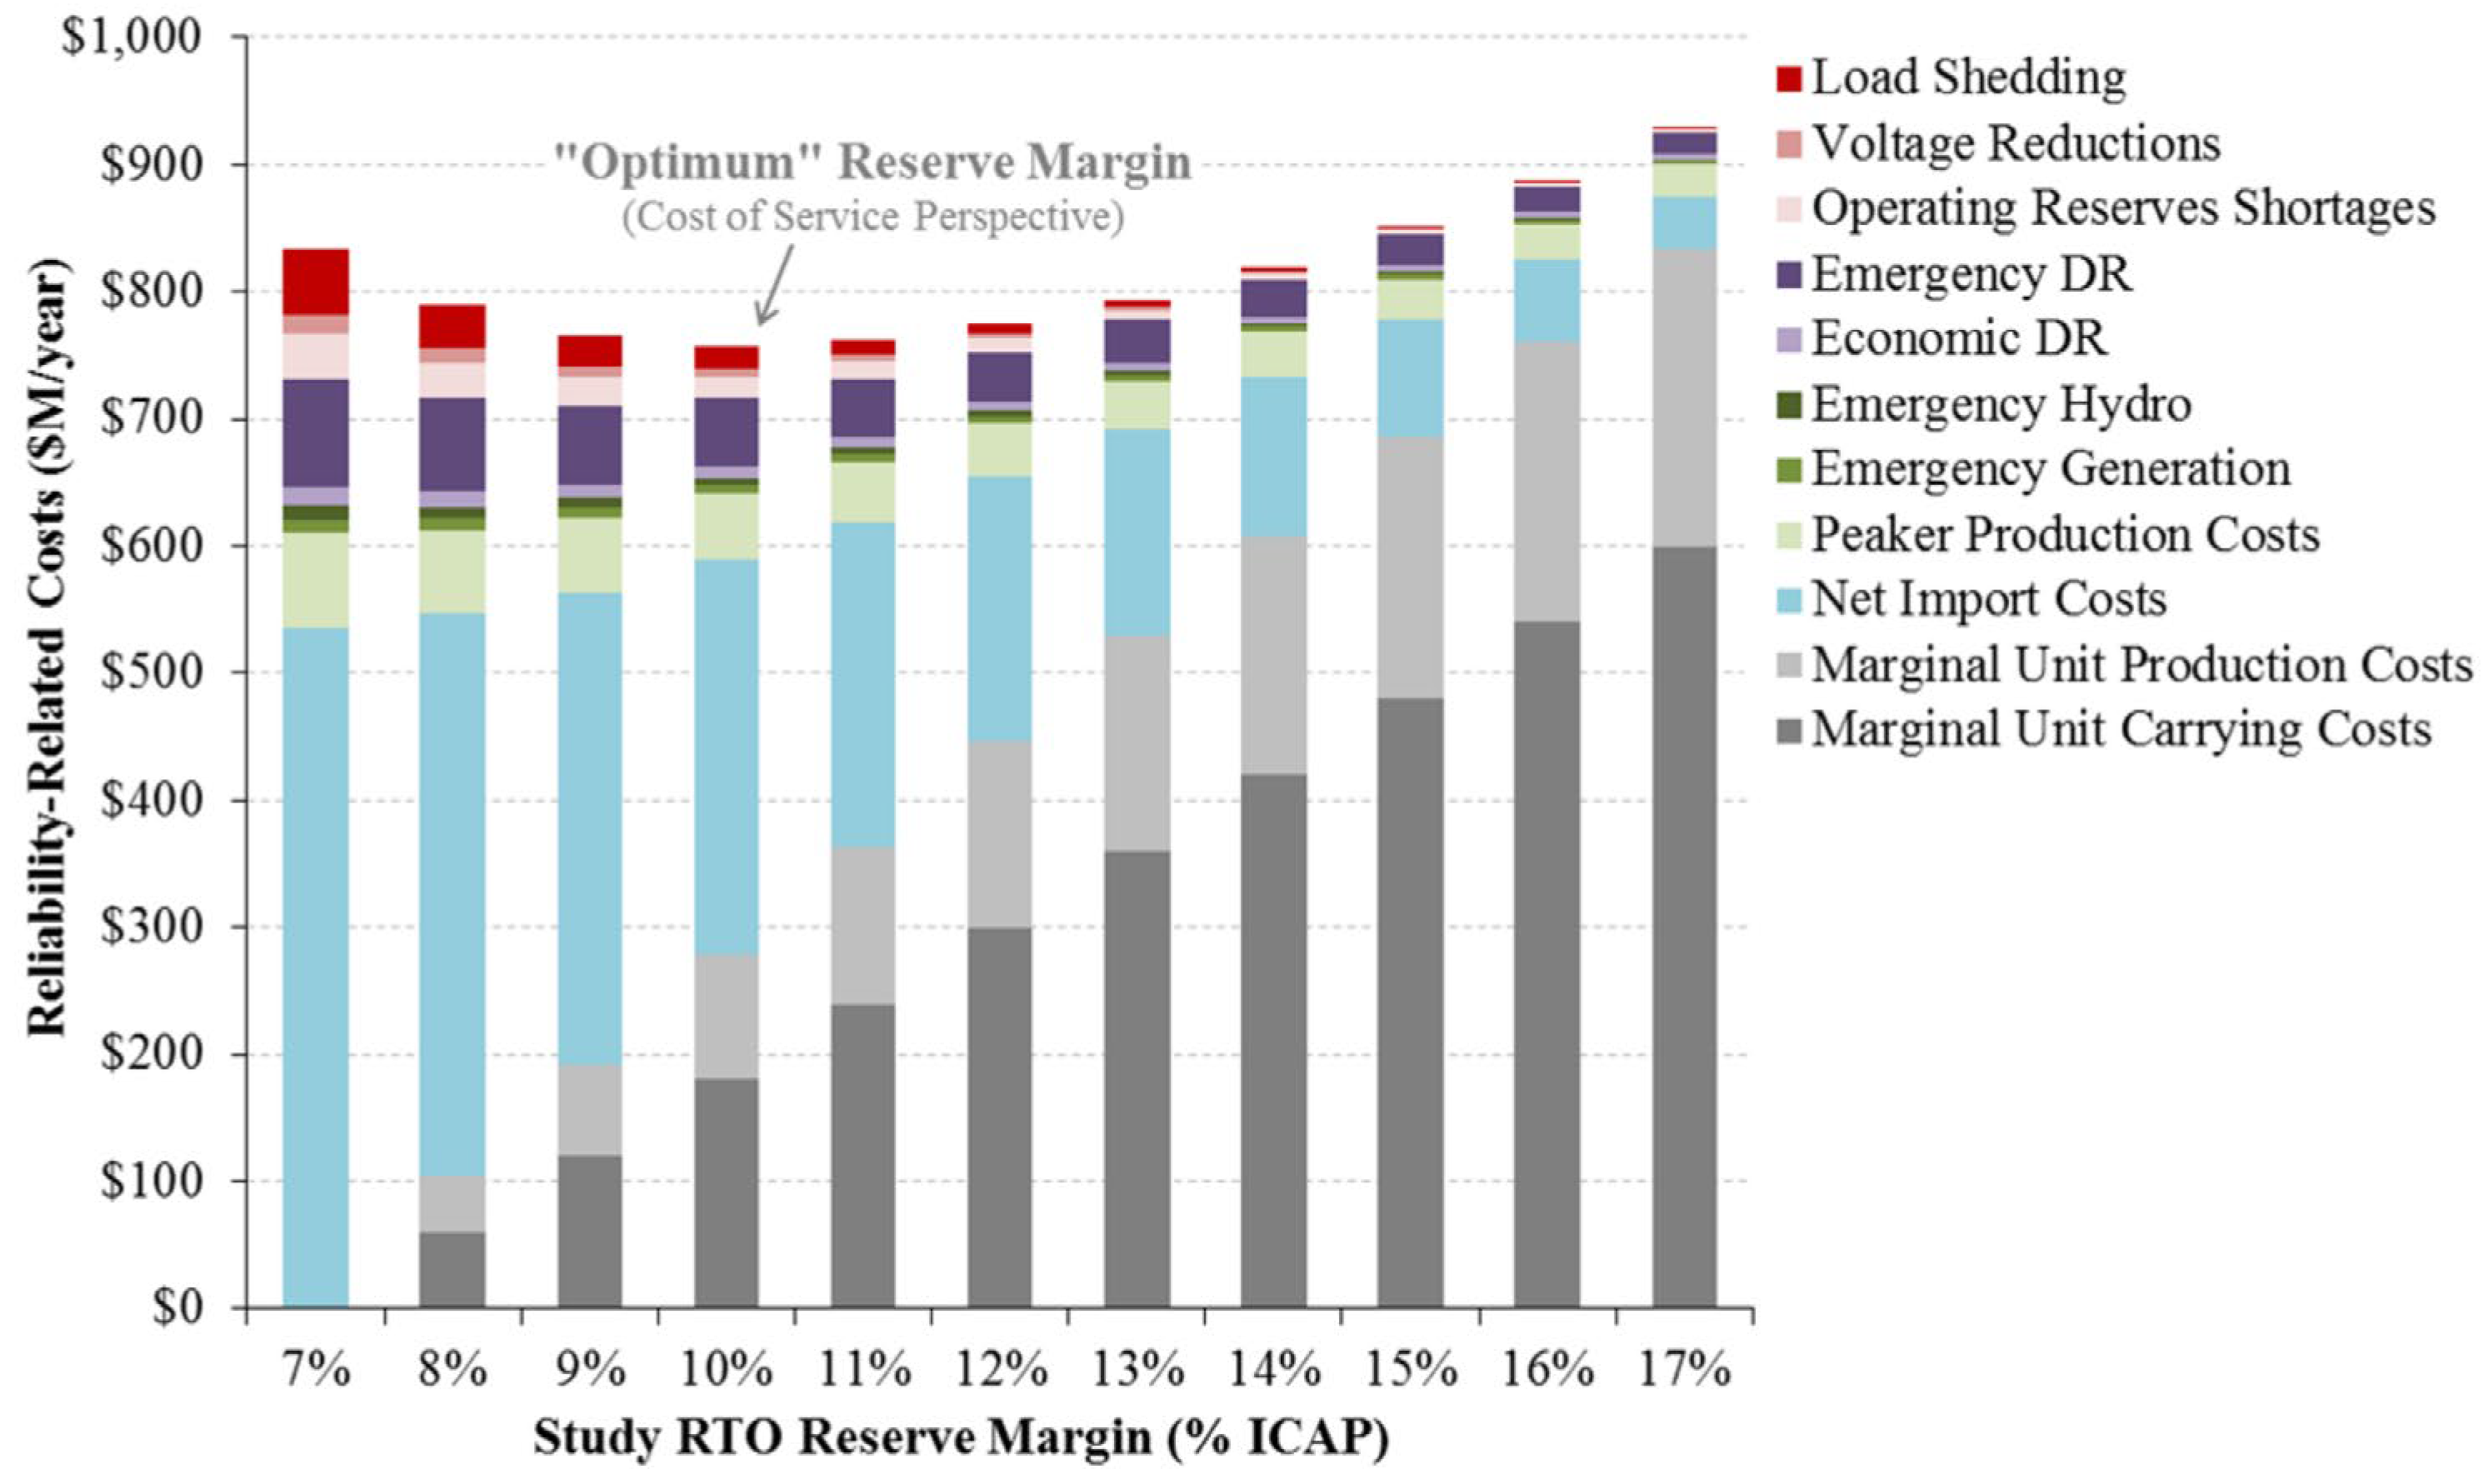
Figure 5.
US ISOs/RTOs Demand Curves [38].
Figure 5.
US ISOs/RTOs Demand Curves [38].
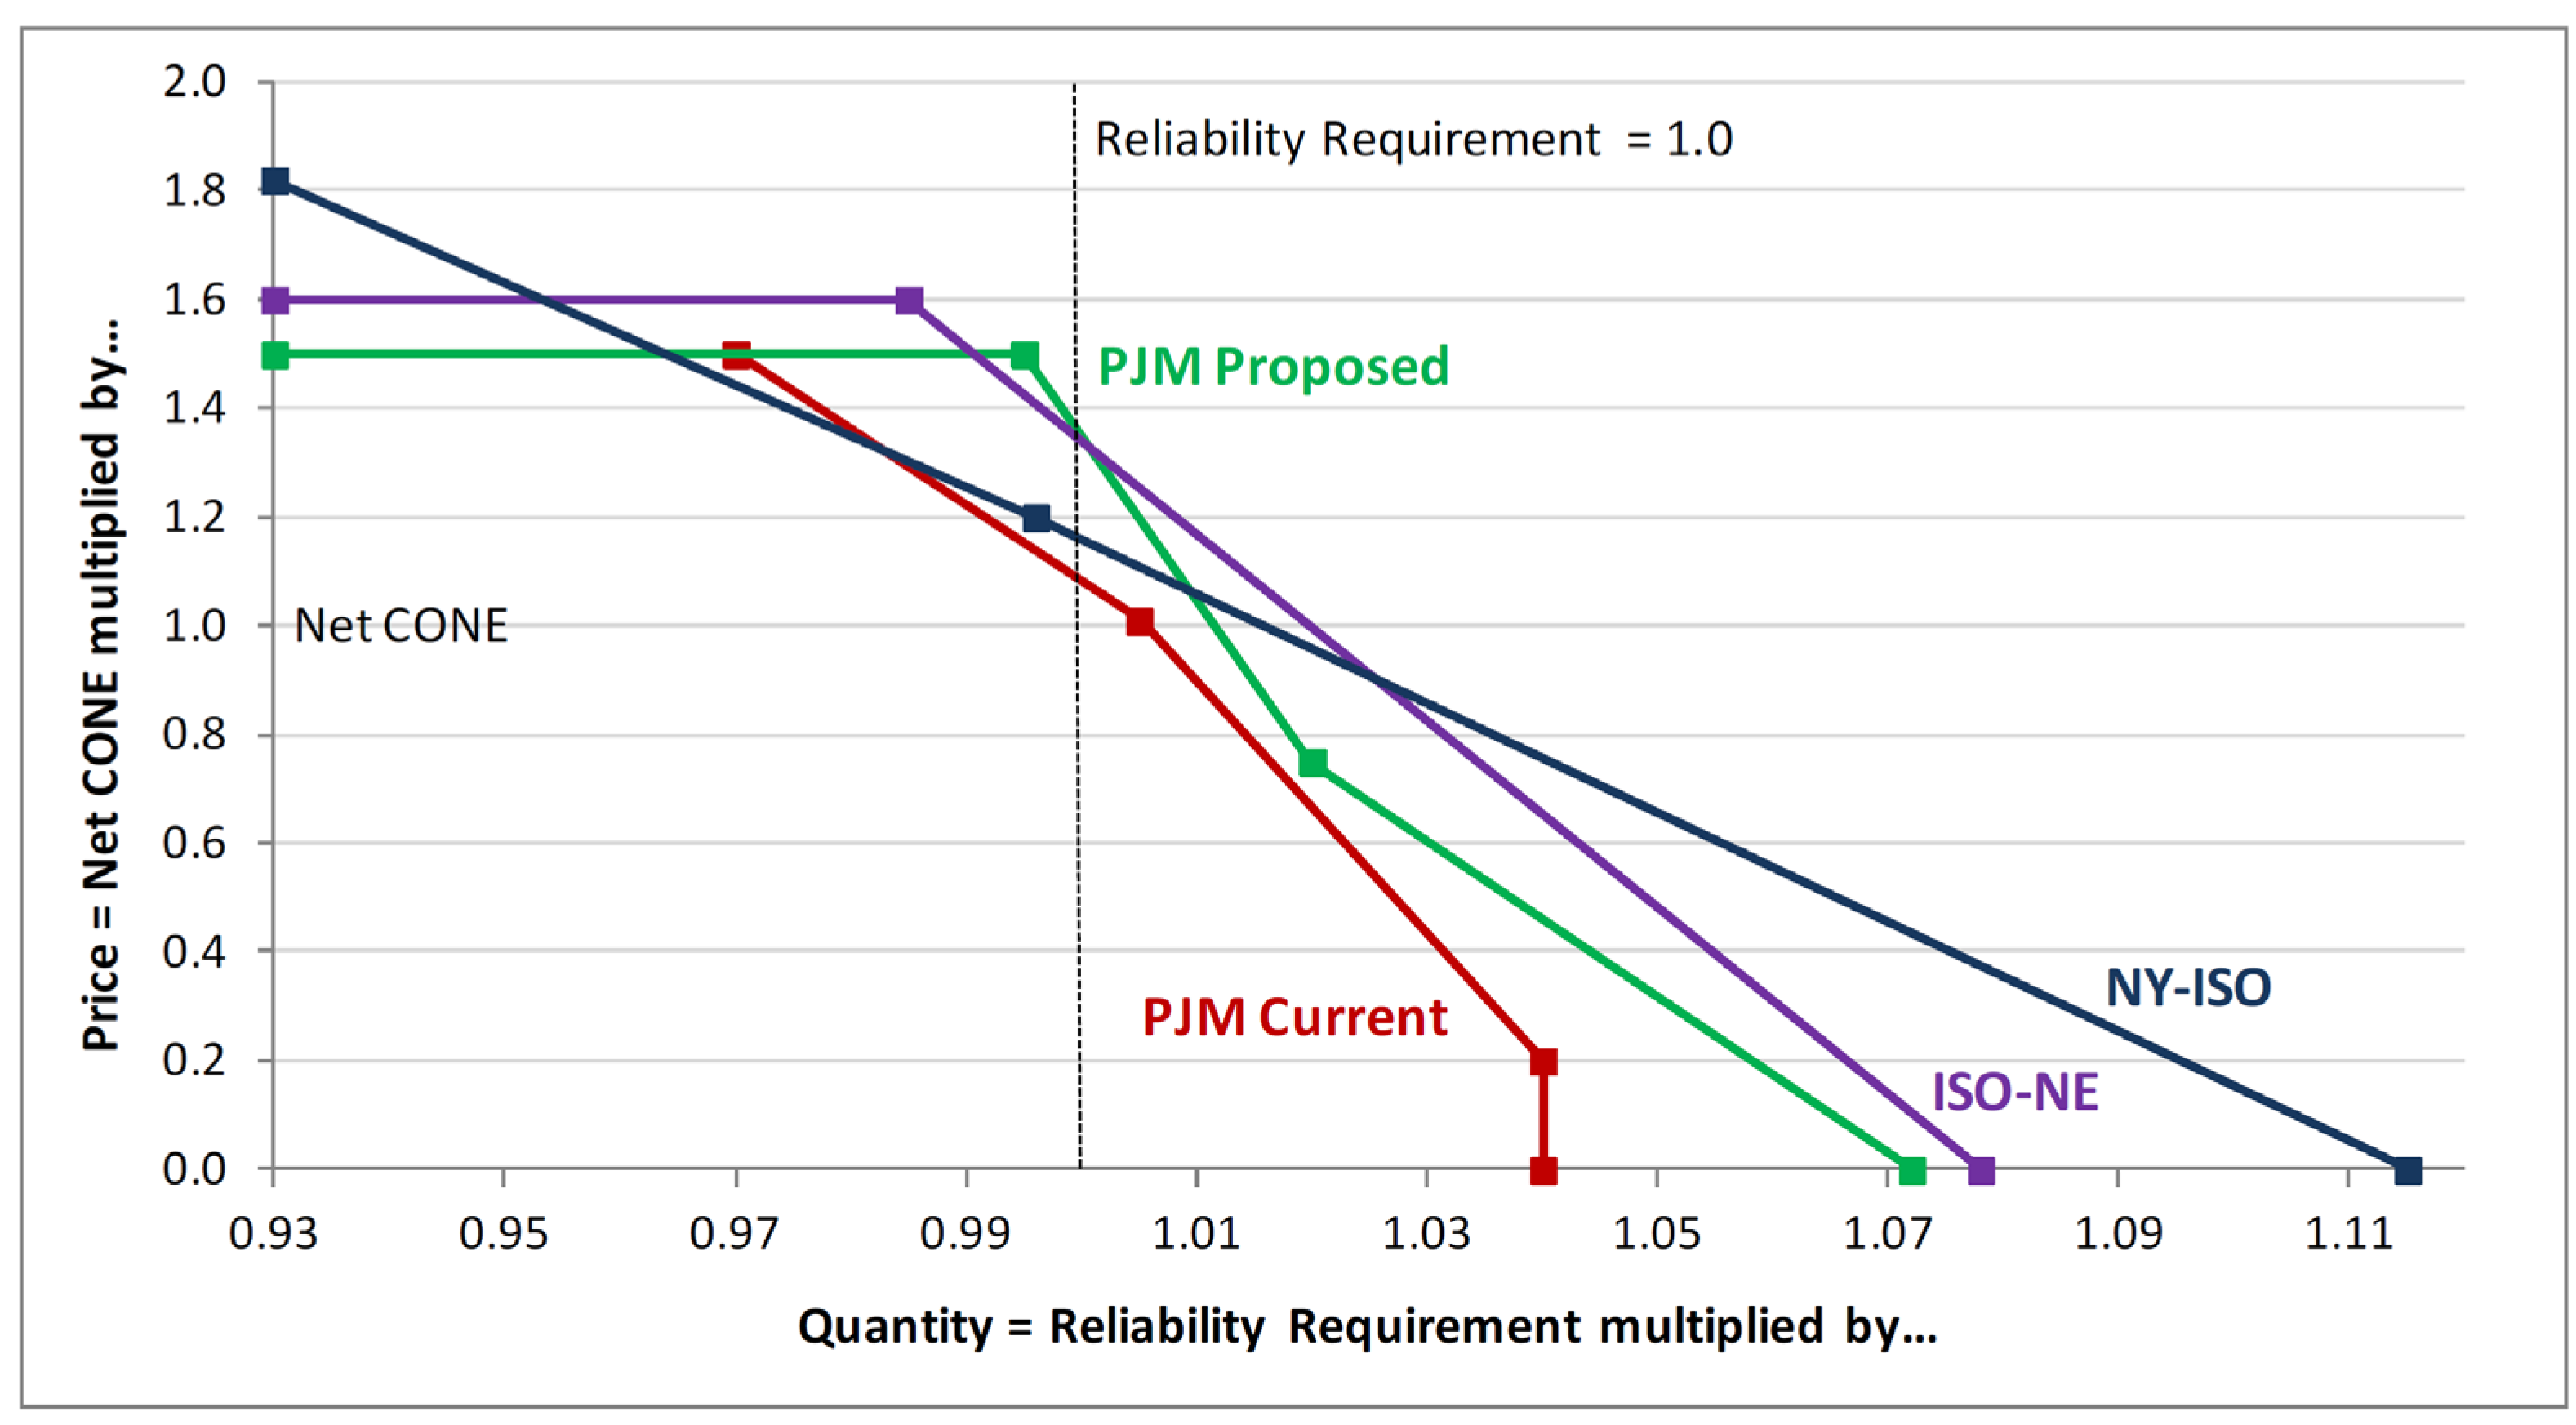
Figure 6.
Historical trend of capacity and energy payments in Pakistan as well as total cost of capacity mechanisms in the EU.
Figure 6.
Historical trend of capacity and energy payments in Pakistan as well as total cost of capacity mechanisms in the EU.
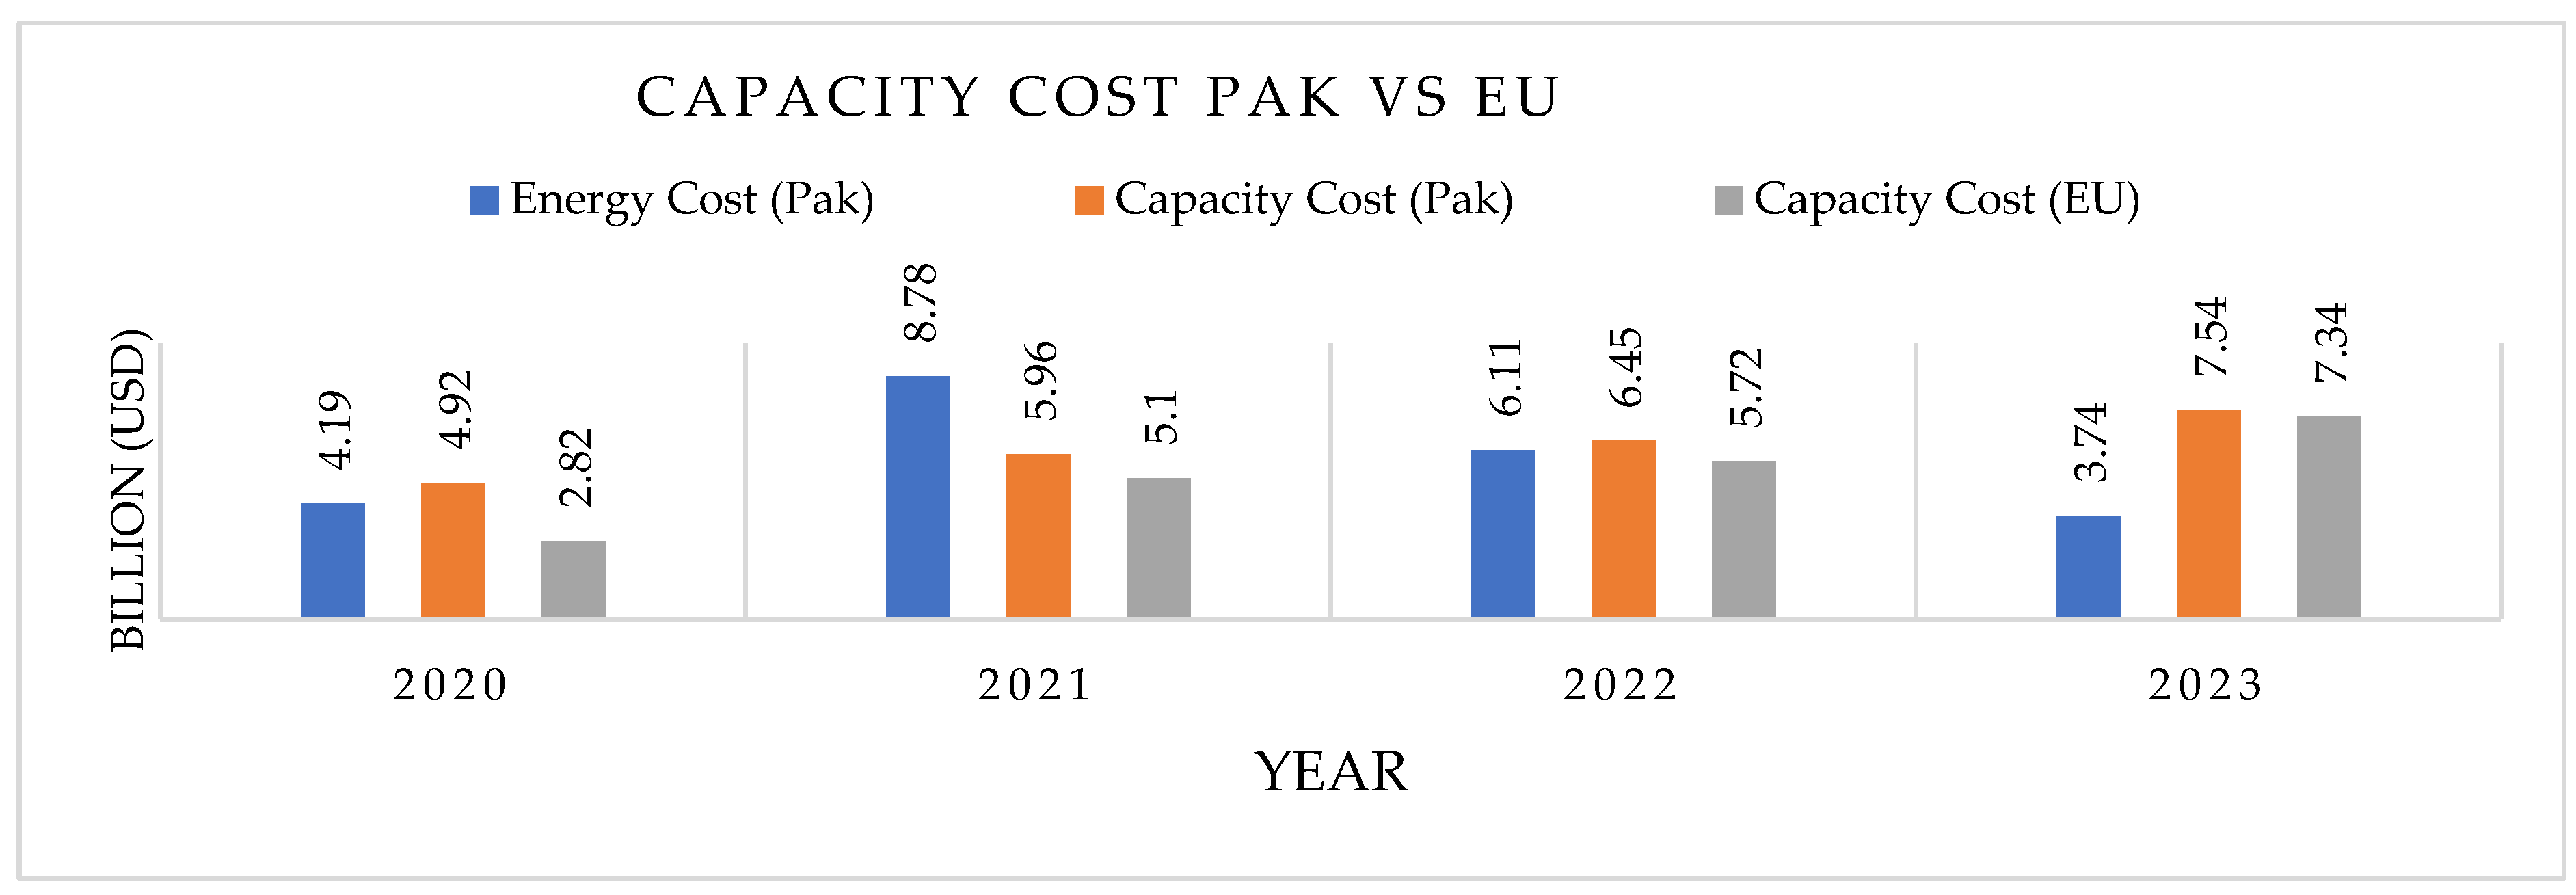
Figure 7.
Suppliers of Last Resort Pre-CTBCM Capacity Allocation Factors.
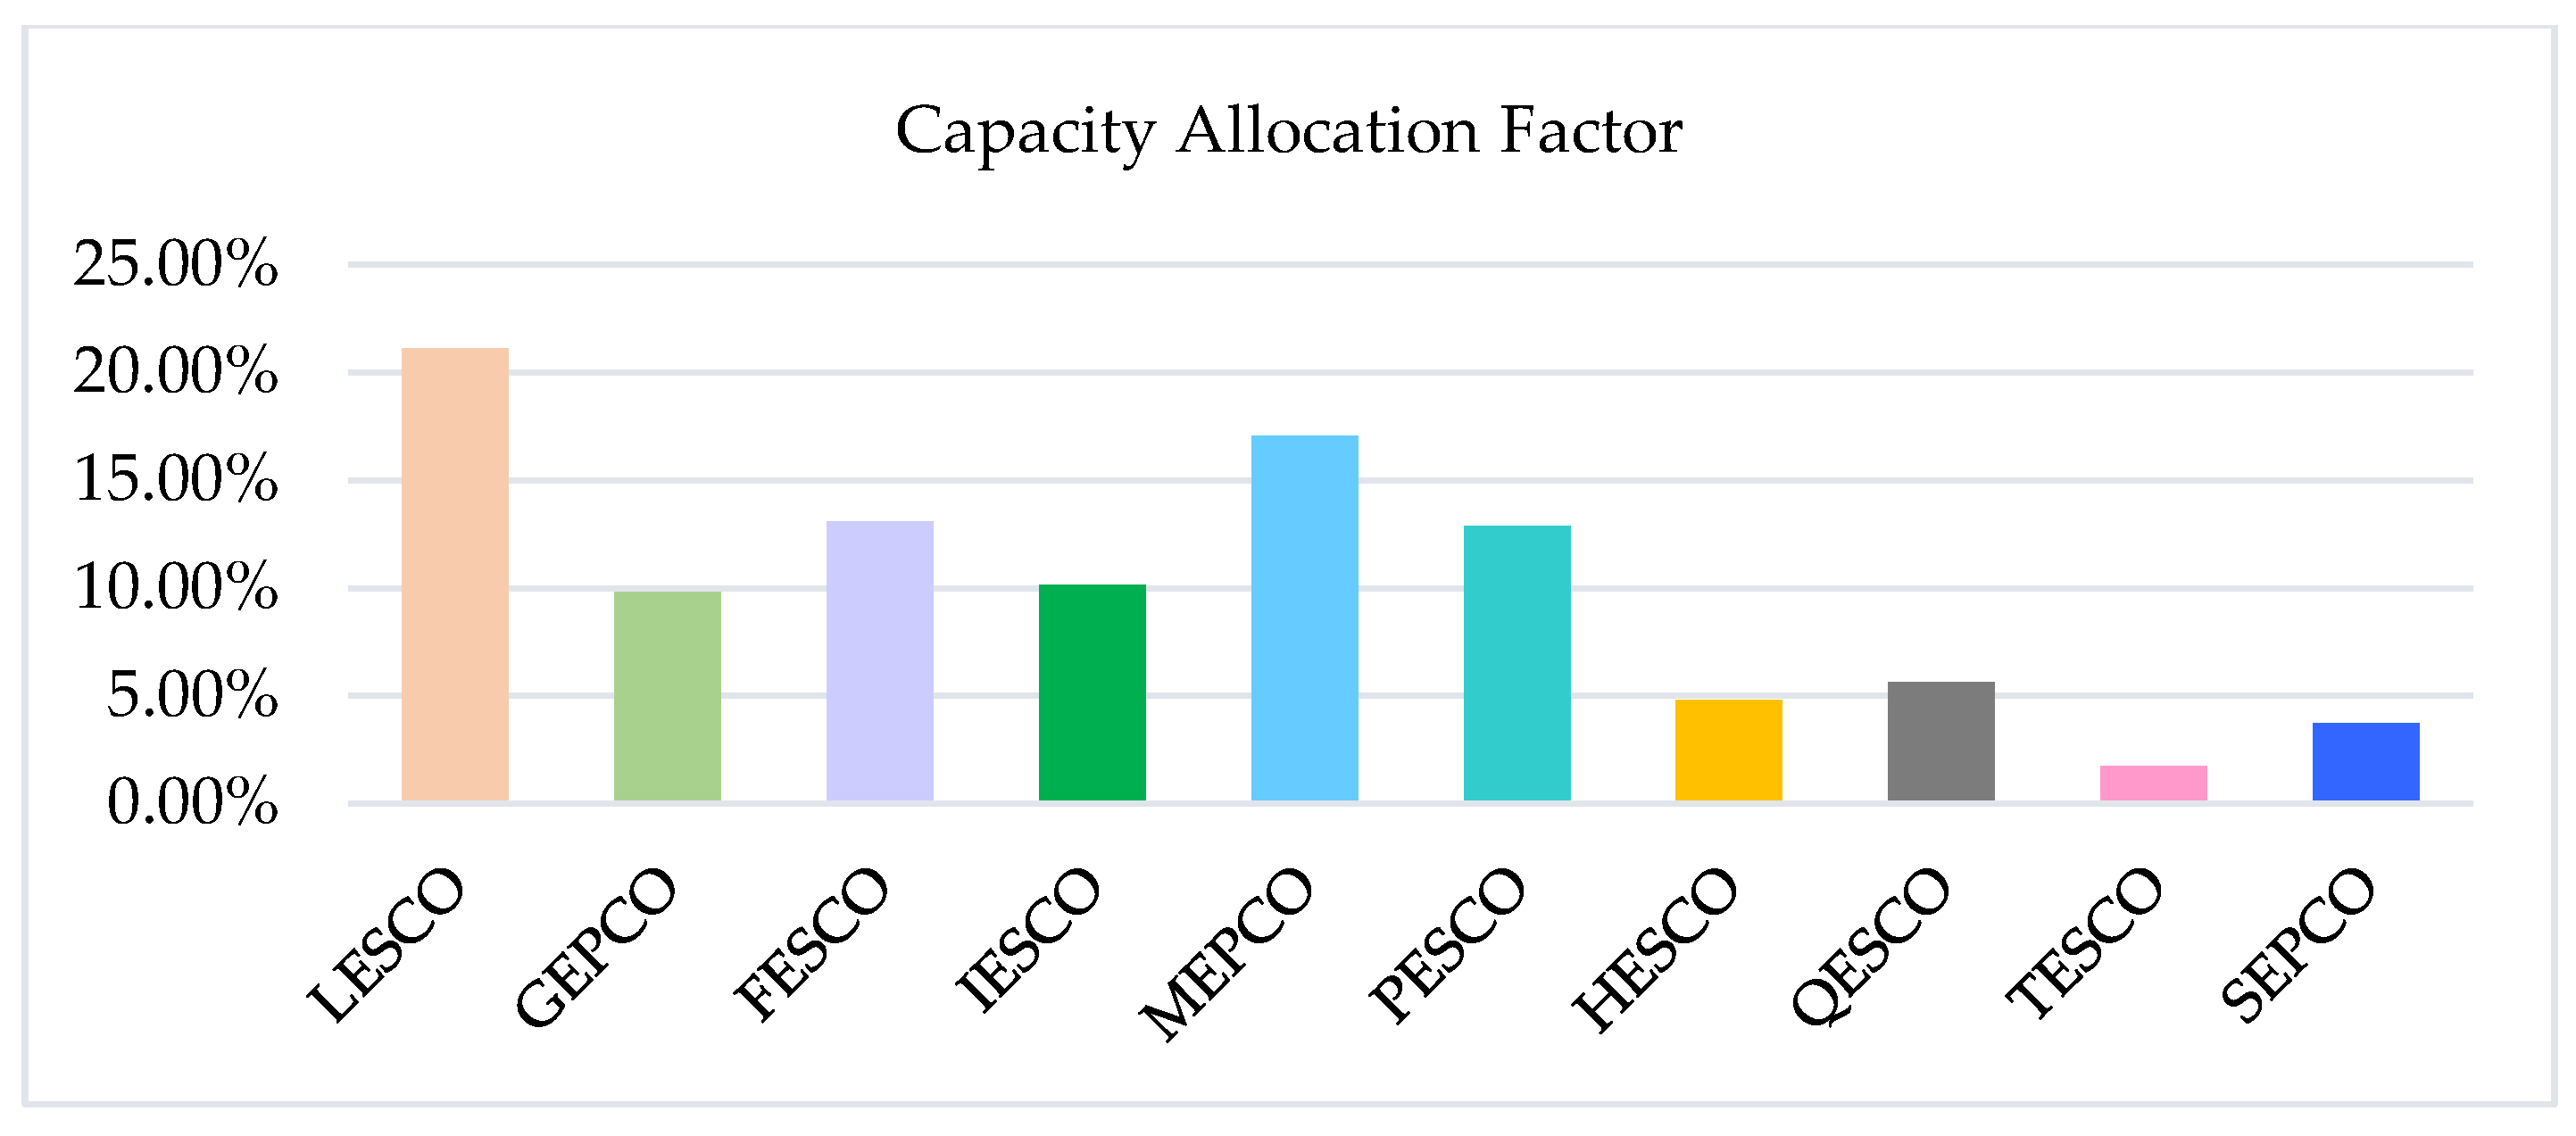
Figure 8.
Demand and supply curve in the Balancing Mechanism for capacity.
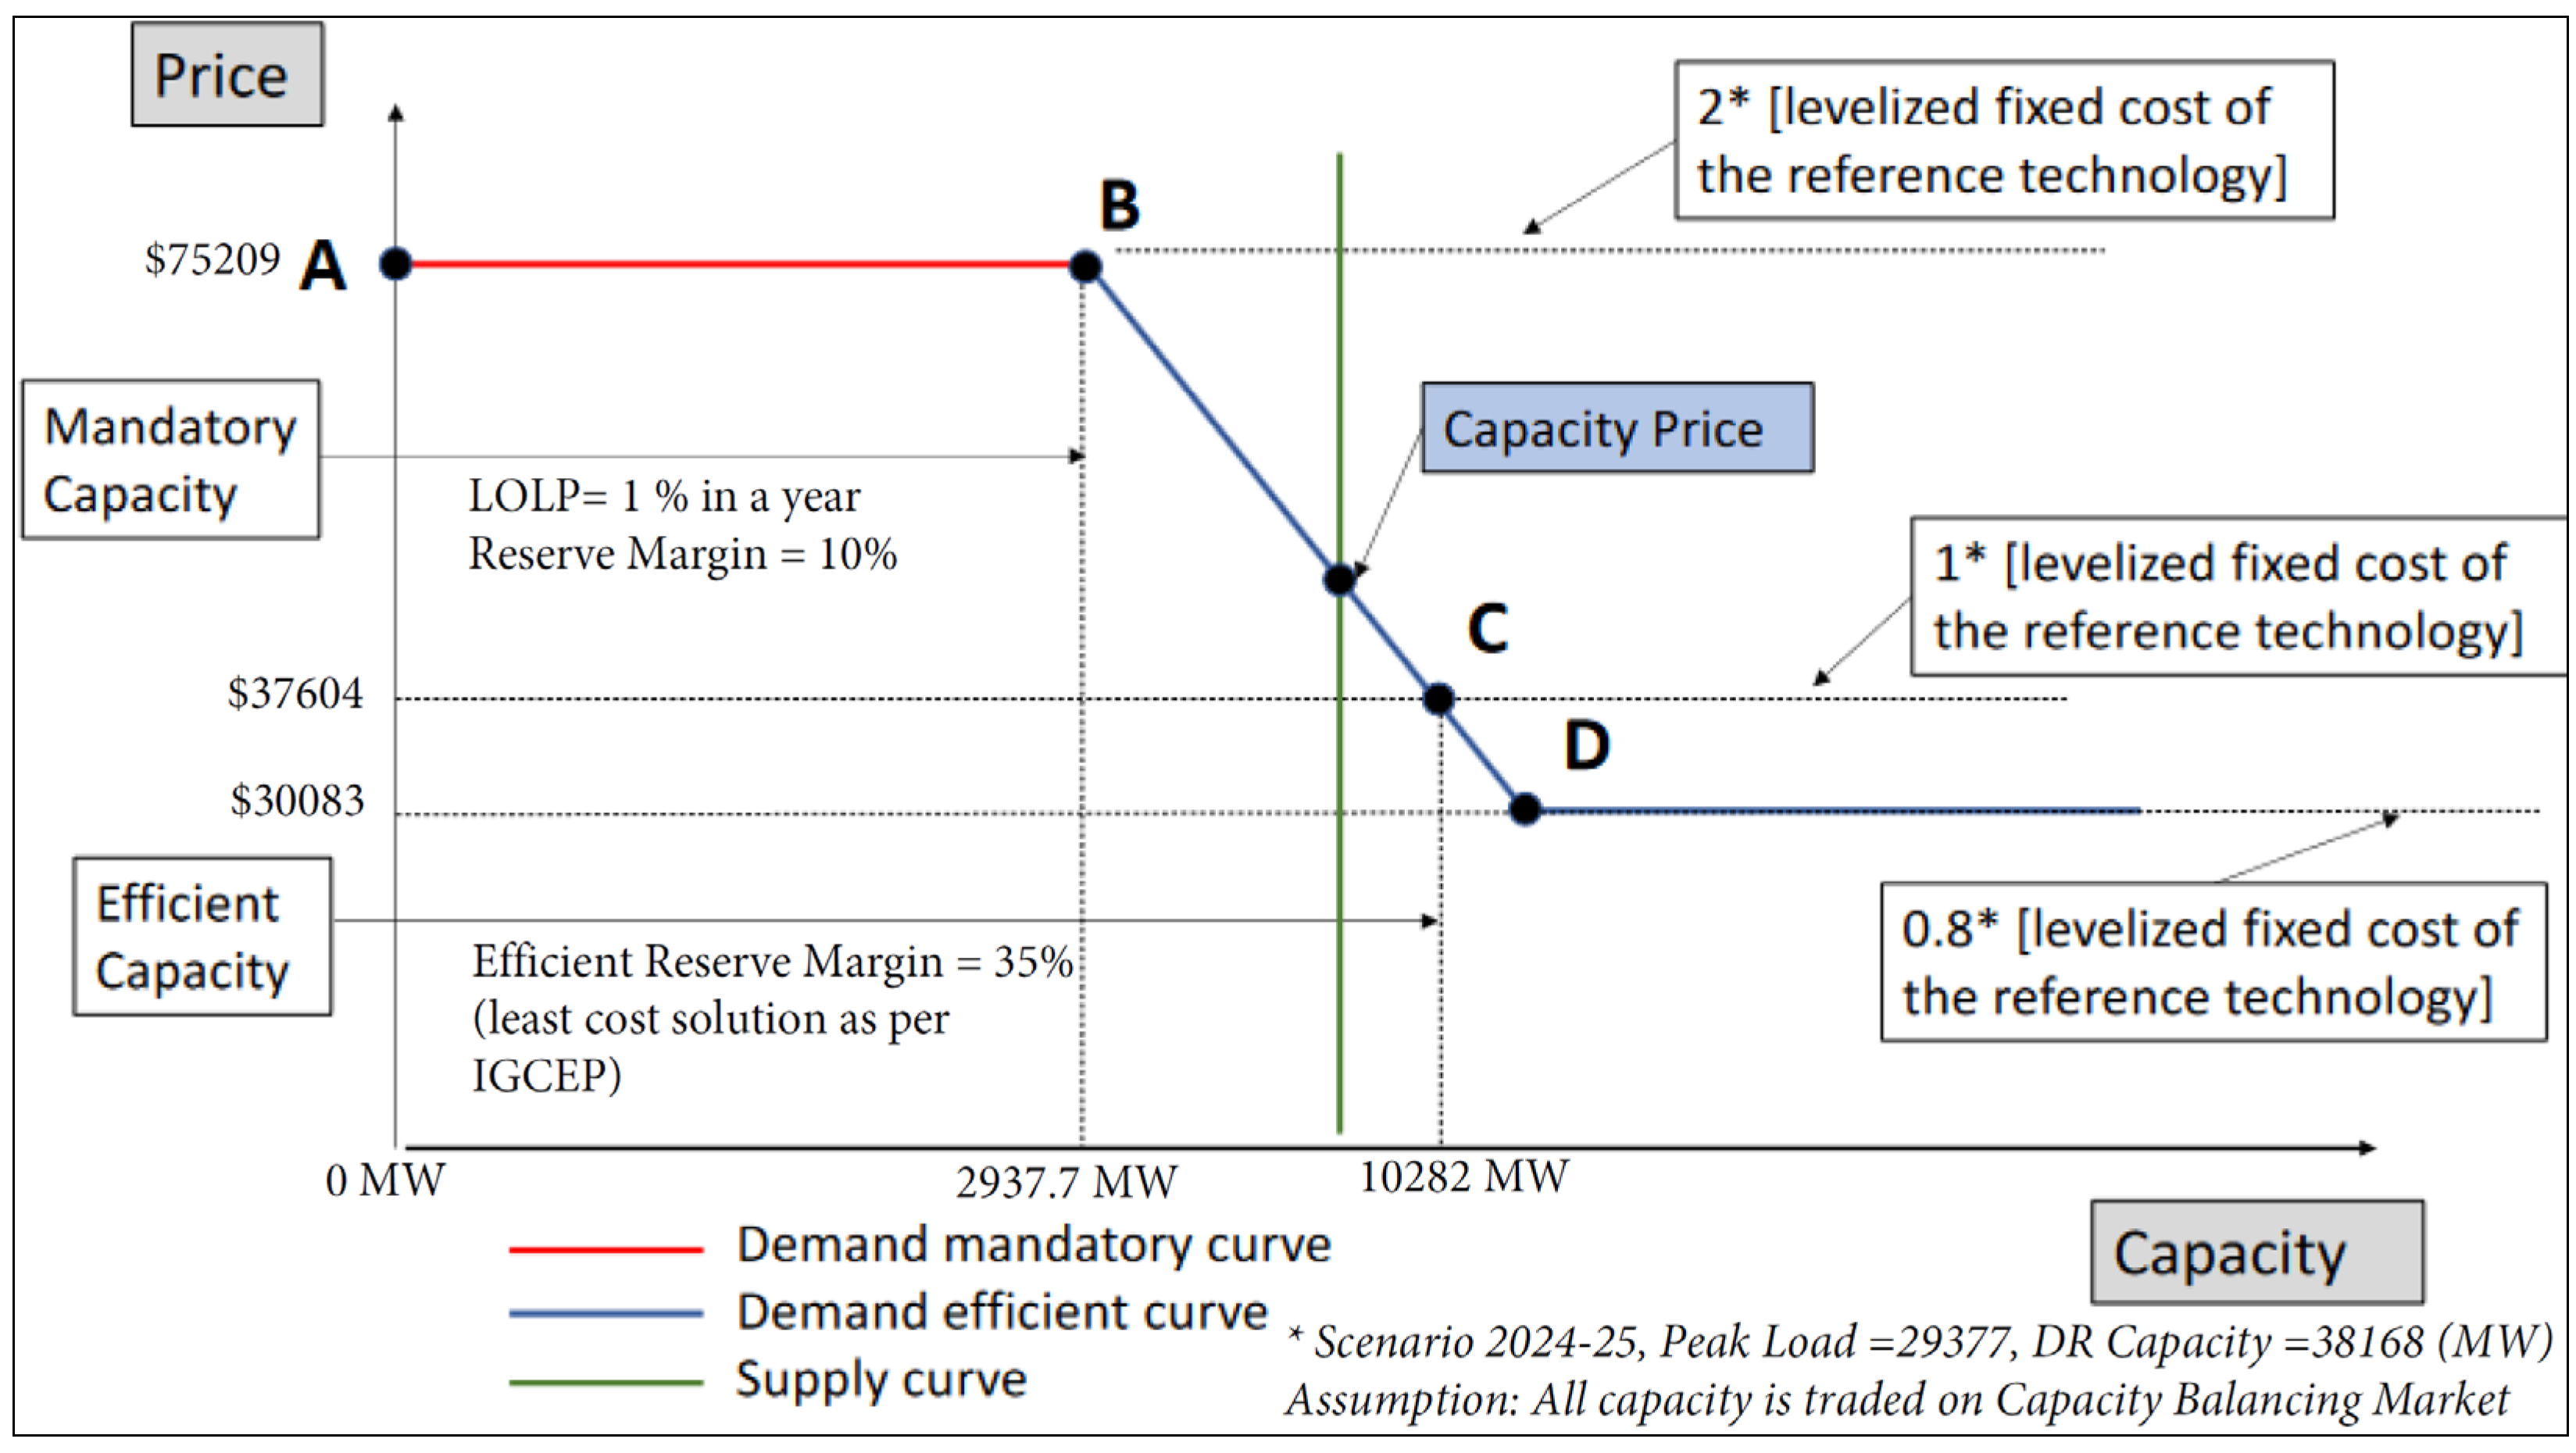
Figure 9.
Renewable generation trends in US.
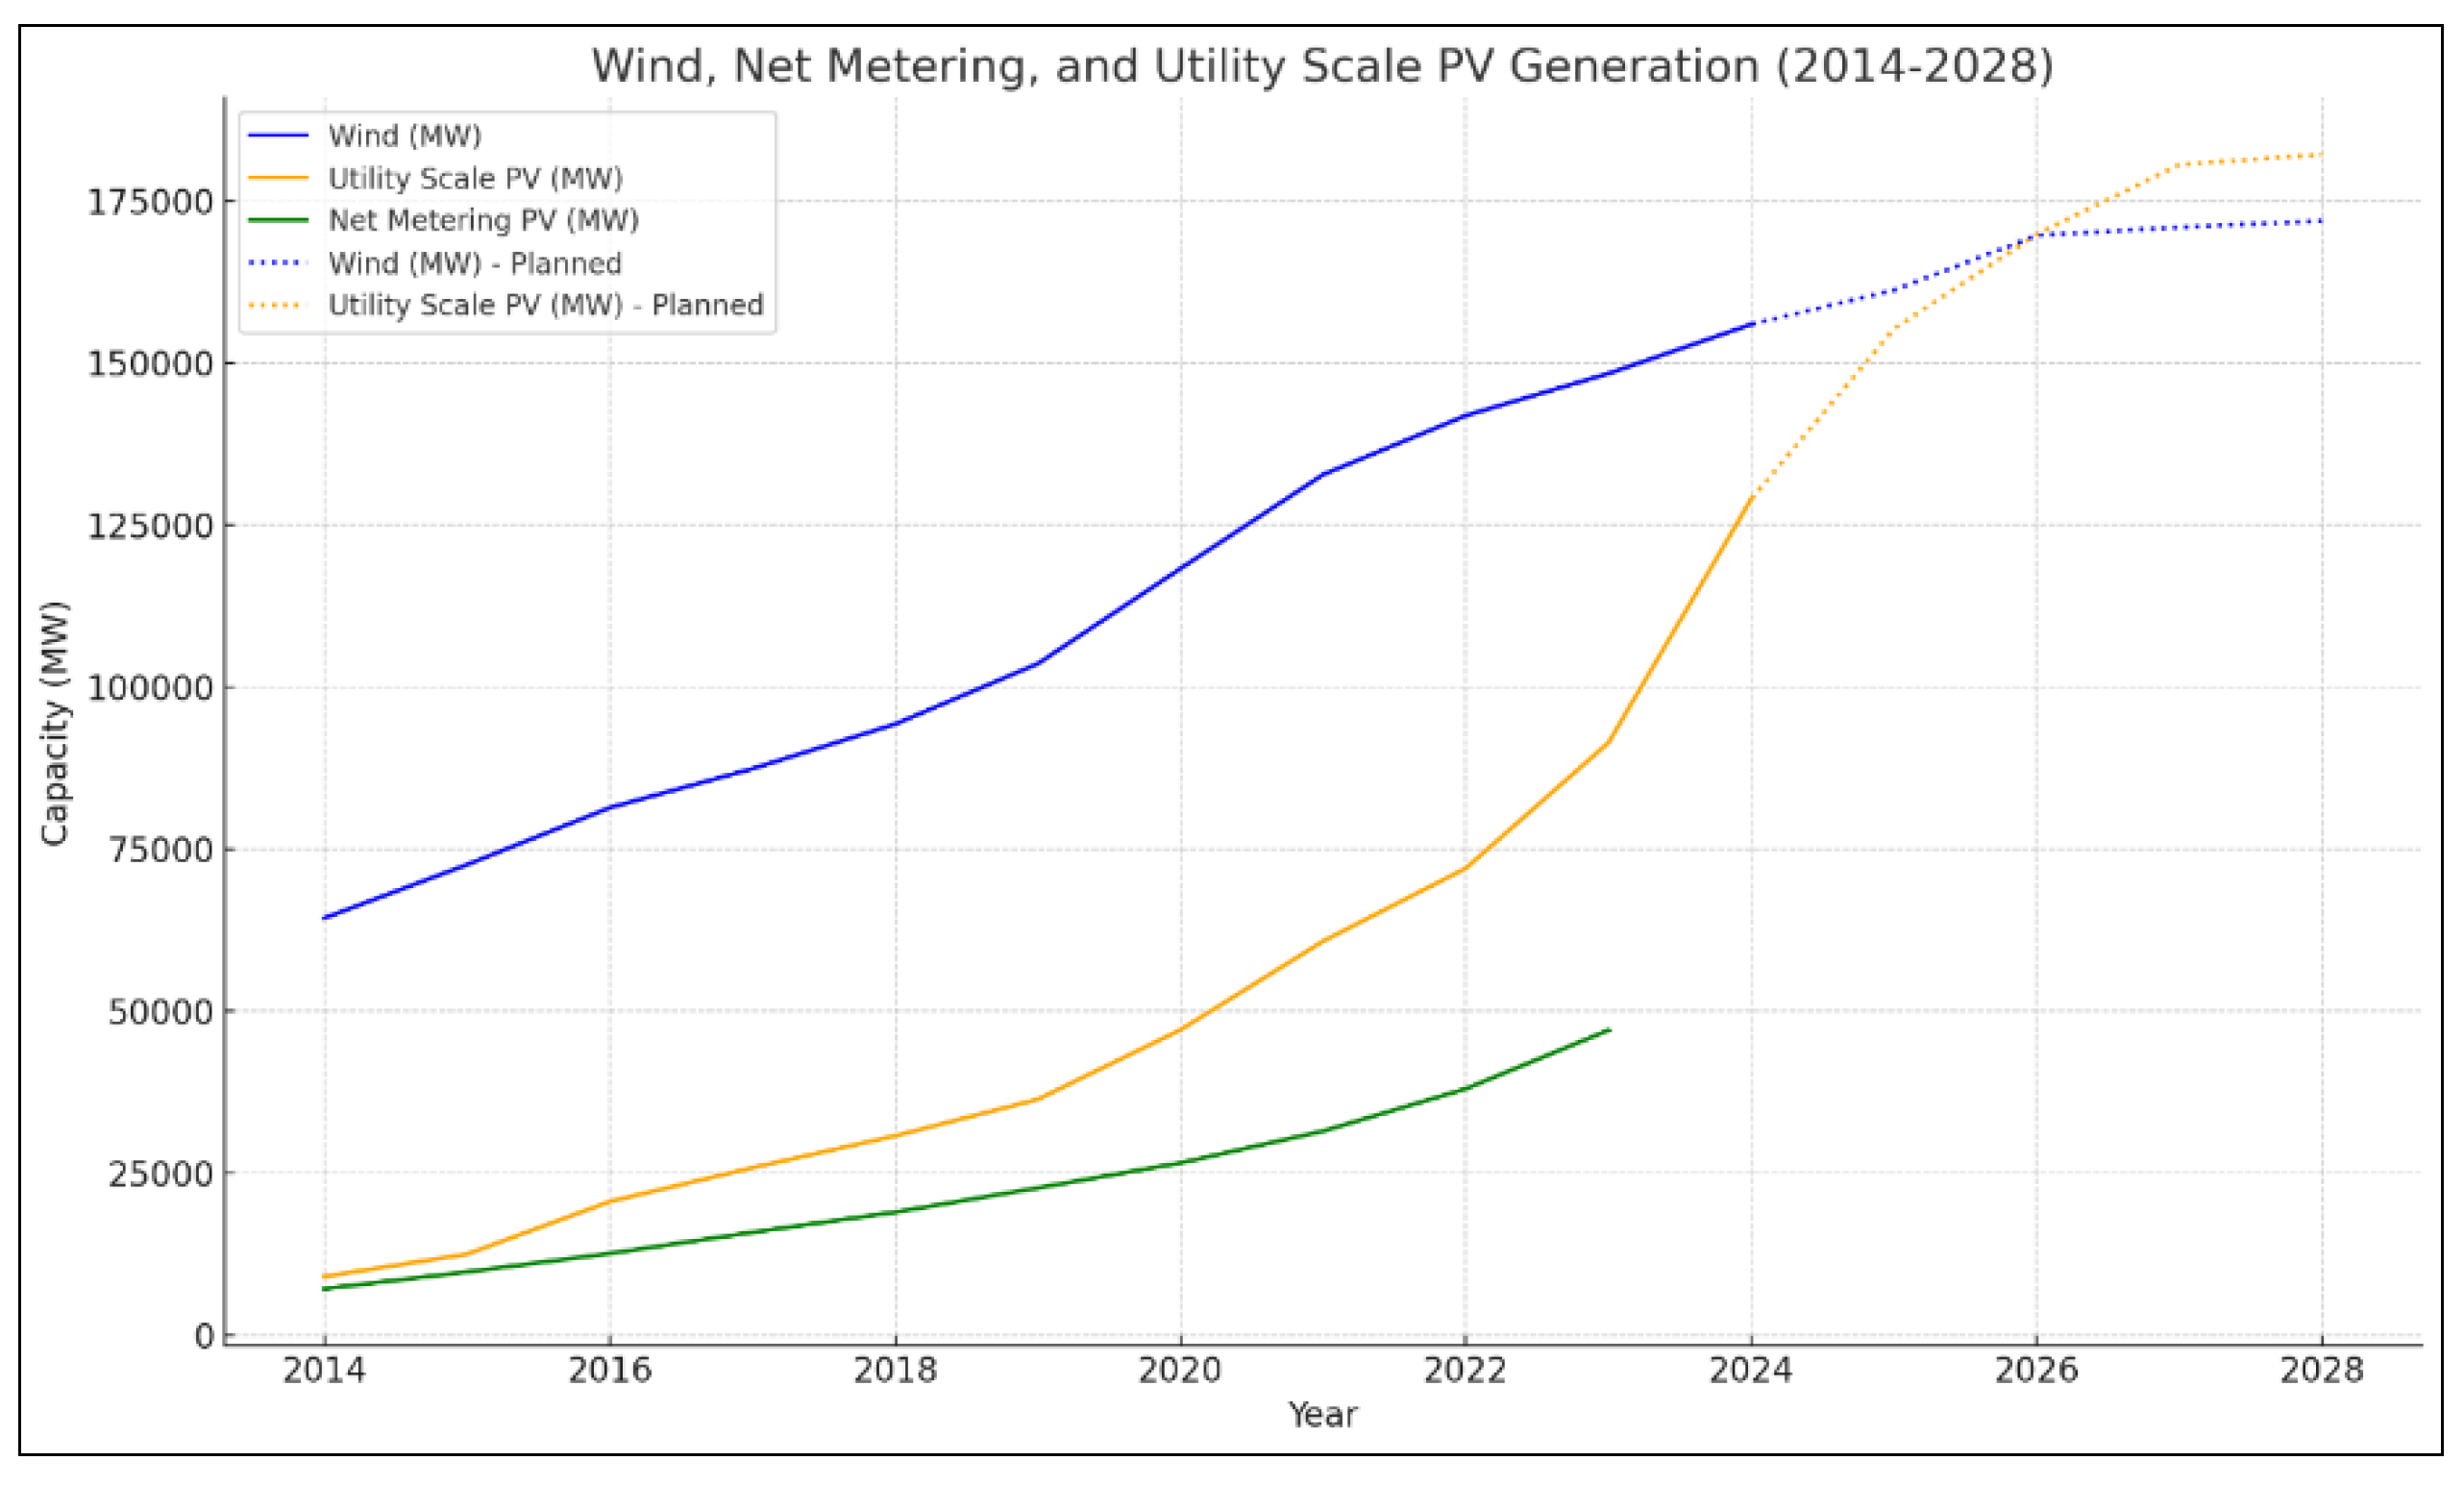
Figure 10.
Nameplate Capacity Net Additions and Retirements from 2013 to 2023 by Resource Type [64].
Figure 10.
Nameplate Capacity Net Additions and Retirements from 2013 to 2023 by Resource Type [64].
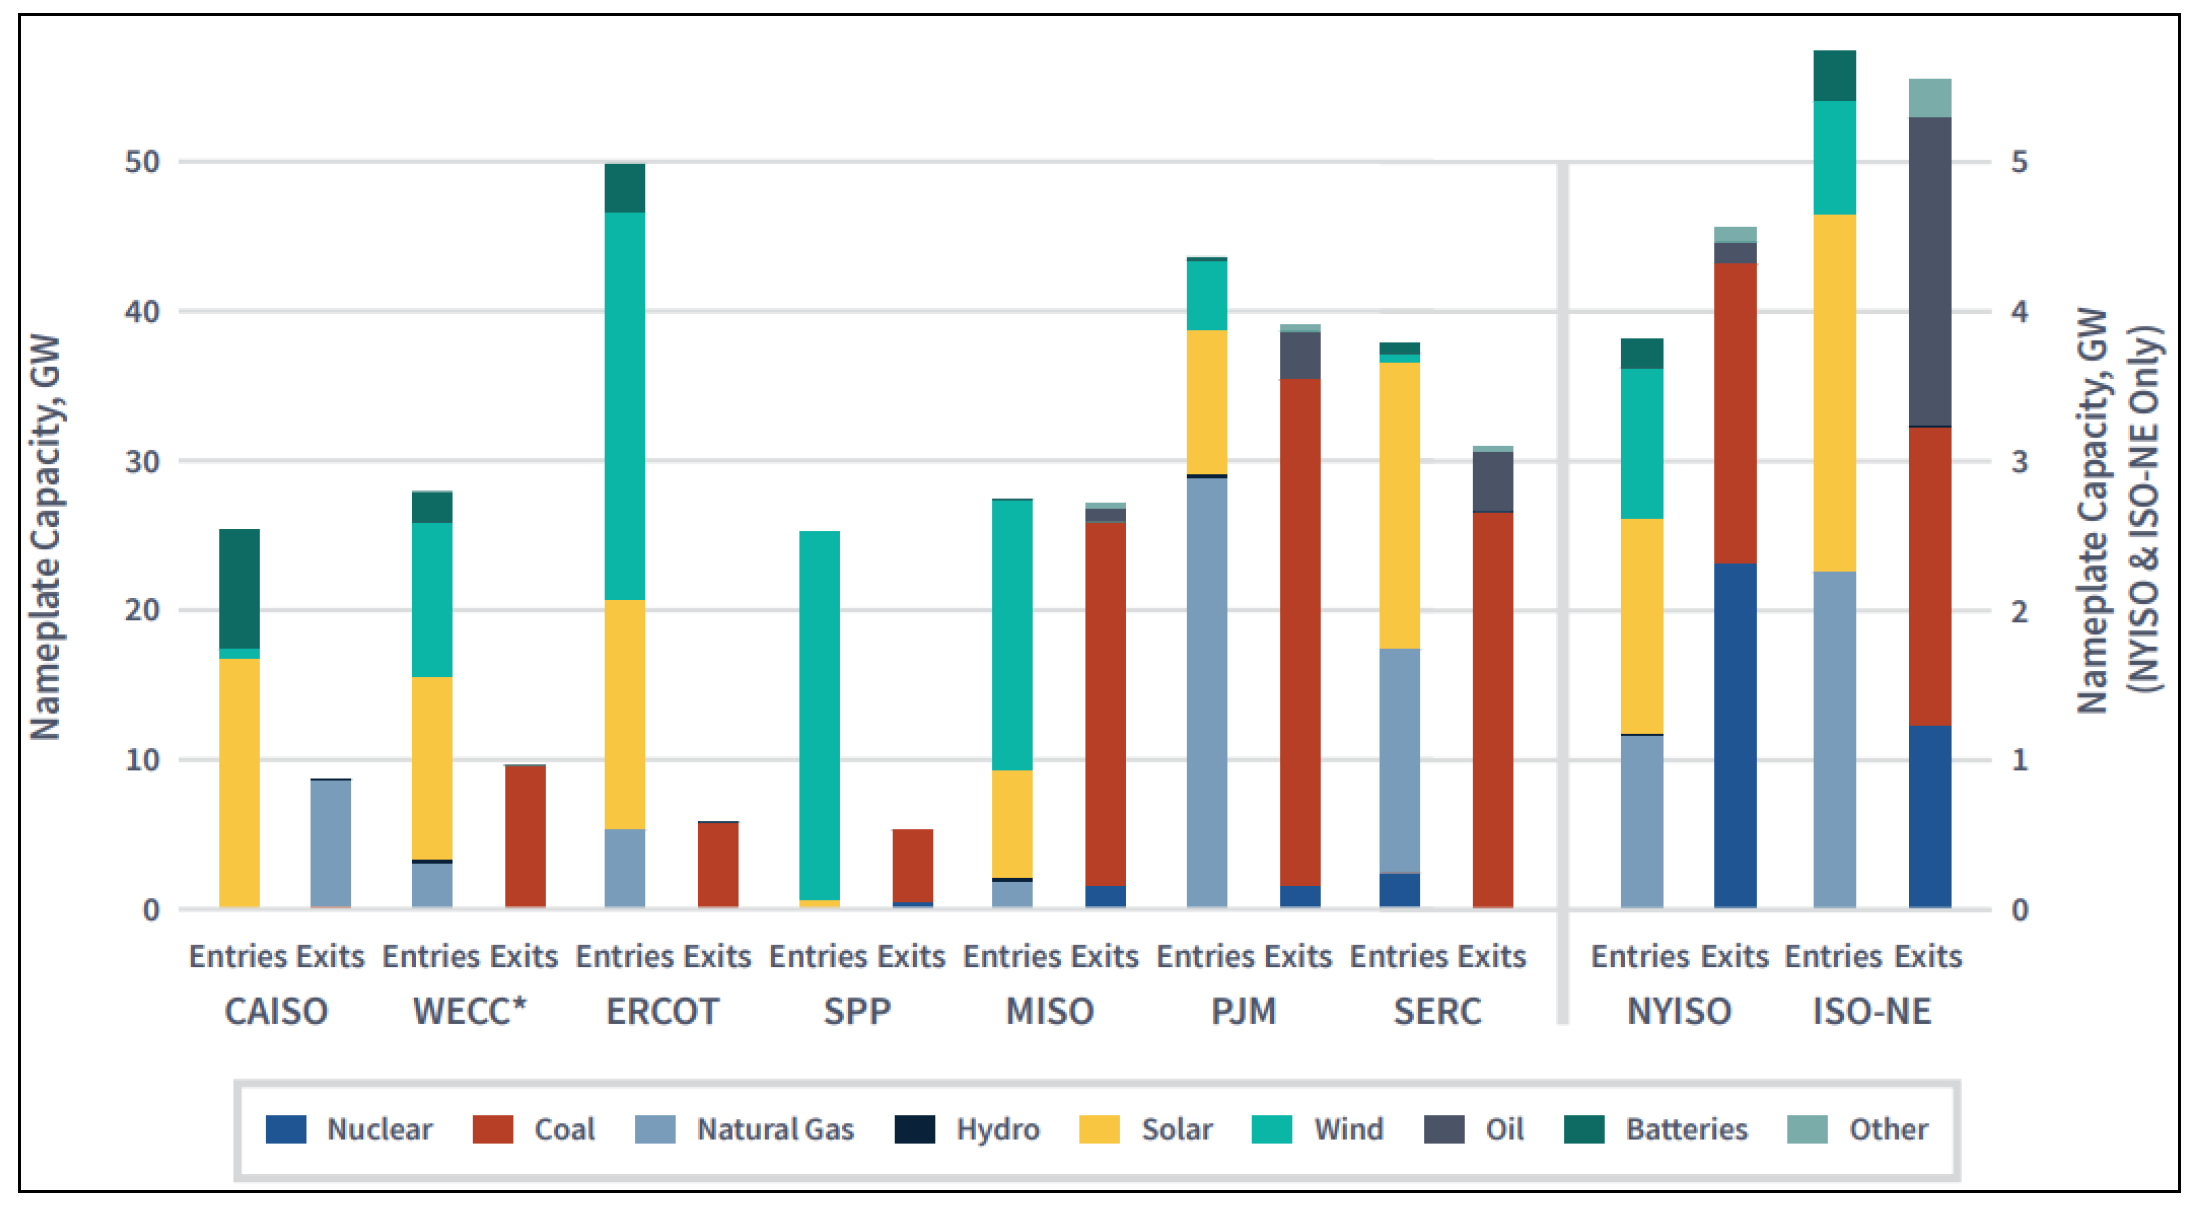
Figure 11.
Evolution of generation per type in the EU-27 (TWh) [65].
Figure 11.
Evolution of generation per type in the EU-27 (TWh) [65].
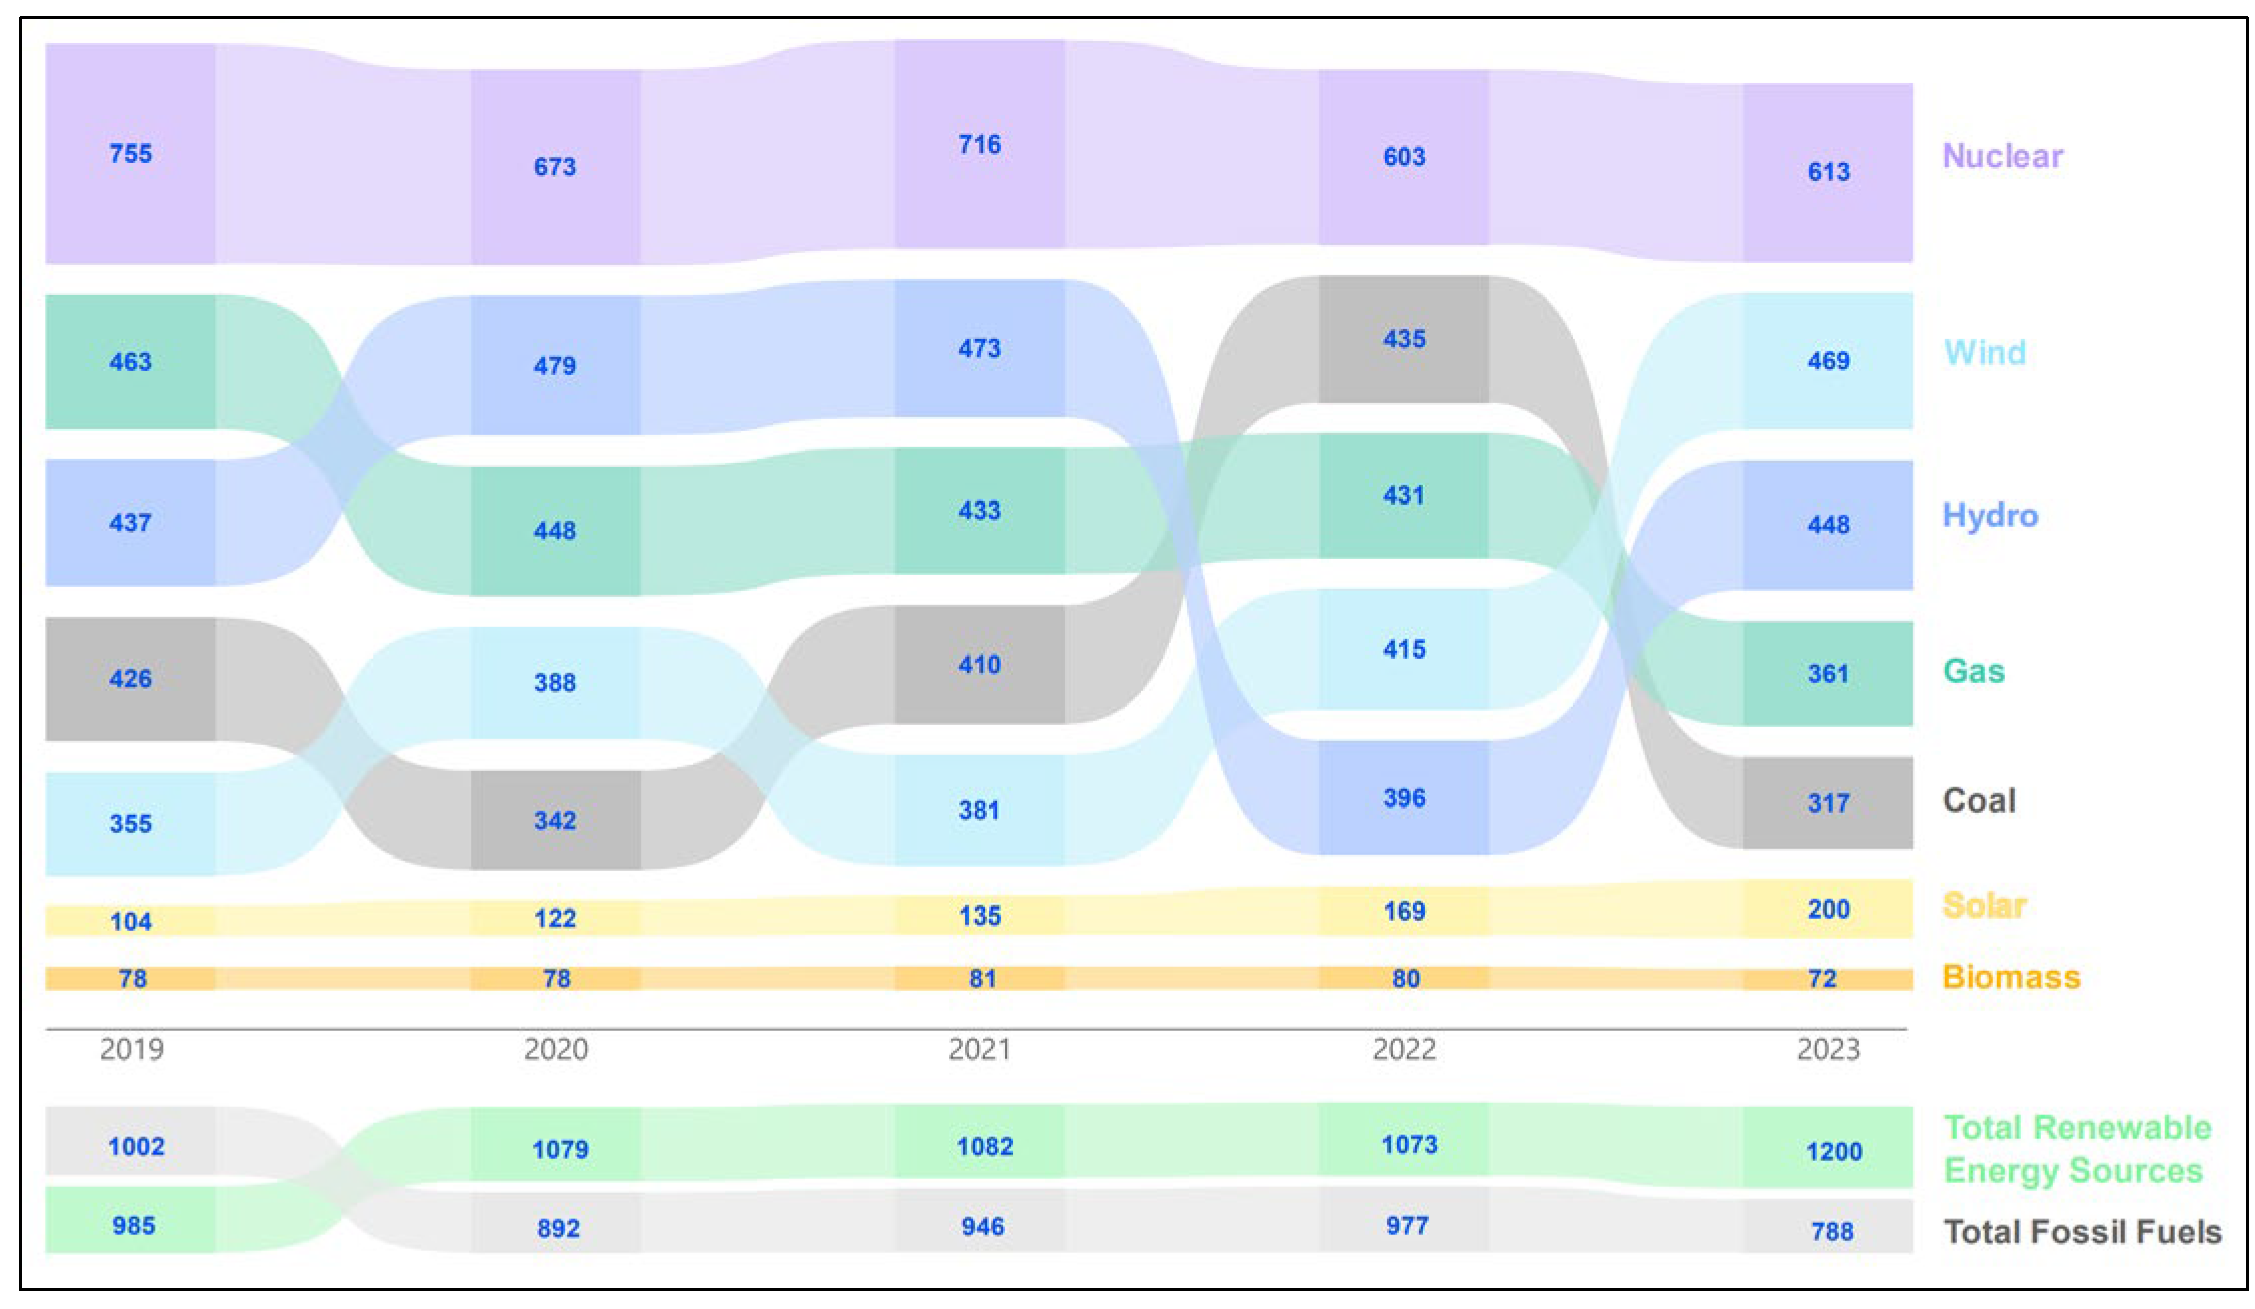
Figure 14.
Installed capacity scenario for Year 2033-34.
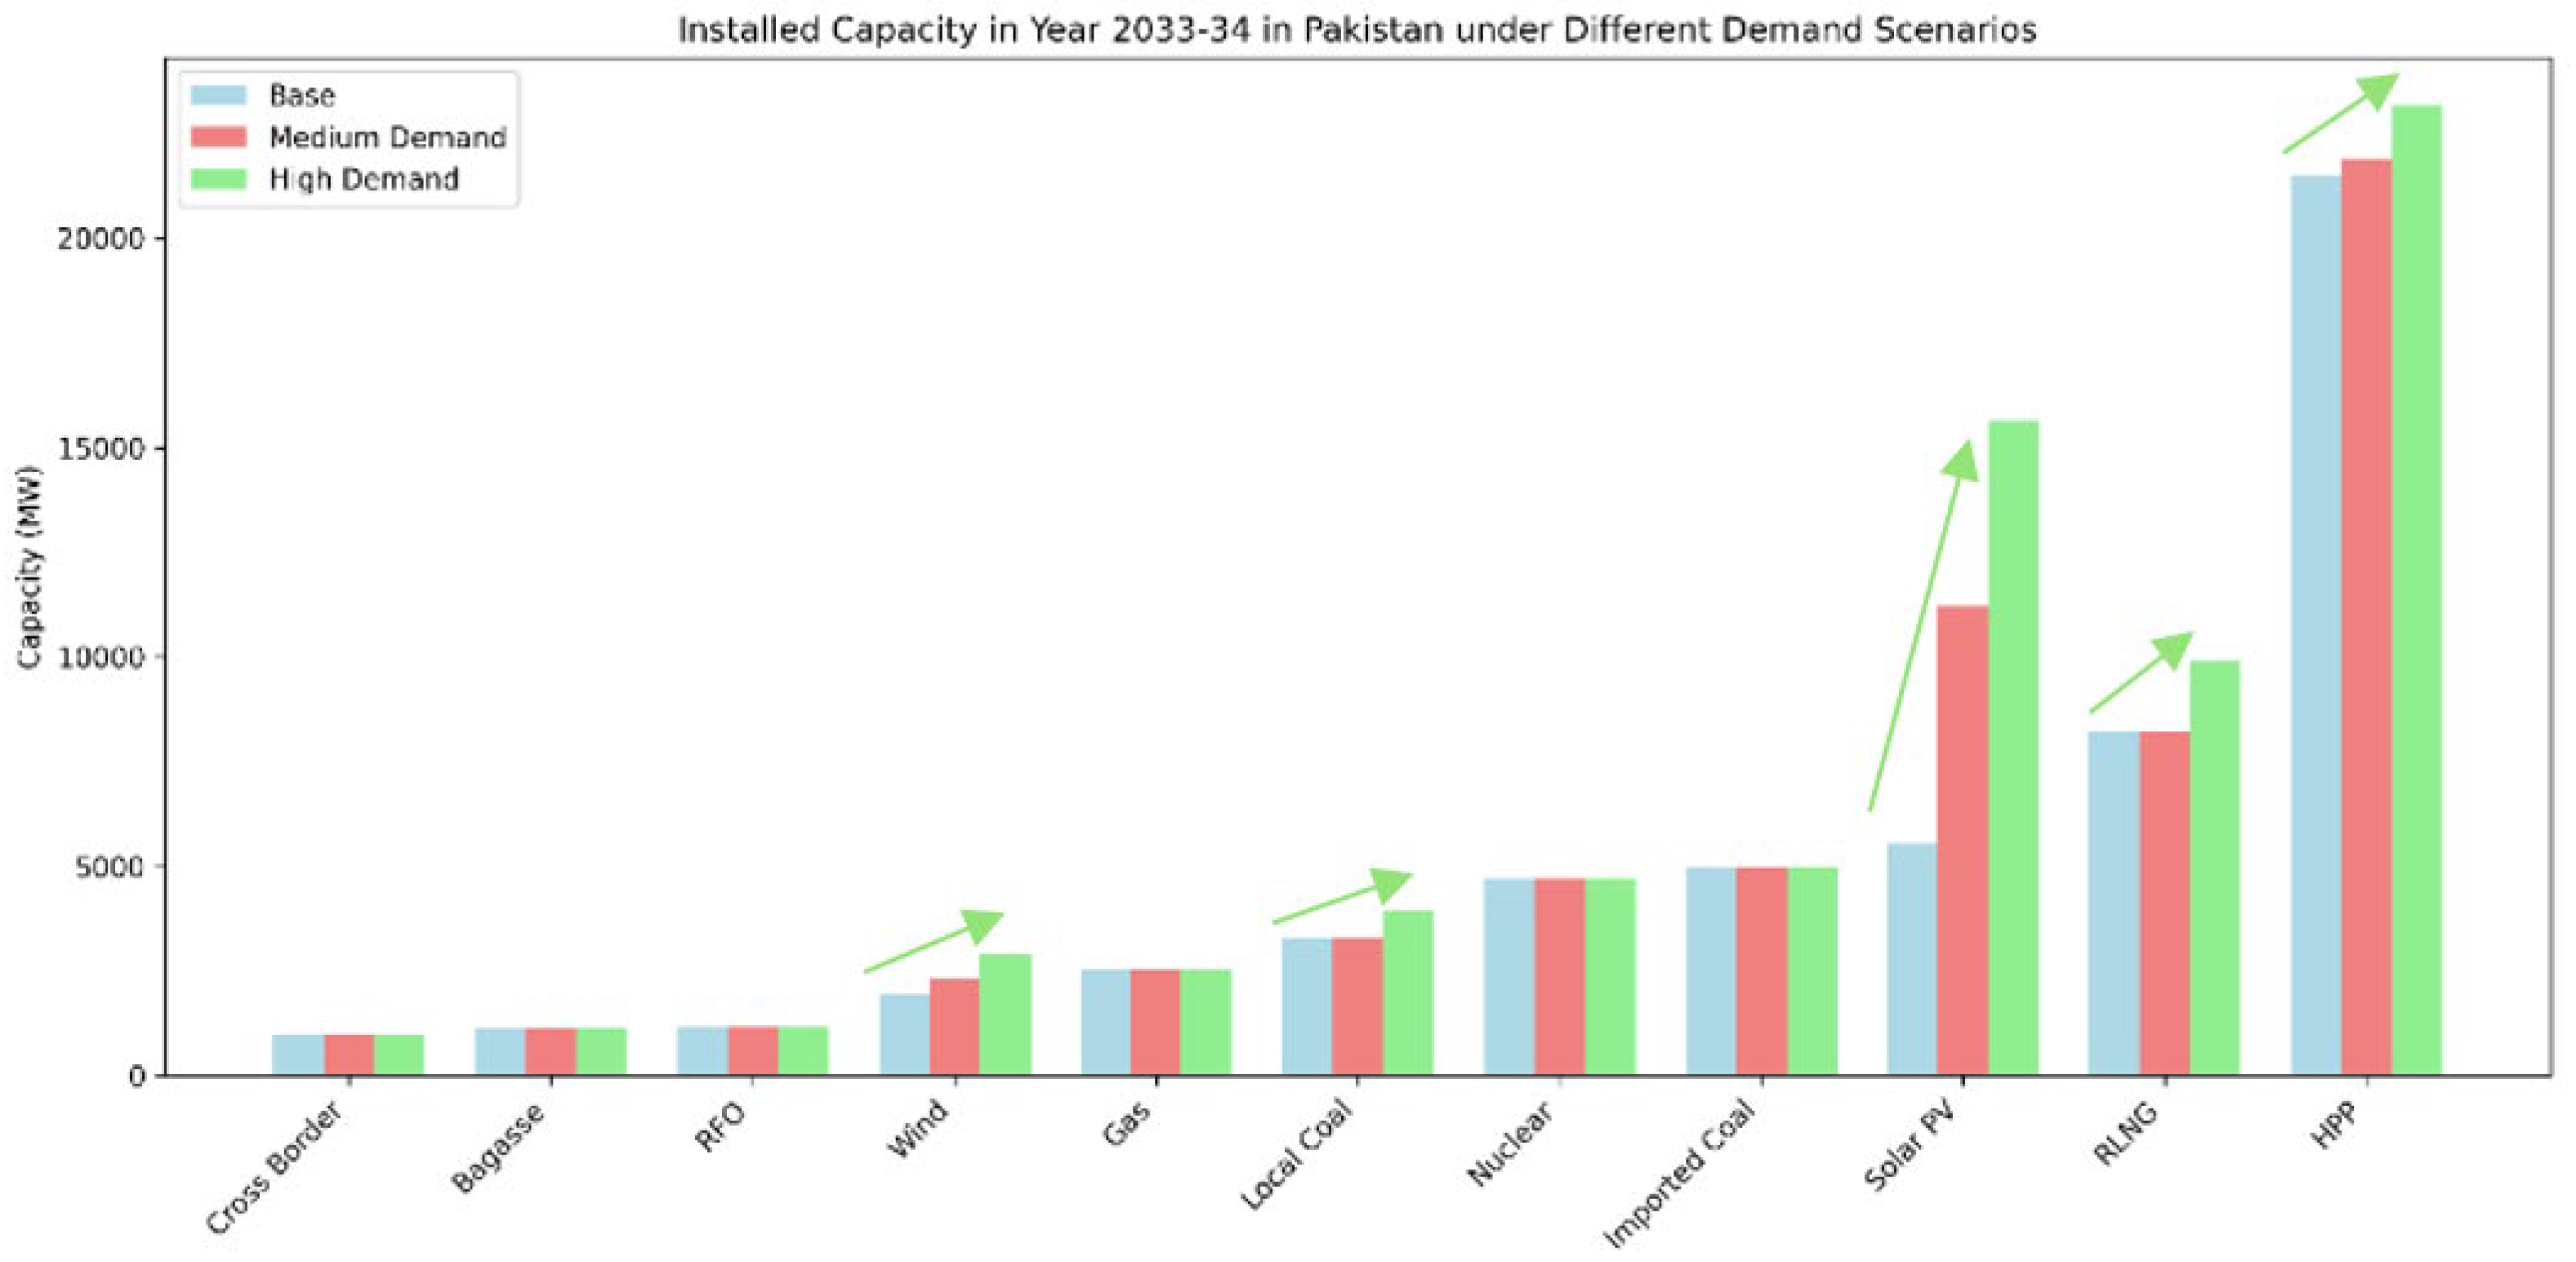
Figure 15.
Tariffs of different generation sources in Pakistan [24].
Figure 15.
Tariffs of different generation sources in Pakistan [24].
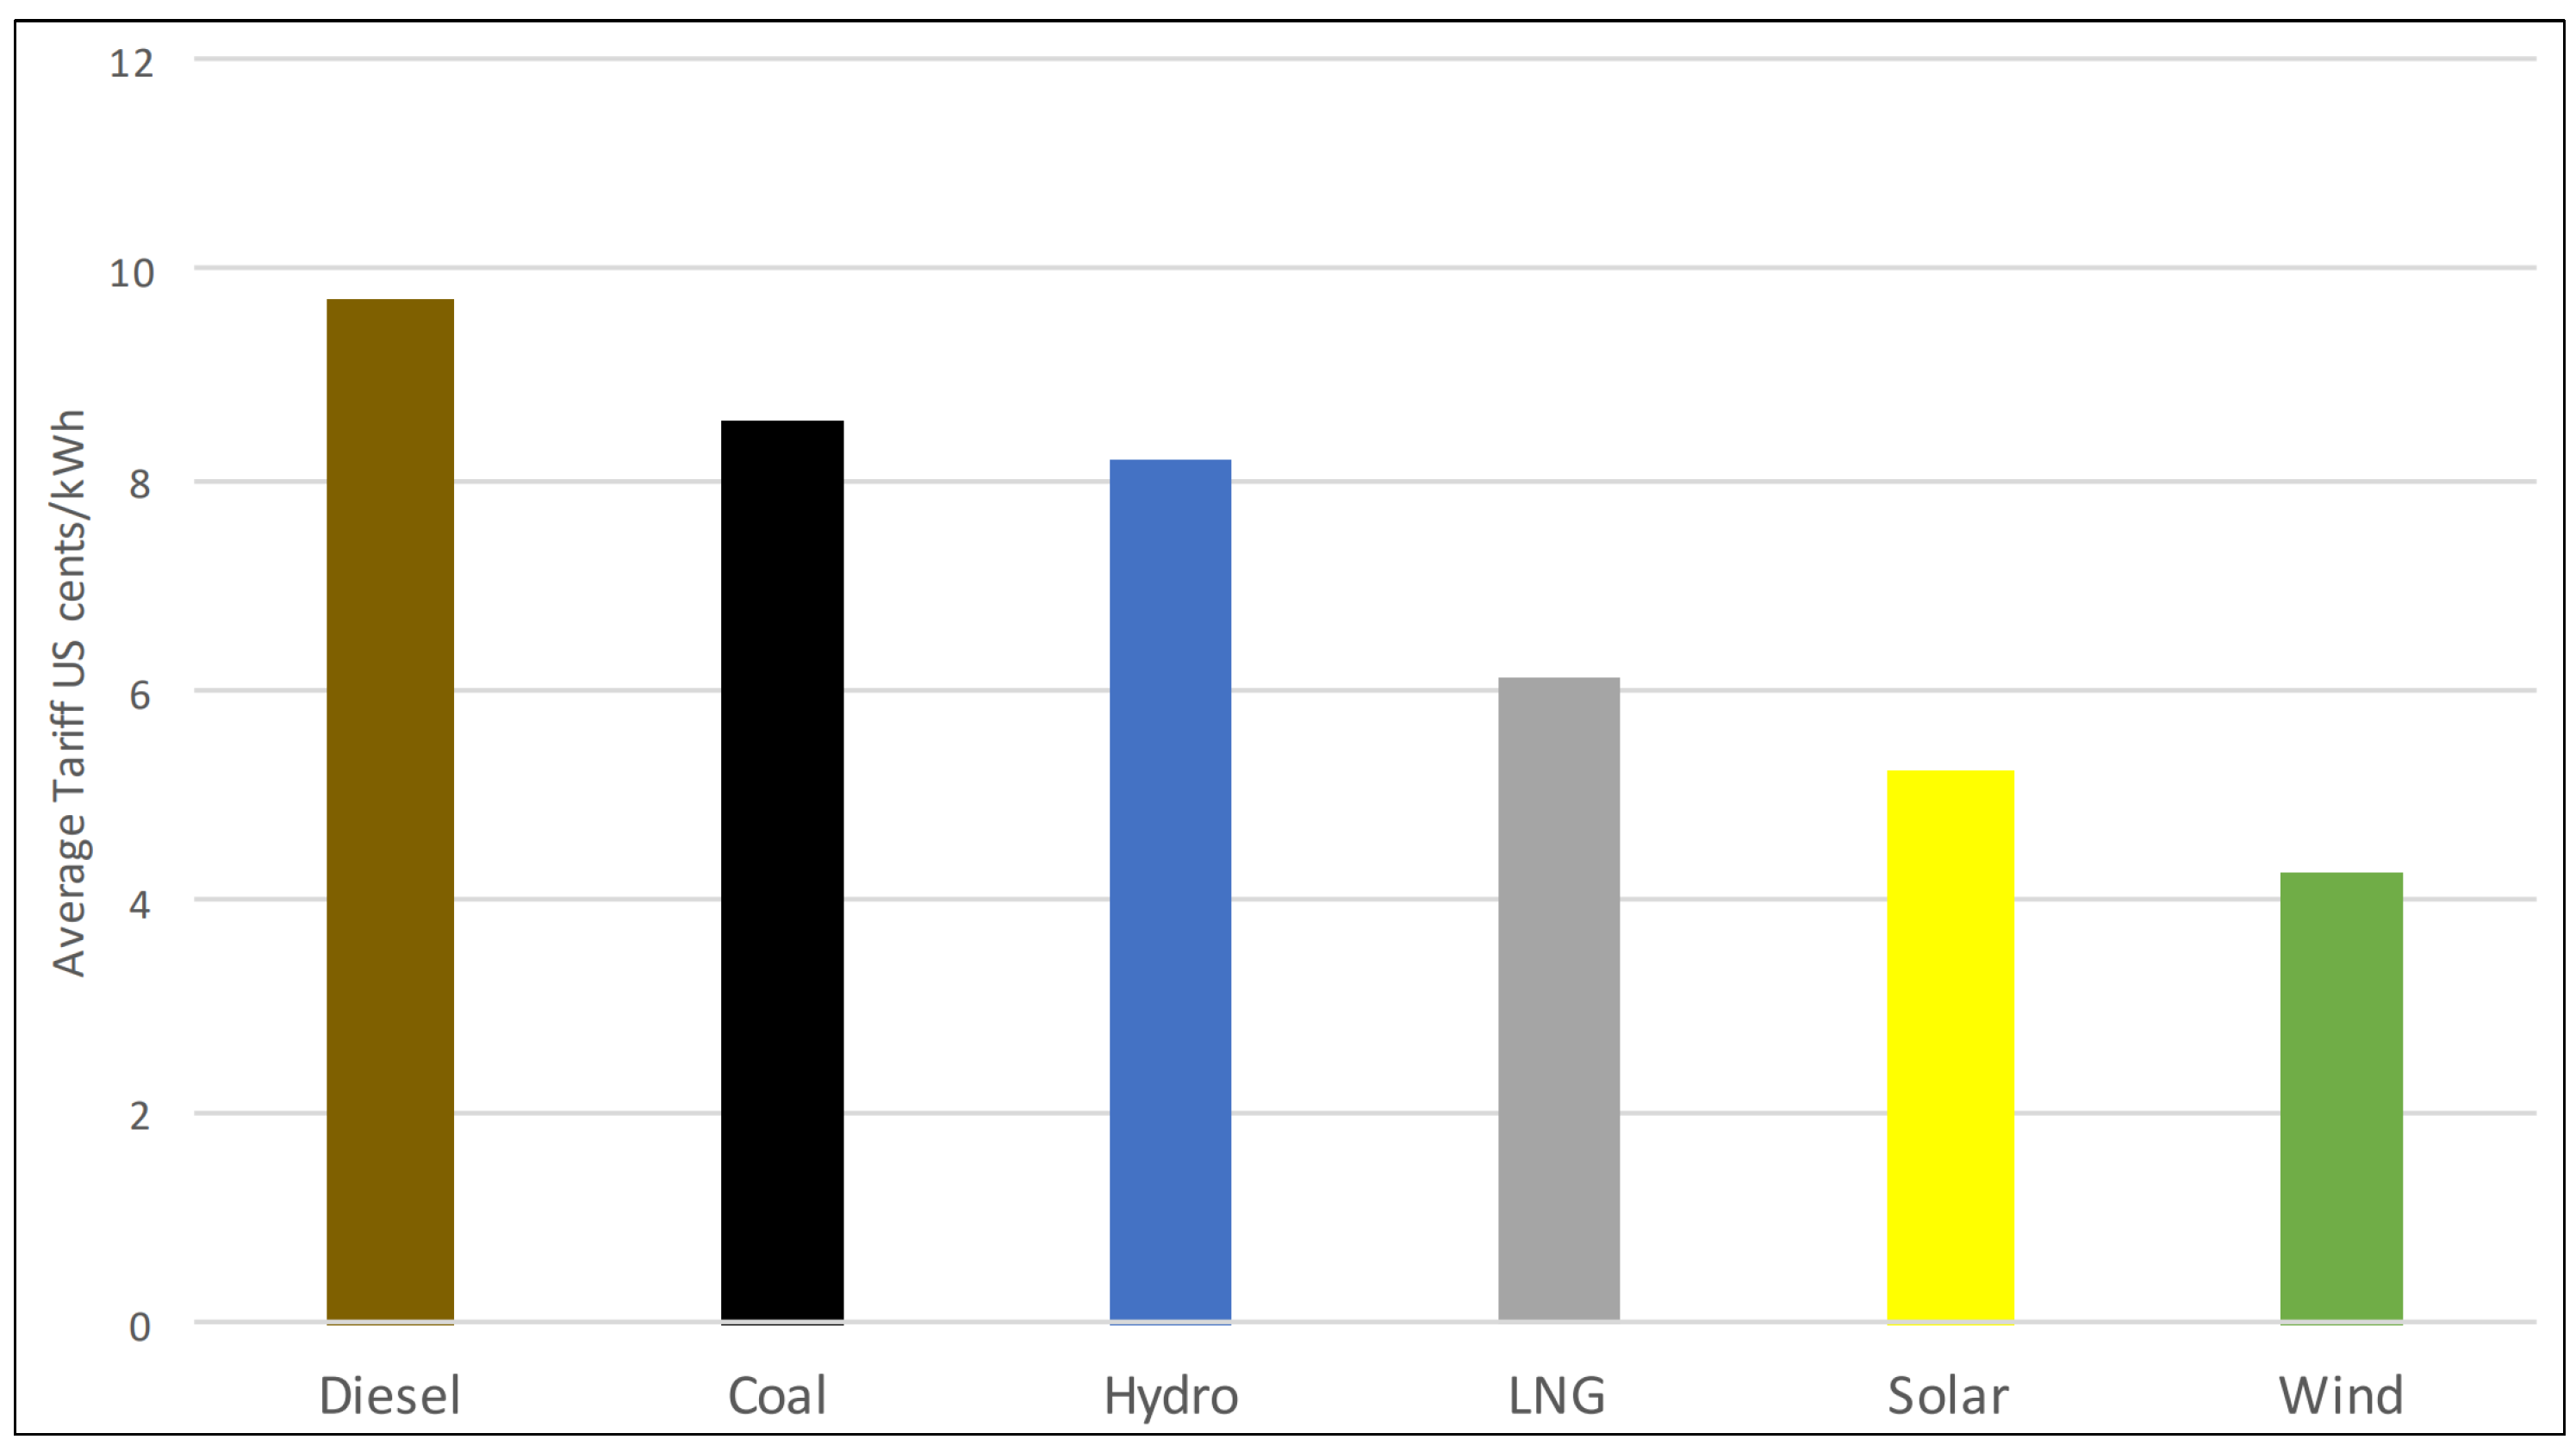
Figure 16.
percentage share of Solar and Wind generation installed capacity [73].
Figure 16.
percentage share of Solar and Wind generation installed capacity [73].
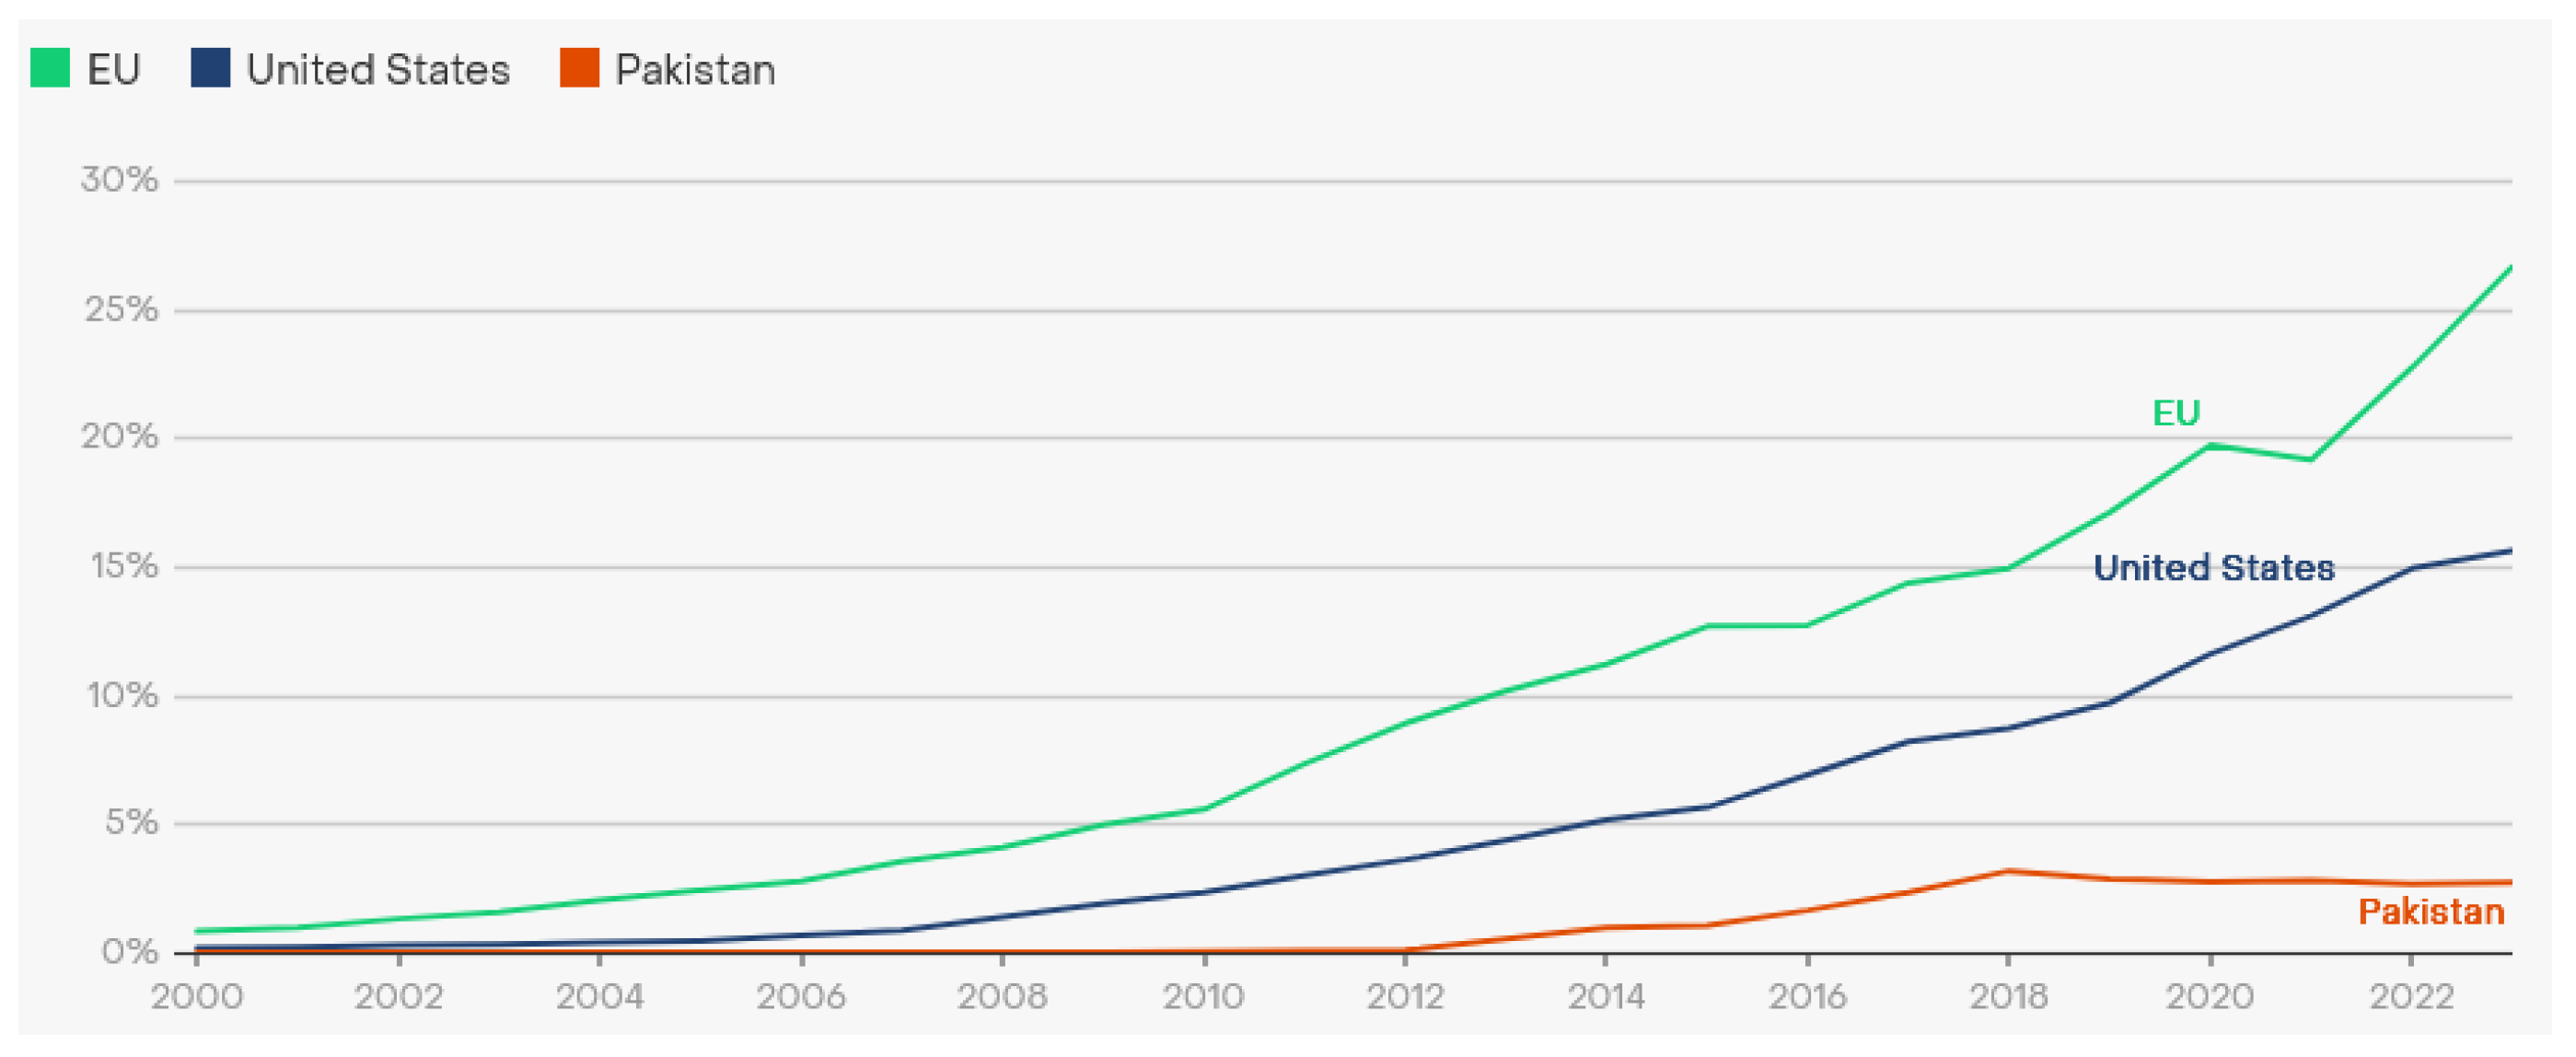
Figure 17.
Effect of extreme conditions on reserve margins.
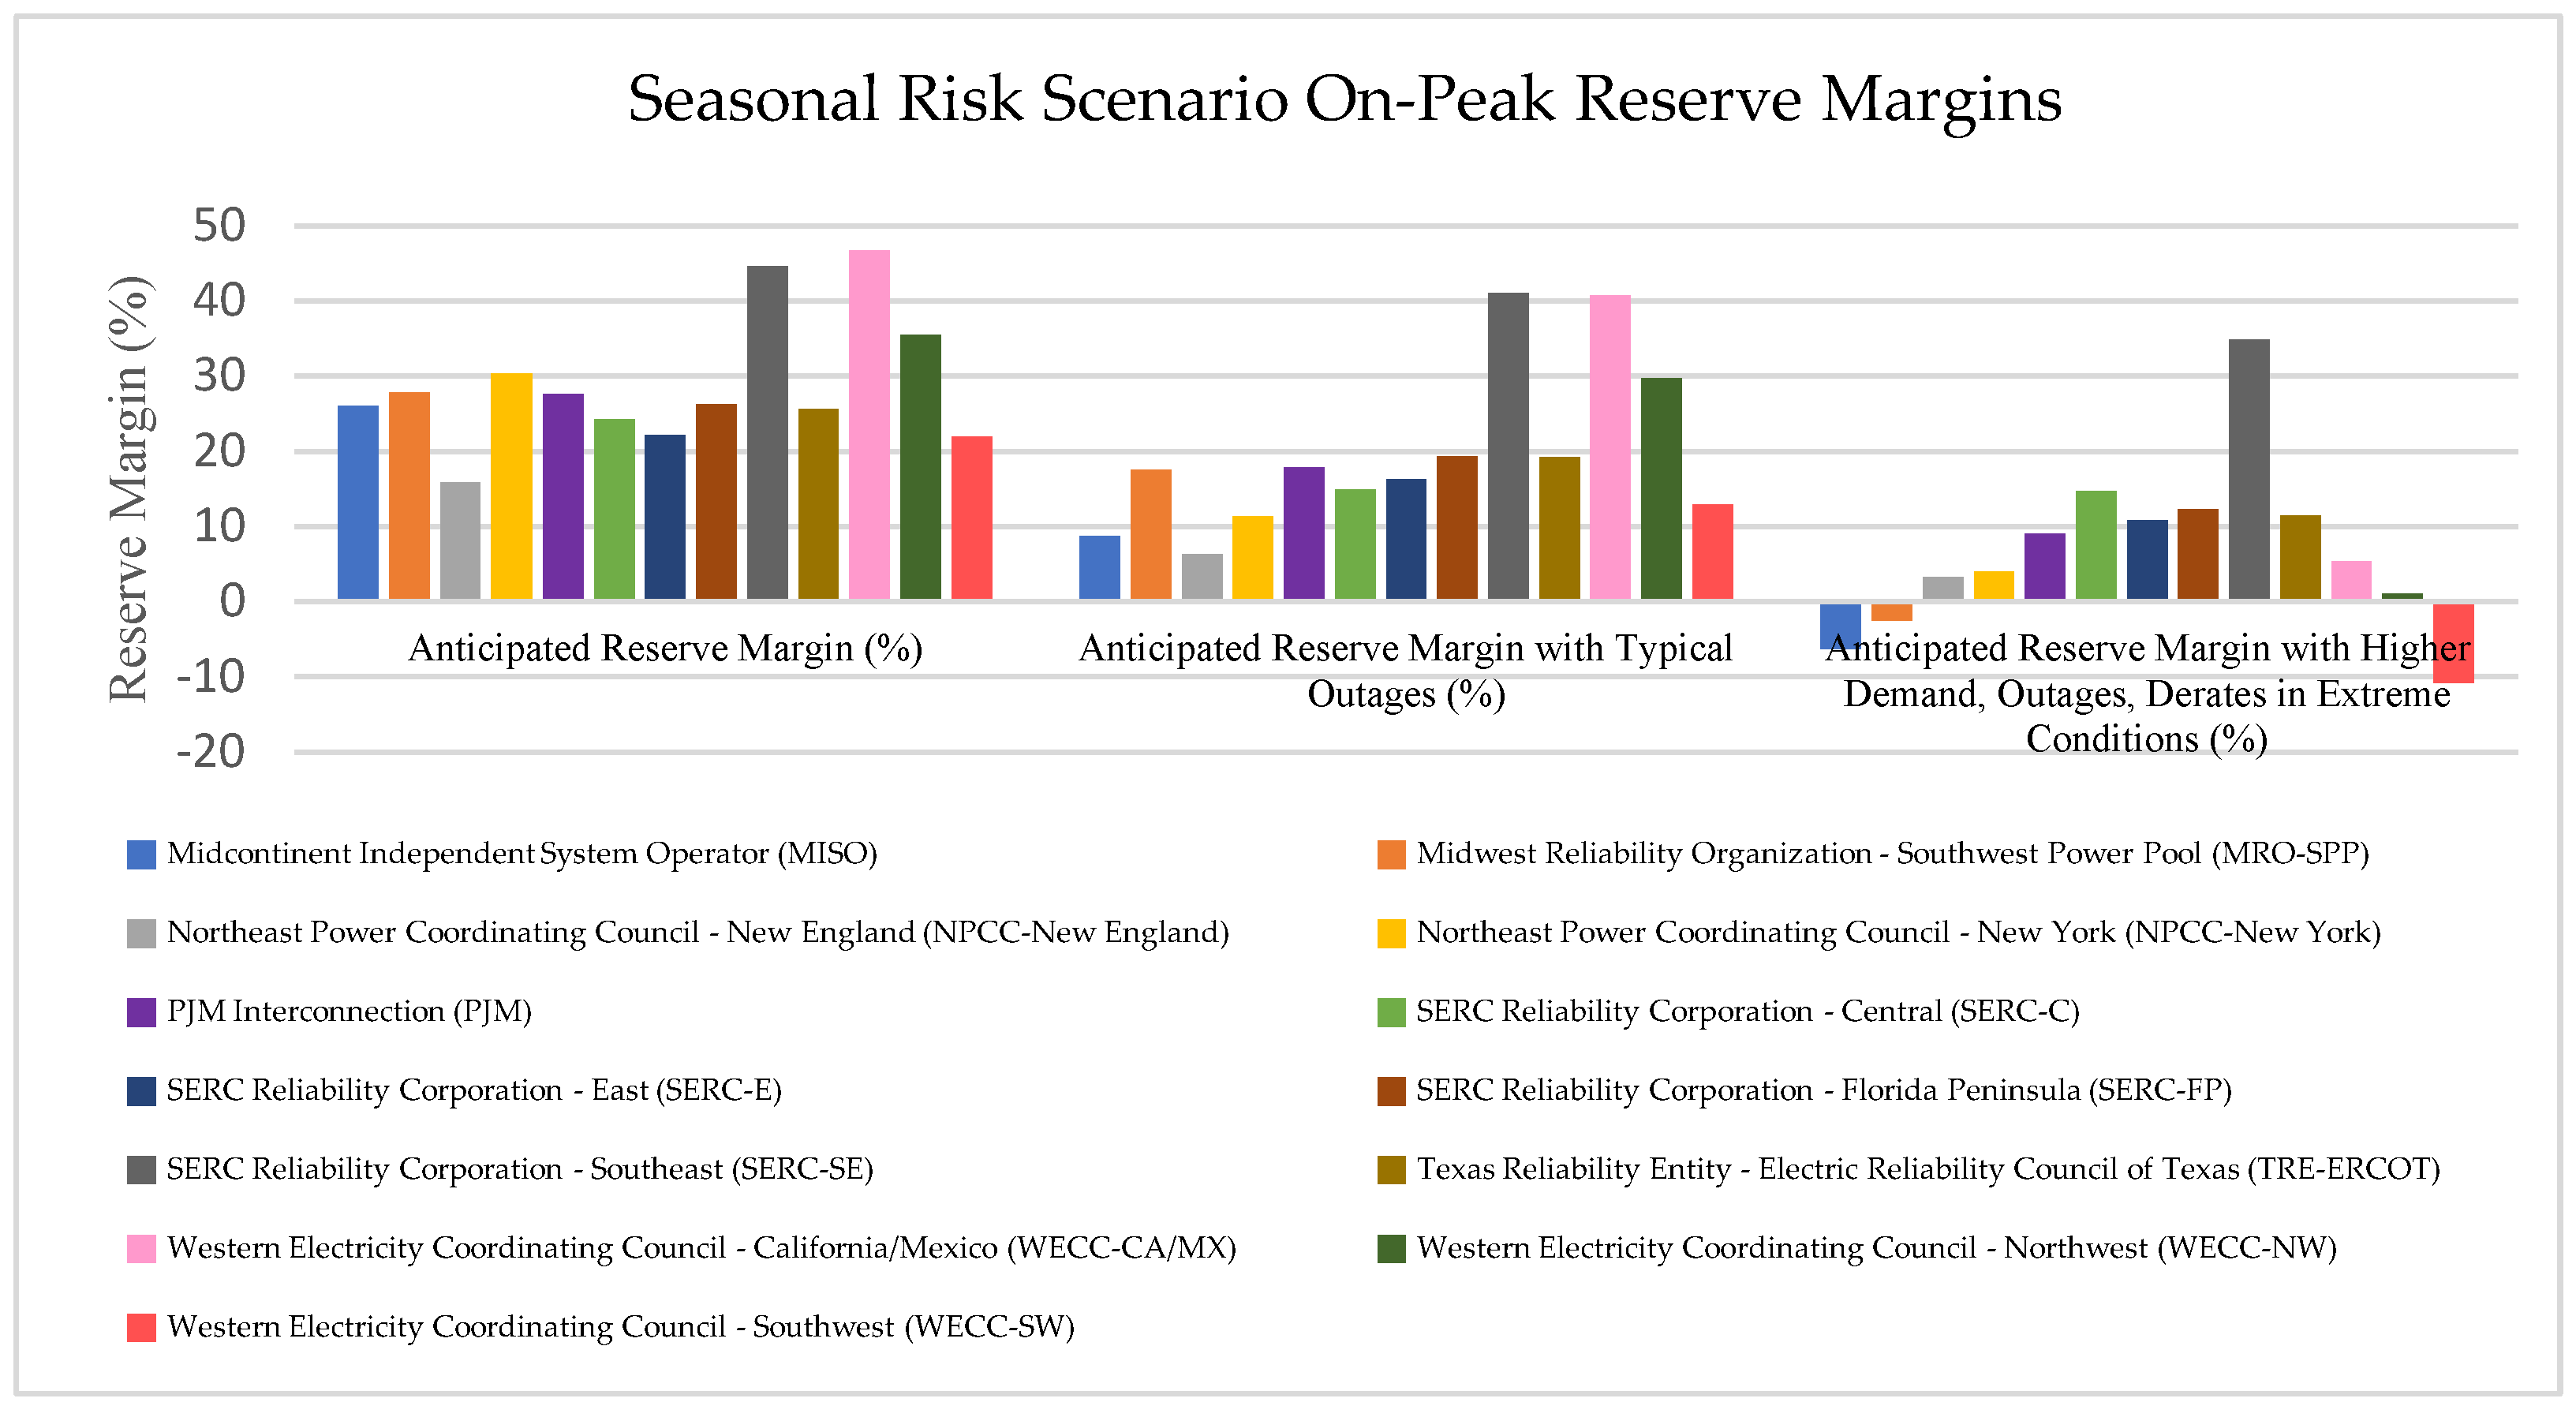
Figure 18.
Figure 19 Historical trend of negative prices in the EU (left) and US (right) wholesale markets [78,79].
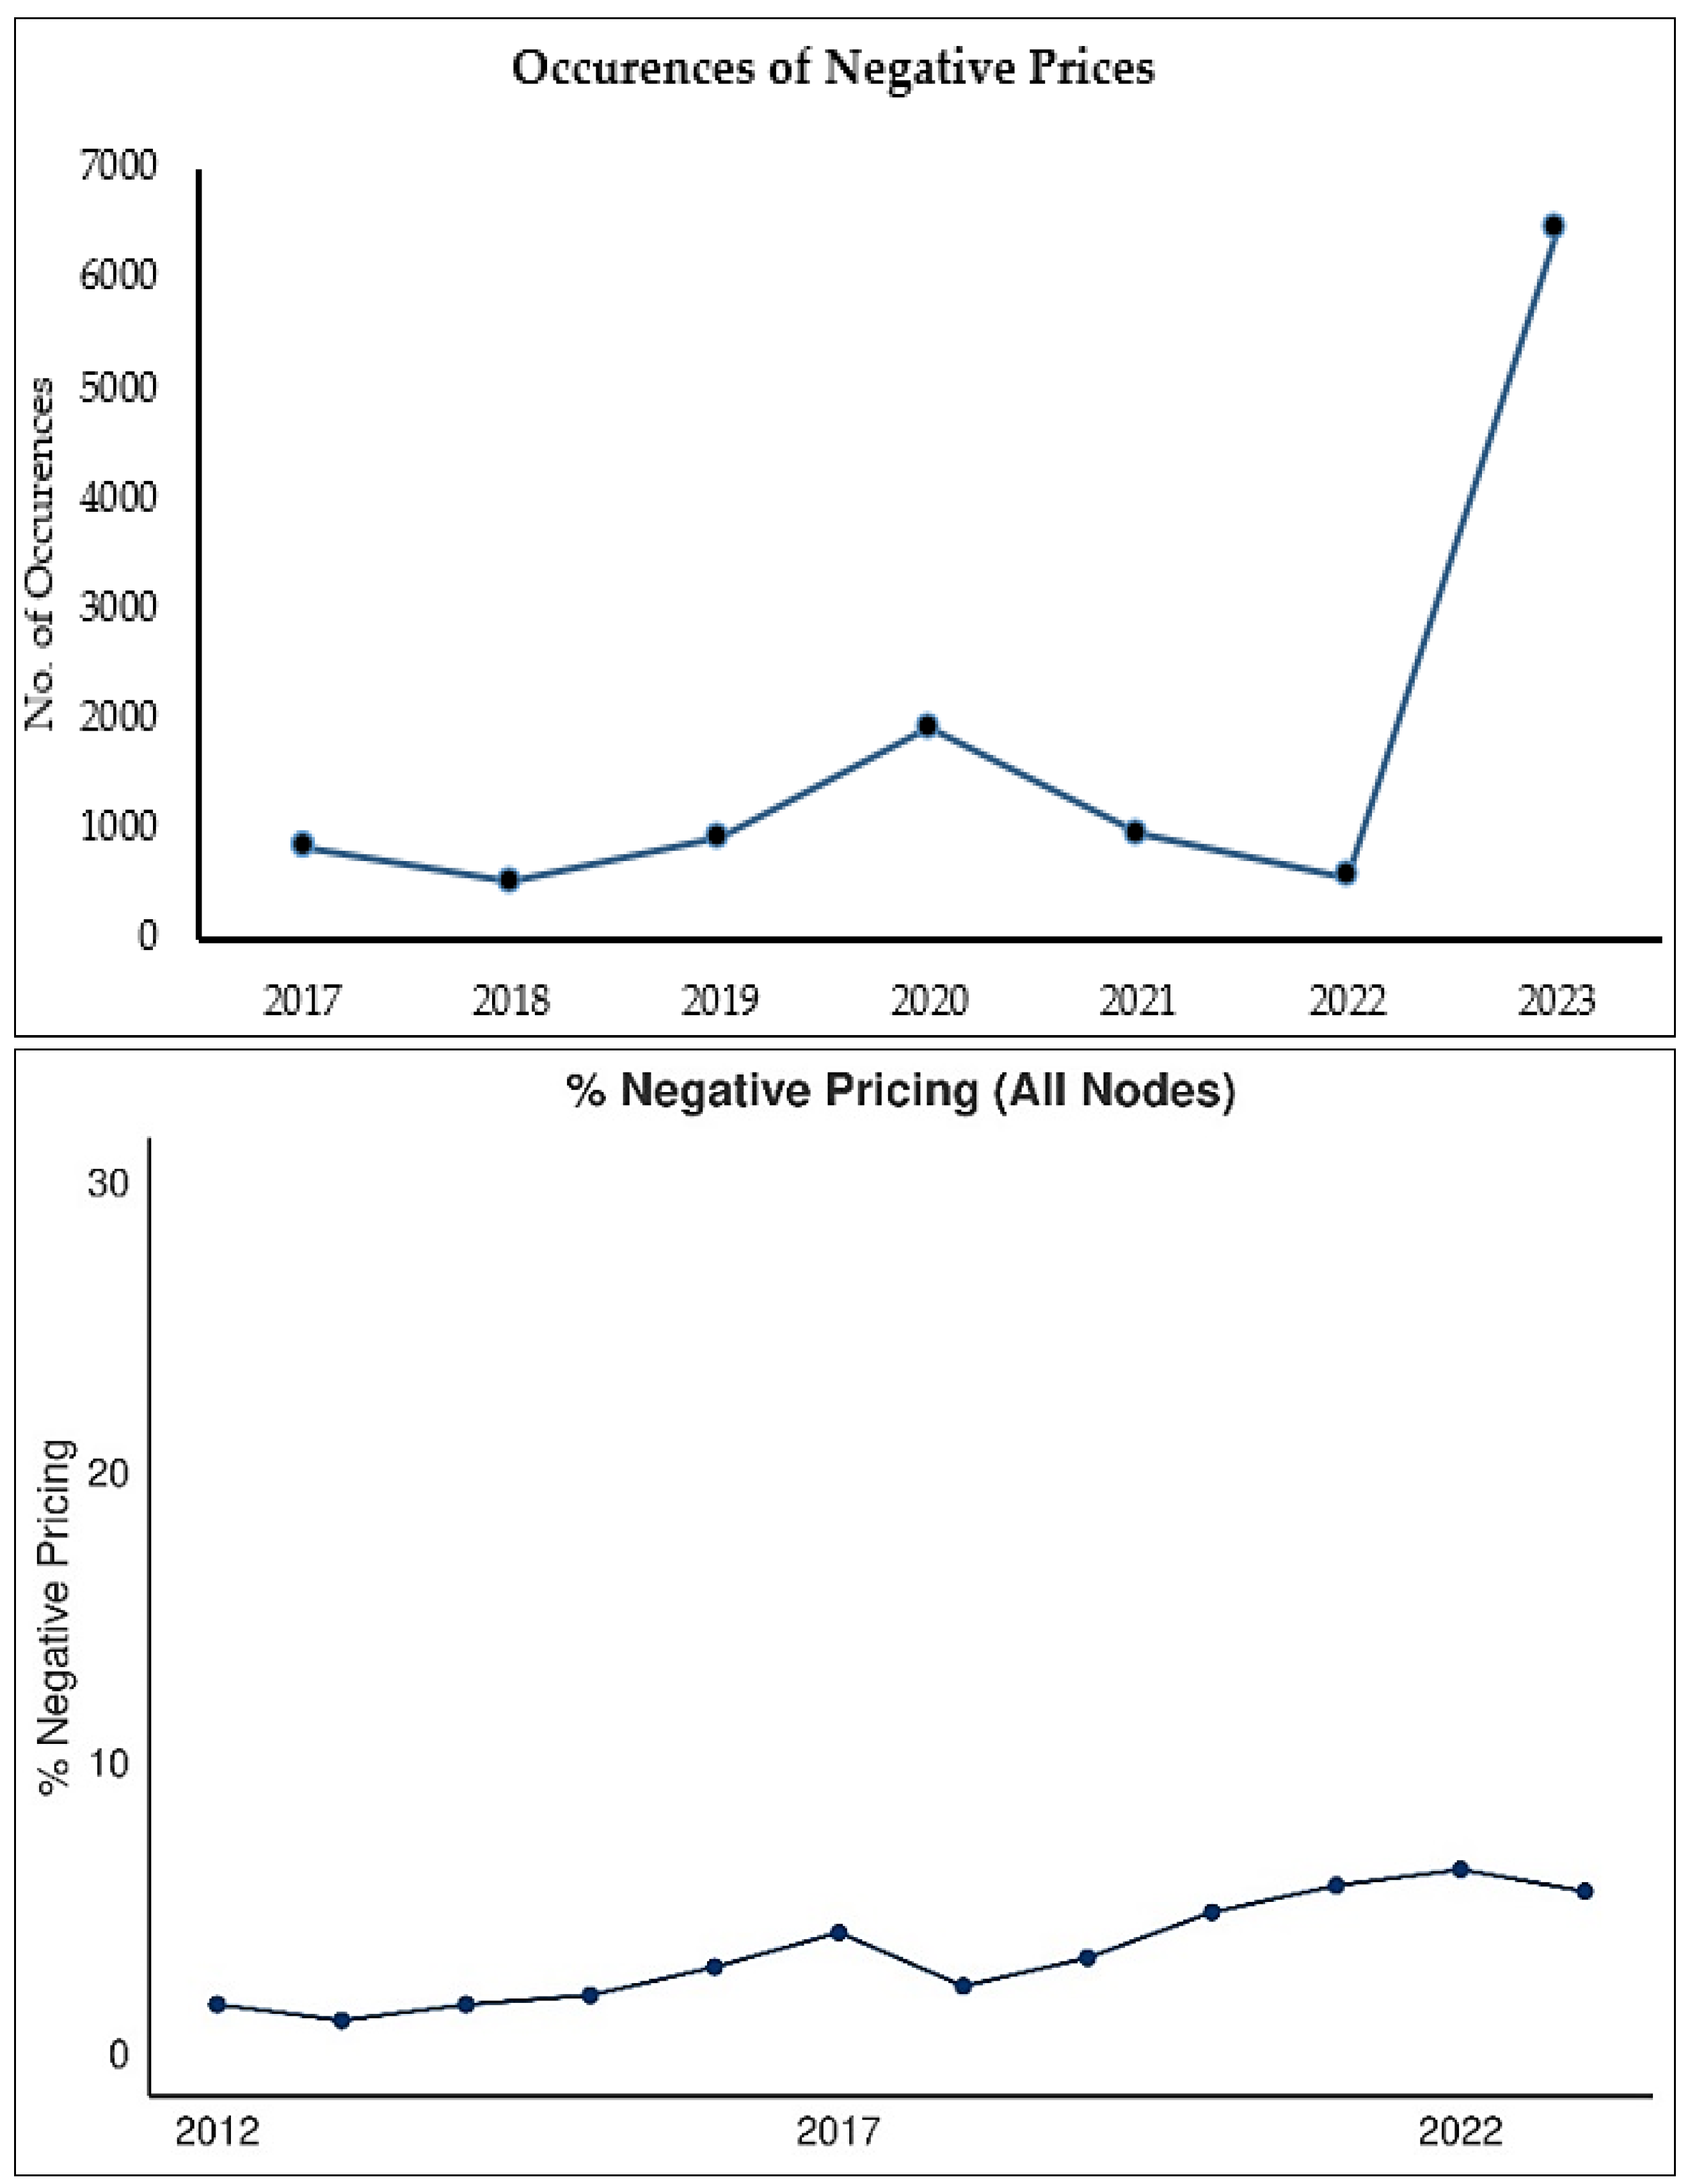
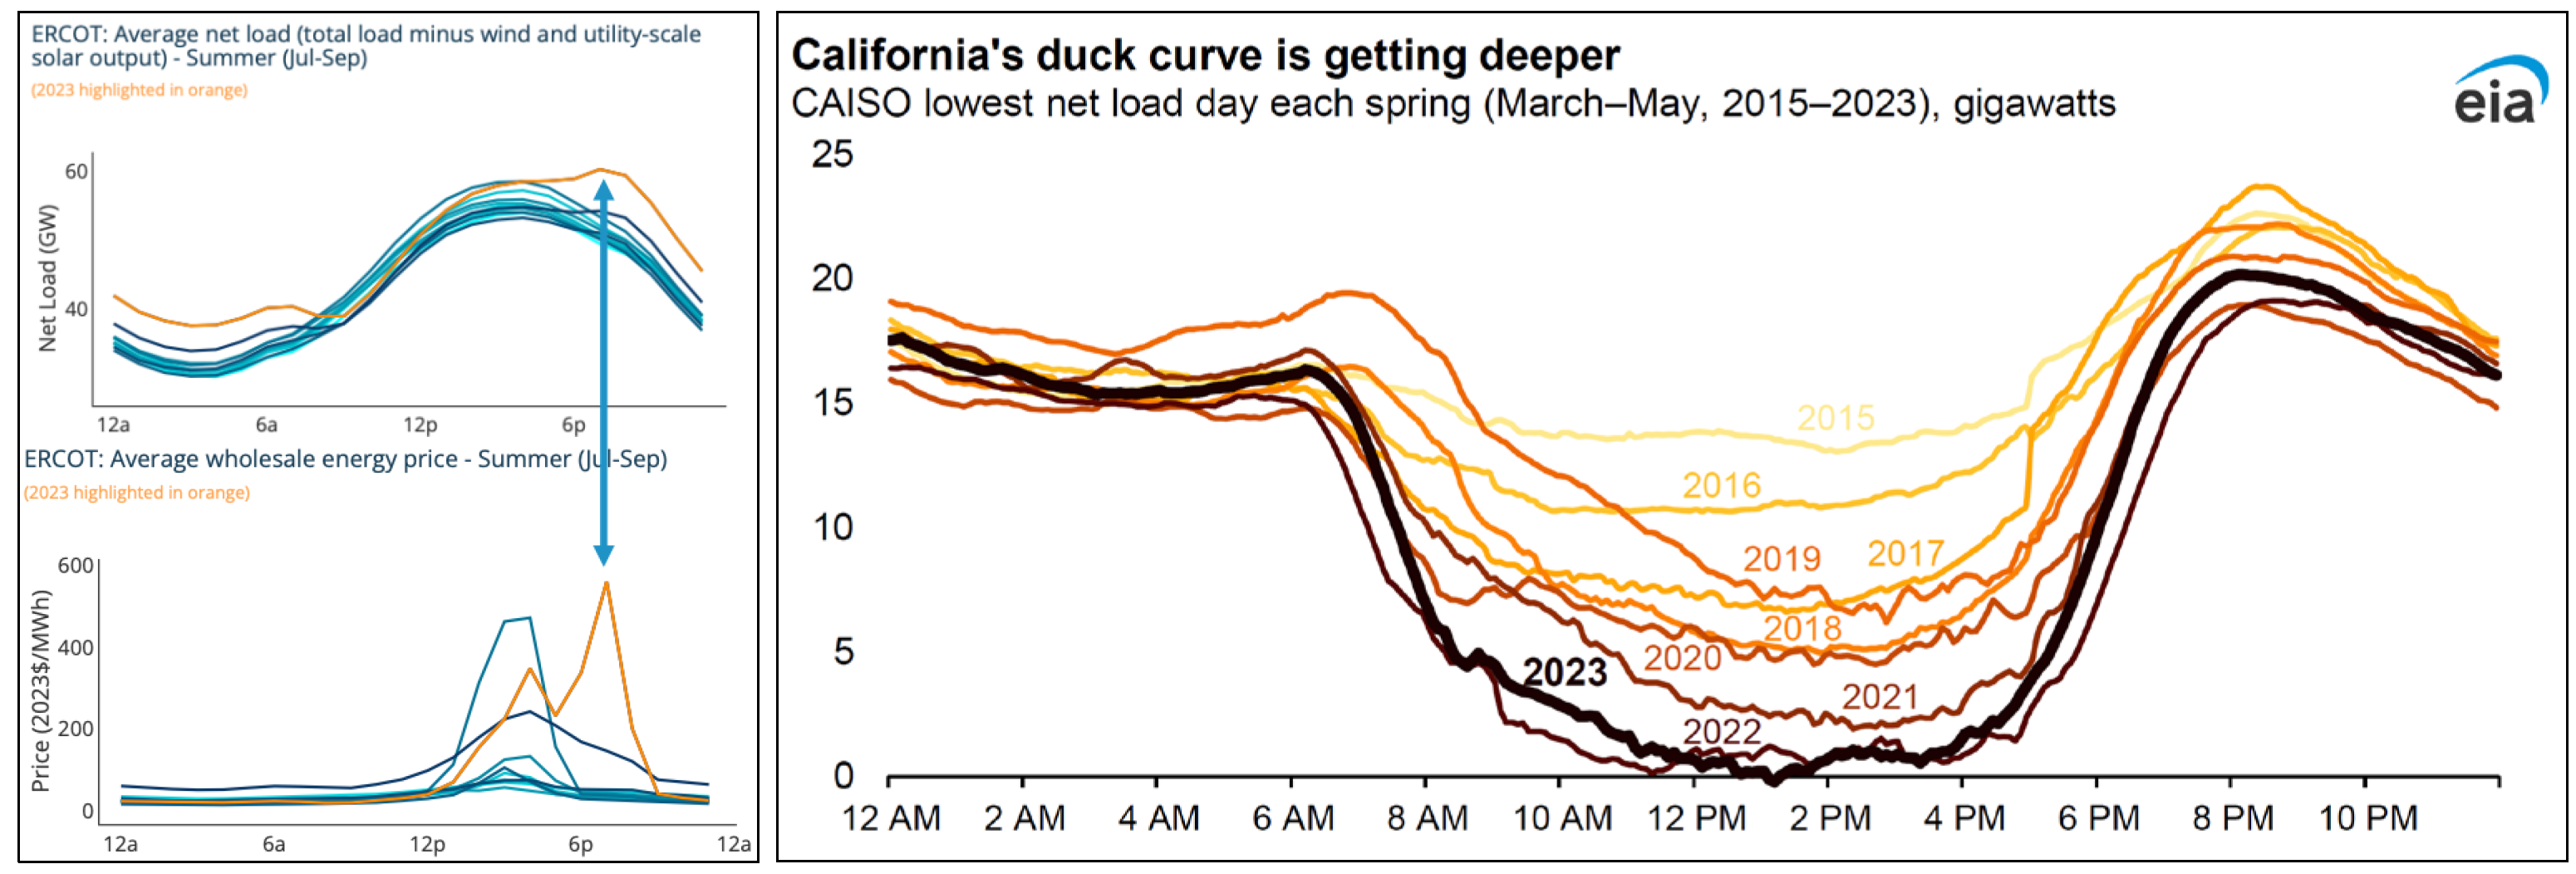
Figure 22.
Past and Future Flexibility Needs in different time frames (EU) [84].
Figure 22.
Past and Future Flexibility Needs in different time frames (EU) [84].
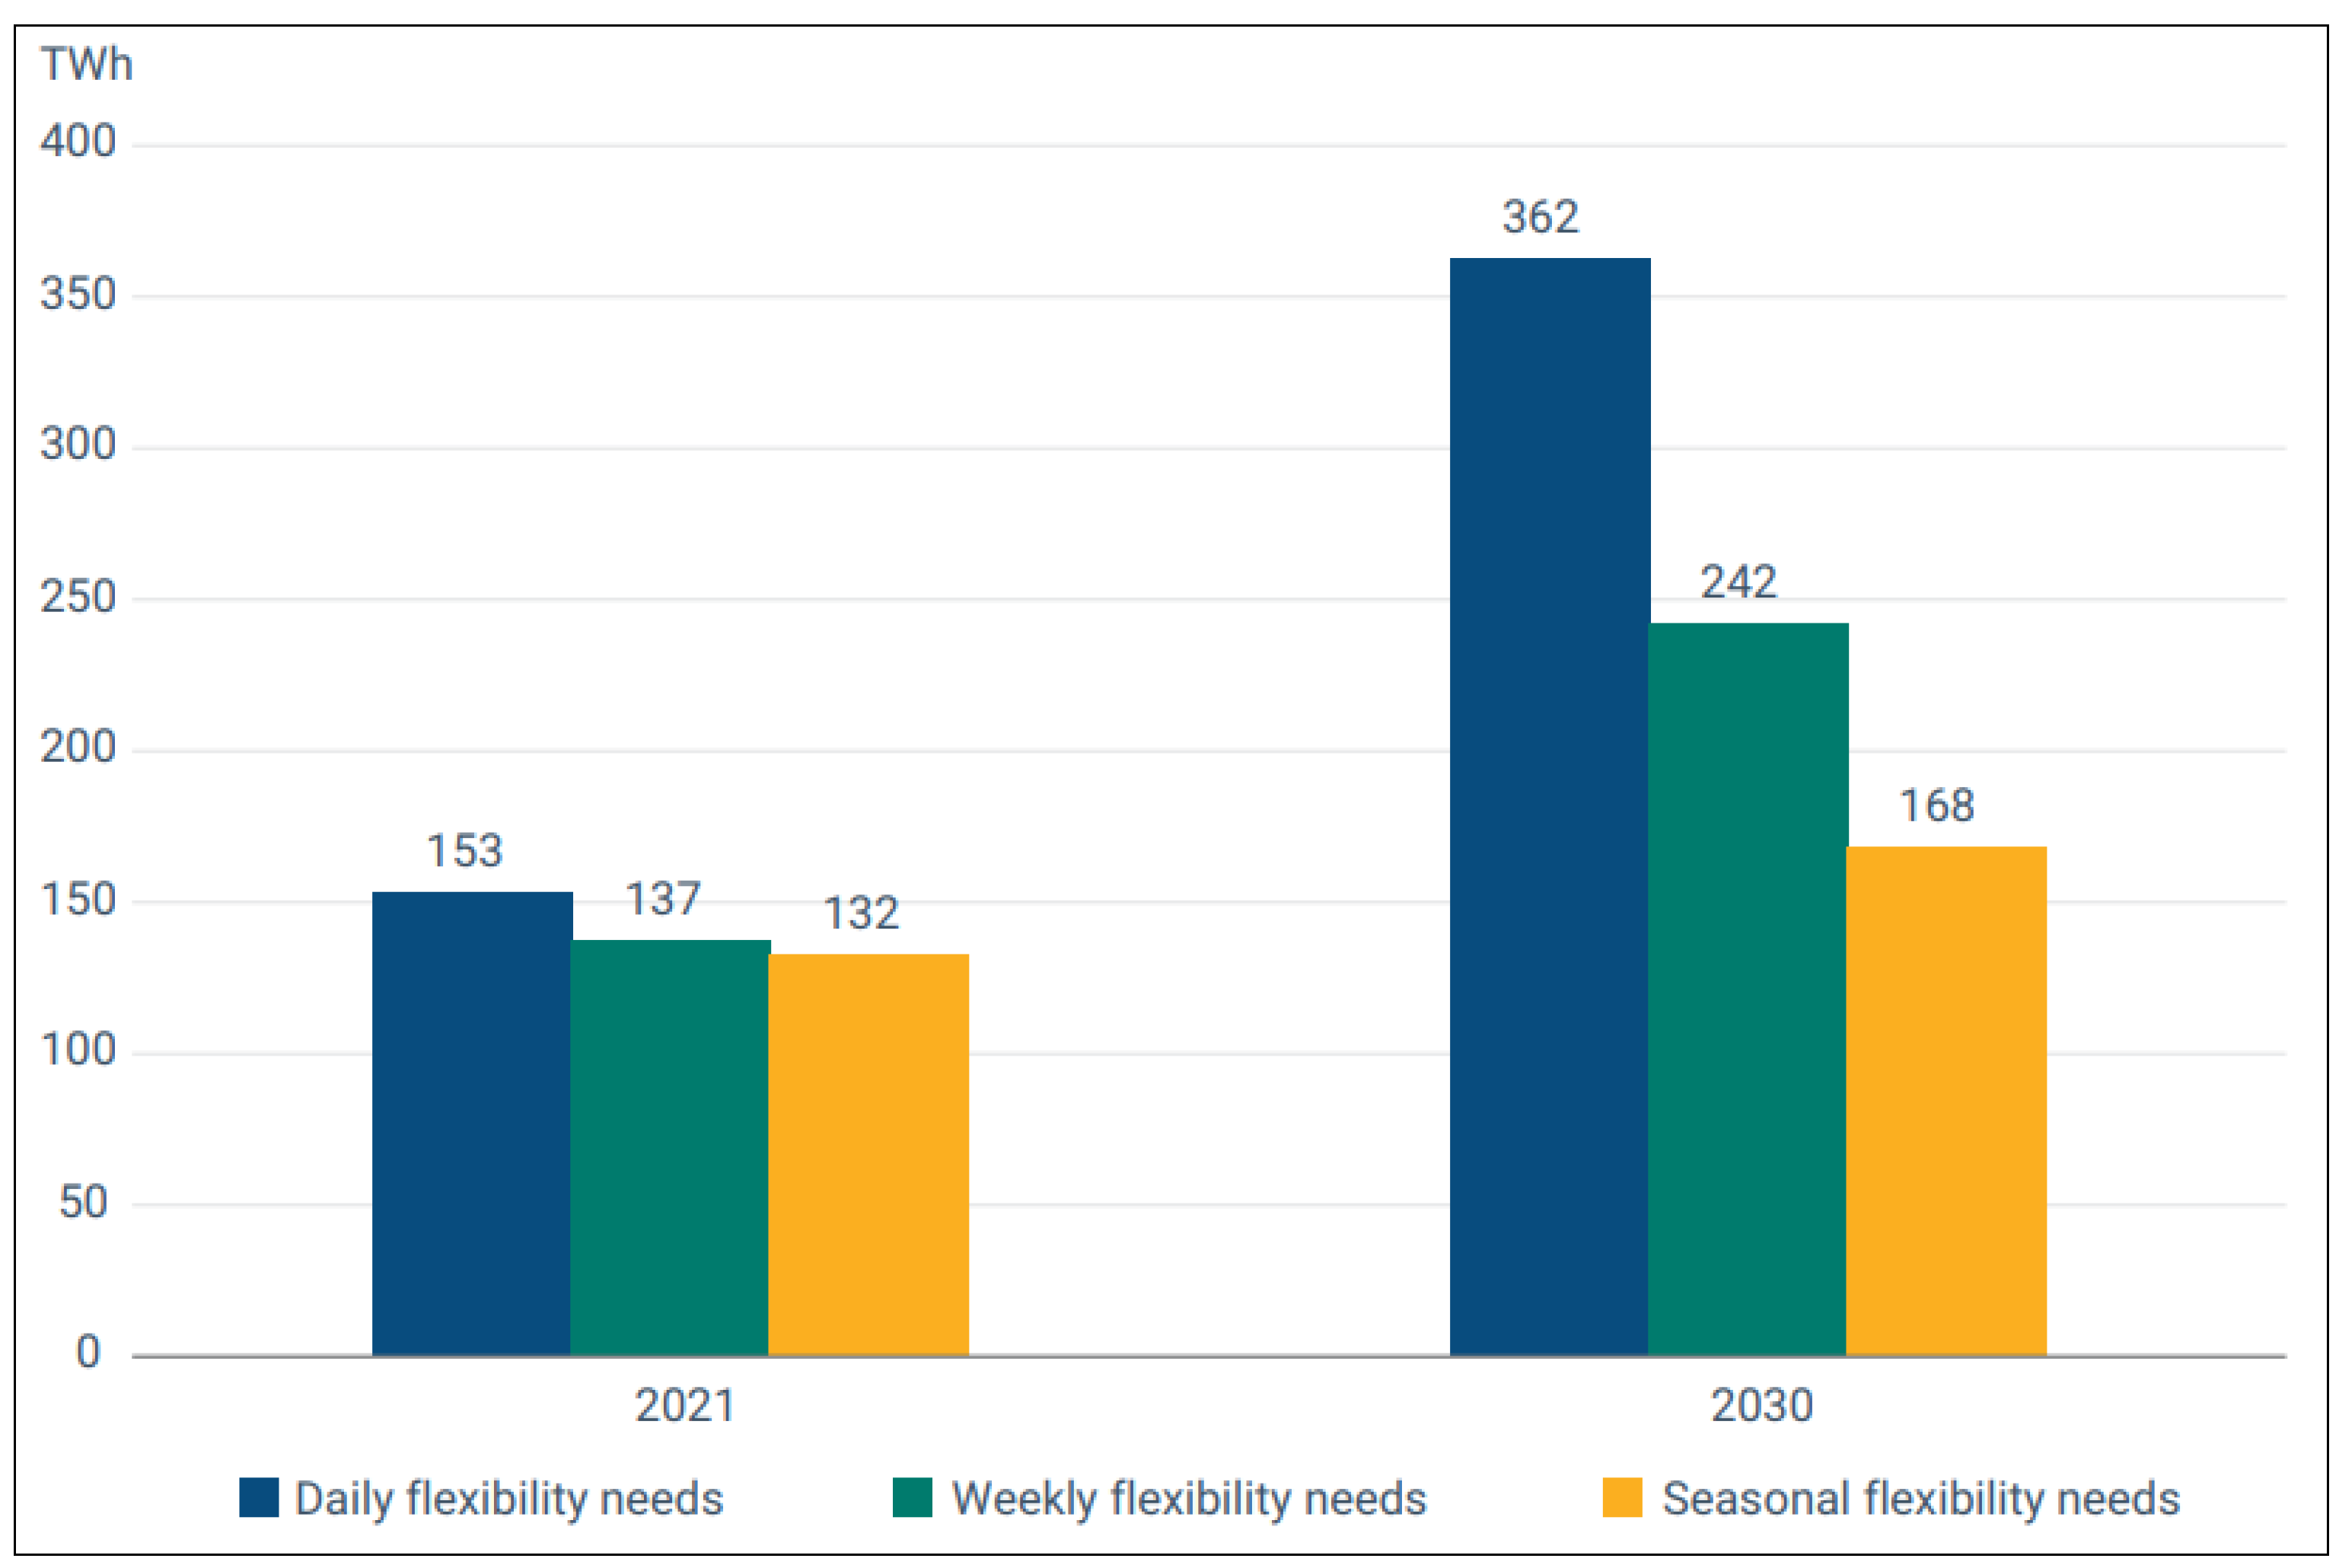
Figure 23.
Missing money problem in ERCOT [86].
Figure 23.
Missing money problem in ERCOT [86].
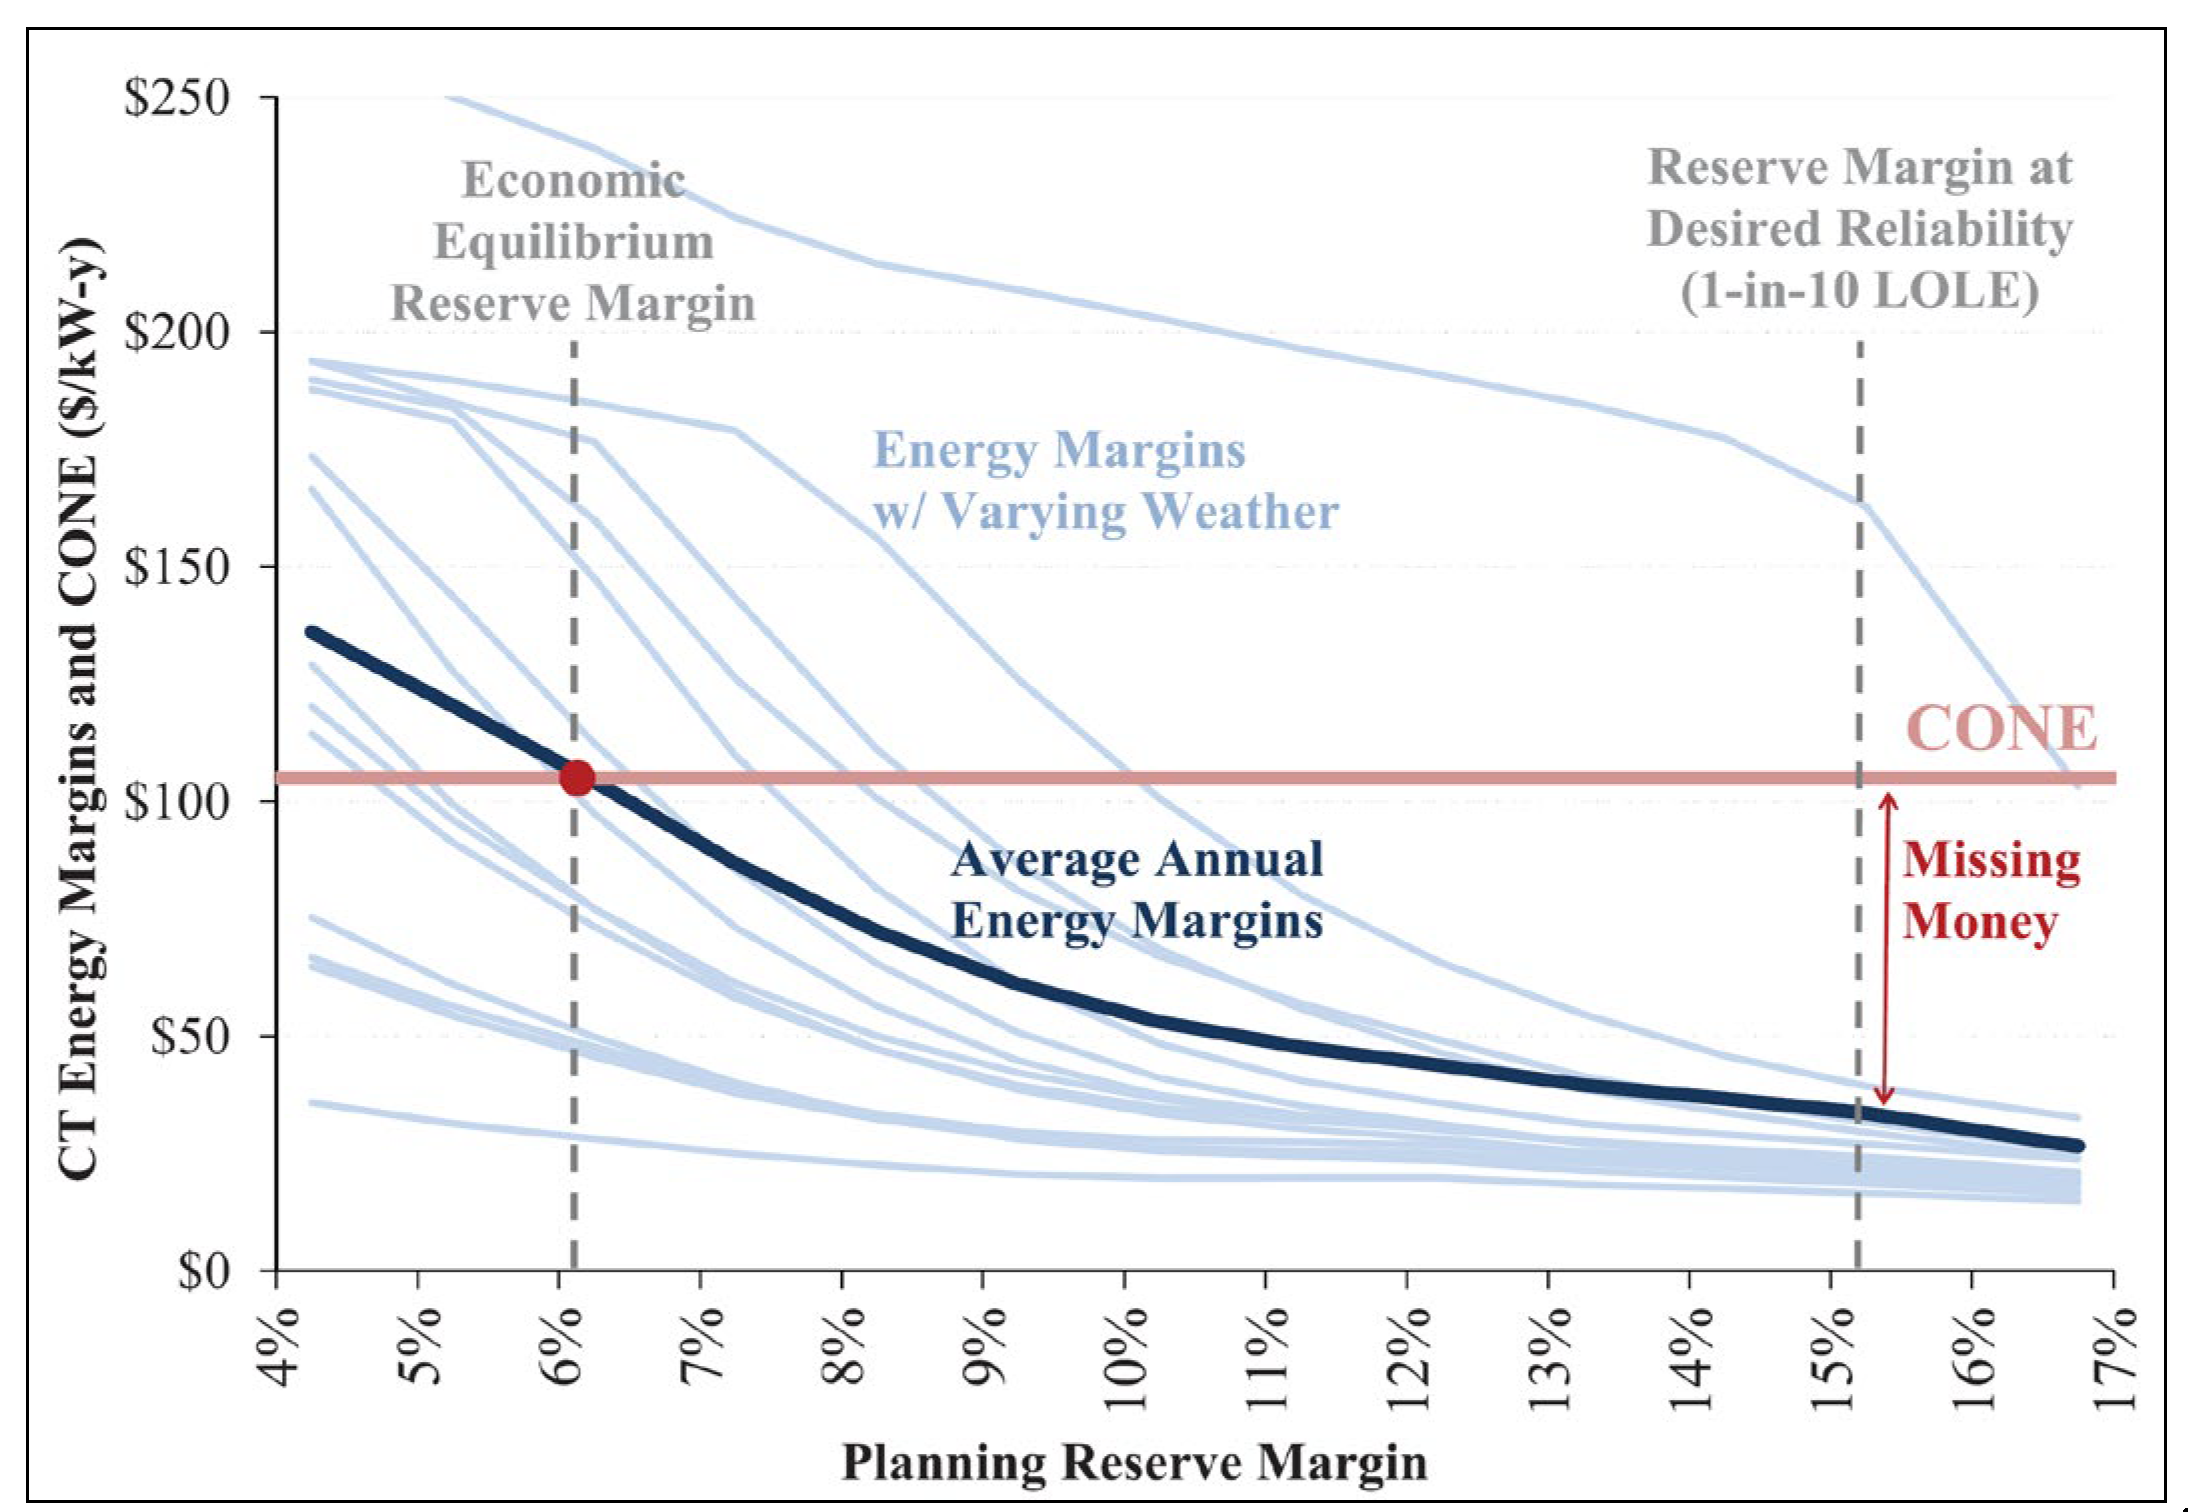
Figure 24.
Capacity Supply Curve in CTBCM Scenario [15].
Figure 24.
Capacity Supply Curve in CTBCM Scenario [15].
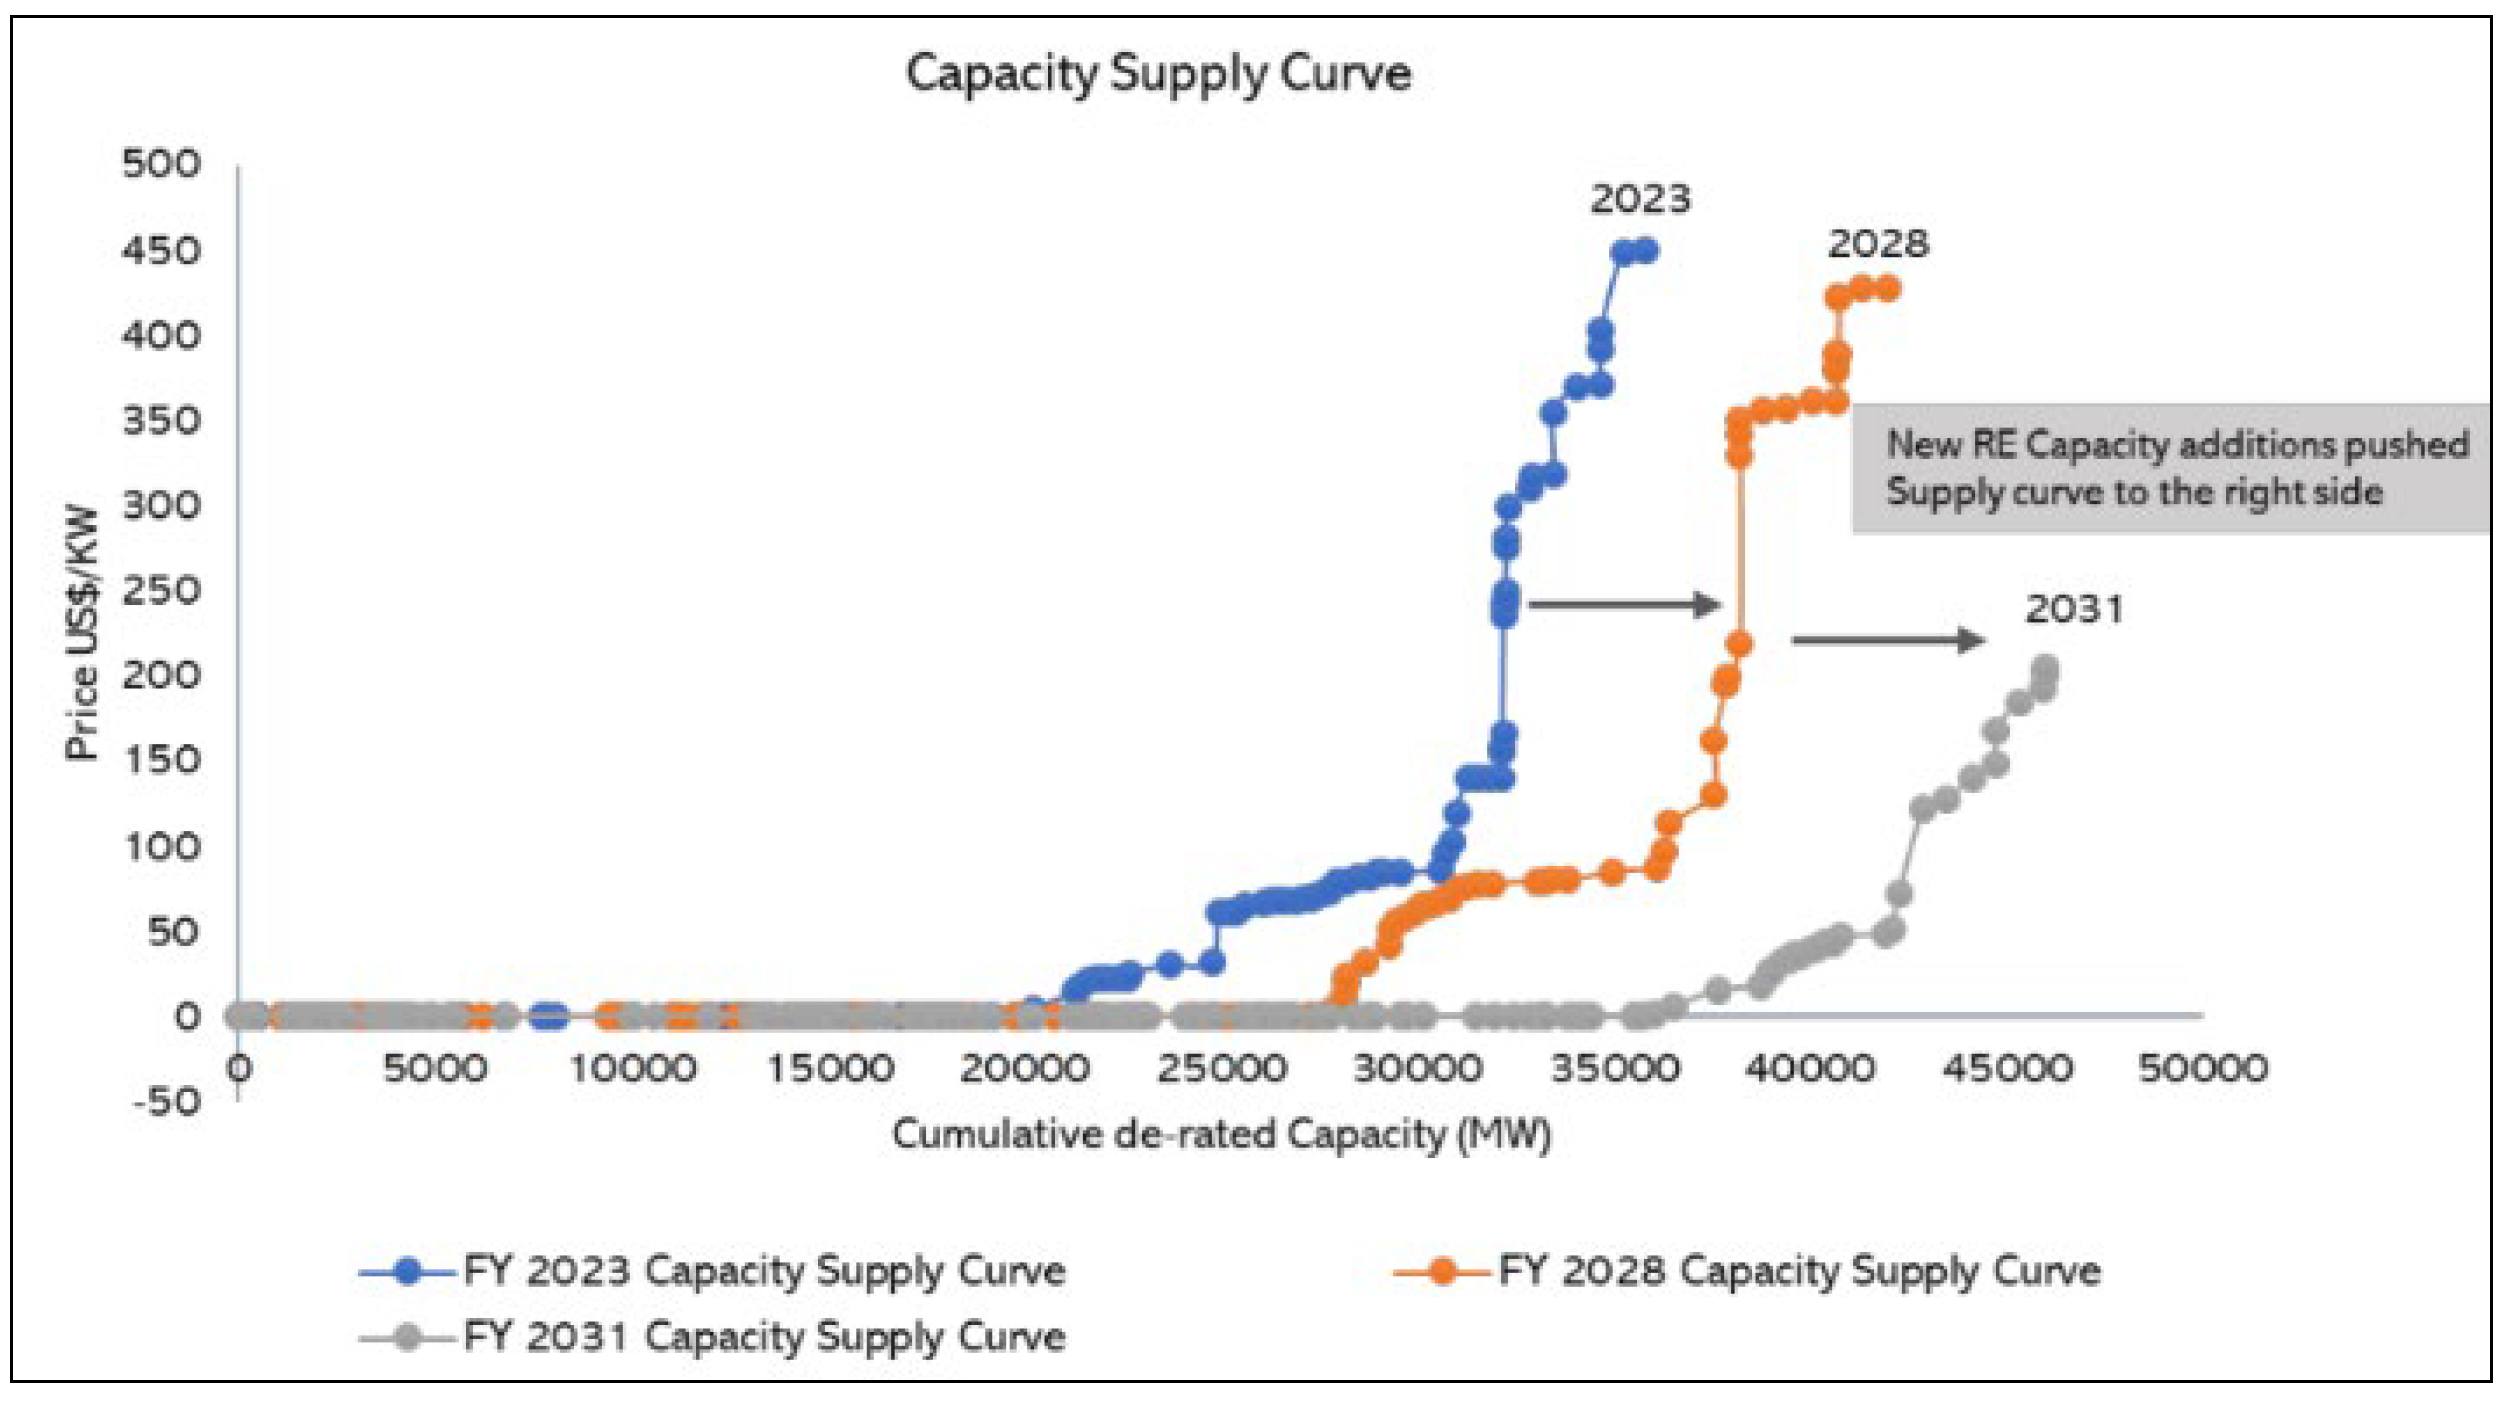
Figure 25.
Hybrid renewables generation [88].
Figure 25.
Hybrid renewables generation [88].
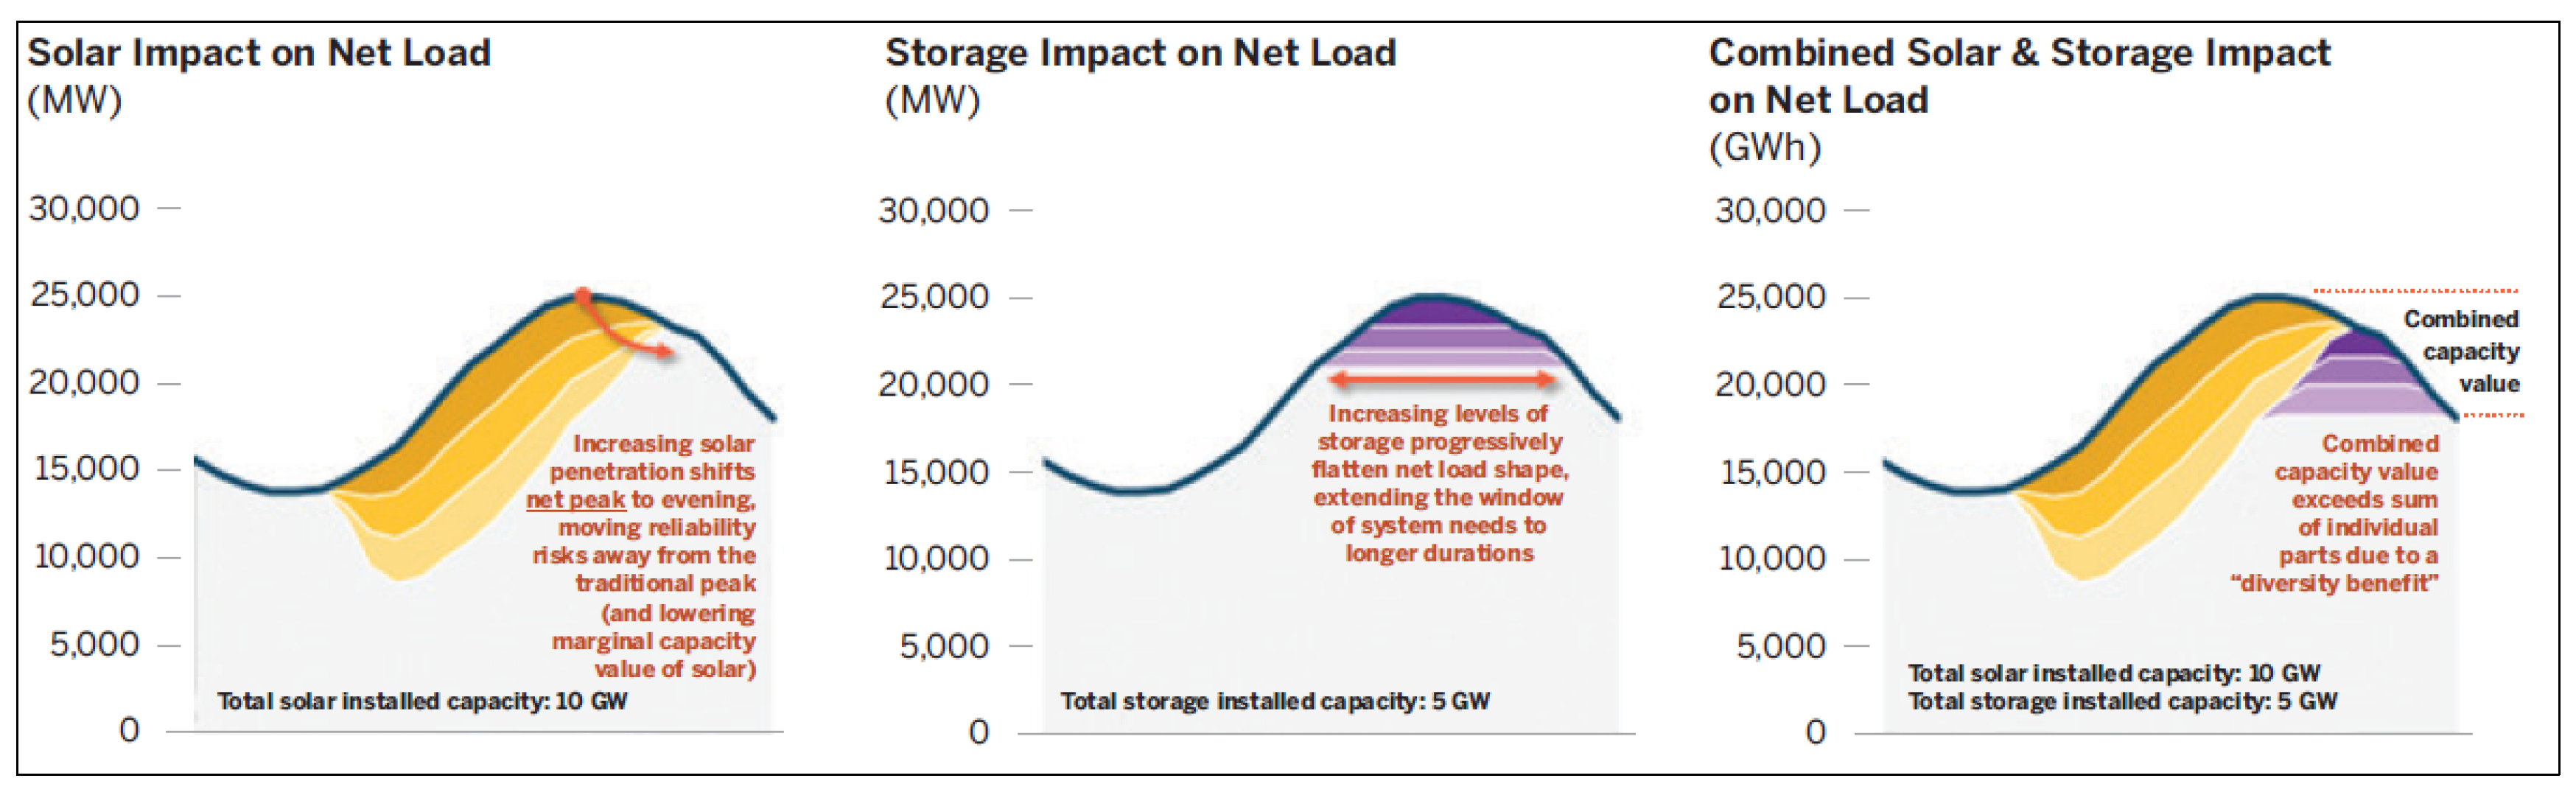
Figure 26.
Effects of capacity value on Net-Cone.
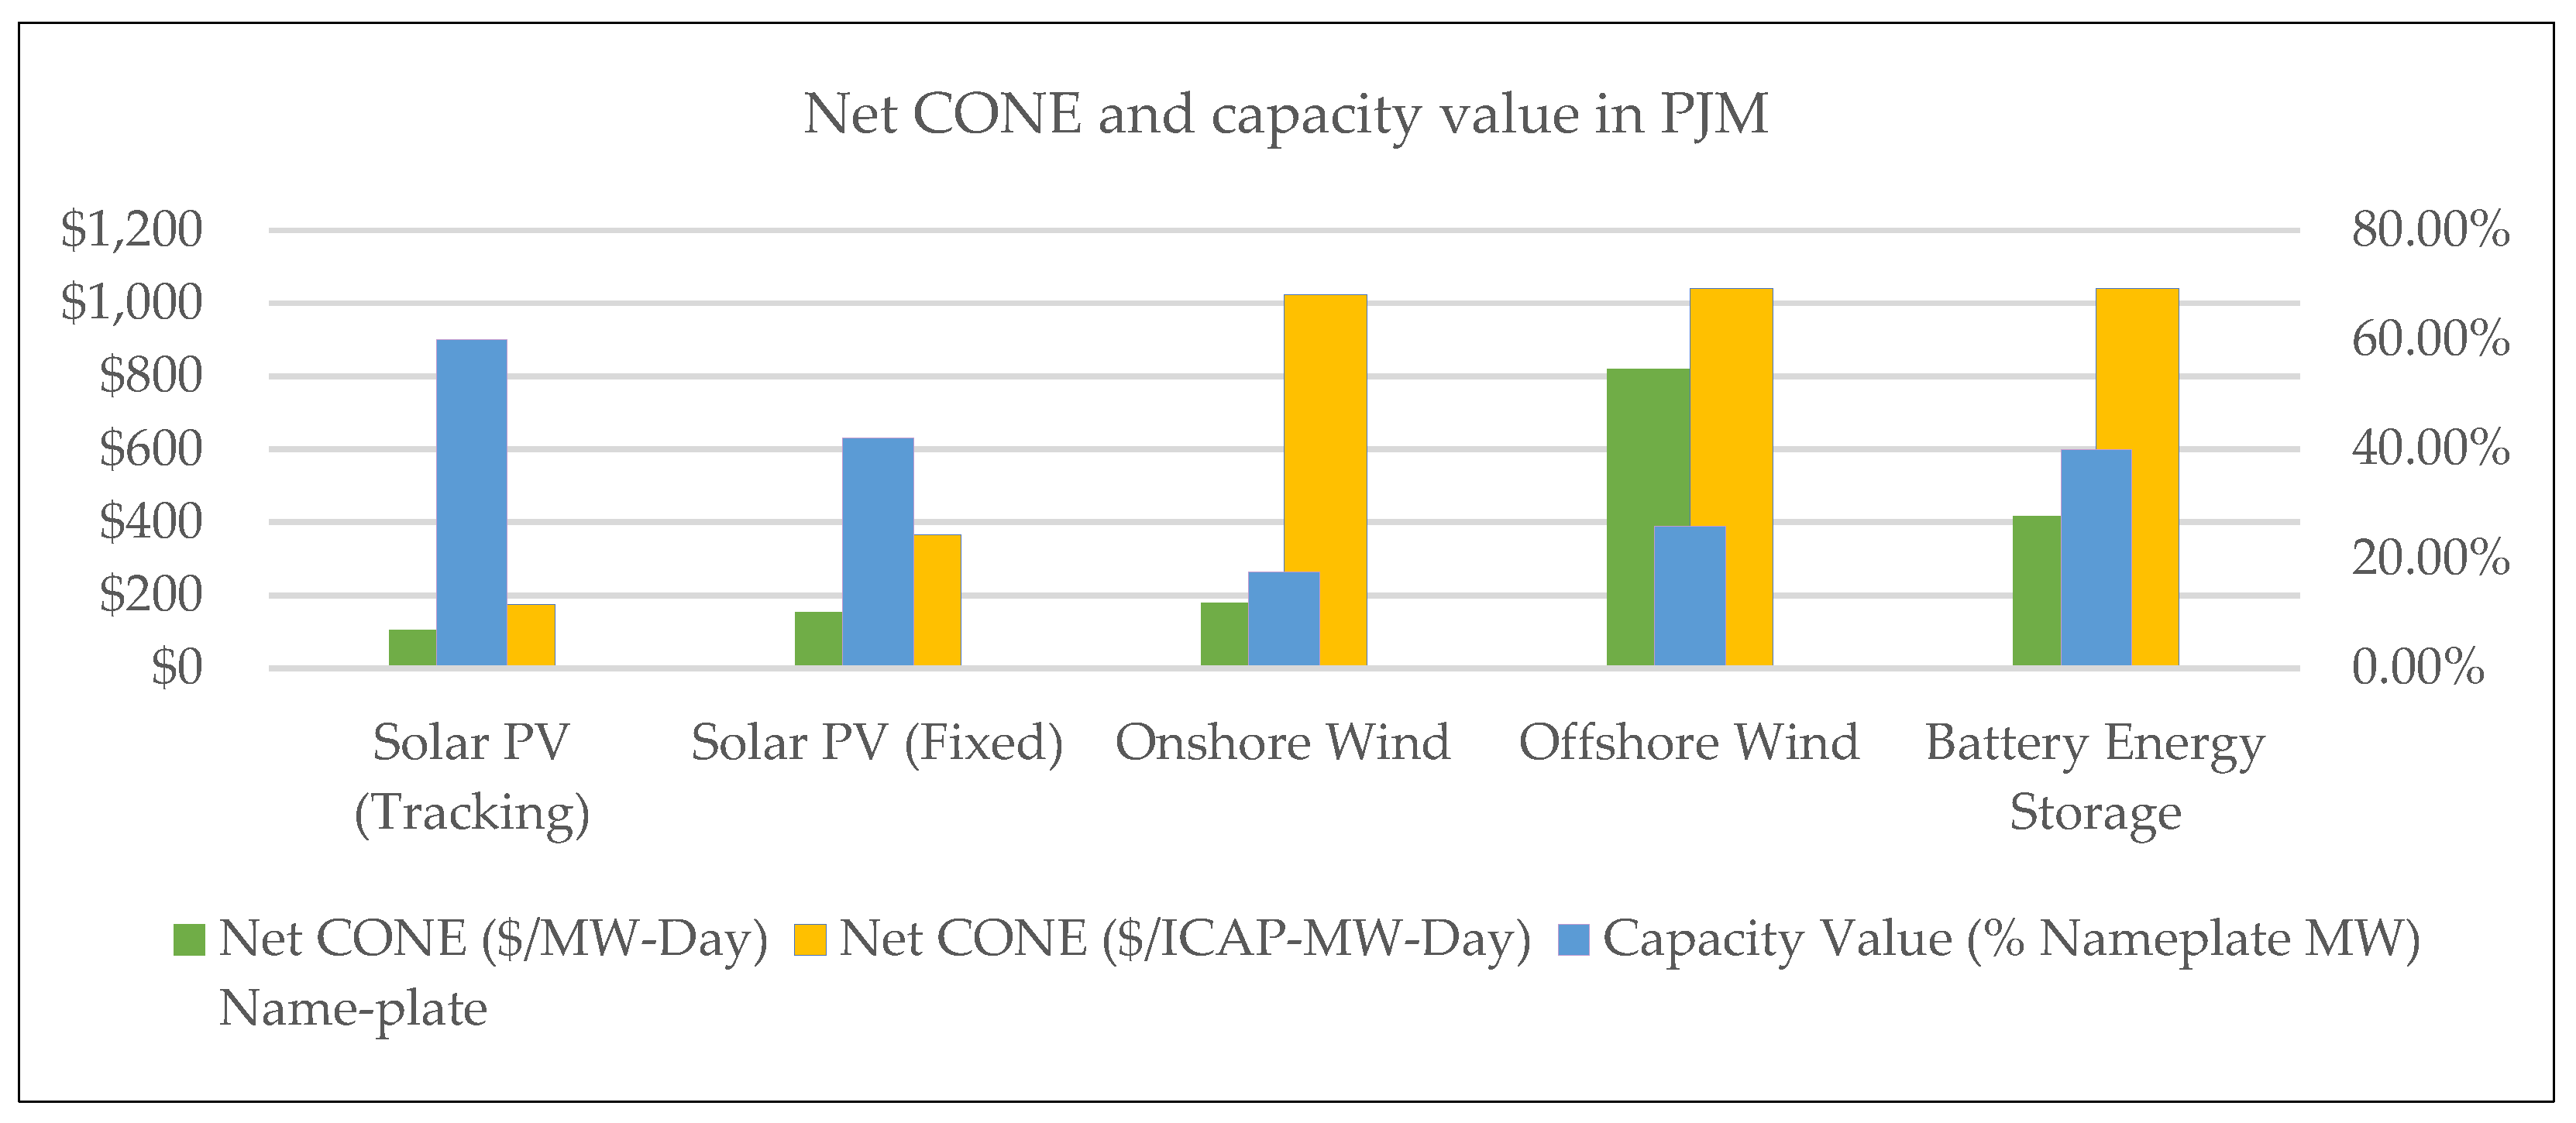
Figure 27.
Availability factors for determining capacity provision of different generation.
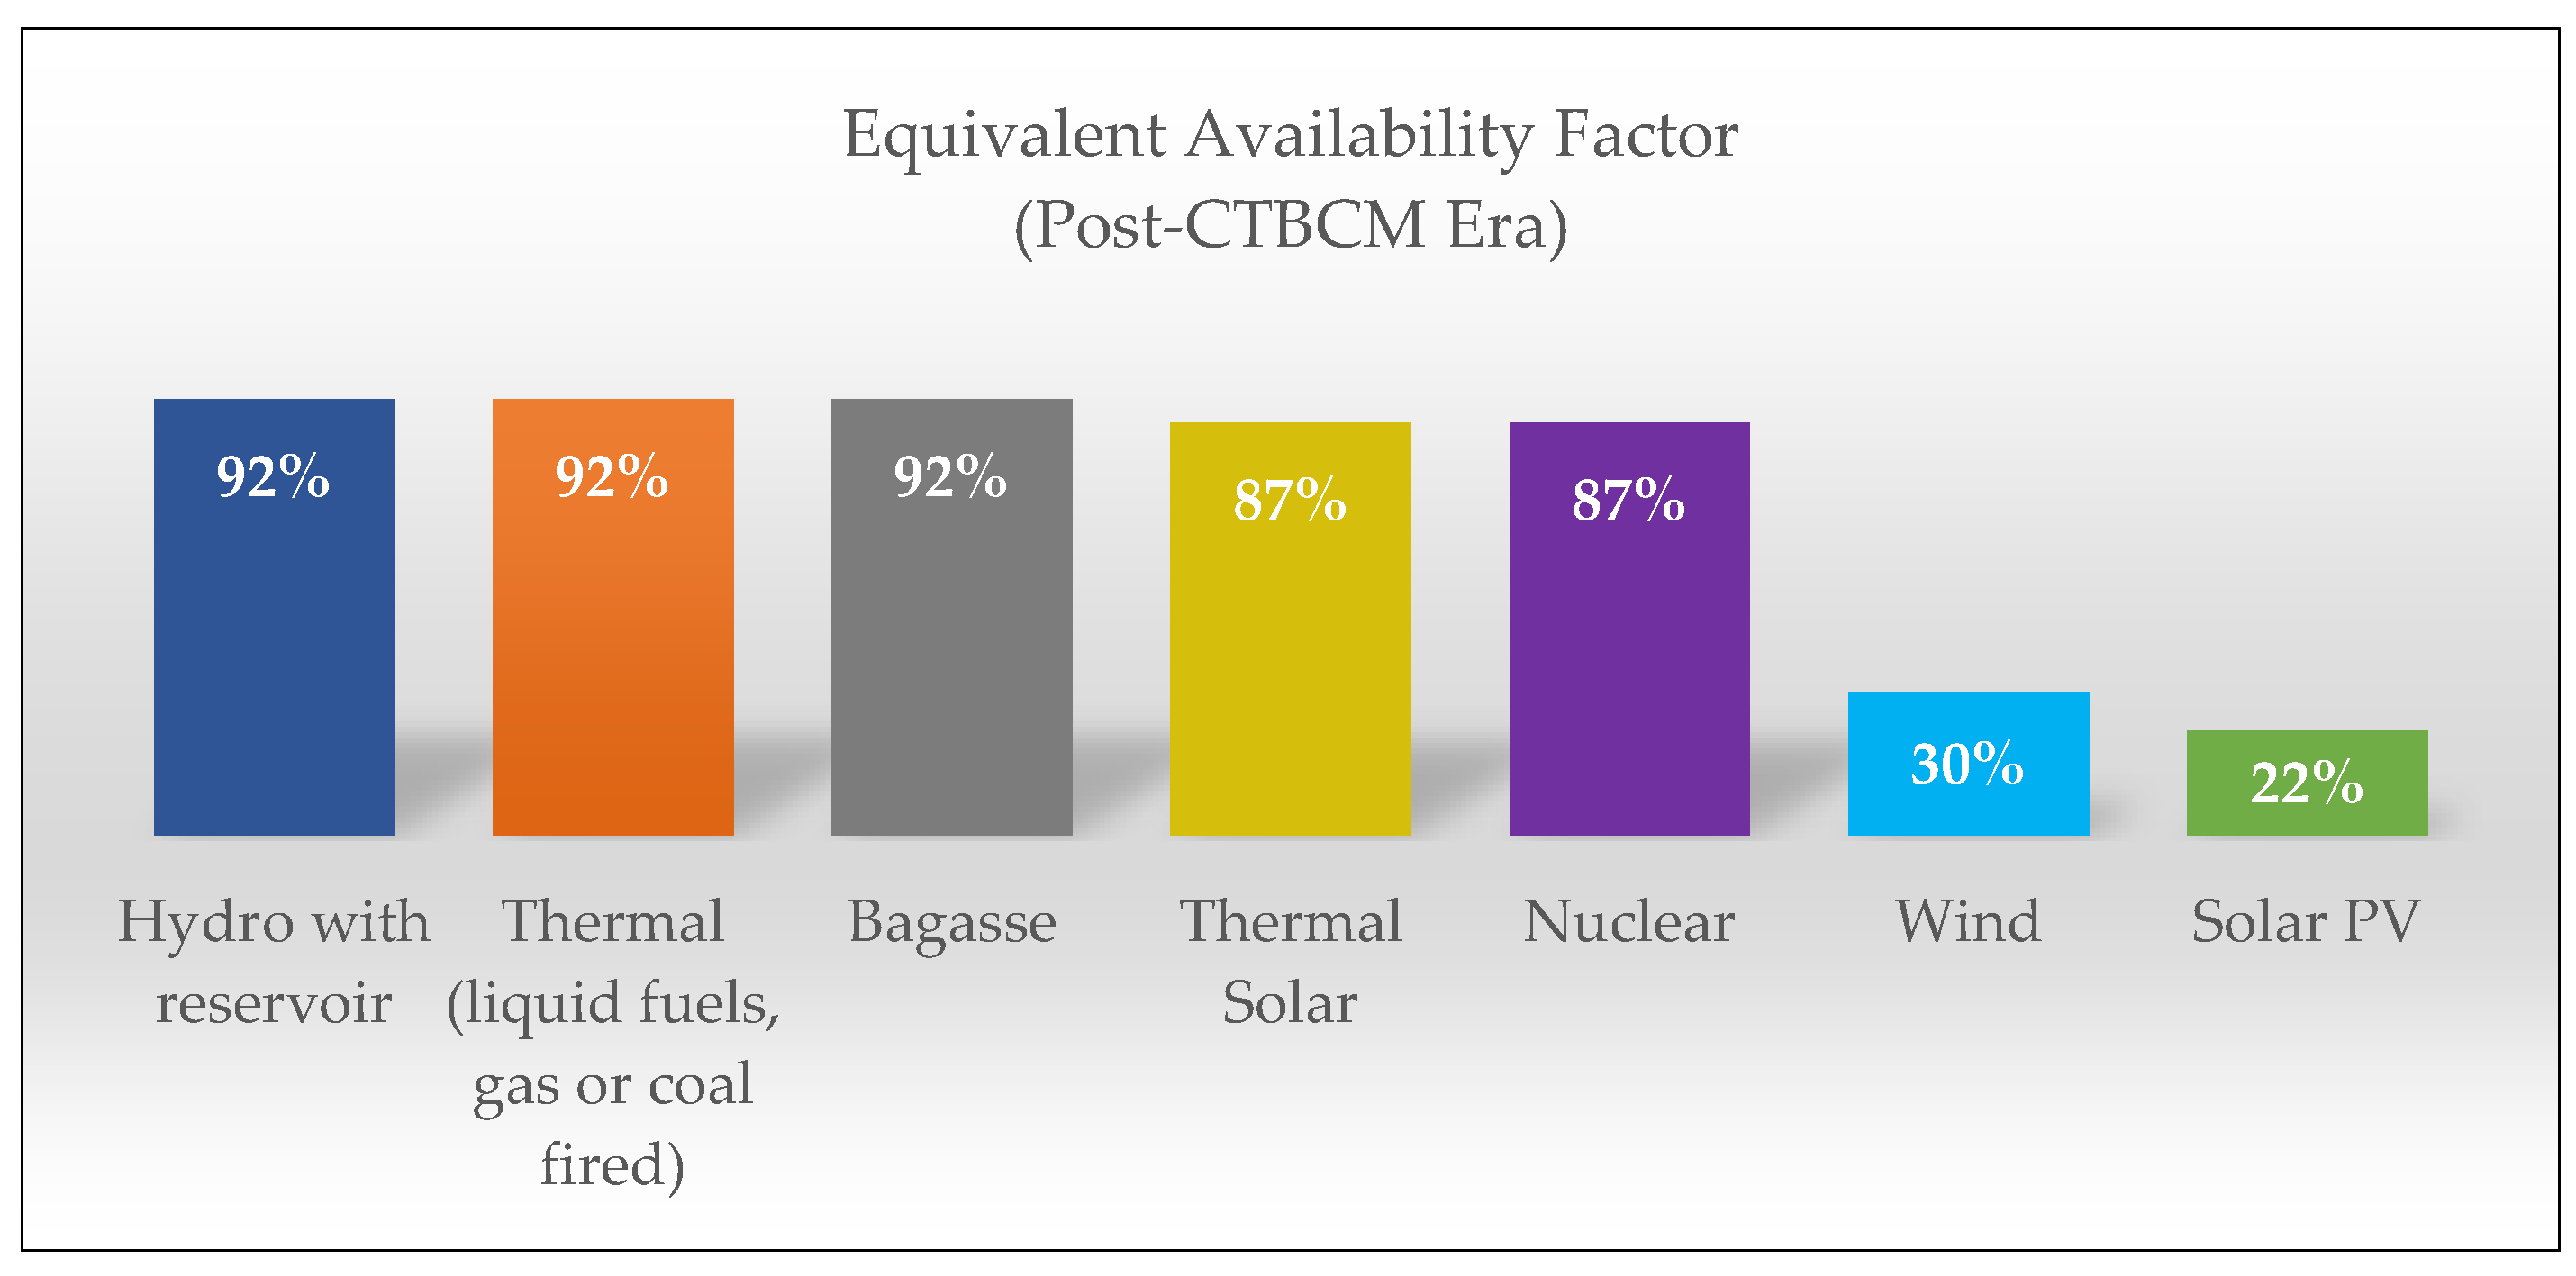
Figure 28.
The ELCC class ratings in different regions of US.
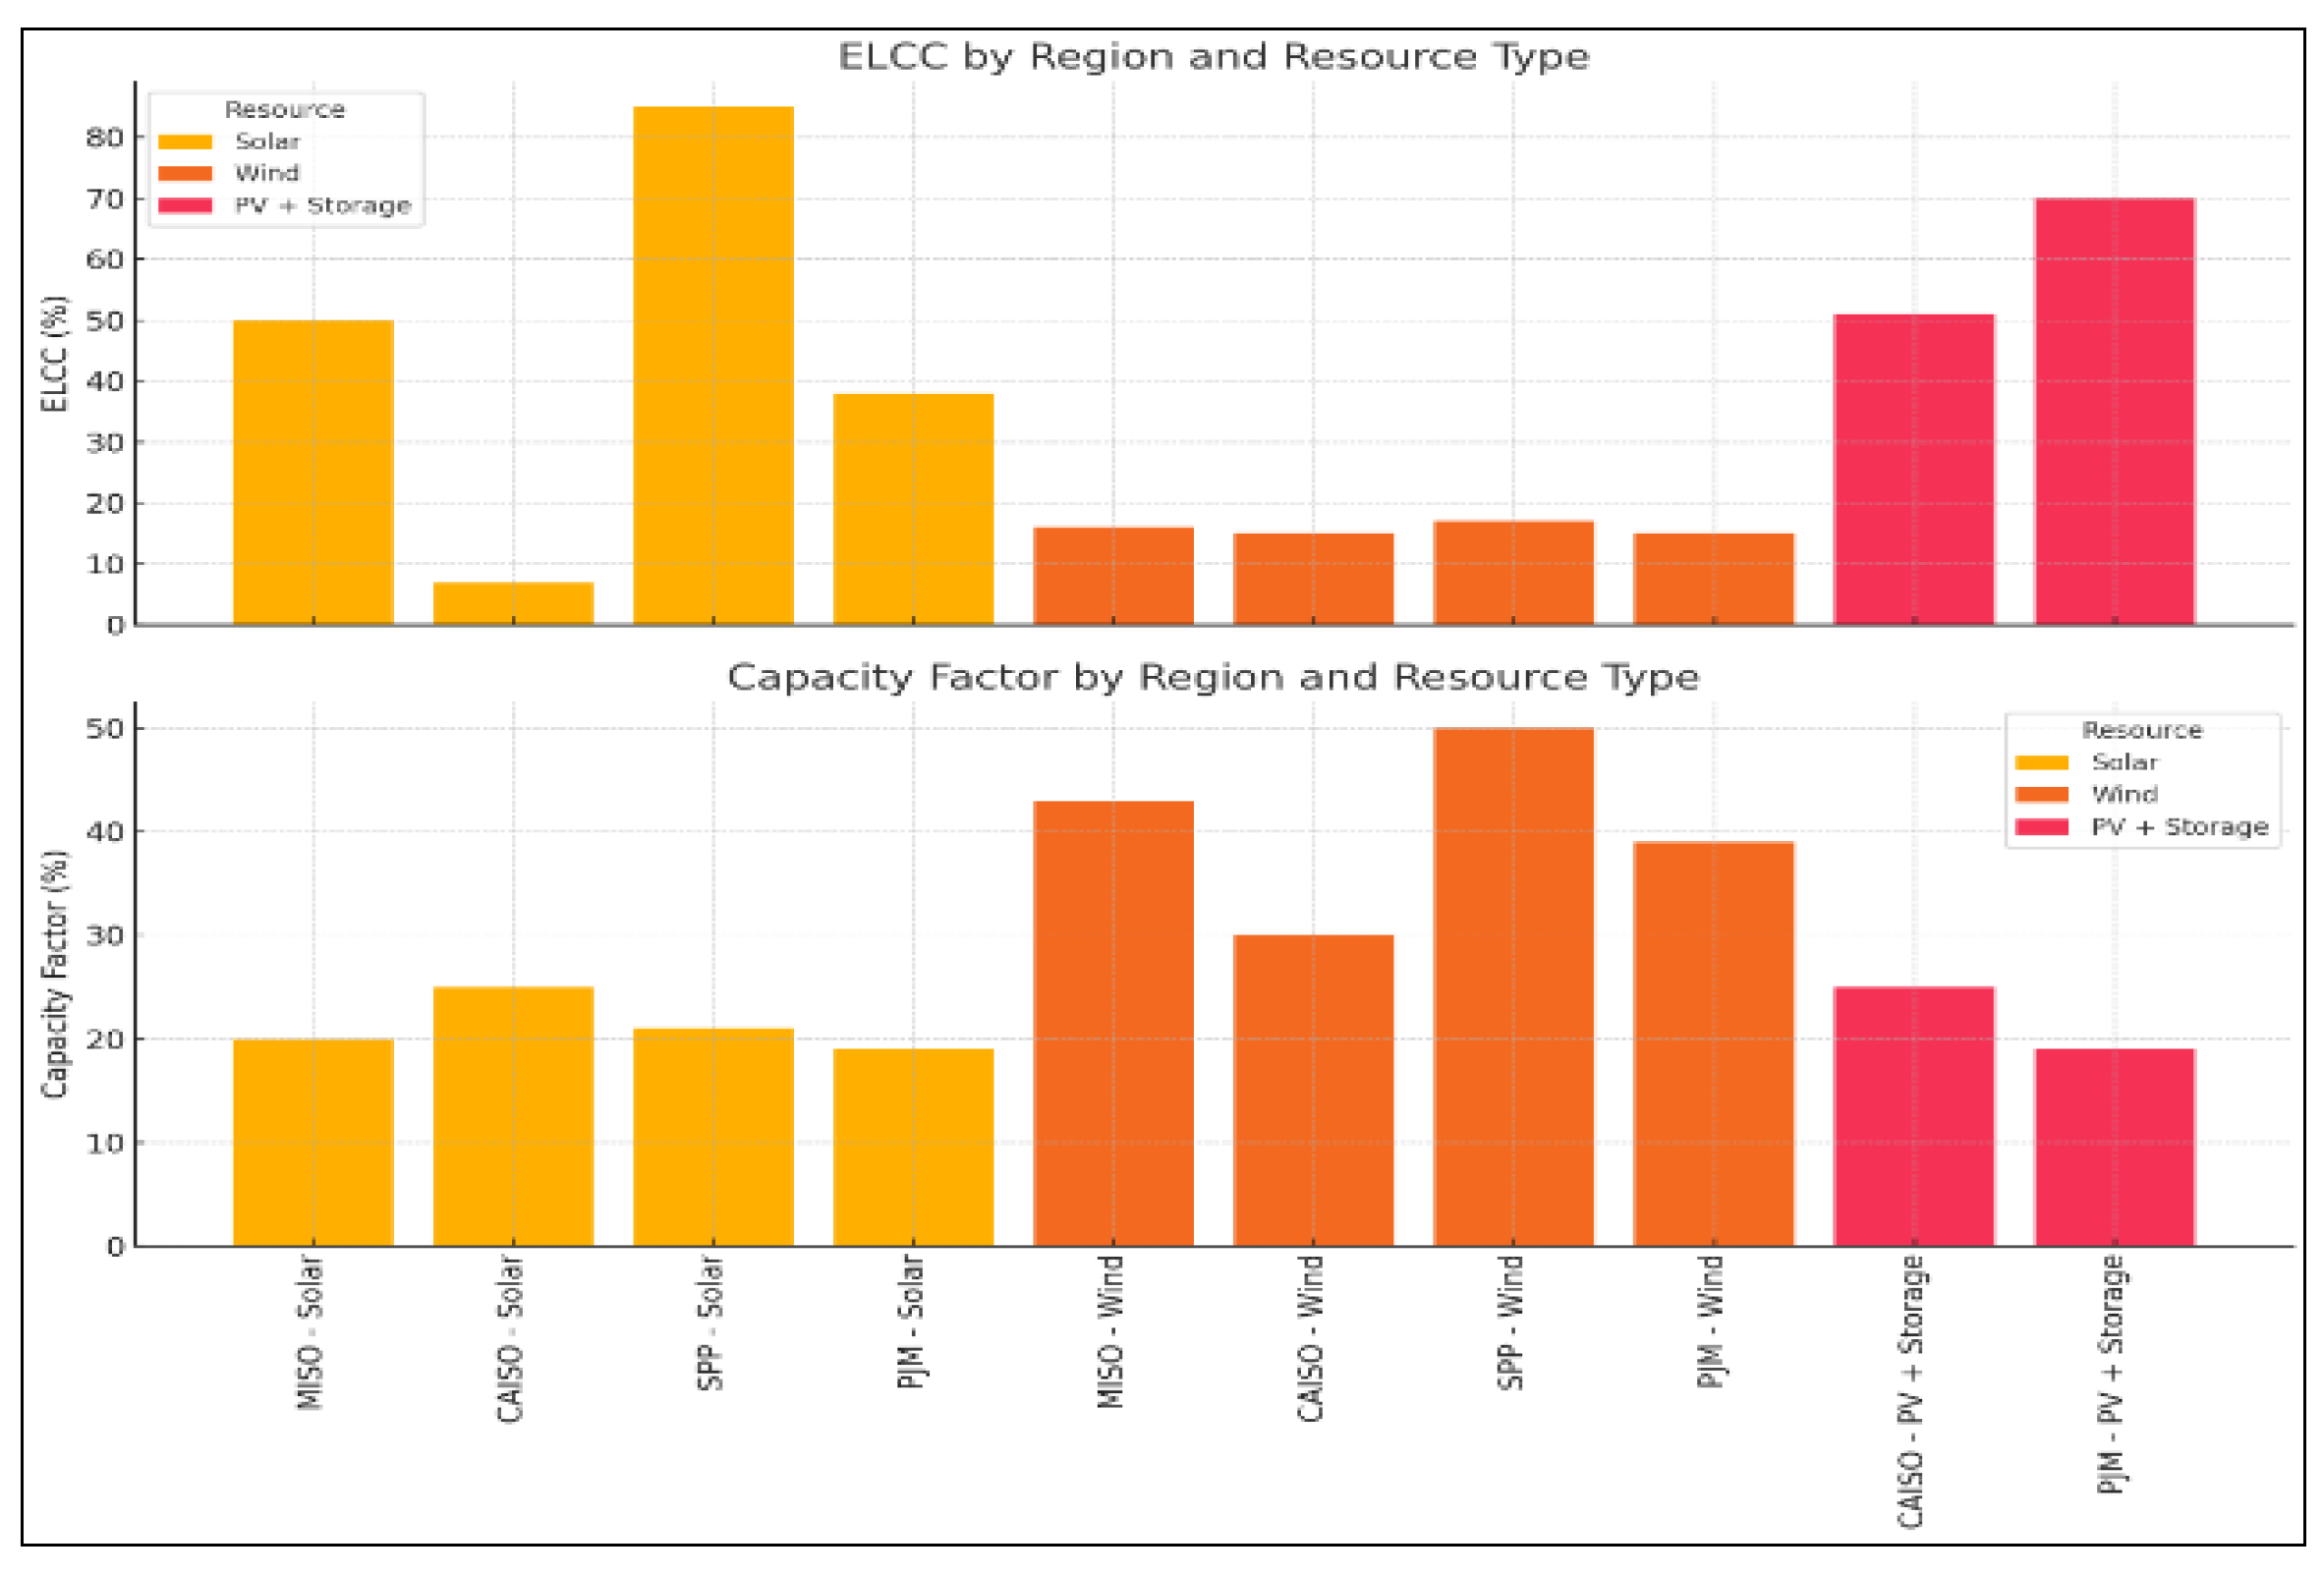
Figure 30.
Average Total System Capital Costs of Utility-Scale Batteries Globally and in Key Markets from 2020 to 2050 [93].
Figure 30.
Average Total System Capital Costs of Utility-Scale Batteries Globally and in Key Markets from 2020 to 2050 [93].
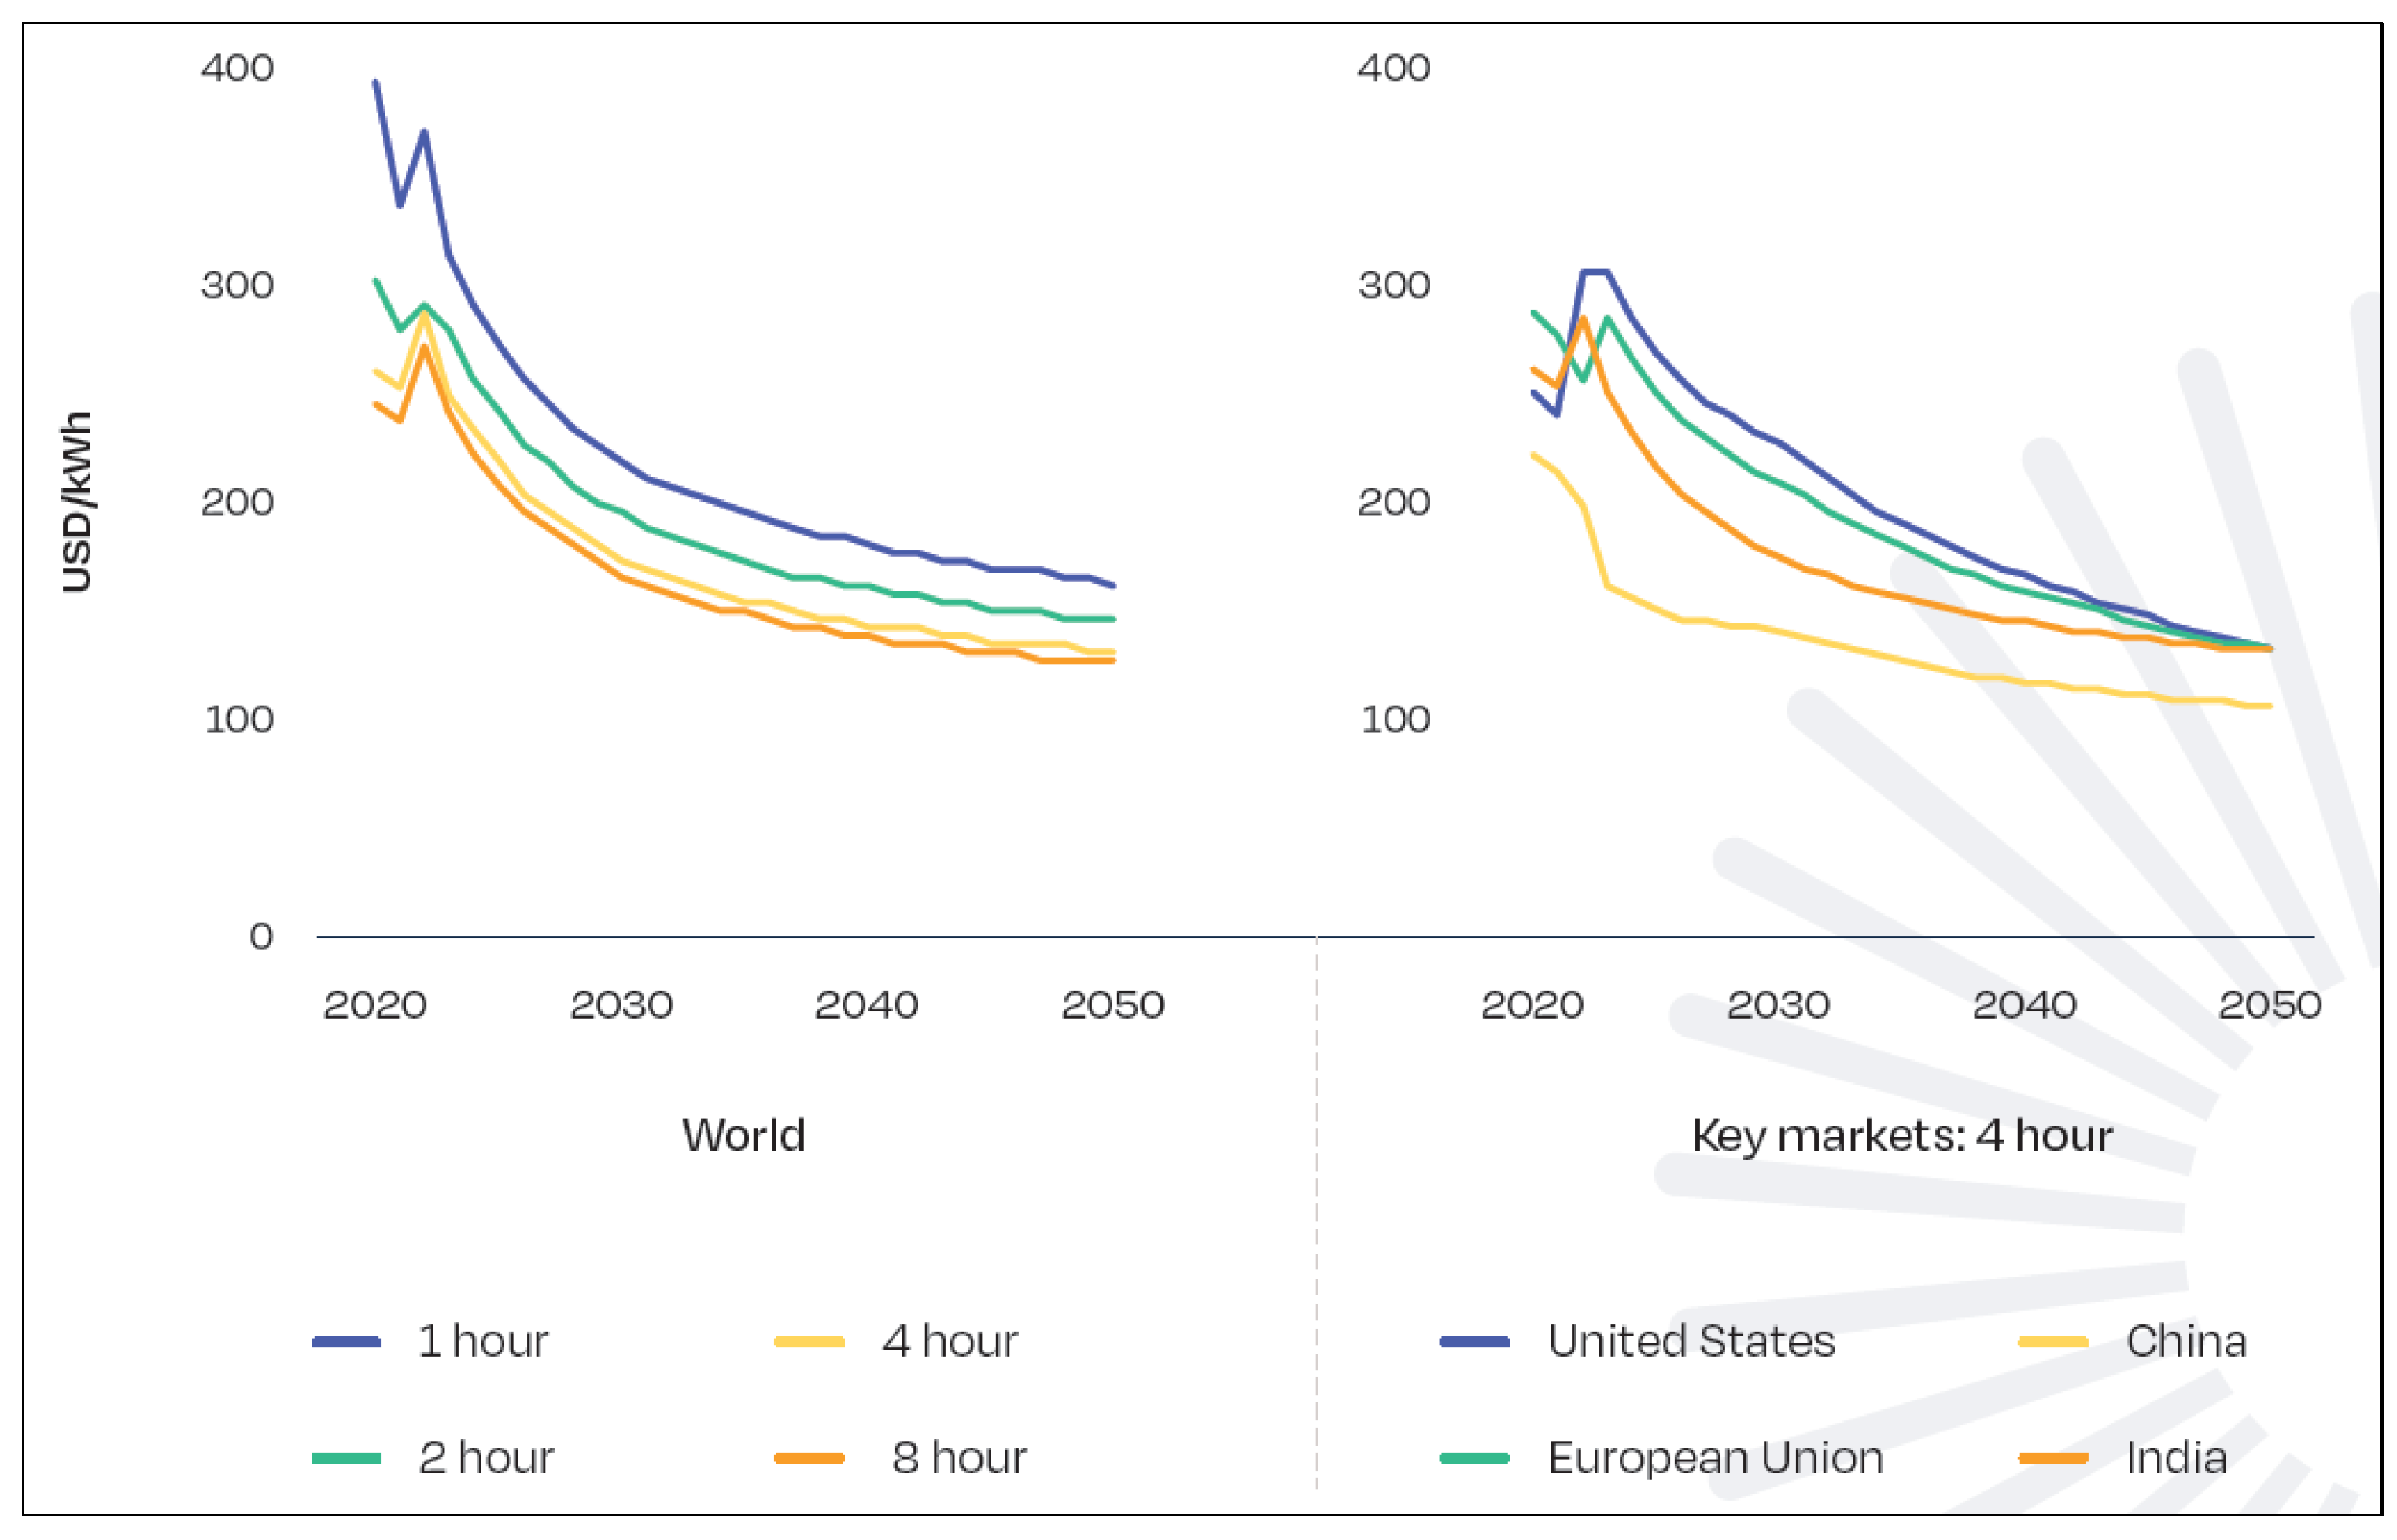
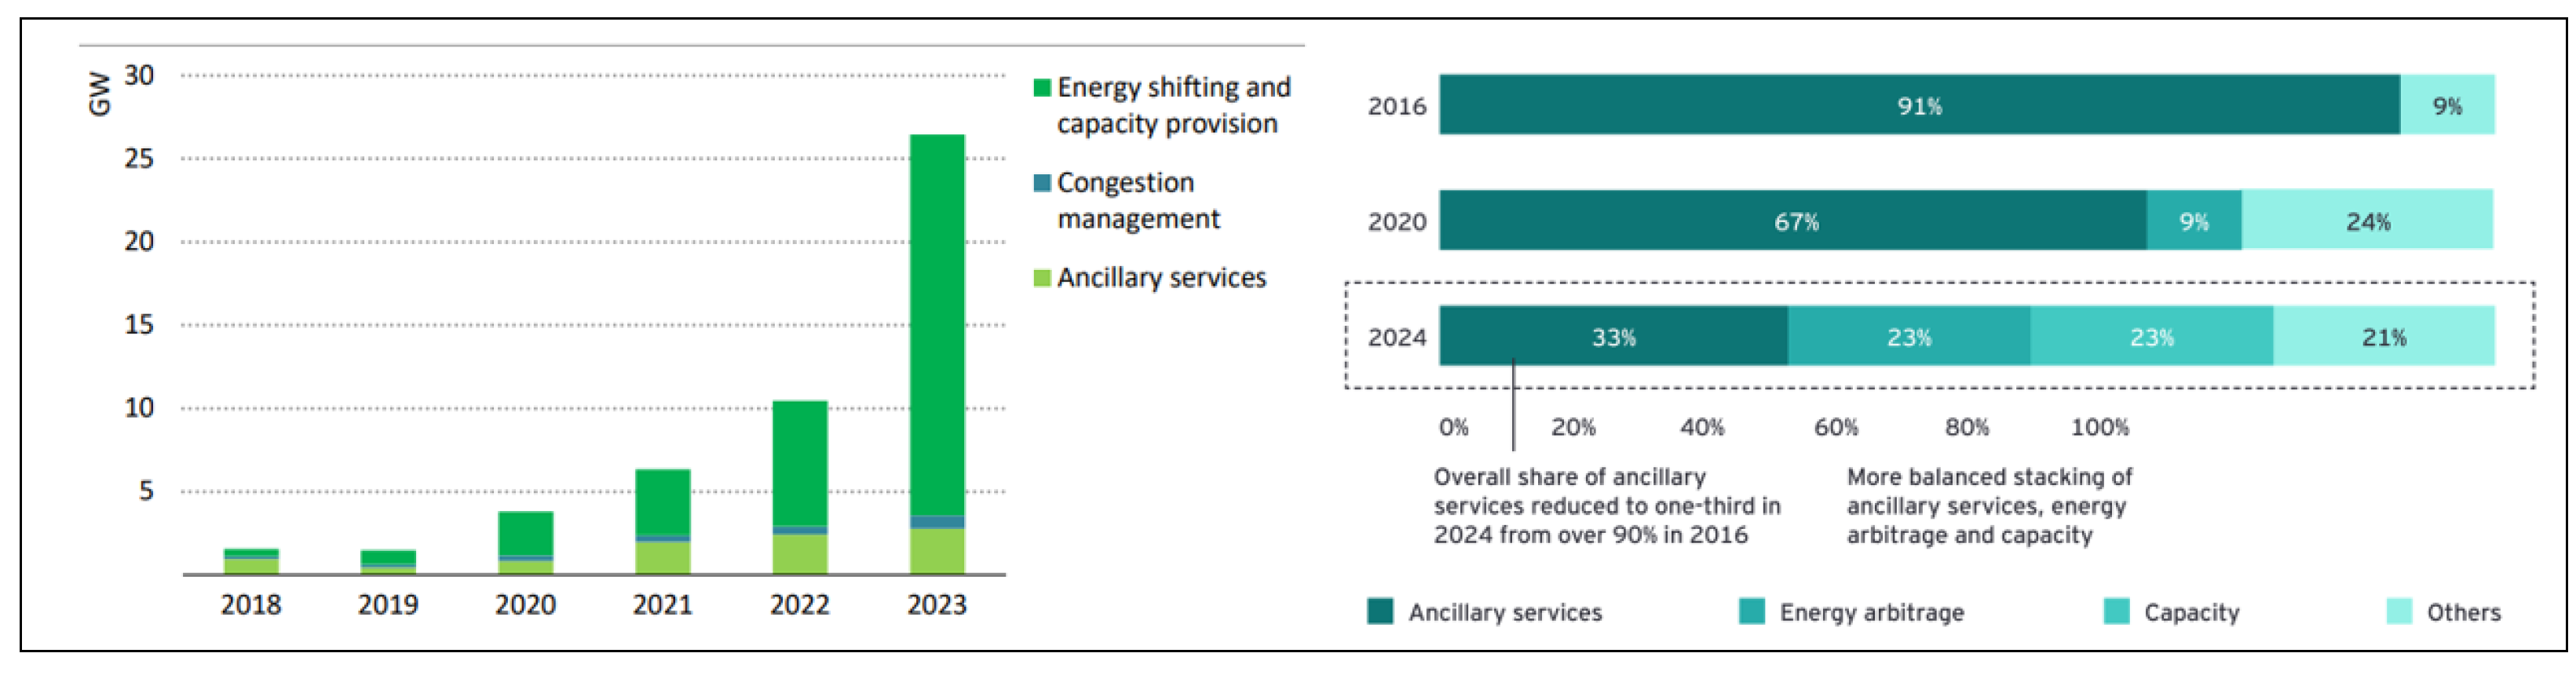
Figure 32.
Installed capacity by sources [94].
Figure 32.
Installed capacity by sources [94].
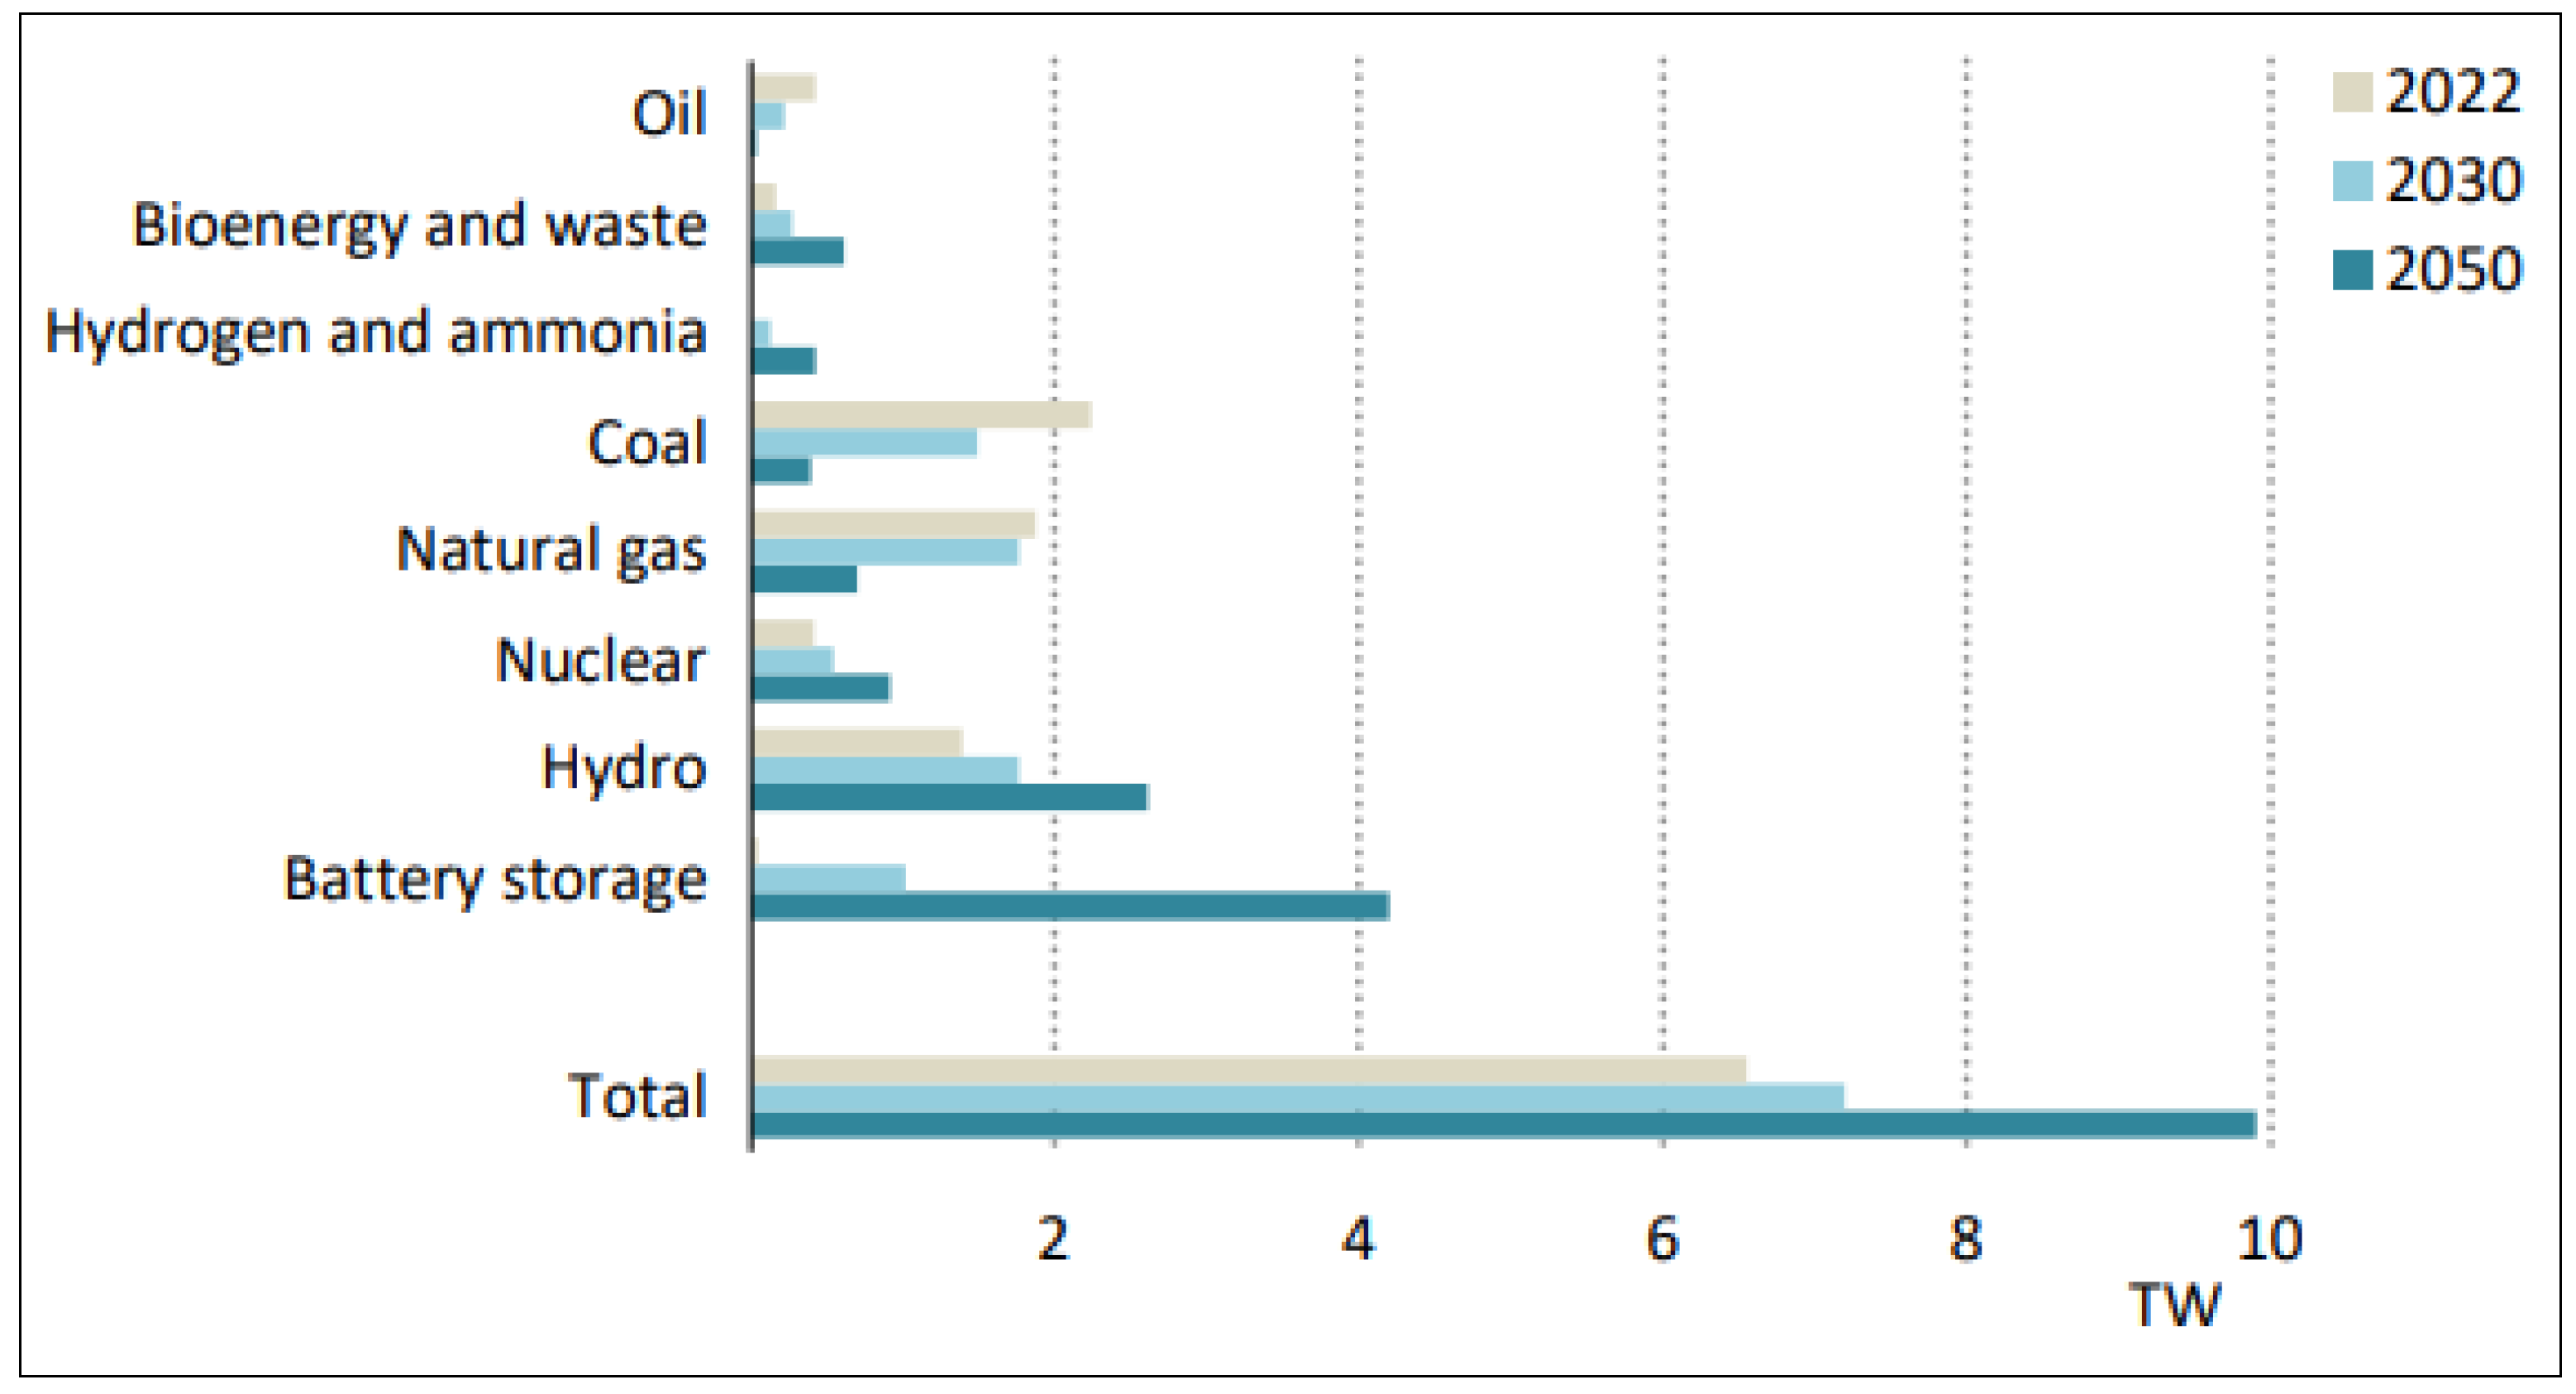
Figure 33.
Figure 3 Overall US storage past trends and future outlook (left) and region wise battery installed capacity (right).
Figure 33.
Figure 3 Overall US storage past trends and future outlook (left) and region wise battery installed capacity (right).
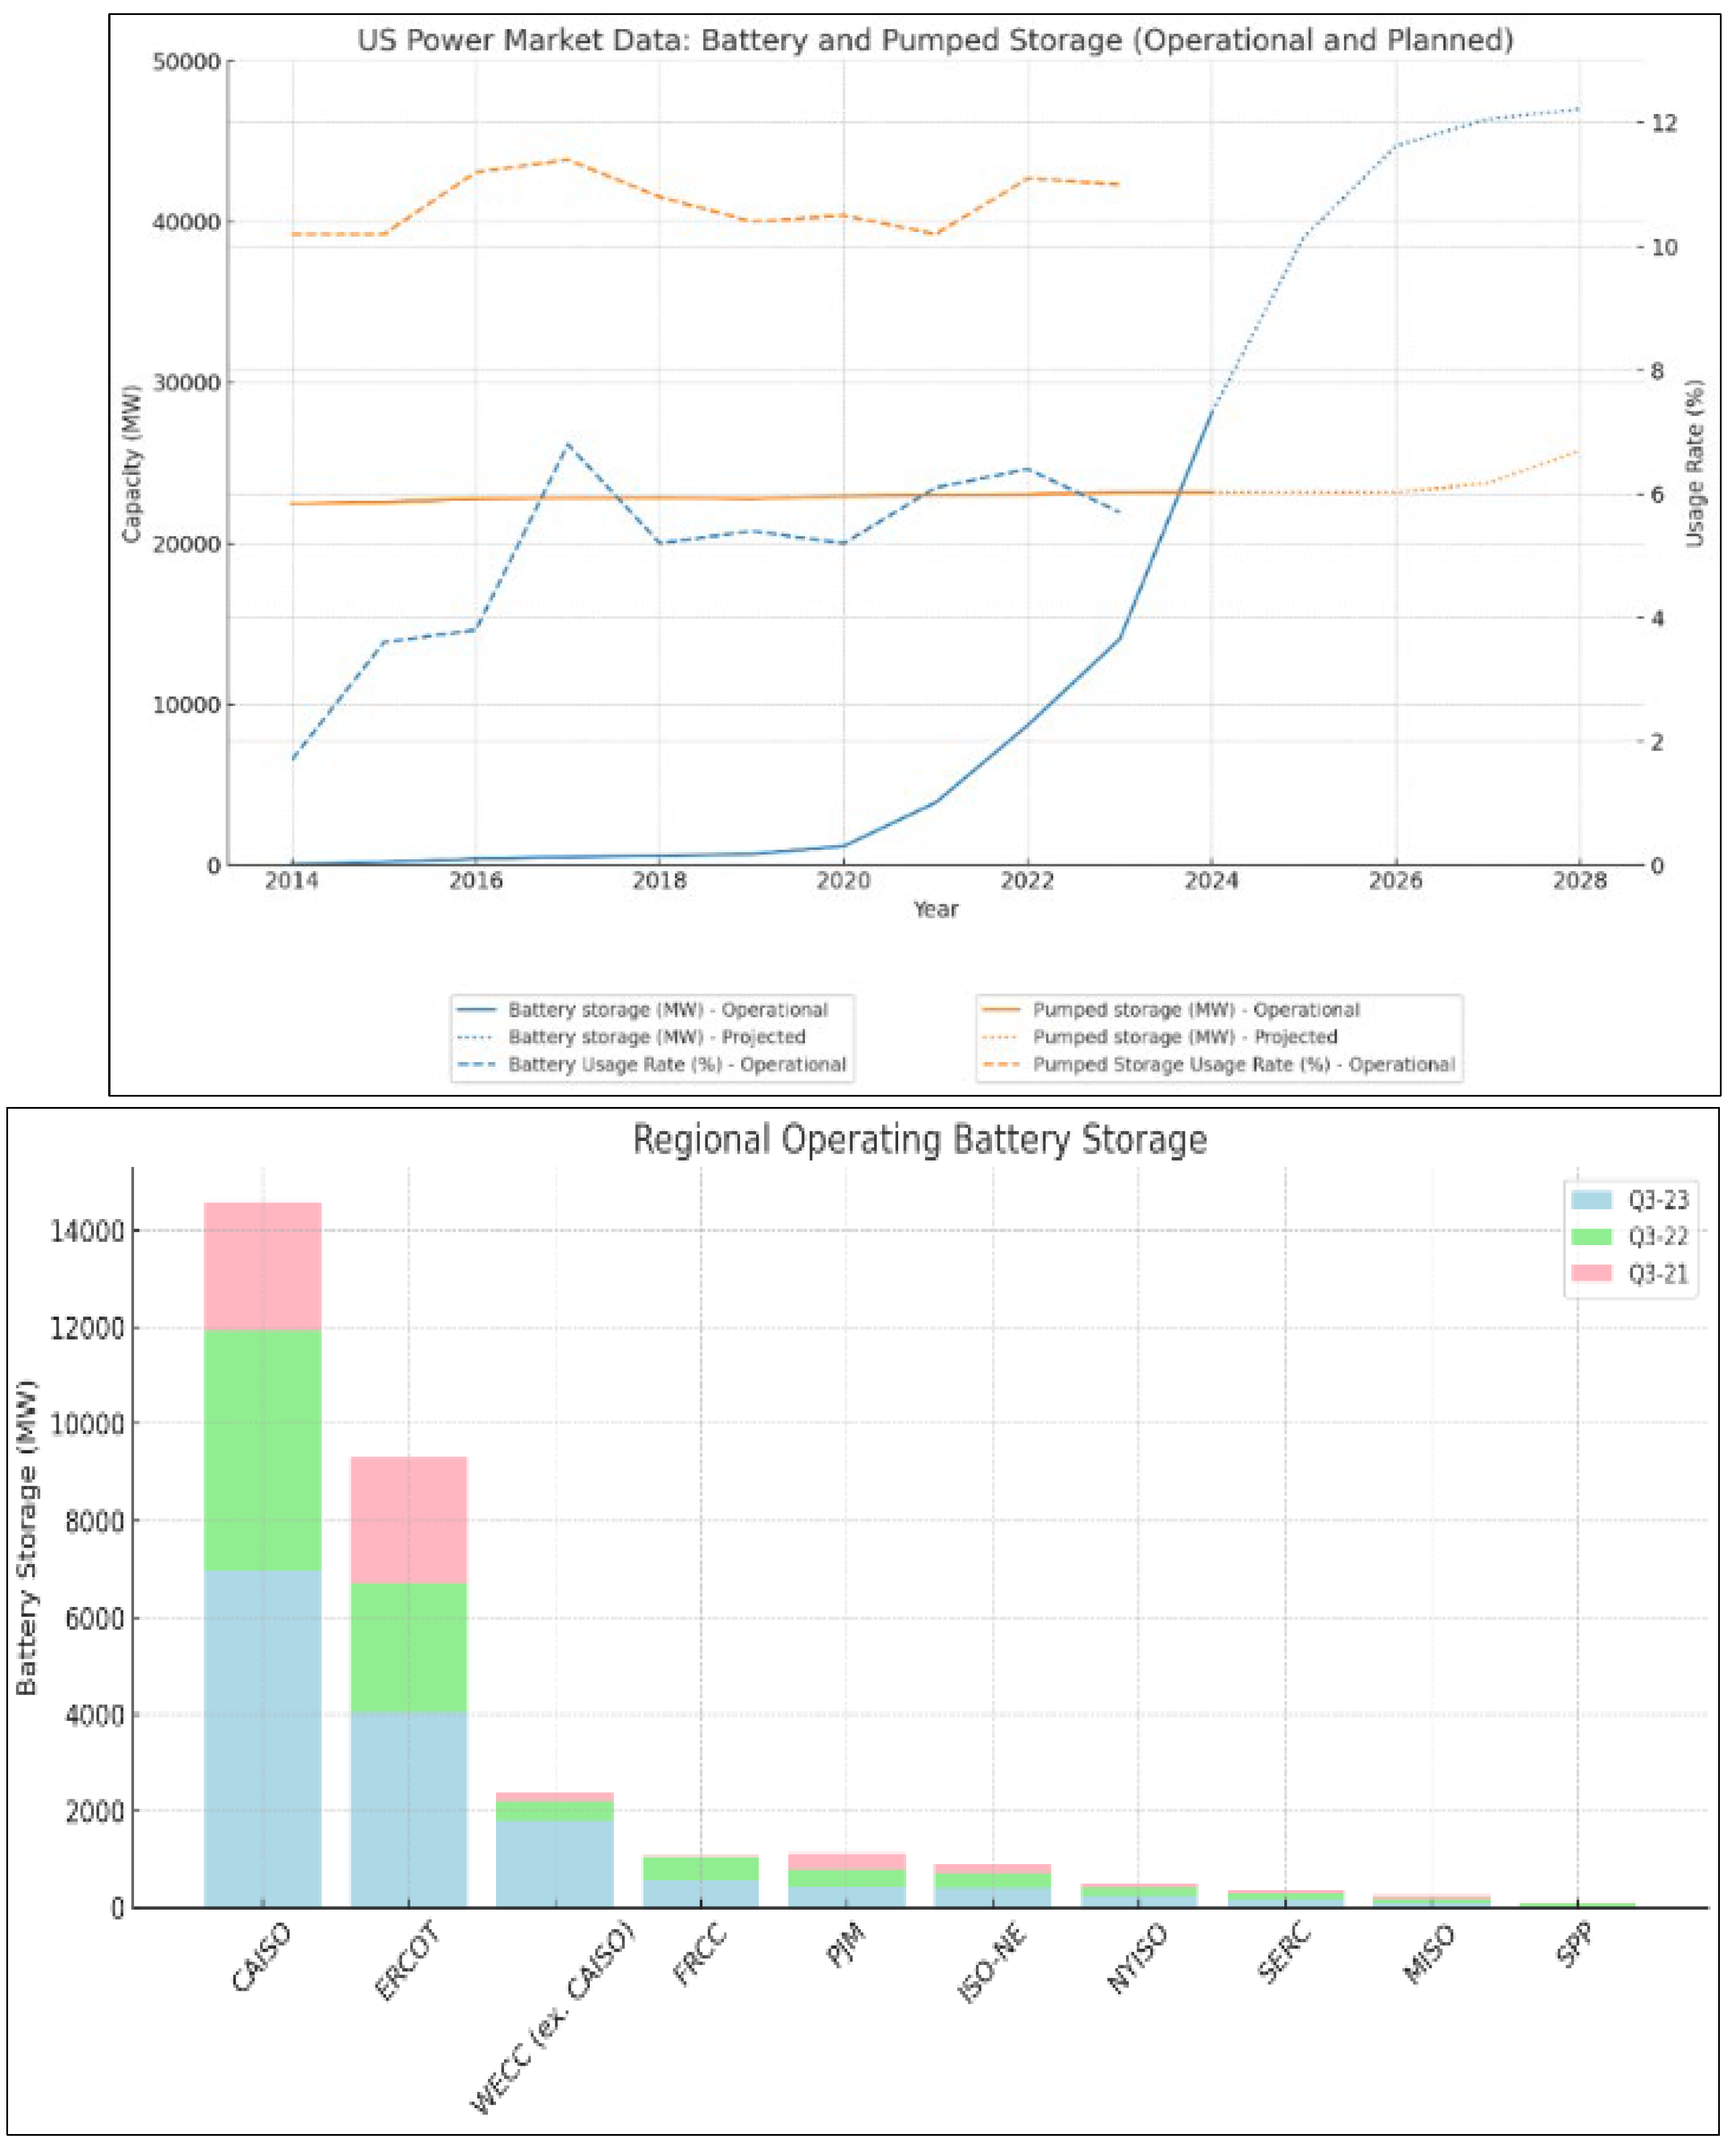
Figure 35.
Hourly U.S. electricity generation for selected cases and representative years (billion kWh) [97].
Figure 35.
Hourly U.S. electricity generation for selected cases and representative years (billion kWh) [97].
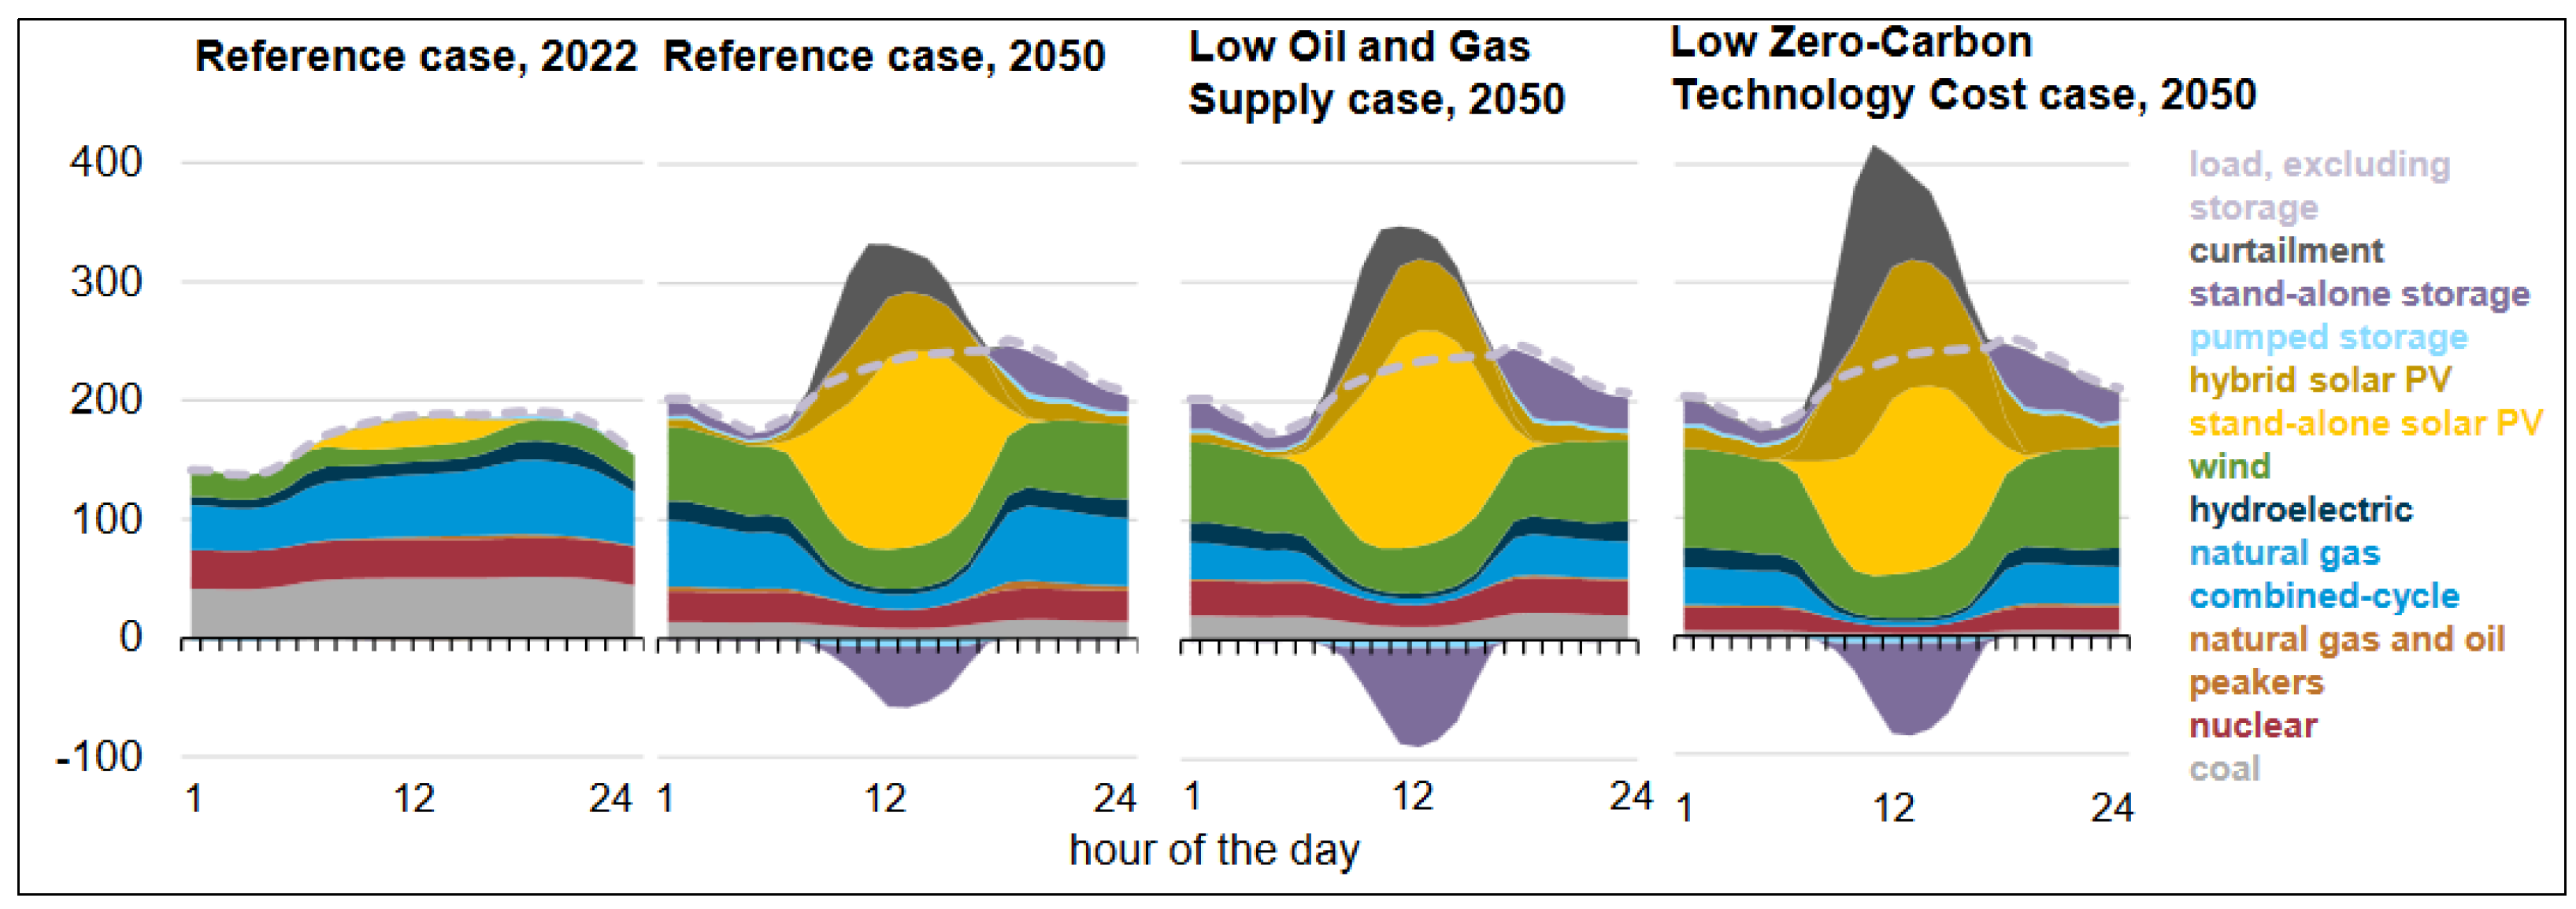
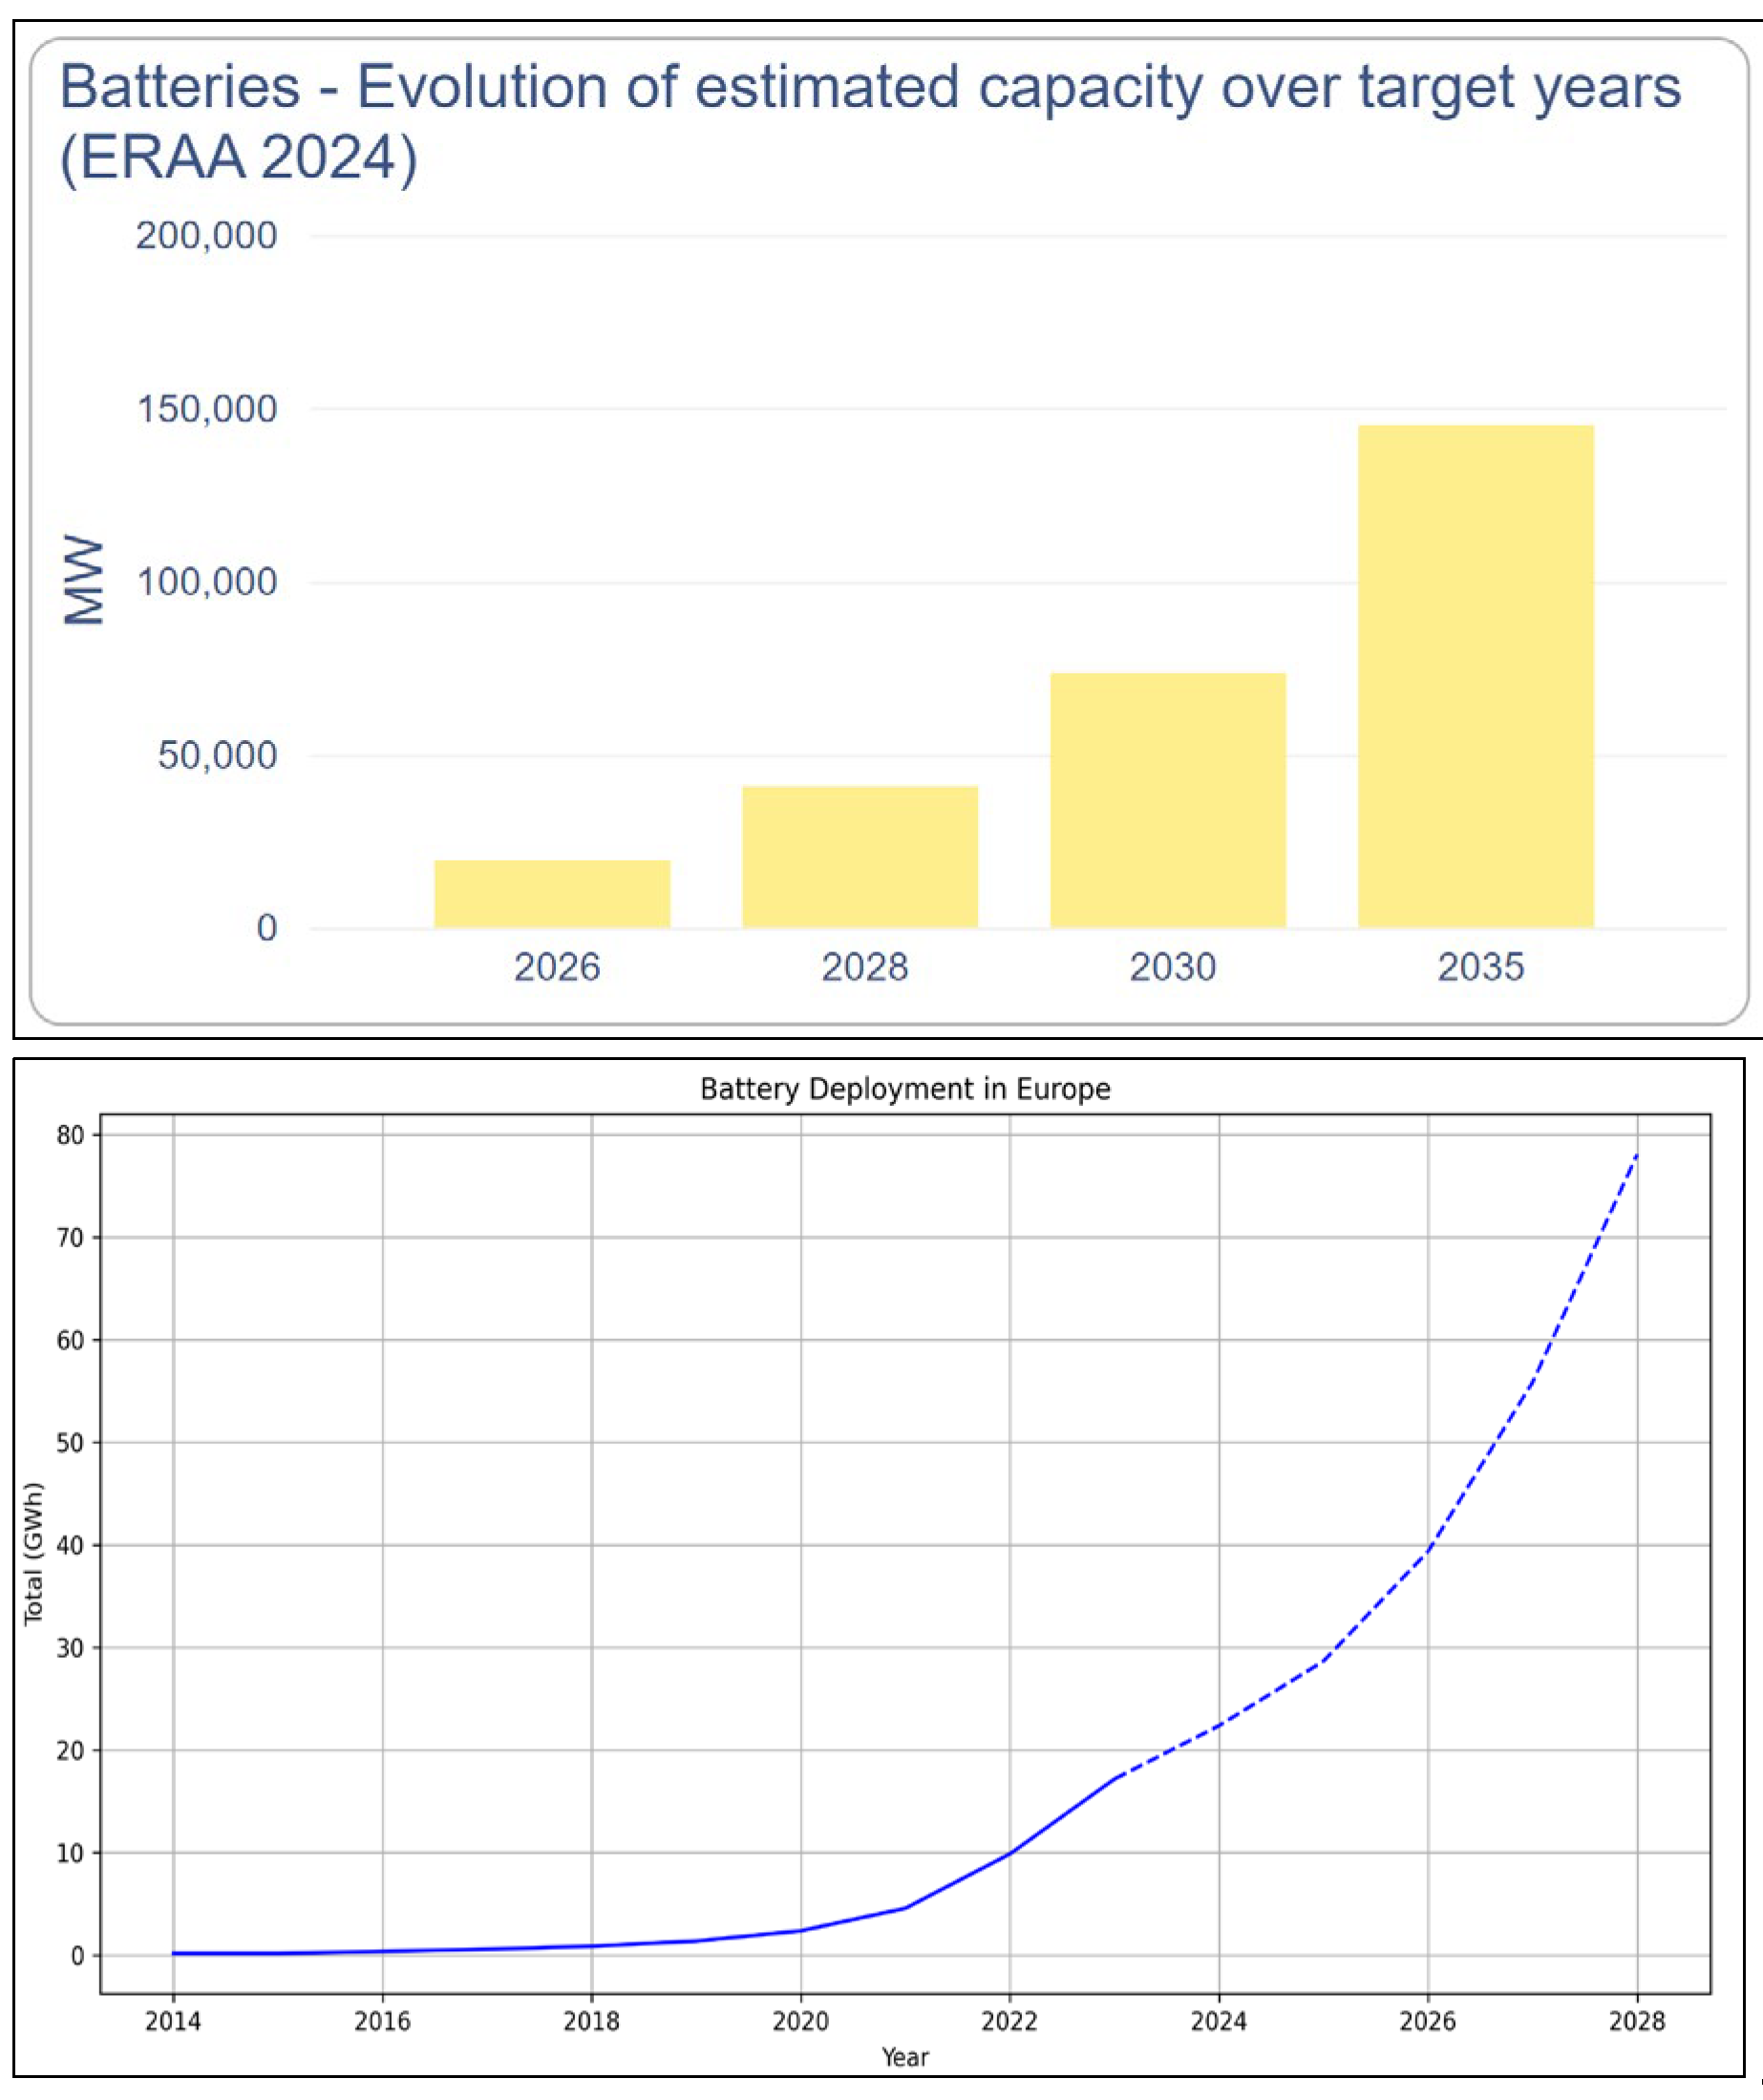
Figure 38.
DR in US regions [76].
Figure 38.
DR in US regions [76].
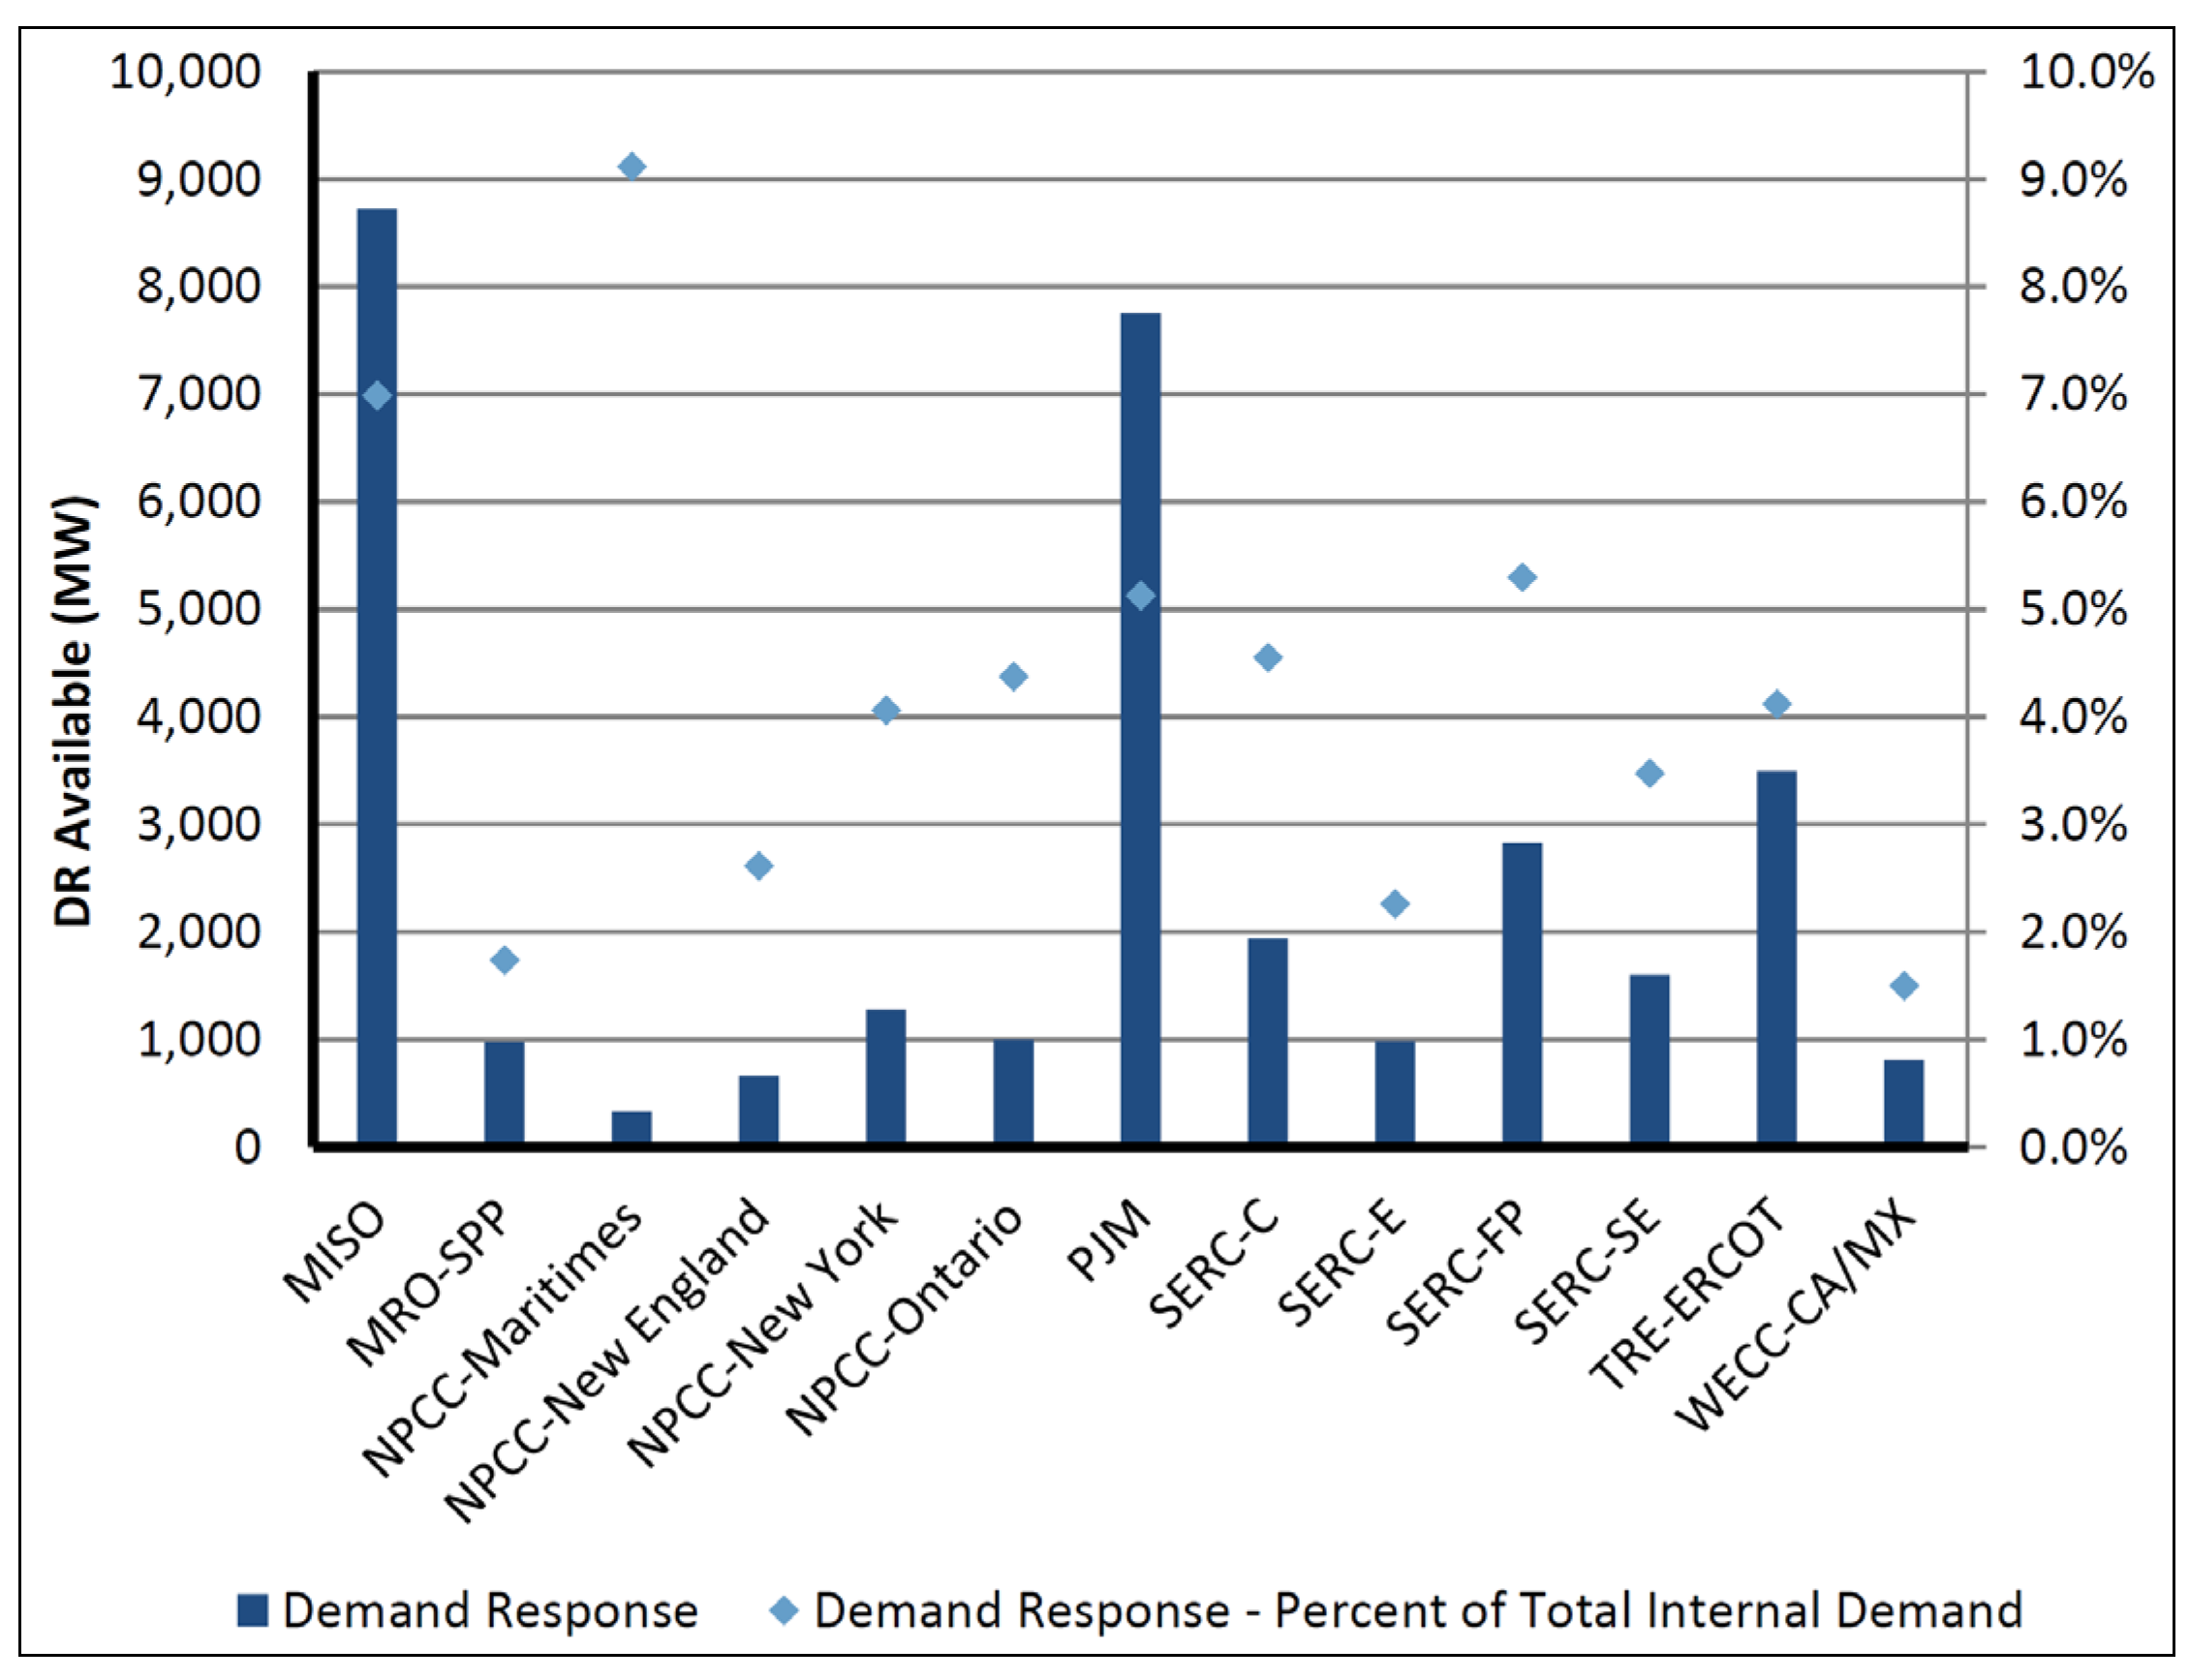
Figure 39.
Contracted volume and remuneration in France.
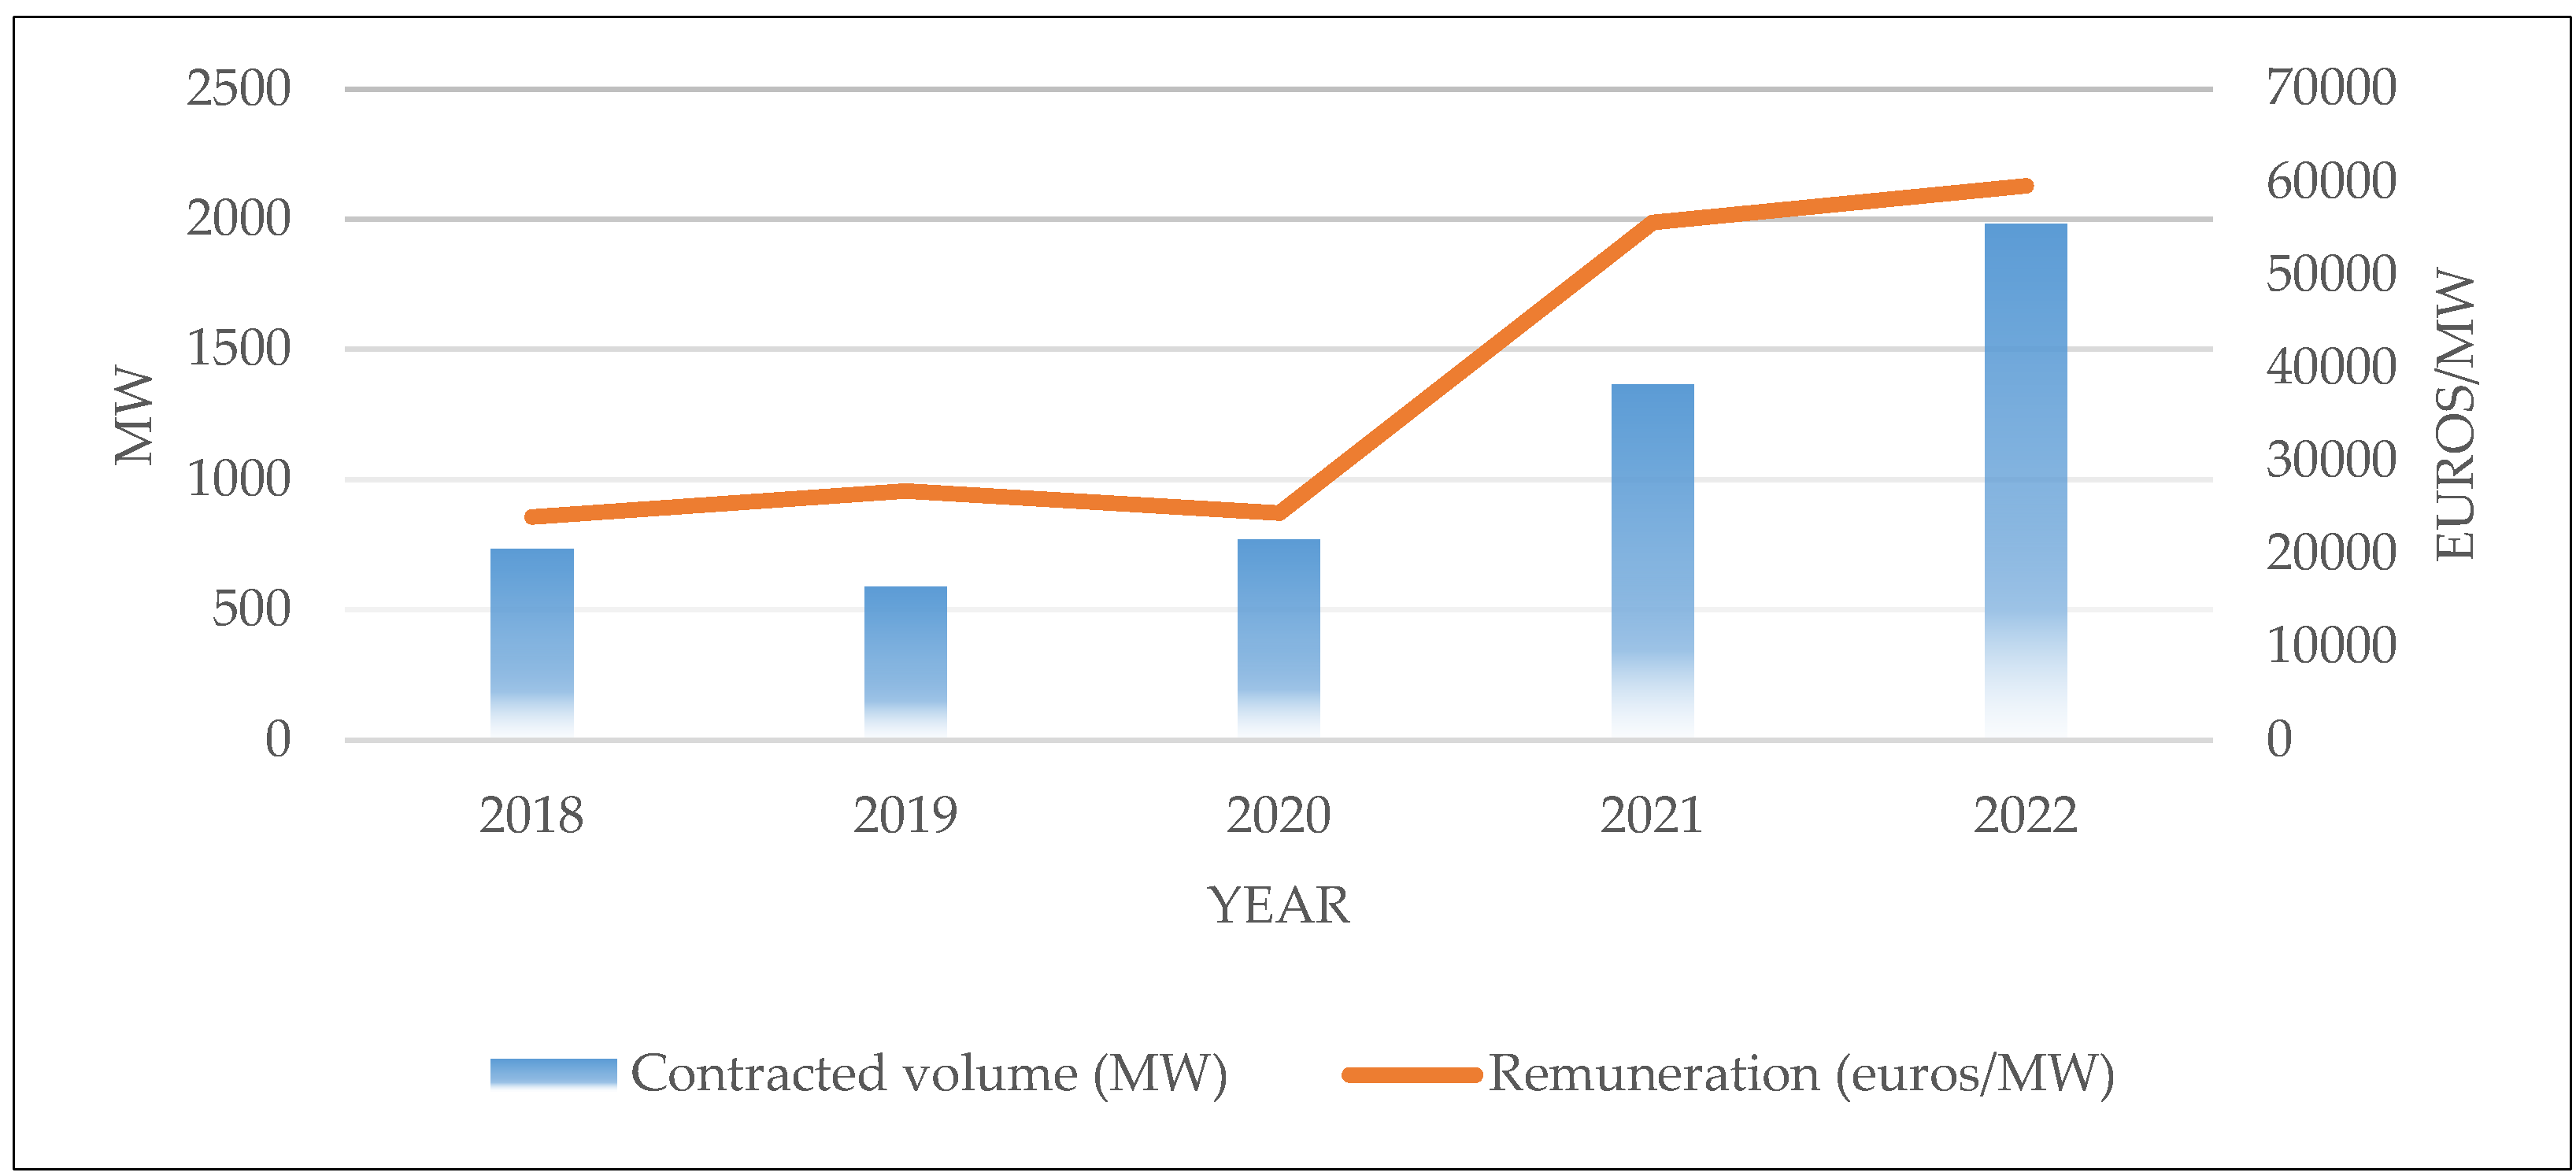

Table 1.
Capacity Remuneration Mechanism (CRM) in EU.
| Capacity Remuneration Mechanism (CRM) | Country |
| Capacity Market | Bulgaria, France, Greece, Ireland, Hungary, Italy, Poland, Portugal, Romania, Spain, Slovakia, Belgium |
| Strategic Reserve | Croatia, Finland, Germany, Netherlands, Lithuania |
| No CRM | Czech Republic, Denmark, Estonia, Latvia, Luxembourg |
| Mostly countries in EU have a unified auction for both new and existing capacities, but differentiating through contract lengths i.e., 15 years for new capacity and 1 years for existing capacity generation. | |
Source: Author’s own illustration based on [41].
Table 2.
Renewable & Clean Energy Goals and Standards [44].
Table 2.
Renewable & Clean Energy Goals and Standards [44].
| Type | State | Year | Target |
|---|---|---|---|
| Renewable Portfolio Standard | Delaware | 2026 | 25% |
| Connecticut | 2030 | 40% | |
| 2040 | 100% | ||
| New Jersey | 2030 | 50% | |
| 2050 | 100% | ||
| Maryland | 2030 | 50% | |
| Illinois | 2040 | 50% | |
| Washington, D.C. | 2032 | 100% | |
| Rhode Island | 2033 | 100% | |
| Virginia | 2045 | 100% | |
| Massachusetts | 2030 | 40% | |
| 2050 | 80% | ||
| Clean Energy Standard | New York | 2030 | 70% |
| 2040 | 100% | ||
| Oregon | 2040 | 50% | |
| California | 2030 | 60% | |
| 2045 | 100% | ||
| New Mexico | 2040 | 80% | |
| 2045 | 100% | ||
| Washington | 2045 | 100% | |
| Clean Energy Goal | Colorado | 2050 | 100% |
| Nevada | 2030 | 50% | |
| 2050 | 100% | ||
| Wisconsin | 2050 | 100% |
Table 3.
Future challenges in US Power Market [75].
Table 3.
Future challenges in US Power Market [75].
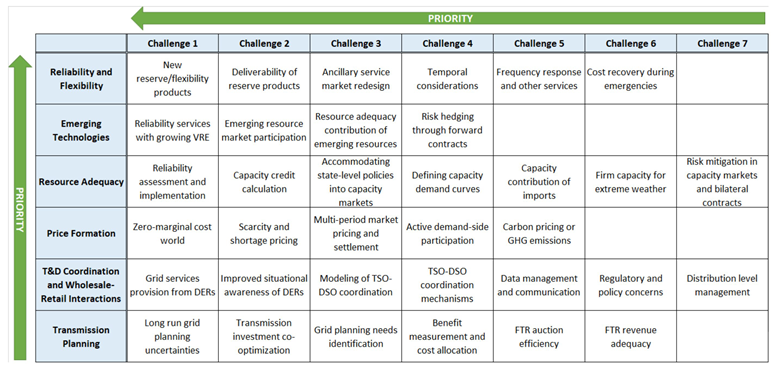
Table 4.
Scenarios of future generation expansion in Pakistan..
| SCENARIO | TOTAL COSTS (w/o Emission Costs) (NPV) bn USD |
TOTAL COSTS (with Emission Costs) (NPV) bn USD |
Total Emissions (2019 - 2040) Gt CO2 |
Wind Share (2025, %) | Solar Share (2025, %) | Wind Share (2030, %) | Solar Share (2030, %) | Rank (VRE Share-2025) | RANK (Average Cost w/o Emission Costs) | RANK (Emissions) |
| PLEXOS Optimum | 84.3 | 106.5 | 1,184.5 | 10.0 | 17.3 | 7.7 | 25.3 | 8 | 7 | 10 |
| Government RE Policy Targets | +0.6% | +3.3% | +20.6% | 8.8 | 11.2 | 9 | 21 | 17 | 8 | 16 |
| Low Demand | -11.9% | -11.8% | -18.0% | 9.2 | 13.9 | 7.2 | 24.1 | 14 | 2 | 3 |
| Nuclear Flexible | 0.0% | -0.1% | -0.5% | 9.9 | 18.0 | 7.8 | 25.4 | 5 | 6 | 9 |
| Delays Hydropower | +6.3% | +8.3% | +17.6% | 9.5 | 21.9 | 11.5 | 28.8 | 2 | 16 | 14 |
| Distributed PV | +2.5% | +3.5% | +8.2% | 10.6 | 9.5 | 10.9 | 16.8 | 16 | 12 | 12 |
| Battery | -0.4% | -1.9% | -11.2% | 9.8 | 19.6 | 10.8 | 26.0 | 4 | 5 | 6 |
| 1= Best 18=Worst | ||||||||||
Disclaimer/Publisher’s Note: The statements, opinions and data contained in all publications are solely those of the individual author(s) and contributor(s) and not of MDPI and/or the editor(s). MDPI and/or the editor(s) disclaim responsibility for any injury to people or property resulting from any ideas, methods, instructions or products referred to in the content. |
© 2024 by the authors. Licensee MDPI, Basel, Switzerland. This article is an open access article distributed under the terms and conditions of the Creative Commons Attribution (CC BY) license (http://creativecommons.org/licenses/by/4.0/).
Copyright: This open access article is published under a Creative Commons CC BY 4.0 license, which permit the free download, distribution, and reuse, provided that the author and preprint are cited in any reuse.


