Preprint
Article
Edge Integration of Artificial Intelligence into Wireless Smart Sensor Platforms for Railroad Bridge Impact Detection
Altmetrics
Downloads
128
Views
46
Comments
0
A peer-reviewed article of this preprint also exists.
This version is not peer-reviewed
Submitted:
10 August 2024
Posted:
13 August 2024
You are already at the latest version
Alerts
Abstract
Of the 100,000 railroad bridges in the United States, 50% are over 100 years old. Many of these bridges do not meet the minimum vertical clearance standards, making them susceptible to impacts from over-height vehicles. Impacts can cause structural damage and unwanted disruption to railroad bridge services; rapid notification of the railroad authorities is crucial to ensure that the bridges are safe for continued use and to affect timely repairs. Therefore, researchers have developed approaches to identify these impacts to railroad bridges. Some recent approaches use machine learning to more effectively identify impacts from the sensor data. Typically, the collected sensor data is transmitted to a central location for processing. However, the challenge with this centralized approach is that the transfer of data to a central location can take considerable time, which is undesirable for time-sensitive events like impact detection that require rapid assessment and response to potential damage. To address the challenges posed by the centralized approach, this study develops a framework for edge implementation of machine learning predictions on wireless smart sensors. Wireless sensors are used because of their ease of installation and lower costs compared to their wired counterparts. The framework is implemented on the Xnode wireless smart sensor platform, thus bringing artificial intelligence models directly to the sensor nodes and eliminating the need to transfer data to a central location for processing. This framework is demonstrated using data obtained from events on a railroad bridge near Chicago; results illustrate the efficacy of the proposed edge computing framework for such time-sensitive structural health monitoring applications.
Keywords:
Subject: Engineering - Civil Engineering
1. Introduction
Railroads play a critical role in the United States’ transportation sector, serving as one of the primary means of freight transportation. According to the United States Bureau of Transportation Statistics, railroads were responsible for moving 18.5 percent (by ton-miles) of the nation’s freight, worth $403 billion, in 2023 [1]. Bridges form a vital part of the rail freight network. Half of the 100,000 railroad bridges in the United States are over 100 years old and were constructed when the minimum vertical clearance requirements were lower than the current standards, thus making them prone to impacts by over-height vehicles [2,3]. These impacts to railroad bridges can exceed the bridge design impact load and can lead to structural damage as well as service disruptions, resulting in danger to public safety, disruption of traffic, and potential significant loss of revenue for railroad owners [4].
While numerous studies have been conducted that emphasize the gravity of the railroad bridge impact issue in the United States [5,6,7], the railroad bridge impact problem is not limited to the United States. Results from a survey conducted by the World Road Association show that various railroad bridge owners across the globe consider bridge impacts as a major issue [8]. NetworkRail in the United Kingdom reported that there were 1,624 railroad bridge impacts between April 2020 and March 2021 across their network [9]. In a study conducted by Coleman et al. [10], they reported that the United Kingdom rail network experiences around 2,000 railroad bridge impacts yearly, which results in the loss of approximately £23 million for the rail authorities. Similar issues are found in New Zealand, where railroad bridge impacts cause significant delays and cost KiwiRail an average of around $650,000 per year between 2010 and 2014 [11]. The above data shows that bridge impacts are a significant problem worldwide with huge cost implications for the railroad owners.
While major full-on impacts are relatively rare, minor impacts such as when vehicles scrape underneath bridges can occur frequently. Because such scrapes can compromise the structural integrity of railroad bridges and often go unnoticed, detection is important. The most common approach for impact detection involves the monitoring and instrumentation of bridges with accelerometers; impacts are assumed to occur when the vibration levels exceed a predetermined threshold. These monitoring systems generally make use of wired sensors which have been widely adopted in practice for structural health monitoring (SHM) [12,13,14]. However, these wired SHM systems often require substantial labor and are costly to deploy and maintain.
Wireless smart sensors (WSS) technologies have emerged as promising alternatives to traditional wired sensor systems in SHM applications, offering advantages such as easier installation and reduced maintenance costs [15]. WSSs are equipped with onboard processing capabilities and wireless communication, which enable them to provide rich information [16,17,18], allowing the assessment of a structure’s condition to be conducted more autonomously, efficiently, and on-demand. To this end, Fu et al. [19] developed a wireless monitoring system for detecting impact events for long-span highway bridges. Moreover, the system employed predetermined thresholds to identify impacts. Although a threshold-based approach can identify major impacts which result in sufficiently large vibration, the more common railroad bridge impacts are often difficult to distinguish from train crossings. Therefore, the use of a threshold-based approach is prone to misclassification of events and unreliable for impact detection.
To address this issue, researchers have proposed the use of machine learning for railroad bridge event classification and impact detection based on acceleration responses obtained from WSSs [4,20,21]. These studies utilize cloud computing, which involves first transferring the data remotely to a centralized location (i.e., the cloud) where the machine learning models are applied. The results show that the use of machine learning produces more accurate outcomes in terms of correctly classifying railroad bridge events and identifying impacts. Hoang et al. [18] developed a cloud-based data retrieval and visualization framework for railroad bridges. Dang et al. [22] proposed a cloud-based digital twin framework for SHM and validated the approach on a railroad bridge. However, these studies may not be effective for applications that require real-time or near real-time inferences. The challenge arises due to the significant time required to transfer the entire dataset from the sensor nodes to a central location over low-bandwidth wireless connections and potential wait times due to the queued data from a previous event. Additionally, the target railroad bridges can be in areas with poor connectivity, resulting in intermittent delays in uploading data. Therefore, to meet the demand of real-time or near real-time decision making, the computation needs to be performed on the WSS.
Edge computing paradigms seek to deploy computational resources at or near the location where the data is acquired, thus reducing or eliminating the need for large amounts of data to be collected at a centralized hub [23]. Some researchers have implemented edge computing on WSSs in SHM applications. For example, Mondal et al. [24] proposed a theoretical framework for anomaly detection using edge computing. Hoang et al. [18] proposed an approach for on-board reference free displacement estimation from measured acceleration that was implemented on the Xnode WSS platform [25,26,27,28]. V.Shajihan et al. [29] implemented edge computing for vision-based displacement estimation of in-service railroad bridges. Despite these developments, current edge computing hardware and software implementations on typical WSSs lack the necessary resources to efficiently support making machine learning predictions using measured data that will facilitate real-time or near real-time decision making.
In this paper, a new artificial intelligence (AI)-enabled WSS framework is proposed that will facilitate machine learning at the edge. The proposed framework integrates the capability of the OpenMV H7 Plus module [30] to implement machine learning models directly with the Xnode WSS platform, leveraging its wireless sensing and communication abilities. Rapid notification of impacts enables quick response and minimizes risk to the public after railroad bridge impacts. Subsequently, the efficiency of the framework is illustrated using field collected data from railroad bridge events. The remainder of the paper is organized as follows: Section 2 discusses the devices required to create a framework for an AI-enabled WSS and the integration of an edge device and a next generation WSS platform. Section 3 introduces the example application used to validate the developed framework. Section 4 demonstrates the efficiency of the proposed approach using railroad bridge field data. The developed framework is shown to be highly flexible, allowing it to be applied to other SHM tasks that require making machine learning predictions on a wireless sensor platform.
2. AI-Enabled Wireless Smart Sensor
This section presents an overview of the hardware for the proposed AI-enabled WSS, which integrates the Xnode platform [25,26,27,28] with the OpenMV H7 Plus module [30]. Following a brief description of the Xnode platform and its limitations with regard to implementing AI models, the features of the OpenMV H7 Plus module are discussed. The framework proposed for enabling AI capabilities on the Xnode is then discussed.
2.1. Xnode
The Xnode is a next-generation WSS platform which has features such as a 24-bit analog to digital converter, a built in 3-axis accelerometer, 8 sensing channels, solar energy harvesting, etc. The Xnode firmware is based on the Illinois Structural Health Monitoring Project Services Toolsuite [31] which is a software service library for long-term SHM of civil infrastructure. The developments made by Fu et al. [17] ensure that the Xnode is capable of event-triggered sensing to capture sudden events while minimizing power consumption. This feature makes the Xnode suitable for the task of detecting the occurrence of sudden events. The Xnode’s modular architecture offers the flexibility for possible connections to other external sensors [32] and possesses long-range wireless communications as well as cloud storage for retrieved data [18]. The Xnode has been found to be effective for several SHM applications (e.g., cable tension monitoring [33] and high-fidelity sensing [27,34]). Figure 1 shows an enclosed Xnode WSS. Despite these capabilities, the Xnode lacks the necessary resources for implementing machine learning tasks.
WSS platforms such as the Xnode used in this research do not have machine learning libraries available that would allow for direct implementation of machine learning tasks at the edge of these devices. Furthermore, the Xnode software library was developed using the C programming language and implementing efficient low-level code for machine learning on an embedded device in C is complex. Finally, to support recent advancements in neural network models, a more powerful processor than the Xnode’s Arm Cortex M4F is required to make inference and eventually on-board training of machine learning models. To this end, the open-source, compact, energy-efficient OpenMV H7 Plus [30] module is chosen to be integrated into the Xnode WSS platform.
2.2. OpenMV H7 Plus
OpenMV is an embedded systems platform with microcontroller-based boards tailored for rapid development and deployment of machine learning applications. The OpenMV H7 Plus module, herein referred to as the OpenMV module, is selected for this research and uses a Micropython [35] interface, which is desirable due to the abundance of available open-source Python libraries, therefore facilitating accessibility and ease of development. In particular, an array of open-source machine learning libraries is offered, allowing for the implementation of a wide range of machine learning applications. The module is compact, energy efficient, and has been widely applied in various domains including robotics, Internet of Things (IoT) devices, drone technology, etc. The aforementioned features make the OpenMV module suitable for edge implementation of machine learning algorithms for SHM tasks. Table 1 summarizes the technical specifications of the OpenMV H7 Plus microcontroller board, while Figure 2 shows an image of the OpenMV board. The integration of the Xnode and OpenMV platforms is discussed in the next subsection.
2.3. Framework for AI-Enabled Wireless Smart Sensor
In this study, an edge device, the OpenMV module is integrated with the Xnode to enable machine learning predictions on a WSS platform. The Xnode’s sensor board, A101-R4 (see Figure 3), is designed to allow connections with external sensors. The connection between the OpenMV module and the Xnode is established using a 9-pin connector. The connector provides power (3.3 V), ground, communication and general-purpose control pins from the Xnode to the external device [18].
The OpenMV module communicates with the Xnode using the Universal Asynchronous Receiver/Transmitter (UART) serial interface. The UART serial interface operates at 115.2 kbps using 8-bits per character and 1-bit for the stop bit. The software development to enable the integration of the OpenMV module with the Xnode platform is challenging, because accurate real-time task handling and effective memory management are required for reliable edge computing on resource-constrained devices. The Xnode software framework utilizes a real-time operating system (FreeRTOS), which allows for precise control over task scheduling and memory allocation [26,27]. To that end, software configuration of the Xnode’s FreeRTOS is done in the “RemoteSensing” application [26] to schedule data acquisition tasks and manage the communication with the OpenMV module. In this application, the Xnode is employed as the control device which sends commands to communicate with the OpenMV module using the UART interface. The OpenMV module software integration is implemented using Micropython to handle communication with the Xnode, load machine learning models and run inference.
The operational workflow of the AI-enabled WSS begins with the detection of an event by the ADXL362 trigger accelerometer [17]. Upon the occurrence of an event, the ADXL362 wakes up the Xnode to start sensing. Simultaneously, the OpenMV module will be powered on. Because the Xnode is the controlling device, the OpenMV module is programmed to wait for a “start” command from the Xnode before executing any further tasks. Once the sensing task is completed, and the Xnode has acquired all sensing data, the “start” command is sent to the OpenMV module and the sensing data is sent via the UART interface. Upon receiving the “start” command the OpenMV module is coded to then check the UART interface and read in any data received, 4 bytes at a time until all the sent data has been stored in arrays on the OpenMV module for on-board processing. After storing all the sensing data, the OpenMV module loads a pretrained machine learning model from its memory.
While the OpenMV module’s processor allows the execution of complex machine learning models, the maximum model complexity is limited by the available memory and processing speed. In this study, the artificial neural network (ANN) model used for railroad bridge impact detection was designed to fit within the OpenMV module’s memory constraints, as its in-memory size is only 36 KB (OpenMV H7 plus features 32 MB RAM). The ANN was trained offline using a large dataset collected by the Xnode from multiple railroad bridge events. Note that the framework proposed in this study requires pretrained machine learning models. Offline pretraining of machine learning models is typically performed using a personal computer or a cloud-based platform. The training process involves collecting a dataset, preprocessing the data and then fitting a selected machine learning model to the data. In this study, the ANN model was trained using the Keras Application Program Interface (API), which provides a wide range of libraries for building and optimizing machine learning models. After training, the model is quantized to reduce the memory footprint and converted to a Tensorflow Lite format for deployment on the OpenMV module. Tensorflow Lite is a library designed to enable machine learning models to run on edge devices [37]. The quantization process involves reducing the precision of the model’s parameters without significant loss in accuracy. For inference, features are extracted from the received data and prediction is made on the extracted features by passing into the loaded model. The results from the on-board processing are sent back to the Xnode via the UART interface. After sending the sensing data, the Xnode checks the UART interface to see if any new data has been sent by the OpenMV module. Once the result is received by the Xnode the task is ended and the results are uploaded to the cloud while notifications may also be immediately sent to end users. Figure 4 shows the software tasks implemented on both devices to ensure the integration of the OpenMV module and the Xnode, while Figure 5 shows the operational framework for this task.
3. Railroad Bridge Impact Detection – Event Classification
The railroad bridge event classification algorithm proposed by Lawal et al. [21] is implemented on the OpenMV module for this research. For the convenience of the reader, a concise summary of the approach is described in this section.
A schematic of the event classification algorithm is shown in Figure 6. Because features extracted from freight train crossings and bridge impacts are often similar and the fact that freight train events are much more frequent than other event types, a heuristic approach is first used to identify freight trains. This heuristic approach is implemented using an event duration threshold, which is defined based on the typical known length of local freight trains. If the duration of an event exceeds the defined threshold, the event is automatically classified as a freight train event without the need for further analysis. For shorter events, further analysis is still required, as passenger trains can have a duration similar to bridge impact events. Thus, a neural network classifier is developed to delineate between bridge impacts and passenger train crossings. Note that the decision to first use a heuristic approach to identify freight train events helps to address the bias problem in training the neural network, as most of the recorded events correspond to freight train crossings.
For the neural network classifier, a fully connected neural network was implemented comprising two hidden layers, with each layer comprising fifteen nodes. The input layer accepts carefully selected features extracted from the Xnode’s accelerometer data, namely the peak absolute acceleration, the two most dominant frequencies obtained from Fast Fourier Transform, center of mass as denoted by Sitton et al. [20] and spectral energy. These five features are extracted in each of the three acceleration directions result in a total of fifteen inputs into the ANN. The rectified linear unit (ReLU) activation function is applied to the hidden layers, introducing non-linearity and enabling the network to learn complex patterns. The network was designed for a binary classification problem, producing either 0 or 1 as its output corresponding to the two categories of interest: passenger train crossings and bridge impact events respectively. A sigmoid activation function is applied to the output layer. Note that all the impact data considered in this work pertains to minor impact events. The construction of the model is executed using the Keras Sequential API in Python.
This algorithm was implemented on the OpenMV in the Xnode. Results will be presented and discussed in the next section. For more details regarding this event classification algorithm, see Lawal et al. [21].
4. Results
Because an appropriate railroad bridge was available for field testing, the proposed edge framework for railroad bridge event classification and impact detection is validated using the data previously collected. First, the data and the testing approach are described. Then, the proposed approach is shown to effectively identify impact events and distinguish them from train crossings. Finally, the broader implications and future directions of the research are discussed.
4.1. Railroad Bridge Field Data
Data from railroad bridge (see Figure 7) in northern Illinois was collected over 44 weeks in 2021-22 using the Xnode wireless sensor. During this period, 20 freight trains and 5 passenger trains crossings occurred in a typical day; additionally, the bridge was impacted by over-height vehicles 105 times during this period, as detailed in Lawal et al. [21]. For all events, a 100 Hz sampling rate was used with the ADXL362 accelerometer, while data from the Xnode’s high fidelity accelerometer, the ST Micro LIS344ALH, is sampled at 1 kHz before being downsampled to 100 Hz. Two Xnode WSSs were mounted on crash beams and placed near the midspan of the bridge, one on each side. For short single-span bridges like the one used in this study, the sensor measurements are expected to be similar regardless of the sensor location, enabling the Xnode to capture the significant modes contributing to the overall response. The collected dataset encompasses a wide range of events with varying acceleration magnitudes, providing a comprehensive representation of the events that occur on the bridge over nearly a year. The consistent sampling rate of 100 Hz for all events ensures uniformity in data representation, facilitating easier comparison between different events and simplifying machine learning implementations. Finally, the high volume of recorded events provides sufficient data for training a robust model.
4.2. Neural Network Training and Implementation
The training process is a critical step in ensuring that the ANN classifier can effectively distinguish ambiguous railroad bridge events. The features mentioned in Section 3 are extracted from the collected dataset and used to train the Keras-based ANN model. To ensure the robustness of the trained model, an equal number of passenger train crossings and bridge impact events are included in the training dataset, totaling 210 events. The dataset is randomly split into 70% training and 30% testing data, with 20% of the training data held out as a validation set. Before training the ANN model, the input features are standardized by removing the mean and scaling to them unit variance. This preprocessing step is performed only on the training data; the obtained parameters are used to transform the test data accordingly. This standardization ensures that all features contribute appropriately to the learning process, regardless of their original scales. The loss function minimized during training is binary cross-entropy. The Adam optimizer is used to update the network’s weights and biases to minimize the loss function. The learning rate is set to 0.001, and the number of training epochs is determined through a trial-and-error approach and ultimately set to 200.
The trained neural network is saved onto the SD card of the OpenMV module for edge implementation. While the model developed for event classification is lightweight enough to be deployed at the edge of the OpenMV device (37 KB in size), the model is converted to a TensorFlow Lite format to optimize performance on an edge device. The generated TensorFlow Lite model is 4 KB in size. The original lightweight Keras model is converted to TensorFlow Lite using the TensorFlow Lite converter API in Python. The implementation is programmed in Micropython to manage loading the model into the OpenMV module’s memory, feature extraction, and inference execution. For the purpose of this study, prerecorded events are used to demonstrate the capability of deploying the developed event classification system at the edge of WSSs, some of which are shown in Figure 8. In this implementation, the acceleration data for these events is saved on the Xnode SD card as a text file to allow efficient reading into the Xnode memory. The data is then sent to the OpenMV module via UART for on-board feature extraction and event classification. Upon receiving the data from the Xnode, the OpenMV module loads the machine learning model into its memory from the SD card. Features are then extracted from the test signals and are used as input into the pre-trained machine learning model to run inference and get the predicted output. Different events are selected because they show the variety in the characteristics of recorded impact signals, including variations in amplitude, duration, and shape of the signals. The primary goal of this implementation is simply to demonstrate the capability of deploying the developed event classification system at the edge of WSSs, with a focus on the data transfer between the Xnode and OpenMV module. The successful transfer and processing of the pre-recorded event data would validate the effectiveness of the proposed edge-deployed event classification algorithm for railroad bridge impact detection.
4.3. Results
Figure 9 presents a confusion matrix of the classification results achieved from running the developed ANN classifier on the test dataset, which comprises 64 events. As mentioned in Lawal et al. [21], the ANN classifier correctly identified all instances of both impact events and train crossings, thus achieving perfect classification accuracy for the examples considered. The classification results highlight the model’s effectiveness in accurately detecting impact events while minimizing false alarms. This high level of performance suggests that the developed system offers reliable impact detection and event classification capabilities which is valuable for practical applications.
To further evaluate the model’s robustness, its performance was validated using a 10-fold cross-validation technique [38]. The cross-validation technique splits the dataset into 10 equal subsets. In each iteration, one subset serves as the test data, while the model is trained on the remaining 9 subsets. This process is repeated 10 times, with each subset taking a turn as the test data. The average accuracy achieved across the 10 distinct models generated during the cross-validation process was 98.67%. This result indicates a high level of performance and robustness for the developed model.
The model’s performance across various event types and acceleration magnitudes is critical, given that impacts can occur with different intensities and signal characteristics. Table 2 presents the peak accelerations in all three directions (longitudinal, vertical, and lateral) for typical events considered, along with their classification results. These examples were chosen to show that the model successfully identified impact events that span a wide range of peak acceleration. Additionally, some train events have peak accelerations similar in magnitude to certain impact events (e.g., events 3 and 9), further demonstrating the unreliability of using a simple threshold-based approach for impact detection as was mentioned in Lawal et al. [21]. In summary, these results highlight the model’s robustness in accurately classifying impacts of different magnitudes and show the importance of a robust classification approach for distinguishing between train crossings and impact events.
Figure 10 shows an example of the output from running the inference at the edge of the proposed system, including the sending and receiving of data. The inference was run on the Event 1 (top row) signals shown in Figure 8. The model classified the signal as an impact event. Note that, to efficiently utilize memory resources, only a single byte is sent back from the OpenMV module to the Xnode as the result – 1 if impact and 0 if not impact (instead of the full string of the result i.e., “impact”). Thus, for this test example the Xnode received a value of “1”. Furthermore, the confidence level, which represents the probability assigned by the neural network model that an event is indeed an impact, is also shown. Finally, the model also outputs the peak acceleration in all three directions to help bridge engineers understand the magnitudes of detected impact events. Note that the peak acceleration is determined using both the high fidelity and ADXL362 accelerometer data. Finally, the average inference time from the moment data is sent from the OpenMV module until the prediction is sent back to the Xnode is 0.93 milliseconds.
Current draw is an important factor to be considered in wireless sensor applications. The Xnode with the OpenMV module draws approximately 190 mA during sensing, representing only a 12% increase over the baseline Xnode power consumption. This modest increase in current draw is particularly favorable considering the significant additional capabilities that the OpenMV module provides for edge computing and machine learning tasks. The relatively low power consumption of the integrated system demonstrates its efficiency and suitability for long-term deployment in wireless SHM applications.
5. Conclusions
In this paper, an AI-based framework for railroad bridge impact detection was developed using an edge implementation on wireless smart sensors. First, the hardware for the AI-enabled platform was developed by integrating the OpenMV H7 plus module with the Xnode. The framework was validated by implementing a railroad bridge impact detection system at the edge of the Xnode WSS platform. The results demonstrated efficient communication between the OpenMV module and Xnode devices. The event classification algorithm correctly classified all events and identified all bridge impacts with a high level of confidence. The event classification algorithm not only accurately predicts impacts but also outputs the maximum acceleration in all three directions. To efficiently utilize memory resources, the classification results are encoded into a single byte before being sent back to the Xnode.
Future research will explore the capabilities of the OpenMV module’s processor to allow for on-board training of machine learning models, in addition to using pre-trained models as was used in the application shown in Section 4.2. On-board training allows the finetuning of pre-trained models when new data becomes available, making the system more robust and adaptable over time. This capability is particularly valuable as environmental conditions or structural characteristics may change over time, requiring periodic model updates to maintain accuracy. The ability to carry out on-board training also allows for using transfer learning. Transfer learning refers to reusing knowledge learned from one task in another related task. For example, the neural network trained in this work could be adapted for detecting events on highway bridges without the need for extensive data collection.
Finally, while the implementation in this work focuses on railroad bridge impact detection and event classification, the broader implication of this work is that machine learning applications for SHM are enabled on the Xnode WSS device.
Author Contributions
Conceptualization, O.L., S.A.V.S., K.M and B.F.S.J.; methodology, O.L and S.A.V.S.; software, O.L., S.A.V.S. and K.M.; validation, O.L. and S.A.V.S.; formal analysis, O.L. and S.A.V.S.; investigation, O.L., S.A.V.S., K.M. and B.F.S.J.; resources, K.M. and B.F.S.J.; data curation, O.L. and K.M.; writing—original draft preparation, O.L.; writing—review and editing, S.A.V.S., K.M. and B.F.S.J.; visualization, O.L. and S.A.V.S.; supervision, K.M and B.F.S.J.; project administration, B.F.S.J.; funding acquisition, K.M. and B.F.S.J. All authors have read and agreed to the published version of the manuscript.
Funding
This research received no external funding.
References
- Moving Goods in the United States. Available online: https://data.bts.gov/stories/s/Moving-Goods-in-the-United-States/bcyt-rqmu/ (accessed on 29 April 2024).
- Ozdagli, A.I.; Gomez, J.A.; Moreu, F. Real-Time Reference-Free Displacement of Railroad Bridges during Train-Crossing Events. Journal of Bridge Engineering 2017, 22. [CrossRef]
- Rakoczy, A.M. Fatigue Safety Verification of Riveted Steel Railway Bridges Using Probabilistic Method and Standard S-N Curves. Archives of Civil Engineering 2021, 67, 625–642. [CrossRef]
- Sitton, J.D.; Zeinali, Y.; Story, B.A. Design and Field Implementation of an Impact Detection System Using Committees of Neural Networks. Expert Syst Appl 2019, 120, 185–196. [CrossRef]
- Agrawal, A.K.; Xu, X.; Chen, Z. Bridge Vehicle Impact Assessment (Project # C-07-10). Final Report for New York State Department of Transportation. 2011.
- Joy, R.; Jones, M.; Otter, D.; Maal, L. Characterization of Railroad Bridge Service Interruptions. U.S. Department of Transportation 2013.
- Nguyen, B.; Brilakis, I. Understanding the Problem of Bridge and Tunnel Strikes Caused by Over-Height Vehicles. Transportation Research Procedia 2016, 14, 3915–3924. [CrossRef]
- Connolly, L.; Bernardini, I.; Kakouris, E.; Kelly, J. BRIDGE and Tunnel Strikes by Oversized Vehicles : A PIARC Special Project; ISBN 9782840606758.; PIARC, 2022; ISBN 9782840606758.
- The Risk of Bridge Strikes - Network Rail. Available online: https://www.networkrail.co.uk/running-the-railway/looking-after-the-railway/bridges-tunnels-and-viaducts/the-risk-of-bridge-strikes/ (accessed on 17 July 2022).
- Coleman, L.; Engineer, P.S.; Wheel, M.; Engineer, S.; Dean, A.; Engineer, I.B. Managing Bridge Strikes from Rail to Road Bridges. In Proceedings of the 9h Australian Small Bridges Conference; 2019; pp. 1–8.
- Critchley, J.; Cowell, E. Rail Over Bridge Strikes - Discussion of an Emergency Recovery in a Metro Area Available online: https://na.eventscloud.com/file_uploads/07e9ab4dc5c28687d73704d166a571e6_RAILOVERROADBRIDGESTRIKESDISCUSSIONOFANEMERGENCYRECOVERYINAMETROAREA.pdf (accessed on 13 December 2022).
- Okada, K.; Nakamura, Y.; Saruta, M. Application of Earthquake Early Warning System to Seismic-Isolated Buildings;
- Yamazaki, F.; Motomura, H.; Hamada, T. DAMAGE ASSESSMENT OF EXPRESSWAY NETWORKS IN JAPAN BASED ON SEISMIC MONITORING;
- Çelebi, M. Real-Time Seismic Monitoring of the New Cape Girardeau Bridge and Preliminary Analyses of Recorded Data: An Overview. Earthquake Spectra 2006, 22, 609–630.
- Yun, C.B.; Cho, S.; Park, H.J.; Min, J.; Park, J.W. Smart Wireless Sensing and Assessment for Civil Infrastructure. Structure and Infrastructure Engineering 2014, 10, 534–550. [CrossRef]
- Sim, S.H.; Li, J.; Jo, H.; Park, J.W.; Cho, S.; Spencer, B.F.; Jung, H.J. A Wireless Smart Sensor Network for Automated Monitoring of Cable Tension. Smart Mater Struct 2014, 23. [CrossRef]
- Fu, Y.; Hoang, T.; Mechitov, K.; Kim, J.R.; Zhang, D.; Spencer, B.F. Sudden Event Monitoring of Civil Infrastructure Using Demand-Based Wireless Smart Sensors. Sensors (Switzerland) 2018, 18. [CrossRef]
- Hoang, T.; Fu, Y.; Mechitov, K.; Sánchez, F.G.; Kim, J.R.; Zhang, D.; Spencer, B.F. Autonomous End-to-End Wireless Monitoring System for Railroad Bridges. Advances in Bridge Engineering 2020, 1. [CrossRef]
- Fu, Y.; Zhu, Y.; Hoang, T.; Mechitov, K.; Spencer, B.F. XImpact : Intelligent Wireless System for Cost-Effective Rapid Condition Assessment of Bridges under Impacts. 2022.
- Sitton, J.D.; Story, B.A.; Zeinali, Y. Bridge Impact Detection and Classification Using Artificial Neural Networks. Structural Health Monitoring 2017: Real-Time Material State Awareness and Data-Driven Safety Assurance - Proceedings of the 11th International Workshop on Structural Health Monitoring, IWSHM 2017 2017, 1, 1261–1267. [CrossRef]
- Lawal, O.; Shaik, S.A.; Mechitov, K.; Spencer, B.F. An Event-Classification Neural Network Approach for Rapid Railroad Bridge Impact Detection. Sensors 2023, 23. [CrossRef]
- Dang, H.; Tatipamula, M.; Nguyen, H.X. Cloud-Based Digital Twinning for Structural Health Monitoring Using Deep Learning. IEEE Trans Industr Inform 2022, 18, 3820–3830. [CrossRef]
- Chen, J.; Ran, X. Deep Learning With Edge Computing: A Review. Proceedings of the IEEE 2019. [CrossRef]
- Mondal, T.G.; Chou, J.-Y.; Fu, Y.; Jianxiao, M. A Hybrid Deep Neural Network Compression Approach Enabling Edge Intelligence for Data Anomaly Detection in Smart Structural Health Monitoring Systems. Smart Struct Syst 2023, 32, 179–193.
- Fu, Y.; Mechitov, K.; Hoang, T.; Kim, J.R.; Memon, S.A.; Spencer, B.F. Efficient and High-Precision Time Synchronization for Wireless Monitoring of Civil Infrastructure Subjected to Sudden Events. Struct Control Health Monit 2021, 28. [CrossRef]
- Fu, Y.; Mechitov, K.; Hoang, T.; Kim, J.R.; Lee, D.H.; Spencer, B.F. Development and Full-Scale Validation of High-Fidelity Data Acquisition on a next-Generation Wireless Smart Sensor Platform. Advances in Structural Engineering 2019, 22, 3512–3533. [CrossRef]
- Shajihan, S.A.V.; Chow, R.; Mechitov, K.; Fu, Y.; Hoang, T.; Spencer, B.F. Development of Synchronized High-Sensitivity Wireless Accelerometer for Structural Health Monitoring. Sensors (Switzerland) 2020, 20, 1–20. [CrossRef]
- Spencer, B.F.; Park, J.W.; Mechitov, K.A.; Jo, H.; Agha, G. Next Generation Wireless Smart Sensors Toward Sustainable Civil Infrastructure. In Proceedings of the Procedia Engineering; Elsevier Ltd., 2017; Vol. 171, pp. 5–13.
- V. Shajihan, S.A.; Hoang, T.; Mechitov, K.; Spencer, B.F. Wireless SmartVision System for Synchronized Displacement Monitoring of Railroad Bridges. Computer-Aided Civil and Infrastructure Engineering 2022. [CrossRef]
- Abdelkader, I.; El-Sonbaty, Y.; El-Habrouk, M. OPENMV: A PYTHON POWERED, EXTENSIBLE MACHINE VISION CAMERA; 2017;
- Structural Health Monitoring at the University of Illinois. Available online: http://shm.cs.illinois.edu/ (accessed on 17 November 2023).
- Lawal, O.; Najafi, A.; Hoang, T.; Shajihan, S.A. V.; Mechitov, K.; Spencer, B.F. Development and Validation of a Framework for Smart Wireless Strain and Acceleration Sensing. Sensors 2022, 22. [CrossRef]
- Active Mass Damper for Buildings and Bridges | TESolution. Available online: http://www.tesolution.com/structural-health-monitoring.html (accessed on 13 November 2023).
- Zhu, L.; Fu, Y.; Chow, R.; Spencer, B.F.; Park, J.W.; Mechitov, K. Development of a High-Sensitivitywireless Accelerometer for Structural Health Monitoring. Sensors (Switzerland) 2018, 18. [CrossRef]
- Bell, C. MicroPython for the Internet of Things; Apress, 2017;
- OpenMV Cam H7. Available online: https://openmv.io/products/openmv-cam-h7 (accessed on 31 July 2024).
- TensorFlow Lite. Available online: https://www.tensorflow.org/lite/guide#2_convert_the_model (accessed on 8 December 2022).
- A Gentle Introduction to K-Fold Cross-Validation. Available online: https://machinelearningmastery.com/k-fold-cross-validation/ (accessed on 30 July 2022).
Figure 1.
Enclosed Xnode WSS.
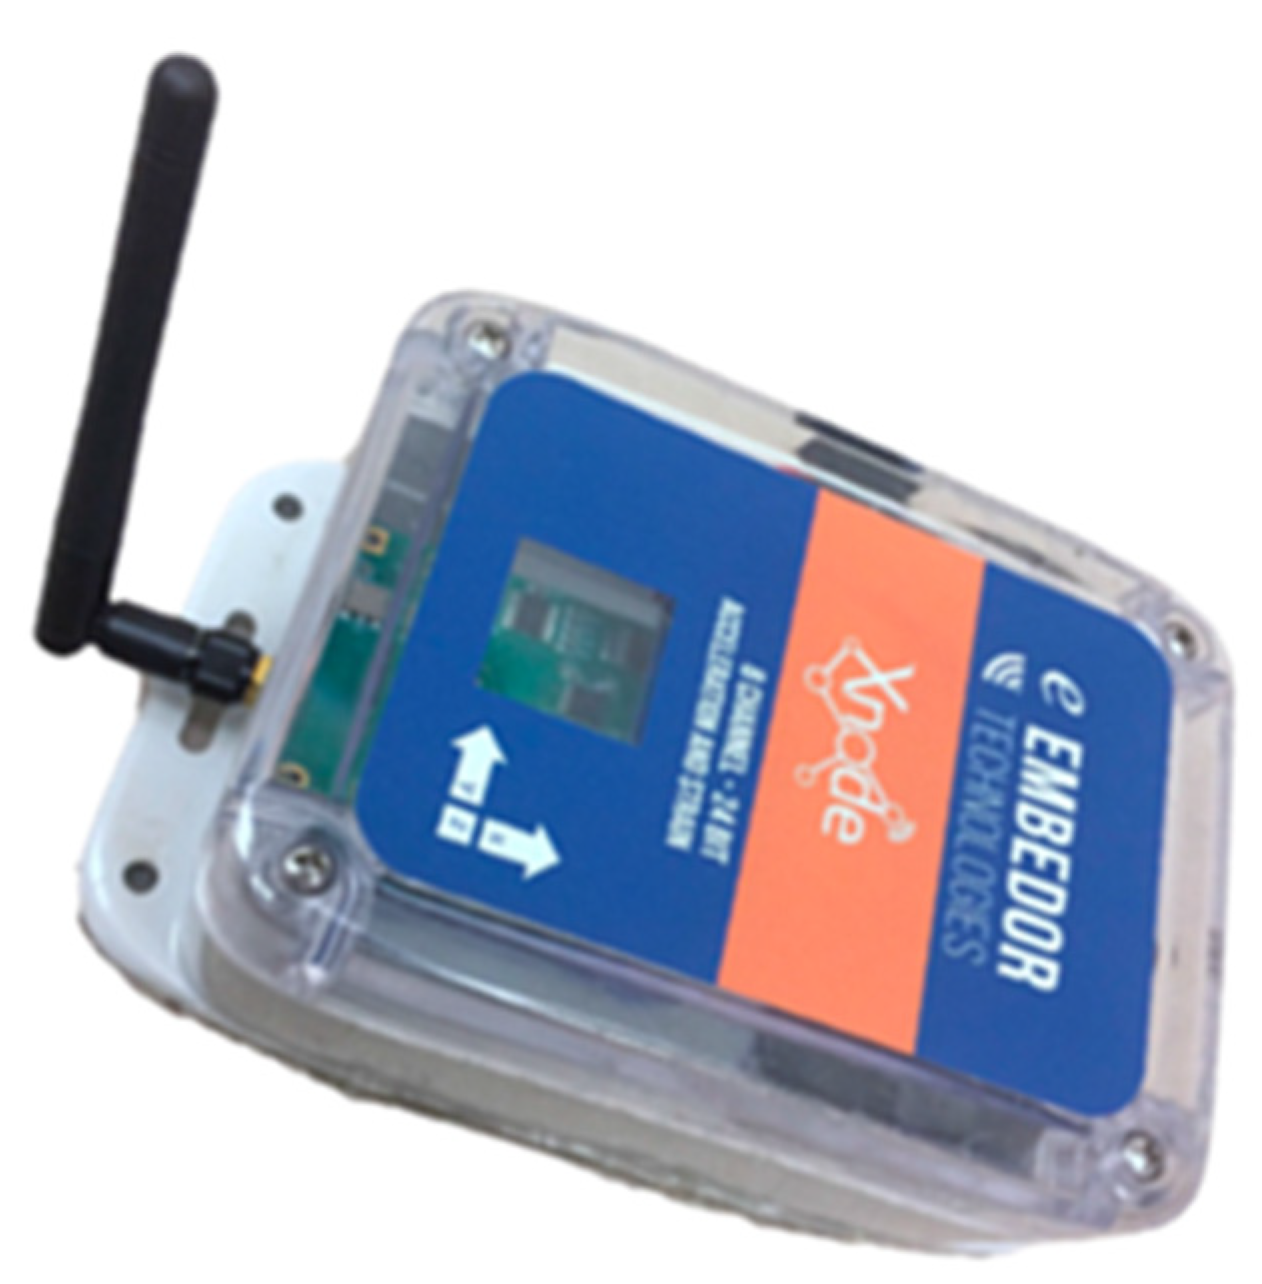
Figure 2.
OpenMV H7 Plus microcontroller board [36].
Figure 2.
OpenMV H7 Plus microcontroller board [36].
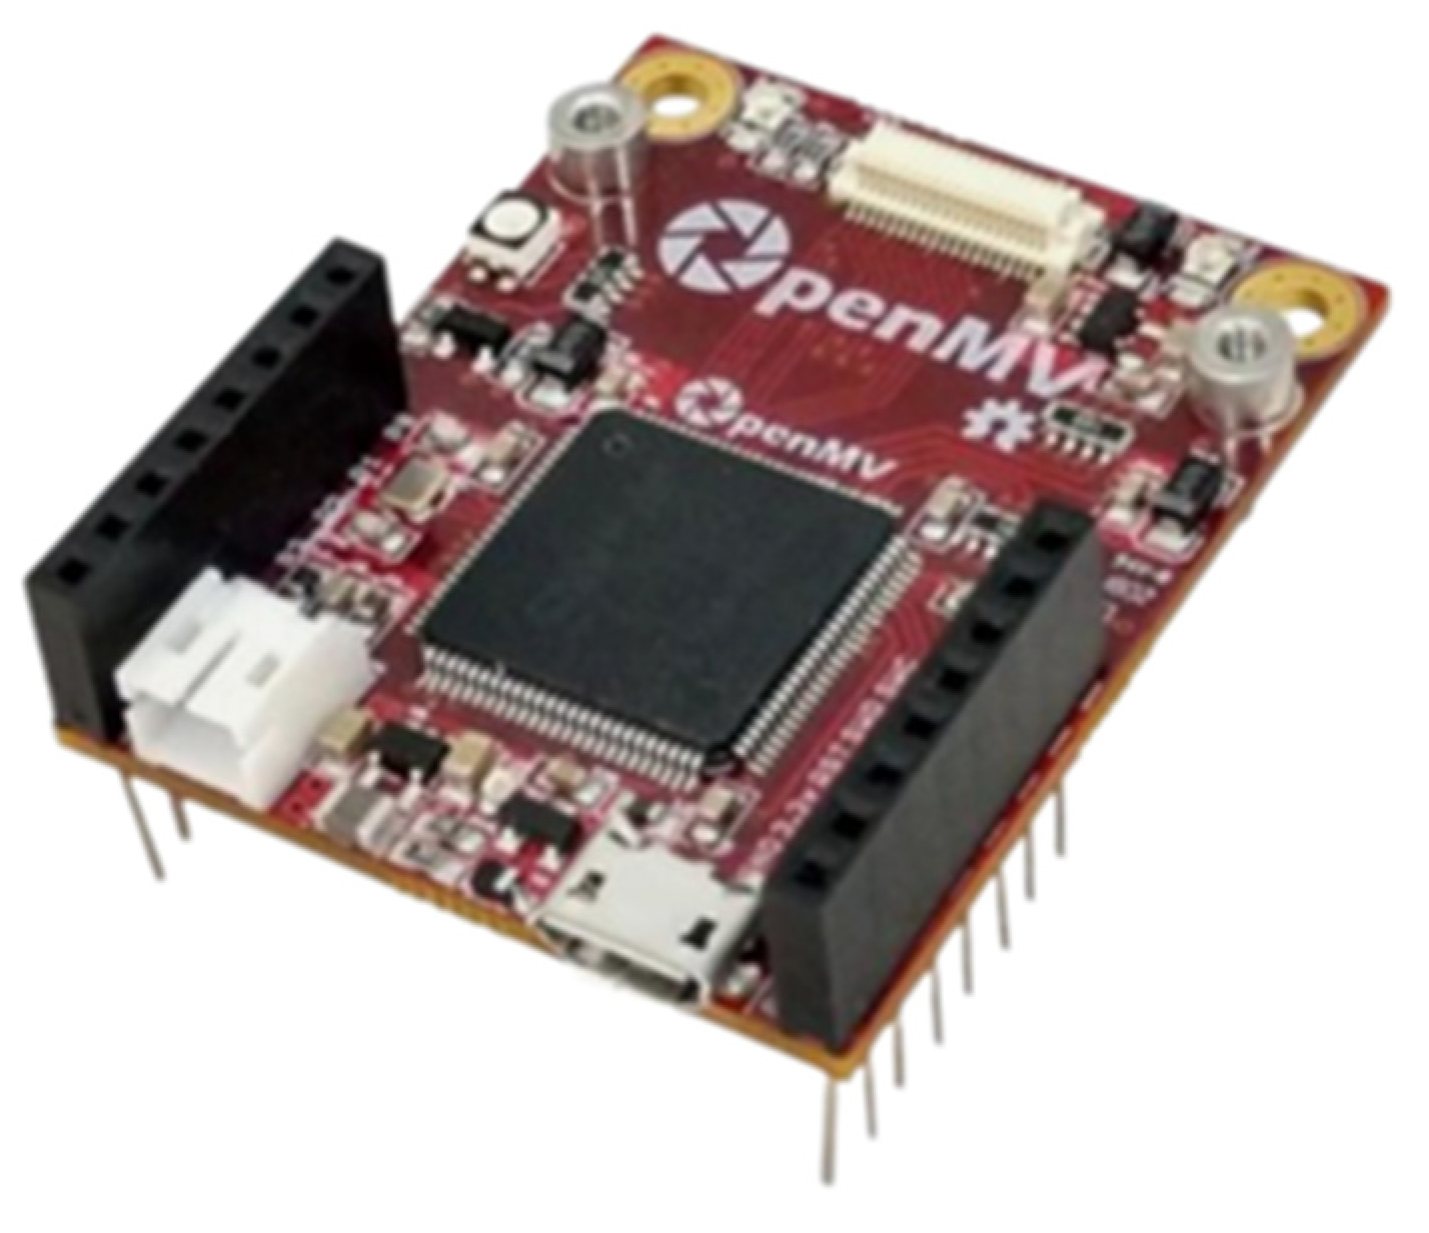
Figure 3.
Xnode sensor board.
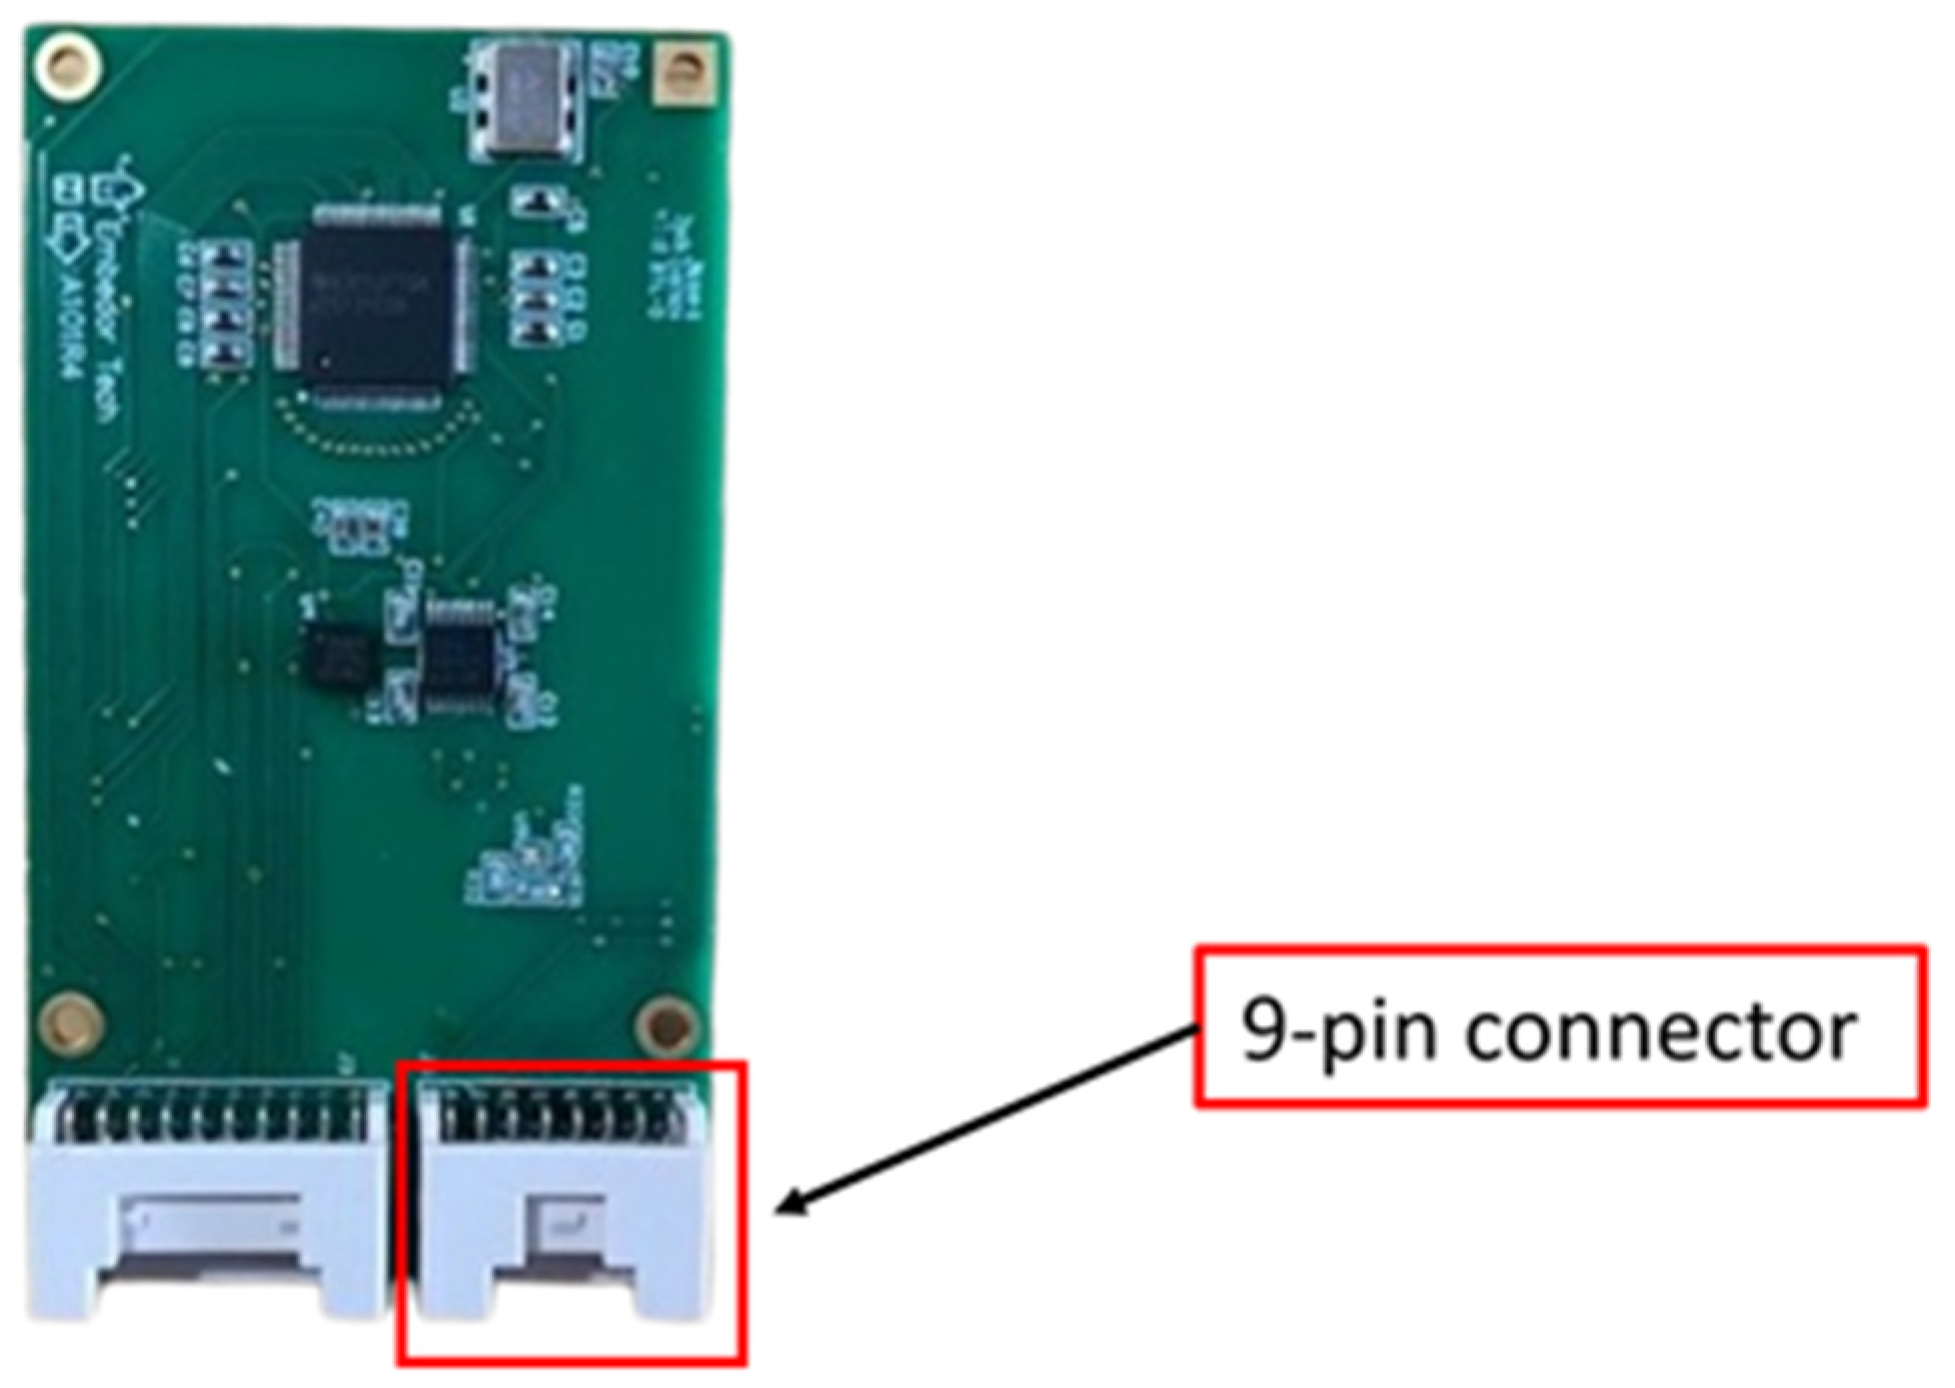
Figure 4.
Implemented software tasks for edge implementation.
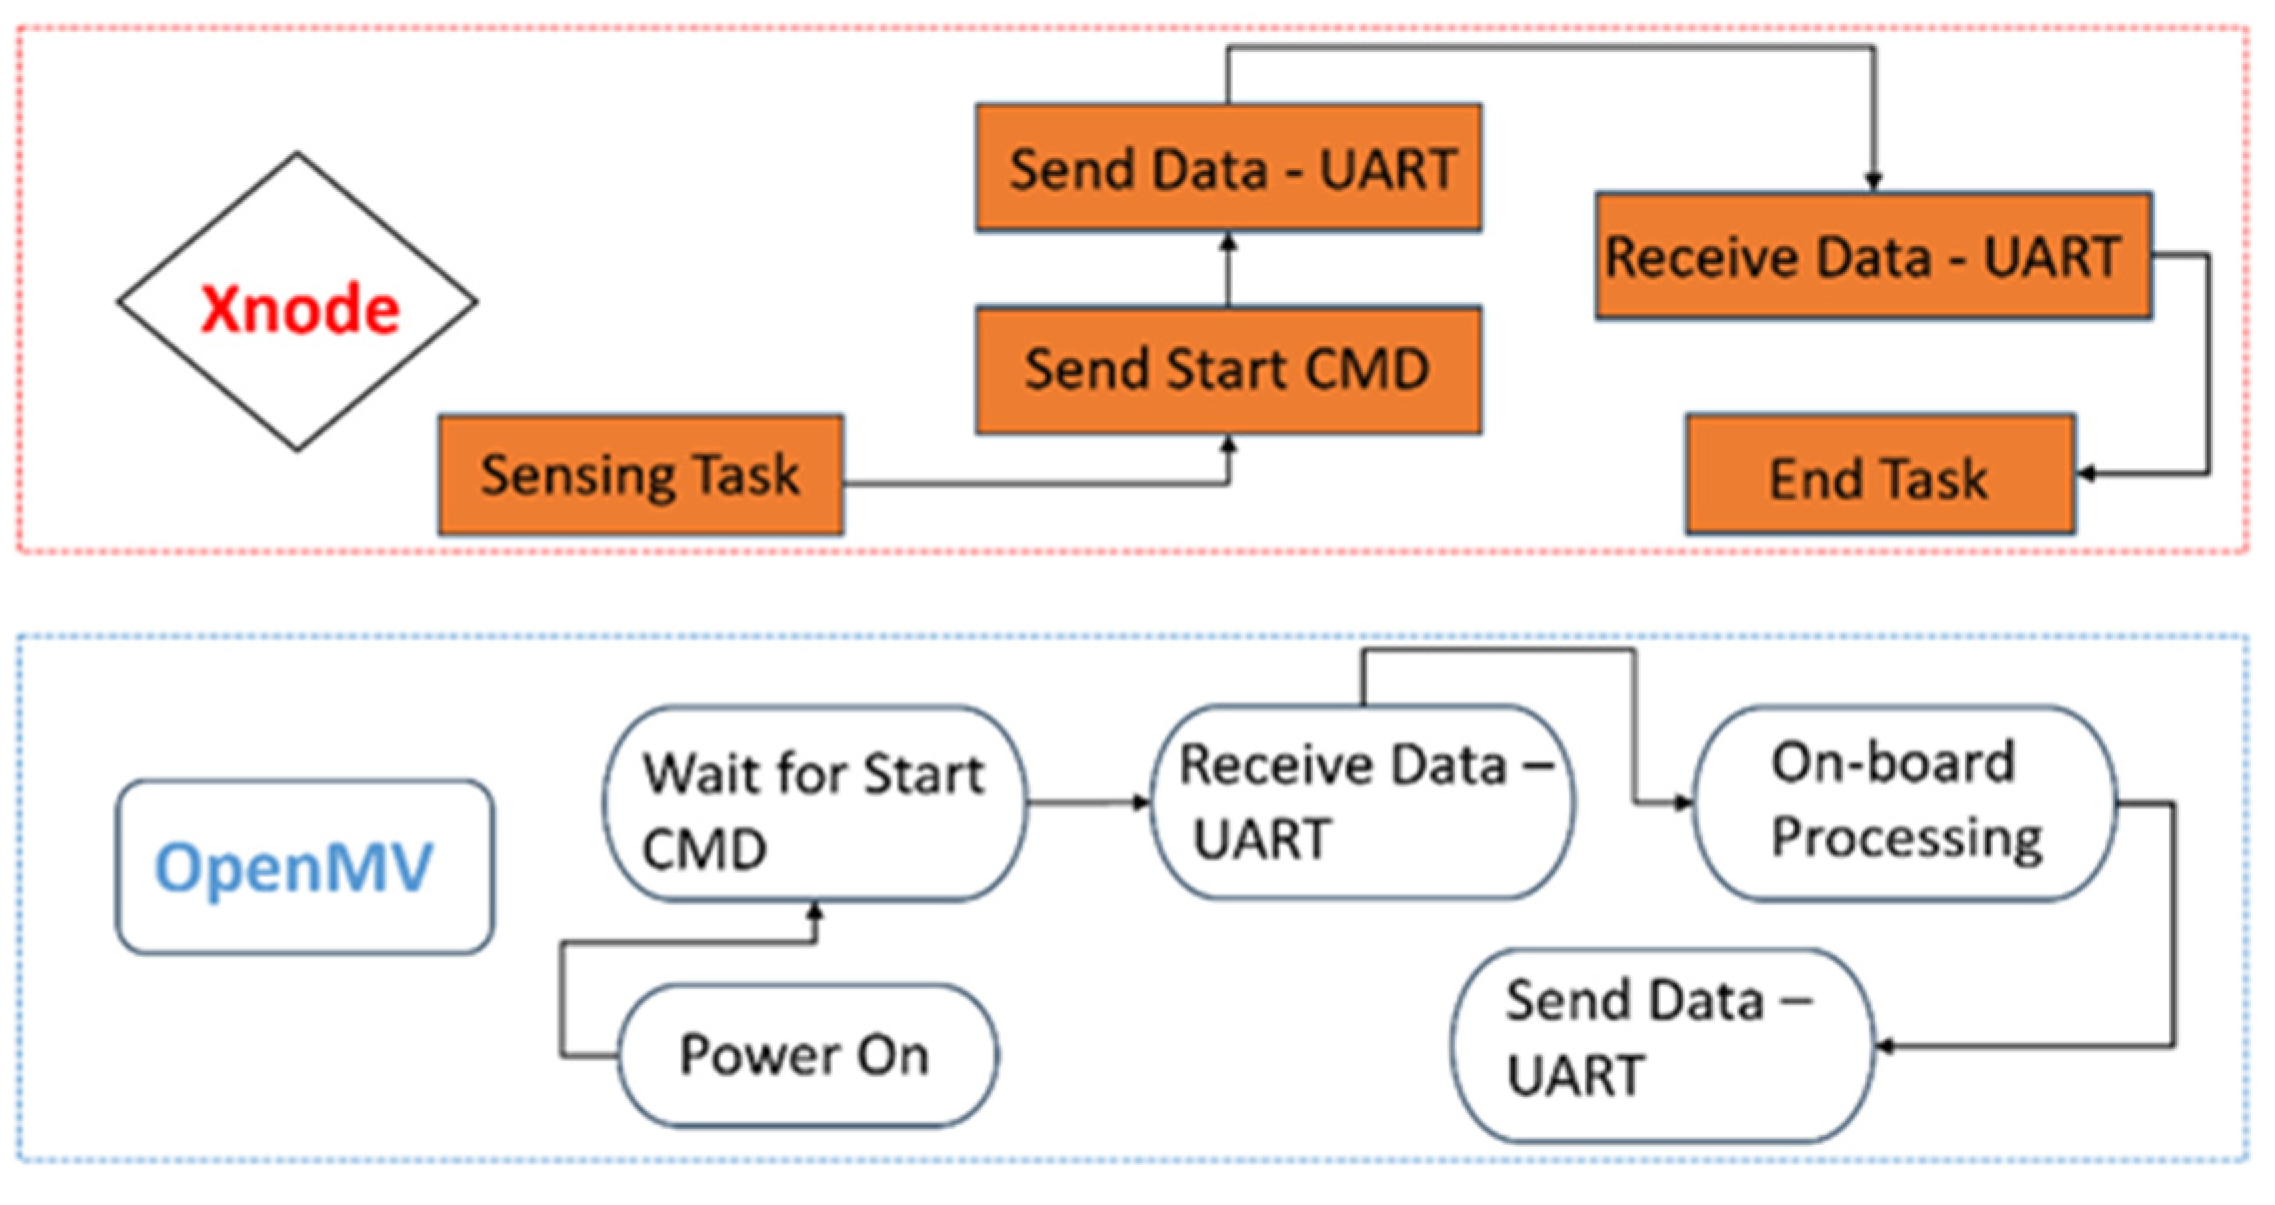
Figure 5.
Operational framework for edge implementation.
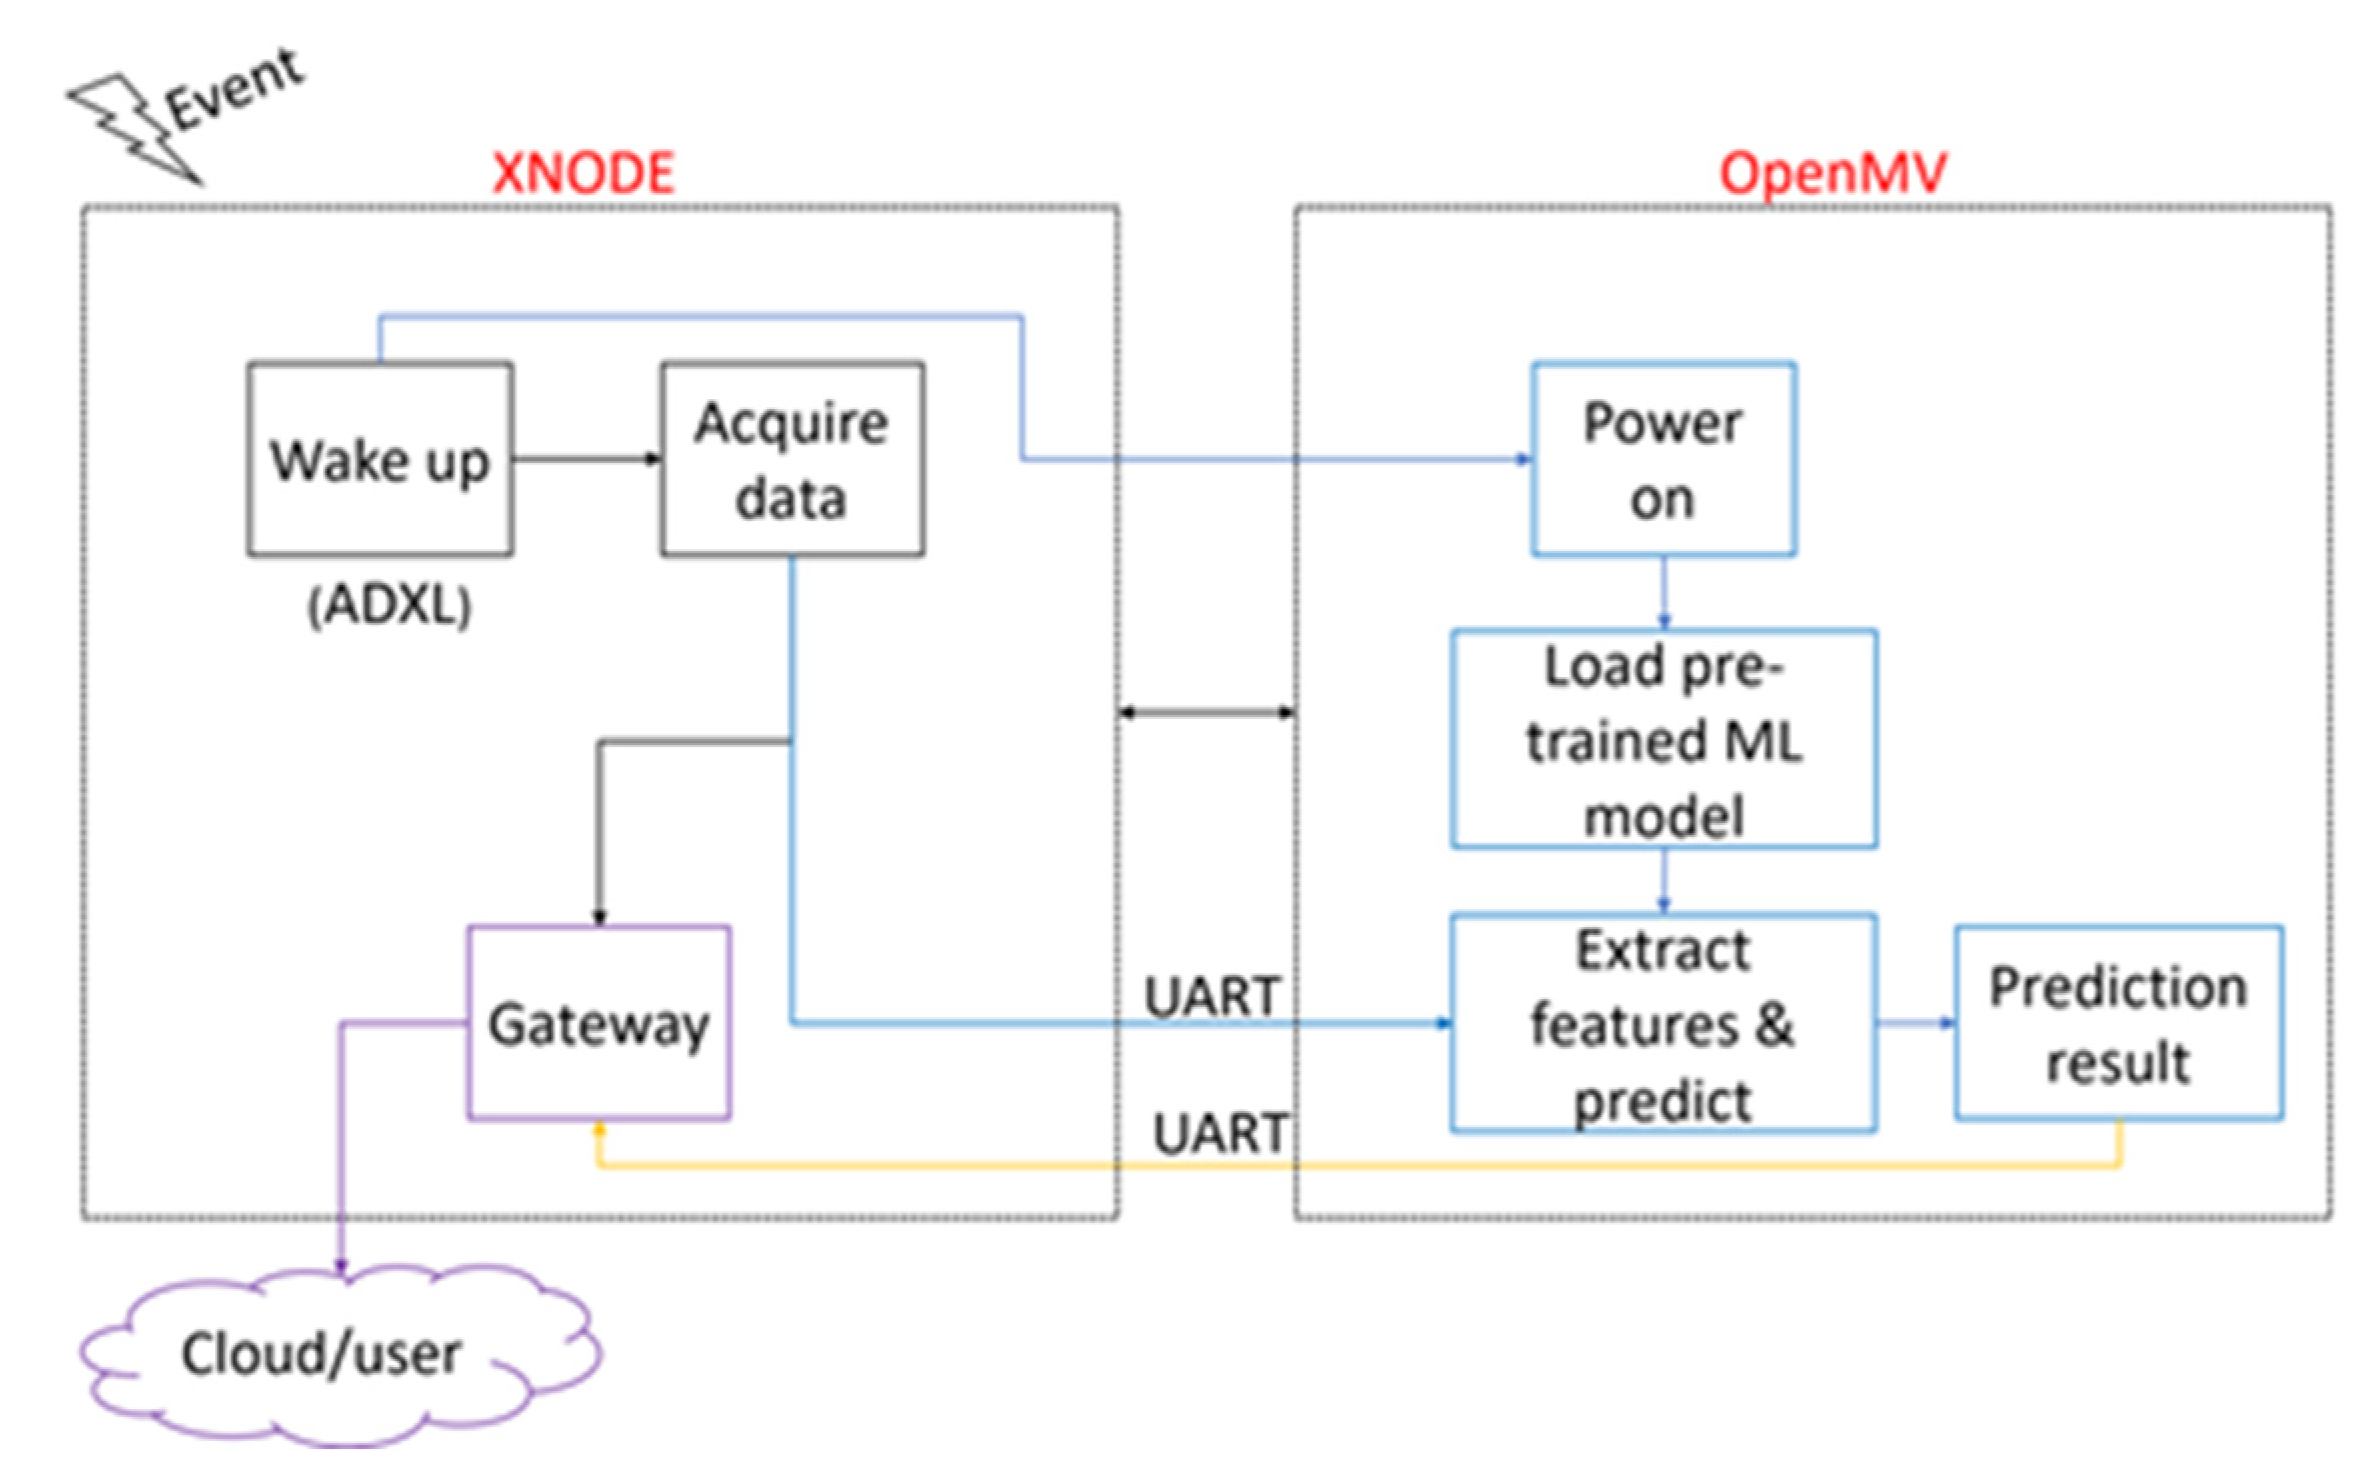
Figure 6.
Algorithm for event classification.

Figure 7.
Low-clearance railroad bridge instrumented with the Xnode.
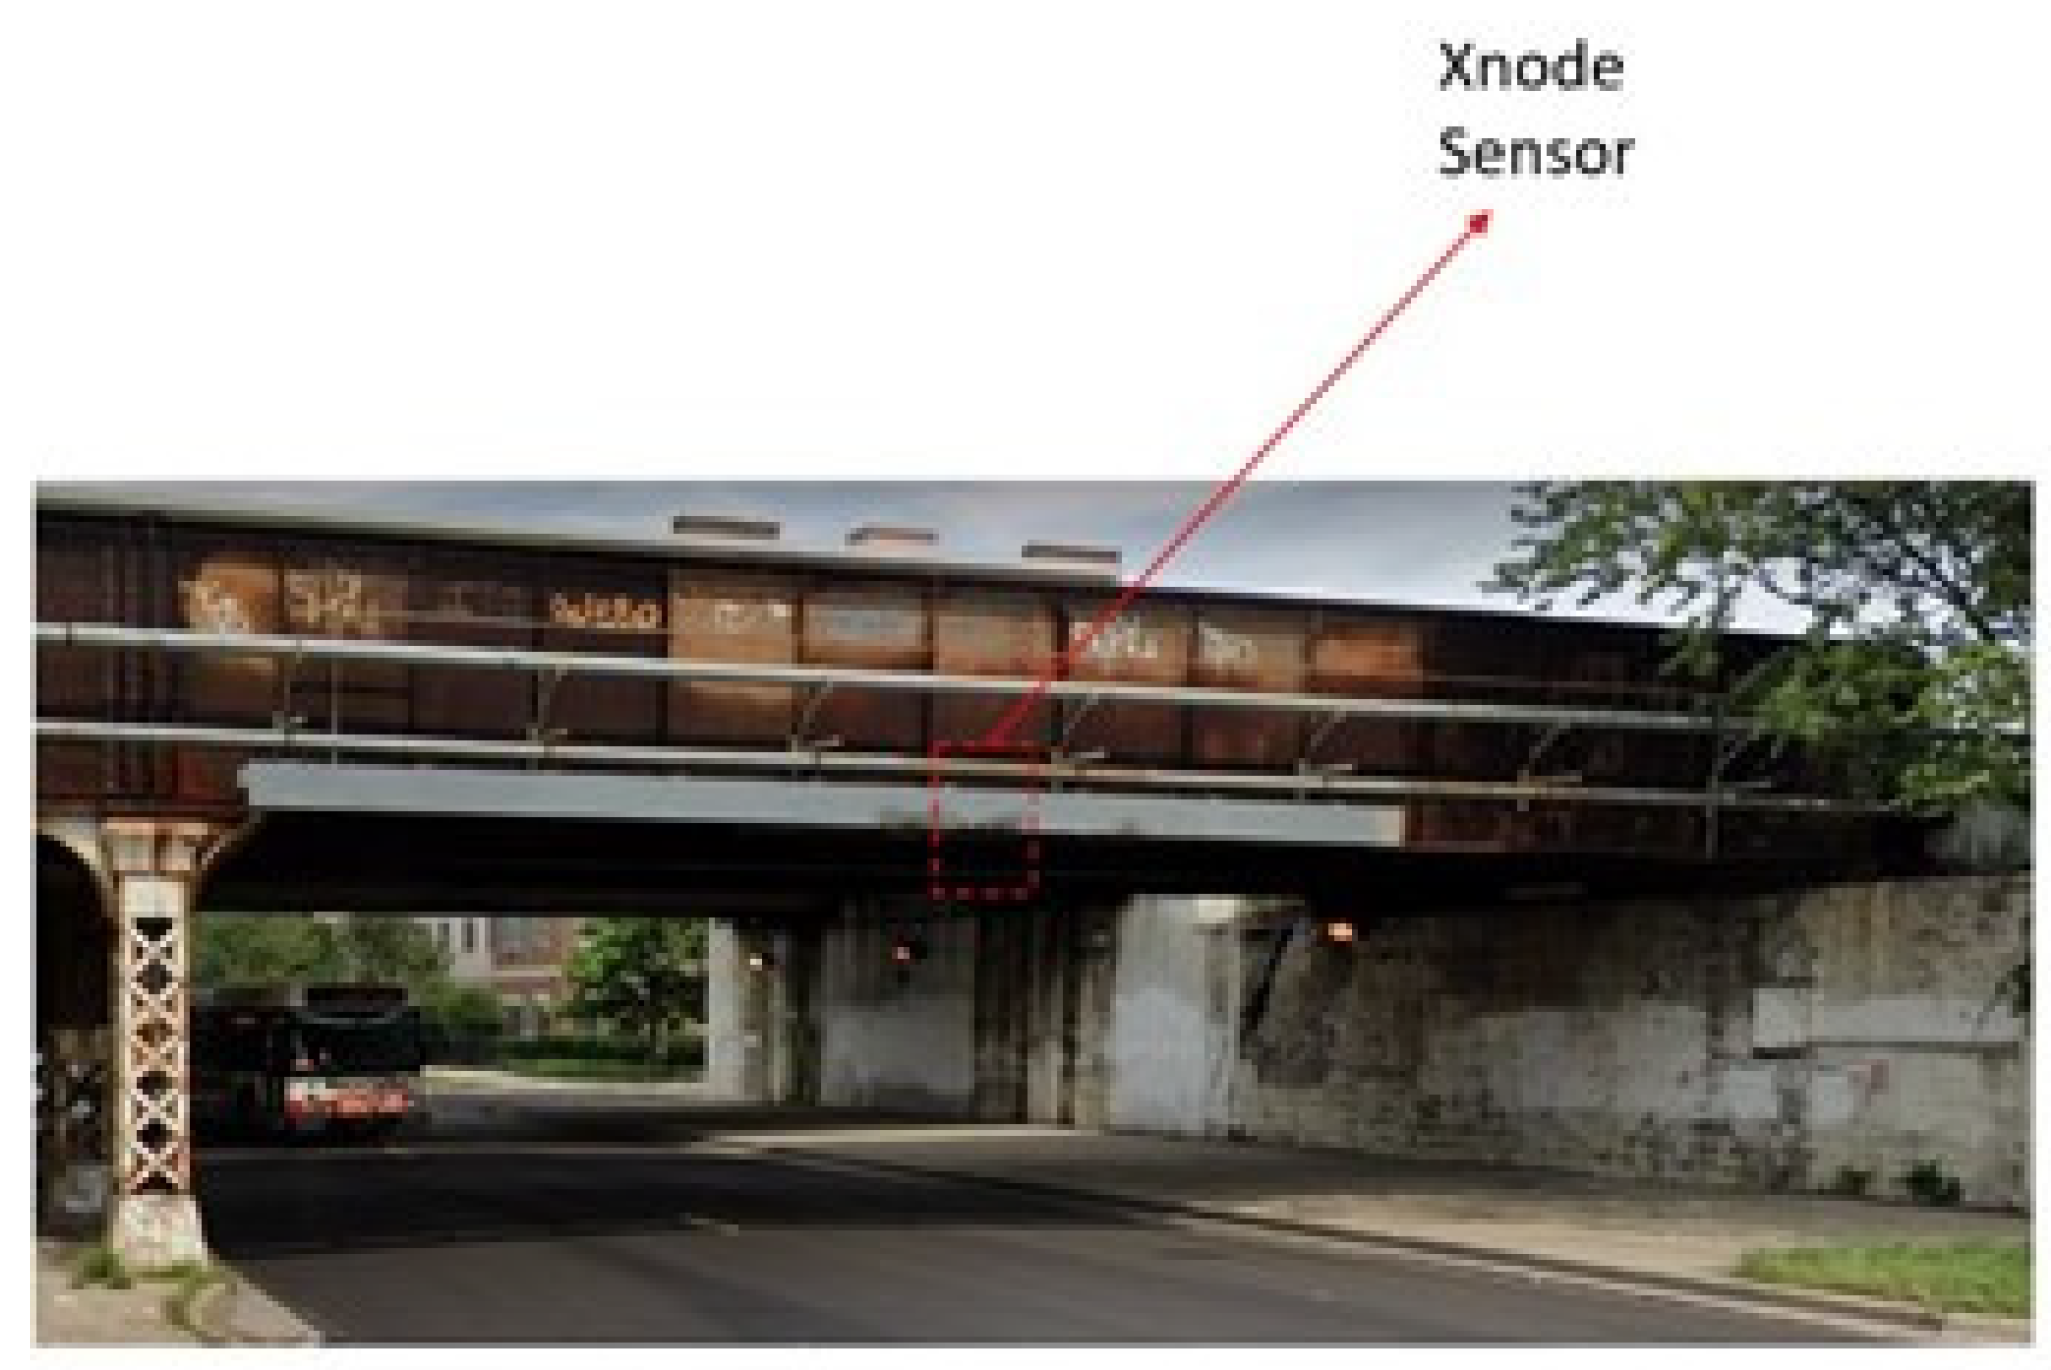
Figure 8.
Acceleration record of three tests in longitudinal (blue), vertical (green) and lateral (red) directions.
Figure 8.
Acceleration record of three tests in longitudinal (blue), vertical (green) and lateral (red) directions.
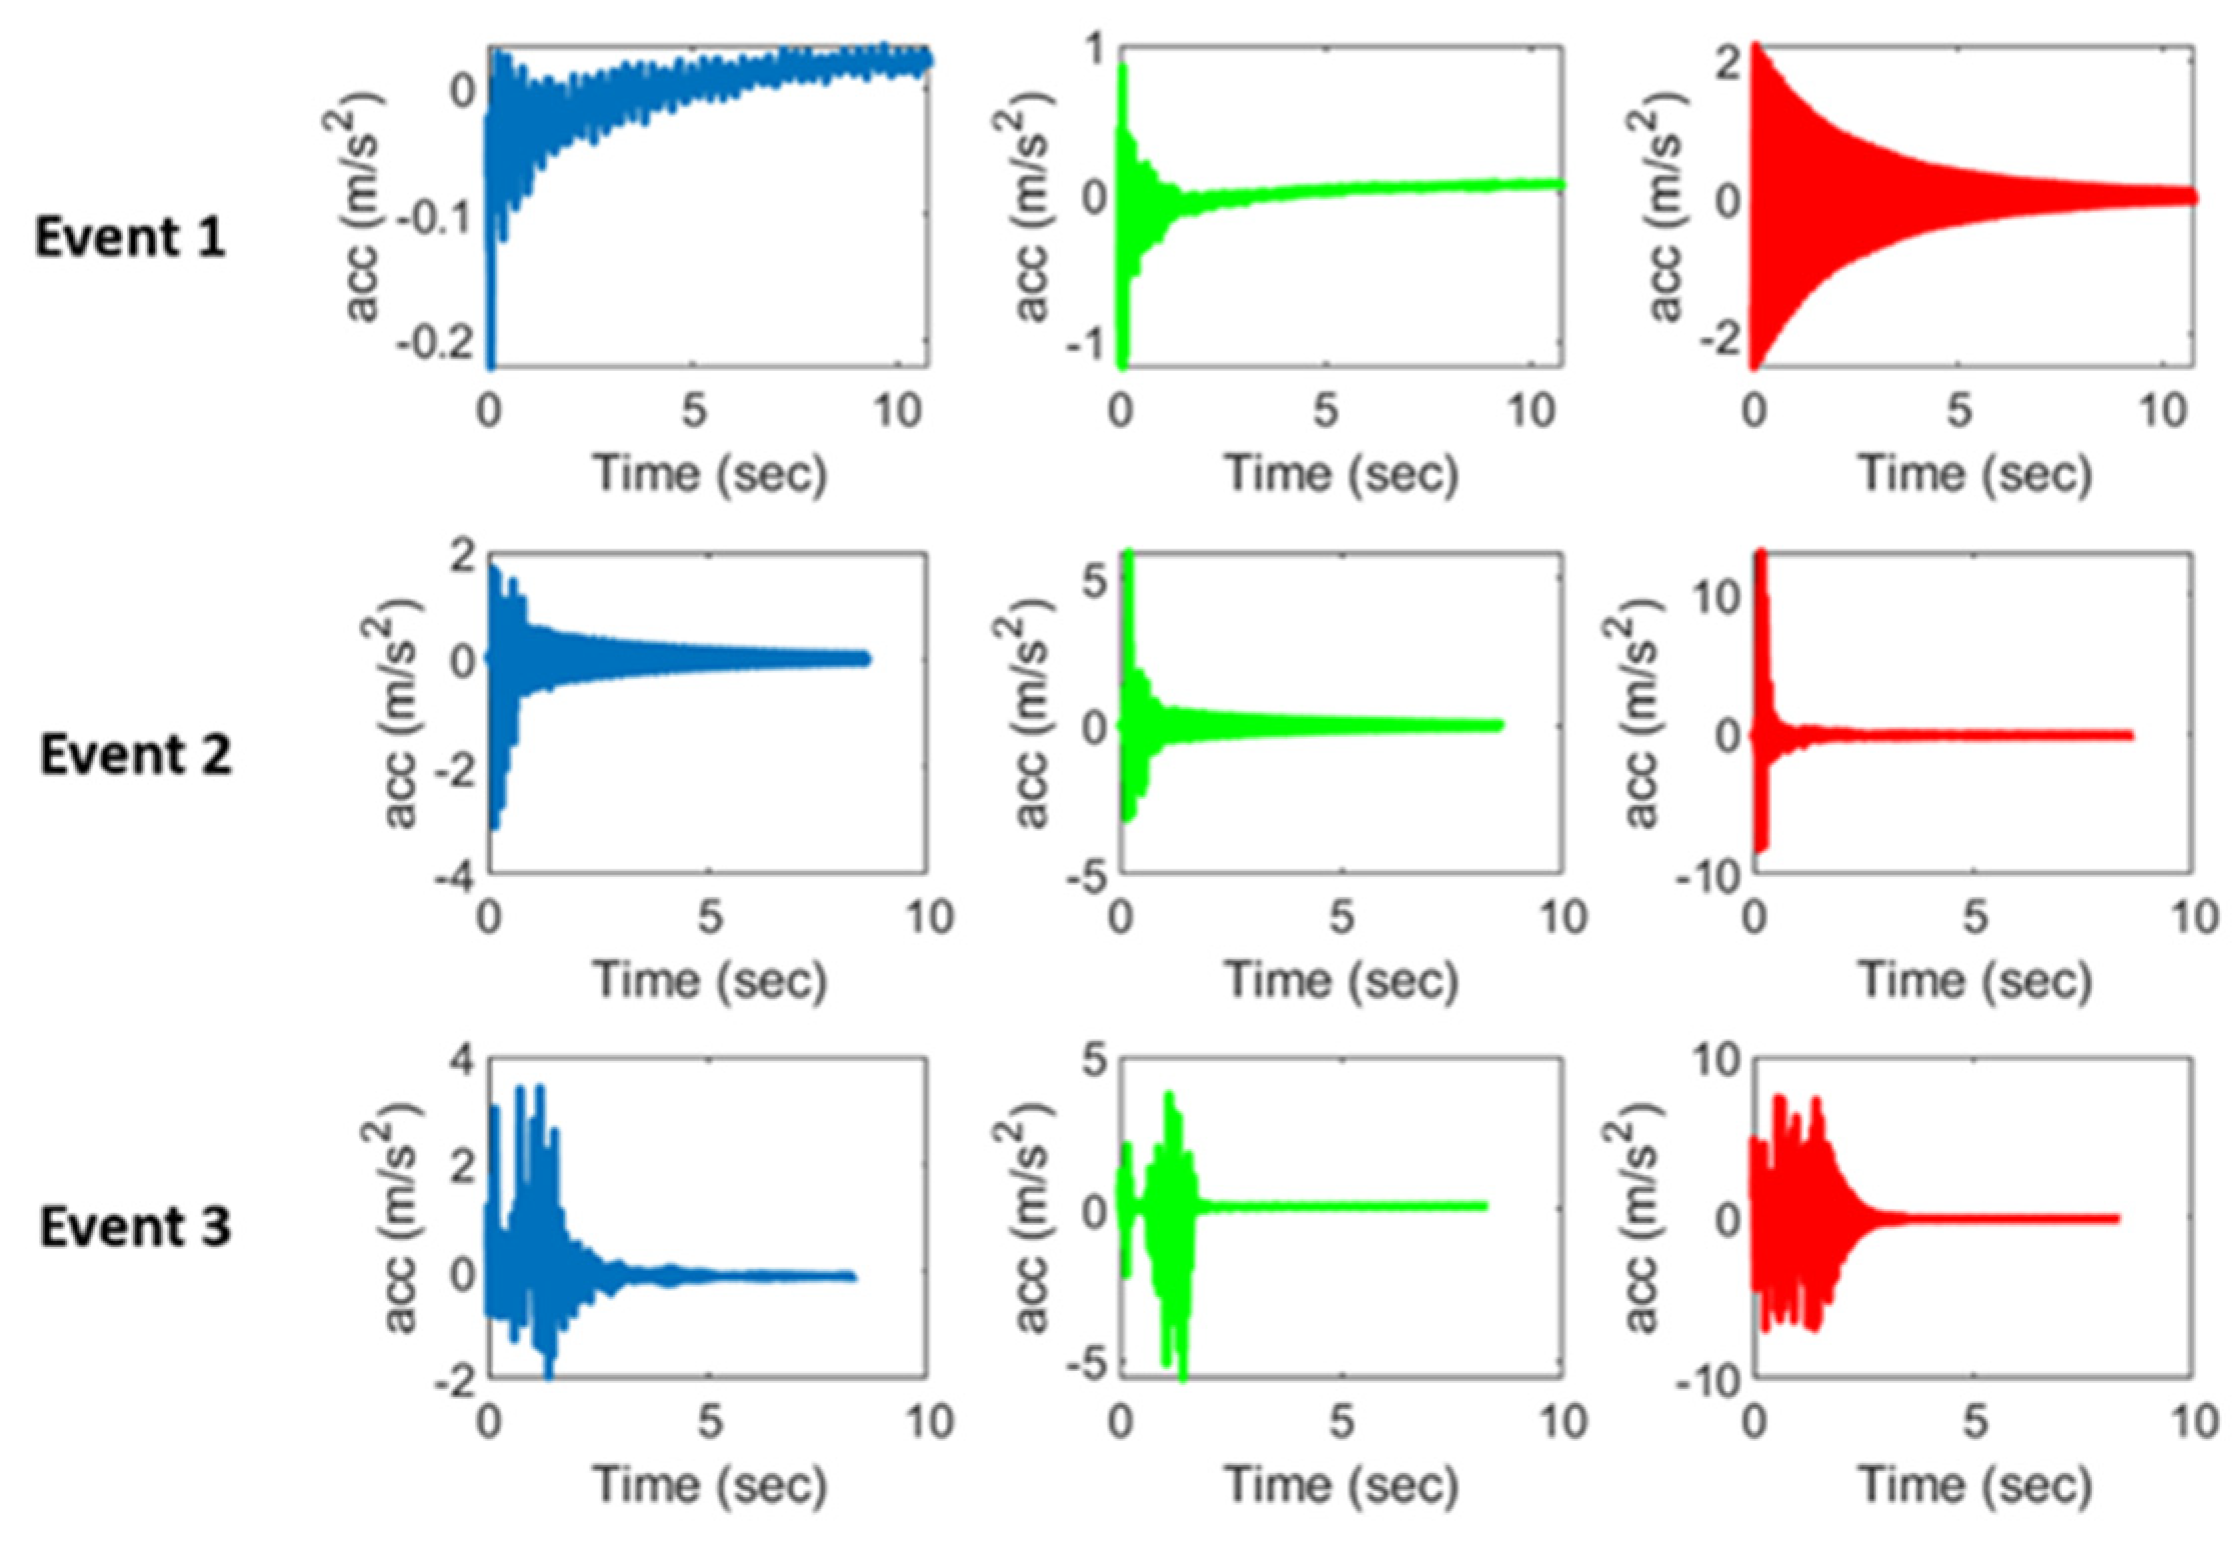
Figure 9.
Confusion Matrix for test examples (0 = train crossing, 1 = bridge impact).
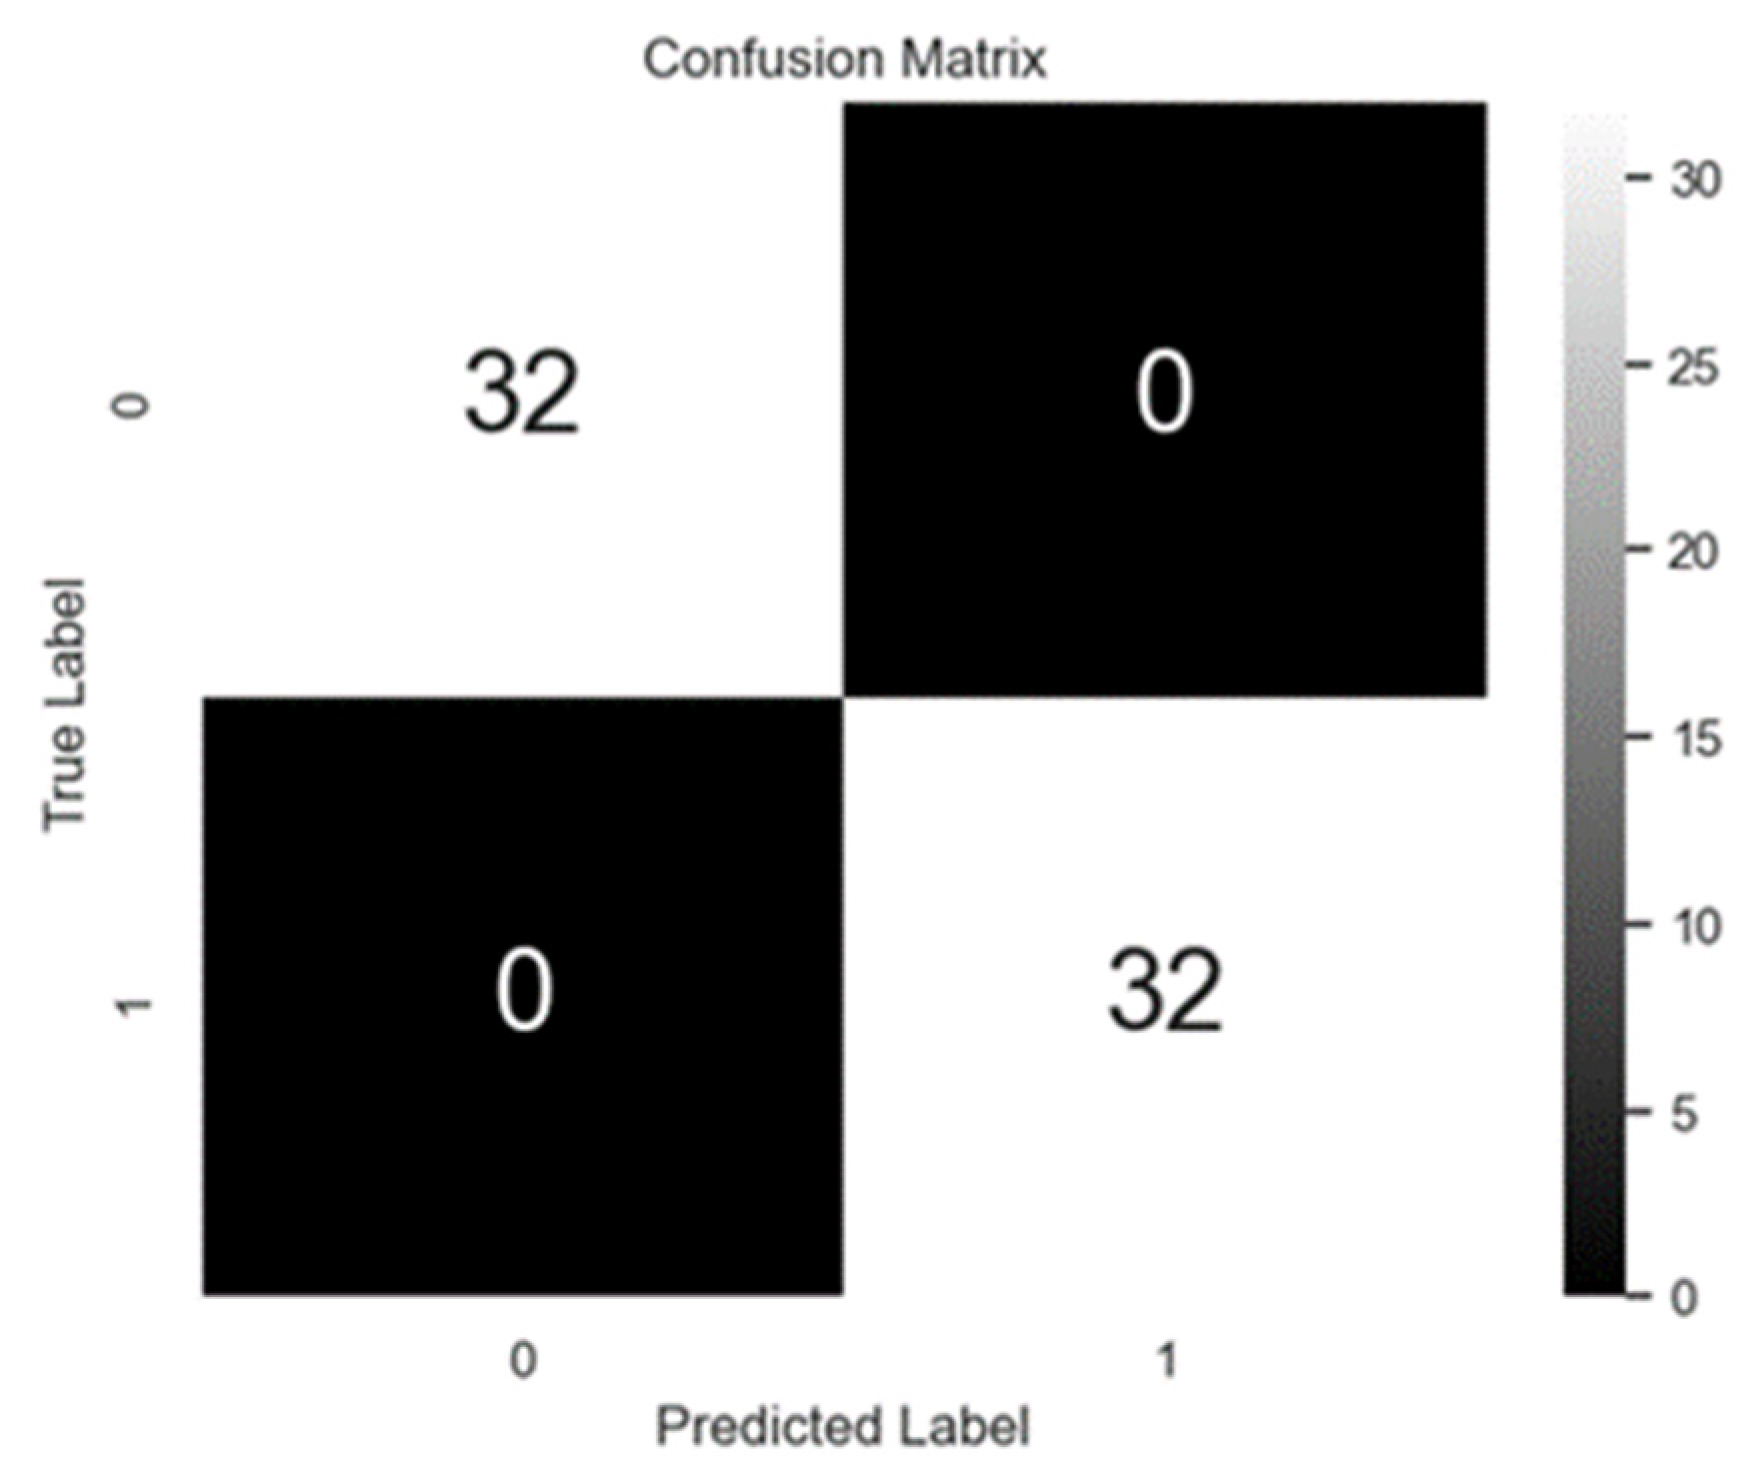
Figure 10.
Screenshot of Xnode terminal output after running ingerence on a test event.
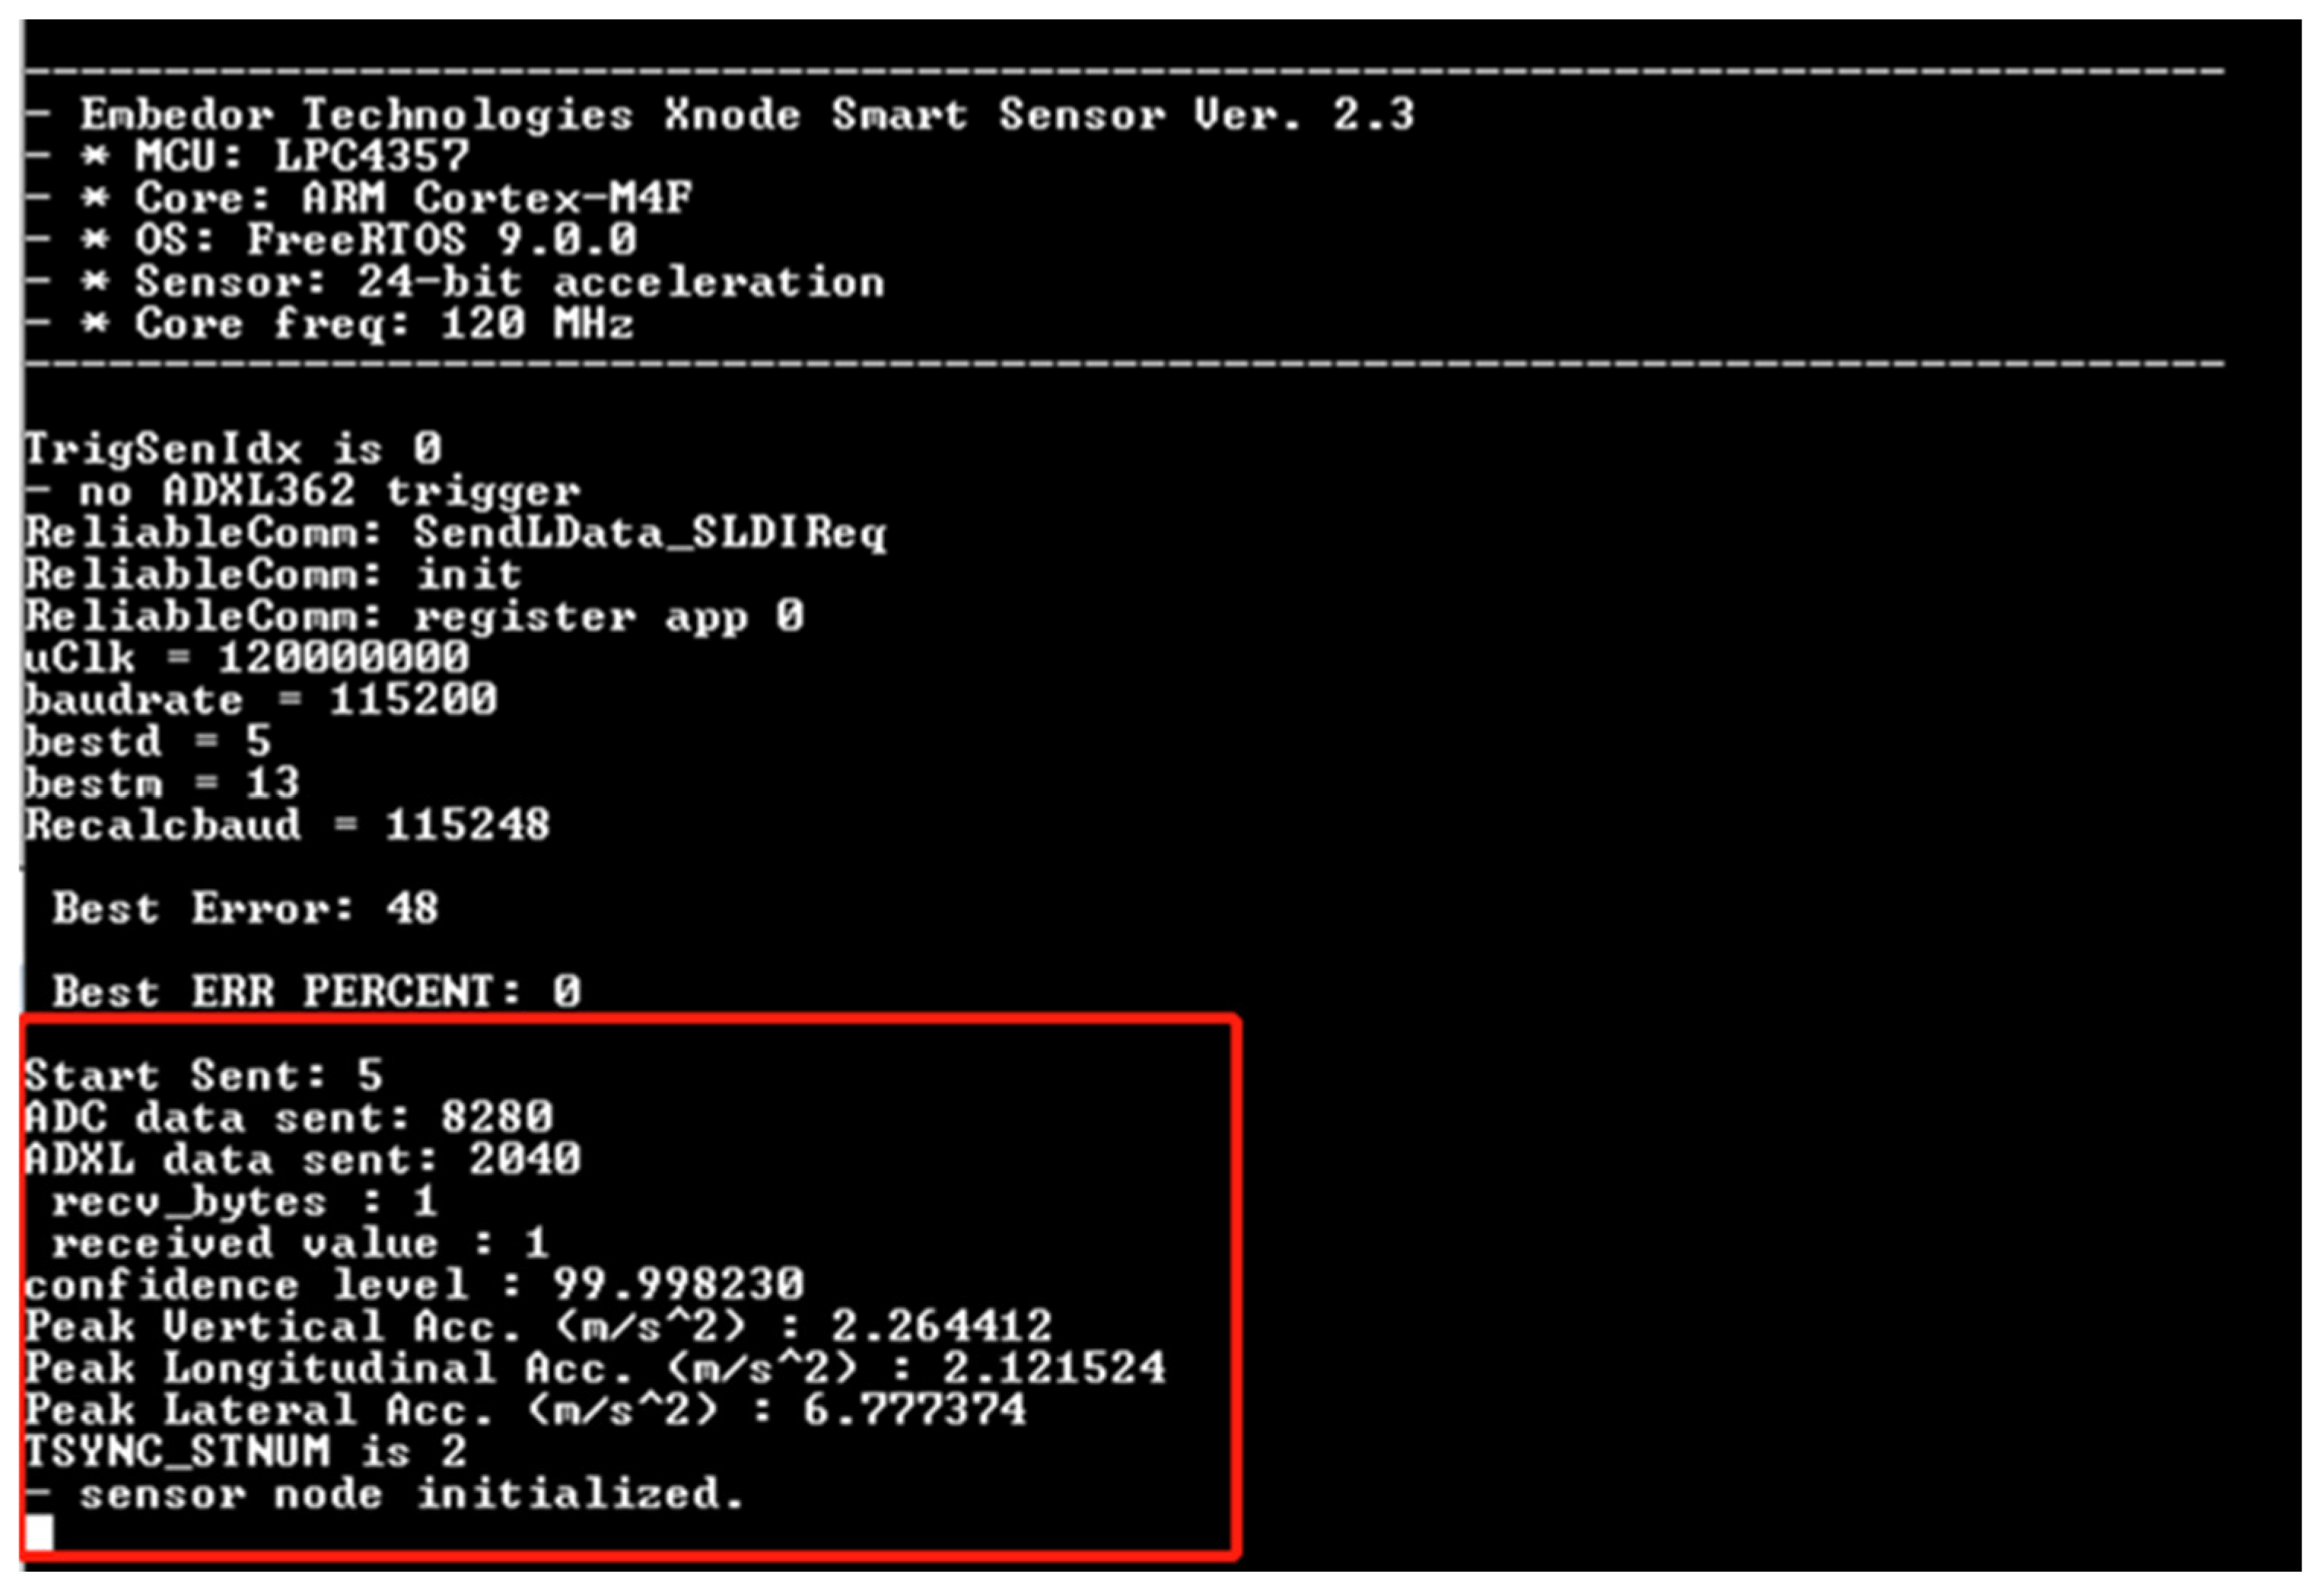
Table 1.
Technical specifications of OpenMV H7 Plus [30].
Table 1.
Technical specifications of OpenMV H7 Plus [30].
| Specification | OpenMV H7 Plus |
| Power | 240 mA @ 3.3 V |
| Microprocessor | Arm Cortex-M7 |
| Clock speed | 480 MHz |
| RAM | 32 MB |
| Programming | Micropython |
| Open source | Yes |
| Commercially available | Yes |
Table 2.
Summary results from selected test events.
| Event Number | Peak Longitudinal Acceleration (m/s2) | Peak Vertical Acceleration (m/s2) | Peak Lateral Acceleration (m/s2) | Classification Result |
| 1 | 2.1215 | 2.2644 | 6.7773 | Impact |
| 2 | 0.6733 | 0.8783 | 1.9868 | Impact |
| 3 | 2.267 | 8.1734 | 9.6672 | Impact |
| 4 | 15.1512 | 19.7129 | 30.8948 | Impact |
| 5 | 0.169 | 1.7734 | 1.664 | Train |
| 6 | 20.4395 | 29.67 | 33.1432 | Impact |
| 7 | 0.4972 | 4.4067 | 3.7558 | Train |
| 8 | 0.629 | 5.4063 | 3.0172 | Train |
| 9 | 2.3407 | 9.5216 | 6.1671 | Train |
| 10 | 0.5296 | 4.8359 | 3.7874 | Train |
Disclaimer/Publisher’s Note: The statements, opinions and data contained in all publications are solely those of the individual author(s) and contributor(s) and not of MDPI and/or the editor(s). MDPI and/or the editor(s) disclaim responsibility for any injury to people or property resulting from any ideas, methods, instructions or products referred to in the content. |
© 2024 by the authors. Licensee MDPI, Basel, Switzerland. This article is an open access article distributed under the terms and conditions of the Creative Commons Attribution (CC BY) license (http://creativecommons.org/licenses/by/4.0/).
Copyright: This open access article is published under a Creative Commons CC BY 4.0 license, which permit the free download, distribution, and reuse, provided that the author and preprint are cited in any reuse.
MDPI Initiatives
Important Links
© 2024 MDPI (Basel, Switzerland) unless otherwise stated


