1. Introduction
People with HIV (PWH) continue to experience neurological disorders even with the widespread implementation of suppressive antiretroviral therapy (ART). Despite the therapeutic success of ART in PWH, HIV-associated neuroinflammation can persist and contribute to neurocognitive impairment (NCI). Current estimates of PWH with comorbid HIV-associated neurocognitive impairment (NCI) range from 20% to greater than 50% in some countries [
1,
2,
3]. The Center for Disease Control and Prevention (CDC) recently estimated that over 53% of PWH in the United States were aged 50 and older [
4]. As such, PWH are susceptible to NCI as well as age-related neurological disorders, including deficits in learning, memory, attention, executive function, and motor skills [
5,
6]. Evidence of premature aging in PWH also includes abnormalities in white matter, increased levels of β-amyloid, mitochondrial dysfunction, reactive astrocytes and microgliosis [
7]. Given the high prevalence of NCI, and increased age of the population of PWH, novel in vivo, in vitro and ex vivo models are needed to provide mechanistic insights and to test therapeutic strategies.
Brain macrophages are major contributors to the chronic neuroinflammation in HIV infection and aging [
8,
9], and they populate the brain as three distinct cell types: microglia, perivascular macrophages, and monocyte-derived macrophages (MDMs)[
10]. Microglia and perivascular macrophages are resident in the parenchyma of the brain, whereas MDMs traverses the blood-brain-barrier and enter the brain during disease states including early during HIV infection [
10,
11]. Models for HIV-induced neurotoxicity, including the novel EcoHIV murine model [
12], indicate that proinflammatory brain macrophages are implicated in the neuropathogenesis of HIV [
13,
14]. Brain macrophages also contribute to homeostasis by modulating the inflammatory signaling and phagocytosing extracellular protein aggregates such as beta-amyloid and dying neurons, processes that may be disrupted in brains of PWH especially in those of increased age [
15,
16,
17,
18,
19]. Brain macrophages produce and respond to cytokines that promote inflammation and can contribute to neuronal injury and apoptosis, including the pro-inflammatory cytokine interleukin-1 beta (IL-1β), which is associated with neurotoxicity in PWH and in aging related neurodegenerative diseases [
20]. Thus, dampening the pro-inflammatory response of macrophages may provide potential therapeutic avenues to restore tissue homeostasis in the aging or HIV-infected brain.
Triggering receptor expressed on myeloid cells 2 (TREM2) is an immunomodulatory receptor expressed by brain macrophages and is pivotal in maintaining homeostasis in the brain [
21]. TREM2 plays a key role in inflammation by promoting phagocytosis, modulating inflammatory gene expression, and suppressing inflammatory signaling pathways [
22,
23,
24]. Additionally, TREM2 is involved in the recognition and clearance of dying neurons and protein aggregates such as Aβ[
21,
25,
26,
27,
28,
29,
30,
31,
32,
33,
34,
35], both of which are associated with HIV-associated neurocognitive impairment and Alzheimer’s Disease (AD) [
17,
36,
37,
38,
39,
40]. Soluble TREM2 (sTREM2), generated through the proteolytic cleavage of membrane-bound TREM2 by proteases such as ADAM10 and ADAM17, can act as a biomarker of microglial activation and neuroinflammation [
41]. Cleavage of TREM2 also results in the generation of C-terminal fragment [
42]. Abnormal expression of TREM2 and sTREM2 have been observed in the cerebrospinal fluid (CSF) and plasma of individuals with various neurodegenerative diseases, including AD and multiple sclerosis [
43,
44,
45]. Moreover, the TREM2 R47H gene variant, a single nucleotide polymorphism that results in an amino acid substitution at position 47, is a loss-of-function mutation that has also been associated with an increased risk of developing AD [
46,
47]. Individuals with the TREM2 R47H mutation may experience more severe neuroinflammatory responses in the presence of HIV, potentially leading to a higher risk of developing HAND and other neurocognitive impairments [
48]. Thus, understanding the function and regulation of TREM2, including in the context of the R47H mutation, is crucial for developing therapeutic strategies for both aging-related neurodegenerative diseases and HIV-associated neurocognitive impairment.
Cannabis use in PWH has previously shown therapeutical potential in managing HIV-associated complications [
49]. Recent studies have reported that PWH using cannabis have less immune cell activation compared to PWH that do not use cannabis [
50,
51]. Cannabis use in PWH is also associated with reduced inflammatory biomarkers in circulation [
52], decreased viral DNA found in tissues [
53], and a lower prevalence of neurocognitive impairment [
54,
55]. Delta-9-tetrahydrocannabinol (THC) and cannabidiol (CBD) are cannabinoids found in cannabis that have demonstrated promising anti-inflammatory properties crucial for managing neuroinflammation linked to neurodegenerative diseases [
56,
57]. CBD, known for lacking the psychoactive properties of THC, is particularly associated with significant anti-inflammatory effects by modulating the immune response to reduce inflammation and protect neural tissue from damage [
58,
59]. Additionally, activation of the cannabinoid type-2 receptor (CB2) on macrophages can reduce the production of pro-inflammatory cytokines while also promoting the release of anti-inflammatory molecules [
60]. Targeting cannabinoid receptor 2 (CB2) on peripheral immune cells may reduce the inflammatory mechanisms implicated in HAND, suggesting a pathway for therapeutic intervention [
61]. However, the precise pathways that mediate the anti-inflammatory and neuroprotective effect of cannabinoids is not fully understood, particularly in the context of PWH that use cannabis while on suppressive ART.
We hypothesized that cannabinoids like CBD promote TREM2 pathway signaling and that cannabis use in PWH can reverse the TREM2 dysfunction that mediates HIV neuropathogenesis. To begin investigation on the effect of HIV on TREM2 signaling, we used novel in vivo murine models. This is the first study to combine EcoHIV with the aging-related TREM2 R47H (TREM2R47H) mutant mouse model. This study is also the first of its kind to investigate the role of TREM2 in MDMs generated from a cohort of PWH with variable cannabis-use patterns. We examined whether HIV induces alterations in TREM2 and related gene expression and assessed the impact of cannabis use and cannabinoids on TREM2-related changes. The findings presented here reveal that HIV affects TREM2 signaling and this is modulated by cannabis use, opening up much needed new avenues for therapeutic targeting in PWH on ART.
2. Materials and Methods
2.1. Ethics
Animal studies were conducted in certified animal research facilities at the University of California, San Diego. These studies also abide by the animal care guidelines set in place by the Institutional Animal Care and Use Committee (IACUC; #S02221) with full compliance with NIH guidelines. Informed written consent was obtained from all participants of this study in compliance with the Institutional Review Board (IRB; #080323) approval at the University of California, San Diego.
2.2. Animals and Treatments
To determine if HIV infection induces learning and memory deficits in mice with the TREM2 R47H gene mutation, we utilized 11-12 month-old C57BL/6 wildtype (WT) and mutant TREM2R47H mice that were inoculated with saline (vehicle control) or EcoHIV (2.0 μg p24/mouse) via intraperitoneal (IP) injection. Behavioral testing was performed 4 weeks after treatment of all animals (total of 23 mice; n=5-6 per condition) and brain tissues were collected after completion of behavior tests. Total Activity Memory (TAM) testing was performed using a high-density Kinder Smart Frame cage rack system (Kinder Scientific, Poway, CA), which continuously monitors the animal’s location in X, Y, Z coordinate space within the chamber using a 7x5 beam configuration. On the day of testing, animals are transported in their home cages to the behavioral testing room for acclimation. Duration of test sessions was 10 minutes and all animals were tested for three consecutive days during the habituation phase, which was followed by a 72 hour gap before the final day of testing.
2.3. Western Blot Detection of TREM2
Mouse brain tissues were processed for TREM2 immunoblotting as previously described [
48]. Briefly, frontal cortex tissues from mouse brains (100 μg) were sonicated in lysis buffer (1.0 mM HEPES, 5.0 mM benzamidine, 2.0 mM β-mercaptoethanol, 3.0 mM EDTA, 0.5 mM magnesium sulfate, 0.05% sodium azide, pH 8.8) containing phosphatase inhibitor (Millipore; #524624) and protease inhibitor (Roche, #04693116001) cocktails. Samples were centrifuged at 2000 rpm at 4°C for 5 minutes before collection of supernatant containing whole lysates. Quantification of protein was conducted using a PierceTM Bicinchoninic Acid (BCA) Protein assay kit (Thermo Scientific; #23225). Protein lysates in 1X Laemmli Sample Buffer (Bio-Rad; #1610747) were vortexed, spun down, and incubated in a hot water bath at 95°C for 5 minutes. Samples were then loaded (15 μg protein per well) onto a 4–15 % CriterionTM TGX Stain-Free Protein Gel (Bio-Rad; #5678085) and electrophoresed at 200V for 45 minutes in Tris/Glycine/SDS running buffer (Bio-Rad; #1610772). Protein gels were transferred using the Trans-Blot Turbo Transfer System that includes PVDF membranes, transfer stacks, and transfer buffer from a Trans-Blot Turbo RTA transfer kit (Bio-Rad; #1704272). Gels were rinsed with water before imaging for total protein using a stain-free blot settings on a Bio-Rad ChemiDoc imager. Membranes were placed in 1X TBS 1% Casein Blocking Buffer (Bio-Rad; #1610782) for one hour at room temperature before overnight incubation at 4°C with primary antibody for rabbit anti-TREM2 (Thermo Scientific; #PA5-87933; 1:1000). Following removal of primary antibody, blots were washed in 1X PBS for 5 minutes before adding HRP-conjugated Goat Anti-Rabbit IgG secondary antibody (Bio-Rad; #1706515; 1:5000) for 1 hour at room temperature. SuperSignal
® West Femto enhanced chemiluminescent substrate (Thermo Scientific; #TG26840A) was applied for visualization of protein bands on membranes. The blots were then stripped using Western Blot Stripping Buffer (Thermo Scientific; #21059) and re-probed with a mouse monoclonal antibody against β-actin (ACTB; Sigma-Aldrich; #A5316; 1:2000) as a loading control. Images were captured, and semi-quantitative analysis was performed on Image Lab Software (Bio-Rad v6.1).
2.4. Immunohistochemistry of Brain Sections
To determine if HIV infection affects levels of microgliosis and astrogliosis, mouse brains were collected immediately after behavioral analyses and fixed in 4% paraformaldehyde for 5 days before being sectioned and immunostained. Free-floating 40 μm thick vibratome sections of mouse brains were washed with phosphate-buffered saline with Tween 20 (PBST) three times for 5 minutes each. The sections were then pre-treated with 3% H2O2 in PBST 1% Triton X-100 for 20 minutes to block endogenous peroxidase activity. Following pretreatment, sections were blocked with 2.5% horse serum (Vector Laboratories; #2-2012) for 30 minutes at room temperature. Primary antibodies for GFAP (Sigma; #G3893; 1:500) and IBA1 (Wako; #019-19741; 1:1000) were applied to the sections and then incubated overnight at 4°C. Primary antibodies were removed the following day and sections were washed three times with PBST for 5 minutes each. Sections were then incubated with the appropriate secondary antibody, Immpress HRP Anti-rabbit IgG (Vector Laboratories; #MP-7401) or Immpress HRP Anti-mouse IgG (Vector Laboratories; #MP-7402), for 30 minutes at room temperature on a rocker. After washing twice with PBST for 5 minutes each, sections were treated with NovaRED Peroxidase (HRP) Substrate (Vector Laboratories; #SK-4800) and incubated until the desired stain was achieved. Control sections were incubated with secondary antibodies only. After staining, tissues were carefully mounted on Superfrost plus slides (VWR International: #48311-703) using diH2O and dried in the dark for 1 hour. Coverslips were applied with Vectashield mounting media (Vector Laboratories; #H-1000-10). Immunostained sections were imaged with a digital Olympus microscope and levels of GFAP and IBA1 immunoreactivity were quantified using Image-Pro Plus software (Media Cybernetics, Silver Spring, MD). For each slide, areas of interest in the hippocampus, including CA1, CA2/3, and DG regions, were analyzed to estimate the average intensity of the immunostaining, corrected for background levels obtained from tissue sections processed without primary antibody. The corrected optical density was calculated as follows: corrected optical density = optical density − background.
2.5. Study Population
This study recruited people with HIV (PWH) and people without HIV (PWoH) with varying demographic characteristics (e.g., age, sex). All PWH on stable antiretroviral therapy (ART) for at least six months were considered virally suppressed. Participants were grouped based on their HIV status and cannabis use patterns following recruitment in San Diego, CA, USA. To account for variability in cannabis use characteristics (e.g., frequency, quantity, mode of administration, cannabinoid content), both laboratory measures and self-report questionnaires were used to comprehensively characterize current and lifetime cannabis use. Prior to the assessment, current cannabis users were asked to adhere to their regular use pattern to mitigate potential withdrawal effects. Cannabis use groups were categorized as naive (never used or used ≤6 times/year with ≥ 60 days of abstinence), moderate (one to six uses a week), or daily (seven days a week). In addition to comprehensive medical and neurobehavioral assessments, participants also underwent venous blood collection. Individuals who tested positive for substances other than cannabis were excluded or rescheduled to minimize potentially confounding effects of acute substance use. Additional exclusion criteria include uncontrolled medical, psychiatric, or neurological conditions; a DSM diagnosis of moderate to severe drug use disorder other than cannabis within the past five years, or mild use disorder within the past six months (excluding tobacco); moderate to severe alcohol use disorder within the past 12 months; safety contraindications for MRI; renal insufficiency, which may increase the risk for nephrogenic systemic fibrosis associated with gadolinium-based contrast agents; allergy to gadolinium-based contrast agents; pregnant or breastfeeding. A total of 55 eligible participants (see
Table 1) were included in data from this study.
2.6. Separation and Treatment of Monocyte-Derived Macrophages (MDM)
Peripheral blood mononuclear cell (PBMC) isolation was performed on donor blood by ficoll gradient separation. Briefly, 15 mL of donor blood was slowly layered onto 15mL of HISTOPAQUE-1077 (Sigma Life Sciences; #10771) and centrifuged at 400g for 30 minutes. The monocyte layer was collected, washed with 1X PBS, and centrifuged at 250g before resuspending cells in Iscove’s Modified Dulbecco’s Medium (IMDM; Gibco; #12440053) supplemented with 10% human serum (Millipore Sigma; #H5667), 1% penicillin/streptomycin (Gibco; #15140122). Automated cell counting was performed on a Countess™ 3 FL (ThermoFisher Scientific; #AMQAF2000) using 0.4% trypan blue solution (Amresco; #K940100ML). Cells were plated in 24-well plates (Corning; #3524) at 400,000 cells/well for RNA testing or 96-well plates (Thermo Scientific; #164588) at 100,000 cells/well for protein testing. Cells were maintained and differentiated in a humidified incubator at 5% CO2 and 37C over 7 days before receiving experimental treatment. Monocyte-derived macrophages (MDMs) were pre-treated for one hour with cannabidiol (CBD; Cerilliant Supelco; #C-045; 30 µM) before incubating with IL1β (Invivogen; #6409-44-01; 20 ng/mL) for 6h prior to RNA isolation or 24h prior to fixation and immunostaining. Additional pre-treatments for inhibitor studies include AM 251 (CB1 antagonist; Tocris; #1117; 10 uM), AM 630 (CB2 antagonist; Tocris Bioscience; #1120; 10 uM), GW 6471 (PPARα antagonist; Cayman Chemical; #11697; 10 uM), or GW 9662 (PPARγ antagonist; Cayman Chemical; #70785; 10 uM). Supernatants were collected and MDMs were washed with 1X PBS prior to RNA isolation or fixation with 4% paraformaldehyde (PFA) solution in PBS (Thermo Scientific; #J19943K2).
2.7. Real-Time Quantitative Polymerase Chain Reaction (qPCR) and RNA-Sequencing
RNA isolation was performed according to manufacturer’s instructions via Qiagen RNeasy Plus Mini Kit (Qiagen; #74136). Total RNA from MDMs was used for RNA-sequencing and RT-qPCR after being analyzed for purity and concentration with a spectrophotometer. RNA was reverse transcription to cDNA using the High Capacity cDNA Reverse Transcription Kit (Applied Biosystems; #4368814) with the kit provided instructions. Multiplex relative quantification assays were performed on a QuantStudio 3 Real-Time PCR machine (Applied Biosystems; #A28567) using TaqMan Fast Advanced Master Mix for qPCR (Applied Biosystems; #4444557) and individual probes for TREM2 (Hs00219132_m1; #4351370), CHIT1 (Hs00185753_m1; #4448892), SMAD3 (Hs00969210_m1; #4453320), ZAP70 (Hs00896345_m1; #4448892), TREM1 (Hs00218624_m1; #4453320), and VSIG4 (Hs00200695_m1; 4453320). For each assay, ACTB (Applied Biosystems; #4310881E) was used as the endogenous control and fold change in gene expression was quantified via the comparative Ct method, as previously described [
62]. All donor samples were run in technical duplicates. RNA-Sequencing was performed at the UC San Diego IGM Genomics Center utilizing an Illumina NovaSeq 6000 that was purchased with funding from a National Institutes of Health SIG grant (#S10 OD026929). The libraries were sequenced on a NovaSeq S4 flow cell, with initial quality control checks, including per-base sequence quality, GC content, and sequence duplication levels conducted using FastQC (v0.11.9). Clean reads were aligned to the hg38 human reference genome using STAR aligner (v2.7.9a) with default parameters on the Illumina BaseSpace Sequence Hub platform. Differential expression analysis was conducted using DESeq2 (v1.30.0) in R (v4.0.5), with genes displaying a false discovery rate (FDR) < 0.05 considered significantly differentially expressed. Gene ontology (GO) and pathway enrichment analyses were performed using PANGEA (v1.1) and identified significantly enriched GO terms and pathways with a corrected p-value < 0.05.
2.8. Enzyme-Linked Immunosorbent Assay (ELISA)
Supernatants collected from treated MDMs were processed to determine levels of sTREM2 using a Human TREM-2 ELISA Kit (Sigma-Aldrich, St. Louis, MO, USA; # RAB1091). Samples were assessed in duplicate and absorbance was measured at 450 nm using a Synergy HTX plate reader (BioTek Instruments Inc., USA).
2.9. Immunocytochemistry for TREM2
Cells were washed twice with 1X PBS and subsequently fixed with PFA (4% w/v) for 20 minutes at 4°C followed by two washes with 1X PBS. The fixed cells were then incubated with blocking buffer (5% BSA, 0.2% Triton-X in 1X PBS) for one hour at room temperature. Primary antibodies for TREM2 (Thermo Scientific; #PA5-87933) were added in blocking buffer (1:250 dilution) and cells were incubated overnight at 4°C. After primary antibody incubation, cells were washed three times with 1X PBS. Alexa Fluor conjugated secondary antibodies (Invitrogen; #A21039) in 1X PBS (1:500 dilution) were then added and incubated for 30 minutes at room temperature on a shaker. Secondary antibodies were removed and cells were washed twice with 1X PBS before being incubated with DAPI solution (Thermo Scientific; #D3571; 1:10,000 dilution in 1X PBS) for 5 minutes. The cells were washed twice then kept in 1X PBS before fluorescent imaging on a CellInsight CX5 HCS Platform (Thermo Scientific; #CX51110).
2.10. Statistical Analysis
All data presented as mean ± SEM with statistical analyses that include one-way and two-way ANOVA with Holm-Sidak post-hoc multiple comparisons tests when appropriate, unless stated otherwise. Statistical significance was determined at p<0.05 for all data, with individual p-values reported when near the significance threshold. All sample sizes and data normalizations are listed in figure legends. Data was analyzed on GraphPad Prism 10.0 software (San Diego, CA, USA).
4. Discussion
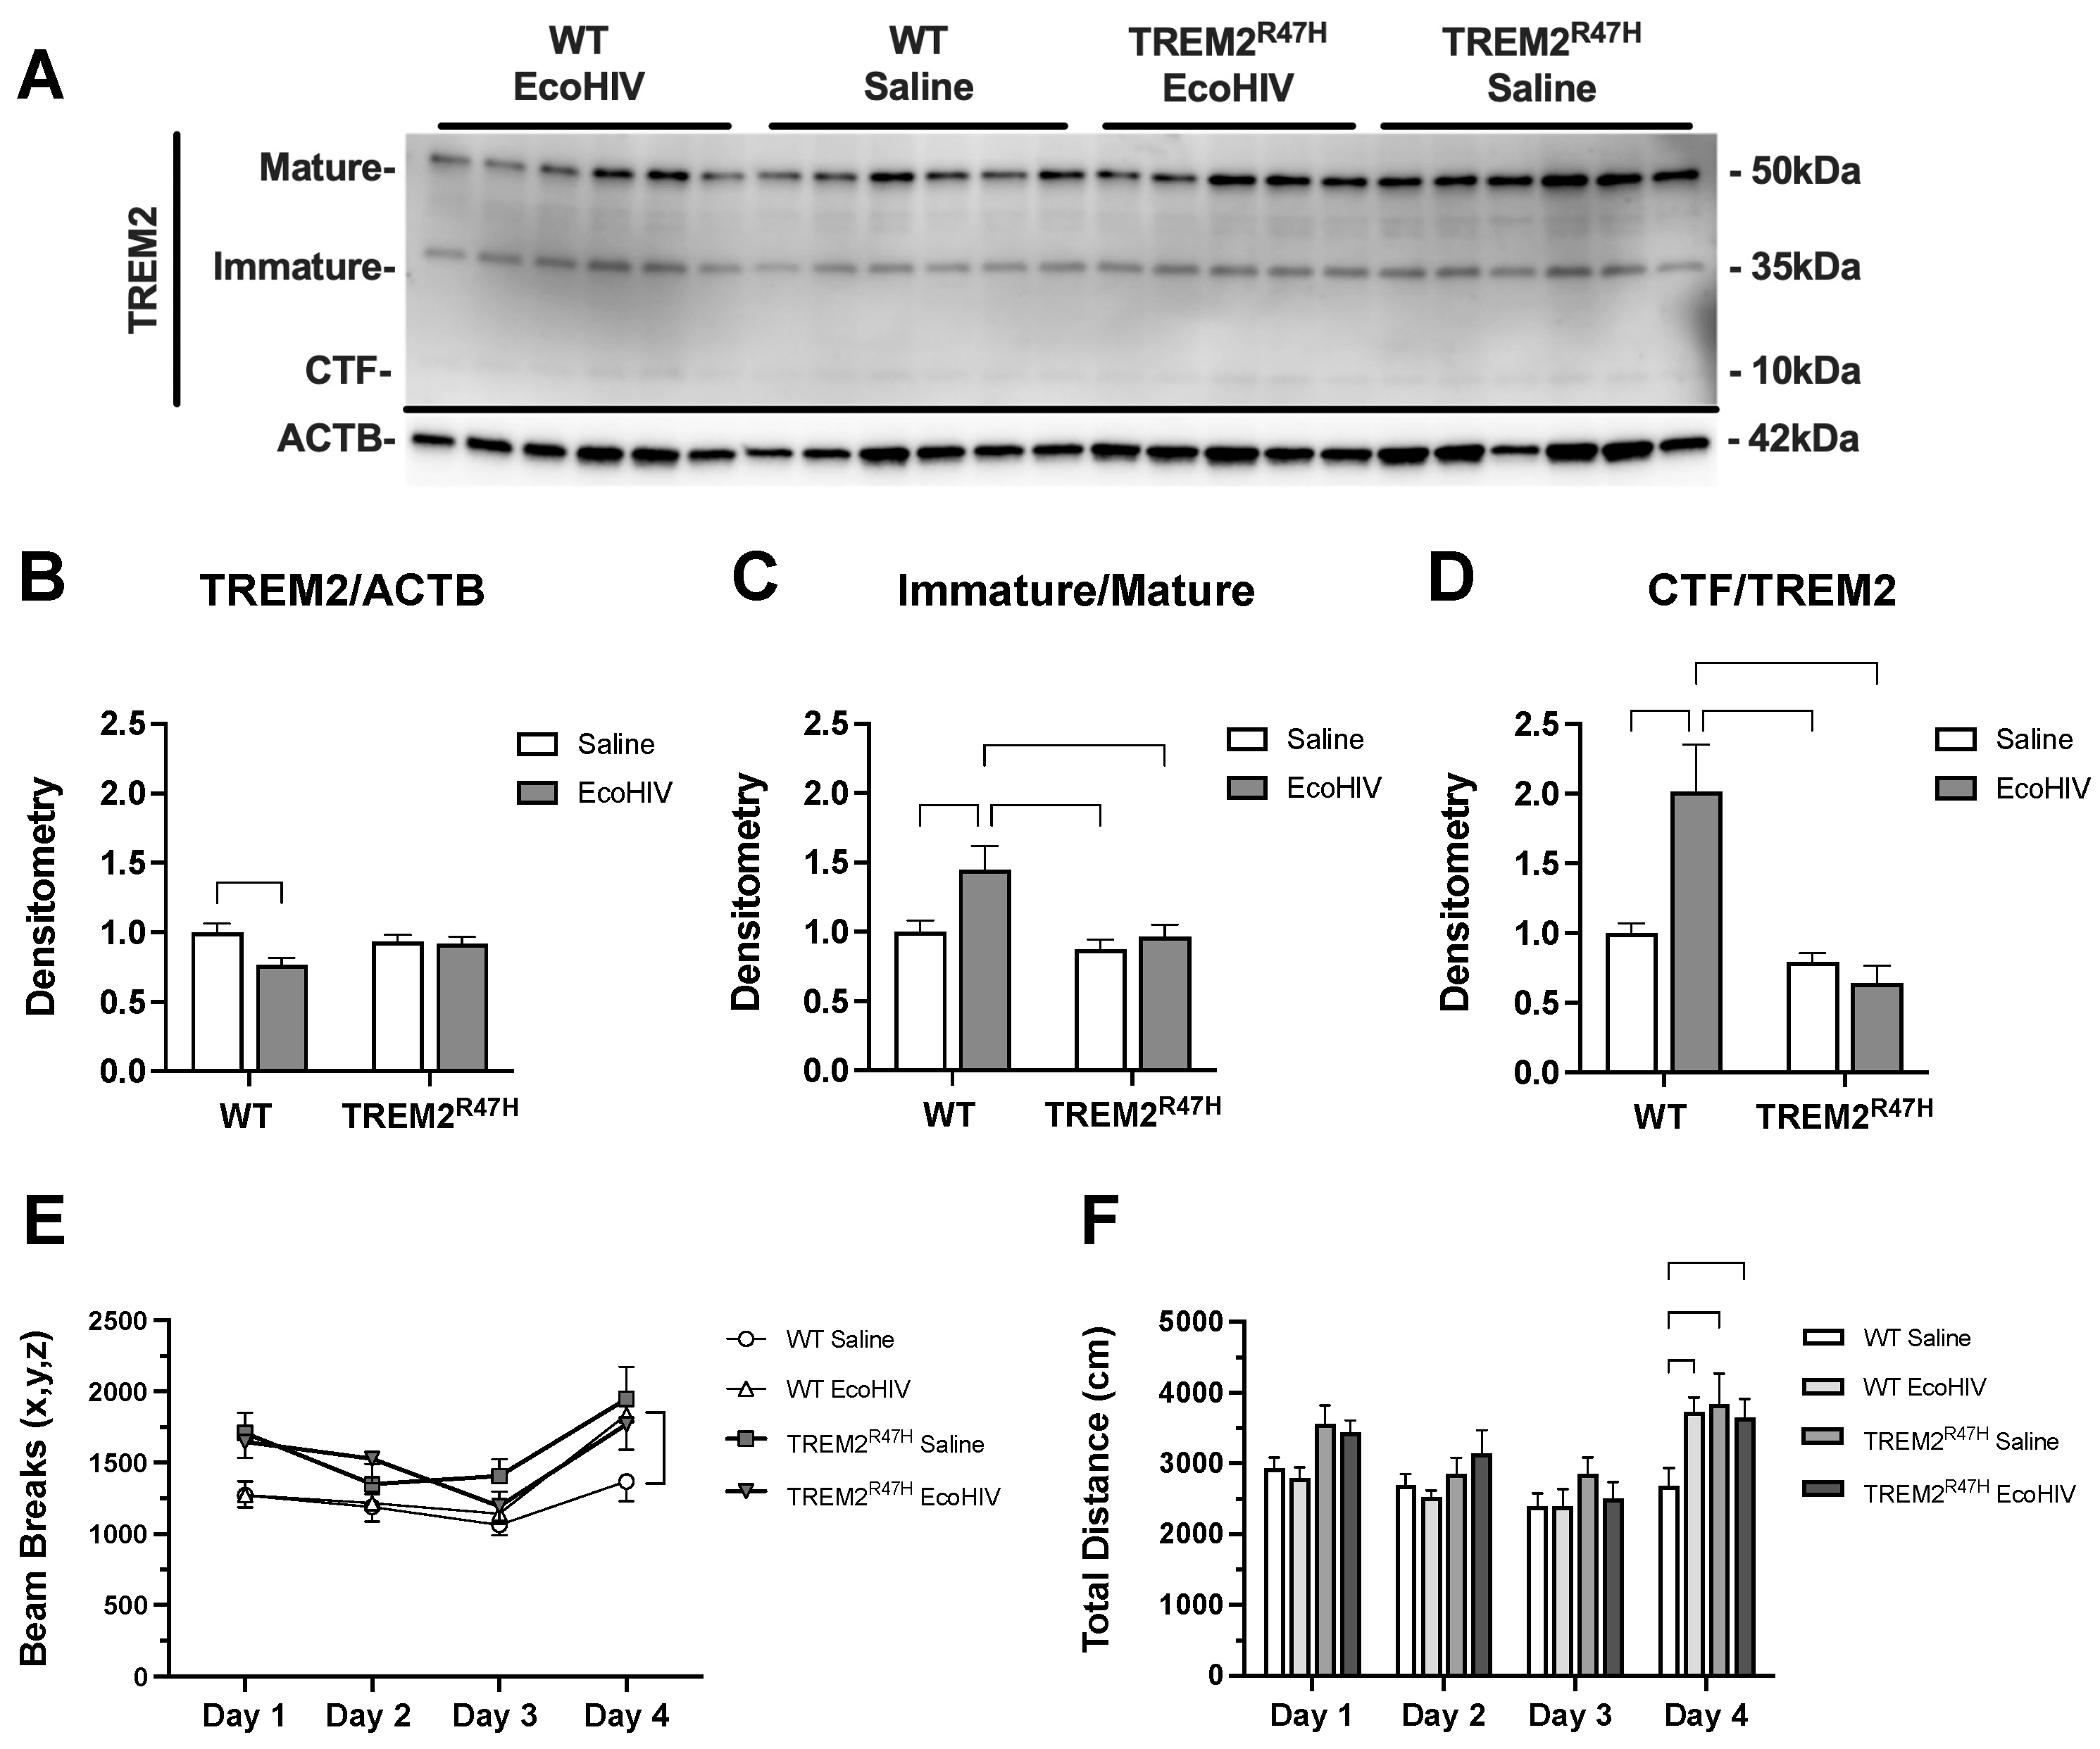
In this study, we investigated the relationship between TREM2, age, and HIV-associated neurocognitive impairment as well as evaluated the impact of cannabis use on TREM2 expression and neuroinflammation in PWH. Our observation of decreased total TREM2 expression in response to EcoHIV infection corroborates previous work which shows decreased TREM2 in membrane-enriched fractions of brain homogenates from PWH with HAND [
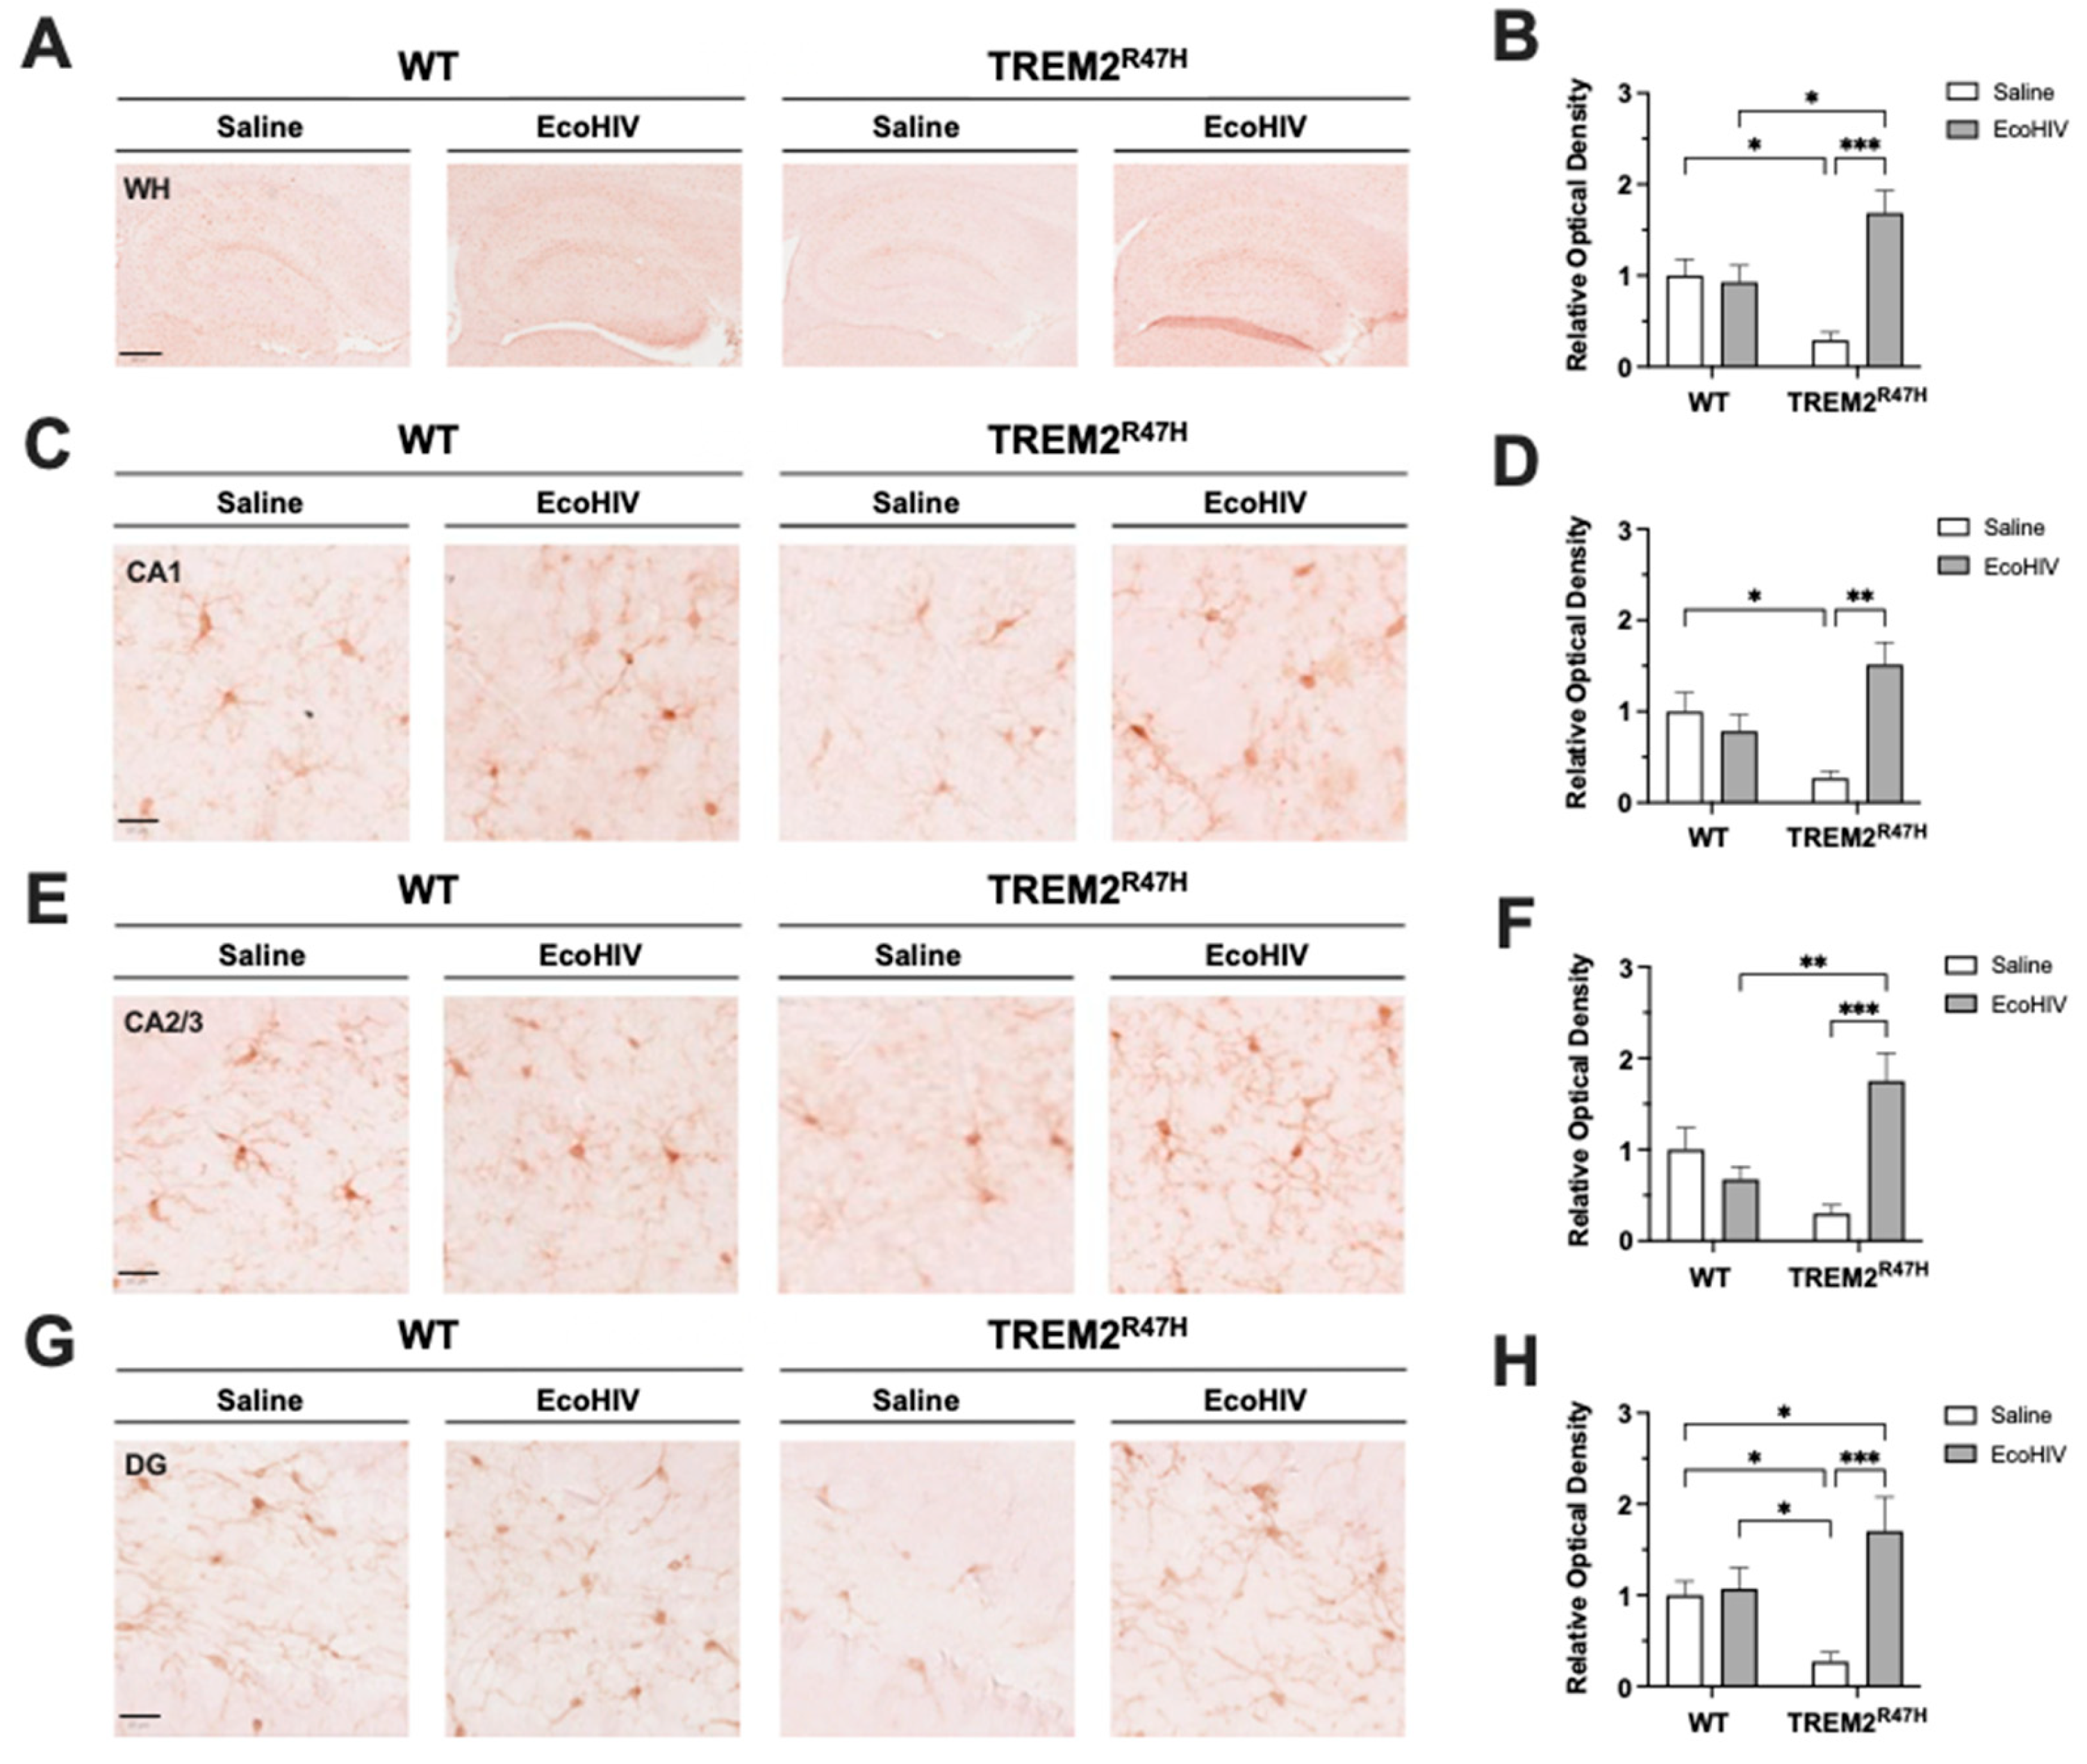
48]. Behavioral analyses revealed significant differences in TAM scoring in EcoHIV-treated WT mice, which performed similarly to TREM2R47H mice independent of EcoHIV or saline treatment. Additionally, alterations in TREM2 expression were accompanied by changes in microglial activation in TREM2 R47H mice, as evidenced by differential IBA1 expression patterns in various hippocampal subregions. Consistent with these findings, other studies have shown that alterations in TREM2 expression can modulate microglial activation and influence cognitive function in various disease models [
63,
64]. Moreover, gene variants of TREM2, such as R47H TREM2, have also been associated with an increased risk of developing AD [
65,
66,
67,
68].
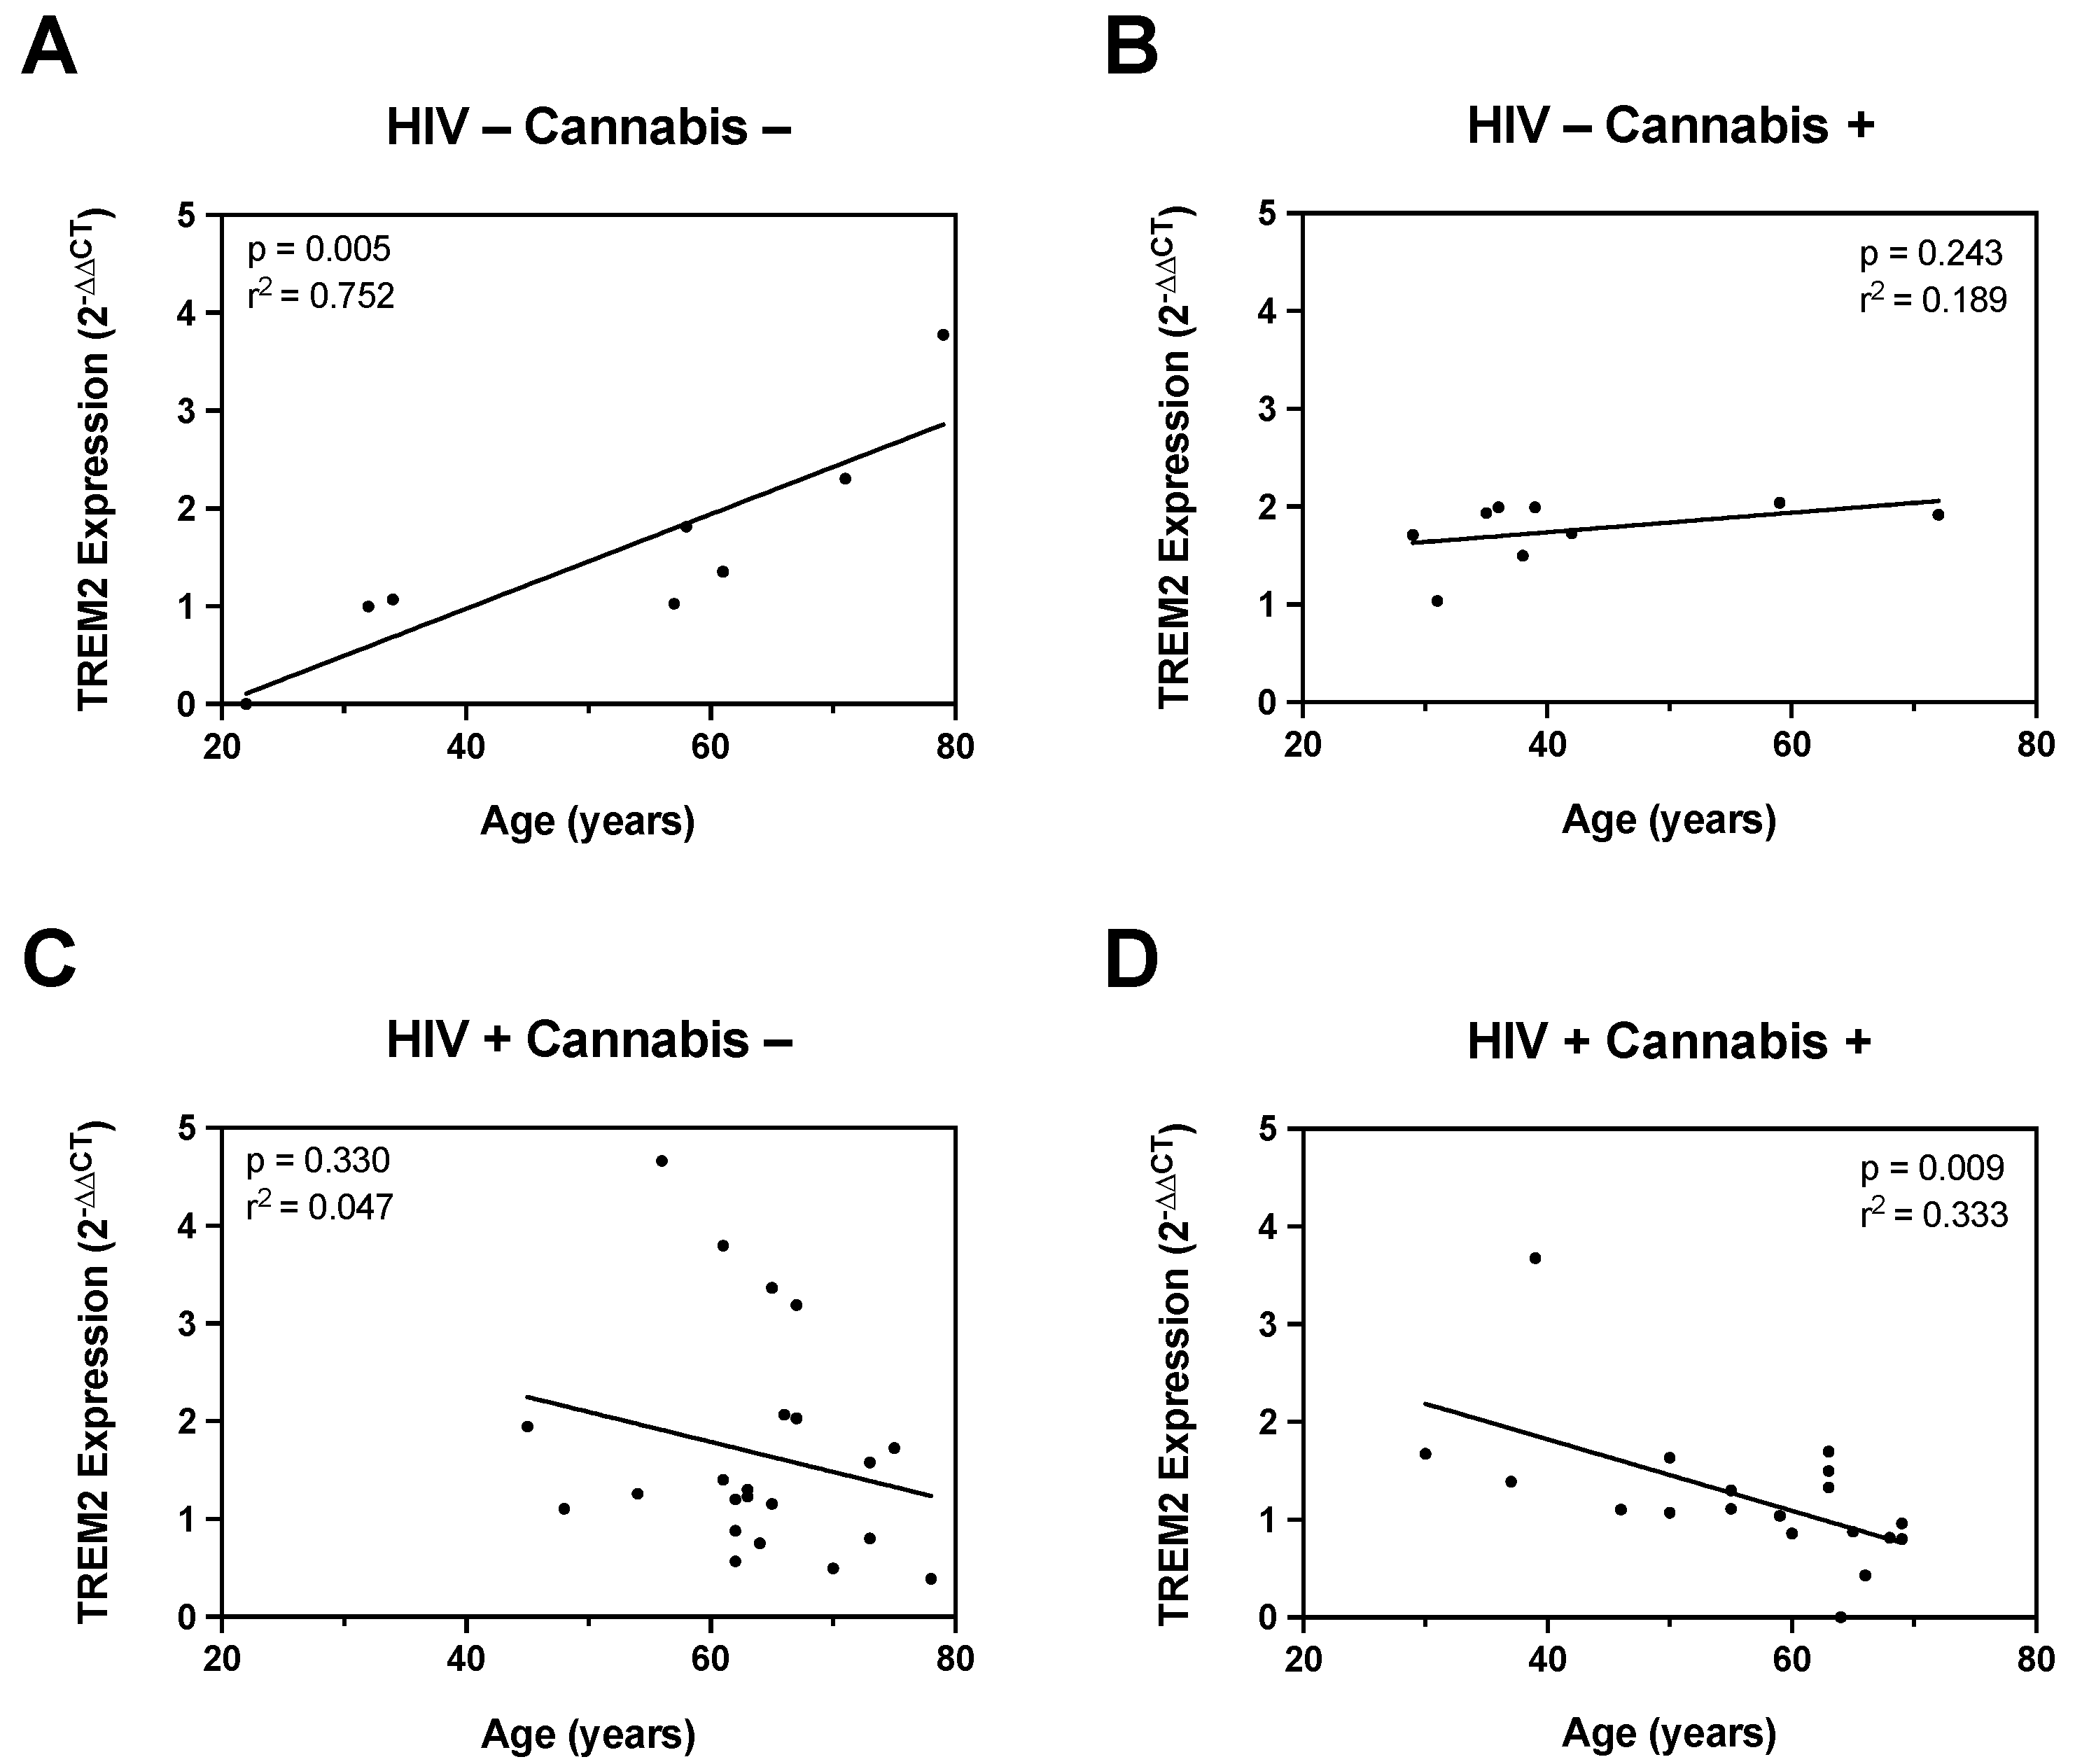
In addition to EcoHIV infection, our study also assessed the influence of HIV status, age, and cannabis use on gene expression and TREM2-mediated neuroinflammatory responses. Correlation analyses revealed distinct age-associated changes in TREM2 expression between HIV- and HIV+ individuals, with cannabis use modulating these relationships. Specifically, cannabis use was linked to lower TREM2 mRNA levels in older individuals. These findings are in line with emerging evidence suggesting bidirectional interactions between cannabinoids and neuroinflammation [
69]. While endocannabinoid system has been shown to regulate immune cell function via the cannabinoid type-2 (CB2) receptor, the specific mechanisms underlying the effects of cannabis on TREM2 expression remain unclear and warrant further investigation. Nevertheless, cannabis contains various cannabinoids, such as cannabidiol (CBD) and delta-9-tetrahydrocannabinol (THC), which have been shown to exert anti-inflammatory effects through various mechanisms, including modulation of cytokine production and immune cell function [
57]. Notably, CBD has been shown to modulate microglial activation in various disease models, including HIV-associated and Aβ-induced neuroinflammation [
57,
70,
71,
72]. The anti-inflammatory actions of cannabis are largely attributed to cannabinoids which can act on multiple targets within the endocannabinoid system, including the cannabinoid type-2 (CB2) receptor [
58,
73]. However, CBD has also been shown to exert its effects on microglia through other signaling pathways [
74].
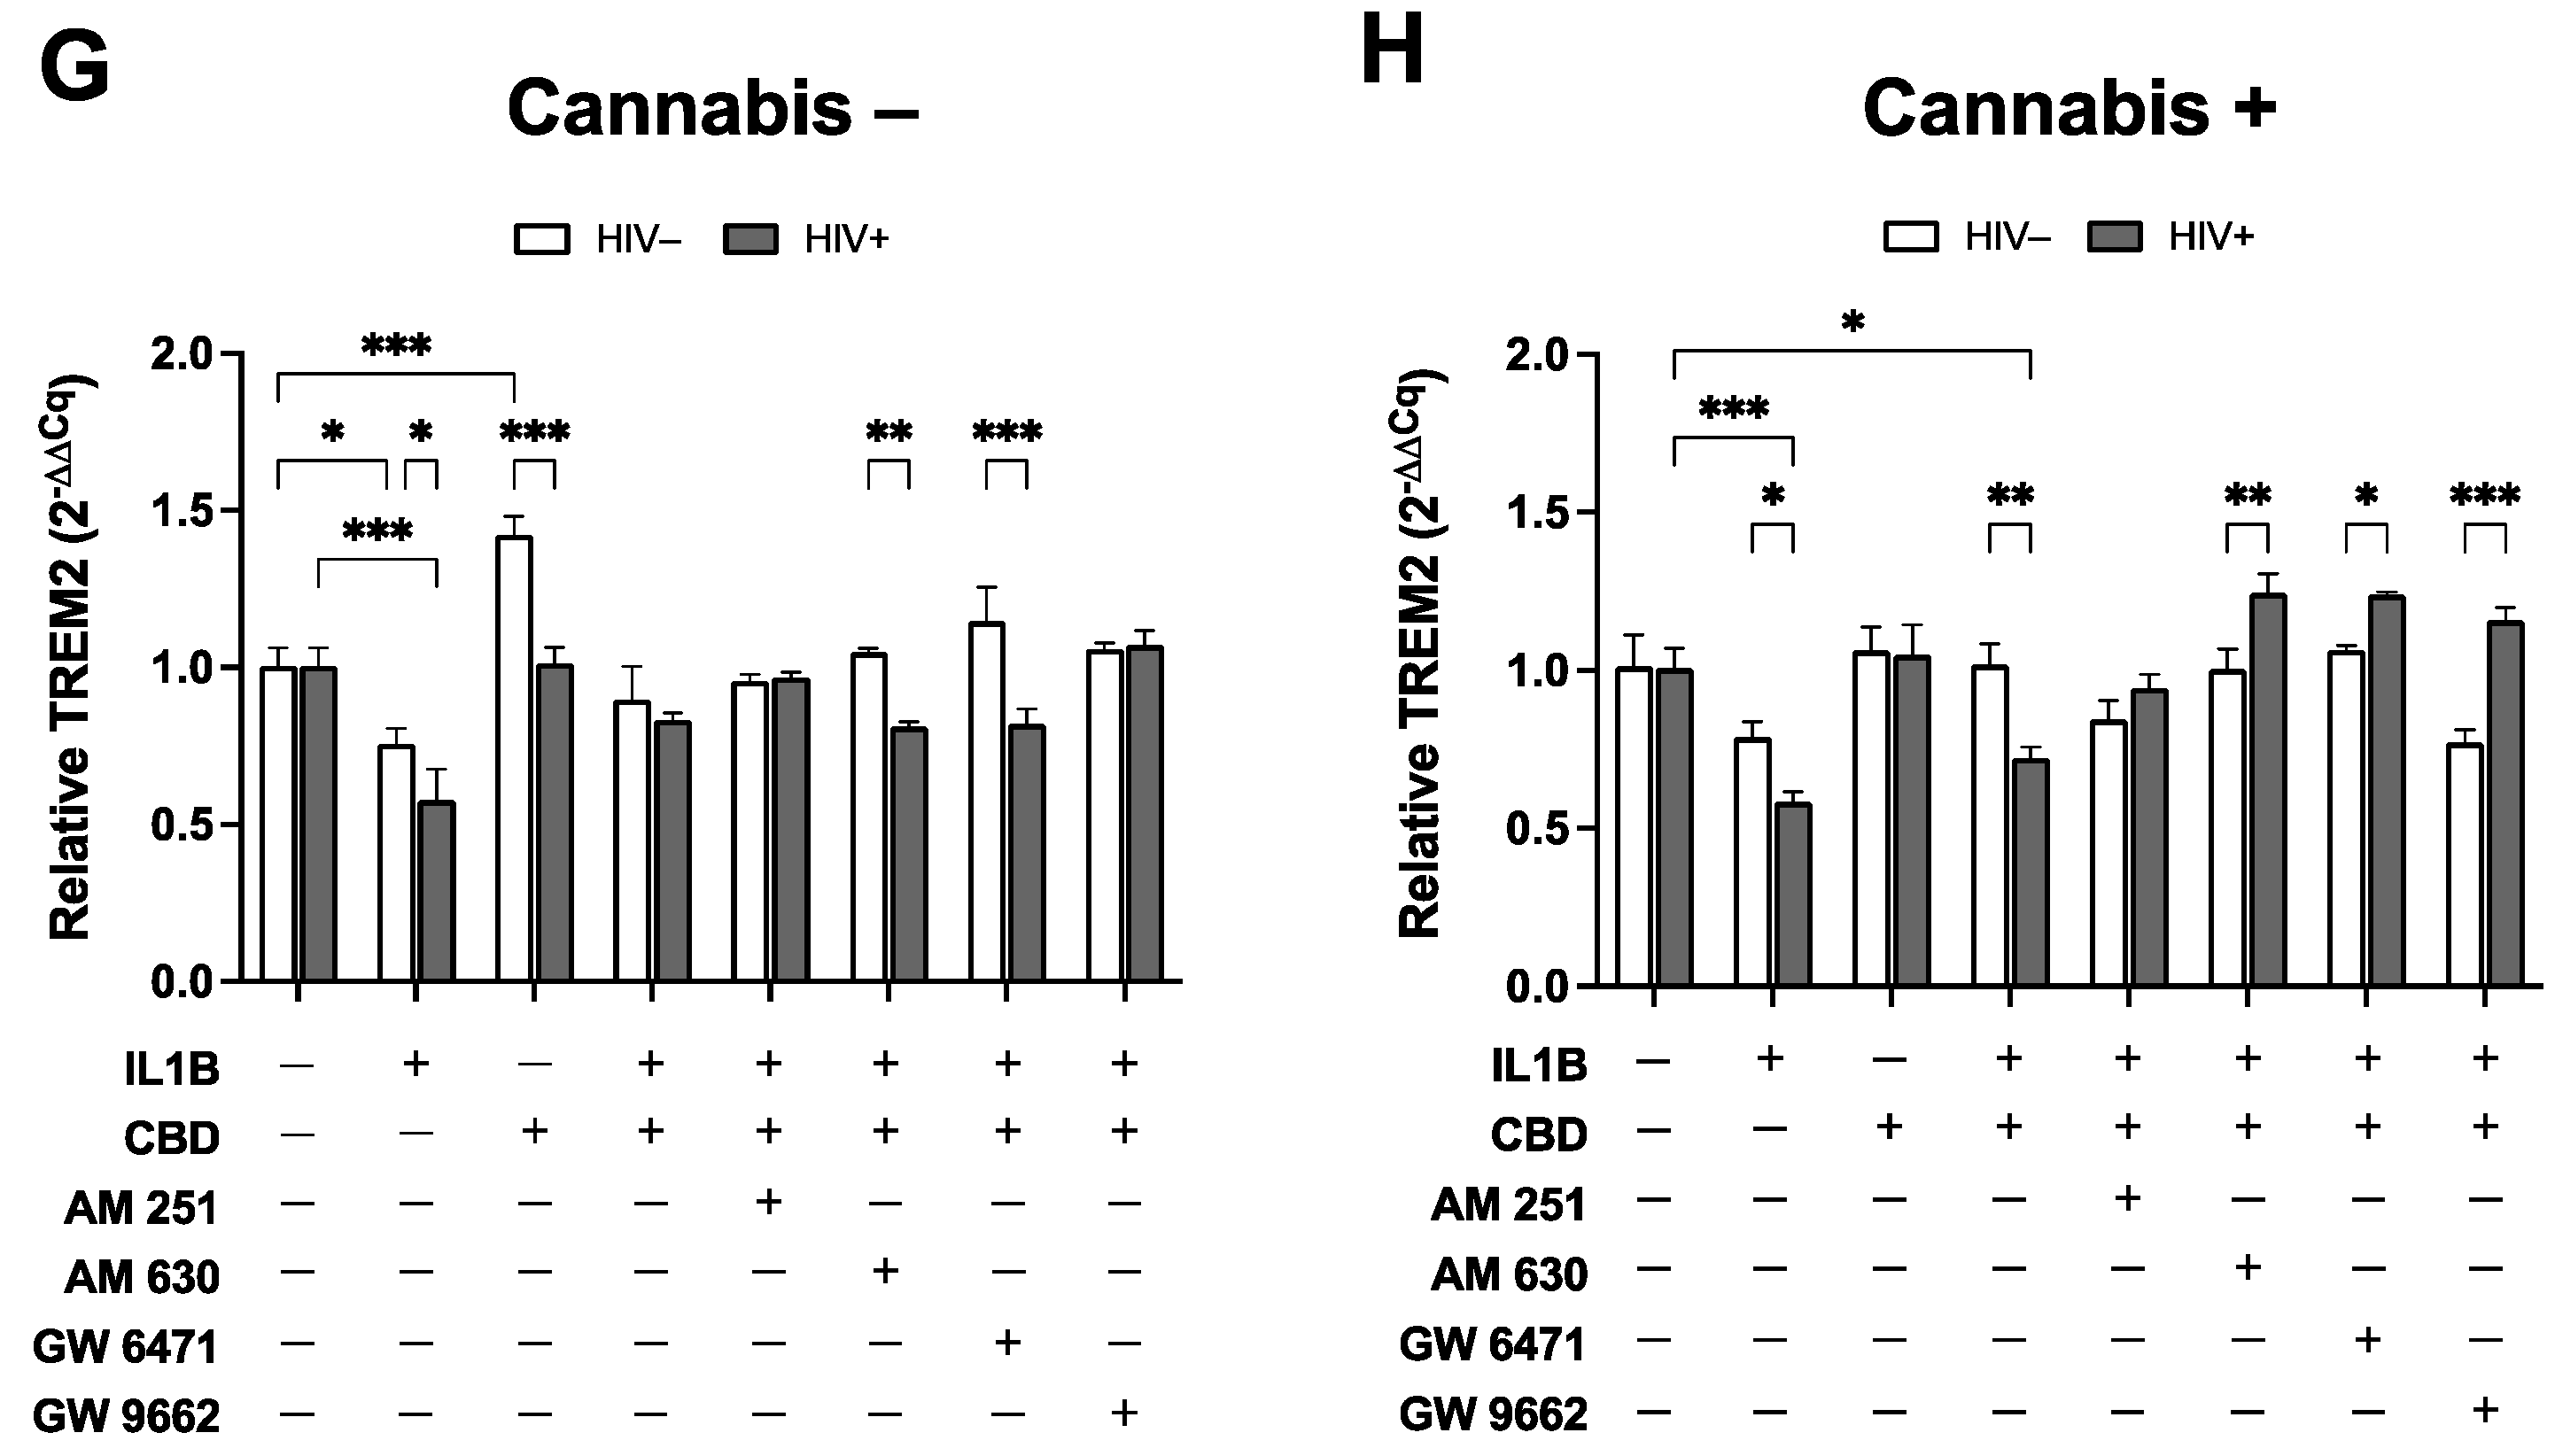
The pharmacological agents AM 251, AM 630, GW 6471, and GW 9662 have been utilized to elucidate the roles of cannabinoid receptors and peroxisome proliferator-activated receptors (PPARs) in immunomodulation. AM 251, a selective CB1 receptor antagonist, and AM 630, a CB2 receptor antagonist, are commonly used to block cannabinoid receptor activity. Studies indicate that blocking CB1 and CB2 receptors can influence macrophage polarization and immune response. For example, AM 630 has been shown to alter the anti-inflammatory effects in MDMs, suggesting a role for CB2 in macrophage-mediated immune responses [
75]. GW 6471, a PPARα antagonist, and GW 9662, a PPARγ antagonist, are used to investigate the involvement of PPARs in immune cell function. PPARγ, in particular, is known for its role in regulating macrophage activation and inflammation. Inhibition of PPARγ by GW 9662 has been observed to impact macrophage differentiation and inflammatory cytokine production, indicating its regulatory function in immune responses [
76].
In contrast, TREM2 exerts its anti-inflammatory effects primarily through modulation of microglial function and the immune response within the CNS. While both CBD and TREM2 may have potential therapeutic implications for neuroinflammatory conditions, they likely act through distinct mechanisms and may target different aspects of the inflammatory cascade. Despite this, cannabis contains hundreds of other phytocannabinoids, terpenoids, and polyphenols that may exert immunomodulatory functions through TREM2-related pathways [
71]. Indeed, recent evidence suggests that certain plant-derived compounds exert anti-inflammatory actions on microglial cells via the TREM2 signaling pathway [
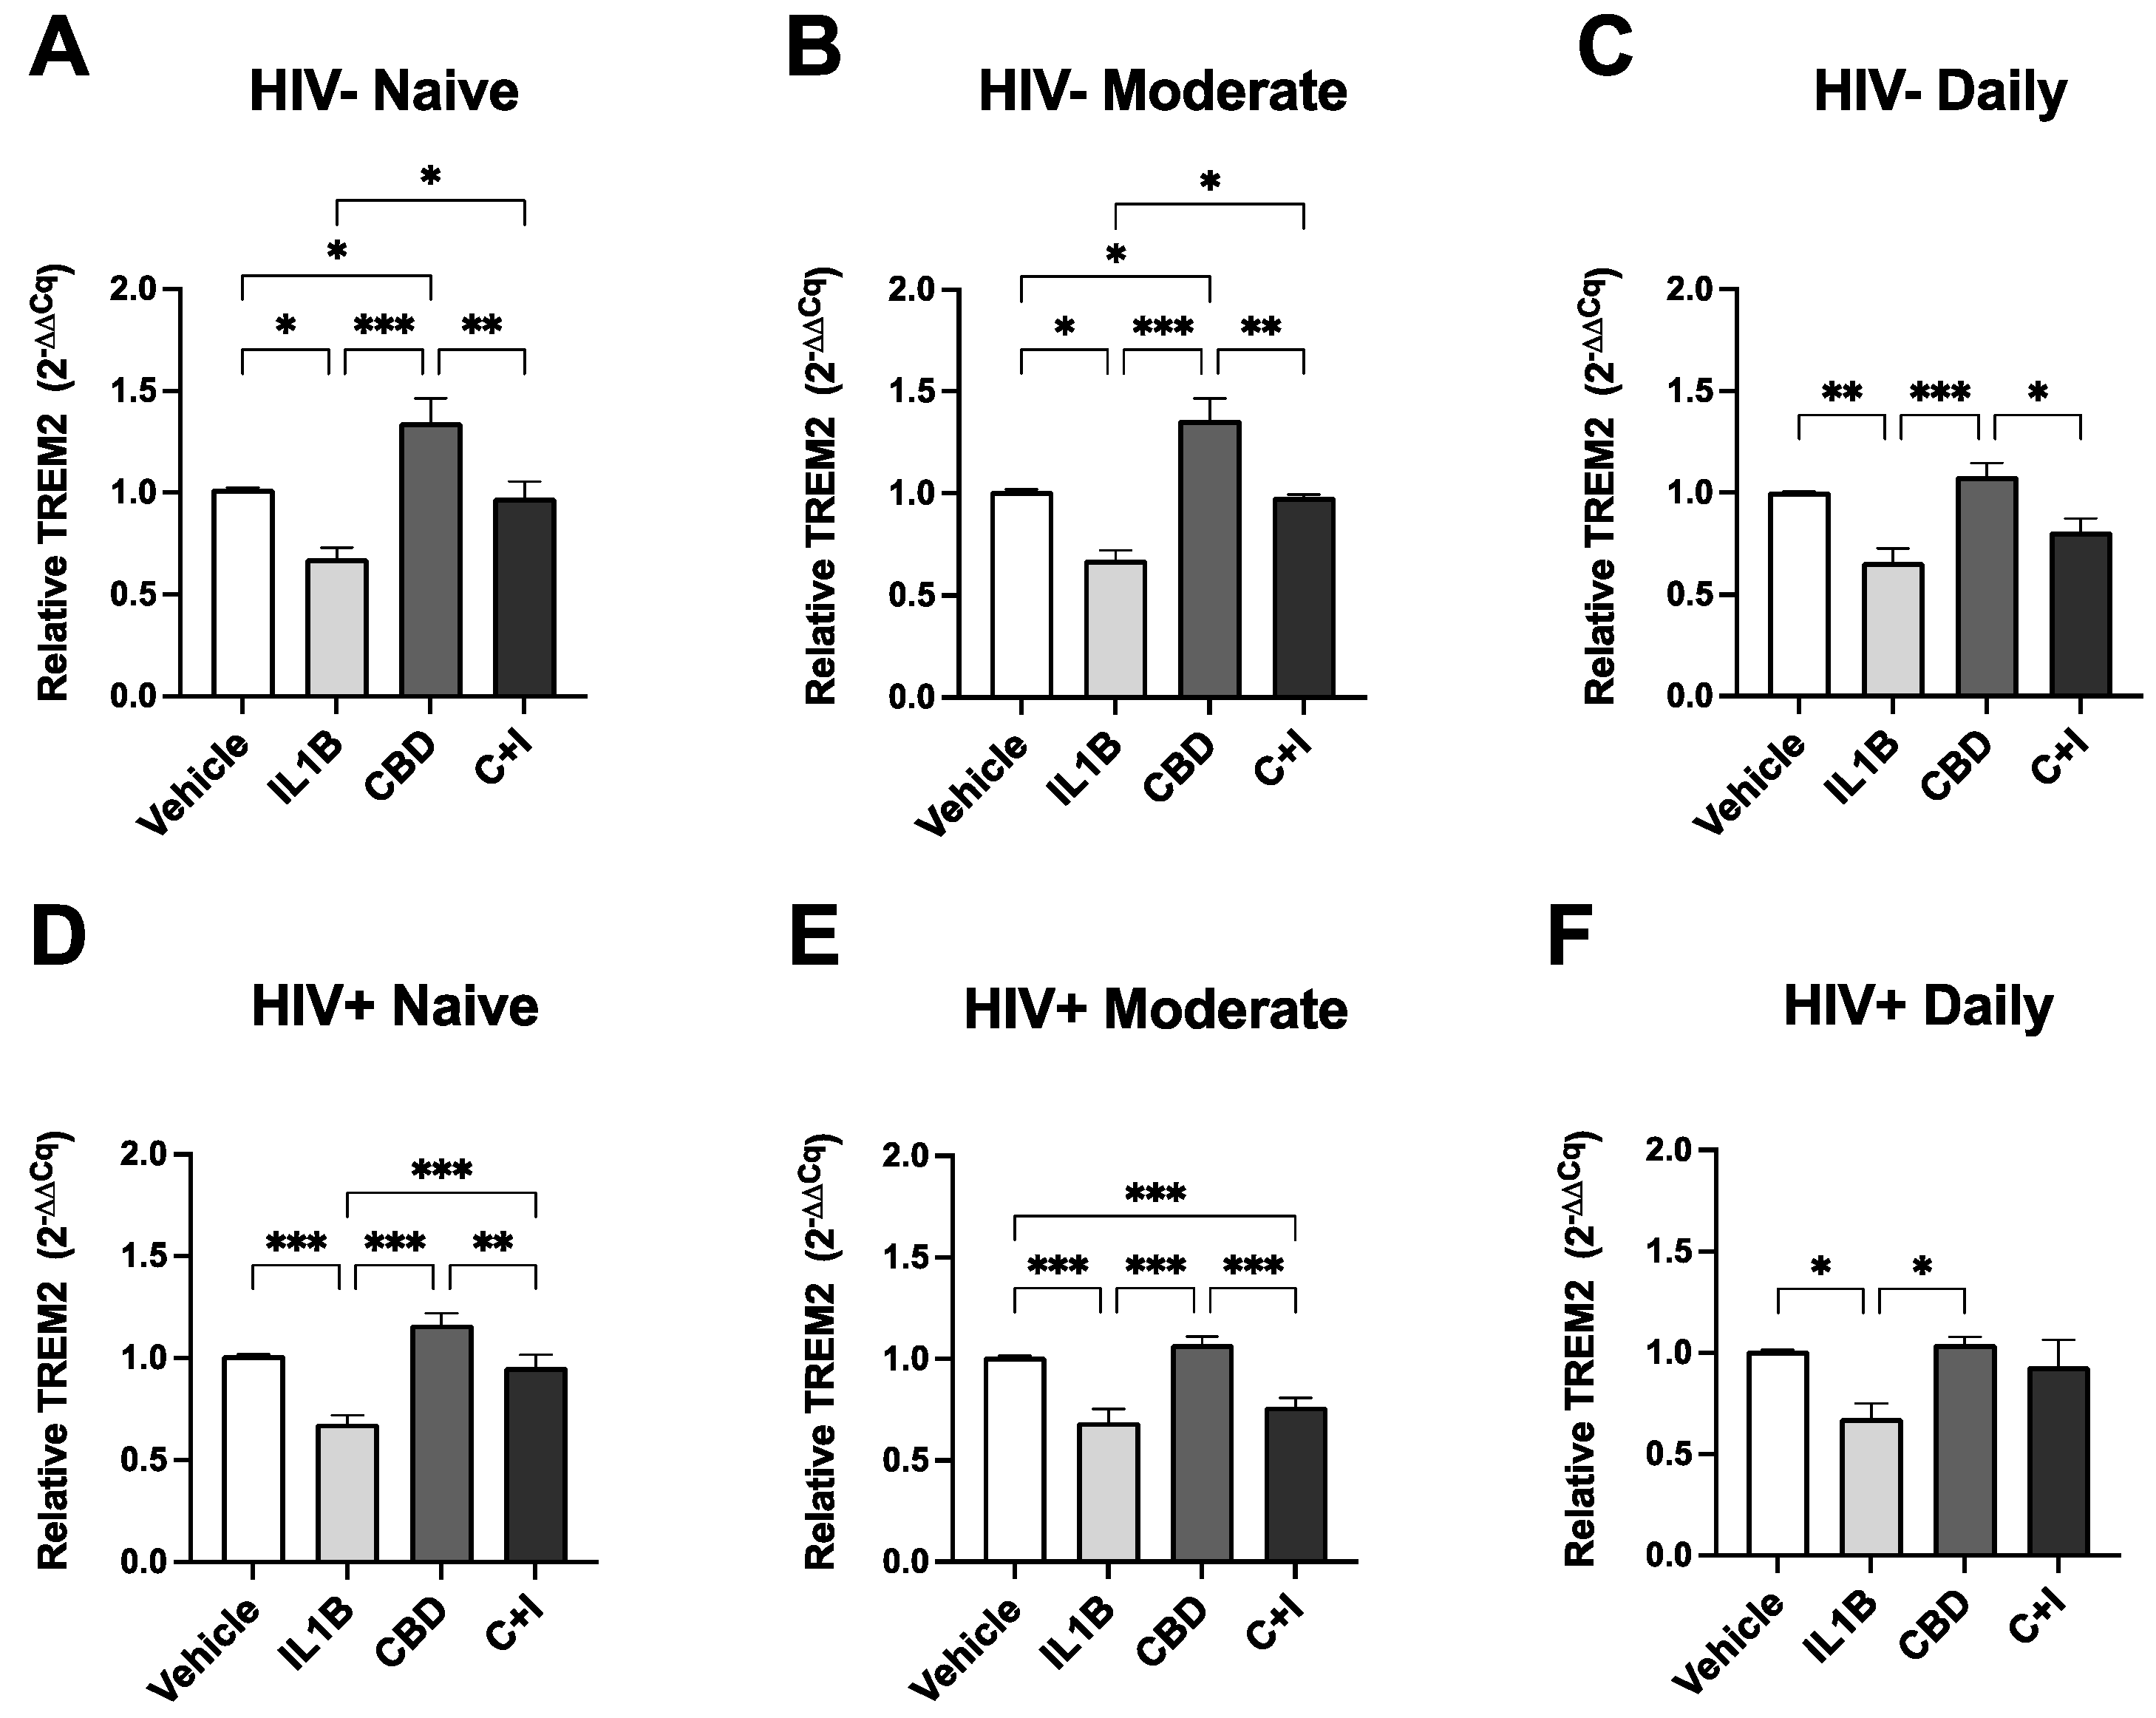
77]. In human MDMs, treatment with CBD consistently resulted in increased TREM2 mRNA regardless of HIV status or cannabis use frequency. These results indicate that CBD treatment mitigates the IL1B-induced downregulation of TREM2, which has been shown to be induced by inflammatory stimuli [
78]. These findings suggest that the immune-modulatory effects of CBD and other cannabinoids are influenced by prior cannabis use and underscore the importance of considering cannabis use history in studies evaluating the therapeutic potential of cannabinoids in individuals with HIV.
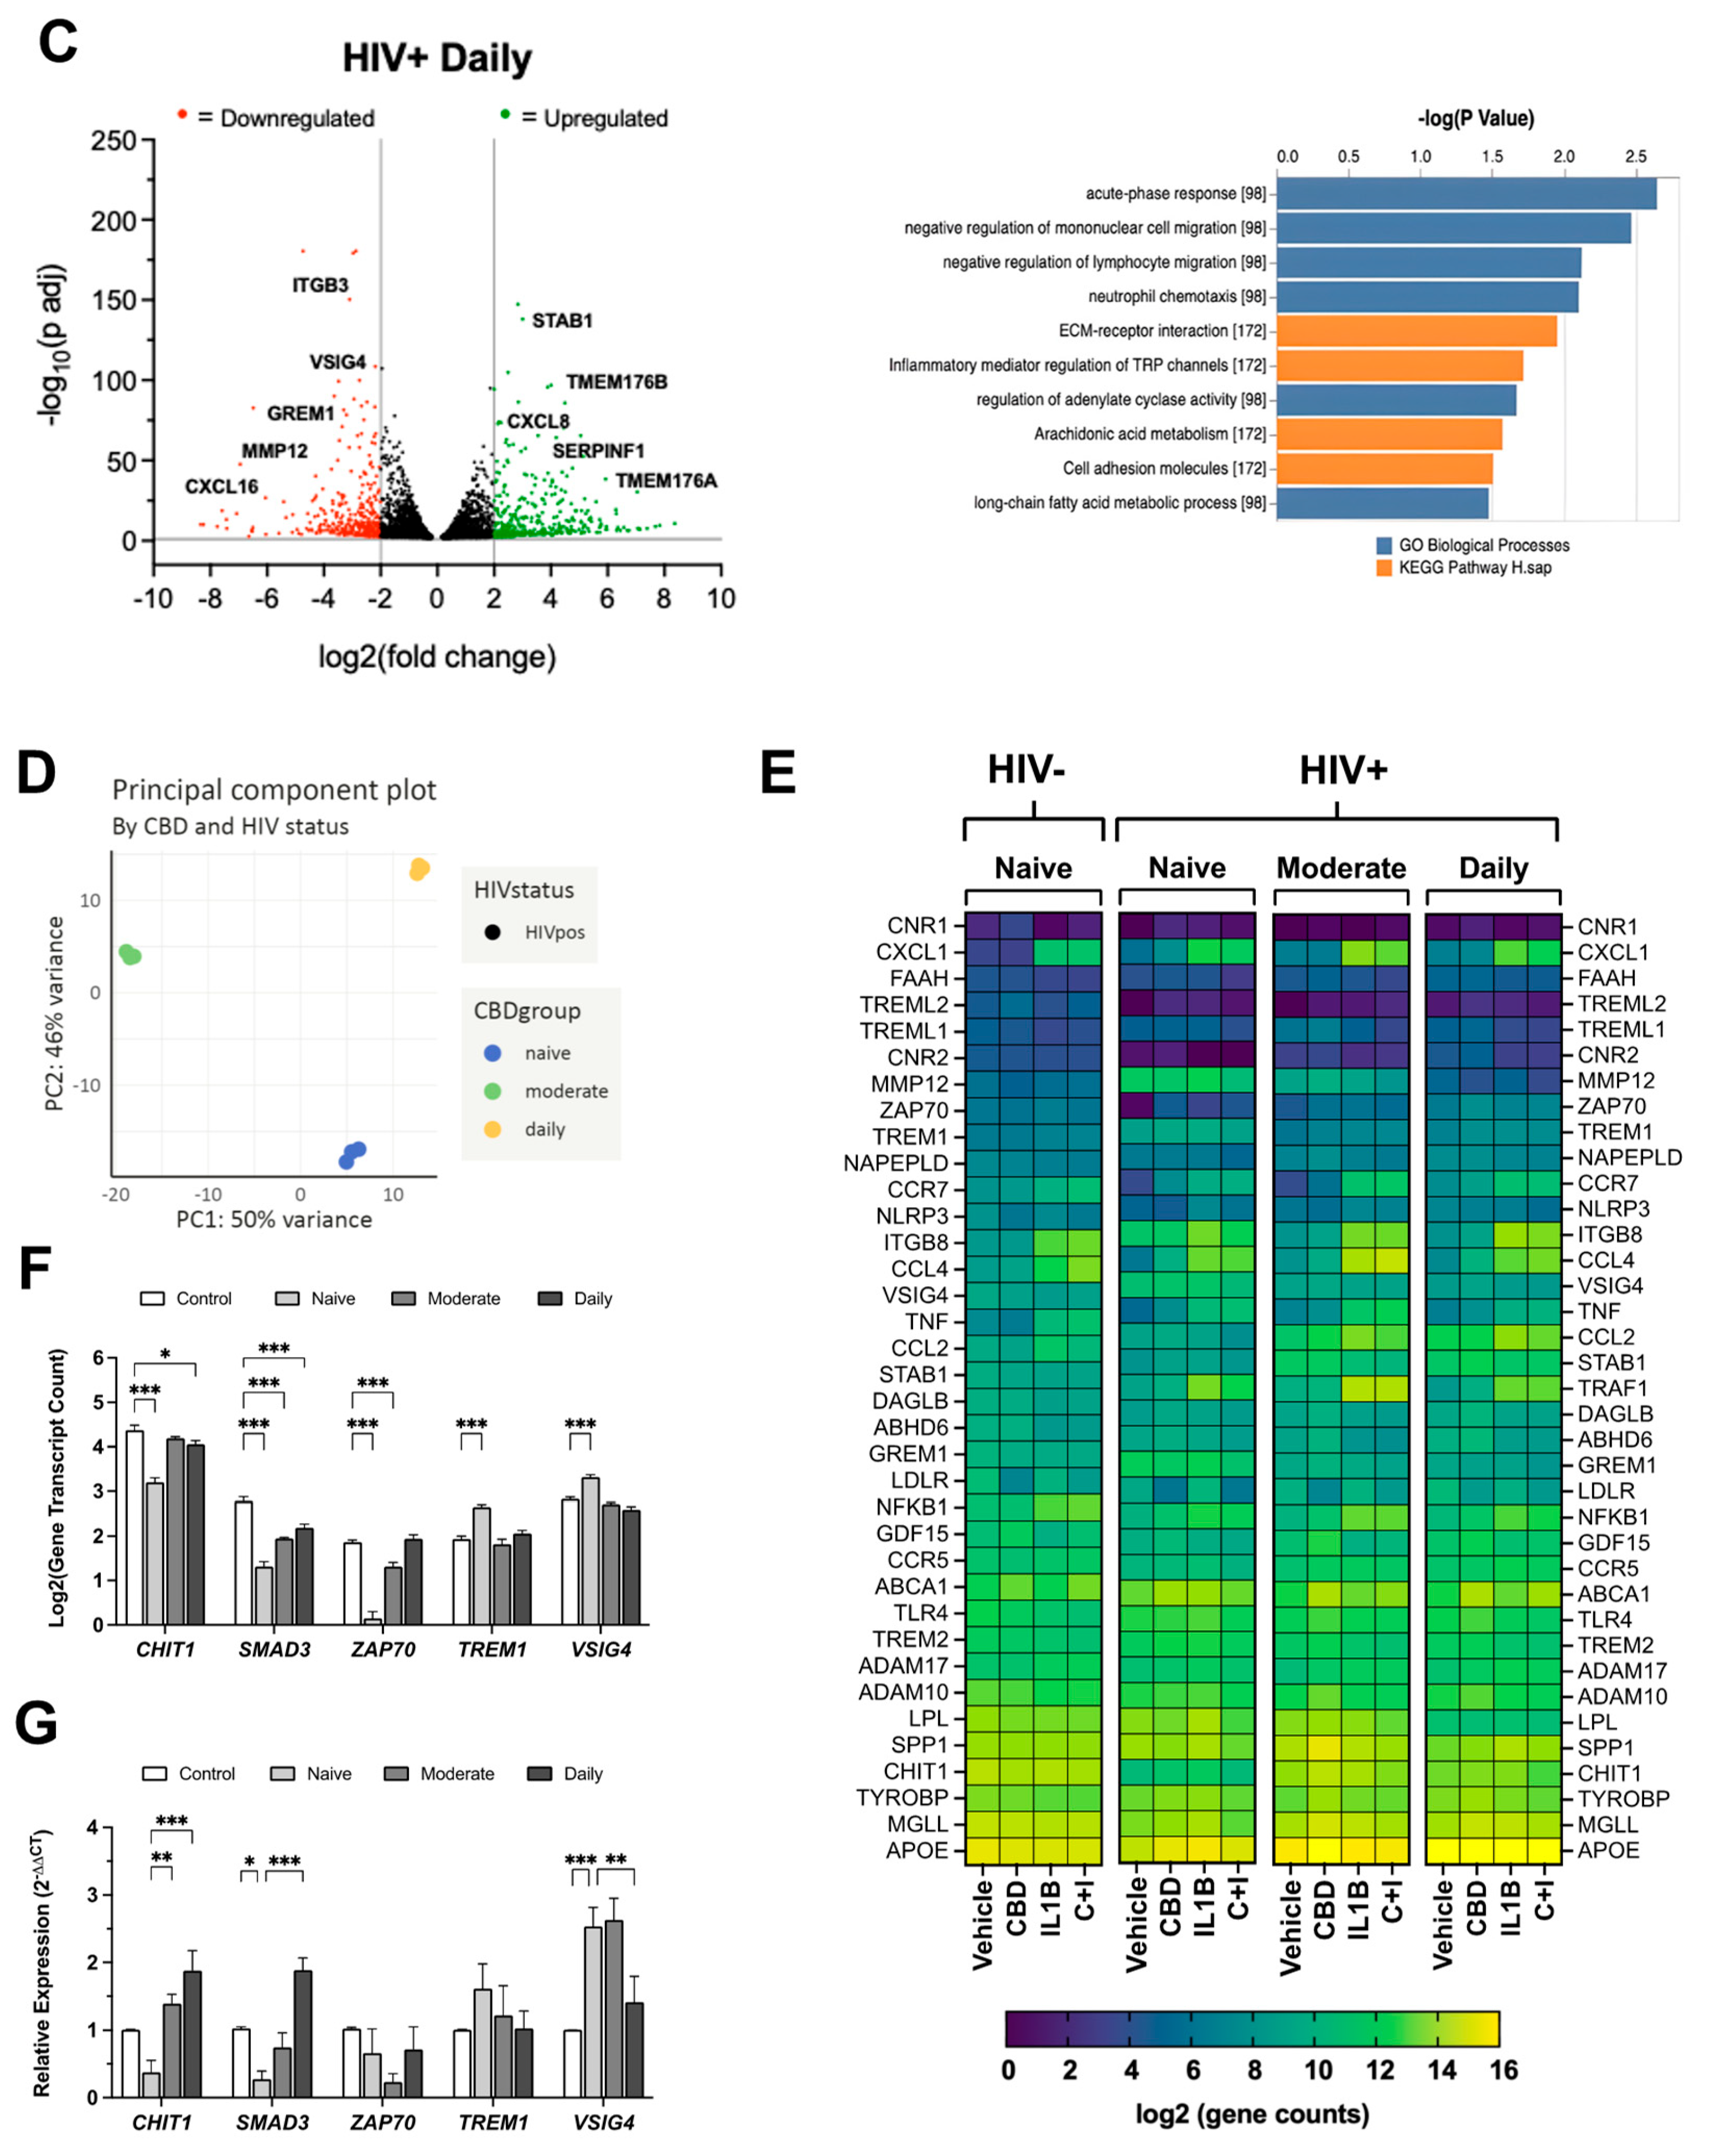
In addition to TREM2, HIV-associated changes in gene expression of immunomodulatory genes, including CHIT1[
79], SMAD3[
80], ZAP70[
81], TREM1[
82,
83], and VISG4[
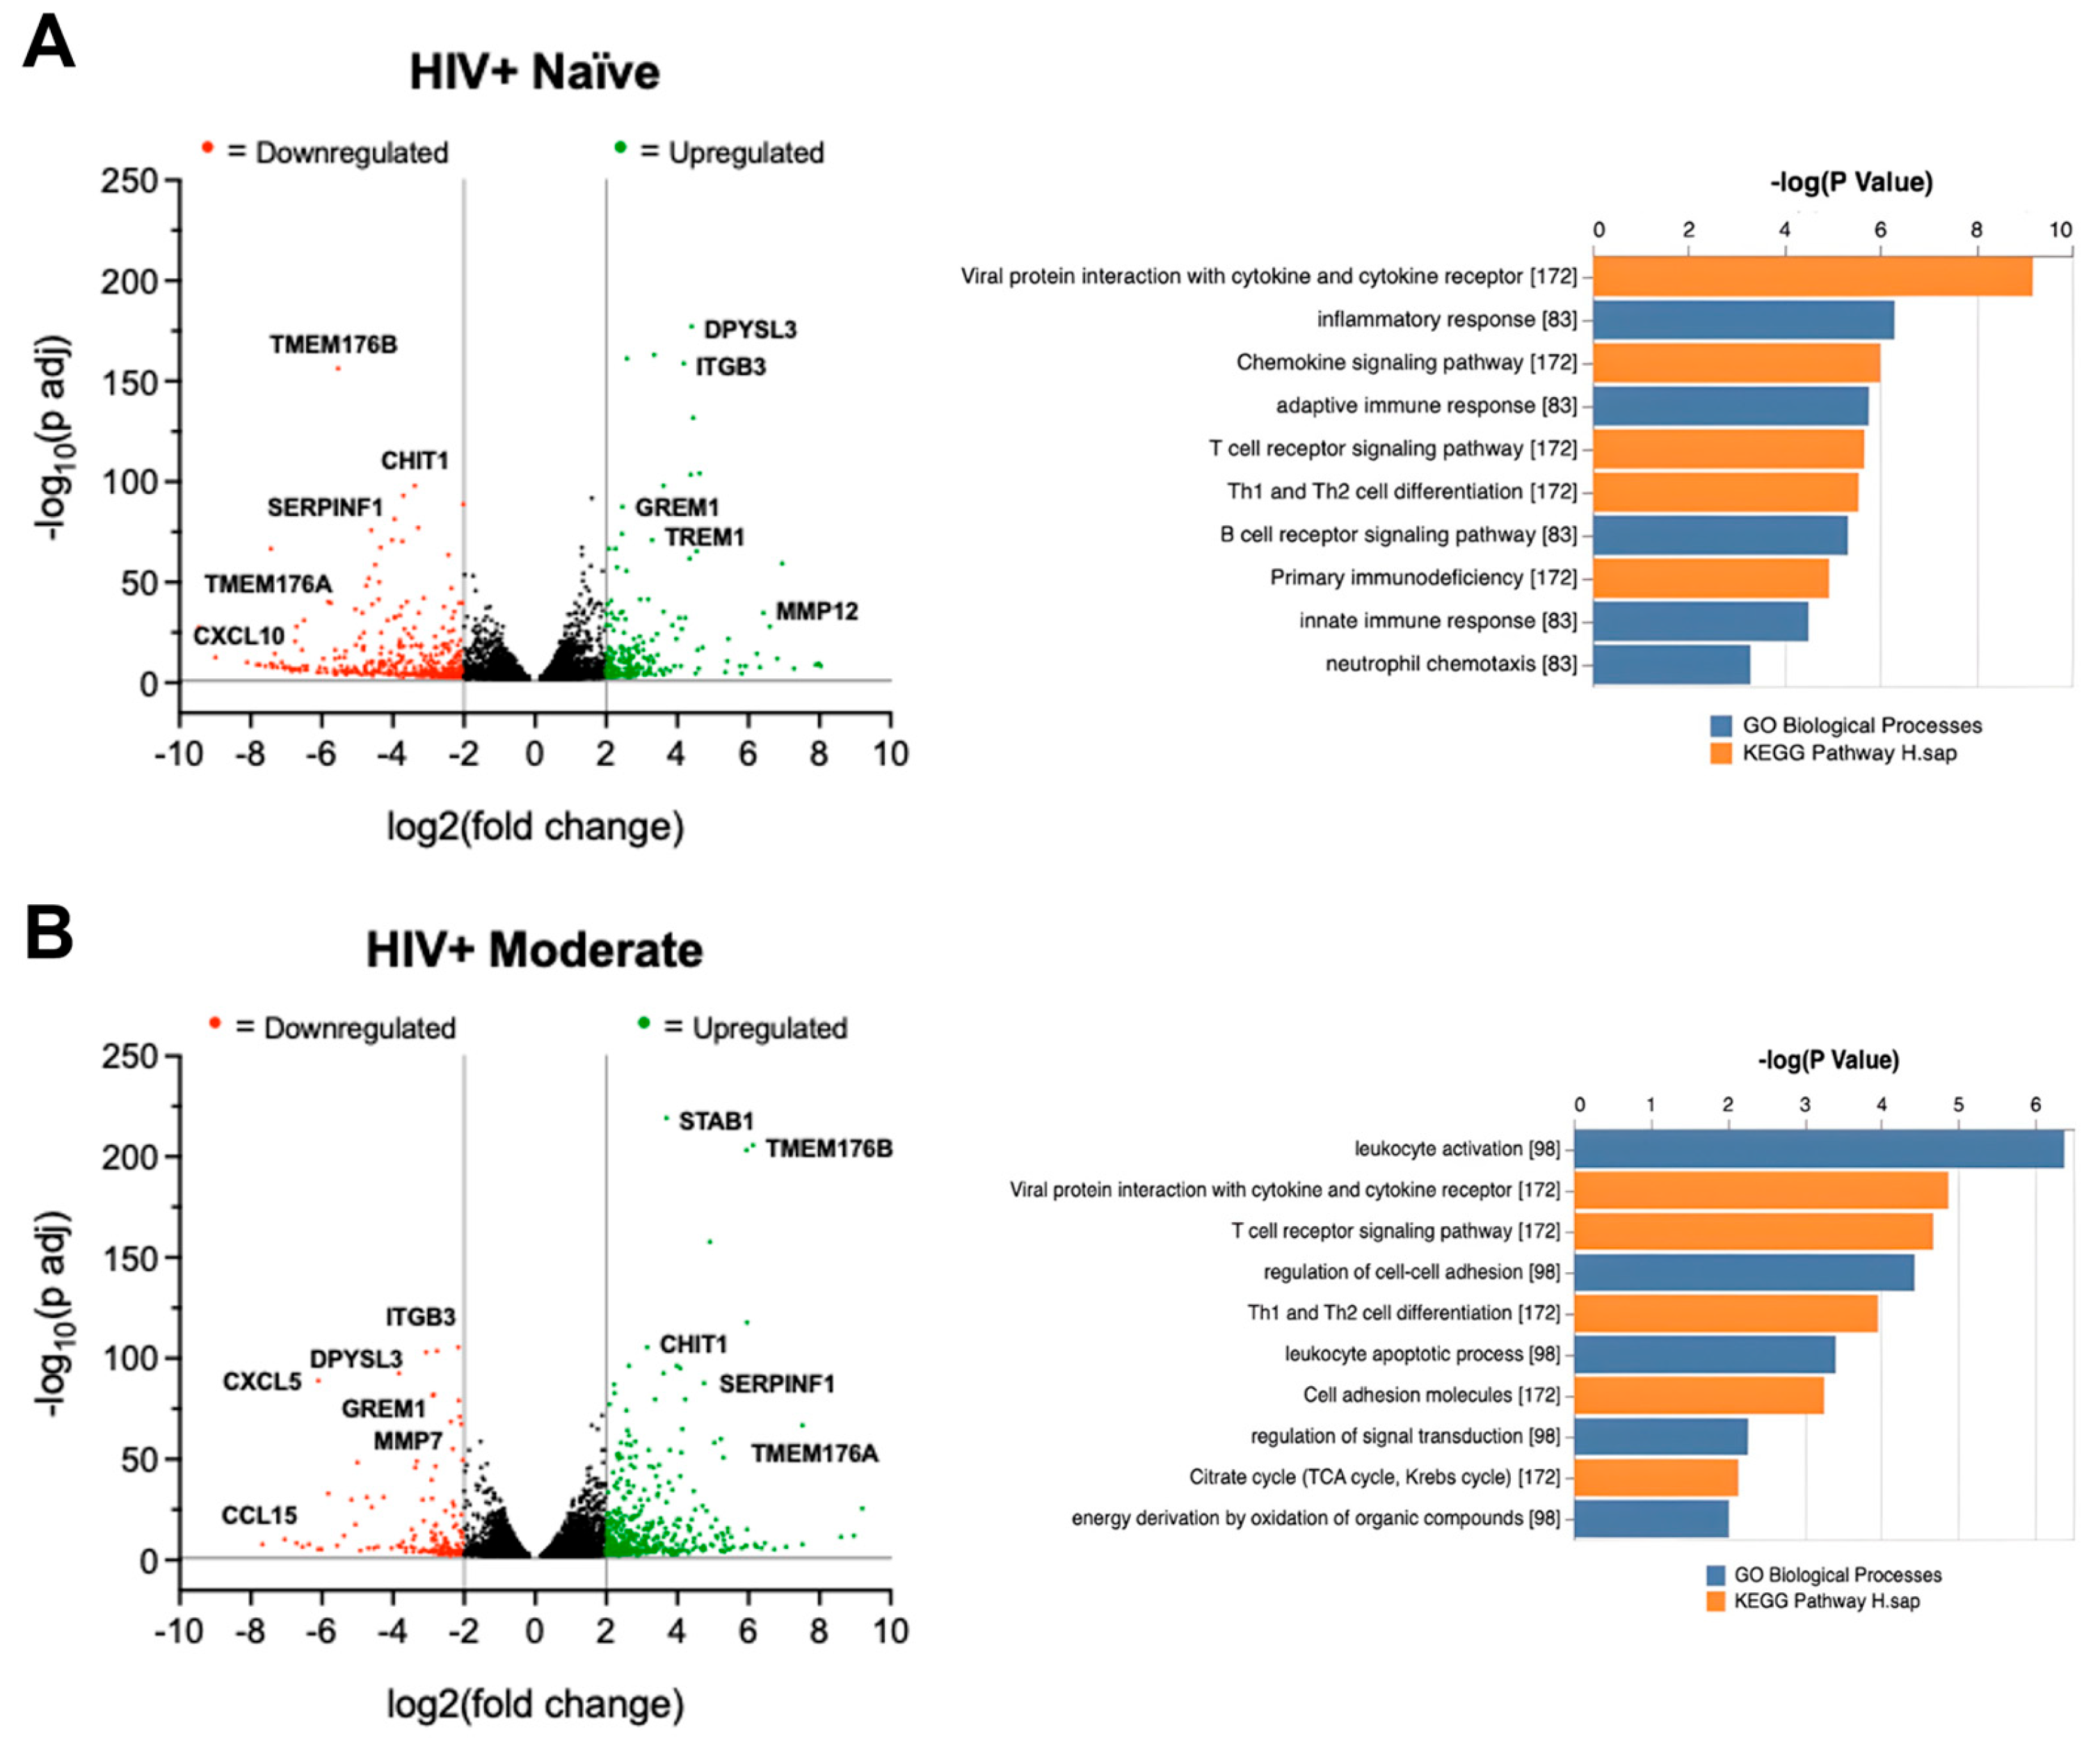
84], were differentially impacted by cannabis use. RNA-sequencing analyses revealed additional differences in the gene expression profile of MDMs from moderate or daily cannabis use backgrounds. This is line with recent findings that illustrate daily cannabis use is associated with lower inflammation in the CNS of PWH [
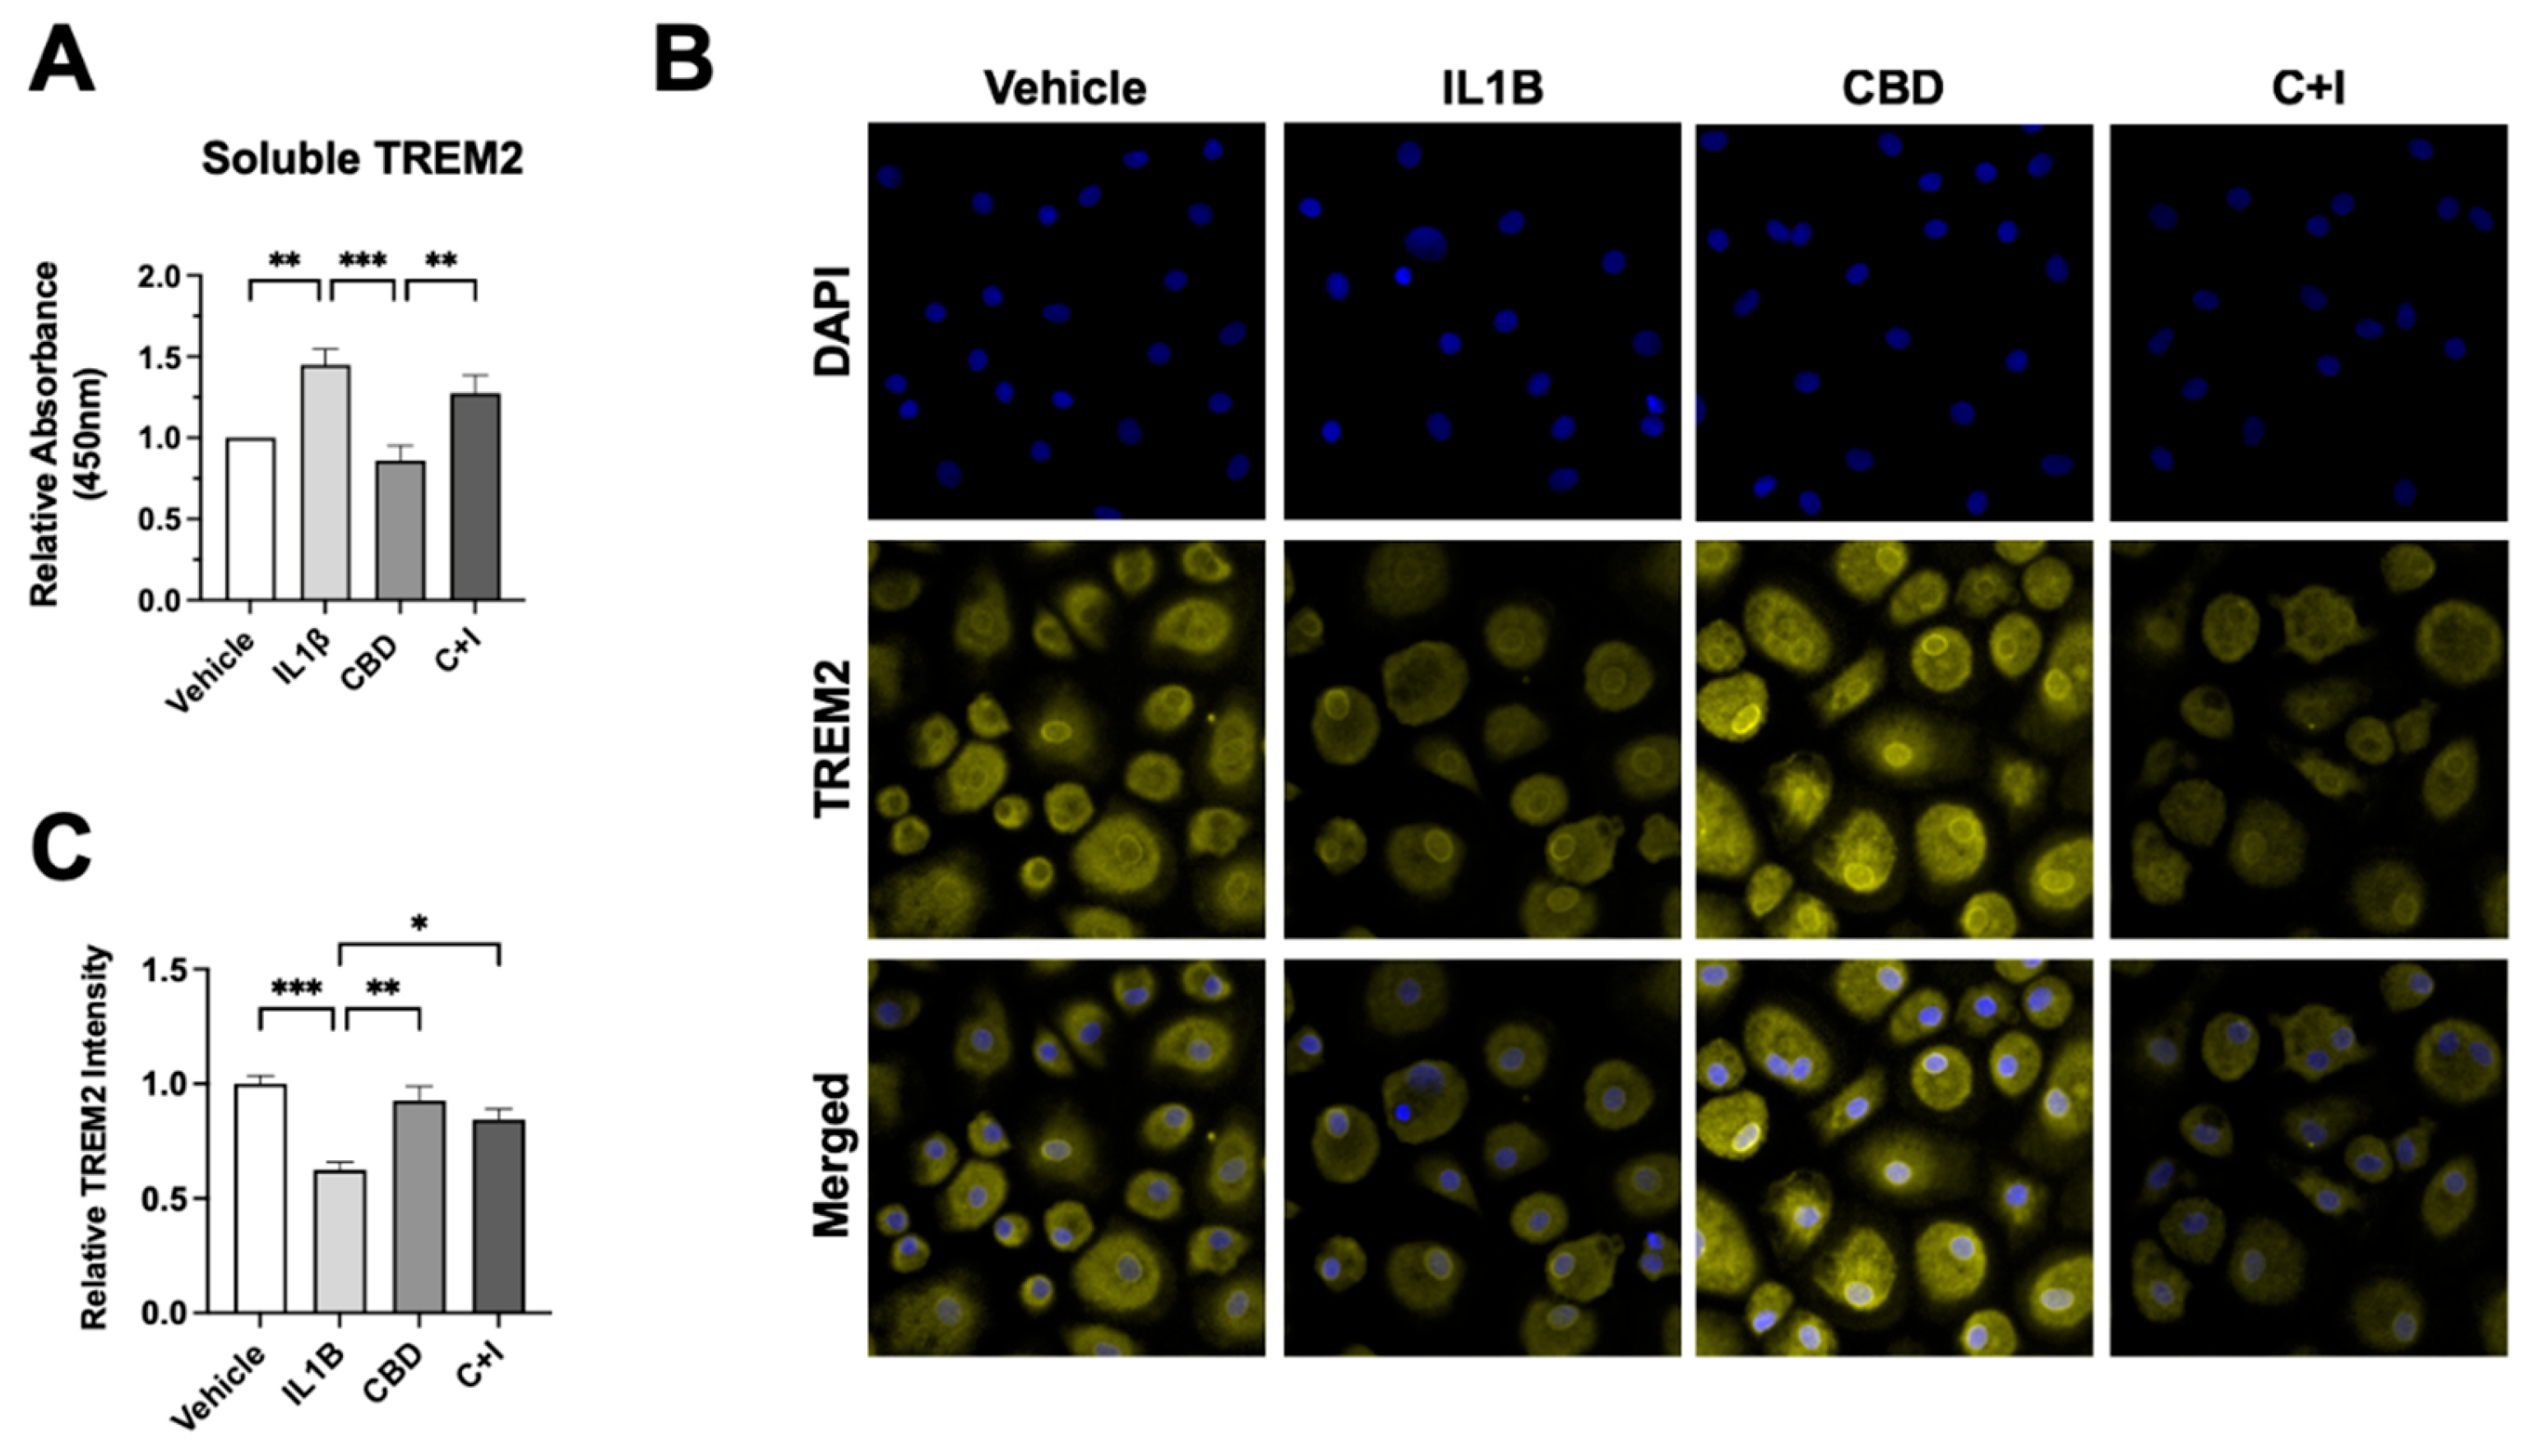
85]. ELISA and immunoblot analyses revealed opposing effects of IL1Β and CBD on sTREM2 levels and TREM2 protein expression, highlighting the complex interplay between inflammatory stimuli and cannabinoid signaling pathways. These results suggest that CBD may ameliorate inflammation in part by maintaining TREM2 expression and reducing sTREM2. Additional research is not only necessary to understand the complex molecular makeup of cannabis, but also is imperative to elucidate the potential underlying molecular mechanisms shared by TREM2 and cannabis-derived anti-inflammatory mediators.
While our study provides valuable insights into the role of TREM2 and the potential impact of cannabis on neuroinflammation in HAND, it is essential to acknowledge several limitations that may affect the generalizability and interpretation of our findings. Firstly, our study relied on a limited number of donors, which may not fully represent the diversity and variability within the population of people living with HIV. Additionally, the age of donors may not encompass the full spectrum of age-related changes that could influence TREM2 expression and neuroinflammatory processes. Moreover, while our analysis revealed alterations in TREM2 expression and neuroinflammatory markers in an EcoHIV-infected mouse model, it is crucial to recognize that this model lacks key components of HIV neuropathogenesis, such as the gp120 protein. Furthermore, our study did not consider the potential effects of antiretroviral therapy (ART) in the mouse model which could significantly influence TREM2 expression, neuroinflammation, and cognition. This line of reasoning may explain the lack of negative effects from the NOR results in EcoHIV-treated mice. Lastly, our study did not explore the effects of minor cannabinoids that are present in cannabis, and these may be responsible for observed associations with reduced inflammation and neuroprotection in PWH. Therefore, while our findings provide valuable insights, further research with larger sample sizes, diverse populations, consideration of age-related changes, inclusion of relevant HIV components, and exploration of therapeutic interventions is warranted to validate and extend our findings.
Figure 1.
EcoHIV reduces levels of TREM2 and alters learning in TREM2R47H and WT mice. (A) Detection of the mature, immature, carboxy terminal fragment (CTF) isoforms for TREM2 in wild type (WT) and TREM2R47H mice treated with EcoHIV or saline. Densitometry measurement ratios of (B) total TREM2 to ACTB, (C) immature to mature TREM2 isoforms, and (D) CTF to total TREM2 band density. (E) Total Activity Measurements represented as beam breaks over four days in WT and TREM2R47H mice treated with EcoHIV or saline. (F) Total distance traveled during behavioral testing in WT and TREM2R47H mice treated with EcoHIV or saline. Day 4 of behavioral tests occurred 72h after mice were tested for three consecutive days (Days 1-3). Data represented as mean ± SEM and analyzed using two-way ANOVA with Holm-Sidak’s multiple comparisons tests; n=5-6 per condition; *p<0.05, **p<0.01, ***p<0.001.
Figure 2.
EcoHIV increases hippocampal IBA1 expression in TREM2R47H mice. (A) IBA1 (ionized calcium binding adaptor molecule 1, i.e., microglia) immunostaining of whole hippocampi (400 μm scale bar) for wild type (WT) and TREM2R47H mice. (B) Quantification of relative optical density for whole hippocampi. (C) IBA1 immunostaining of CA1 (20 μm scale bar). (D) Quantification of relative optical density for CA1. (E) IBA1 immunostaining of CA2/3 (20 μm scale bar). (F) Quantification of relative optical density for CA2/3. (G) IBA1 immunostaining of dentate gyrus (DG) (20 μm scale bar). (H) Quantification of relative optical density for DG. Data represented as mean ± SEM and analyzed using two-way ANOVA with Holm-Sidak’s multiple comparisons tests; n=5-6 per condition; *p<0.05, **p<0.01, ***p<0.001.
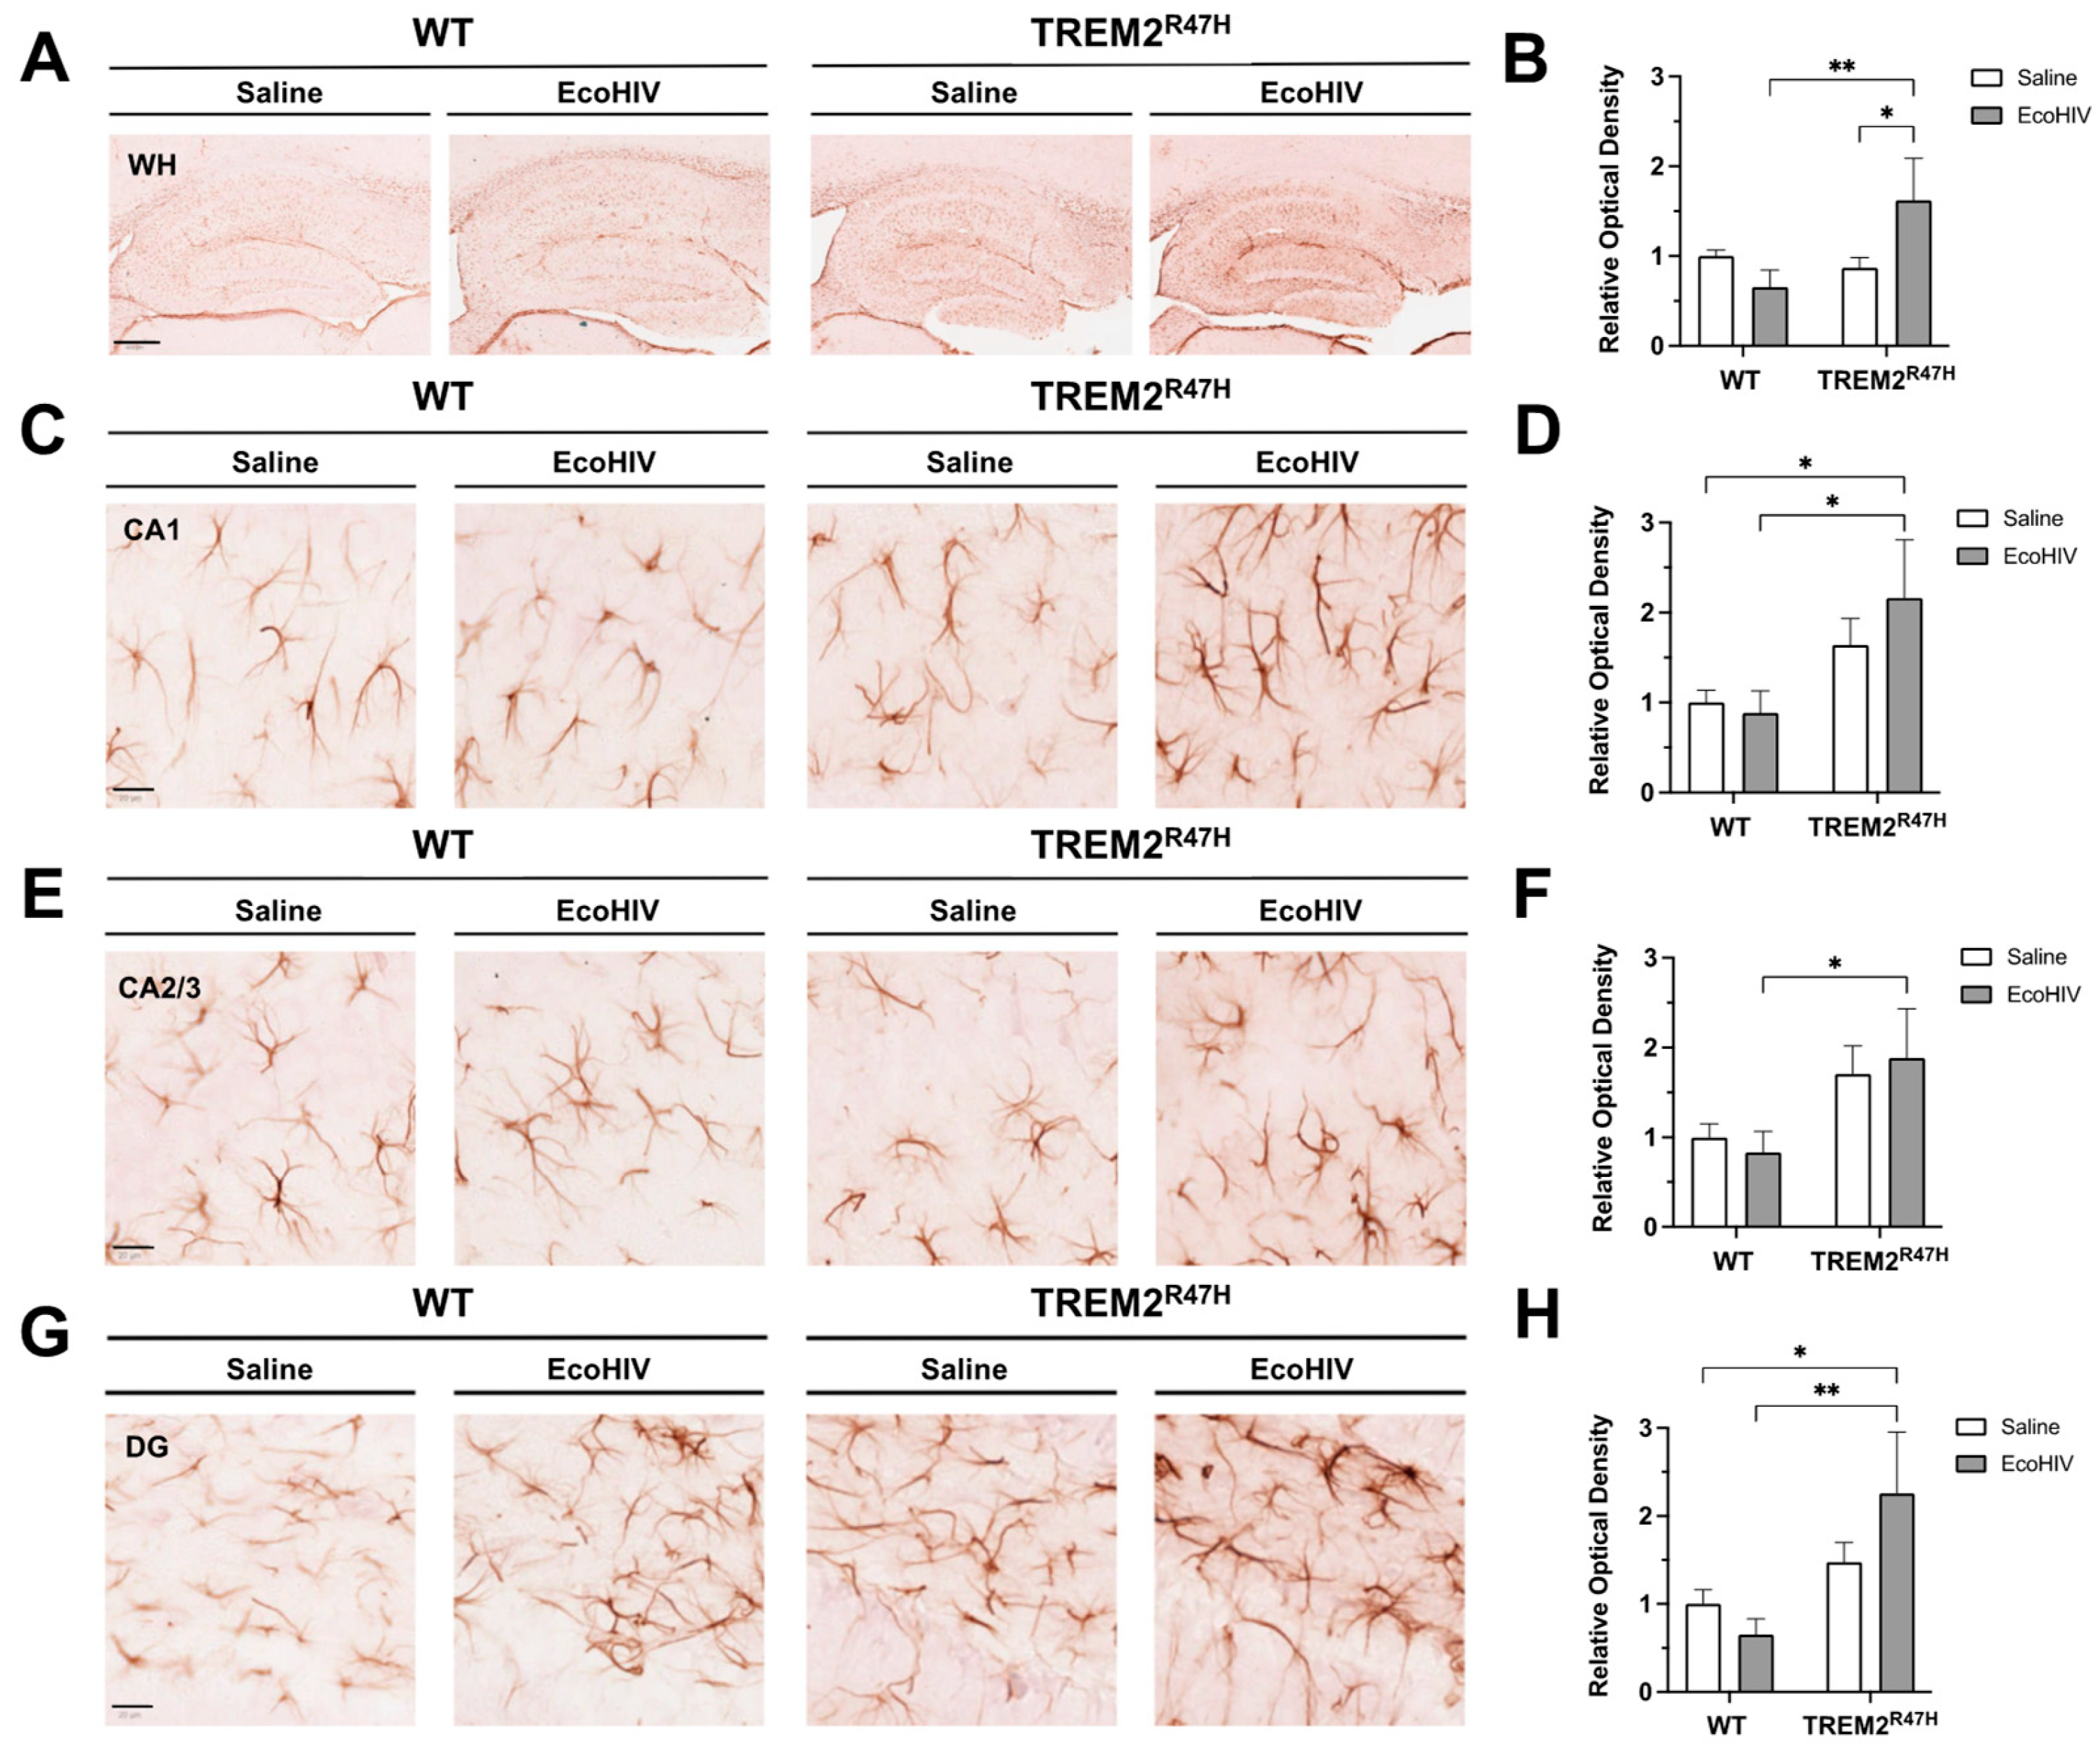
Figure 3.
Hippocampal GFAP expression is increased in TREM2R47H mice infected with EcoHIV. (A) GFAP (glial fibrillary acidic protein, i.e., astroglia) immunostaining of whole hippocampi (400 μm scale bar) for wild type (WT) and TREM2R47H mice. (B) Quantification of relative optical density for whole hippocampi. (C) GFAP immunostaining of CA1 (20 μm scale bar). (D) Quantification of relative optical density for CA1. (E) GFAP immunostaining of CA2/3 (20 μm scale bar). (F) Quantification of relative optical density for CA2/3. (G) GFAP immunostaining of dentate gyrus (DG) (20 μm scale bar). (H) Quantification of relative optical density for DG. Data represented as mean ± SEM and analyzed using two-way ANOVA with Fisher’s LSD multiple comparisons tests; n=4-6 per condition; *p<0.05, **p<0.01, ***p<0.001.
Figure 4.
The relationship between monocyte-derived macrophage TREM2 mRNA expression and age is differentially affected by cannabis and HIV. (A) Correlation plot for TREM2 mRNA versus age in HIV- Naïve cannabis users (n=6). (B) Correlation plot for TREM2 mRNA versus age in HIV- Moderate and HIV- Daily cannabis users (n=7). (C) Correlation plot for TREM2 mRNA versus age in HIV+ Naïve cannabis users (n=20). (D) Correlation plot for TREM2 mRNA versus age in HIV+ Moderate and HIV+ Daily cannabis users (n=14). All correlation plots analyzed via simple linear regression.
Figure 5.
Cannabis Use and HIV Status Differential Modulate TREM2 Expression in MDMs treated with CBD and cannabinoid/PPAR antagonists. MDMs from (A) HIV- Naïve (n=10), (B) HIV- Moderate (n=3), (C) HIV- Daily (n=8), (D) HIV+ Naïve (n=22), (E) HIV+ Moderate (n=13), and (F) HIV+ Daily (n=7) treated with IL1B (20 ng/mL), CBD (30 uM), or a combination of CBD and IL1B (C+I). (G) Cannabis- and (H) Cannabis+ groups were evaluated for TREM2 expression after treatment with IL1B, CBD, or C+I alone and in combination with cannabinoid PPAR antagonists. AM 251; CB1 receptor antagonist; 1 uM, AM 630; CB2 receptor antagonist; 1 uM, GW 6471; PPARα antagonist; 1 uM, and GW 9662; PPARγ antagonist; 1 uM. TREM2 expression levels were measured by qPCR and presented as relative expression (2−ΔΔCq); n=3 per condition. Data represented as mean ± SEM and analyzed using one-way (A-F) and two-way (G-H) ANOVA with Holm-Sidak’s multiple comparisons tests. *p<0.05, **p<0.01, ***p<0.001.
Figure 6.
Cannabis use alters TREM2 and TREM2-related mRNA expression in monocyte-derived macrophages (MDMs) isolated from blood samples of people with HIV. Volcano plots with corresponding GO term plots relative to HIV- Naïve for (A) HIV+ Naïve, (B) HIV+ Moderate, and (C) HIV+ Daily patients. (D) Principal component analysis (PCA) plot displaying sample variance among MDMs from people with HIV with varying cannabis use frequency. (E) Heat map of TREM2-related and other relevant genes in MDMs pre-treated with cannabidiol (CBD, 30µM) or vehicle for 1h prior to IL1B (20ng/ml) or vehicle for 6h. C+I = CBD + IL1B (F) Differentially expressed genes from RNAseq and (G) RT-qPCR analysis from additional donor samples. Data represented as mean ± SEM and analyzed using two-way ANOVA with Holm-Sidak’s multiple comparisons tests; n=3 per condition; *p<0.05, **p<0.01, ***p<0.001.
Figure 7.
Cannabidiol (CBD) reduces soluble (sTREM2) and increases membrane-bound TREM2 in cultured monocyte-derived macrophages (MDMs). (A) Relative absorbance for sTREM2 measured via ELISA in cultured MDMs treated with IL1Β (20ng/ml), CBD (30µM, 1h pre-treatment), or CBD + IL1B (C+I) (B) Representative images of MDMs from HIV+ Naïve background immunostained for membrane-bound TREM2 following 24h treatment with IL1Β, CBD, or C+I. (C) Relative TREM2 intensity for immunostained MDMs treated with IL1Β, CBD, or C+I. Data represented as mean ± SEM and analyzed using one-way ANOVA with Holm-Sidak’s multiple comparisons tests; n=3-6 per condition; *p<0.05, **p<0.01, ***p<0.001.
Table 1.
Clinical and demographic characteristics of study population. GDS = global deficit score, POMS = Profile of Mood States.
Table 1.
Clinical and demographic characteristics of study population. GDS = global deficit score, POMS = Profile of Mood States.
| HIV Status |
Sex
(M/F/TBD) |
Ethnicity
(% Hispanic) |
Race
(% White) |
Education
(years) |
| HIV- |
11 / 3 / 3 |
14.3 |
14.3 |
15.5 |
| HIV+ |
32 / 4 / 6 |
13.3 |
76.7 |
15.6 |
| Group |
Age
(years ± SEM)
|
GDS
(score ± SEM)
|
POMS
(score ± SEM)
|
Infection Duration (years ± SEM) |
| HIV+ Naive (n=22) |
63.68 ± 1.69 |
0.37 ± 0.08 |
1.78 ± 0.29 |
27.46 ± 2.25 |
| HIV+ Moderate (n=12) |
55.83 ± 3.51 |
0.46 ± 0.13 |
2.05 ± 0.52 |
22.42 ± 2.76 |
| HIV+ Daily (n=8) |
53.62 ± 5.19 |
0.82 ± 0.3 |
2.55 ± 0.26 |
28.49 ± 1.91 |
| HIV- Naïve (n=8) |
51.75 ± 7.14 |
0.28 ± 0.05 |
1.20 ± 0.30 |
N/A ± N/A |
| HIV- Moderate (n=1) |
29.0 ± N/A |
0.06 ± N/A |
0.19 ± N/A |
N/A ± N/A |
| HIV- Daily (n=8) |
44.0 ± 4.98 |
0.25 ± N/A |
2.94 ± N/A |
N/A ± N/A |
