Preprint
Communication

Identification of Key Biomarkers in Pulmonary Arterial Hypertension Based on Weighted Gene Co-expression Network Analysis

Altmetrics

Downloads

107

Views

38

Comments

0

Submitted:

12 August 2024

Posted:

13 August 2024

You are already at the latest version

Alerts
Abstract
Pulmonary arterial hypertension (PAH) is a complex and devastating disease that the underlying cellular and molecular mechanisms are largely remains unknown. This study aimed to elucidate the key hub genes and pathways in PAH by bioinformatics analysis. In the current study, we performed WGCNA analysis to systematically identify the hub genes for PAH using transcriptome microarray data. From the Gene Expression Omnibus (GEO) database, one microarray dataset (GSE113439) was downloaded for this study. There were 26 samples in this data set, including 15 PHA samples and 11 normal controls. Based on weighted correlation network analysis, 11 modules were identified and the MEgreenyellow module showed a significantly positive correlation with PAH (r = 0.93, P = 1e−06). The genes in greenyellow module were mainly significantly enriched in mitophagy related pathways by KEGG analyses. Combined with the protein–protein interaction (PPI) and co-expression networks, ten hub genes were identified as candidate biomarkers for PAH in the greenyellow module, including CTNNB1, NIPBL, ROCK2, ROCK1, SCAF11, JAK1, BIRC6, KIF5B, PPP1R12A and XRN1. These hub genes might be potential targets for clinical therapy against PAH. The molecular mechanisms involved in these genes that affected the prognosis of PAH should be further validated through biological and basic studies.
Keywords: 
Subject: Medicine and Pharmacology  -   Pulmonary and Respiratory Medicine

1. Introduction

Pulmonary arterial hypertension (PAH) is a devastating and complex disease in the worldwide. According to the World Health Organization (WHO) classification system, a resting mean pulmonary artery pressure (mPAP) of PAH is more than 25 mm Hg, pulmonary capillary wedge pressure (PCWP) of PAH is less than 15 mm Hg, and a pulmonary vascular resistance (PVR) of PAH is more than three Wood units.[1,2,3] PAH affects the pulmonary vasculature by remodeling of the pulmonary vasculature primarily, which can eventually cause vascular dysfunction and structural remodeling of the small pulmonary arteries, then ultimately leading to right ventricular (RV) failure.[4,5] Median survival is only 5–7 years for PAH patients.[6] The pathophysiology of PAH is complex, for this condition can be influenced by multiple processes including DNA damage, genetic modifying factors, environmental factors, microRNAs (miRs), oxidative stress, sex hormones and altered cell metabolism.[7,8,9,10] Even though great efforts have been made in this field during the past few years, the underlying mechanism of PAH is not entirely clear.
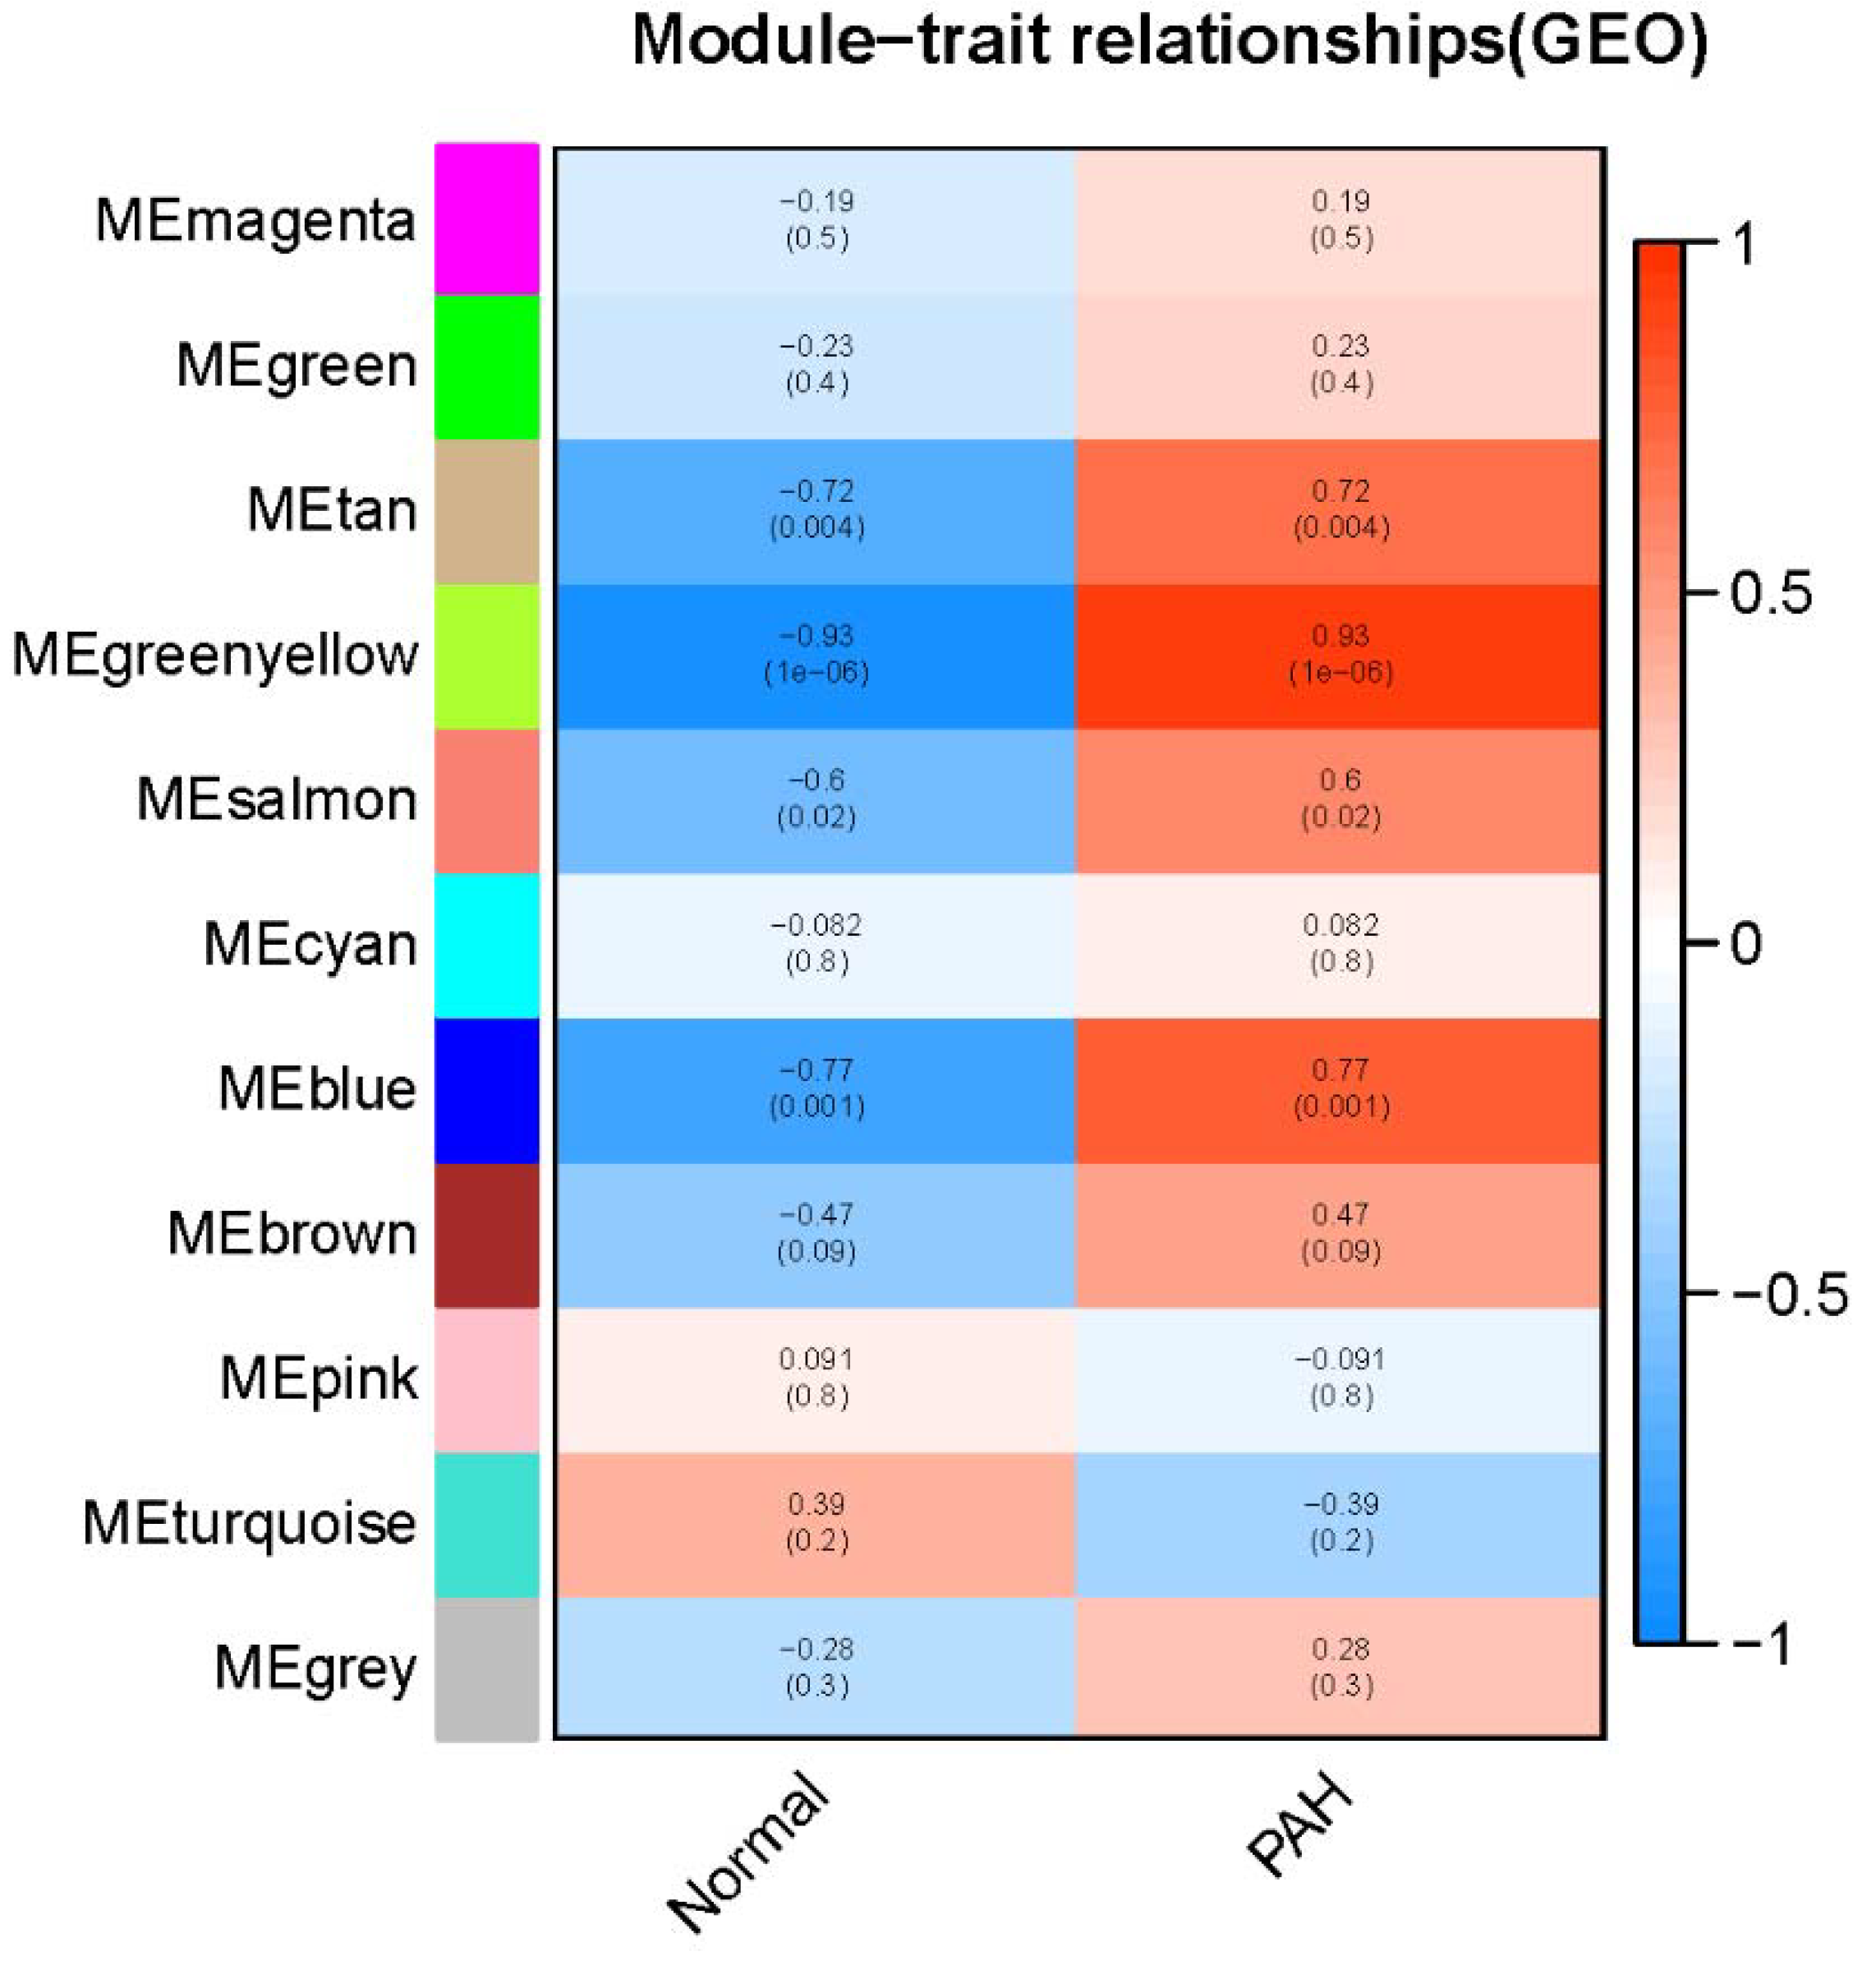
Weighted gene co-expression network analysis (WGCNA), which is a widely used technique to detect modules and hub genes that are based on comparison between two groups and complex network analysis.[11] WGCNA method is based on some Network Medicine hypothesis.[12] To gain further insight into the mechanisms and factors leading to the development of PAH, we performed WGCNA to identify co-expression modules and hub genes for PAH using transcriptome microarray data. One microarray dataset (GSE113439) was obtained from the Gene Expression Omnibus (GEO) database for WGCNA analysis. The results of WGCNA found that 11 modules were identified and the MEgreenyellow module showed a significantly positive correlation with PAH (r = 0.93, P = 1e−06). In this module, ten hub genes were identified as potential biomarkers for PAH, including CTNNB1, NIPBL, ROCK2, ROCK1, SCAF11, JAK1, BIRC6, KIF5B, PPP1R12A and XRN1. These hub genes might be potential targets for clinical therapy against PAH.

2. Material and Methods

2.1. Microarray Data Sources

The GEO database (http://www.ncbi.nlm.nih.gov/geo/) is a public database containing a large number of gene profiles in various diseases. The gene expression profile was obtained from the GEO database. For the present study, the selection criteria were: (1) a total sample size was more than 15; (2) data accessibility (raw data or processed data); (3) studies were conducted on human samples of normal control and PAH patients. The GSE113439 dataset was included in the end, for its highest quality and appropriate sample size. Ethical approval was not necessary in this study, for the data we used was extracted from public GEO database.

2.2. Data and Statistical Analysis

Statistical analyses were performed by the R software (v.4.0.3) and the aforementioned packages. The limma (linear models for microarray data) package was used for the quality control.[13] Since the data were already normalized through Robust Multi-array Average (RMA) method,[14] we conducted the WGCNA analysis on the entire GSE113439 dataset.

2.3. Identification Key Gene Modules by WGCNA and Functional Enrichment Analysis

The WGCNA package in R was used to bulid the co-expression network with the GSE113439 dataset. The samples were clustered by Pearson’s correlation coefficient to filter the obvious outliers first. Second, using the automatic network construction function, the gene co-expression network was obtained. Third, the soft thresholding power β was used to calculate the WGCNA adjacency. Modules were determined through hierarchical clustering dendogram and dynamic tree cut function. Then, we calculated the module membership (MM), the gene significance (GS) and the correlation between the modules and the clinical data. We set a threshold of 0.25 to merge the similar modules to obtain the correct module number and clarify gene interaction. Genes in the most significant module were exported for further analysis. The linear regression relationship between the clinical features and gene expression was based on the P-value. To explore the potential biological themes and pathways of genes from the key module, the Kyoto Encyclopedia of Genes and Genomes (KEGG) enrichment terms were analyzed via. the clusterProfiler package[15] in R. We also used DAVID 6.8 (https://david-d.ncifcrf.gov/) online tools to perform the Gene Ontology (GO) analysis. The “ggplot2” R package was used to display the GO and KEGG enrichment results. A P value < 0.05 was considered significant pathways.

2.4. Identification of Hub Genes

After the identification of the key modules, the genes in the key module with high connectivity were screened. Next, to perform protein–protein interaction (PPI) network analysis, we uploaded these genes to STRING (v11.0) database (https://string-db.org/).[16] The combined score was set to more than 0.4 and other parameters were set to default. The “TSV: tab separated values” file was downloaded and imported into the Cytoscape software (version 3.8.2). The top 10 key genes were identified as “hub genes” by Maximal Clique Centrality (MCC) using the “cytoHubba” app. [17]

3. Results

3.1. Identification Key Gene Modules by WGCNA

In this study, we screened gene expression profiles from the GEO dataset for WGCNA analysis. The GSE113439 dataset was obtained from the GEO website. GSE113439, which was established on the platform of the Human Gene 1.0 set array (Affymetrix Inc., Santa Clara, CA, USA), was submitted by Mura. There were 26 samples in this data set, including 15 PAH samples and 11 normal controls. In our study, we comprehensively analyzed the expression data of GSE113439. The limma package was used for data normalization and quality control. Then, the Pearson’s correlation coefficient was used to cluster the samples in GSE113439. 45 was set as the cut-off height value. The samples that did not meet this criterion were removed. To construct a scale-free network, power of β = 17 (scale-free R2=0.9) was selected as the soft-thresholding power. We then constructed the gene co-expression network by WGCNA package in R software, and 11 modules were detected and constructed (Figure 1). The sizes ranges of the 11 modules were from 75 to 551 genes. The correlations between each module and clinical trait (PAH or normal) were also calculated to determine significant associations (Figure 2). The results revealed that the greenyellow module was the most significantly correlated with PAH.

3.2. Functional GO and KEGG Pathway Enrichment Analyses of the Key Module

To study the function of the greenyellow module, we conducted a GO analysis of all genes in this module. A total of 13 significantly enriched biological process (BP) were observed in the current study, such as regulation of establishment of endothelial barrier,regulation of stress fiber assembly, ubiquitin-dependent protein catabolic process,protein phosphorylation,resolution of recombination intermediates,regulation of gene expression,negative regulation of bicellular tight junction assembly,regulation of cell adhesion,negative regulation of myosin-light-chain-phosphatase activity,actin cytoskeleton reorganization,regulation of actin cytoskeleton organization,cellular response to DNA damage stimulus,positive regulation of DNA-templated transcription, initiation (GO IDs: 1903140,0051492,0006511,0006468,0071139,0010468,1903347,0030155,0035509,0031532,0032956,0006974,2000144, respectively). A total of 8 significantly enriched cellular component (CC) were observed in the current study, such as nucleoplasm, nucleus, membrane, intracellular, cytoplasm, cell cortex, centrosome, transcriptional repressor complex (GO IDs: 0005654, 0005634, 0016020, 0005622, 0005737, 0005938, 0005813, 0017053, respectively). A total of 8 significantly enriched molecular function (MF) were observed in the current study, such as protein binding, ATP binding, cysteine-type endopeptidase activity, thiol-dependent ubiquitin-specific protease activity, nucleic acid binding, SMAD binding, poly(A) RNA binding, DNA binding (GO IDs: 0005515, 0005524, 0004197, 0004843, :0003676, 0046332, 0044822, 0003677, respectively).
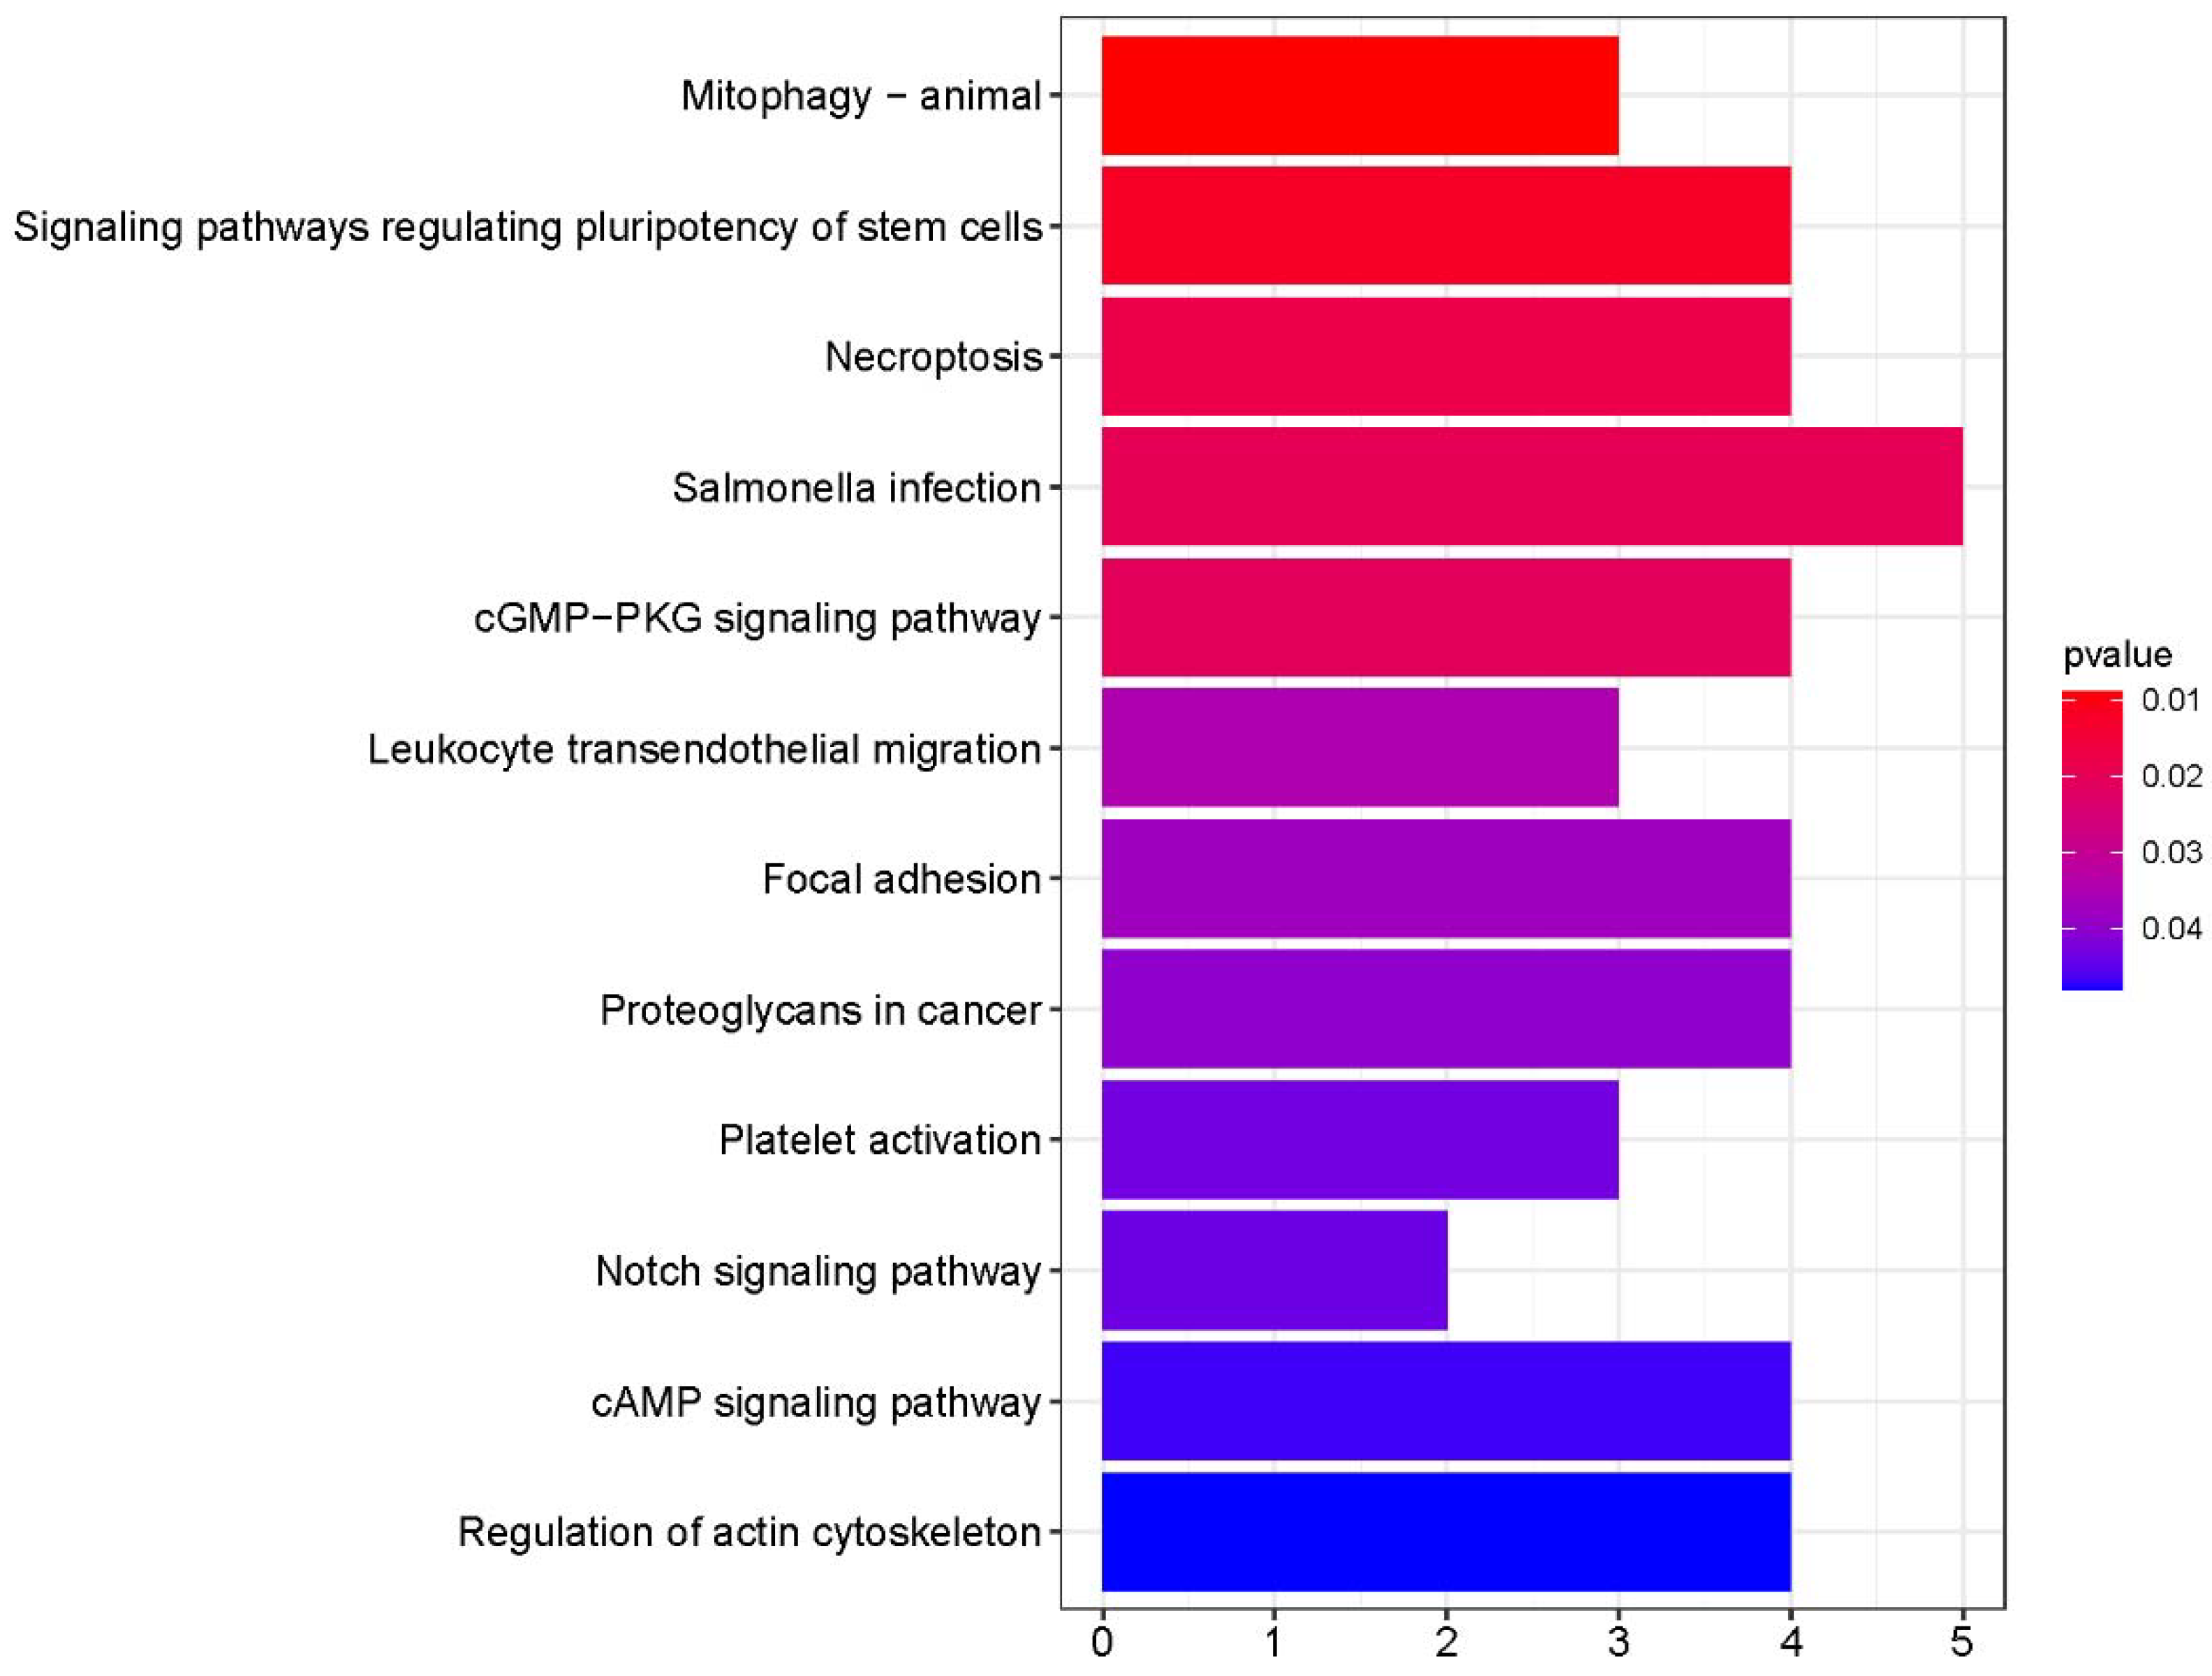
We also conducted a KEGG analysis of all genes in the greenyellow module. Figure 3 shows that the most significantly enriched KEGG pathway was mitophagy (pathway ID: 04137), which is directly associated with PAH. Moreover, the present study detected the others significantly enriched KEGG pathways, including signaling pathways regulating pluripotency of stem cells, necroptosis, salmonella infection, cGMP-PKG signaling pathway, leukocyte transendothelial migration, focal adhesion, proteoglycans in cancer, platelet activation, notch signaling pathway, cAMP signaling pathway and regulation of actin cytoskeleton (Figure 3).

3.3. PPI Network Construction

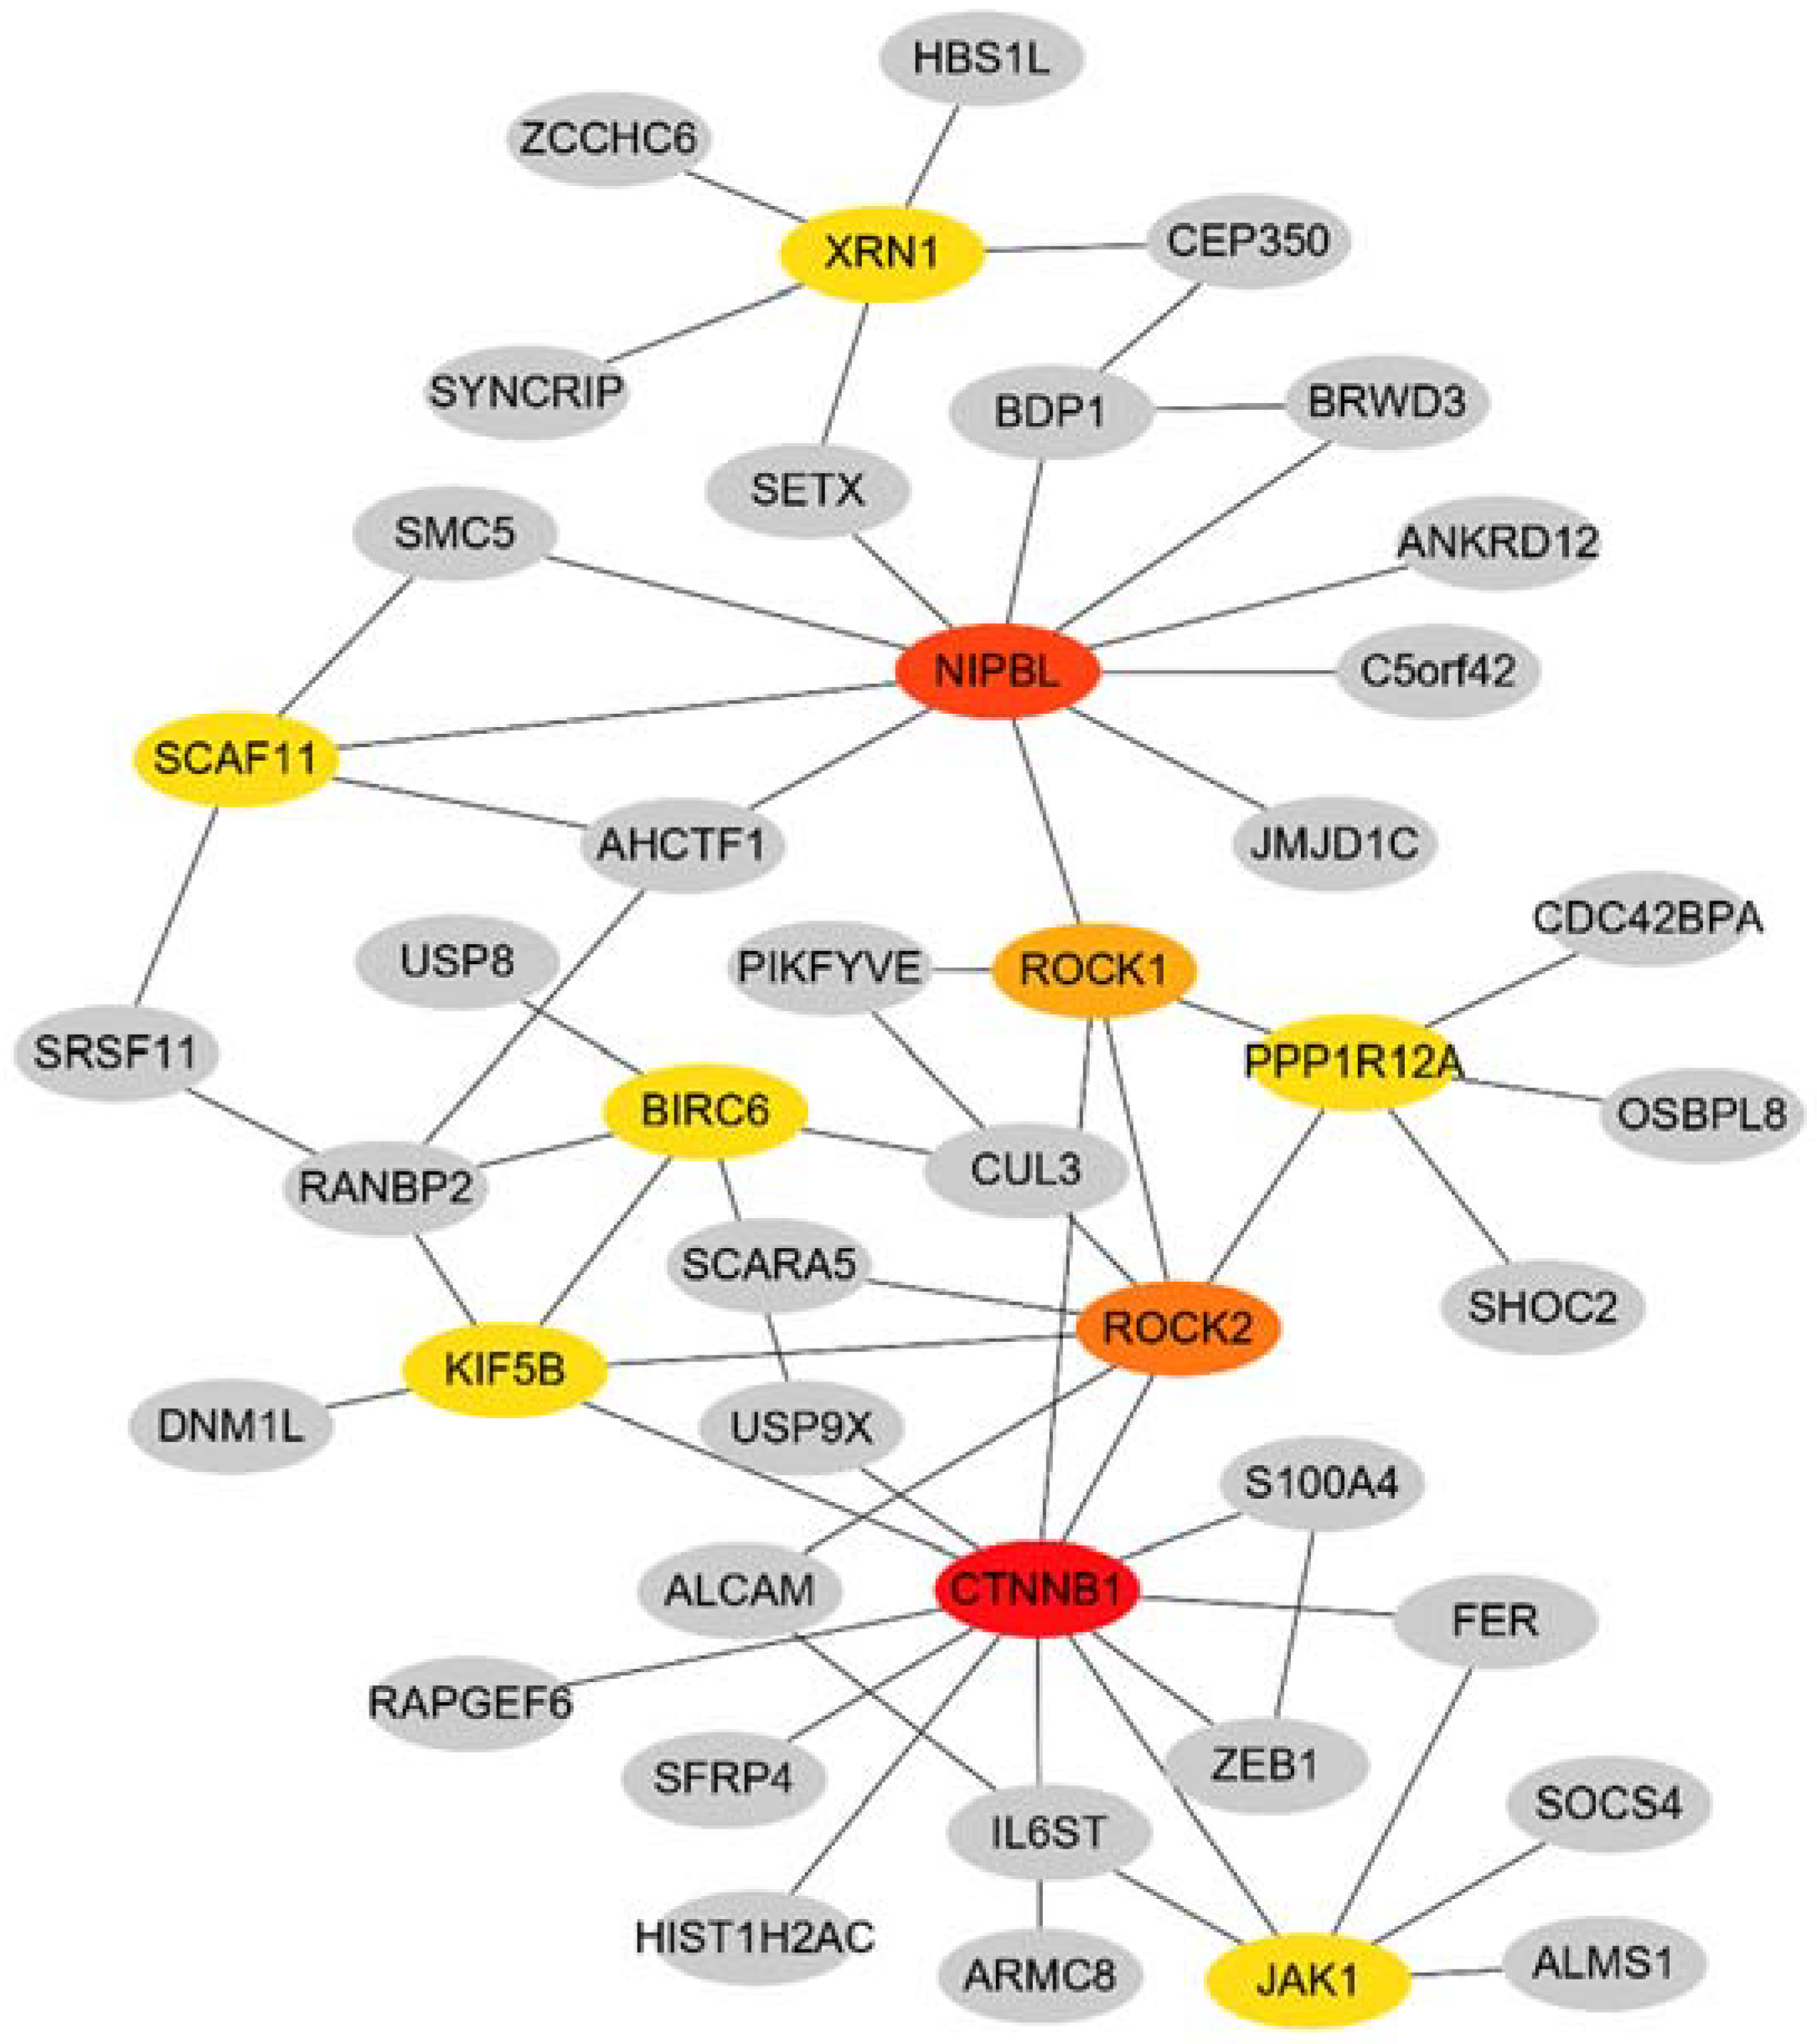
To define the protein interactions, STRING was used to create PPI network. With the cytoHubba plugin, the top 10 hub genes were identified as CTNNB1, NIPBL, rho-associated coiled-coil–containing protein kinase (ROCK)2, ROCK1, SCAF11, JAK1, BIRC6, KIF5B, PPP1R12A and XRN1(Figure 4). KEGG analysis revealed that the mainly enriched pathways for the 10 hub genes were proteoglycans in cancer, focal adhesion and vascular smooth muscle contraction.

4. Discussion

PAH is a complex and devastating disorder. Histopathological examination of PAH reveals that proliferation of pulmonary artery endothelial cells (PAECs), fibroblasts and pulmonary artery smooth muscle cells (PASMCs) might occlude pulmonary arterioles, then eventually leads to right heart hypertrophy and heart failure.[18,19] The exact pathophysiology and mechanisms for PAH are largely unknown. Therefore, it is of great important to identify the underlying cellular and molecular mechanism of PAH, and might be the potential targets for clinical treatment of PAH.
In this study, we screened key gene modules and hub genes from the GSE113439 dataset through WGCNA analysis, and 11 modules were detected and constructed. The greenyellow module was highly correlated with PAH. We then conducted GO and KEGG analysis of all genes in the greenyellow module. The most significantly enriched KEGG pathway was mitophagy, which is directly associated with PAH. Mitophagy is a process referred to mitochondria degradation via autophagy. A number of studies have demonstrated that enhanced autophagic pathway promotes the development of PAH through several mechanisms, such as the removal of misfolded proteins and the preservation of mitochondrial homeostasis.[20]-[22] The present study also detected the others significantly hub pathways, including signaling pathways regulating pluripotency of stem cells, necroptosis, salmonella infection, cGMP-PKG signaling pathway, leukocyte transendothelial migration, focal adhesion, proteoglycans in cancer, platelet activation, notch signaling pathway, cAMP signaling pathway and regulation of actin cytoskeleton. Recently, Hashimoto et al.[3] demonstrated an unexpected function for bone marrow-derived hematopoietic stem cells (HSCs) in the pathogenesis of PAH, which is consist with our findings. In a recent animal study, necroptosis pathway was found associated with the pathogenesis of PAH through the RNA-seq data set and bioinformatics approach.[23] In this study, we also identify the necroptosis pathway was significantly enriched in the greenyellow module. Previous studies have shown that the platelets of PAH patients are activated.[24,25] Similarly, in the current study, we have also found that platelet activation pathway was significantly enriched. These finding suggests that the hub pathways may be involved in modulation of PAH and have a therapeutic potential.
STRING was used to create PPI network of the genes in the greenyellow module to define the protein interactions. With the cytoHubba plugin, the top 10 hub genes were screened as CTNNB1, NIPBL, ROCK2, ROCK1, SCAF11, JAK1, BIRC6, KIF5B, PPP1R12A and XRN1. Previous studies have analyzed the same public microarray dataset (GSE113439), and have indicated different results. Luo et al. found that SMC2, CDK1, SMC4, CENPE, and KIF23 might be closely associated with the pathogenesis of PAH.[26] Li et al. identified nine hub genes related to PAH, including the PLK4 and SMC2 genes.[27] In another study, Ma et al. suggested that SMC4, TOP2A, SMC2, ANLN, KIF11, KIF23, SMC3, ARHGAP11A, RAD50 and SMC6 may involve in the pathogenesis of PAH.[28] In a recent study, Yao et al. revealed several hub genes associated with PAH, including HSP90AA1, ANGPT2, HSPD1, HSPH1, TTN, SPP1, SMC4, EEA1, and DKC1.[29] Another recent study found that 5 hub genes (CCL5, CXCL12, VCAM1, CXCR1, and SPP1) might play an important role in the development of PAH.[30] All of the above studies compared the differentially expressed genes (DEGs) between control samples and PAH samples. The methodology is different from our study. According to the tutorials of WGCNA (https://horvath.genetics.ucla.edu/html/CoexpressionNetwork/Rpackages/WGCNA/Tutorials/ ), the input data should be the unfiltered expression matrix. Different approaches often give different results. To our knowledge, this is the first time using WGCNA methods to comprehensively reveal the biological processes of PAH in patients.
Among the top 10 hub genes in this study, CTNNB1, also known as catenin beta 1 or β-catenin, has an important role in adherens junctions. Yu et al.[31] have found that the mRNA and protein levels of β-catenin were remarkably elevated in the lung tissues of monocrotaline (MCT)-induced pulmonary arterial hypertension (PAH) rats group than control group. A case report showed that the variation of CTNNB1 is associated with abnormal lung growth and pulmonary hypertension.[32] NIPBL is a multifunctional protein and functions as a loading factor for cohesion.[33] Publications have reported that loss of NIPBL promotes autophagy through impairs the DNA damage response and decrease lung cancer cells proliferation, migration and invasion.[34] Previous reports have shown that ROCK1 and ROCK2 were involved in autophagy and fibrosis of the heart.[35] Reduced expression of either ROCK1 or ROCK2 might be a protective factor of pulmonary fibrosis.[36] These findings suggest that identification of the hub genes will allow greater understanding of the mechanisms and prognosis of PAH, as well as promote discovery of novel diagnostic and therapeutic direction.
In this study, there are some limitations. Firstly, the sample size was still relatively small. Second, although this study was based on WGCNA approach, which is a useful systems biology method, it was still limited to a certain computer analysis. Finally, there is still lack of experimental verification.
In the future, large amounts of data will be needed to further verify the hub genes and co-expression networks relationships of PAH, and the results need to be verified by experiments in vivo and in vitro.

5. Conclusions

Taken together, our findings indicate that CTNNB1, NIPBL, ROCK2, ROCK1, SCAF11, JAK1, BIRC6, KIF5B, PPP1R12A and XRN1 are closely associated with PAH. The molecular mechanisms involved in these genes that affected the prognosis of PAH should be further validated through biological and basic studies.

Author Contributions

ZZ: MW, XY and PC conceived and designed the idea; MW and HJ extracted data, analyzed the data and drafted the manuscript. MW, HJ and HJ checked raw data. PC and ZZ revised the manuscript. PC and XY revised the final manuscript.

Funding

A project supported by Center for Early Childhood Education Research, Sichuan (CECER-2022-B01); A project supported by the National Natural Science Foundation of China (82073539); A project supported by College Students' Innovation and Entrepreneurship Training Program of Sichuan Province (S202411079090); A project supported by College Students' Innovation and Entrepreneurship Training Program of Chengdu University (CDUCX2024173).

Acknowledgments

We acknowledge GEO database for providing their platforms and contributors for uploading their meaningful datasets.

Conflicts of Interest

No.

Abbreviations

PAH Pulmonary arterial hypertension
GEO Gene Expression Omnibus
PPI protein–protein interaction
WHO World Health Organization
mPAP mean pulmonary artery pressure
PCWP pulmonary capillary wedge pressure
PVR pulmonary vascular resistance
RV right ventricular
WGCNA Weighted gene co-expression network analysis
miRs microRNAs
RMA Robust Multi-array Average
MM module membership
GS gene significance
KEGG Kyoto Encyclopedia of Genes and Genomes
MCC Maximal Clique Centrality
BP biological process
CC cellular component
MF molecular function
PAECs pulmonary artery endothelial cells
PASMCs pulmonary artery smooth muscle cells
ROCK rho-associated coiled-coil–containing protein kinase
DEGs differentially expressed genes

References

  1. "2015 ESC/ERS Guidelines for the diagnosis and treatment of pulmonary hypertension. The Joint Task Force for the Diagnosis and Treatment of Pulmonary Hypertension of the European Society of Cardiology (ESC) and the European Respiratory Society (ERS)." Nazzareno Galiè, Marc Humbert, Jean-Luc Vachiery, Simon Gibbs, Irene Lang, Adam Torbicki, Gérald Simonneau, Andrew Peacock, Anton Vonk Noordegraaf, Maurice Beghetti, Ardeschir Ghofrani, Miguel Angel Gomez Sanchez, Georg Hansmann, Walter Klepetko, Patrizio Lancellotti, Marco Matucci, Theresa McDonagh, Luc A. Pierard, Pedro T. Trindade, Maurizio Zompatori and Marius Hoeper. Eur Respir J 2015; 46: 903-975. Eur. Respir. J. 2015, 46, 1855–1856. [CrossRef]
  2. Ruopp, N.F.; Cockrill, B.A. Diagnosis and Treatment of Pulmonary Arterial Hypertension: A Review. Jama 2022, 327, 1379–1391. [Google Scholar] [CrossRef]
  3. Hashimoto, R.; Lanier, G.M.; Dhagia, V.; et al. , Pluripotent hematopoietic stem cells augment α-adrenergic receptor-mediated contraction of pulmonary artery and contribute to the pathogenesis of pulmonary hypertension. Am. J. Physiol.. Lung Cell. Mol. Physiol. 2020, 318, L386–l401. [Google Scholar] [CrossRef]
  4. Steppan, J.; Wang, H.; Nandakumar, K.; et al. LOXL2 inhibition ameliorates pulmonary artery remodeling in pulmonary hypertension. Am. J. Physiol.. Lung Cell. Mol. Physiol. 2024. [Google Scholar] [CrossRef]
  5. Xiao, L.; Tong, X. [Advances in molecular mechanism of vascular remodeling in pulmonary arterial hypertension]. Zhejiang Da Xue Xue Bao. Yi Xue Ban = J. Zhejiang University. Med. Sci. 2019, 48, 102–110. [Google Scholar] [CrossRef]
  6. Benza, R.L.; Miller, D.P.; Barst, R.J.; et al. An evaluation of long-term survival from time of diagnosis in pulmonary arterial hypertension from the REVEAL Registry. Chest 2012, 142, 448–456. [Google Scholar] [CrossRef] [PubMed]
  7. Albulushi, A.; Kashoub, M.; Al-Saidi, K.; et al. Iron Deficiency in Pulmonary Hypertension. Int. Heart J. 2024. [Google Scholar] [CrossRef] [PubMed]
  8. Fukumoto, Y. Pathophysiology and Treatment of Pulmonary Arterial Hypertension. Int. J. Mol. Sci. 2024, 25. [Google Scholar] [CrossRef] [PubMed]
  9. Wołowiec, Ł.; Mędlewska, M.; Osiak, J.; et al. MicroRNA and lncRNA as the Future of Pulmonary Arterial Hypertension Treatment. Int. J. Mol. Sci. 2023, 24. [Google Scholar] [CrossRef]
  10. Southgate, L.; Machado, R.D.; Gräf, S.; et al. Molecular genetic framework underlying pulmonary arterial hypertension. Nat. Rev.. Cardiol. 2020, 17, 85–95. [Google Scholar] [CrossRef]
  11. Langfelder, P.; Horvath, S. WGCNA: an R package for weighted correlation network analysis. BMC Bioinform. 2008, 9, 559. [Google Scholar] [CrossRef]
  12. Barabási, A.L.; Oltvai, Z.N. Network biology: understanding the cell's functional organization. Nat. Rev.. Genet. 2004, 5, 101–113. [Google Scholar] [CrossRef] [PubMed]
  13. Ritchie, M.E.; Phipson, B.; Wu, D.; et al. limma powers differential expression analyses for RNA-sequencing and microarray studies. Nucleic Acids Res. 2015, 43, e47. [Google Scholar] [CrossRef] [PubMed]
  14. Mura, M.; Cecchini, M.J.; Joseph, M.; et al. Osteopontin lung gene expression is a marker of disease severity in pulmonary arterial hypertension. Respirology 2019, 24, 1104–1110. [Google Scholar] [CrossRef] [PubMed]
  15. Yu, G.; Wang, L.G.; Han, Y.; et al. clusterProfiler: an R package for comparing biological themes among gene clusters. Omics : A J. Integr. Biol. 2012, 16, 284–287. [Google Scholar] [CrossRef] [PubMed]
  16. Szklarczyk, D.; Morris, J.H.; Cook, H.; et al. The STRING database in 2017: quality-controlled protein-protein association networks, made broadly accessible. Nucleic Acids Res. 2017, 45, D362–d368. [Google Scholar] [CrossRef]
  17. Chin, C.H.; Chen, S.H.; Wu, H.H.; et al. cytoHubba: identifying hub objects and sub-networks from complex interactome. BMC Syst. Biol. 2014, 8 (Suppl 4), S11. [Google Scholar] [CrossRef] [PubMed]
  18. Zolty, R. Pulmonary arterial hypertension specific therapy: The old and the new. Pharmacol. Ther. 2020, 214, 107576. [Google Scholar] [CrossRef] [PubMed]
  19. Tuder, R.M.; Archer, S.L.; Dorfmüller, P.; et al. Relevant issues in the pathology and pathobiology of pulmonary hypertension. J. Am. Coll. Cardiol. 2013, 62, D4–D12. [Google Scholar] [CrossRef]
  20. Gomez-Puerto, M.C.; van Zuijen, I.; Huang, C.J.; et al. Autophagy contributes to BMP type 2 receptor degradation and development of pulmonary arterial hypertension. J. Pathol. 2019, 249, 356–367. [Google Scholar] [CrossRef]
  21. Chichger, H.; Rounds, S.; Harrington, E.O. Endosomes and Autophagy: Regulators of Pulmonary Endothelial Cell Homeostasis in Health and Disease. Antioxid. Redox Signal. 2019, 31, 994–1008. [Google Scholar] [CrossRef]
  22. Ornatowski, W.; Lu, Q.; Yegambaram, M.; et al. Complex interplay between autophagy and oxidative stress in the development of pulmonary disease. Redox Biol. 2020, 36, 101679. [Google Scholar] [CrossRef]
  23. Xiao, G.; Zhuang, W.; Wang, T.; et al. Transcriptomic analysis identifies Toll-like and Nod-like pathways and necroptosis in pulmonary arterial hypertension. J. Cell. Mol. Med. 2020, 24, 11409–11421. [Google Scholar] [CrossRef]
  24. Frantz, R.P.; McLaughlin, V.V.; Sahay, S.; et al. Seralutinib in adults with pulmonary arterial hypertension (TORREY): a randomised, double-blind, placebo-controlled phase 2 trial. Lancet. Respir. Med. 2024, 12, 523–534. [Google Scholar] [CrossRef]
  25. Vrigkou, E.; Tsantes, A.E.; Kopterides, P.; et al. Coagulation Profiles of Pulmonary Arterial Hypertension Patients, Assessed by Non-Conventional Hemostatic Tests and Markers of Platelet Activation and Endothelial Dysfunction. Diagnostics 2020, 10. [Google Scholar] [CrossRef]
  26. Luo, J.; Li, H.; Liu, Z.; et al. Integrative analyses of gene expression profile reveal potential crucial roles of mitotic cell cycle and microtubule cytoskeleton in pulmonary artery hypertension. BMC Med. Genom. 2020, 13, 86. [Google Scholar] [CrossRef]
  27. Li, Q.; Meng, L.; Liu, D. Screening and Identification of Therapeutic Targets for Pulmonary Arterial Hypertension Through Microarray Technology. Front. Genet. 2020, 11, 782. [Google Scholar] [CrossRef]
  28. Ma, Y.; Chen, S.S.; Feng, Y.Y.; et al. Identification of novel biomarkers involved in pulmonary arterial hypertension based on multiple-microarray analysis. Biosci. Rep. 2020, 40. [Google Scholar] [CrossRef] [PubMed]
  29. Yao, X.; Jing, T.; Wang, T.; et al. Molecular Characterization and Elucidation of Pathways to Identify Novel Therapeutic Targets in Pulmonary Arterial Hypertension. Front. Physiol. 2021, 12, 694702. [Google Scholar] [CrossRef] [PubMed]
  30. Zeng, Y.; Li, N.; Zheng, Z.; et al. Screening of Hub Genes Associated with Pulmonary Arterial Hypertension by Integrated Bioinformatic Analysis. BioMed Res. Int. 2021, 2021, 6626094. [Google Scholar] [CrossRef] [PubMed]
  31. Yu, R.H.; Wang, L.M.; Hu, X.H. MiR-135a inhibitor alleviates pulmonary arterial hypertension through β-Catenin/GSK-3β signaling pathway. Eur. Rev. Med. Pharmacol. Sci. 2019, 23, 9574–9581. [Google Scholar] [CrossRef]
  32. Karolak, J.A.; Szafranski, P.; Kilner, D.; et al. Heterozygous CTNNB1 and TBX4 variants in a patient with abnormal lung growth, pulmonary hypertension, microcephaly, and spasticity. Clin. Genet. 2019, 96, 366–370. [Google Scholar] [CrossRef]
  33. Alonso-Gil, D.; Losada, A. NIPBL and cohesin: new take on a classic tale. Trends Cell Biol. 2023, 33, 860–871. [Google Scholar] [CrossRef]
  34. Zheng, L.; Zhou, H.; Guo, L.; et al. Inhibition of NIPBL enhances the chemosensitivity of non-small-cell lung cancer cells via the DNA damage response and autophagy pathway. OncoTargets Ther. 2018, 11, 1941–1948. [Google Scholar] [CrossRef]
  35. Shi, J.; Surma, M.; Yang, Y.; et al. Disruption of both ROCK1 and ROCK2 genes in cardiomyocytes promotes autophagy and reduces cardiac fibrosis during aging. FASEB J. : Off. Publ. Fed. Am. Soc. Exp. Biol. 2019, 33, 7348–7362. [Google Scholar] [CrossRef]
  36. Knipe, R.S.; Probst, C.K.; Lagares, D.; et al. The Rho Kinase Isoforms ROCK1 and ROCK2 Each Contribute to the Development of Experimental Pulmonary Fibrosis. Am. J. Respir. Cell Mol. Biol. 2018, 58, 471–481. [Google Scholar] [CrossRef]
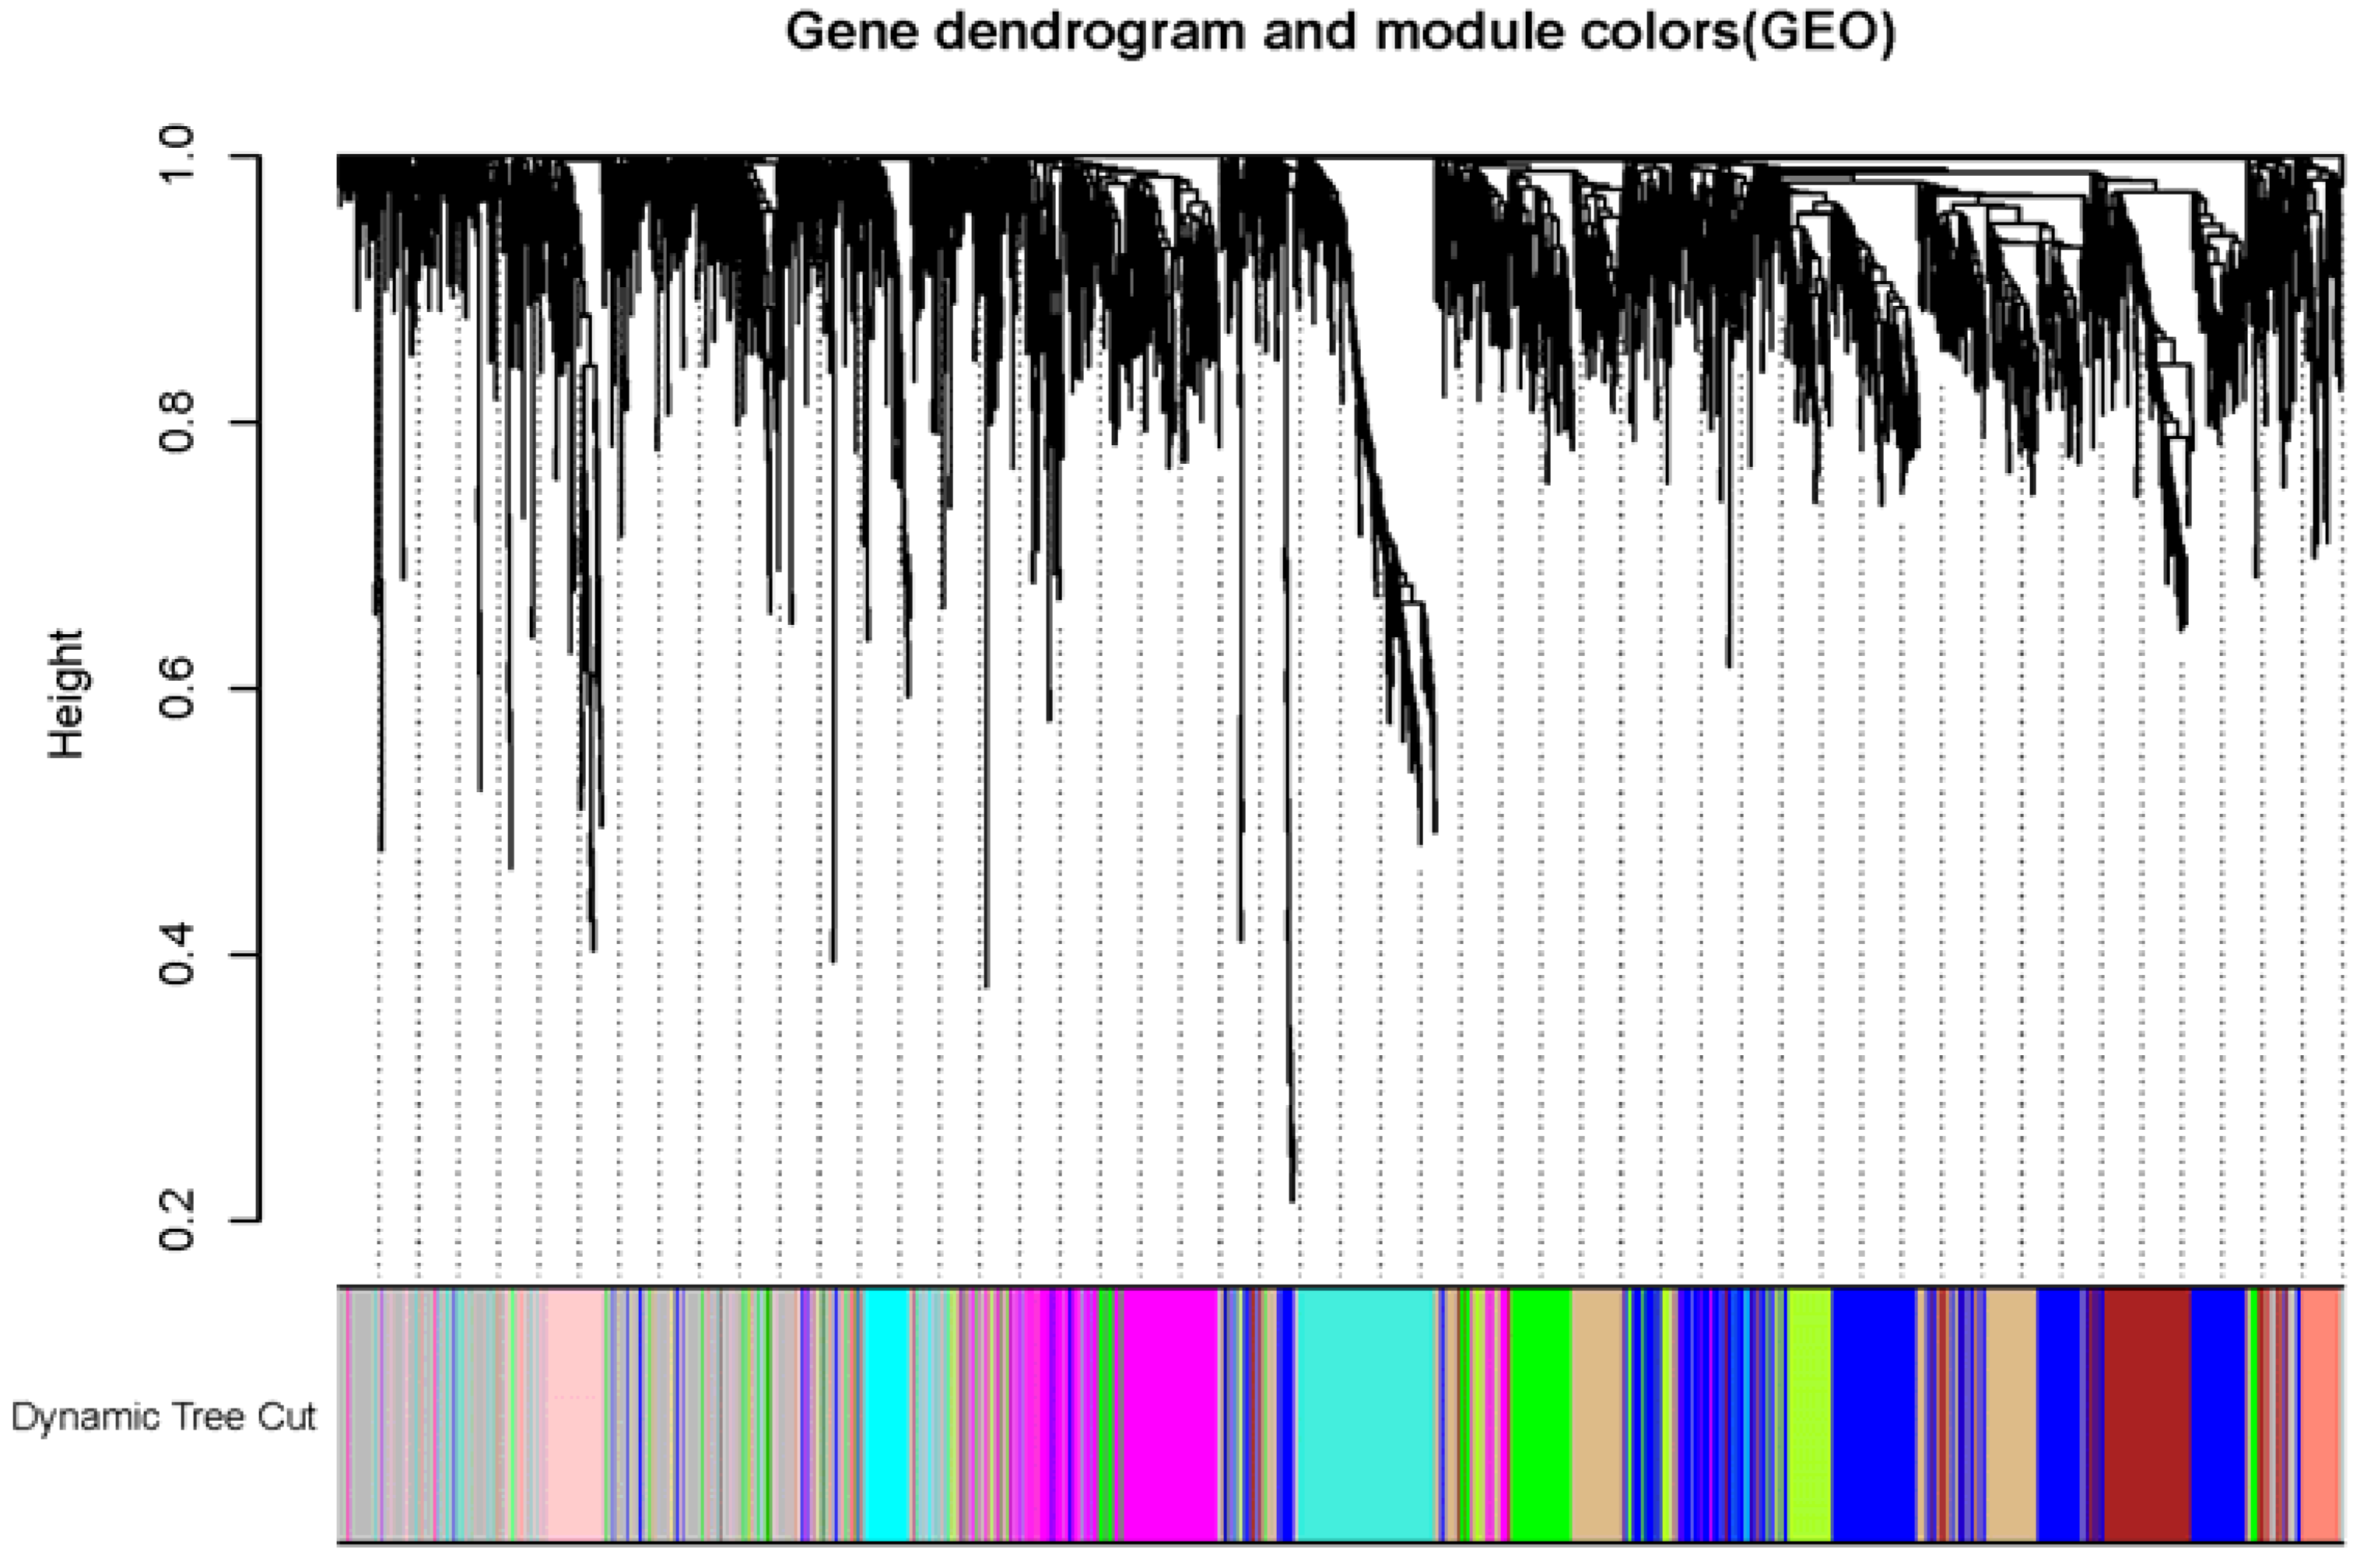
Figure 1. Clustering dendrogram of genes.
Preprints 115023 g001
Figure 2. Heatmap of the correlation between the genes module and clinical features of PAH. Red represents high adjacency (positive correlation). Blue represents low adjacency (negative correlation).
Preprints 115023 g002
Figure 3. The significant KEGG pathways of genes involved in greenyellow module. P<0.05 was defined as the thresholds in selecting significant KEGG pathways.
Preprints 115023 g003
Figure 4. The PPI network of the genes from the greenyellow module. The nodes other than the grey nodes represent the hub genes with the highest prediction scores. The top 10 identified hub genes are showen from red (high degree value) to yellow (low degree value).
Preprints 115023 g004
Disclaimer/Publisher’s Note: The statements, opinions and data contained in all publications are solely those of the individual author(s) and contributor(s) and not of MDPI and/or the editor(s). MDPI and/or the editor(s) disclaim responsibility for any injury to people or property resulting from any ideas, methods, instructions or products referred to in the content.
Copyright: This open access article is published under a Creative Commons CC BY 4.0 license, which permit the free download, distribution, and reuse, provided that the author and preprint are cited in any reuse.
Prerpints.org logo

Preprints.org is a free preprint server supported by MDPI in Basel, Switzerland.

Subscribe

© 2024 MDPI (Basel, Switzerland) unless otherwise stated