Preprint
Review

A Comprehensive Review on Viscoelastic Parameters Used for Engineering Materials Including Soft Materials and the Relationships between Different Damping Parameters

Altmetrics

Downloads

127

Views

109

Comments

0

A peer-reviewed article of this preprint also exists.

This version is not peer-reviewed

Submitted:

13 August 2024

Posted:

14 August 2024

You are already at the latest version

Alerts
Abstract
The physical properties of a structure such stiffness although can be determined by some statical tests, the identification of damping parameter requires a dynamic test. In general, both theoretical prediction and experimental identification of damping are quite difficult. There are many different techniques available for damping identification, and each method gives a different damping parameter. The dynamic indentation method, rheometry, atomic force microscopy, and resonant vibration tests are commonly used to identify the damping of materials, including soft materials. While the viscous damping ratio, loss factor, complex modulus and viscosity are quite common to describe damping of materials, there are also other parameters such as the specific damping capacity, loss angle, half-power bandwidth, and logarithmic decrement to describe damping of various materials. Often one of these parameters is measured in practical applications and the measured damping parameter needs to be converted into another damping parameter for comparison purposes. In this review, the theoretical derivations of different parameters for the description and quantification of damping and their relationships, and the methods for damping identification are presented. The expressions for both high damping and low damping are included and evaluated. This paper could be a primary resource for damping research and teaching.
Keywords: 
Subject: Engineering  -   Bioengineering

1. Introduction

Soft materials exhibit both viscous (damping) and elastic (stiffness) characteristics [1,2,3,4]. Quantification of the viscoelastic properties of soft materials is essential in numerous science and engineering applications [5,6,7,8,9,10,11,12]. Furthermore, next to elasticity, damping (or viscosity) could be an additional, relevant, diagnostic biomarker, and viscosity could enhance the current diagnosis in quantitative elastography [13,14,15,16,17,18,19,20,21,22]. Briefly, damping is the removal of energy from a system, and the energy can be either dissipated within the system or transmitted away by radiation [23]. It should be remembered that material damping is the energy dissipation due to deformation in a medium, and radiation damping is the energy transfer to a surrounding medium [23,24]. In addition, the energy in a system can be dissipated, for example, via the friction between different parts in the system and air resistance [25]. The properties of a structure such as mass and stiffness can be determined by preforming some static tests. However, identifying the damping of a structure or system requires a dynamic test [26]. In general, both theoretical modelling and experimental identification of damping is quite difficult [24,27,28,29]. There are many research papers on determining the damping of materials, including biomaterials (e.g., [30,31,32,33,34,35,36,37]). The literature survey shows that there are different techniques for the identification of damping (e.g., dynamic indentation method, logarithmic decrement method, rheometry), and each method gives a different damping parameter, such as loss factor, loss modulus and viscous damping ratio [23,26,38,39,40,41,42,43]. The identification of the damping of conventional materials (such as ceramics and metals) is quite straightforward, and loss factor or viscous damping ratio is commonly used to quantify their damping [44]. On the other hand, the identification of the damping of soft materials (e.g., agar, gelatine and collagen phantoms and tissue) is challenging, and different damping parameters such as loss modulus, loss angle, viscous damping ratio, or viscosity are used to describe their damping [30,34,36,45,46].
Regarding the identification of the damping of materials, Nayar et al. [30] used the dynamic indentation method to determine the storage and loss moduli of some samples of agar which is a representative material for biological tissues. Similarly, using the dynamic indentation method, Vriend et al. [47] determined the viscoelastic properties of some elastomeric materials and Boyer et al. [48] assessed the stiffness and damping of skin. Dakhil et al. [31] identified the storage and loss moduli of cells using a rheometer. Peng et al. [32] determined the dilute solution viscosities of some cellulose nanocrystal dispersions using a capillary viscometer. Wang et al. [33] identified the viscous damping ratios of some beam-like hydrogel samples via resonant vibration tests. Esmaeel et al. [36] determined the viscous damping coefficient of soft tissue by calculating the dissipated energy per cycle of harmonic motion by the material and the maximum stored energy in the sample using the displacement-force curve. Rosicka et al. [49] identified the biomechanical and viscoelastic properties of skin, including the logarithmic decrement values. Based on the mathematical models for the dynamic response of a microbubble located at the soft medium interface [50,51,52], Bezer et al. [34] determined the shear modulus and viscosity of a tissue-mimicking gelatine phantom by matching the experimentally measured and predicted responses of the microbubble located at the soft medium interface exposed to ultrasound. Similarly, using the mathematical models for the dynamic response of a sphere located at the soft medium interface [53,54,55], the shear modulus and viscous damping ratio of tissue-mimicking gelatine phantoms were identified by matching the experimentally measured and predicted responses of the sphere located at the soft medium interface [37,56,57].
Li et al. [58] presented the viscoelasticity imaging of biological tissues and single cells using shear wave propagation, including examples of ultrasound shear wave viscoelasticity imaging applications. Beuve et al. [59] investigated the diffuse shear wave spectroscopy for the characterisation of the viscoelastic properties (shear modulus and viscosity) of soft tissue. Tecse et al. [60] developed and validated a method for the characterisation of the viscoelastic properties of soft tissue using ultrasound elastography. Wang et al. [61] investigated the effect of damping on ultrasound elastography algorithms. Koruk and Pouliopoulos [62] presented the elasticity and viscoelasticity imaging based on the use of small particles located within the tissue and at the tissue interface exposed to static and dynamic external forces. Hirsch et al. [45] measured the shear modulus and loss angle of liver and spleen using magnetic resonance elastography. Wang et al. [63] derived the shear wave speed and loss angle for depicting hepatic fibrosis and inflammation in chronic viral hepatitis using magnetic resonance elastography.
Overall, the literature review shows that the dynamic indentation method [30], rheometry and viscometry [31,32,64], atomic force microscopy [65], hysteresis loop [36], resonant vibration tests or experimental modal analysis [33,66], and logarithmic decrement [49,67] are commonly used to identify the damping of materials, including soft materials. In addition, a bubble or sphere placed inside the soft medium or located at the soft medium interface exposed to an external excitation such as acoustic radiation force or magnetic force has been recently used to identify the viscoelastic properties of soft materials [34,37,68,69,70,71,72]. The ultrasound elastography [17,73,74,75], and magnetic resonance elastography [76,77,78,79] for determining tissue mechanical properties are quite common for the preclinical and clinical applications. It is seen that there are many parameters for the description and quantification of damping. The viscous damping ratio, loss factor, complex modulus (or storage and loss moduli), and viscosity are quite common to describe the damping of materials. In addition, some other parameters such as the specific damping capacity, phase lag or loss angle, half-power bandwidth, logarithmic decrement, and inverse quality factor are used to describe the damping of various materials. Often one of these parameters (e.g., loss factor) is measured in practical applications, and for comparison purposes the measured damping parameter needs to be converted into some other damping parameters (e.g., to viscosity). However, there is a limited number of studies that evaluated only few different damping parameters and presented their relationships [38,80]. Therefore, there is a need for a comprehensive study that presents the theoretical derivations of different damping parameters and their relationships.
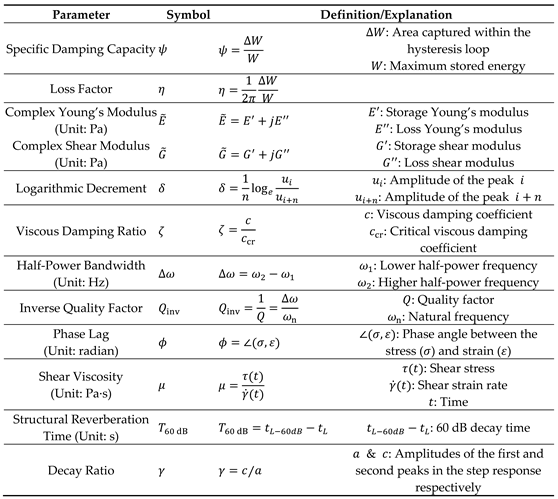
This paper presents theoretical derivations of different parameters for the description and quantification of damping and their relationships, as well as the methods for damping identification. In this paper, the expressions for both high damping (i.e., accurate formulas) and low damping (i.e., approximate formulas) are presented and these approaches are evaluated. The structure of this paper is as follows. First, the elastic, viscous and viscoelastic materials are defined, and then the responses of single-degree-of-freedom (SDOF) systems with a viscous damper and a complex stiffness are presented in Section 2. By exploiting the theoretical background presented in Section 2, the theoretical derivations of different damping parameters and their relationships are presented in Section 3. It should be noted that the MATLAB software (MathWorks, Natick, MA, USA) was used to present the relationship between different parameters whenever needed. The damping parameters investigated in this paper include the specific damping capacity, loss factor, viscous damping coefficient, viscous damping ratio, phase lag (or loss angle), logarithmic decrement, half-power bandwidth, complex modulus (or loss and storage moduli), inverse quality factor, viscosity, decay ratio in the step response, and structural reverberation time. The relationships between different damping parameters are summarised in Section 4, and some sample damping identification applications of biomaterials using different sensing technologies are presented in Section 5. It is anticipated that many researchers conducting research on damping, from very soft materials to very stiff conventional engineering materials used in different fields, will refer to this study. In addition, the material presented in this study can be exploited for teaching damping or viscoelasticity in various branches. Before the theoretical derivations of different parameters for the description and quantification of damping and their relationships are presented, the definitions of common damping parameters are listed in Table 1 so that the reader can refer to these parameters as needed.

2. Theoretical Background

In the following sections, the elastic, viscous and viscoelastic materials are first defined, and then the responses of SDOF systems with a viscous damper and a complex stiffness are presented. It is worth remembering that, by using the theoretical background presented in this section, different damping parameters are derived, and their relationships are presented in Section 3.

2.1. Elastic, viscous, and viscoelastic materials

Materials are mostly assumed to behave according to the Hooke’s linear elasticity theory under small deformations. In other words, it is assumed that there is a linear relationship between the stress and strain given by:
σ = E ε
where σ , E , and ε are the stress, Young’s modulus, and strain, respectively. It should be noted that the same relation can be written between the shear stress and strain as τ = G γ where τ , G , and γ are the shear stress, shear modulus, and shear strain, respectively. In this article, the expressions are written mostly using the normal strain, the normal stress, and the Young’s modulus. However, it should be kept in mind that similar expressions can be written using the shear strain, shear stress, and shear modulus. It should be noted that the materials described by Equation (1) are called elastic materials. For a so-called purely elastic material, all the energy stored in the sample during loading is returned when the load is removed. Engineering materials such as aluminium and steel can be conveniently assumed as elastic materials.
Opposite to an elastic material, a so-called purely viscous material does not store energy. For a purely viscous material, there is no elastic component, and all the energy is dissipated as pure damping once the load is removed. For these materials, the stress is proportional to the strain rate given by:
σ = μ d ε d t
where μ is the viscosity, and ε ˙ = d ε d t is known as the strain rate. Liquidus materials such as glycerine, oil and honey can be considered as viscous materials.
The so-called viscoelastic materials show both elastic and viscous behaviour, therefore they exhibit time-dependent strain [81,82]. For viscoelastic materials, some of the energy stored in the system can be recovered upon the removal of the load, and the remaining energy is dissipated in the form of heat. There are different mathematical models such as the Kelvin-Voigt, Maxwell, and standard linear solid models for the viscoelastic materials where springs and dampers are arranged in series and/or parallel to determine their stress and strain relationships [81,83,84,85,86]. For example, for the Kelvin-Voigt model represented by a purely viscous damper and purely elastic spring connected in parallel, the stress, strain, and strain rate with respect to time are governed by [87]:
σ t = E ε t + μ d ε t d t
Tissue-mimicking materials such as hydrogels and biological structures such as tissue and skin show viscoelastic behaviour.
The cyclic stress-strain versus time for the classic elastic, viscous, and viscoelastic materials are shown in Figure 1. The stress and strain curves for the elastic materials move completely in phase as seen in Figure 1a, while there is π⁄2 radian or 90° phase difference between the stress and strain for the viscous materials as seen in Figure 1b [88]. On the other hand, with the cyclic stress at frequency ω , there is a phase ϕ between the stress and strain for the viscoelastic materials, where ϕ is between 0 and π⁄2 (Figure 1c). It is noted that ε 0 and σ 0 show the strain and stress amplitudes, respectively. The term ϕ is also called phase shift or loss angle. It should be noted that the loss angle is a measure of material’s damping.
Various formulations for the response of a SDOF system are given in Section 2.2, Section 2.3 and Section 2.4. By exploiting the theoretical background presented in Section 2.2, Section 2.3 and Section 2.4, the theoretical derivations of different damping parameters and their relationships are presented in Section 3.

2.2. Viscously damped SDOF system exposed to harmonic excitation

2.2.1. Steady-state response of a spring-damper system

The equation of motion for a viscously damped SDOF system with damping coefficient, c and spring coefficient, k without any inertia (i.e., m = 0 ) exposed to a harmonic excitation f t = F 0 s i n ω t shown in Figure 2a can be written as follows:
c u ˙ + k u = F 0 s i n ω t
where F 0 is the amplitude of the applied force, u and u ˙ show the displacement and velocity, respectively, and ω = 2 π f is the angular or circular frequency in rad/s, and f is the linear frequency in 1/s or Hz. The steady-state solution for this system can be written as follows [38]:
u ( t ) = B s i n ω t ϕ
where B is the amplitude of the steady-state response, and ϕ is the phase angle by which the response lags the excitation given by:
B = F 0 k 1 + c ω k 2 = F 0 k 1 + t a n 2 ϕ
ϕ = t a n 1 c ω k
It is seen that the phase angle is a function of the material properties (i.e., c and k ) and the frequency ( ω ) for a viscously damped system.

2.2.2. Free vibrations of a mass-spring-damper system

The equation of motion for a viscously damped SDOF system with damping coefficient c , mass m and spring coefficient k without any external force (i.e., f t = 0 ) shown in Figure 2a can be written as follows:
m u ¨ + c u ˙ + k u = 0
where u , u ˙ and u ¨ are the displacement, velocity, and acceleration of the mass. Dividing Equation (8) by the mass yields:
u ¨ + 2 ζ ω n u ˙ + ω n 2 u = 0
where ω n = k / m is the undamped natural frequency, and ζ = c c c r = c 2 k m is the viscous damping ratio [89]. Here, c c r is called the critical damping coefficient. For oscillatory motion ( ζ < 1 ) and imposed initial displacement u 0 and velocity u ˙ 0 , the solution of Equation (9) can be determined to be as follows [90]:
u t = A e ζ ω n t s i n ω d t + θ
where A and θ are the coefficients to be determined from the initial conditions, and ω d = ω n 1 ζ 2 is the damped natural frequency.

2.2.3. Forced vibrations of a mass-spring-damper system

The equation of motion for a viscously damped SDOF system subjected to a harmonic excitation f t = F 0 c o s ω t shown in Figure 2a can be written as follows [91]:
m u ¨ + c u ˙ + k u = F 0 c o s ω t
Dividing Equation (11) by the mass yields:
u ¨ + 2 ζ ω n u ˙ + ω n 2 u = F 0 m c o s ω t
For oscillatory motion ( ζ < 1 ), the solution of Equation (12) can be determined to be the summation of the homogenous solution u h t and particular u p t solution as follows [26]:
u t = A e ζ ω n t s i n ω d t + θ + B c o s ω t φ
where A and θ are the coefficients to be determined from the initial conditions, and B and φ are the coefficients of the particular solution given by:
B = F 0 / m ω n 2 ω 2 2 + 2 ζ ω n ω 2
φ = t a n 1 2 ζ ω n ω ω n 2 ω 2
The equations above can be further arranged as follows:
C = B F 0 / k = 1 1 r 2 2 + 2 ζ r 2
φ = t a n 1 2 ζ r 1 r 2
where r = ω / ω n is the frequency ratio. Here, φ is the phase lag of the displacement of the mass with respect to the force applied to the mass. It should be remembered that ϕ is the phase lag of the strain with respect to the stress in the material. As presented later, the phase lag of the strain with respect to the stress in the material is ϕ = t a n 1 2 ζ ω n ω = t a n 1 2 ζ r for a viscously damped system. It should be noted that for the quasistatic loading (i.e., r = ω / ω n 1 ), the solution for the forced vibrations of mass-spring-damper system reduces to that of the system without inertia, hence we have φ ϕ for the quasi-static loading.

2.3. Viscously damped SDOF system exposed to step excitation

The equation of motion for a viscously damped SDOF system subjected to a step excitation f t = F 0 for t 0 shown in Figure 2a can be written as follows:
m u ¨ + c u ˙ + k u = F 0   for   t 0
The response of an underdamped system ( ζ < 1 ) exposed to step excitation can be shown to be as follows [55]:
u t = F 0 k F 0 k 1 ζ 2 e ζ ω n t c o s ω d t θ
where
θ = t a n 1 ζ 1 ζ 2

2.4. SDOF system with complex stiffness exposed to harmonic excitation

2.4.1. Steady-state response of a complex spring system

The equation of motion for a complex spring having real and imaginary components k ~ = k ' + j k ' ' without any inertia (i.e., m = 0 ) exposed to a harmonic excitation f t = F 0 s i n ω t shown in Figure 2b can be written as follows:
k ~ u = k + j k u = F 0 s i n ω t
where j = 1 . The steady-state solution for this system can be shown to be as follows [38]:
u ( t ) = B s i n ω t ϕ
where
B = F 0 k 1 + k k 2 = F 0 k 1 + t a n 2 ϕ
ϕ = t a n 1 k k
It is worth remembering that the spring with complex stiffness property is restrained from one end and forced from the other end (see Figure 2b). It is seen that, opposite to the viscously damped system in which the phase angle is a function of the material properties (i.e., c and k ) and the frequency ( ω ), the phase angle is only a function of the material properties for the complex spring system (i.e., k ' and k ' ' ). However, the material properties can be dependent on the frequency.

2.4.2. Steady-state response of a mass-complex spring system

The equation of motion for a SDOF system with complex stiffness subjected to harmonic excitation f t = F 0 e j ω t shown in Figure 2b can be written as follows:
m u ¨ + k + j k u = F 0 e j ω t
It is common to write k ~ = k ' + j k ' ' = k + j η k = k 1 + j η where η is known as loss factor. Assuming the form of the solution to be as B ~ e j ω t , and substituting this into the equation above, the following expression will be produced:
m ω 2 + k 1 + j η B ~ = F 0
By performing some operations, the equation above can be written as follows:
B ~ = F 0 / m ω n 2 ω 2 + j η ω n 2
Hence, the amplitude of oscillations and the phase between the displacement of the mass with respect to the force applied to the mass can be written as follows [92]:
B ~ = F 0 / m ω n 2 ω 2 2 + η ω n 2 2
φ = t a n 1 η 1 ω / ω n 2
The equations above can be further arranged as follows:
C ~ = B ~ F 0 / k = 1 1 r 2 2 + j η 2
φ = t a n 1 η 1 r 2
It is again worth remembering that φ is the phase lag of the displacement of the mass with respect to the force applied to the mass, while ϕ is the phase lag of the strain with respect to the stress in the material. As presented later, the phase lag of the strain with respect to the stress in the material is ϕ = t a n 1 η for a SDOF system with complex stiffness. As stated before, using the theoretical background presented in Section 2, different damping parameters are derived, and their relationships are presented in Section 3.

3. Theoretical Derivations of Different Damping Parameters and Their Relationships

Many techniques are available for the identification of the damping of structures using experimental data. For example, the logarithmic decrement and step-response techniques are time-domain decay-rate methods; the half-power bandwidth, circle-fit and line-fit methods are frequency-domain modal analysis curve-fitting methods; the hysteresis loop or power input method is an energy-based technique [90]. Each method gives a different damping parameter (loss factor, viscous damping ratio, etc.). The theoretical derivations of different damping parameters and their relationships, and damping identification methods are presented in the following sections.

3.1. Hysteresis loop and specific damping capacity

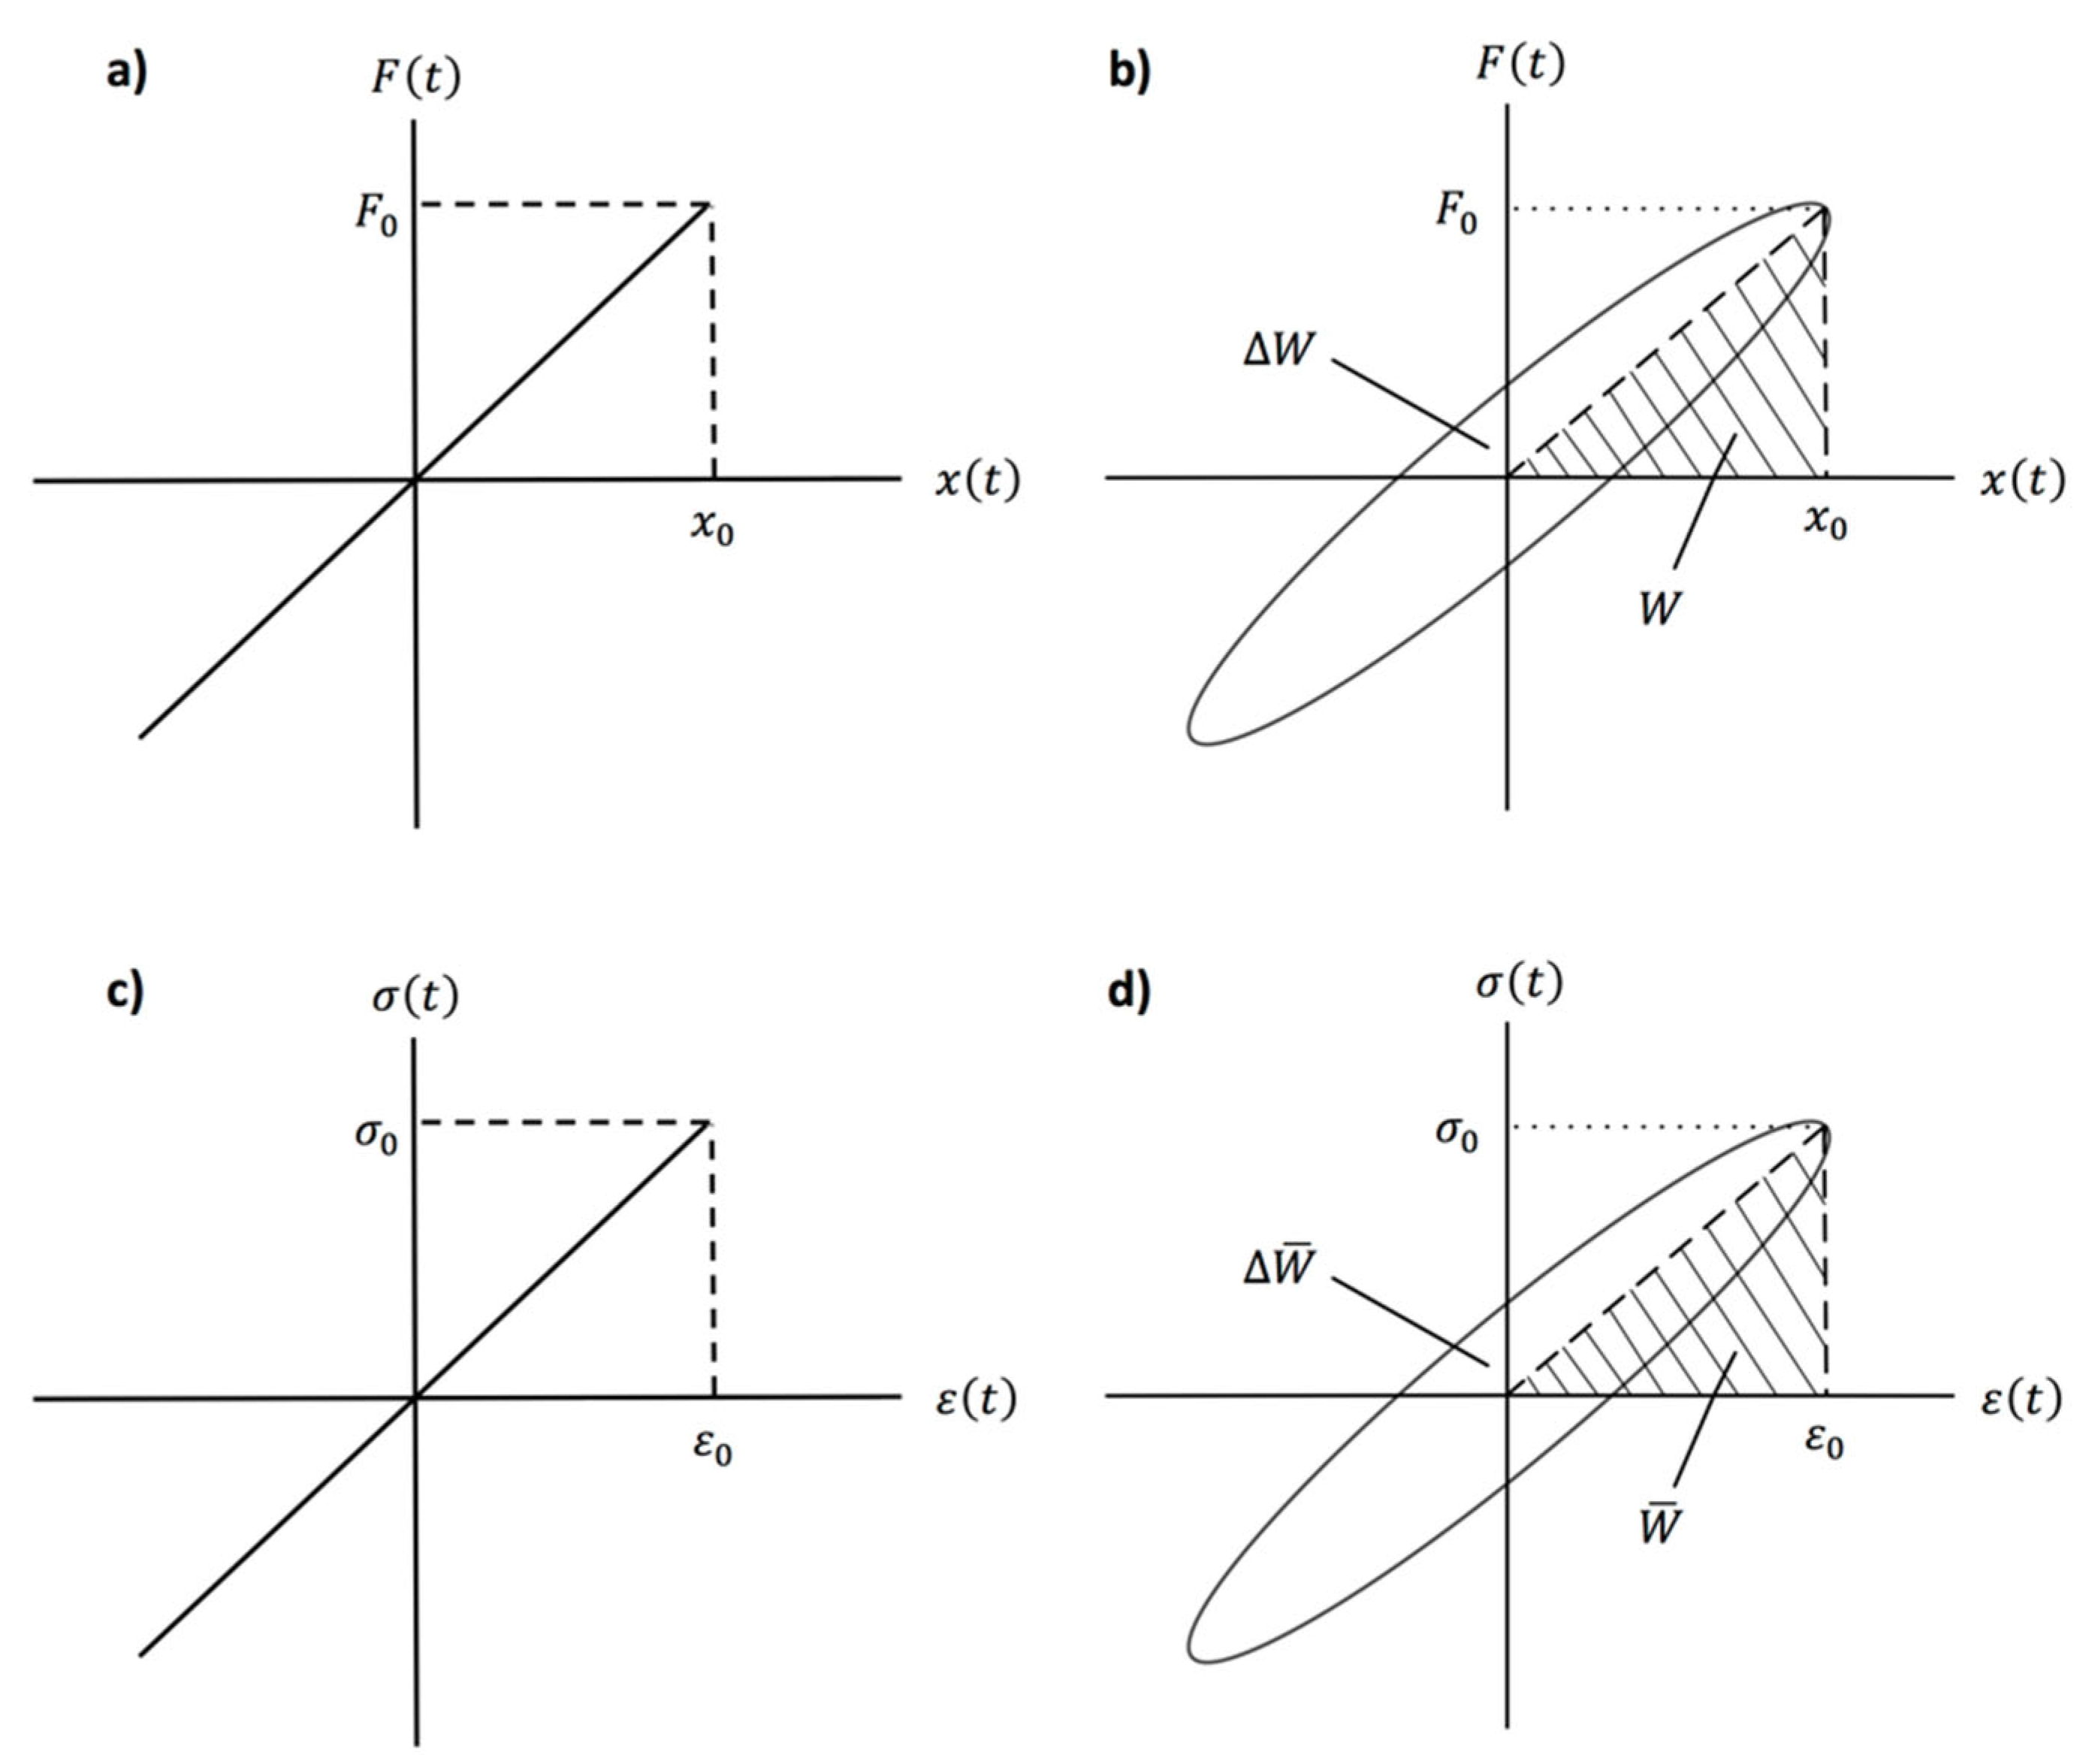
The force-displacement and the stress-strain relationship for a purely elastic material given in Equation (1) are simply illustrated in Figure 3a,c. As seen, the stress-strain (or force-displacement) curve of a purely elastic material is a straight line. For a viscoelastic material under the cyclic loading at constant frequency ω , and for the stress amplitude σ 0 (see Figure 1), the stress can be written as follows:
σ t = σ 0 e j ω t
The induced strain for the viscoelastic material can be expressed as follows:
ε t = ε 0 e j ω t ϕ
where ε 0 is the strain amplitude, and as stated before, ϕ is the phase between the stress and strain. For a viscoelastic material, the input force versus the induced displacement, and the input stress σ t versus the induced strain ε t for one cycle of motion is plotted in Figures 3b,d. The elliptical shape shown in Figures 3b,d is known as the hysteresis loop [93,94]. The area captured within the hysteresis loop, W , equals the dissipated energy per cycle of harmonic motion by the material, and W represents the maximum stored energy [88]. Similarly, W ¯ is the energy dissipated per unit volume of the sample during one cycle, and W ¯ is the maximum stored energy per unit volume. It should be noted that W = 0 for a purely elastic material (or spring), while W > for a viscoelastic material, and it is proportional to the area bounded by the hysteretic curve. Overall, by harmonically loading a sample in one direction, the hysteresis loop for the sample can be obtained. The specific damping capacity which is defined as the ratio of the mechanical energy dissipated during one cycle to the maximum potential (strain) energy of the sample can be calculated using [44]:
ψ = W W
or
ψ = W ¯ W ¯
Remembering that the energy dissipated per unit volume of the sample is W ¯ = σ d ε , and the maximum energy per unit volume is W ¯ = 1 2 σ 0 ε 0 , the expression above can be written as:
ψ = σ d ε 1 2 σ 0 ε 0
Furthermore, as we can write σ 0 = E ε 0 , the following expression can be written:
ψ = σ d ε 1 2 E ε 0 2
It should be noted that the hysteresis loop method or the power input method is quite effective for determining the frequency-averaged damping of a structure under steady-state vibration.

3.2. Hysteresis loop and loss factor

For reasonable levels of damping, the relationship between the structural (or material) damping ratio and associated energy components shown in Figures 3b,d is given by the following equation [88,95]:
η = 1 2 π W W
or
η = 1 2 π W ¯ W ¯
where η is known as loss factor. Furthermore, using W ¯ = σ d ε , W ¯ = 1 2 σ 0 ε 0 and σ 0 = E ε 0 in Equation (39) produces the following expression:
η = σ d ε π σ 0 ε 0
Or
η = σ d ε π E ε 0 2
It is worth reminding that the loss factor is so commonly used to define and quantify the damping of structures in practical applications.

3.3. Specific damping capacity and loss factor

By substituting Equation (34) into Equation (38), the relationship between the specific damping capacity and loss factor can be easily obtained to be as follows [96]:
η = ψ 2 π

3.4. Dissipated energy and viscous damping coefficient

For a viscous damper subjected to a harmonic force, the dissipated energy per cycle can be written as follows:
W = c x ˙ d x
where c is the viscous damping coefficient. Since d x = x ˙ d t , x ( t ) = B s i n ω t , and hence x ˙ ( t ) = B ω c o s ω t , the expression for the dissipated energy per cycle of harmonic motion by the material becomes:
W = c B 2 ω 2 c o s 2 ω t d t
where B is the displacement amplitude. Hence, the integration for the whole cycle produces [36]:
W = π c B 2 ω
or
W = 2 π 2 c B 2 f
Here, f is the frequency in Hz, and ω = 2 π f is the frequency in rad/s, as stated before. After all, the viscous damping coefficient can be found using the dissipated energy per cycle of harmonic motion as:
c = W π B 2 ω = W 2 π 2 B 2 f

3.5. Complex modulus and loss factor

The Young’s modulus or shear modulus of a viscoelastic material can be represented by a complex (or dynamic) quantity, having both the storage and dissipative energy components. In order to derive the complex modulus, now, let’s write the stress and strain as complex quantities as follows:
σ t = σ 0 e j ω t = σ 0 c o s ω t + j s i n ω t
ε t = ε 0 e j ω t ϕ = ε 0 c o s ω t ϕ + j s i n ω t ϕ
where σ 0 and ε 0 are the stress and strain amplitudes, respectively. Hence, the complex Young’s modulus E ~ of the material can be written as follows:
E ~ = σ 0 e j ω t ε 0 e j ω t ϕ = σ 0 ε 0 c o s ϕ + j σ 0 ε 0 s i n ϕ = E + j E
where E ' is the storage Young’s modulus, and E is the loss Young’s modulus. The storage Young’s modulus or the real part of the complex Young’s modulus E = σ 0 ε 0 c o s ϕ is related to the elastic behavior of the material, and the loss Young’s modulus or the imaginary part of the complex Young’s modulus E " = σ 0 ε 0 s i n ϕ is related to the viscous behavior of the material (a measure of the energy dissipation ability of the material). When E = 0 , then E takes the place of the ordinary Young’s modulus E . Therefore, it is called the storage Young’s modulus since it measures the material’s ability to store elastic energy. The complex Young’s modulus can be written as follows [97]:
E ~ = E 1 + j E E
The energy dissipated during a load cycle can be written as W ¯ = π E ε 0 2 . Similarly, the maximum elastic energy during the cycle can be written as W ¯ = 1 2 E ε 0 2 . By substituting these into the equation above yields:
E ~ = E 1 + j W 2 π W
As W 2 π W was defined as the loss factor before, the following expression can be written:
E ~ = E 1 + j η
From Equations (51) and (53), it is clear that the relationship between the loss factor and the storage and loss Young’s moduli is as follows:
η = E E
Although the expressions above are written for the Young’s modulus, the similar expressions can be written for shear modulus using G ~ = G + j G where G is the storage shear modulus, and G is the loss shear modulus.

3.6. Logarithmic decrement and viscous damping ratio

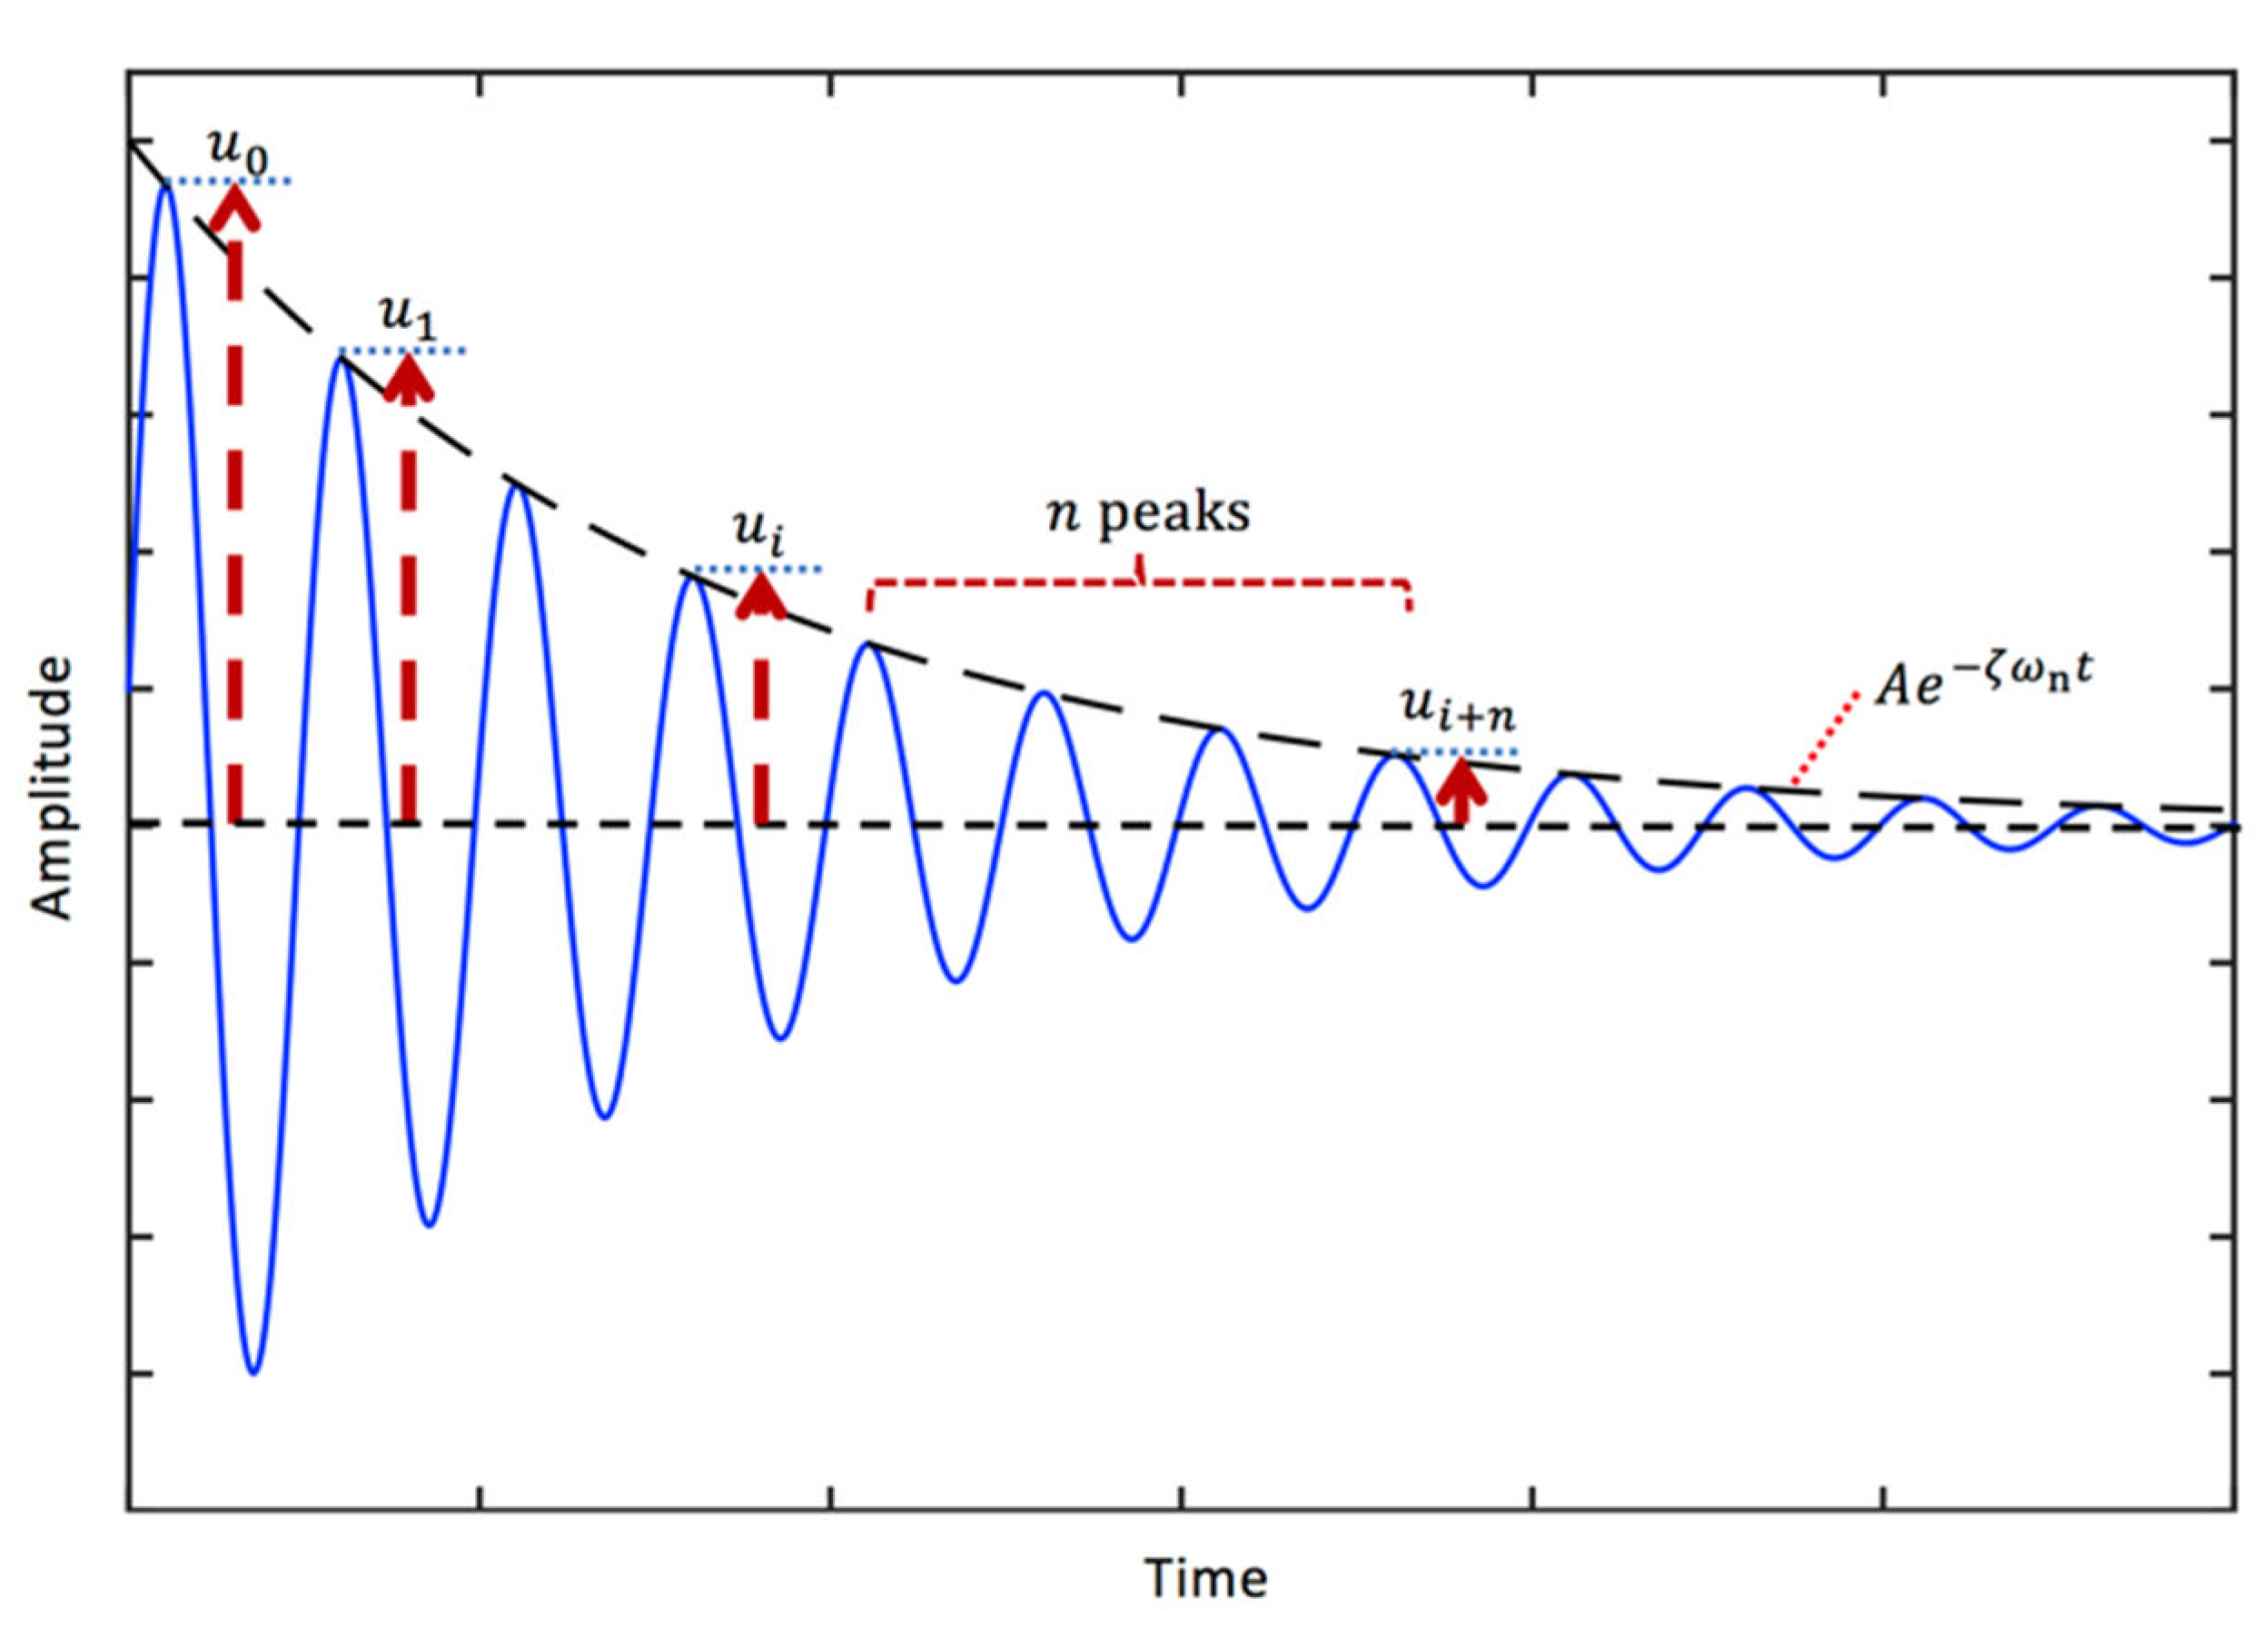
A typical free vibration response of a viscously damped SDOF system given in Equation (10) is illustrated in Figure 4. It should be noted that the decay envelope for the free vibrations is A e ζ ω n t . The logarithmic decrement is defined as the natural logarithm of the ratio of the amplitudes of any two successive peaks given by [67]:
δ = l o g e u 0 u 1 = l o g e u 1 u 2 = l o g e u 2 u 3 = = l o g e u m 1 u m
Using Equations (10) and (55), the following equation that relates the logarithmic decrement and the viscous damping ratio can be obtained [98]:
δ = 1 n l o g e u i u i + n = 2 π ζ 1 ζ 2
where u i is the amplitude of the peak i , and u i + n is the amplitude of the peak i + n . Overall, the viscous damping ratio using the logarithmic decrement can be determined using the following expression:
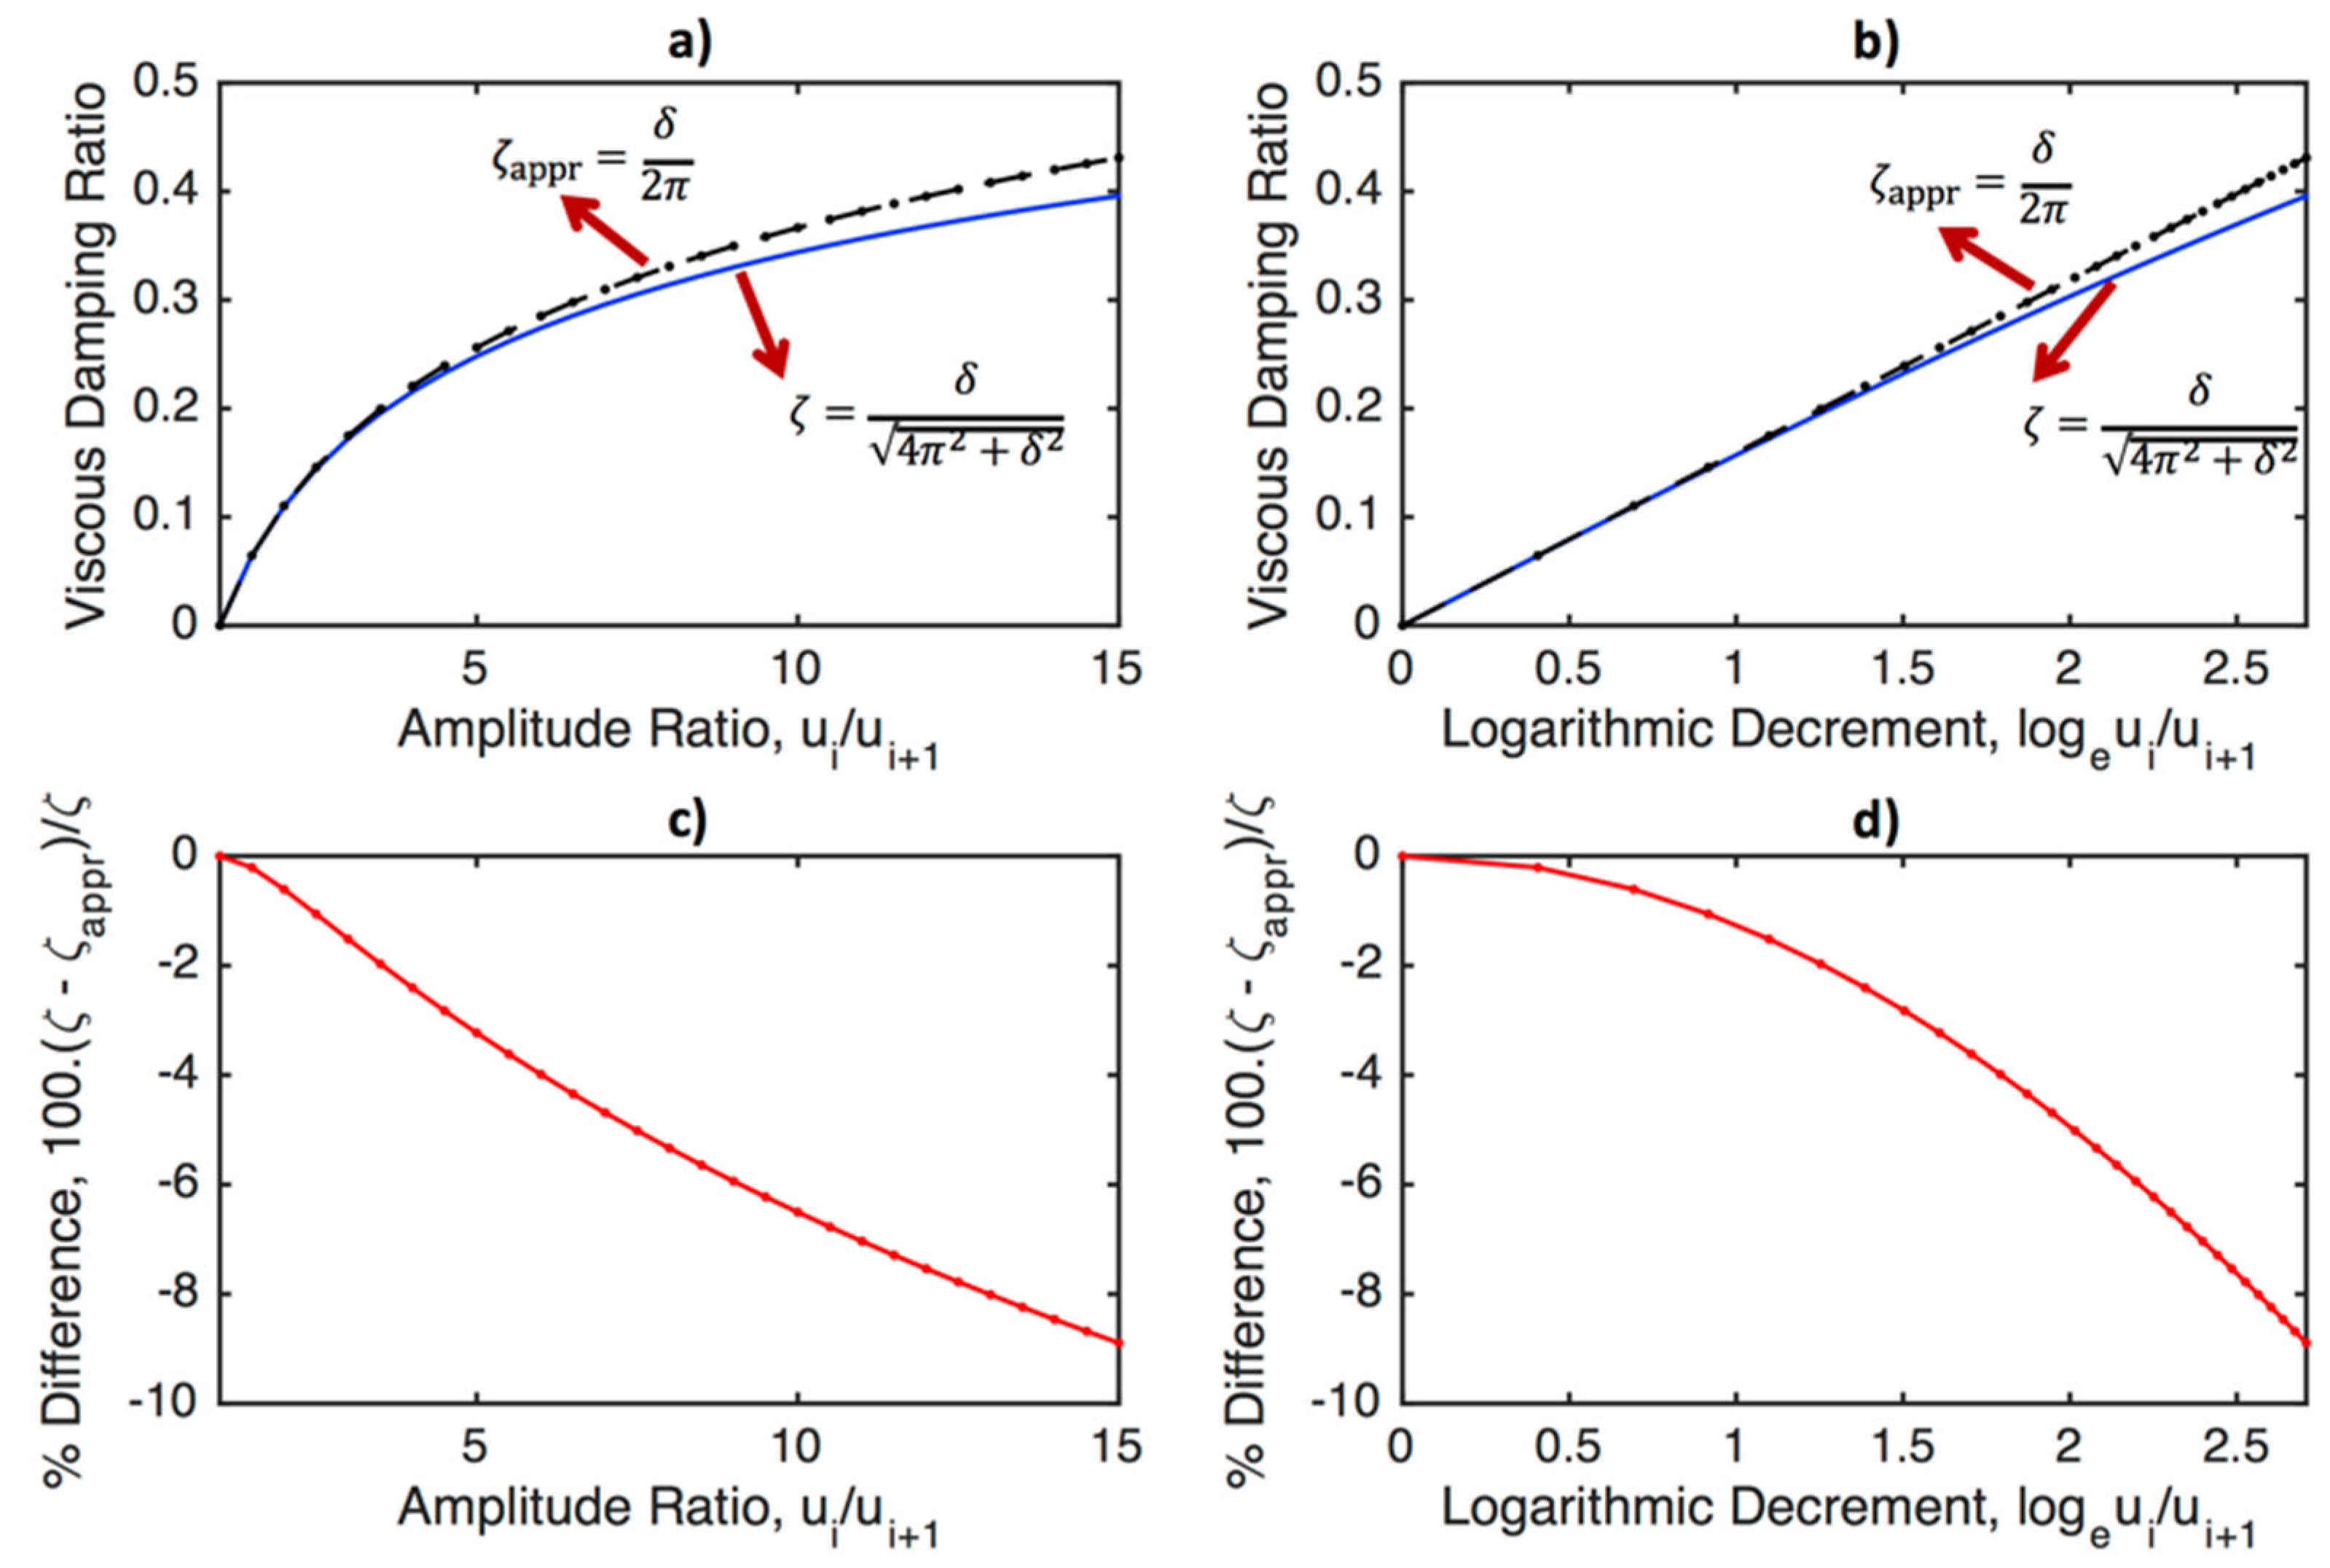
ζ = δ 4 π 2 + δ 2
Since 1 ζ 2 1 for small damping, it is common to define the relationship between the viscous damping ratio and the logarithmic decrement as follows:
ζ a p p r = δ 2 π   for   ζ 1
The logarithmic decrement method is a time-domain identification approach that does not require input measurement, it requires only response measurements. It should be noted that the logarithmic decrement method is effective for damping identification when a single mode of vibration can be isolated from the others.
Figure 5 presents the real viscous damping ratio calculated using Equation (57) and the approximate viscous damping ratio calculated using Equation (58) as a function of the amplitude ratio (Figure 5a), and the logarithmic decrement (Figure 5b), and the percentage difference as a function of the amplitude ratio (Figure 5c), and the logarithmic decrement (Figure 5d). It is seen that the difference is greater than 2% when the amplitude ratio is greater than or equal to 3.5, or when the logarithmic decrement is greater than or equal to 1.25. As the exact formula (i.e., Equation (57)) is still quite simple, the use of Equation (57) is highly recommended when calculating the viscous damping ratio from the logarithmic decrement in practical applications.

3.7. Half-power bandwidth and viscous damping ratio

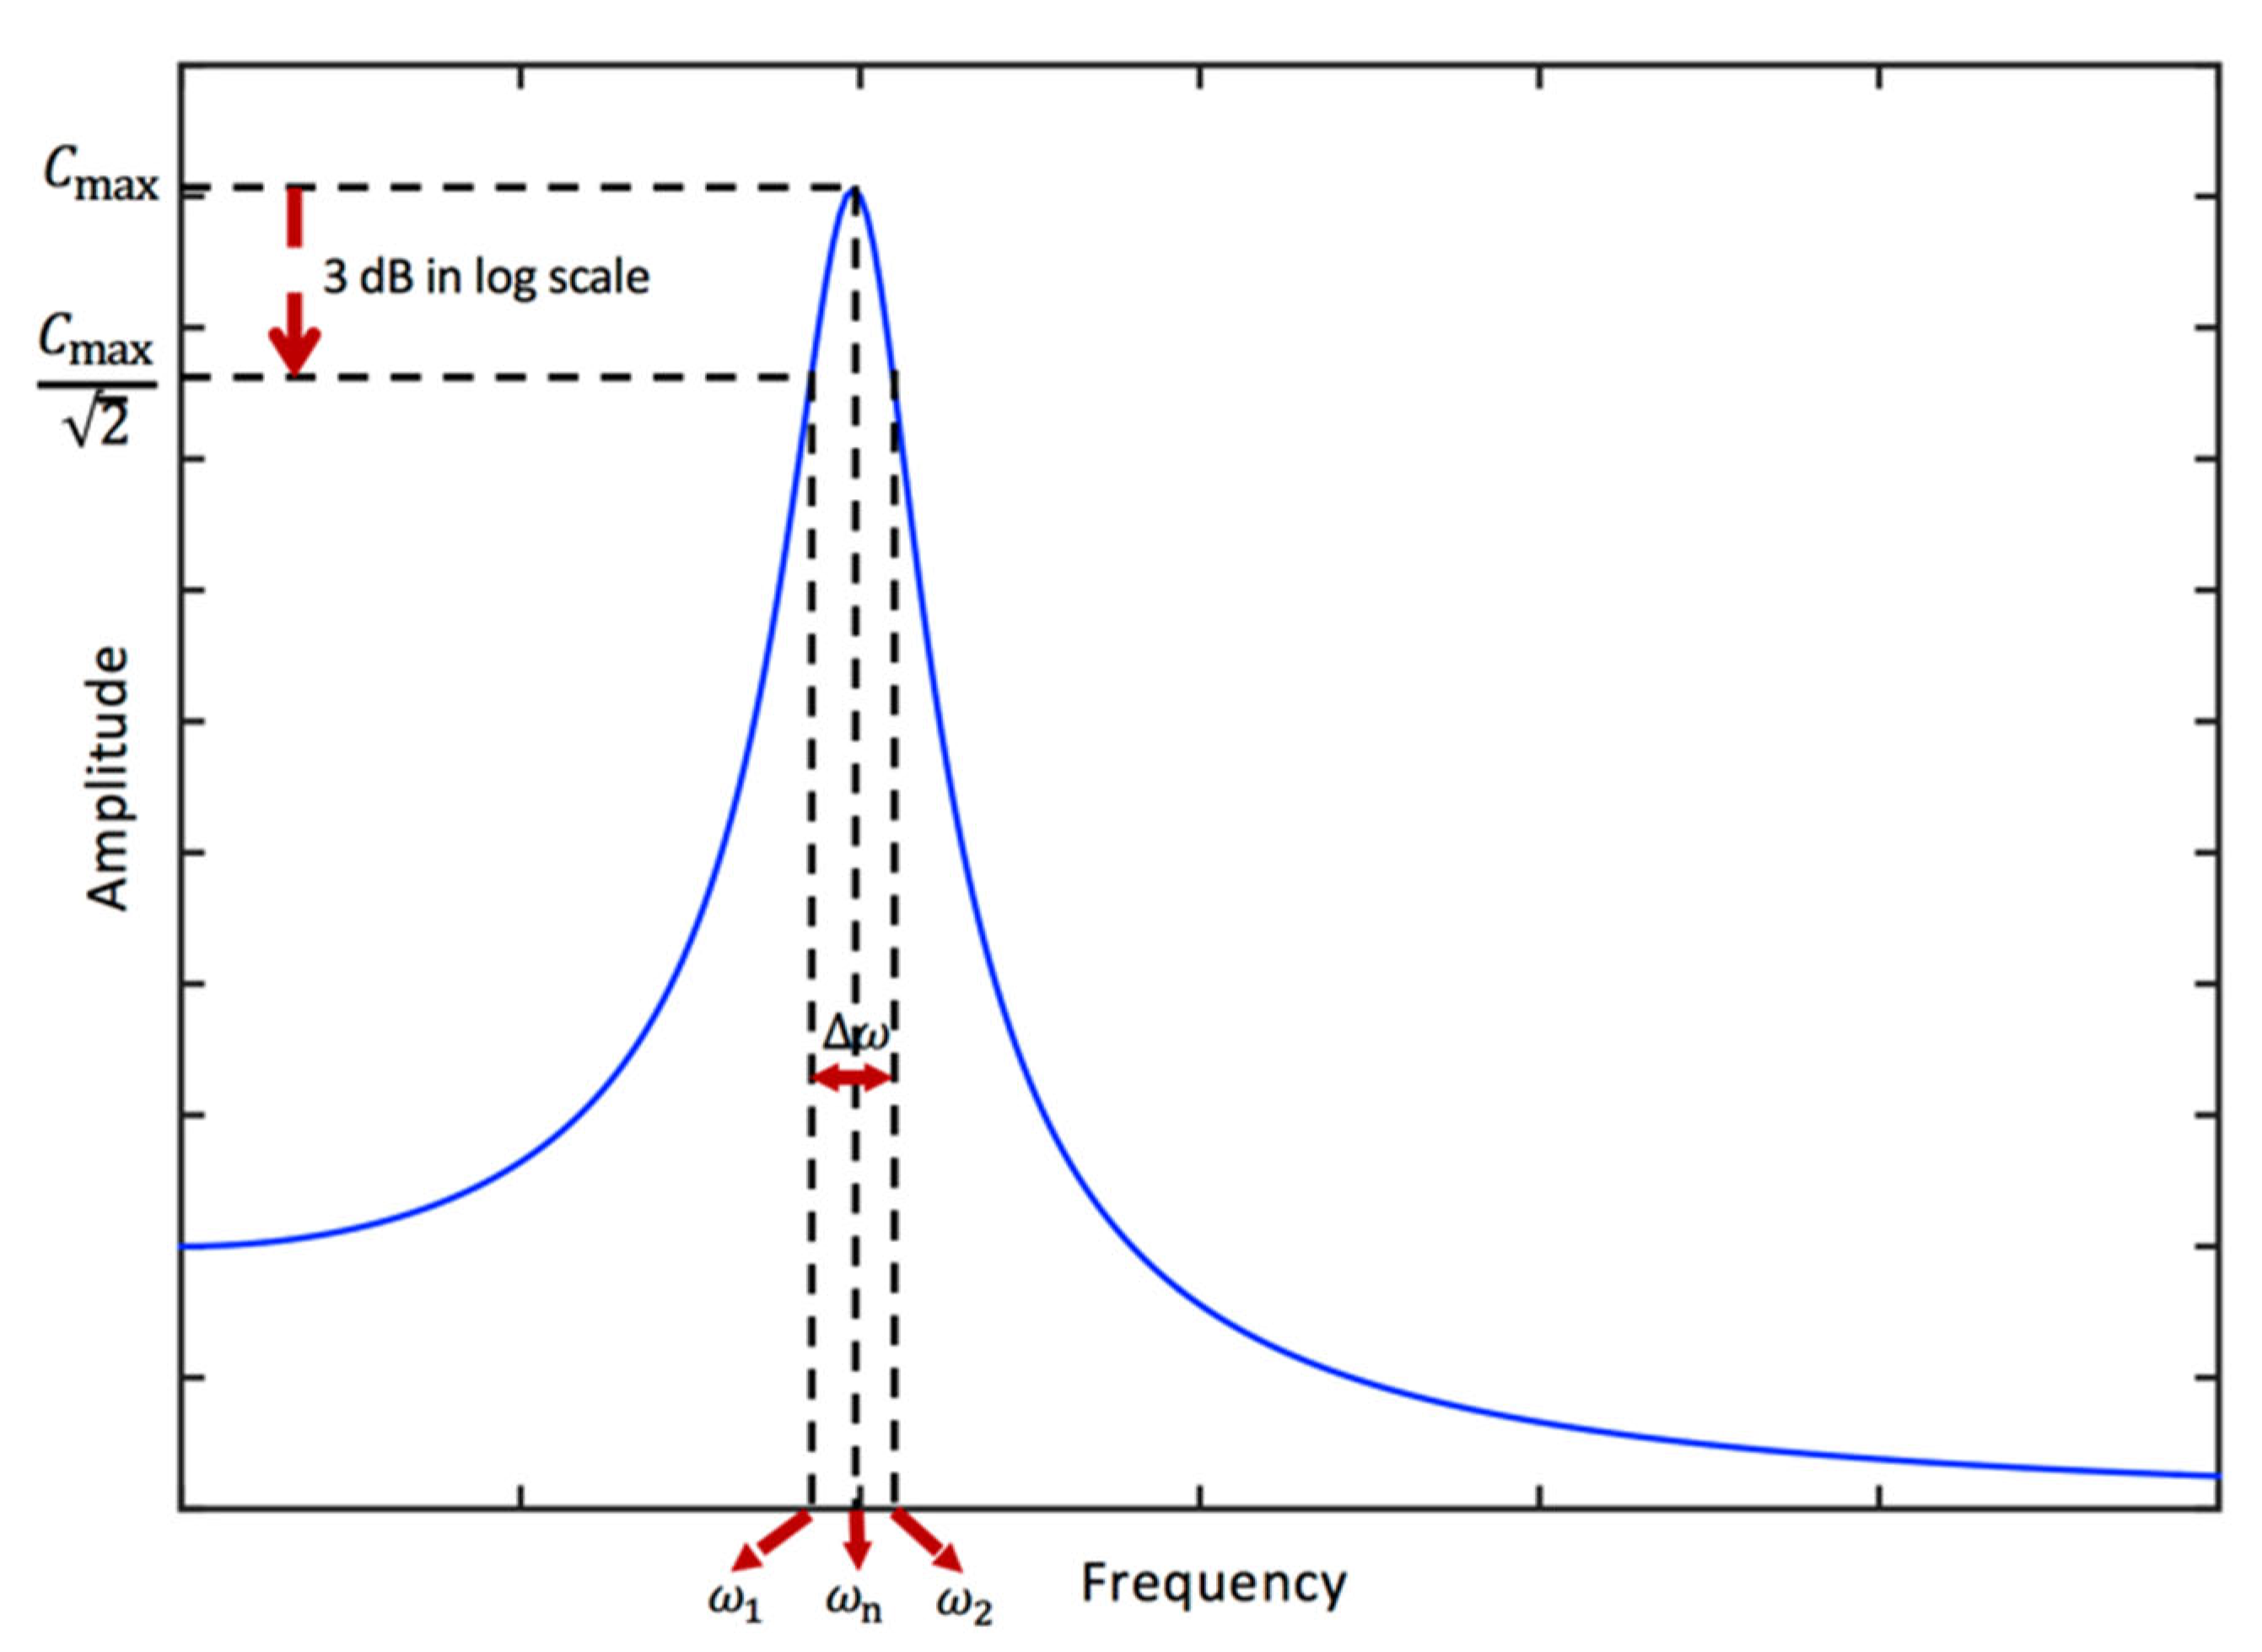
For a viscously damped SDOF system subjected to a harmonic excitation, the contribution of the homogenous (or transient) solution (i.e., the response due to the initial conditions) is diminished for large values of t [26], hence we have only the particular solution (i.e., the response due to the applied force) at the steady state (see Equation (13)). As the power is proportional to the square of the amplitude of oscillations, the half-power response level corresponds to B m a x / 2 where B m a x is the maximum value of the amplitude B given in Equation (14). The half-power frequencies are the two points on either side of the natural frequency such that the dynamic amplification is equal to 1 / 2 . It should be noted that this corresponds to 3 dB amplitude decrease in the logarithmic scale. The procedure for the use of half-power bandwidth for the identification of damping is illustrated in Figure 6. Using Equations (14) and (16), the operation d d r B F 0 / k = 0 produces the peak value C m a x = 1 2 ζ 1 ζ 2 at r m a x = 1 2 ζ 2 [26]. Hence, using C r = C m a x / 2 in Equation (16) yields the frequency ratios at the half-power points as r 1,2 = 1 2 ζ 2 ± 2 ζ 1 + ζ 2 . Hence, the lower and upper half-power frequencies are obtained as ω 1 = ω n 1 2 ζ 2 2 ζ 1 + ζ 2 , and ω 2 = ω n 1 2 ζ 2 + 2 ζ 1 + ζ 2 , respectively. Overall, the relationship between the viscous damping ratio and the half-power bandwidth becomes as follows [38,99]:
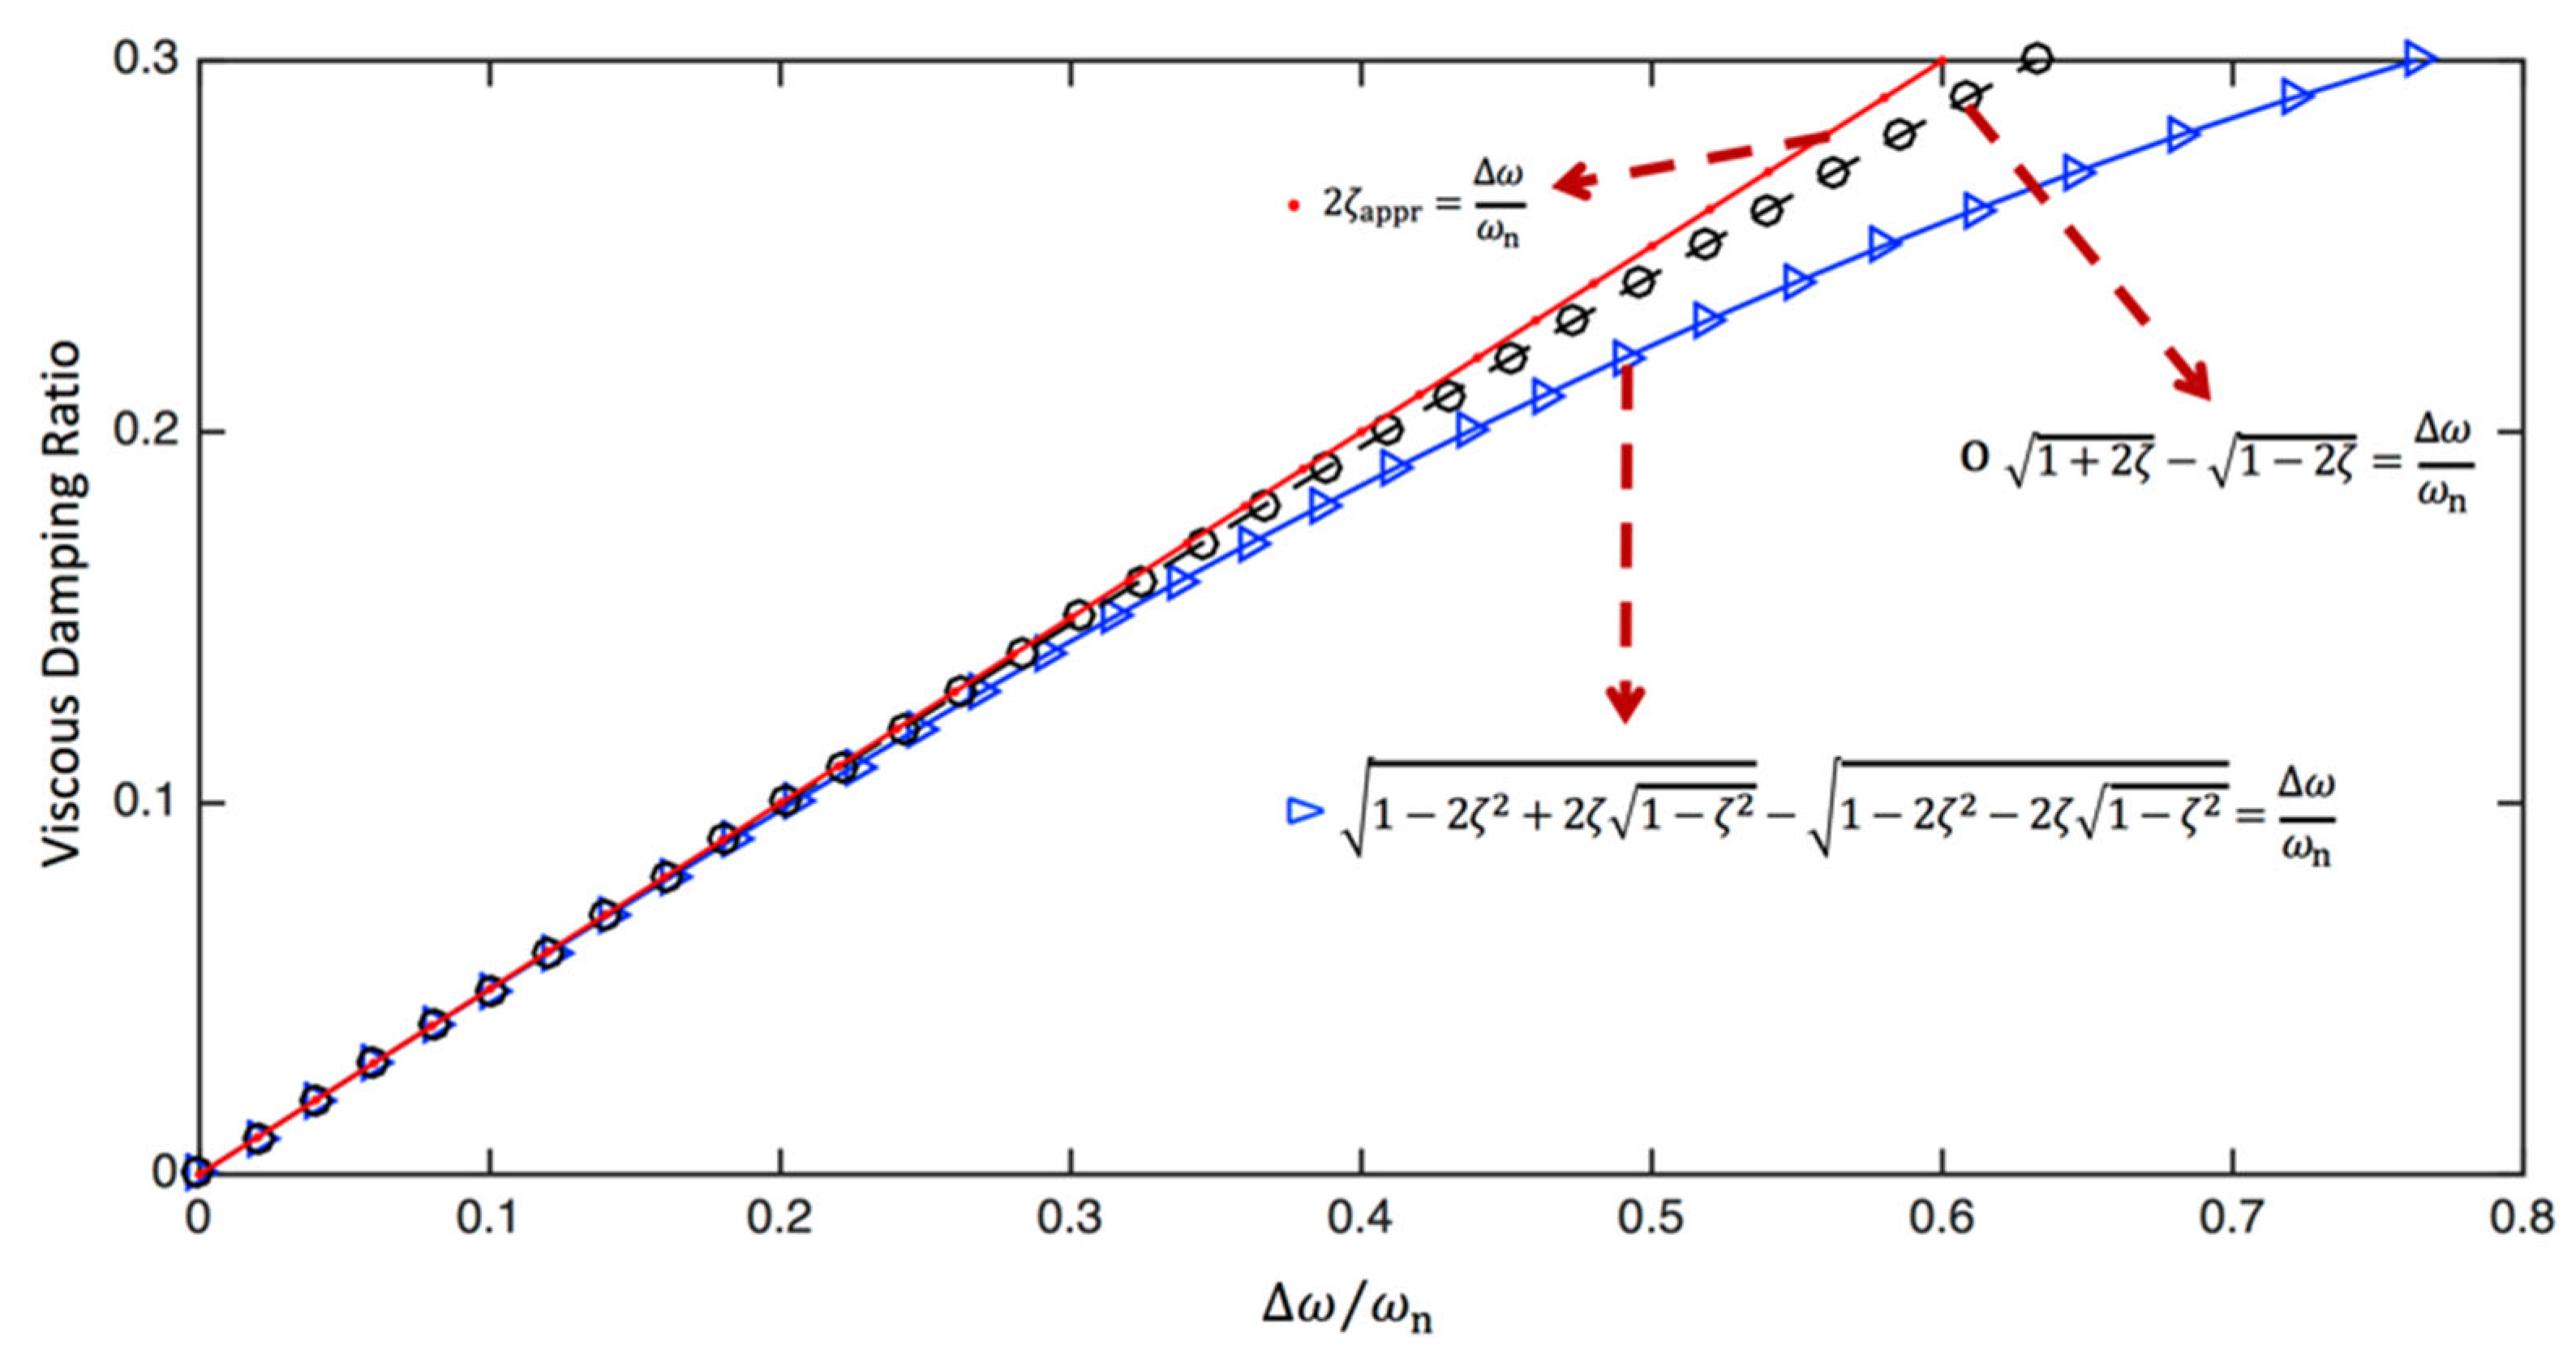
ω ω n = ω 2 ω 1 ω n = 1 2 ζ 2 + 2 ζ 1 + ζ 2 1 2 ζ 2 2 ζ 1 + ζ 2
where ω = ω 2 ω 1 is the half-power bandwidth. Once, the half-power frequencies and the natural frequency are determined using the measured data, the viscous damping ratio can be found using Equation (59). It is clear that the wider bandwidth means more damping. The expression in Equation (59) is quite complicated. Therefore, the following approximate expression can be used to define the relationship between the half-power bandwidth and the viscous damping ratio:
ω ω n = ω 2 ω 1 ω n = 1 + 2 ζ 1 2 ζ   for   ζ < 0.1
For small damping (i.e., ζ 1 ), the equation can be further simplified as follows [100]:
ω ω n = ω 2 ω 1 ω n = 2 ζ a p p r   for   ζ 1
The relationship between the half-power bandwidth and the viscous damping ratio using Equations (59-61) is visualized in Figure 7. It is seen that for small damping (i.e., ω ω n < 0.2 or ζ < 0.1 ), Equations (59-61) produce almost the same results, while there is a considerable difference between Equation (59) and Equations (60) and (61) when ζ > 0.2 . On the other hand, the approximation given in Equation (60) is always better than the simplest expression given in Equation (61).

3.8. Half-power bandwidth and loss factor

As it will be shown later, the loss factor can be written as η = t a n ϕ . Hence, the relationship between the loss factor and the half-power bandwidth can be shown to be as [38]:
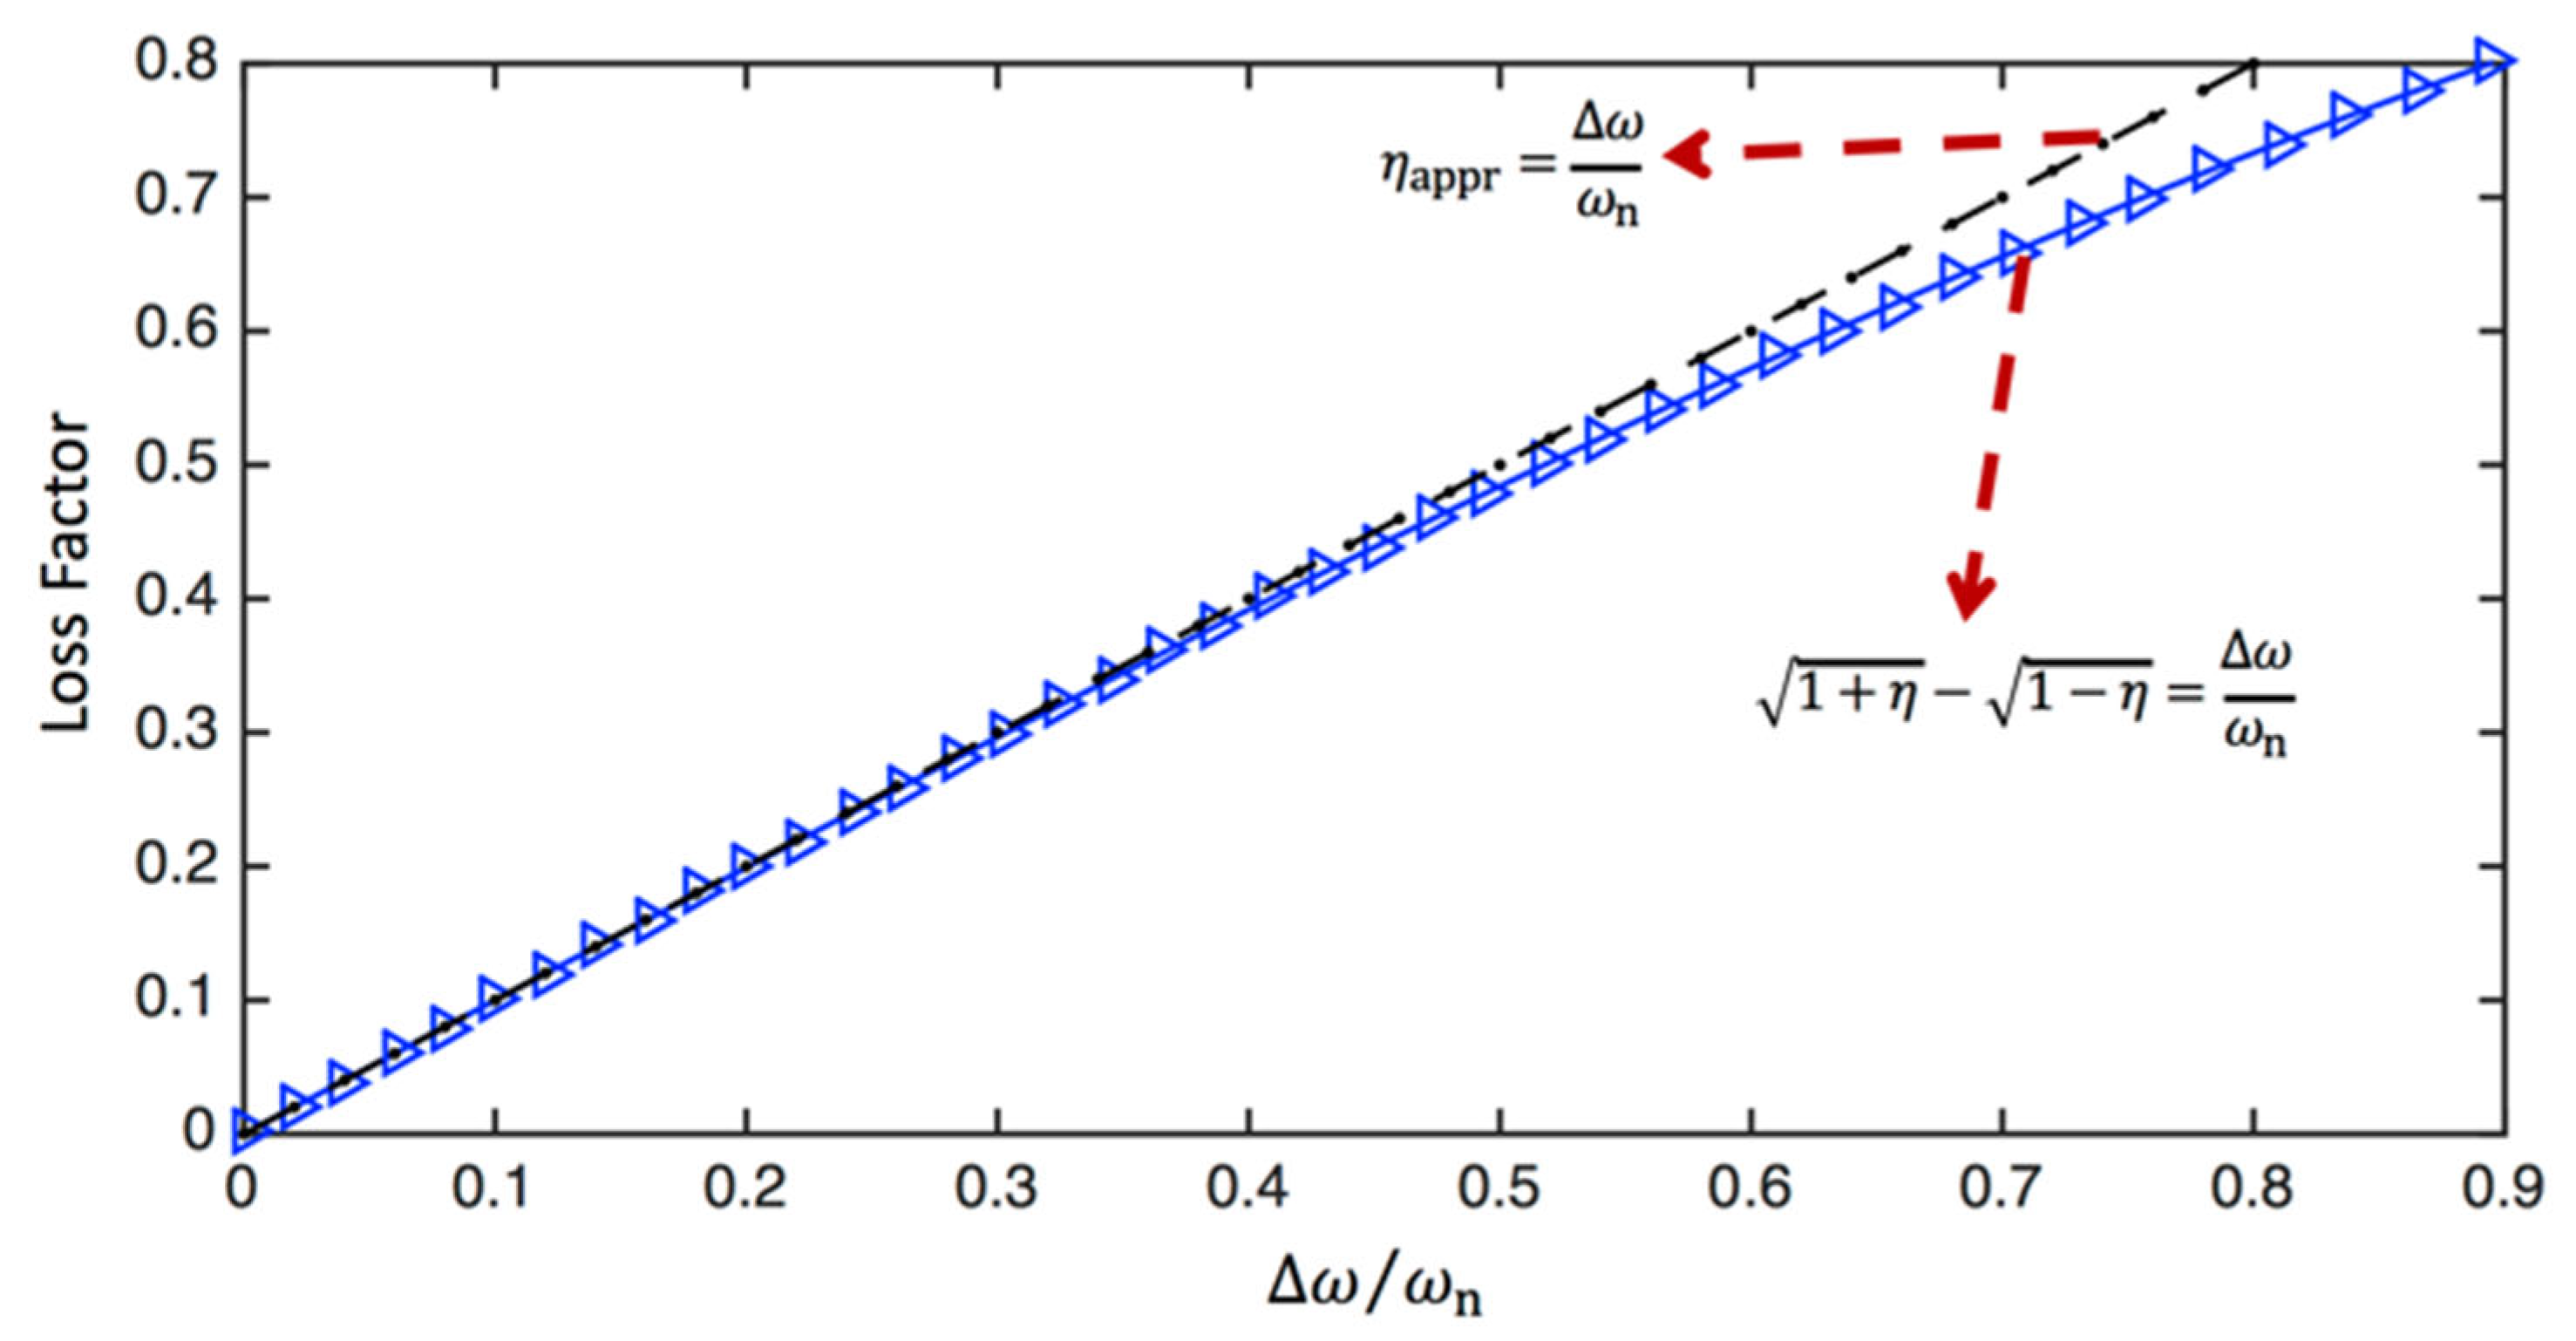
ω ω n = ω 2 ω 1 ω n = 1 + η 1 η
For small and medium damping, the equation can be further simplified as:
ω ω n = ω 2 ω 1 ω n = η   for   η < 0.3
The relationship between the half-power bandwidth and the loss factor calculated using Equations (62) and (63) is visualized in Figure 8. It is seen that for small and medium damping (i.e., ω ω n < 0.3 or η < 0.3 ), Equations (62) and (63) produce almost the same results, while there is a considerable difference between Equations (62) and (63) when η > 0.6 .
In practical applications, the most commonly used methods for the identification of the loss factor require vibration spectrums or the frequency response functions, which are obtained by the Fourier transformation of the time-domain data [101]. Although, we presented the half-power bandwidth concept above, more sophisticated methods such as the circle-fit and line-fit methods are commonly used to identify the modal loss factors of a structure using measured frequency response functions [90,92,102,103].

3.9. Loss factor and viscous damping ratio

As seen in Equation (54), the loss factor is defined as η = E E for the complex Young’s modulus E + j E . It should be remembered that, similarly, the same concept is used for the complex stiffness given by k ~ = k + j k " where k and k " are the real and imaginary parts of the complex stiffness, respectively. Now, let’s try to obtain the equivalent complex stiffness for a viscously damped SDOF system. The equation of motion for a viscously damped SDOF system subjected to a harmonic excitation can be written as:
m u ¨ + c u ˙ + k u = F 0 e j ω t
Assuming the form of the solution to be B ~ e j ω t , and substituting this into the equation above produces the following expression:
m ω 2 + k + j c ω B ~ = F 0
The equation above can be further arranged as follows:
m ω 2 + k 1 + j c ω k B ~ = F 0
or
m ω 2 + k ~ B ~ = F 0
where k ~ is the complex stiffness defined as:
k ~ = k + j k " = k 1 + j c ω k
Hence, the loss factor for a viscously damped system can obtained as follows [38]:
η = k " k = c ω k
Using the definitions of ω n = k / m , and ζ = c c c r = c 2 k m at ω = ω d , the relationship between the loss factor and the viscous damping ratio is obtained as:
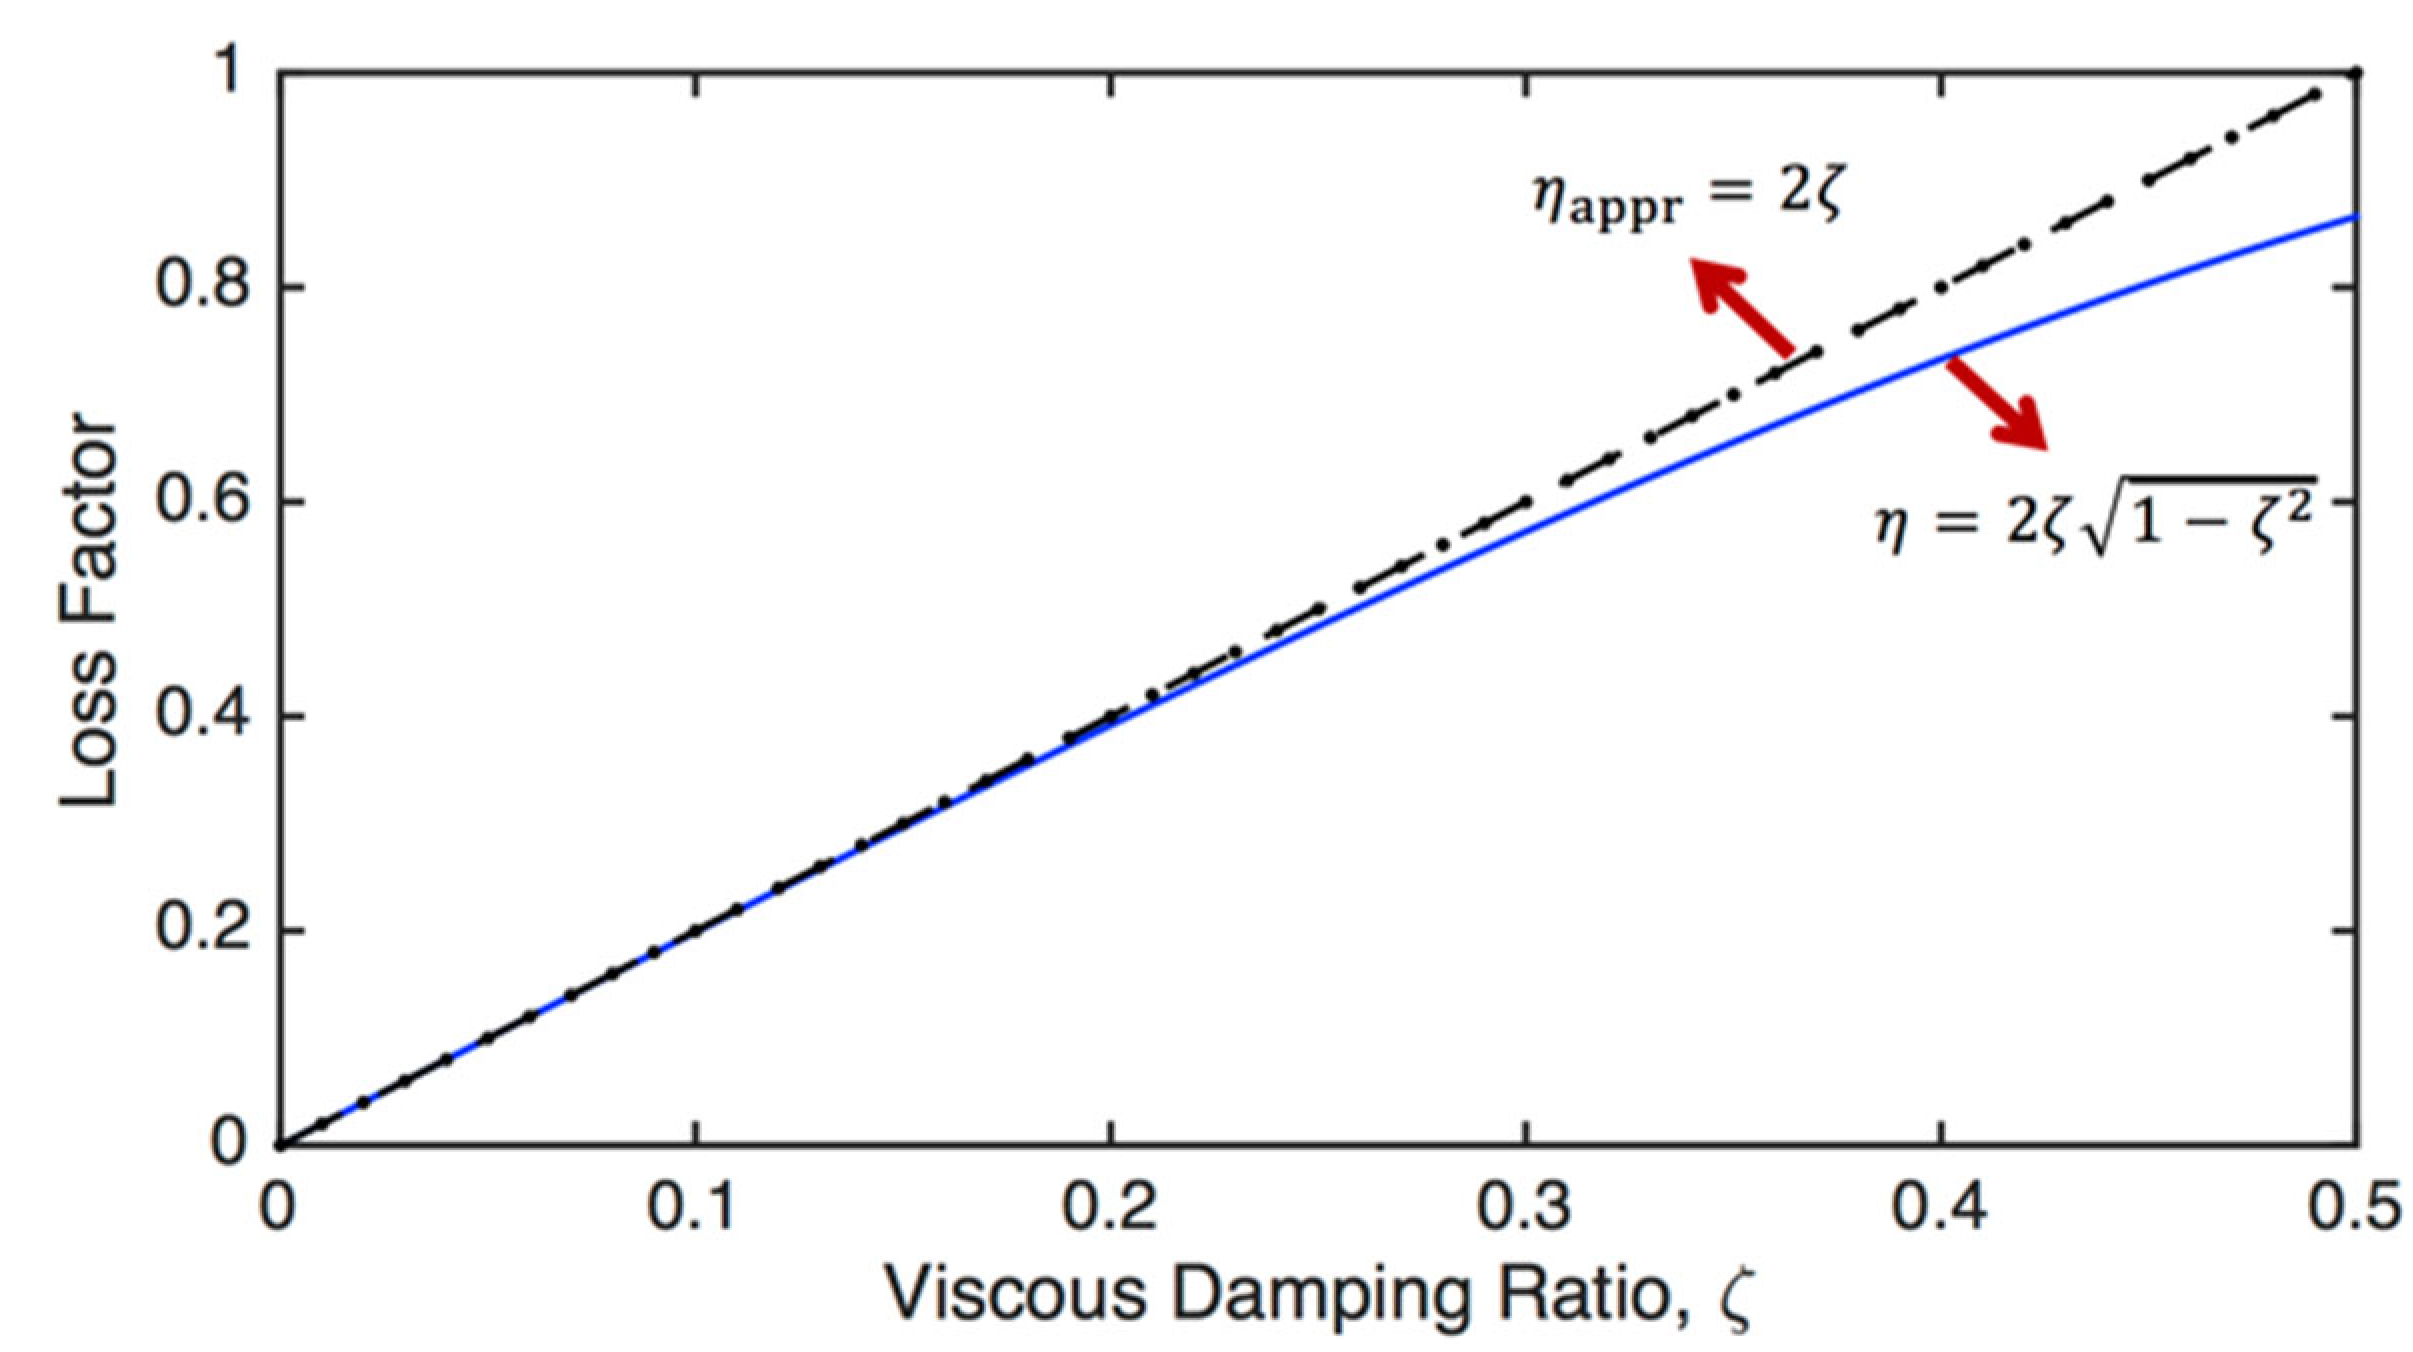
η = 2 ζ 1 ζ 2
Since 2 ζ 1 ζ 2 2 ζ for small damping, the equation above can be written as:
η a p p r = 2 ζ   for   ζ 1
The relationship between the viscous damping ratio and the loss factor calculated using Equations (70) and (71) is visualized in Figure 9. It is seen that for small damping (i.e., ζ < 0.15 ), both approaches produce almost the same results, while there is a considerable difference between these two approaches when ζ > 0.3 .

3.10. Phase lag and loss factor

As seen in Equation (50), the storage and loss moduli are given by E = σ 0 ε 0 c o s ϕ and E " = σ 0 ε 0 s i n ϕ , respectively. Using these in Equation (54), the relationship between the phase lag and the loss factor is obtained as [104]:
η = E E = t a n ϕ
Hence, the phase lag in terms of the loss factor can be written as follows:
ϕ = t a n 1 η

3.11. Phase lag and viscous damping ratio

Using ω n = k / m and ζ = c c c r = c 2 k m in Equation (7), the relationship between the phase lag and the viscous damping ratio can be shown to be:
2 ζ ω n ω = t a n ϕ
Hence, the phase lag in terms of the viscous damping ratio can be written as:
ϕ = t a n 1 2 ζ ω n ω
At ω = ω n , the relation between the loss angle and viscous damping ratio becomes:
ϕ = t a n 1 2 ζ   at   ω = ω n

3.12. Viscosity and loss modulus

In the oscillatory shear experiment, the rotation provided to the sample is a simple harmonic motion. Hence, the shear strain can be written as [105]:
γ t = γ 0 s i n ω t
where γ 0 and ω are input strain amplitude and frequency, respectively. Based on Equation (77), the shear strain rate will be:
γ ˙ t = d γ d t = γ 0 ω c o s ω t
For a linear viscoelastic material, the stress response to the applied shear is determined not only by the current rate of strain, but also by the historical rate of strain. Hence, the stress for a general linear viscoelastic material at time t can be written as [106,107]:
τ t = t G t t γ ˙ t d t = t G t t γ 0 ω c o s ω t d t
where the function G ( t ) is the relaxation modulus of the fluid [108] and shows the importance of the past strain rate on the current stress in the system. It is worth to notice that a linear elastic solid has a constant relaxation modulus of G t = G 0 , and a purely viscous fluid has a relaxation modulus of G t = μ δ t where μ is viscosity, and δ t is the Dirac delta function [106]. Overall, using reference [109], the relationship between the loss modulus and the viscosity is obtained as explained below. First, by changing variables using s = t t , we can transform the integral in Equation (79) to the following expression:
τ t = γ 0 ω 0 G s c o s ω t s d s
In addition, by writing c o s ω t s = R e e j ω t s , we can obtain the following equation:
τ t = γ 0 ω 0 G s R e e j ω t s d s = γ 0 ω R e e j ω t 0 G s e j ω s d s
It is clear that the integral above is a one-sided Fourier transform, and since it has no dependence on t , it is a complex number. By convention, we can define the complex shear modulus G ~ as follows:
G ~ = j ω 0 G s e j ω s d s = G + j G
where G is the storage shear modulus, and G is the loss shear modulus, as stated before. Overall, we have the following expression:
τ t = γ 0 R e e j ω t j G ~ = γ 0 R e c o s ω t + j s i n ω t G j G
By further rearranging the expression above and substituting Equations (77) and (78) into Equation (83), we can obtain the following equation [106]:
τ t = γ 0 G s i n ω t + G c o s ω t = G γ t + G ω γ ˙ t
It should be noted that the response of a purely viscous fluid is τ t = μ γ ˙ t = μ γ 0 ω c o s ω t , and the response of a purely elastic solid is τ t   = G γ t = G γ 0 s i n ω t . As seen in Equation (84), the role of the viscosity is taken by the term G ω . Therefore, it is common to write the shear viscosity in terms of the shear loss modulus as follows [109,110]:
μ = G ω

3.13. Viscosity and loss factor

As the loss factor is defined as η = G G , using Equation (85), the viscosity in terms of the loss factor can be written as follows [111]:
μ = η G ω

3.14. Inverse quality factor and viscous damping ratio

The inverse quality factor for a mechanical system is defined as the inverse of the so-called quality factor ( Q ), and using Equation (59), it can be written as follows [38]:
Q i n v = 1 Q = ω ω n = 1 2 ζ 2 + 2 ζ 1 + ζ 2 1 2 ζ 2 2 ζ 1 + ζ 2
For small damping, the equation above can be written as follows:
Q i n v , a p p r = 1 Q = ω ω n = 2 ζ   for   ζ 1

3.15. Inverse quality factor and loss factor

The inverse quality factor in terms of the loss factor is given by [38]:
Q i n v = 1 Q = ω ω n = 1 + η 1 η
For small and medium damping, the equation above can be written as follows:
Q i n v , a p p r = 1 Q = ω ω n = η   for   η < 0.3

3.16. Structural reverberation time and loss factor

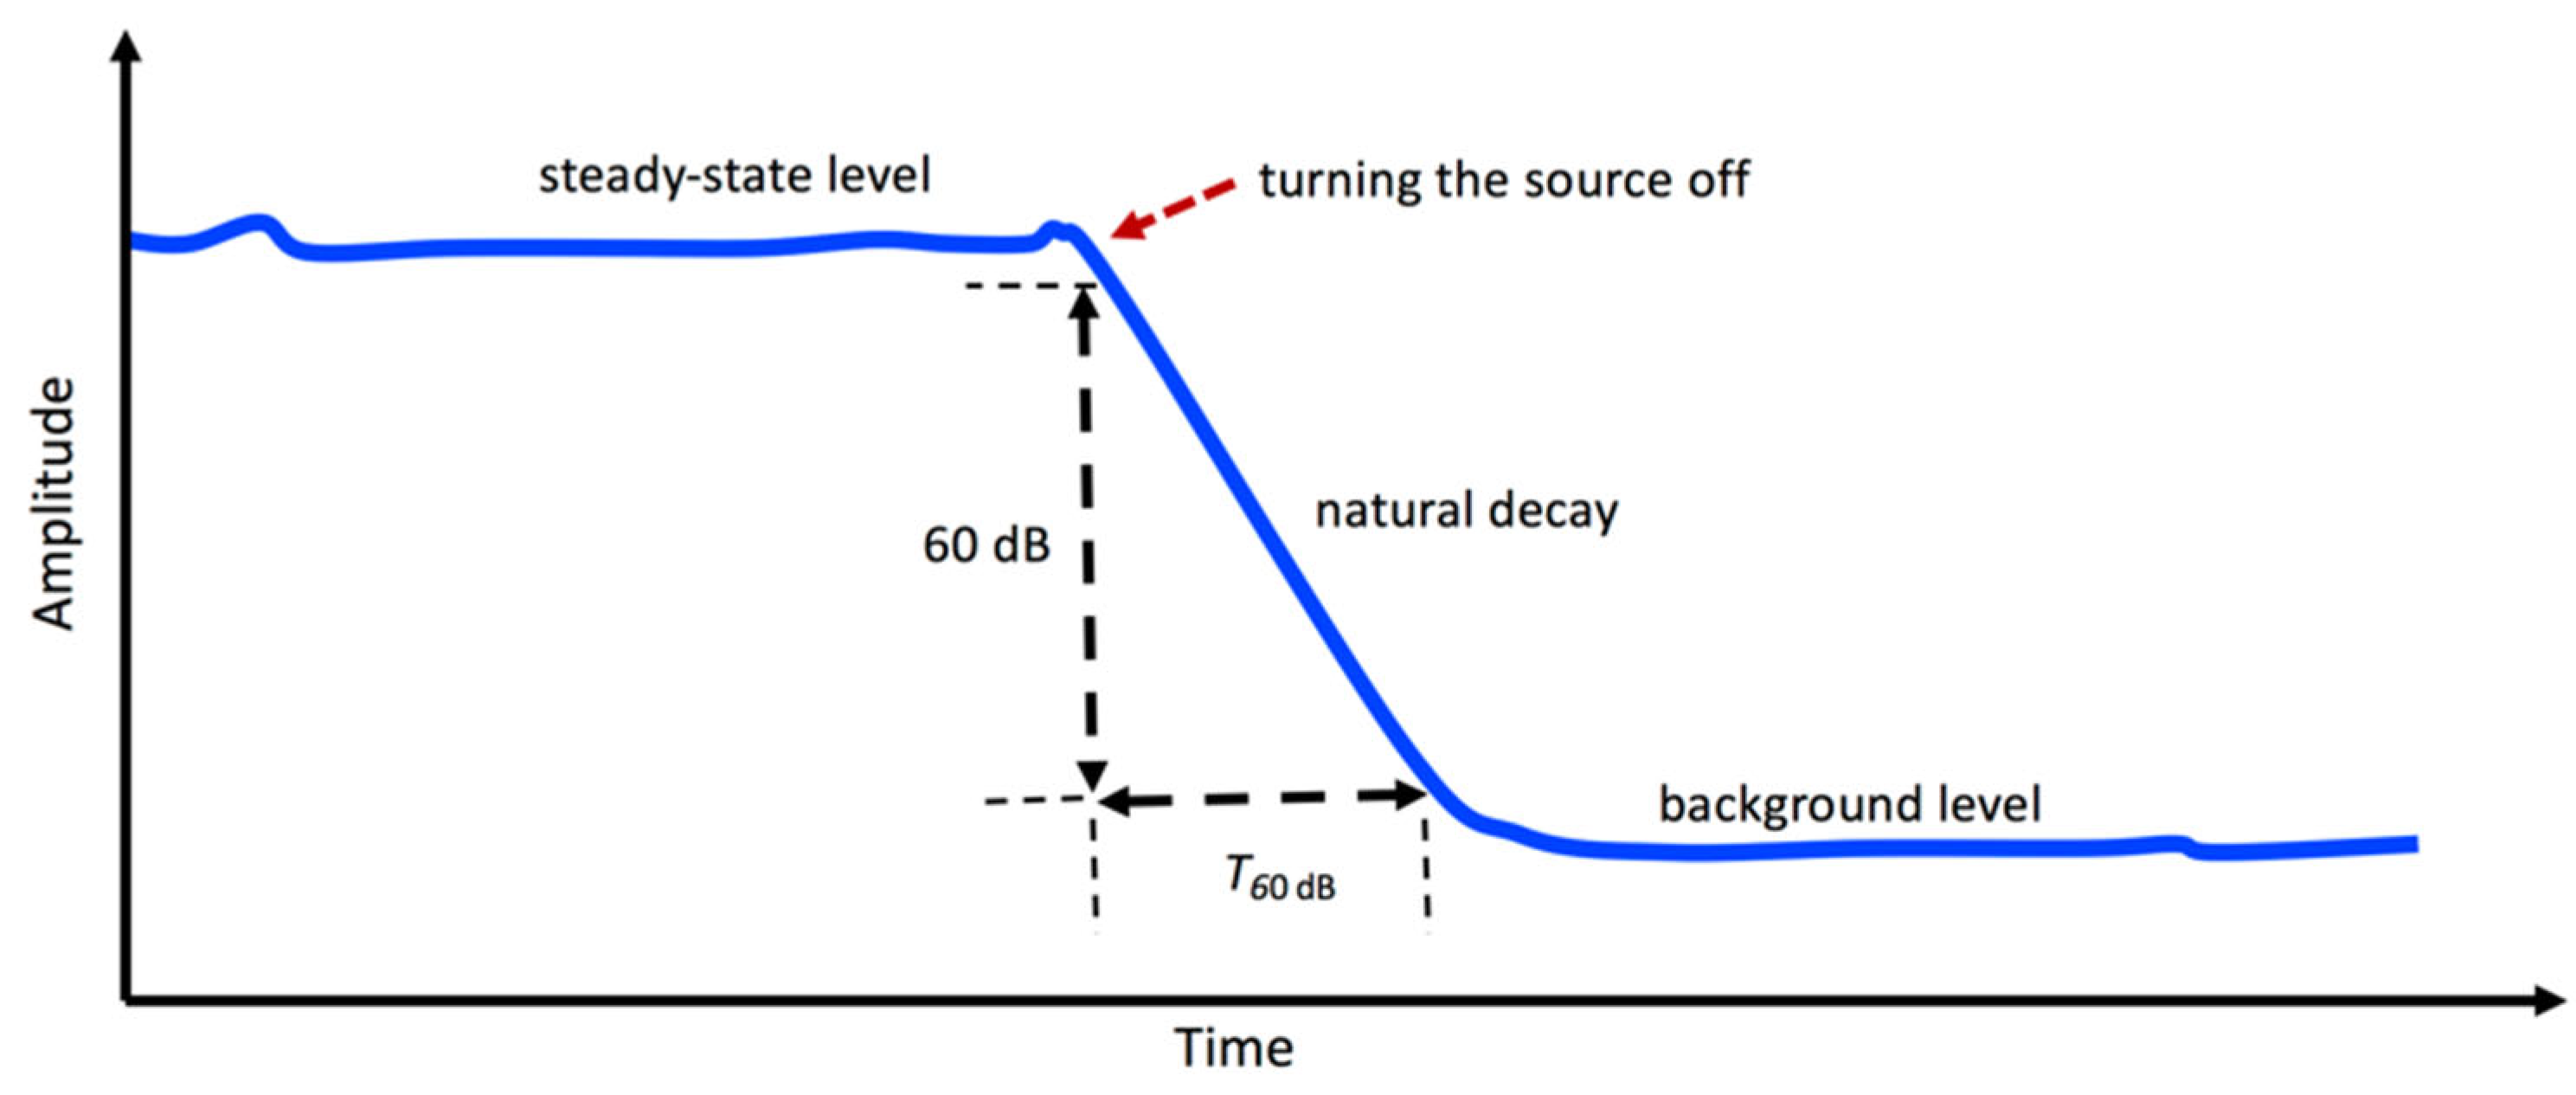
The loss factor of a plate-like structure can be identified using the method based on the energy attenuation [112]. For this purpose, the structure is suspended by a set of soft springs, and then it is excited by a shaker. When the steady vibrations are set, the excitation is abruptly interrupted, and the decay time of the vibrations is measured (see Figure 10). Hence, the loss factor of the plate is estimated using the following expression [113,114,115]:
η = 2.2 f · T 60 d B = 6 l o g e 10 ω · T 60 d B
where f is the frequency in Hz, ω = 2 π f is the frequency in rad/s as stated before, and T 60   d B is the 60 dB decay time (see Figure 10) or structural reverberation time in s.

3.17. Step response and viscous damping ratio

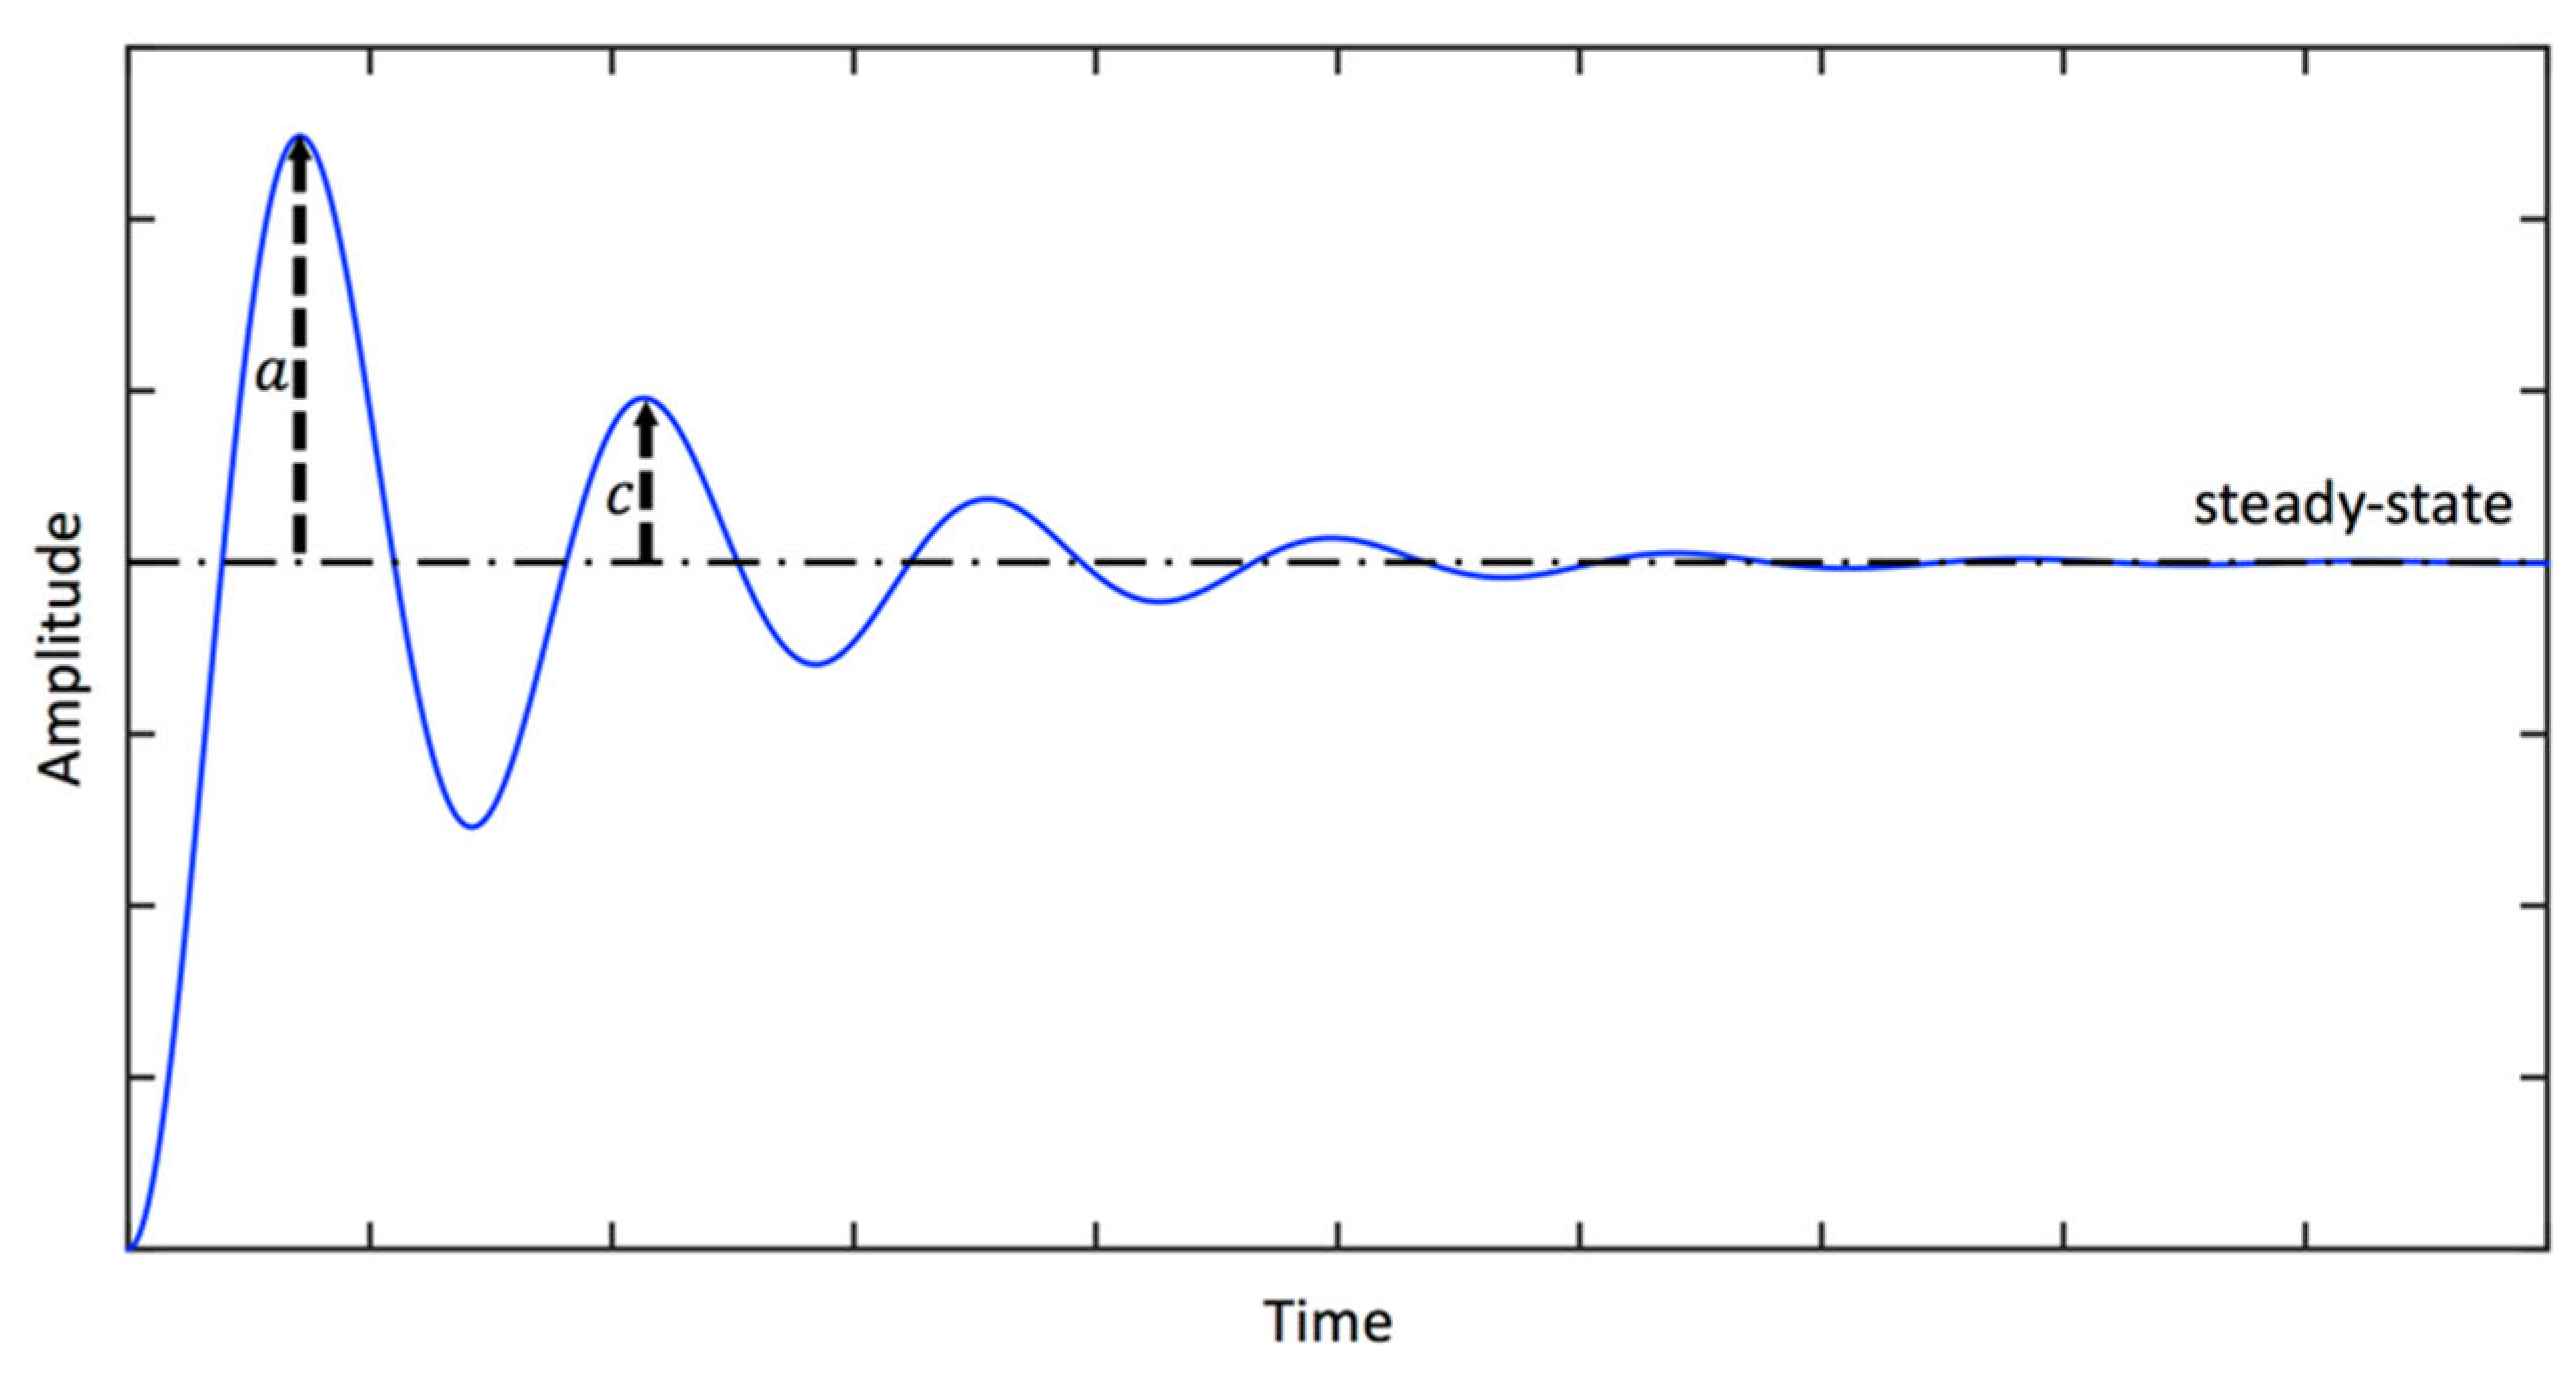
A typical step response of a viscously damped SDOF system given in Equation (19) is illustrated in Figure 11. Various parameters of the step response such as the so-called peak time, rise time, overshoot, decay ratio and settling time can be related to the viscous damping ratio [116]. For example, the relationship between the viscous damping ratio ζ and the decay ratio γ = c / a can be shown to be:
ζ = l o g e γ 4 π 2 + l o g e γ 2
where a and c are the amplitudes of the first and second peaks, respectively.

3.18. Rayleigh damping and viscous damping

A common method of modelling damping in practical applications is the so-called Rayleigh damping [117]. It is usually known as proportional damping or classical damping [118]. Overall, the Rayleigh damping model approximates the viscous damping available in the system. In this model, two damping coefficients (i.e., α and β ) are specified. These coefficients can be calculated from the modal viscous damping ratio ζ n at a particular frequency ω n using the following simple expression [119]:
ζ n = α 2 ω n + β ω n 2
If the viscous damping ratios for the i th and j th modes are ζ i and ζ j , then the Rayleigh coefficients α and β are determined from the solution of the following two algebraic equations [120]:
1 2 1 / ω i ω i 1 / ω j ω j α β = ζ i ζ j
If both modes have the same viscous damping ratio (i.e., ζ i = ζ j = ζ ) , then the values of α and β can be determined to be as follows:
α = ζ 2 ω i ω j ω i + ω j   and   β = ζ 2 ω i + ω j
It is worth noting that the Rayleigh damping model is implemented in many finite element software packages, including ABAQUS [121], ANSYS [122] and COMSOL [123].

4. Summary of The Relationships Between Common Damping Parameters

In practical applications, often one of the damping parameters (e.g., loss factor) is measured, and for comparison purposes, it is needed to convert the measured damping parameter into some other damping parameters (e.g., viscosity). The measured parameter can be converted into the desired parameter using the expressions presented in Section 3. Using the derived expressions in Section 3, an important equation relating the loss factor ( η ) to the ratio of the dissipated energy per cycle ( W ) and maximum stored energy ( W ), the specific damping capacity ( ψ ), the loss angle ( ϕ ), the ratio of the loss modulus ( E ) and storage modulus ( E ), and the viscous damping ratio ( ζ ) can be written as follows:
η = 1 2 π W W = ψ 2 π = t a n ϕ = E E = 2 ζ 1 ζ 2
Again using the derived expressions in Section 3, for small damping, another important equation relating the viscous damping ratio ( ζ ) to the ratio of the dissipated energy per cycle ( W ) and maximum stored energy ( W ), the specific damping capacity ( ψ ), the loss angle ( ϕ ), the ratio of the loss modulus ( E ) and storage modulus ( E ), the loss factor ( η ), the logarithmic decrement ( δ ), the ratio of the half-power bandwidth ( ω ) and natural frequency ( ω n ), the quality factor ( Q ) and the inverse quality factor ( Q i n v ) at ω = ω n can be written as follows:
ζ = 1 4 π W W = ψ 4 π = t a n ϕ 2 = E 2 E = η 2 = δ 2 π = ω 2 ω n = 1 2 Q = Q i n v 2   for   ζ 1   ( at   ω = ω n )
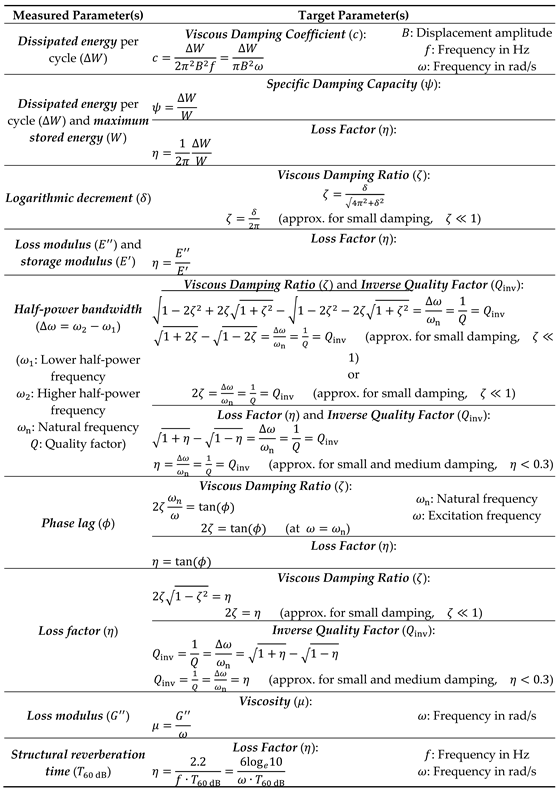
Overall, the important damping parameters measured in practical applications and their relations to other important damping parameters are summarized in Table 2.

5. Some Damping Identification Applications of Biomaterials

The dynamic indentation test is widely used to identify the viscoelastic properties of biomaterials. For example, the dynamic indentation method was used to determine the storage and loss moduli of some agar samples [30]. The average storage modulus ( E ) and loss modulus ( E ) for a 5% agar sample obtained with the frequency sweep load function with a 1500 μN static load and 2 μN dynamic amplitude was found to be between 2 and 2.3 MPa and 0.013 and 0.02 MPa, respectively, in the frequency range of 100-200 Hz [30]. Using Equation (54), i.e., η = E E , the loss factor of the 5% agar sample can be calculated to be around 0.07 and 0.09 at 100 and 200 Hz, respectively.
It is quite common to measure the storage and loss shear moduli of soft materials using an oscillatory rheometer, and then calculate the loss factor or viscosity from the measured storage and loss shear moduli. For instance, the storage shear modulus ( G ) and loss shear modulus ( G ) of a hydrogel were measured using an oscillatory rheometer test [124]. Using the relationship between the loss factor and the storage and loss shear moduli given before (i.e., η = G / G ), the average loss factor of the hydrogel for the given frequency range (i.e., 1-10 Hz) can be calculated to be η = 0.007 . Similarly, using the relationship between the viscosity and the loss shear modulus (i.e., μ = G / ω ) and the given frequency, the viscosity of the hydrogel at f = 10 Hz can be calculated to be μ = 4 Pa·s.
The logarithmic decrement method is effective for determining the damping of a structure when a single mode of vibration can be isolated from the others. Furthermore, this time-domain method does not require input measurement, it requires only response measurements. For example, the vibration damping characteristics of some spider silk threads were determined through the nanoindentation and the time decay waveform obtained from a laser vibrometer [125]. Using the measured time decay waveform and Equation (56), the logarithmic decrement of the so-called spiral thread was calculated. Then, the viscous damping ratio of the spiral thread was calculated using Equation (57). It should be noted that, although the measured time decay waveform given in the reference [125] is not pure harmonic, it is still dominated by a frequency component, and the logarithmic decrement can be used to identify the damping of the structure. Overall, the viscous damping ratio for the spiral thread was found to be ζ = 0.12 [125]. Using Equation (71), i.e., η = 2 ζ , the loss factor of the spiral thread can be calculated to be η = 0.24 .
The resonant vibration test or experimental modal analysis is quite commonly used to identify the damping of a structure. The viscous damping ratios of some hydrogel beam-shaped samples were identified via resonant vibration tests for the first bending mode [33]. For this purpose, the frequency response functions using an accelerometer and a laser Doppler vibrometer were measured. The modal viscous damping ratio was determined by fitting the Euler-Bernoulli beam model to the experimental data. Using Equation (72), i.e., η = E E = t a n ϕ , the loss factor of the hydrogel sample was determined, and using the simplified relation between the loss factor and the viscous damping ratio (i.e., η = 2 ζ ), the viscous damping ratio of the hydrogel sample was calculated. For example, the viscous damping ratio for the hydrogel 0.8% Bis sample was found to be ζ = 0.019 [33].
As mentioned before, although the half-power bandwidth concept for the identification of the loss factor was presented in Section 3, more sophisticated methods such as the circle-fit and line-fit methods are commonly used to identify the modal loss factors of a structure using the measured frequency response functions [92]. For instance, the circle-fit is based on fitting a circle to the measured frequency response function data around the vicinity of a natural frequency. Although the viscous damping ratio can be identified using Equations (59-61) based on the half-power bandwidth method, the modal loss factor for the rth mode ( η r ) of a structure is determined using η r = ω 2 , r 2 ω 1 , r 2 ω n , r 2 t a n θ 2 , r / 2 + t a n θ 1 , r / 2 in the circle-fit method where ω n , r is the natural frequency of the rth mode, and ω r , 1 and ω r , 2 correspond to the angles θ r , 1 and θ r , 2 around ω n , r when the frequency response function is plotted using the Nyquist diagram. For example, the loss factor of a biofibre based plate for the first mode using the circle-fit method was determined to be η = 0.027 [102]. Using the simplified relation between the loss factor and viscous damping ratio (i.e., η = 2 ζ ), the viscous damping ratio of the biofiber based plate can be determined to be ζ = 0.0135 .
In the recent years, a bubble or sphere placed inside the soft medium [68,69,70] or located at the soft medium interface [34,56,57] exposed to an external excitation such as acoustic radiation force or magnetic force has been widely used to identify the viscoelastic properties of soft materials. For instance, using the deformation curve for a microbubble administered into a wall-less hydrogel channel exposed to an acoustic pulse obtained by the high-speed microscopy, and the curve fitted to the measured deformation curve exploiting a mathematical model, the viscosity of the gel was estimated [34]. Overall, the maximum displacement of the bubble was determined to be around 2.2 μm, and the viscosity of the hydrogel was estimated to be 0.12 Pa·s [34]. Using a novel approach based on the dynamic response of a spherical object placed at the sample interface, the shear modulus and viscosity of a gelatine sample with a density of 1105 kg/m3 were determined to be 3000 Pa and 1.5 Pa⋅s, respectively [56].
An ultrasound elastography for the characterisation of the viscoelastic properties of soft tissue was developed and validated [60]. The reverberant shear wave ultrasound elastography was used to scan plantar soft tissue and gelatine phantom at 400–600 Hz. The shear wave speed was determined using the ultrasound particle velocity data. The viscoelastic parameters were extracted by fitting the Young’s modulus as a function of frequency derived using different rheological models to the shear wave dispersion data. For example, the Young’s modulus and viscosity of plantar soft tissue were determined to be 13628 Pa and 3.3 Pa⋅s, respectively, using the Kelvin-Voight model [60]. It should be noted that there have been many attempts to exploit the damping (or viscosity) in quantitative ultrasound [58,60,126,127,128,129]. For example, the reconstructions of viscosity maps in different tissues (e.g., ex vivo normal porcine liver, fatty duck liver and fatty goose liver) with inclusions were presented in [60]. In addition, modifications have been made to existing magnetic resonance elastography via using a damping parameter (e.g., loss angle) to improve its accuracy [45,63,76,130,131].

6. Conclusions

The literature review shows that the dynamic indentation method, rheometry and viscometry, atomic force microscopy, hysteresis loop or power input method, resonant vibration tests or experimental modal analysis, and logarithmic decrement are commonly used to identify the damping of materials, including soft materials. In addition, a bubble or sphere placed inside the soft medium or located at the soft medium interface exposed to an external excitation such as acoustic radiation force or magnetic force is nowadays used to identify the viscoelastic properties of soft materials. The ultrasound elastography and magnetic resonance elastography for determining tissue mechanical properties are quite common for the preclinical and clinical applications. The viscous damping ratio, loss factor, complex modulus (or storage and loss moduli), and viscosity are quite common to describe and quantify damping in practical applications. In addition, the specific damping capacity, loss angle, half-power bandwidth, logarithmic decrement, and inverse quality factor are used to describe and quantify damping in many applications. In practice, usually one of the damping parameters (e.g., loss factor) is measured, and for comparison purposes the measured damping parameter needs to be converted into some other damping parameters (e.g., viscosity).
The theoretical derivation of different damping parameters and their relationships have not been presented in the literature so far. Therefore, the theoretical derivations of different parameters for the description and quantification of damping and their relationships, as well as the methods for damping identification are covered in this comprehensive review. Both accurate formulas (i.e., for systems with any amount of damping) and approximate formulas (i.e., for systems with low damping) are presented and compared. The damping parameters investigated in this paper include the specific damping capacity, loss factor, viscous damping coefficient, viscous damping ratio, loss angle or phase lag, logarithmic decrement, half-power bandwidth, complex modulus (or loss and storage moduli), inverse quality factor, viscosity, decay ratio in the step response, and structural reverberation time. It is believed that the material presented in this paper will be a primary resource for damping or viscoelasticity research and teaching in the future.

Author Contributions

Conceptualization, H.K.; methodology, H.K.; software, H.K.; validation, H.K.; formal analysis, H.K.; investigation, H.K. and S.R.; resources, H.K. and S.R.; data curation, H.K; writing—original draft preparation, H.K. and S.R.; writing—review and editing, H.K. and S.R.; visualization, H.K.; supervision, H.K. and S.R.; project administration, H.K. and S.R.; funding acquisition, H.K. All authors have read and agreed to the published version of the manuscript.

Funding

This research received no external funding.

Data Availability Statement

The data supporting the findings of this study are available within the article. The scripts used for processing data presented in this study are available on request from the corresponding author.

Acknowledgments

We thank Prof. Kenan Y. Sanliturk (Istanbul Technical University, Turkey) and Prof. H. Temel Belek (Istanbul Technical University, Turkey) for reviewing the manuscript and providing valuable suggestions.

Conflicts of Interest

The authors declare no conflicts of interest.

References

  1. Tang, Y.; Liu, S.; Deng, Y.; Zhang, Y.; Yin, L.; Zheng, W. An Improved Method for Soft Tissue Modeling. Biomed Signal Process Control 2021, 65, 102367. [Google Scholar] [CrossRef]
  2. Shi, H.; Xiang, S.; Wang, L.; Sun, Y.; Wang, J.; Liu, Z. Characterization of Middle Ear Soft Tissue Damping and Its Role in Sound Transmission. Biomech Model Mechanobiol 2023, 22, 1003–1018. [Google Scholar] [CrossRef]
  3. Wells, M.; Schneider, R.; Bhattarai, B.; Currie, H.; Chavez, B.; Christopher, G.; Rumbaugh, K.; Gordon, V. Perspective: The Viscoelastic Properties of Biofilm Infections and Mechanical Interactions with Phagocytic Immune Cells. Front Cell Infect Microbiol 2023, 13. [Google Scholar] [CrossRef]
  4. Elango, J.; Lijnev, A.; Zamora-Ledezma, C.; Alexis, F.; Wu, W.; Marín, J.M.G.; Sanchez de Val, J.E.M. The Relationship of Rheological Properties and the Performance of Silk Fibroin Hydrogels in Tissue Engineering Application. Process Biochemistry 2023, 125, 198–211. [Google Scholar] [CrossRef]
  5. Bailey, M.; Alunni-Cardinali, M.; Correa, N.; Caponi, S.; Holsgrove, T.; Barr, H.; Stone, N.; Winlove, C.P.; Fioretto, D.; Palombo, F. Viscoelastic Properties of Biopolymer Hydrogels Determined by Brillouin Spectroscopy: A Probe of Tissue Micromechanics. Sci Adv 2020, 6. [Google Scholar] [CrossRef] [PubMed]
  6. Efremov, Y.M.; Okajima, T.; Raman, A. Measuring Viscoelasticity of Soft Biological Samples Using Atomic Force Microscopy. Soft Matter 2020, 16, 64–81. [Google Scholar] [CrossRef]
  7. Gu, X.; Wang, L.; Guan, X.; Wang, Y.; Cheng, Y.; Wu, Y. Advances in the Design, Preparation and Application of Biomimetic Damping Materials. Giant 2024, 19, 100321. [Google Scholar] [CrossRef]
  8. Young, S.; Pincus, G.; Hwang, N.H.C. Dynamic Evaluation of the Viscoelastic Properties of a Biomedical Polymer (Biomer). Biomater Med Devices Artif Organs 1977, 5, 233–254. [Google Scholar] [CrossRef] [PubMed]
  9. Cheng, T.; Dai, C.; Gan, R.Z. Viscoelastic Properties of Human Tympanic Membrane. Ann Biomed Eng 2007, 35, 305–314. [Google Scholar] [CrossRef] [PubMed]
  10. Hans, G.A.; Besser, M.W. The Place of Viscoelastic Testing in Clinical Practice. Br J Haematol 2016, 173, 37–48. [Google Scholar] [CrossRef]
  11. Cowman, M.K.; Schmidt, T.A.; Raghavan, P.; Stecco, A. Viscoelastic Properties of Hyaluronan in Physiological Conditions. F1000Res 2015, 4, 622. [Google Scholar] [CrossRef] [PubMed]
  12. Eliahoo, P.; Setayesh, H.; Hoffman, T.; Wu, Y.; Li, S.; Treweek, J.B. Viscoelasticity in 3D Cell Culture and Regenerative Medicine: Measurement Techniques and Biological Relevance. ACS Materials Au 2024, 4, 354–384. [Google Scholar] [CrossRef]
  13. Rus, G.; Faris, I.H.; Torres, J.; Callejas, A.; Melchor, J. Why Are Viscosity and Nonlinearity Bound to Make an Impact in Clinical Elastographic Diagnosis? Sensors 2020, 20, 2379. [Google Scholar] [CrossRef] [PubMed]
  14. Yang, F.; Chen, Z.; Wang, P.; Shi, Y. Phase-Domain Photoacoustic Mechanical Imaging for Quantitative Elastography and Viscography. IEEE Trans Biomed Eng 2024, 71, 2330–2340. [Google Scholar] [CrossRef] [PubMed]
  15. Kimondo, J.J.; Said, R.R.; Wu, J.; Tian, C.; Wu, Z. Mechanical Rheological Model on the Assessment of Elasticity and Viscosity in Tissue Inflammation: A Systematic Review. PLoS One 2024, 19, e0307113. [Google Scholar] [CrossRef]
  16. Chen, X.; Li, X.; Turco, S.; van Sloun, R.J.G.; Mischi, M. Ultrasound Viscoelastography by Acoustic Radiation Force: A State-of-the-Art Review. IEEE Trans Ultrason Ferroelectr Freq Control 2024, 71, 536–557. [Google Scholar] [CrossRef]
  17. Dietrich, C.; Bamber, J.; Berzigotti, A.; Bota, S.; Cantisani, V.; Castera, L.; Cosgrove, D.; Ferraioli, G.; Friedrich-Rust, M.; Gilja, O.; et al. EFSUMB Guidelines and Recommendations on the Clinical Use of Liver Ultrasound Elastography, Update 2017 (Long Version). Ultraschall in der Medizin - European Journal of Ultrasound 2017, 38, e16–e47. [Google Scholar] [CrossRef]
  18. Berzigotti, A.; Ferraioli, G.; Bota, S.; Gilja, O.H.; Dietrich, C.F. Novel Ultrasound-Based Methods to Assess Liver Disease: The Game Has Just Begun. Digestive and Liver Disease 2018, 50, 107–112. [Google Scholar] [CrossRef]
  19. Ganeau, A.; Lafond, M.; Legrand, F.; Laloy-Borgna, G.; Ben Moussa, O.; Poinard, S.; Mascarelli, F.; Thuret, G.; Gain, P.; Lafon, C.; et al. Characterization of the Viscoelastic Properties of in Vitro Crystalline Lens Samples Using Ultrasound Elastography. Appl Phys Lett 2023, 123. [Google Scholar] [CrossRef]
  20. Oglat, A.A.; Abukhalil, T. Ultrasound Elastography: Methods, Clinical Applications, and Limitations: A Review Article. Applied Sciences 2024, 14, 4308. [Google Scholar] [CrossRef]
  21. Lim, W.T.H.; Ooi, E.H.; Foo, J.J.; Ng, K.H.; Wong, J.H.D.; Leong, S.S. The Role of Shear Viscosity as a Biomarker for Improving Chronic Kidney Disease Detection Using Shear Wave Elastography: A Computational Study Using a Validated Finite Element Model. Ultrasonics 2023, 133, 107046. [Google Scholar] [CrossRef] [PubMed]
  22. Zhang, K.; Zhu, M.; Thomas, E.; Hopyan, S.; Sun, Y. Existing and Potential Applications of Elastography for Measuring the Viscoelasticity of Biological Tissues In Vivo. Front Phys 2021, 9. [Google Scholar] [CrossRef]
  23. Gaul, L. The Influence of Damping on Waves and Vibrations. Mech Syst Signal Process 1999, 13, 1–30. [Google Scholar] [CrossRef]
  24. Koruk, H. Development of an Improved Mathematical Model for the Dynamic Response of a Sphere Located at a Viscoelastic Medium Interface. Eur J Phys 2022, 43, 25002. [Google Scholar] [CrossRef]
  25. Rahman, M.Z. Mechanical and Damping Performances of Flax Fibre Composites – A Review. Composites Part C: Open Access 2021, 4, 100081. [Google Scholar] [CrossRef]
  26. Inman, D.J. Engineering Vibrations; Fourth Edi.; Pearson Education: New Jersey, 2013. [Google Scholar]
  27. De Greef, D.; Pires, F.; Dirckx, J.J.J. Effects of Model Definitions and Parameter Values in Finite Element Modeling of Human Middle Ear Mechanics. Hear Res 2017, 344, 195–206. [Google Scholar] [CrossRef]
  28. West, G.; Harris, E.; Lowe, M.; Bamber, J.; Huthwaite, P. Multi-Band Finite Element Simulation of Ultrasound Attenuation by Soft Tissue. In Proceedings of the 2021 IEEE International Ultrasonics Symposium (IUS); 2021; pp. 1–5. [Google Scholar]
  29. Navindaran, K.; Kang, J.S.; Moon, K. Techniques for Characterizing Mechanical Properties of Soft Tissues. J Mech Behav Biomed Mater 2023, 138, 105575. [Google Scholar] [CrossRef]
  30. Nayar, V.T.; Weiland, J.D.; Nelson, C.S.; Hodge, A.M. Elastic and Viscoelastic Characterization of Agar. J Mech Behav Biomed Mater 2012, 7, 60–68. [Google Scholar] [CrossRef]
  31. Dakhil, H.; Gilbert, D.F.; Malhotra, D.; Limmer, A.; Engelhardt, H.; Amtmann, A.; Hansmann, J.; Hübner, H.; Buchholz, R.; Friedrich, O.; et al. Measuring Average Rheological Quantities of Cell Monolayers in the Linear Viscoelastic Regime. Rheol Acta 2016, 55, 527–536. [Google Scholar] [CrossRef]
  32. Peng, B.; Tang, J.; Wang, P.; Luo, J.; Xiao, P.; Lin, Y.; Tam, K.C. Rheological Properties of Cellulose Nanocrystal-Polymeric Systems. Cellulose 2018, 25, 3229–3240. [Google Scholar] [CrossRef]
  33. Wang, B.; Moura, A.G.; Chen, J.; Erturk, A.; Hu, Y. Characterization of Hydrogel Structural Damping. Extreme Mech Lett 2020, 40, 100841. [Google Scholar] [CrossRef]
  34. Bezer, J.H.; Koruk, H.; Rowlands, C.J.; Choi, J.J. Elastic Deformation of Soft Tissue-Mimicking Materials Using a Single Microbubble and Acoustic Radiation Force. Ultrasound Med Biol 2020, 46, 3327–3338. [Google Scholar] [CrossRef]
  35. Vasconcelos, L.; Kijanka, P.; Urban, M.W. Viscoelastic Parameter Estimation Using Simulated Shear Wave Motion and Convolutional Neural Networks. Comput Biol Med 2021, 133, 104382. [Google Scholar] [CrossRef]
  36. Esmaeel, A.; Ahmed, K.I.E.; FathEl-Bab, A.M.R. Determination of Damping Coefficient of Soft Tissues Using Piezoelectric Transducer. Biomed Microdevices 2021, 23, 23. [Google Scholar] [CrossRef]
  37. Koruk, H.; Yurdaer, S.B.; Koc, H.O.; Besli, A. Identification of the Viscoelastic Properties of Soft Materials Using a Convenient Dynamic Indentation System and Procedure. Mater Today Proc 2022, 57, 464–468. [Google Scholar] [CrossRef]
  38. Graesser, E.J.; Wong, C.R. The Relationship of Traditional Damping Measures for Materials with High Damping Capacity: A Review. Mechanics and Mechanisms of Material Damping 1992, 316–343. [Google Scholar]
  39. Argatov, I.; Mishuris, G. Indentation Testing of Biological Materials; Advanced Structured Materials; Springer International Publishing: Cham, 2018; Vol. 91, ISBN 978-3-319-78532-5. [Google Scholar]
  40. Liu, T.; Butaud, P.; Placet, V.; Ouisse, M. Damping Behavior of Plant Fiber Composites: A Review. Compos Struct 2021, 275, 114392. [Google Scholar] [CrossRef]
  41. Mostafavi Yazdi, S.J.; Baqersad, J. Mechanical Modeling and Characterization of Human Skin: A Review. J Biomech 2022, 130, 110864. [Google Scholar] [CrossRef]
  42. Moučka, R.; Sedlačík, M.; Pátíková, Z. Fractional Viscoelastic Models of Porcine Skin and Its Gelatin-Based Surrogates. Mechanics of Materials 2023, 177, 104559. [Google Scholar] [CrossRef]
  43. Wang, Y.; Selomulya, C. Food Rheology Applications of Large Amplitude Oscillation Shear (LAOS). Trends Food Sci Technol 2022, 127, 221–244. [Google Scholar] [CrossRef]
  44. Zapoměl, J.; Dekýš, V.; Ferfecki, P.; Sapietová, A.; Sága, M.; Žmindák, M. Identification of Material Damping of a Carbon Composite Bar and Study of Its Effect on Attenuation of Its Transient Lateral Vibrations. Int J Appl Mech 2015, 7, 1550081. [Google Scholar] [CrossRef]
  45. Hirsch, S.; Guo, J.; Reiter, R.; Papazoglou, S.; Kroencke, T.; Braun, J.; Sack, I. MR Elastography of the Liver and the Spleen Using a Piezoelectric Driver, Single-Shot Wave-Field Acquisition, and Multifrequency Dual Parameter Reconstruction. Magn Reson Med 2014, 71, 267–277. [Google Scholar] [CrossRef] [PubMed]
  46. Tom, C.; Sangitra, S.N.; Pujala, R.K. Rheological Fingerprinting and Applications of Cellulose Nanocrystal Based Composites: A Review. J Mol Liq 2023, 370, 121011. [Google Scholar] [CrossRef]
  47. Vriend, N.M.; Kren, A.P. Determination of the Viscoelastic Properties of Elastomeric Materials by the Dynamic Indentation Method. Polym Test 2004, 23, 369–375. [Google Scholar] [CrossRef]
  48. Boyer, G.; Laquièze, L.; Le Bot, A.; Laquièze, S.; Zahouani, H. Dynamic Indentation on Human Skin in Vivo: Ageing Effects. Skin Research and Technology 2009, 15, 55–67. [Google Scholar] [CrossRef] [PubMed]
  49. Rosicka, K.; Mierzejewska-Krzyżowska, B.; Mrówczyński, W. Skin Biomechanical and Viscoelastic Properties Measured with MyotonPRO in Different Areas of Human Body. Skin Research and Technology 2021, 1–10. [Google Scholar] [CrossRef] [PubMed]
  50. Koruk, H.; El Ghamrawy, A.; Pouliopoulos, A.N.; Choi, J.J. Acoustic Particle Palpation for Measuring Tissue Elasticity. Appl Phys Lett 2015, 107, 223701. [Google Scholar] [CrossRef] [PubMed]
  51. Koruk, H.; Choi, J.J. Displacement of a Bubble by Acoustic Radiation Force into a Fluid-Tissue Interface. Journal of the Acoustical Society of America 2018, 143, 2535–2540. [Google Scholar] [CrossRef] [PubMed]
  52. Koruk, H.; Choi, J.J. Displacement of a Bubble Located at a Fluid-Viscoelastic Medium Interface. J Acoust Soc Am 2019, 145, EL410–EL416. [Google Scholar] [CrossRef] [PubMed]
  53. Koruk, H. Development of a Model for Predicting Dynamic Response of a Sphere at Viscoelastic Interface: A Dynamic Hertz Model. IOP Conf Ser Mater Sci Eng 2021, 1150, 012015. [Google Scholar] [CrossRef]
  54. Koruk, H. Assessment of the Models for Predicting the Responses of Spherical Objects in Viscoelastic Mediums and at Viscoelastic Interfaces. IOP Conf Ser Mater Sci Eng 2021, 1150, 012016. [Google Scholar] [CrossRef]
  55. Koruk, H. Modelling Small and Large Displacements of a Sphere on an Elastic Half-Space Exposed to a Dynamic Force. Eur J Phys 2021, 52, 055006. [Google Scholar] [CrossRef]
  56. Koruk, H.; Pouliopoulos, A.N. Investigation of the Motion of a Spherical Object Located at Soft Elastic and Viscoelastic Material Interface for Identification of Material Properties. Applied Science and Engineering Progress 2024, 17, 7277. [Google Scholar] [CrossRef]
  57. Koruk, H.; Koc, H.O.; Yurdaer, S.B.; Besli, A.; Pouliopoulos, A.N. A New Approach for Measuring Viscoelastic Properties of Soft Materials Using the Dynamic Response of a Spherical Object Placed at the Sample Interface. Exp Mech 2024, 64, 21–32. [Google Scholar] [CrossRef]
  58. Li, H.; Flé, G.; Bhatt, M.; Qu, Z.; Ghazavi, S.; Yazdani, L.; Bosio, G.; Rafati, I.; Cloutier, G. Viscoelasticity Imaging of Biological Tissues and Single Cells Using Shear Wave Propagation. Front Phys 2021, 9. [Google Scholar] [CrossRef]
  59. Beuve, S.; Kritly, L.; Callé, S.; Remenieras, J.-P. Diffuse Shear Wave Spectroscopy for Soft Tissue Viscoelastic Characterization. Ultrasonics 2021, 110, 106239. [Google Scholar] [CrossRef] [PubMed]
  60. Tecse, A.; Romero, S.E.; Naemi, R.; Castaneda, B. Characterisation of the Soft Tissue Viscous and Elastic Properties Using Ultrasound Elastography and Rheological Models: Validation and Applications in Plantar Soft Tissue Assessment. Phys Med Biol 2023, 68, 105005. [Google Scholar] [CrossRef]
  61. Wang, J.; Li, R.; Zhou, Q.; Gu, L.; Dong, P. Analysis of Shear Wave Propagation in Soft Biomaterials Using a Finite Element Model. J Eng Sci Med Diagn Ther 2023, 7. [Google Scholar] [CrossRef]
  62. Koruk, H.; Pouliopoulos, A.N. Elasticity and Viscoelasticity Imaging Based on Small Particles Exposed to External Forces. Processes 2023, 11, 3402. [Google Scholar] [CrossRef]
  63. Wang, Y.; Zhou, J.; Lin, H.; Wang, H.; Sack, I.; Guo, J.; Yan, F.; Li, R. Viscoelastic Parameters Derived from Multifrequency MR Elastography for Depicting Hepatic Fibrosis and Inflammation in Chronic Viral Hepatitis. Insights Imaging 2024, 15, 91. [Google Scholar] [CrossRef]
  64. Aho, J.; Hvidt, S.; Baldursdottir, S. Rheology in Pharmaceutical Sciences. In Analytical Techniques in the Pharmaceutical Sciences; Müllertz, A., Perrie, Y., Rades, T., Eds.; Springer: New York, 2016; pp. 719–750. [Google Scholar]
  65. Garcia, R. Nanomechanical Mapping of Soft Materials with the Atomic Force Microscope: Methods, Theory and Applications. Chem Soc Rev 2020, 49, 5850–5884. [Google Scholar] [CrossRef] [PubMed]
  66. Wang, F.; Liao, J.; Huang, C.; Yu, H.; Yan, J.; Li, H. Study on the Damping Dynamics Characteristics of a Viscoelastic Damping Material. Processes 2022, 10, 635. [Google Scholar] [CrossRef]
  67. Miao, Y.; Li, R.; Qian, X.; Yin, Y.; Yang, Y.; Jin, X.; Lin, B.; Liu, Y.; Liu, Z. Effect of Extraction on the Acoustic Vibrational Properties of Picea Jezoensis Var. Microsperma (Lindl.) W.C.Cheng & L.K.Fu. Ann For Sci 2021, 78, 24. [Google Scholar] [CrossRef]
  68. Yoon, S.; Aglyamov, S.R.; Karpiouk, A.B.; Kim, S.; Emelianov, S.Y. Estimation of Mechanical Properties of a Viscoelastic Medium Using a Laser-Induced Microbubble Interrogated by an Acoustic Radiation Force. J Acoust Soc Am 2011, 130, 2241–2248. [Google Scholar] [CrossRef] [PubMed]
  69. Levy, B.E.; Oldenburg, A.L. Single Magnetic Particle Motion in Magnetomotive Ultrasound: An Analytical Model and Experimental Validation. IEEE Trans Ultrason Ferroelectr Freq Control 2021, 68, 2635–2644. [Google Scholar] [CrossRef]
  70. Aglyamov, S.R.; Karpiouk, A.B.; Ilinskii, Y.A.; Zabolotskaya, E.A.; Emelianov, S.Y. Motion of a Solid Sphere in a Viscoelastic Medium in Response to Applied Acoustic Radiation Force: Theoretical Analysis and Experimental Verification. The Journal of the Acoustical Society of Americac 2007, 122, 1927–1936. [Google Scholar] [CrossRef] [PubMed]
  71. Dollet, B.; Marmottant, P.; Garbin, V. Bubble Dynamics in Soft and Biological Matter. Annu Rev Fluid Mech 2019, 51, 331–355. [Google Scholar] [CrossRef]
  72. Saint-Michel, B.; Garbin, V. Bubble Dynamics for Broadband Microrheology of Complex Fluids. Curr Opin Colloid Interface Sci 2020, 50, 101392. [Google Scholar] [CrossRef]
  73. Wang, X.; Lin, S.; Lyu, G. Advances in the Clinical Application of Ultrasound Elastography in Uterine Imaging. Insights Imaging 2022, 13, 141. [Google Scholar] [CrossRef]
  74. Wells, P.N.T.; Liang, H.-D. Medical Ultrasound: Imaging of Soft Tissue Strain and Elasticity. J R Soc Interface 2011, 8, 1521–1549. [Google Scholar] [CrossRef] [PubMed]
  75. Chen, S.; Sanchez, W.; Callstrom, M.R.; Gorman, B.; Lewis, J.T.; Sanderson, S.O.; Greenleaf, J.F.; Xie, H.; Shi, Y.; Pashley, M.; et al. Assessment of Liver Viscoelasticity by Using Shear Waves Induced by Ultrasound Radiation Force. Radiology 2013, 266, 964–970. [Google Scholar] [CrossRef]
  76. Sack, I. Magnetic Resonance Elastography from Fundamental Soft-Tissue Mechanics to Diagnostic Imaging. Nature Reviews Physics 2022, 5, 25–42. [Google Scholar] [CrossRef]
  77. Manduca, A.; Bayly, P. V.; Ehman, R.L.; Kolipaka, A.; Royston, T.J.; Sack, I.; Sinkus, R.; Van Beers, B.E. MR Elastography: Principles, Guidelines, and Terminology. Magn Reson Med 2021, 85, 2377–2390. [Google Scholar] [CrossRef]
  78. Feng, Y.; Murphy, M.C.; Hojo, E.; Li, F.; Roberts, N. Magnetic Resonance Elastography in the Study of Neurodegenerative Diseases. Journal of Magnetic Resonance Imaging 2024, 59, 82–96. [Google Scholar] [CrossRef] [PubMed]
  79. Seyedpour, S.M.; Nabati, M.; Lambers, L.; Nafisi, S.; Tautenhahn, H.-M.; Sack, I.; Reichenbach, J.R.; Ricken, T. Application of Magnetic Resonance Imaging in Liver Biomechanics: A Systematic Review. Front Physiol 2021, 12. [Google Scholar] [CrossRef]
  80. Sun, P.; Wang, D. Comparison of Damping Parameters Based on the Half-Power Bandwidth Methods of Viscous and Hysteretic Damping Models. Journal of Vibration and Control 2023, 29, 968–979. [Google Scholar] [CrossRef]
  81. Nashif, A.D.; Jones, D.I.G.; Henderson, J.P. Vibration Damping; Wiley: New York, 1985. [Google Scholar]
  82. Islam, M.R.; Virag, J.; Oyen, M.L. Micromechanical Poroelastic and Viscoelastic Properties of Ex-Vivo Soft Tissues. J Biomech 2020, 113, 110090. [Google Scholar] [CrossRef]
  83. Roeder, R.K. Mechanical Characterization of Biomaterials. In Characterization of Biomaterials; Bandyopadhyay, A., Bose, S., Eds.; Elsevier: Oxford, 2013; pp. 49–104. ISBN 978-0-12-415800-9. [Google Scholar]
  84. Parker, K.J.; Szabo, T.; Holm, S. Towards a Consensus on Rheological Models for Elastography in Soft Tissues. Phys Med Biol 2019, 64, 215012. [Google Scholar] [CrossRef] [PubMed]
  85. Zhou, X.; Yu, D.; Barrera, O. Mechanics Constitutive Models for Viscoelastic Solid Materials: Development and a Critical Review. In; 2023; pp. 189–321.
  86. Song, J.; Holten-Andersen, N.; McKinley, G.H. Non-Maxwellian Viscoelastic Stress Relaxations in Soft Matter. Soft Matter 2023, 19, 7885–7906. [Google Scholar] [CrossRef]
  87. Poul, S.S.; Ormachea, J.; Ge, G.R.; Parker, K.J. Comprehensive Experimental Assessments of Rheological Models’ Performance in Elastography of Soft Tissues. Acta Biomater 2022, 146, 259–273. [Google Scholar] [CrossRef] [PubMed]
  88. Koruk, H. Identification, Modelling and Optimisation of Structures with Passive Damping Treatments, PhD Thesis, Istanbul Technical University, 2013.
  89. Monkova, K.; Vasina, M.; Zaludek, M.; Monka, P.P.; Tkac, J. Mechanical Vibration Damping and Compression Properties of a Lattice Structure. Materials 2021, 14, 1502. [Google Scholar] [CrossRef] [PubMed]
  90. Koruk, H.; Sanliturk, K.Y. Damping Uncertainty Due to Noise and Exponential Windowing. J Sound Vib 2011, 330, 5690–5706. [Google Scholar] [CrossRef]
  91. Jia, Y. Review of Nonlinear Vibration Energy Harvesting: Duffing, Bistability, Parametric, Stochastic and Others. J Intell Mater Syst Struct 2020, 31, 921–944. [Google Scholar] [CrossRef]
  92. Ewins, D.J. Modal Testing: Theory, Practice and Application; Second Edi.; Research Studies Press Ltd.: Somerset, England, 2009. [Google Scholar]
  93. Liu, Q.; Wang, Y.; Sun, P.; Wang, D. Comparative Analysis of Viscous Damping Model and Hysteretic Damping Model. Applied Sciences 2022, 12, 12107. [Google Scholar] [CrossRef]
  94. Sharma, S.; Shankar, V.; Joshi, Y.M. Viscoelasticity and Rheological Hysteresis. J Rheol (N Y N Y) 2023, 67, 139–155. [Google Scholar] [CrossRef]
  95. Chen, Z.; Zhong, X.; Shi, J.; Zhang, X. Damping-Enabling Technologies for Broadband Control of Piezo-Stages: A Survey. Annu Rev Control 2021, 52, 120–134. [Google Scholar] [CrossRef]
  96. Zhang, J.; Perez, R.J.; Lavernia, E.J. Documentation of Damping Capacity of Metallic, Ceramic and Metal-Matrix Composite Materials. J Mater Sci 1993, 28, 2395–2404. [Google Scholar] [CrossRef]
  97. Gröhlich, M.; Lang, A.; Böswald, M.; Meier, J. Viscoelastic Damping Design – Thermal Impact on a Constrained Layer Damping Treatment. Mater Des 2021, 207, 109885. [Google Scholar] [CrossRef]
  98. Zhang, B.; Li, Z.; Wu, H.; Nie, J. Research on Damping Performance and Strength of the Composite Laminate. Sci Rep 2021, 11, 18281. [Google Scholar] [CrossRef] [PubMed]
  99. Wu, B.; Liu, W.; Wu, X. A Damping Estimation Method Based on Power Ratio. Archive of Applied Mechanics 2018, 88, 1919–1927. [Google Scholar] [CrossRef]
  100. Arvinda Pandian, C.K.; Siddhi Jailani, H. Investigation of Viscoelastic Attributes and Vibrational Characteristics of Natural Fabrics-Incorporated Hybrid Laminate Beams. Polymer Bulletin 2018, 75, 1997–2014. [Google Scholar] [CrossRef]
  101. Lee, E.-T.; Hong, Y.-S.; Eun, H.-C. Prediction of the Physical Properties of a Structural Member by the Impact Hammer Test. Sensors 2022, 22, 6762. [Google Scholar] [CrossRef] [PubMed]
  102. Koruk, H.; Saygili, Y.; Genc, G.; Sanliturk, K.Y. Identification of the Elastic and Damping Properties of Jute and Luffa Fiber-Reinforced Biocomposites. In Advances in Bio-Based Fiber; Rangappa, S.M., Puttegowda, M., Parameswaranpillai, J., Siengchin, S., Gorbatyuk, S.B.T., Eds.; Elsevier, 2022; pp. 447–473 ISBN 978-0-12-824543-9.
  103. Kiasat, Sh.; Nobari, A.S.; Filippi, M.; Carrera, E. Characterization of Viscoelastic Damping Mechanism in a Delaminated Structure. Mech Syst Signal Process 2024, 219, 111600. [Google Scholar] [CrossRef]
  104. Shaid Sujon, M.A.; Islam, A.; Nadimpalli, V.K. Damping and Sound Absorption Properties of Polymer Matrix Composites: A Review. Polym Test 2021, 104, 107388. [Google Scholar] [CrossRef]
  105. Khandavalli, S.; Rothstein, J.P. Large Amplitude Oscillatory Shear Rheology of Three Different Shear-Thickening Particle Dispersions. Rheol Acta 2015, 54, 601–618. [Google Scholar] [CrossRef]
  106. Townsend, A.K.; Wilson, H.J. Small- and Large-Amplitude Oscillatory Rheometry with Bead–Spring Dumbbells in Stokesian Dynamics to Mimic Viscoelasticity. J Nonnewton Fluid Mech 2018, 261, 136–152. [Google Scholar] [CrossRef]
  107. Vasques, C.M.A.; Moreira, R.A.S.; Rodrigues, J. Viscoelastic Damping Technologies–Part I: Modeling and Finite Element Implementation⋆. Journal of Advanced Research in Mechanical Engineering 2010, 1. [Google Scholar]
  108. Sangroniz, L.; Fernández, M.; Santamaria, A. Polymers and Rheology: A Tale of Give and Take. Polymer (Guildf) 2023, 271, 125811. [Google Scholar] [CrossRef]
  109. Wilson, H.J. Lecture Notes on Linear Viscoelasticity Available online: ucl.ac.uk/~ucahhwi/GM05/.
  110. Jamburidze, A.; De Corato, M.; Huerre, A.; Pommella, A.; Garbin, V. High-Frequency Linear Rheology of Hydrogels Probed by Ultrasound-Driven Microbubble Dynamics. Soft Matter 2017, 13, 3946–3953. [Google Scholar] [CrossRef]
  111. COMSOL Documentation - Mechanical Damping and Losses Available online: https://doc.comsol.com/6.2/doc/com.comsol.help.sme/sme_ug_modeling.05.092.html.
  112. Liu, X.; Feng, Q. Statistical Energy Analysis of Tire/Road Noise. In Automotive Tire Noise and Vibrations; Wang, X., Ed.; Elsevier, 2020; pp. 271–296 ISBN 978-0-12-818409-7.
  113. Petrone, G.; D’Alessandro, V.; Franco, F.; De Rosa, S. Damping Evaluation on Eco-Friendly Sandwich Panels through Reverberation Time (RT60) Measurements. Journal of Vibration and Control 2014, 21, 3328–3338. [Google Scholar] [CrossRef]
  114. Vergassola, G.; Boote, D.; Tonelli, A. On the Damping Loss Factor of Viscoelastic Materials for Naval Applications. Ships and Offshore Structures 2018, 13, 466–475. [Google Scholar] [CrossRef]
  115. Nering, K. Damping Problem of Numerical Simulation of Structural Reverberation Time. IOP Conf Ser Mater Sci Eng 2020, 960, 042083. [Google Scholar] [CrossRef]
  116. Bolton, W. System Response. In Instrumentation and Control Systems; Bolton, W., Ed.; Elsevier, 2021; pp. 227–256 ISBN 978-0-12-823471-6.
  117. Adhikari, S. Structural Dynamic Analysis with Generalized Damping Models: Analysis; John Wiley & Sons. 2013. [Google Scholar]
  118. ADHIKARI, S.; WOODHOUSE, J. IDENTIFICATION OF DAMPING: PART 1, VISCOUS DAMPING. J Sound Vib 2001, 243, 43–61. [Google Scholar] [CrossRef]
  119. Liu, M.; Gorman, D.G. Formulation of Rayleigh Damping and Its Extensions. Comput Struct 1995, 57, 277–285. [Google Scholar] [CrossRef]
  120. SOLIDWORKS Documentation - Dynamic Analysis Available online: https://help.solidworks.com/2016/english/SolidWorks/cworks/c_Rayleigh_Damping.htm.
  121. Zhang, W.; Taciroglu, E. A Novel Rayleigh-Type Viscoelastic Perfectly-Matched-Layer for Wave Propagation Analysis: Formulation, Implementation and Application. Comput Methods Appl Mech Eng 2021, 383, 113913. [Google Scholar] [CrossRef]
  122. Khan, N.U.; Babu, P.B. The Material Damping as Rayleigh Damping in the Vibrations of Square and Rectangular Metalic Plates. In Proceedings of the 2018 Advances in Science and Engineering Technology International Conferences (ASET); IEEE, February 2018; pp. 1–6. [Google Scholar]
  123. Sun, J.; Wu, Y.; Xi, X.; Zhang, Y.; Wu, X. Analysis of the Damping Characteristics of Cylindrical Resonators Influenced by Piezoelectric Electrodes. Sensors 2017, 17, 1017. [Google Scholar] [CrossRef] [PubMed]
  124. Dehghan-Niri, M.; Vasheghani-Farahani, E.; Baghaban Eslaminejad, M.; Tavakol, M.; Bagheri, F. Physicomechanical, Rheological and in Vitro Cytocompatibility Properties of the Electron Beam Irradiated Blend Hydrogels of Tyramine Conjugated Gum Tragacanth and Poly (Vinyl Alcohol). Materials Science and Engineering: C 2020, 114, 111073. [Google Scholar] [CrossRef] [PubMed]
  125. Das, R.; Kumar, A.; Patel, A.; Vijay, S.; Saurabh, S.; Kumar, N. Biomechanical Characterization of Spider Webs. J Mech Behav Biomed Mater 2017, 67, 101–109. [Google Scholar] [CrossRef] [PubMed]
  126. Bhatt, M.; Moussu, M.A.C.; Chayer, B.; Destrempes, F.; Gesnik, M.; Allard, L.; Tang, A.; Cloutier, G. Reconstruction of Viscosity Maps in Ultrasound Shear Wave Elastography. IEEE Trans Ultrason Ferroelectr Freq Control 2019, 66, 1065–1078. [Google Scholar] [CrossRef]
  127. Kazemirad, S.; Bernard, S.; Hybois, S.; Tang, A.; Cloutier, G. Ultrasound Shear Wave Viscoelastography: Model-Independent Quantification of the Complex Shear Modulus. IEEE Trans Ultrason Ferroelectr Freq Control 2016, 63, 1399–1408. [Google Scholar] [CrossRef]
  128. Budelli, E.; Brum, J.; Bernal, M.; Deffieux, T.; Tanter, M.; Lema, P.; Negreira, C.; Gennisson, J.-L. A Diffraction Correction for Storage and Loss Moduli Imaging Using Radiation Force Based Elastography. Phys Med Biol 2017, 62, 91–106. [Google Scholar] [CrossRef] [PubMed]
  129. Osika, M.; Kijanka, P. Ultrasound Shear Wave Propagation Modeling in General Tissue–Like Viscoelastic Materials. Ultrasound Med Biol 2024. [CrossRef] [PubMed]
  130. Reiter, R.; Shahryari, M.; Tzschätzsch, H.; Haas, M.; Bayerl, C.; Siegmund, B.; Hamm, B.; Asbach, P.; Braun, J.; Sack, I. Influence of Fibrosis Progression on the Viscous Properties of in Vivo Liver Tissue Elucidated by Shear Wave Dispersion in Multifrequency MR Elastography. J Mech Behav Biomed Mater 2021, 121, 104645. [Google Scholar] [CrossRef] [PubMed]
  131. Majumdar, S.; Klatt, D. Longitudinal Study of Sub-regional Cerebral Viscoelastic Properties of 5XFAD Alzheimer’s Disease Mice Using Multifrequency MR Elastography. Magn Reson Med 2021, 86, 405–414. [Google Scholar] [CrossRef]
Figure 1. The cyclic stress-strain versus time plots for the classical elastic (a), viscous (b), and viscoelastic (c) materials.
Preprints 115065 g001
Figure 2. Viscously damped SDOF system (a), and SDOF system with a complex stiffness (b).
Preprints 115065 g002
Figure 3. The force-displacement and stress-strain relationship for a purely elastic material (a and c), and a viscoelastic material (b and d) under harmonic loading.
Preprints 115065 g003
Figure 4. A typical free vibration response of a viscously damped SDOF system and the logarithmic decay.
Preprints 115065 g004
Figure 5. The real viscous damping ratio calculated using Equation (57) and the approximate viscous damping ratio calculated using Equation (58) as a function of the amplitude ratio (a), and the logarithmic decrement (b), and the percentage difference as a function of the amplitude ratio (c), and the logarithmic decrement (d).
Preprints 115065 g005
Figure 6. The illustration for the procedure for the use of half-power bandwidth for the identification of damping.
Preprints 115065 g006
Figure 7. The relationship between the half-power bandwidth and the viscous damping ratio calculated using Equations (59-61).
Preprints 115065 g007
Figure 8. The relationship between the half-power bandwidth and the loss factor calculated using Equations (62) and (63).
Preprints 115065 g008
Figure 9. The relationship between viscous damping ratio and loss factor calculated using Equations (70) and (71).
Preprints 115065 g009
Figure 10. Illustration of the measurement procedure of the 60 dB decay time ( T 60   d B )
Preprints 115065 g010
Figure 11. The typical step response of a viscously damped SDOF system.
Preprints 115065 g011
Table 1. The definitions of common damping parameters.
Preprints 115065 i001
Table 2. The important damping parameters measured in practical applications and their relations to other important damping parameters.
Preprints 115065 i002
Disclaimer/Publisher’s Note: The statements, opinions and data contained in all publications are solely those of the individual author(s) and contributor(s) and not of MDPI and/or the editor(s). MDPI and/or the editor(s) disclaim responsibility for any injury to people or property resulting from any ideas, methods, instructions or products referred to in the content.
Copyright: This open access article is published under a Creative Commons CC BY 4.0 license, which permit the free download, distribution, and reuse, provided that the author and preprint are cited in any reuse.
Prerpints.org logo

Preprints.org is a free preprint server supported by MDPI in Basel, Switzerland.

Subscribe

© 2024 MDPI (Basel, Switzerland) unless otherwise stated