1. Introduction
G protein-coupled receptors (GPCRs) are membrane proteins involved in cellular signalling and various physiological processes. They interact with transducers such as G proteins, GPCR kinases (GRKs), and arrestins, leading to specific intracellular signalling pathways and functional outcomes. GPCRs are extensively studied for their therapeutic potential as they mediate the effects of many human hormones and drugs . Endocannabinoid receptor one (CB
1) and endocannabinoid receptor two (CB
2) hold particular significance within this family. CB
1 receptors are ubiquitous in the body but are predominantly expressed in the central nervous system (CNS) while CB
2 receptors are mainly located in immune cells and peripheral tissues [
2,
3]. In addition, the distinct locations of these receptors explain why cannabinoids have such diverse effects on the body. The discovery of endocannabinoid receptors (CBR) has shed light on the endocannabinoid system (ECS), a complex signalling network involved in various physiological functions, such as pain modulation, immune response, appetite regulation, and mood control [
4,
5,
6]. Furthermore, the activation of endocannabinoid receptors (CBRs) has been associated in the therapeutic management of various medical conditions, including cancer, anxiety disorders, chronic pain, neurodegenerative diseases, and other health complications [
7,
8,
9].
The dynamic behaviour GPCRs is essential for their biological function in cell signalling. These receptors located in the cell membrane, act as intricate molecular switches that toggle between active and inactive conformations in response to ligand binding which is a fundamental aspect of their role in signal transduction These changes are crucial for activating intracellular G-proteins, which cause a signal cascade inside the cell, leading to varied physiological responses. For example, when CB
1, binds to its endogenous ligand anandamide, it undergoes a structural change that enables it to activate an associated G-protein. The activated G-protein trimer then dissociates into subunits, which can inhibit adenylate cyclase activity, leading to decreased levels of the second messenger cAMP [
11,
12]. This cascade modulates neurotransmitter release, affecting physiological processes such as pain sensation, appetite, and memory. Similarly, the CB
2 receptor, when engaged by a cannabinoid such as CBD, can influence immune cell behaviour, potentially reducing inflammation through its impact on G-protein signalling pathway Ligands that act as agonists stabilise the receptor in its active conformation, enhancing signalling. Conversely, inverse agonists stabilise the receptor in its inactive state, dampening signalling [
10,
14]. CBRs are naturally activated by endogenous cannabinoids called N-arachidonoylethanolamide (AEA, anandamide) and 2-arachidonoylglycerol (2-AG) These lipid-based neurotransmitters are naturally produced in the body and initiate a cascade of intracellular signalling events involved in maintaining homeostasis and regulating various physiological processes. Due to the extensive range of physiological effects CBRs modulate, an in-depth understanding of the structure, function, and dynamics of CBRs is essential for developing cannabinoid-based therapeutics, as these receptors serve as key targets for exogenous phytocannabinoids derived from the
Cannabis sativa L. plant, including D
9-tetrahydrocannabinol (D
9-THC) and cannabidiol (CBD) [
16,
17]. The interaction of CBRs with phytocannabinoids can lead to various therapeutic effects, such as pain relief, anti-inflammation, and modulation of mood and appetites. Additionally, synthetic cannabinoids are also being developed to enhance their potency and effects to CBRs
Presently, considerable progress has been made in the fields of computational biology and molecular modelling, leading to a deeper understanding of the sequence and 3D structures of CBRs. The availability of crystal structures and computational models has paved the way for structure-based drug discovery, rational drug design, and virtual screening approaches, thereby aiding in the identification of novel ligands with enhanced specificity and efficacy [
19,
20]. Currently, several crystal structures of CBRs have been identified, providing valuable insights into their 3D conformations . The first crystal structure of a CB
1 receptor was determined in 2016 using X-ray crystallography, while the first crystal structure of a CB
2 receptor was resolved in 2018 [
22,
23]. To date, multiple crystal structures, with co-crystal ligands, of both CBRs have been reported, contributing to our understanding of their ligand-binding sites and functional mechanisms.
To computationally study the effects of natural and modified phytocannabinoids on CBRs, it is essential to develop a comprehensive computational system. This involves accurately representing the receptor structure in various states, optimising ligand parameters, and validating simulation protocols Once established and validated, these systems provide a foundation for investigating the effects of various protein interactions, thereby allowing researchers to simulate and understand how different cannabinoids and their synthetic variants interact with the receptors at a molecular level. Molecular modelling methods, such as molecular docking and molecular dynamics (MD) simulations, are essential for understanding receptor-ligand interactions and predicting functional and dynamic behaviour of receptor-ligand complexes based on the structural dynamics of the protein with the passage of time. Molecular docking aids in identifying key interactions and potential binding sites, contributing to the understanding of binding modes and affinities of ligands such as phytocannabinoids from
Cannabis to CBRs Additionally, MD simulations allow studying the dynamic behaviour of the receptor-ligand complex over time By simulating the motion and interactions of atoms within the system, MD simulations can provide insights into the stability, flexibility, and conformational changes of the complex [
27,
28]. This understanding can lead to the design of new compounds with tailored properties, enhancing therapeutic benefits and reducing side effects. Additionally, these computational models expedite the development of new medications that can target specific receptor states, thus opening possibilities for personalised medicine and more effective treatment strategies for a variety of conditions.
For this study, analyses were conducted on CB
1 and CB
2 receptors obtained from the Research Collaboratory for Structural Bioinformatics: Protein Data Bank (RCSB: PDB) where the crystal structures were deposited by the X-ray crystallographers [
27,
29,
30]. Currently, the crystal structure of the CB
1 receptor (PDB ID: 5U09) stands as the model with the best resolution of 2.6 Å available on UniProtKB database This structure was obtained by X-ray diffraction and can be used for cannabinoid research due to strategic modifications that preserve its functional integrity while facilitating the lipidic cubic phase crystallisation process. These alterations do not affect the receptor as they ensure that the receptor active site and binding domains remains unchanged, providing a reliable framework for examining cannabinoid interactions and their potential therapeutic applications. First, the N-terminal was truncated, and the third intracellular loop (ICL3) was replaced with a thermostable PGS domain (1.8 Å), a glycogen synthase (GlgA) from
Pyrococcus abyssi. These alterations, along with the T210A mutation, were crucial for crystallisation despite lower affinity for certain agonists. The binding properties remain sufficiently intact, as shown by binding assays, and the structure maintains key aspects of the receptor that are key for interaction with ligands like CBD This makes the modified structure a reliable model for studying ligand-receptor interactions and designing new modulators for therapeutic use. The CB
2 receptor (PDB ID: 5ZTY) underwent a similar process while being crystallised by X-ray diffraction by For computational studies, this structure is valuable as it retains functional integrity despite modifications for crystallisation. The modifications include truncating a part of the N-terminus and incorporating T4 lysozyme into the ICL3. These changes do not impact receptor functionality or ligand binding, as confirmed by radioligand binding assays and receptor stabilisation showing negligible effect on affinity. Therefore, this CB
2, which holds the current best resolution (2.8 Å) on UniProtKB, is suitable for computational studies of phytocannabinoids as the empirical data support its utility in drug design and understanding receptor-ligand interactions. Due to these changes, in this study CBRs were referred to as pseudo-CBRs (p-CBRs).
This study specifically focused on exploring each p-CBRs with various ligands (NADA, CBD, FUB-MDMB/E3R, Taranabant/AM630) to enable further investigations of phytocannabinoids such as modified phytocannabinoids emerging in this fast-paced cannabis market. This comprehensive approach allowed for a deeper understanding of receptor-ligand binding behaviour and its associated dynamics. By unravelling the intricate mechanisms underlying the binding and activation of p-CBRs, novel therapeutic strategies can be developed to target these receptors and modulate their functions, potentially leading to the development of more effective and specific natural, modified, or synthetic cannabinoid-based treatments for various diseases and conditions.
2. Materials and Methods
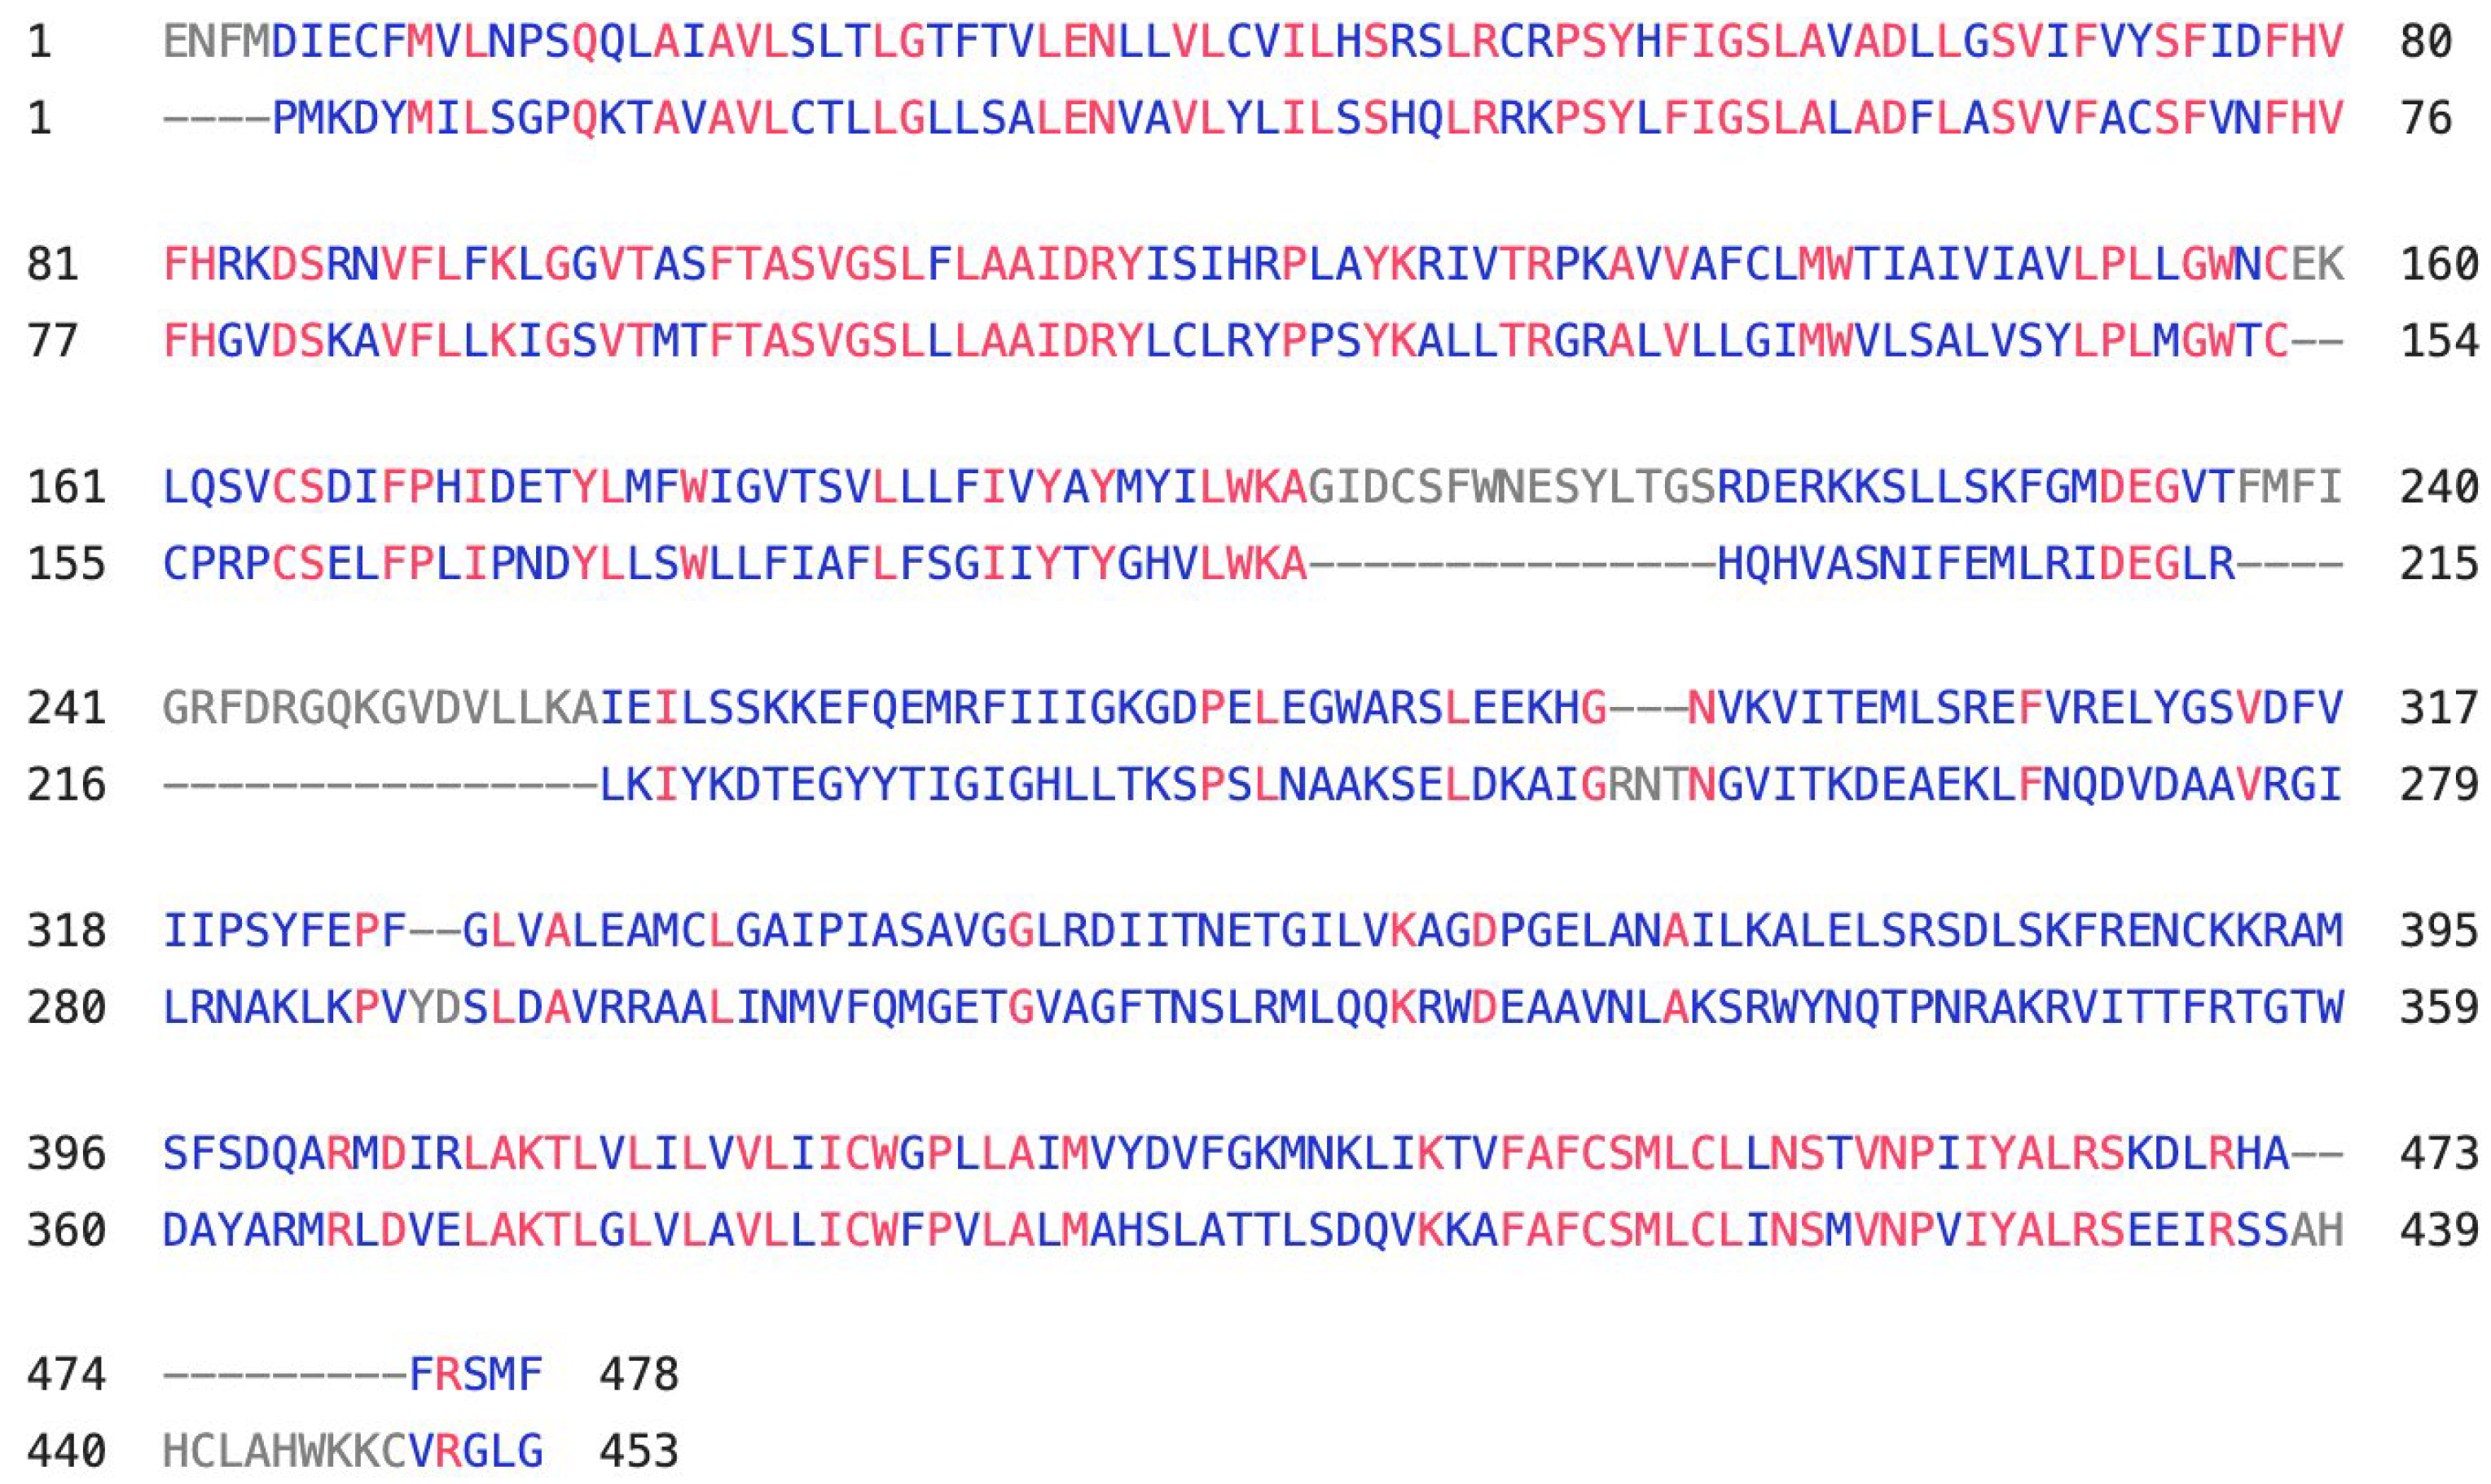
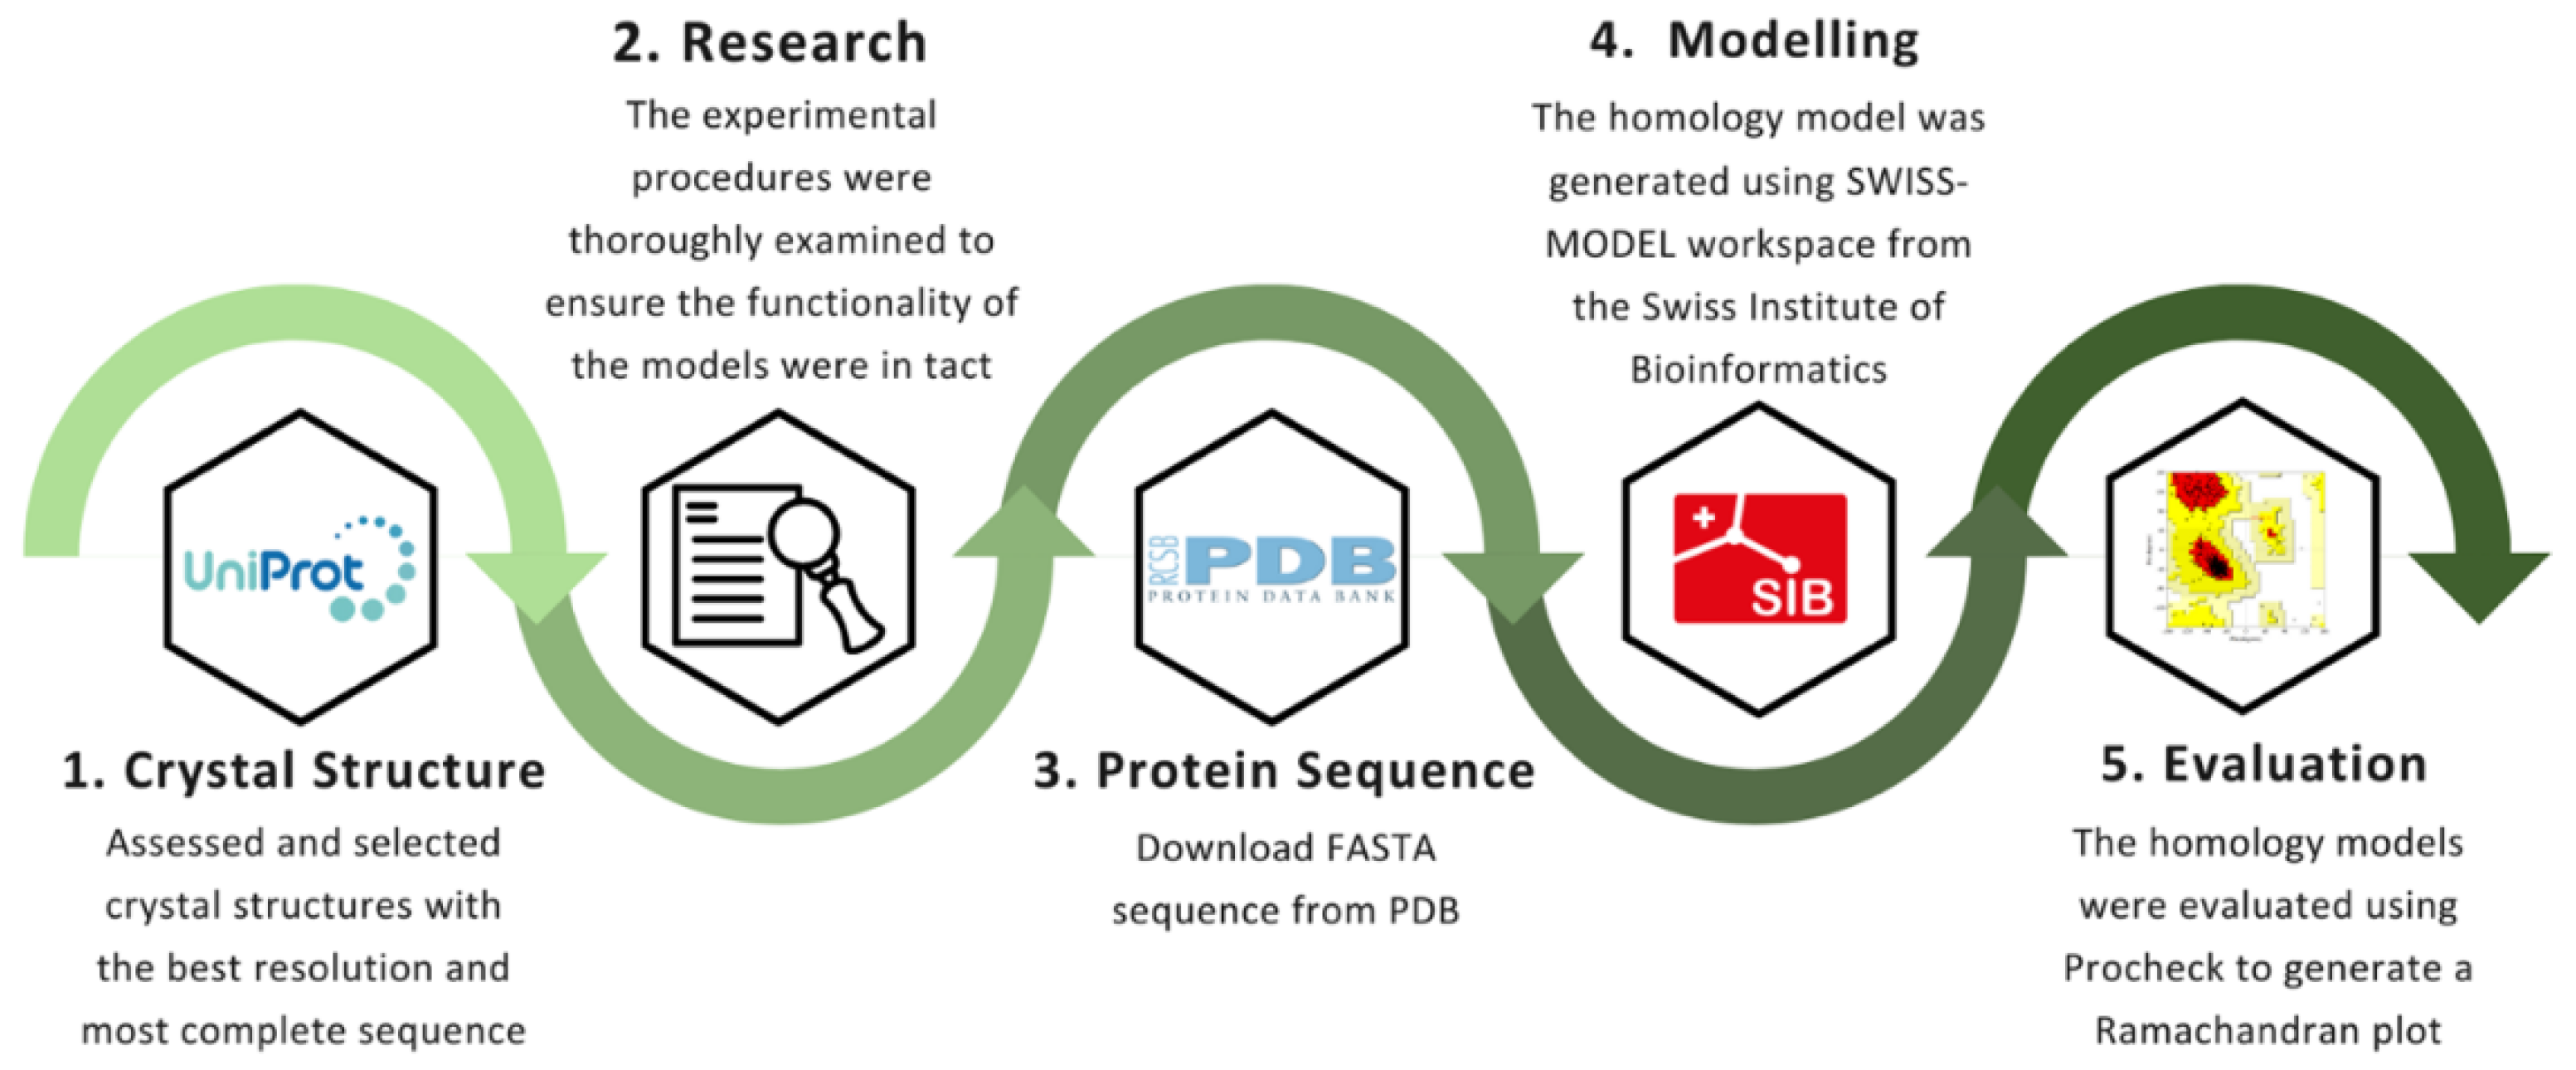
Crystal structures for CB
1 and CB
2 were first selected from the UniProtKB database (UniProtKB ID: P21554) and (UniProtKB ID: P34972) with sequences obtained from PDB (PDB ID: 5U09) and (PDB ID: 5ZTY), respectively [
23,
30] (
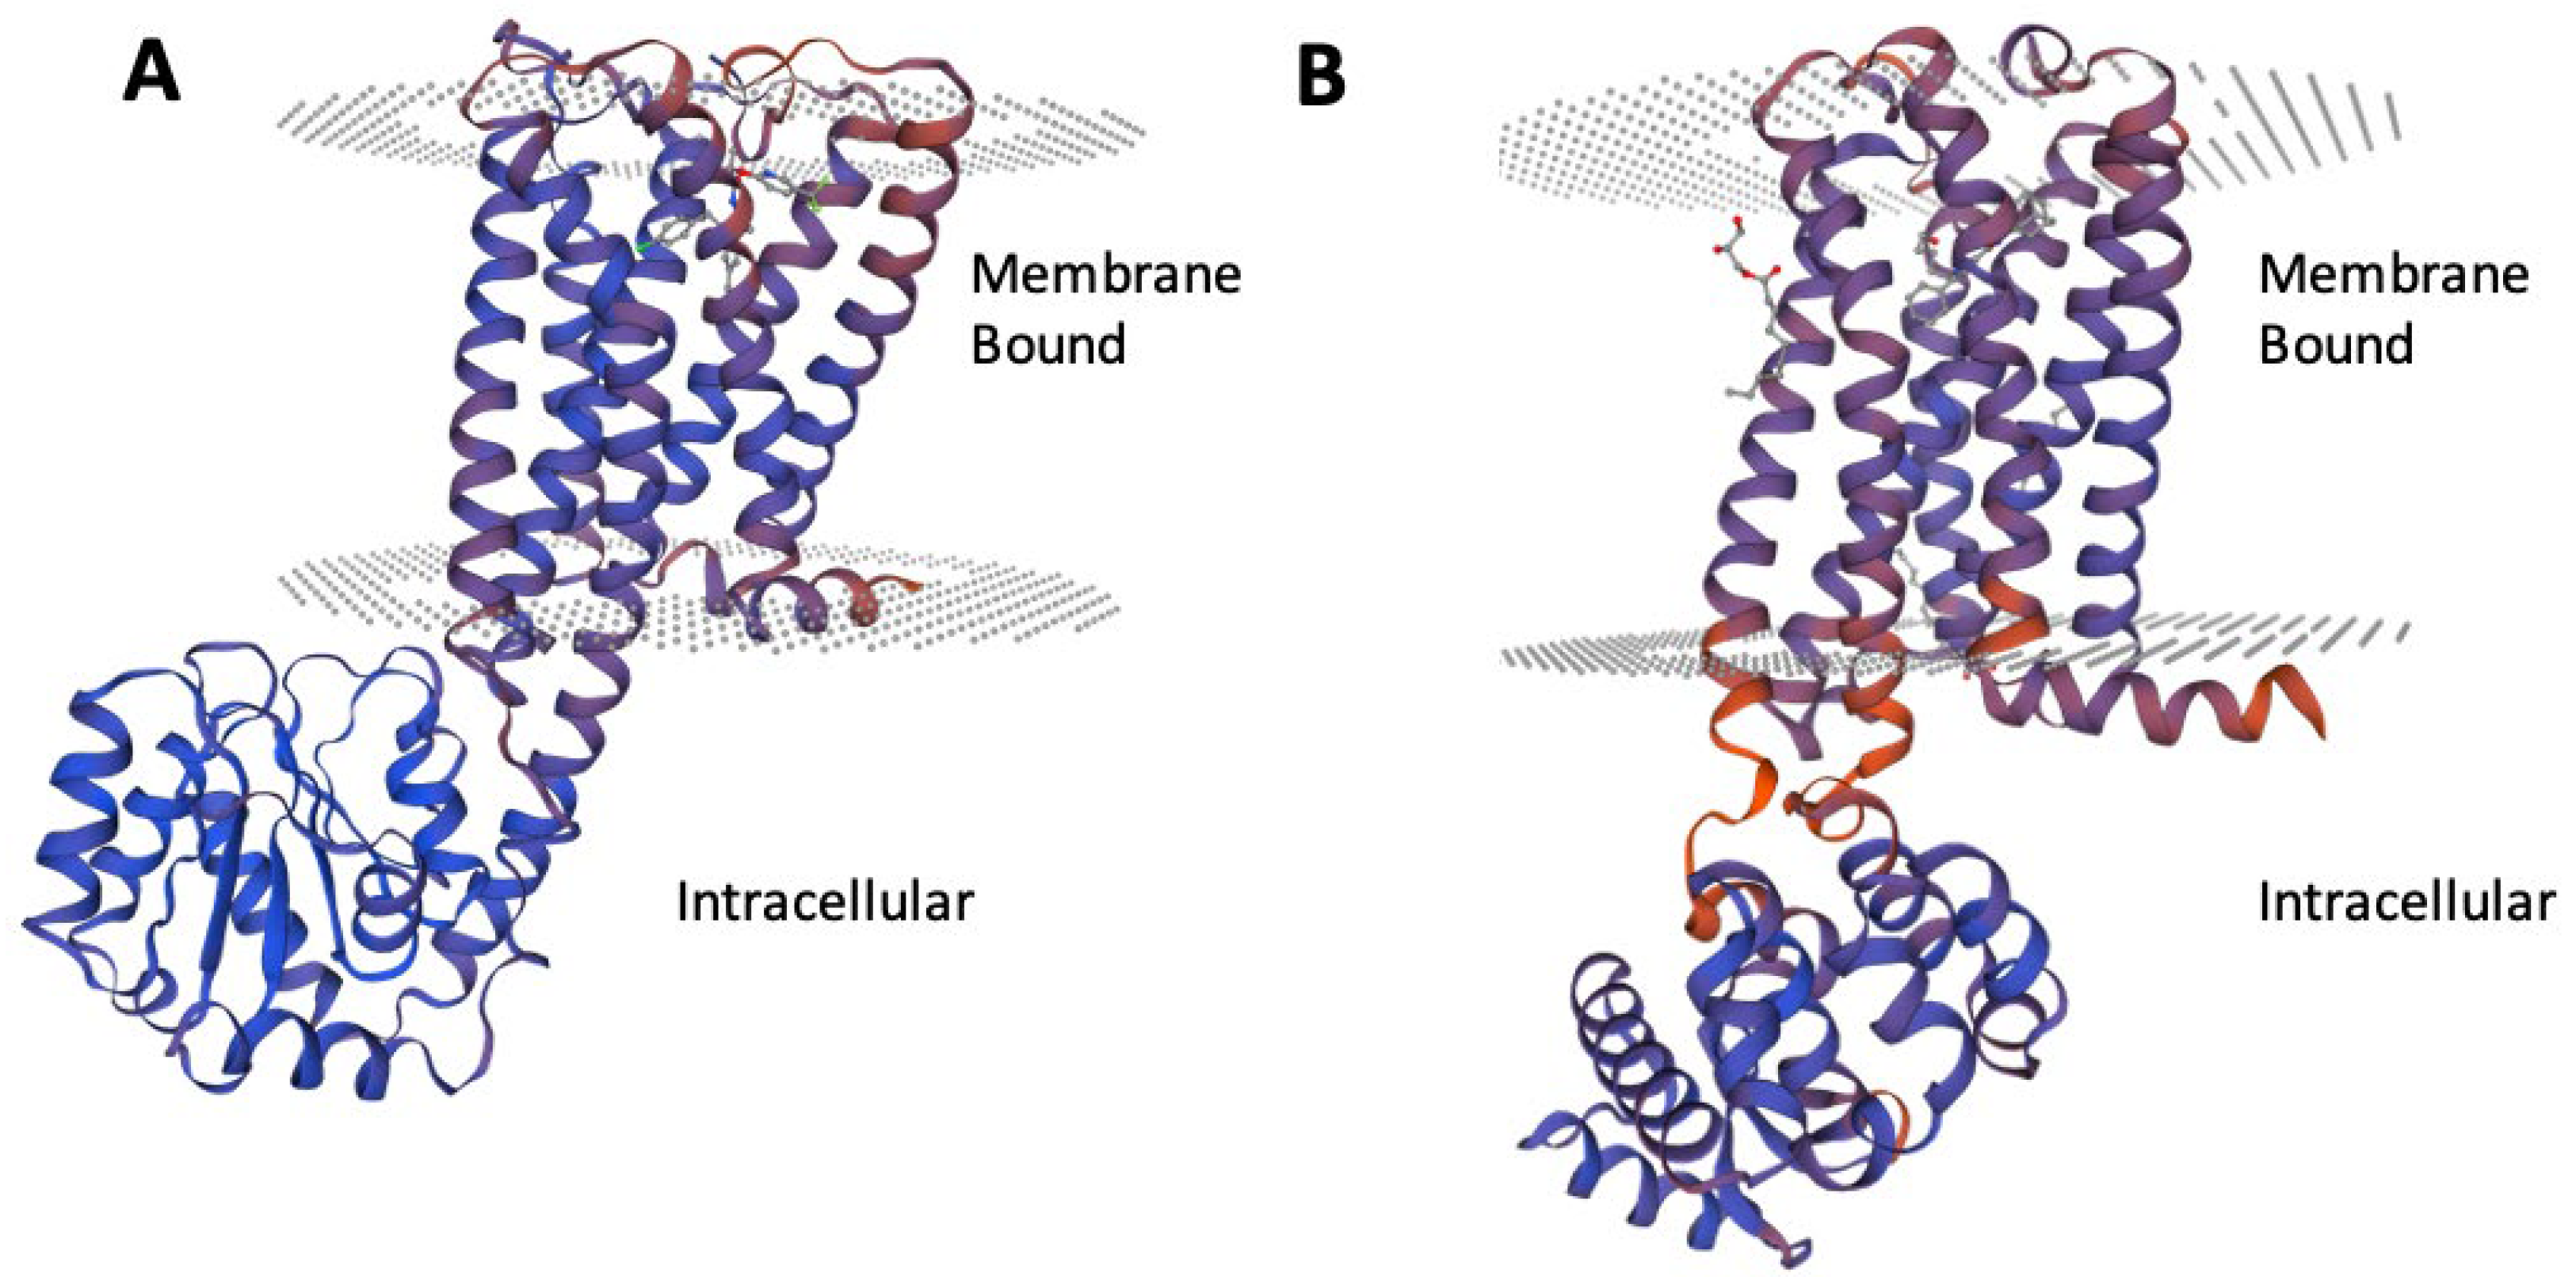
Figure 1). Homology models (
Figure 2) were generated using SWISS-MODEL to help predict structure of any missing regions , after which the p-CBRs were prepared using the Protein Preparation Wizard tool implemented in Maestro Software 13.0 Schrödinger suite Inc. . This step involved several optimisation procedures to improve the protein structures, including the addition of hydrogen atoms, filling in missing side chains using Prime, the assignment of bond orders from the conserved core domain (CCD) database, and the optimisation of side chain orientations [
33,
34]. This is conducted to enhance the accuracy of protein models for computational studies by correcting structural details not resolved in the original data. Both apo proteins were prepared for induced-fit docking (IFD) and molecular dynamics (MD) simulations. The aim of this preparation was to ensure that the protein structures were in a suitable conformation for accurate docking and simulation studies.
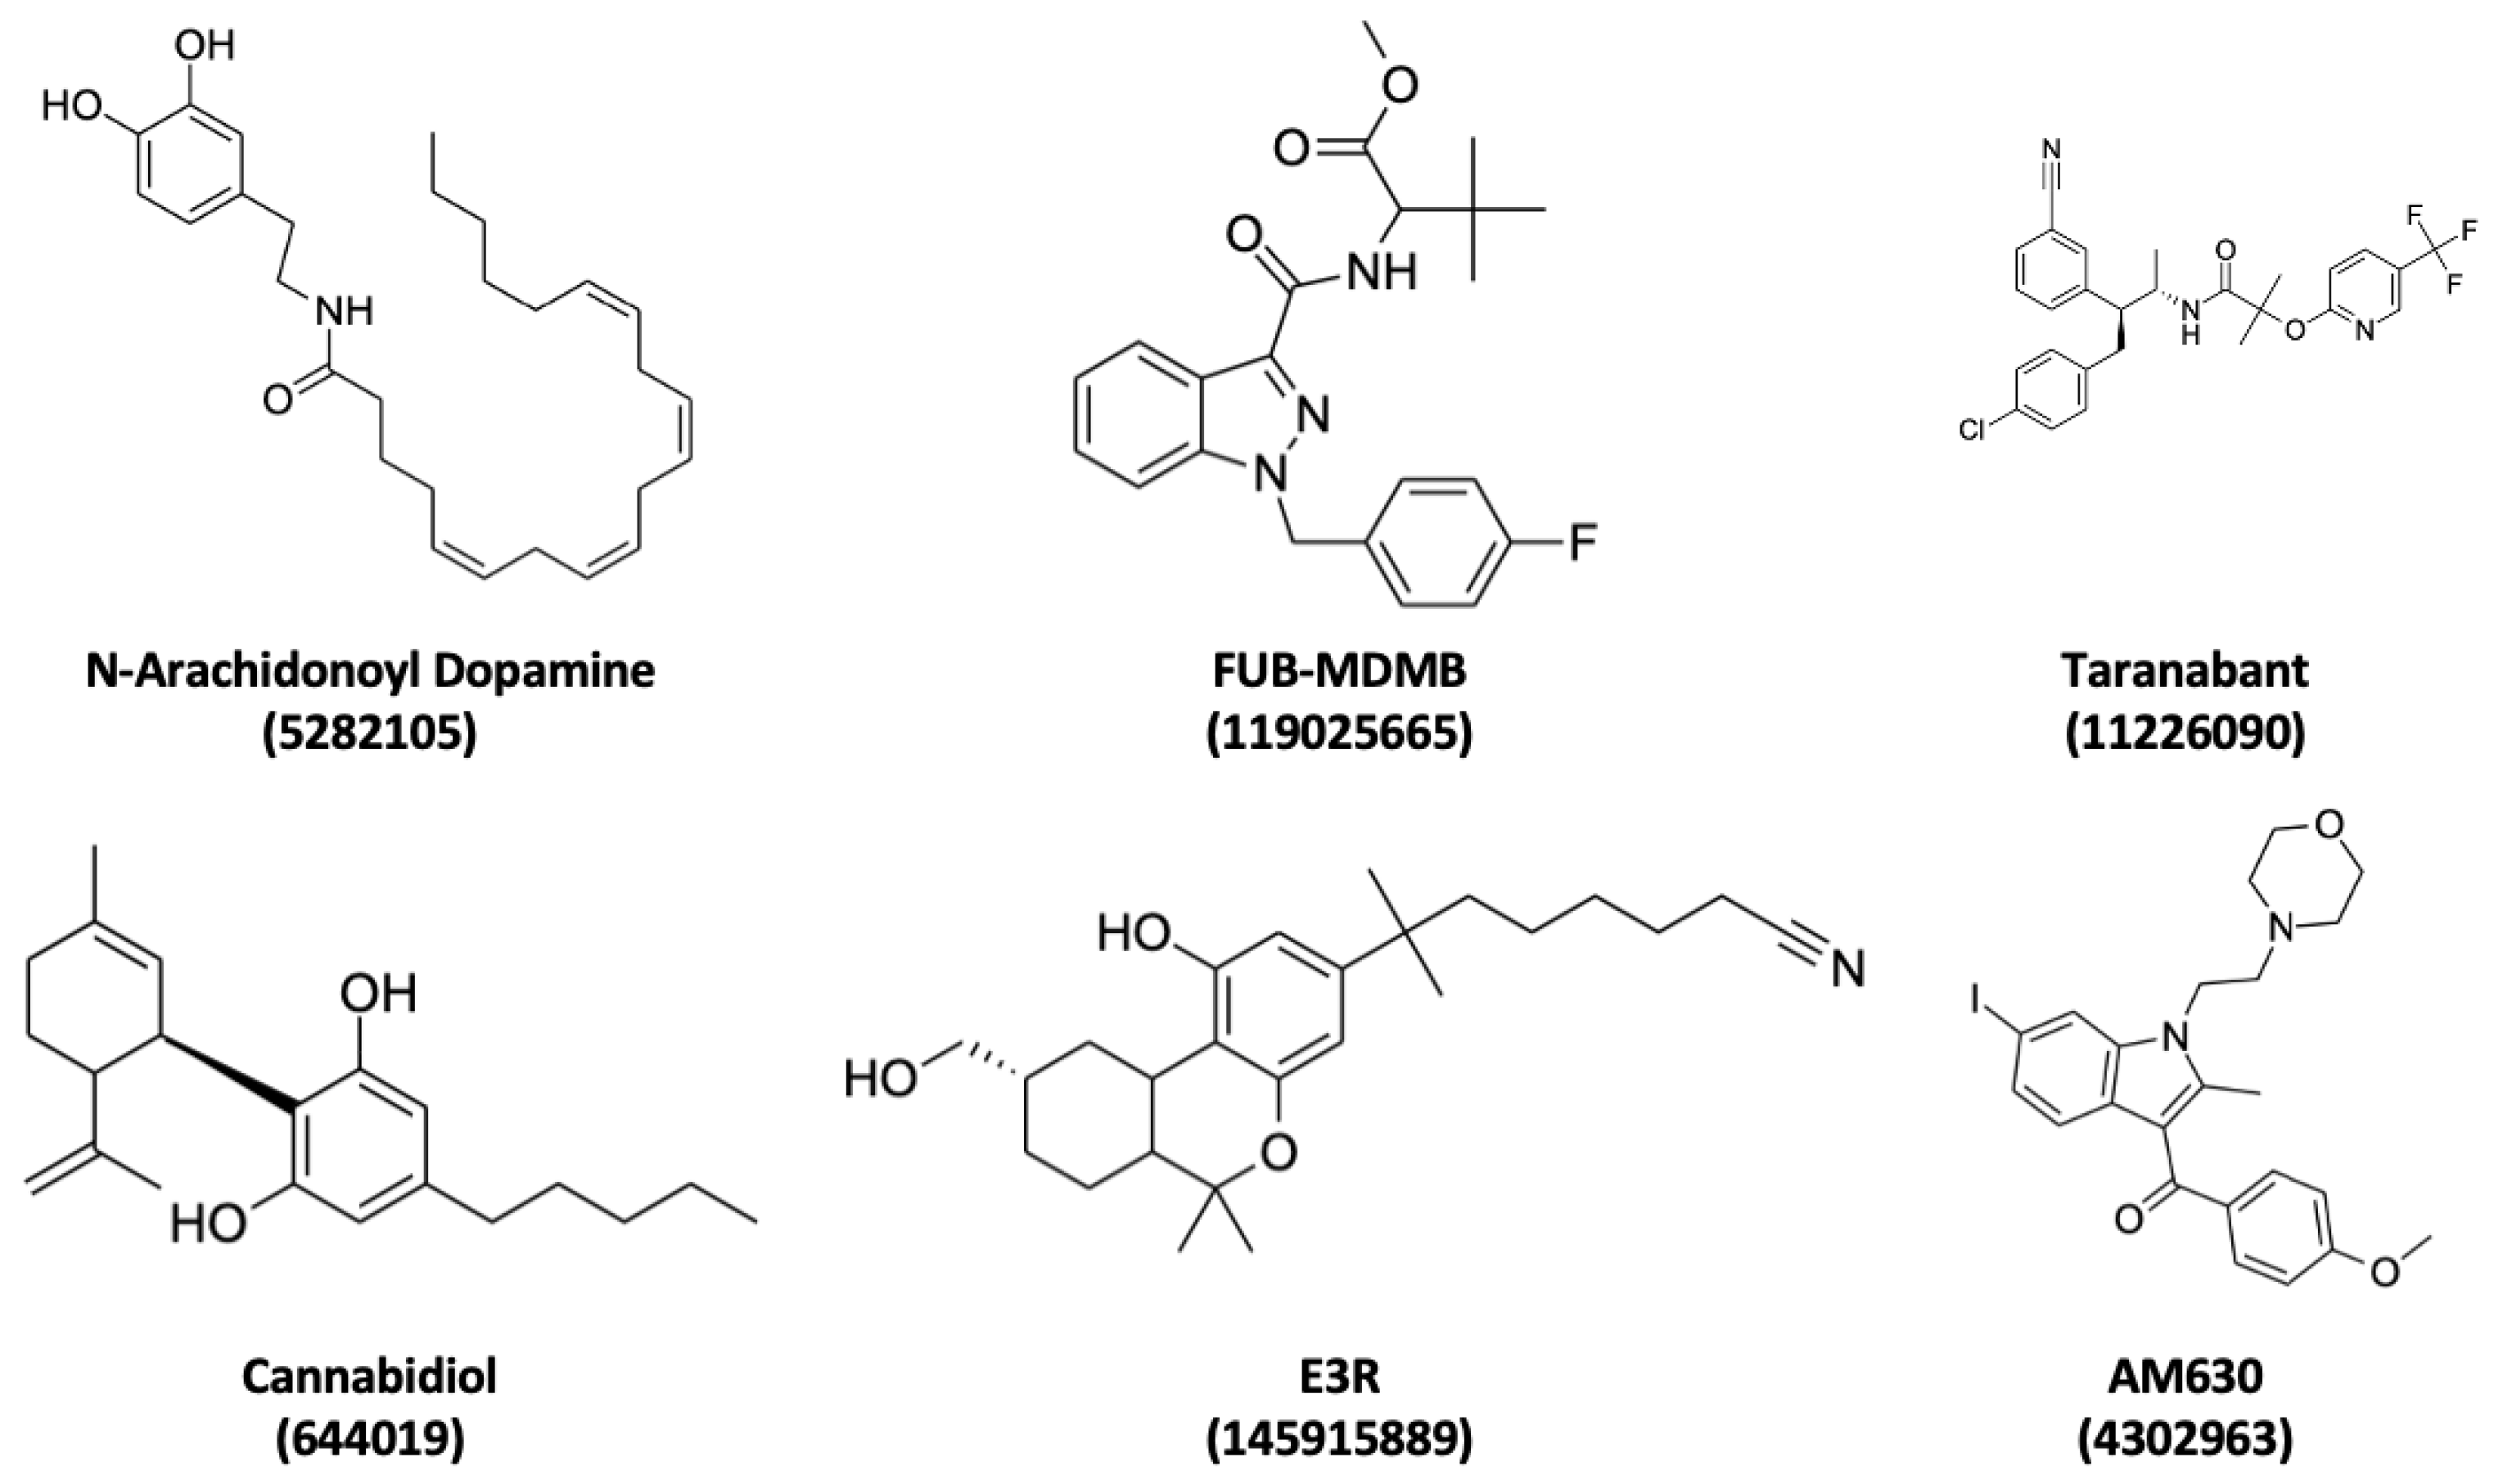
All ligands (
Figure 3) underwent preparation using the LigPrep tool implemented in Maestro using the OPLS2005 forcefield LigPrep generates tautomers and stereoisomers and low-energy conformations of the ligand while optimising ligand protonation states at physiological pH conditions of 7.0 ± 2.0 using Epik [
36,
37,
38]. This critical step was aimed at ensuring the ligands had suitable conformations for precise docking analyses.
The prepared p-CBR structures underwent IFD procedures using Schrödinger's Glide software integrated into the Maestro platform with various ligands (
Figure 3) [
39,
40,
41,
42,
43,
44,
45]. IFD is a docking technique allowing the protein's binding site to adapt flexibly to the ligand's conformation throughout the docking process. To ensure precision, the IFD box centre for each protein was strategically defined based on the residues intricately interacting with their corresponding co-crystal ligands. The complex selected for further analysis was the top conformer with the most favourable docking score, which was subsequently utilised for subsequent MD simulations.
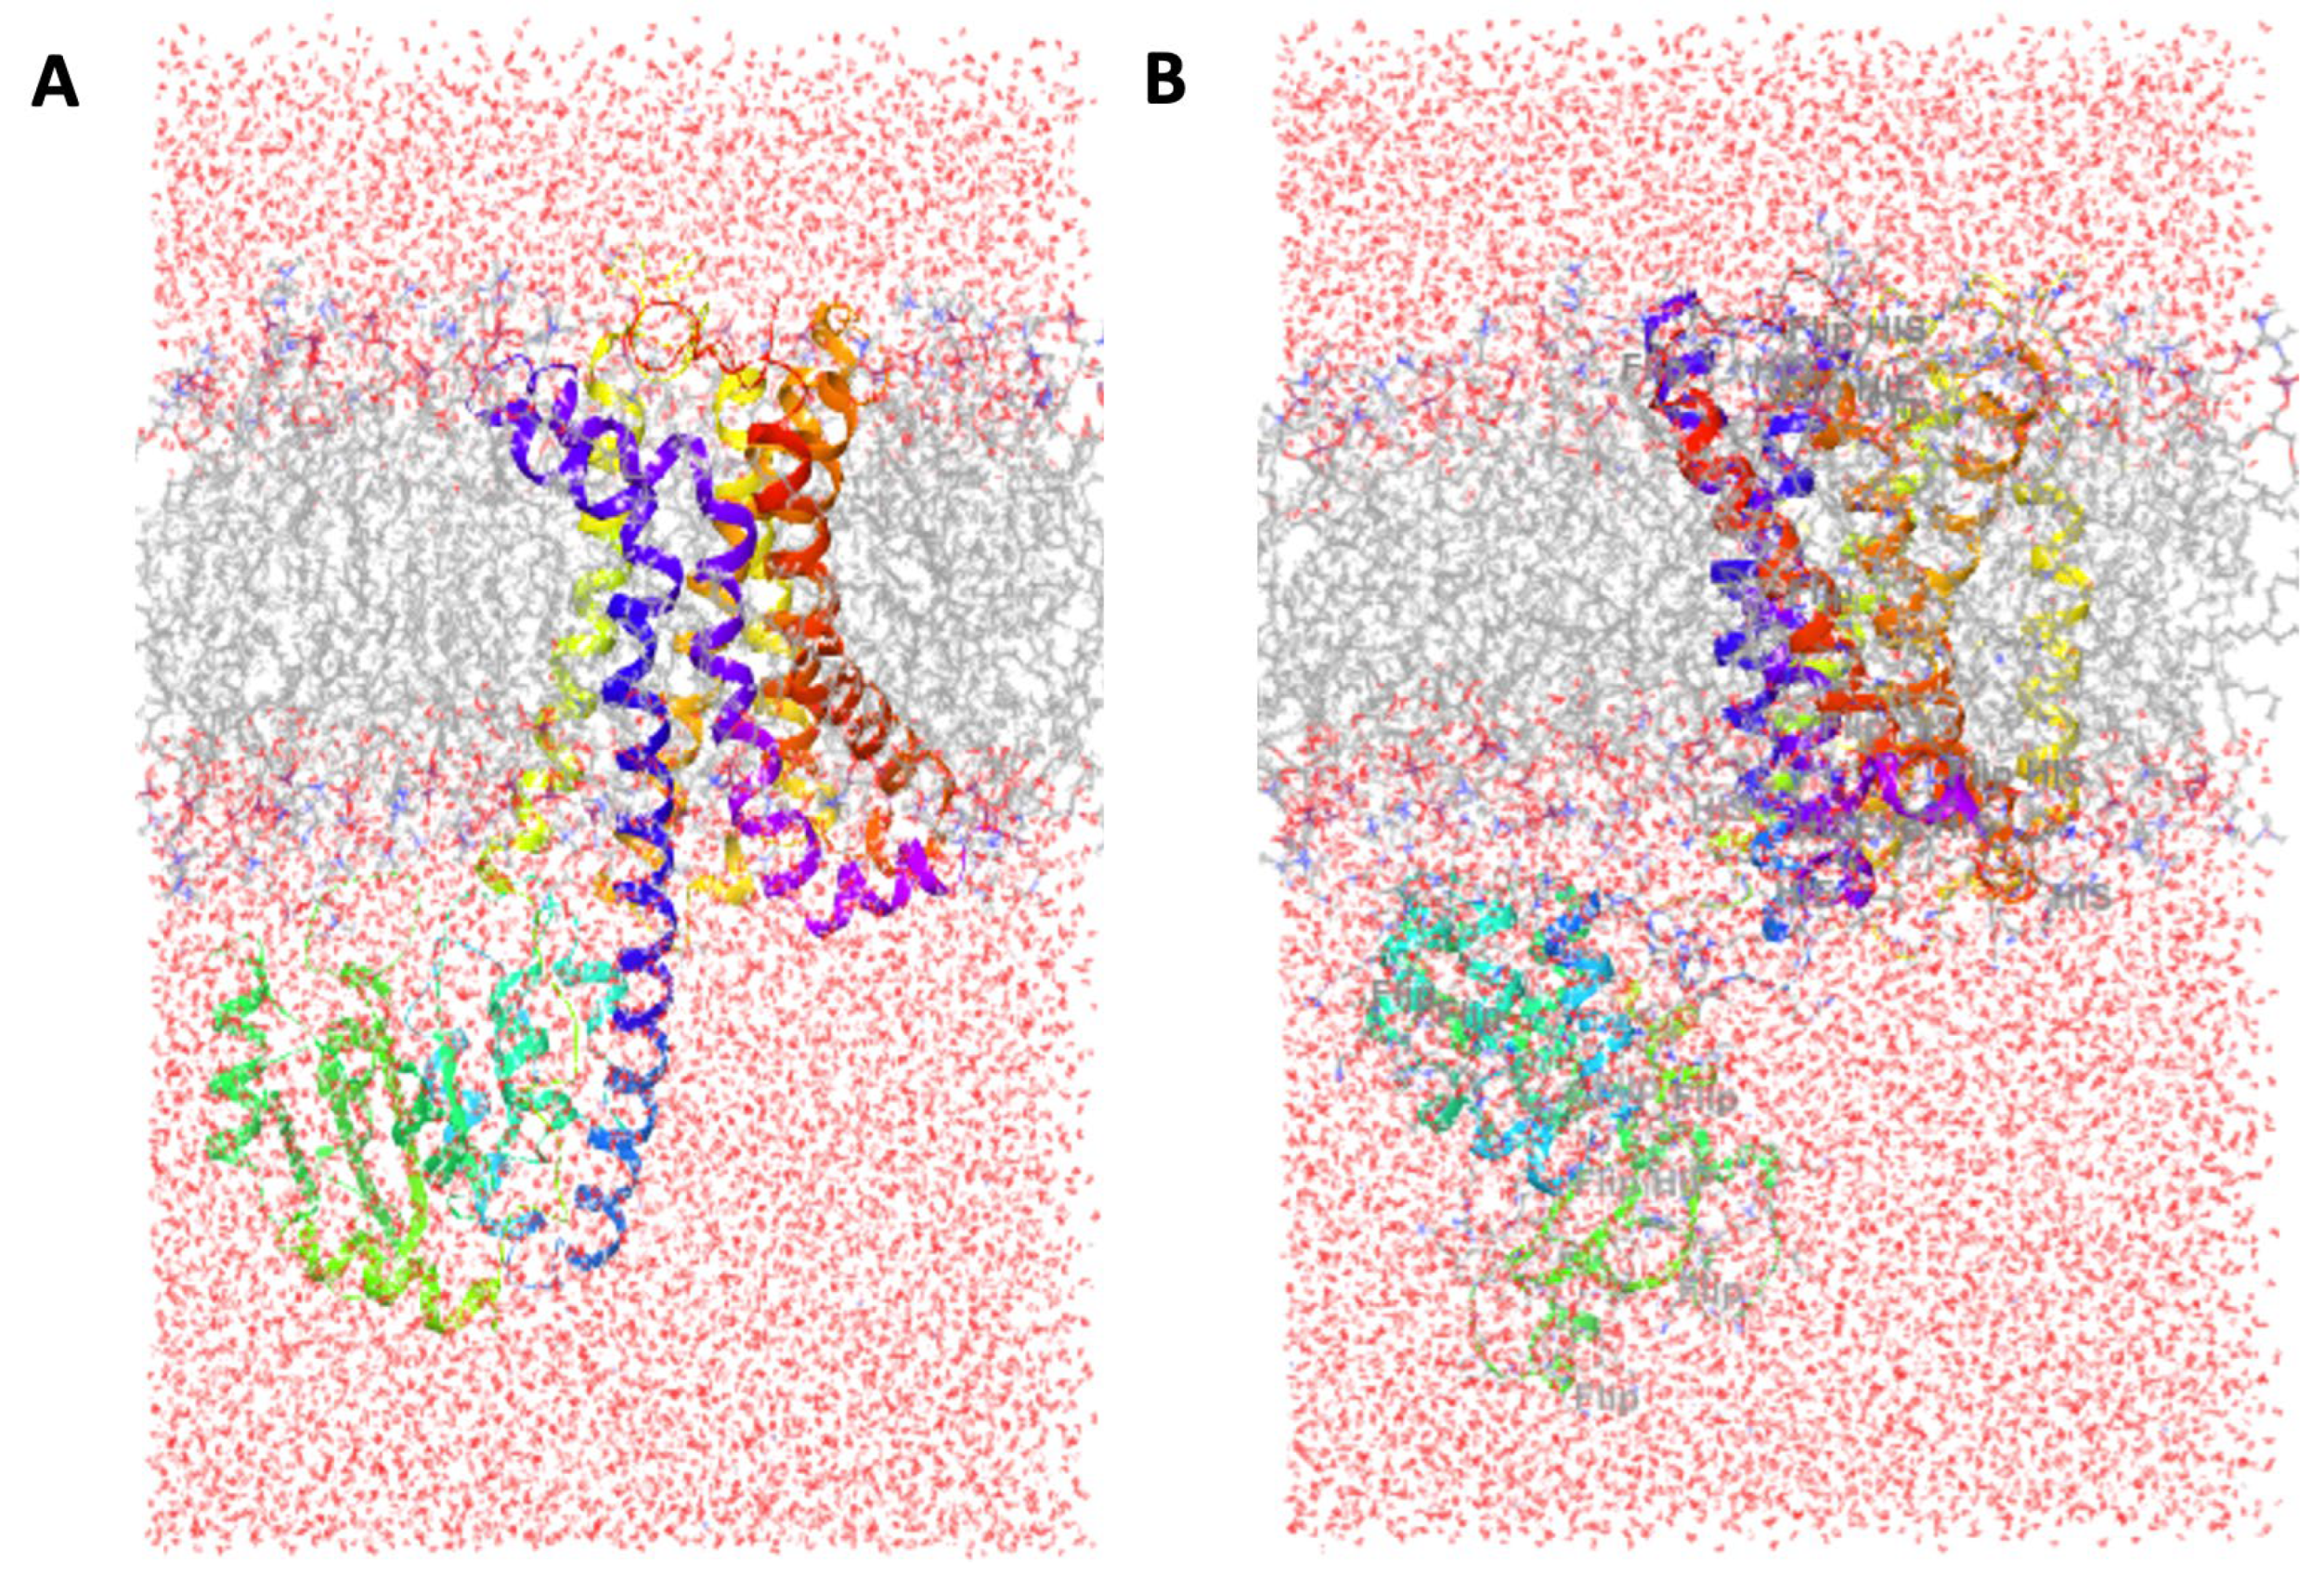
The Desmond Molecular Simulation Software System Builder tool was used to prepare a total of 10 systems for MD simulations of the p-CBRs . The protein-ligand complex for these systems are the most favourable conformations identified through IFD. Each system was constructed while being embedded in a 1-palmitoyl-2-oleoyl-sn-glycero-3-phosphocholine (POPC) lipid bilayer model, and explicit water molecules were introduced around the system using the transferable intermolecular potential with three-points (TIP3P) water model with a minimum 10 Å buffer distance (
Figure A1). To replicate physiological conditions, sodium (Na
+) and chloride (Cl
-) ions were added at a concentration of 0.15 M to neutralise the net charge of the system. This comprehensive approach aimed to establish a realistic and biologically relevant environment, facilitating the exploration of dynamic behaviours within the protein-ligand complex during MD simulations.
Desmond in Maestro was used to run all MD simulations which were 250 ns long to explore system dynamics Following the initial solvation and ionisation in an explicit solvent setup, the system proceeded through a multi-stage MD production phase. The process entailed simulation specifics across eight stages, with stages one to seven focusing on equilibration via brief simulation intervals and stage eight being the 250 ns simulation stage. The type and parameters of the solvated system were established in the first stage, followed by a 100 ps simulation at 10 K, applying restraints to solute-heavy atoms in the second stage under NVT conditions using Brownian dynamics. The third stage continued under similar NVT conditions for 12 ps. The series of simulations for stages four (12 ps), six (12 ps), and seven (24 ps), while omitting the pocket solvation at stage five, involved short steps under NPT conditions, with temperature and atom restraints integrated in stages four and six. The seventh stage heavy atoms had no restraints, paving the way for the final eighth stage, which adopted an NPT ensemble at a consistent 300 K temperature.
While performing post-MD simulation analysis, several key parameters were examined to gain insights into the conformational dynamics and interactions within the protein-ligand complexes. The backbone root-mean-square deviation (C
α RMSD) was calculated to assess the overall structural stability of the protein-ligand complexes over the course of the simulation. Additionally, the backbone fluctuation (C
α RMSF) was computed to quantify the local flexibility of residues and to identify regions with significant conformational changes. C
α radius of gyration (RoG) analysis was conducted to monitor the compactness of the protein-ligand complexes during the simulation, providing information on structural changes and potential unfolding events. Principal component analysis (PCA) was performed utilising RStudio by Posit Software, PBC (version 2023.09.1+494), incorporating the ggfortify package to assess all C
α values in relation to their corresponding apo structure [
47,
48]. The creation of scree plots based on the PCA outputs was also executed within the R environment, facilitating a visual interpretation of the variance distribution among the principal components [
48,
49,
50]. Ligand-specific analyses were also performed. The ligand root-mean-square deviation (Lig-RMSD) was calculated to evaluate the stability of the ligands within the binding pocket and to identify any deviations from their initial positions. These trajectory analyses collectively provided a comprehensive view of the dynamic behaviour and intermolecular interactions within the protein-ligand complexes post-MD simulations, shedding light on the stability and potential binding mechanisms of the ligands to CBRs.
3. Results
3.1. Crystal Selection and Homology Modelling
After the appropriate structures were selected (
Figure 1) homology models were generated (
Figure 2).
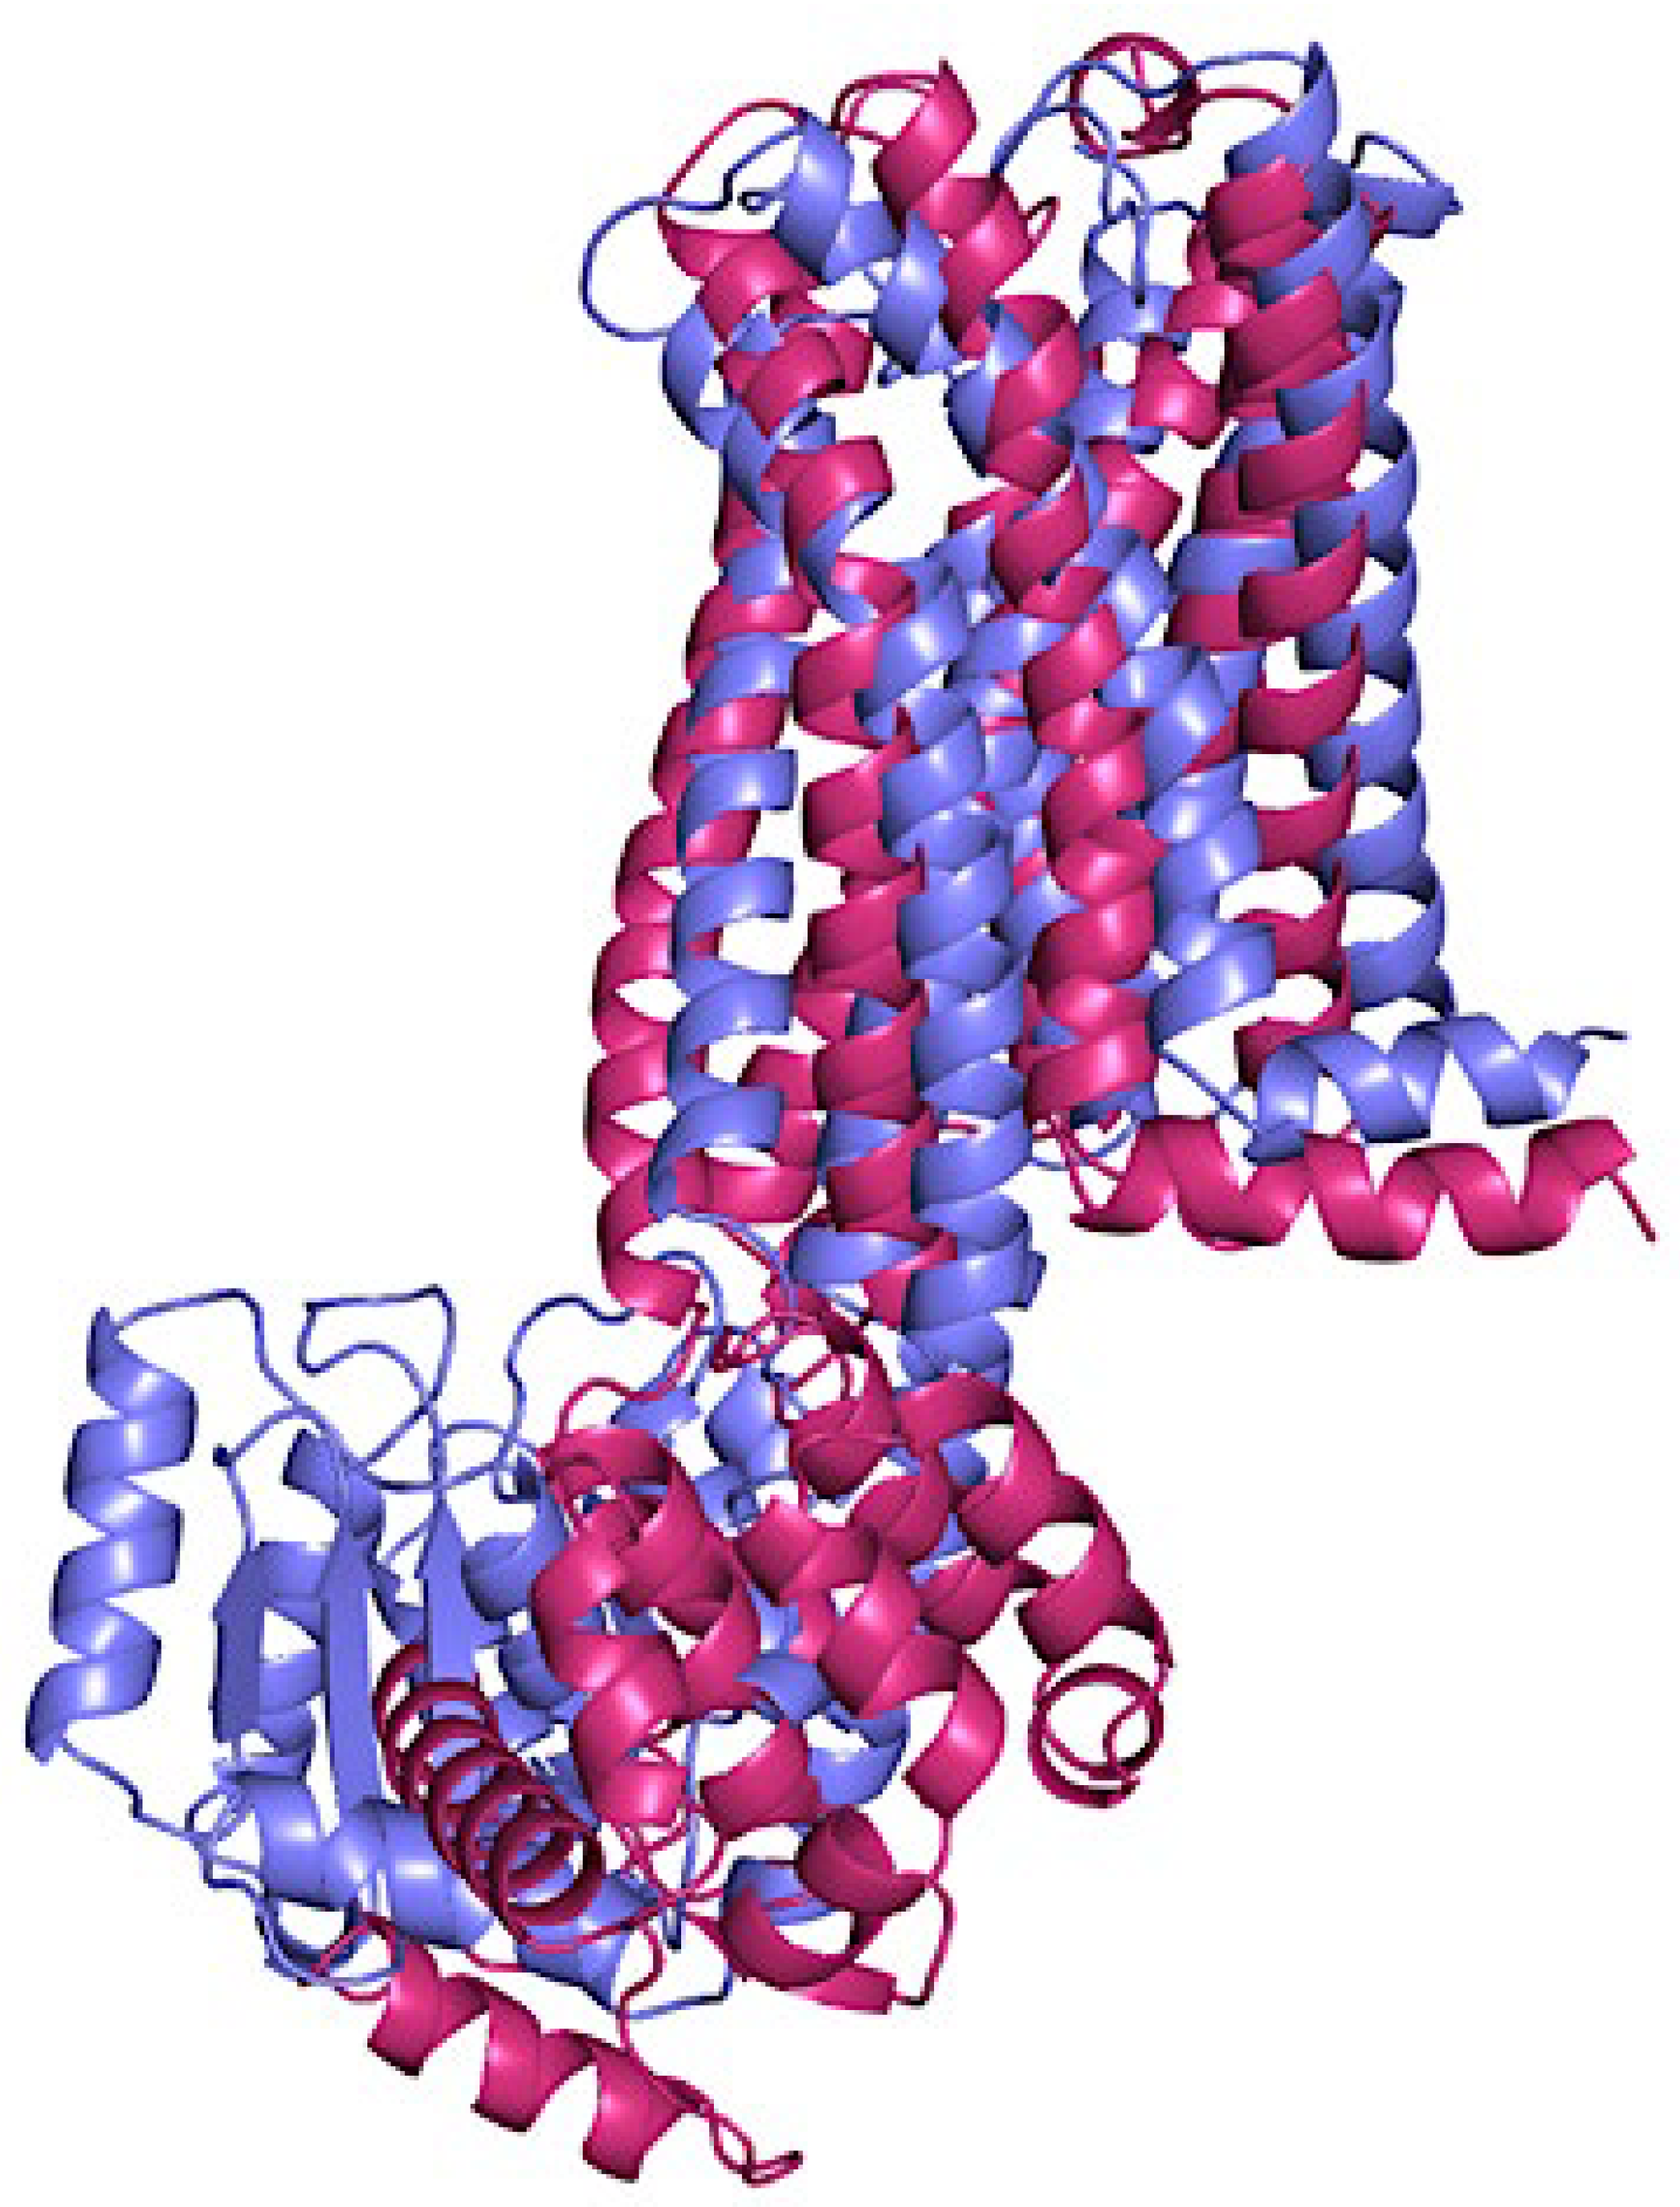
Figure 4 illustrates the structural alignment of p-CBRs, highlighting their similarities and differences. The superimposition of CB
1 (purple) and CB
2 (pink) models allows for a visual comparison of their three-dimensional (3D) structures. This comparison can elucidate variations in their conformations that may relate to their distinct physiological roles, ligand specificities, and signalling mechanisms. Differences in structure between CB
1 and CB
2 are key to understanding their unique interactions with various ligands, which ultimately influences their differing functions in the body. For the p-CB
1 receptor, the intracellular region spans residues 214-409, while the segment embedded within the membrane encompasses residues 12-213 and 410-498. Similarly, the p-CB
2 receptor intracellular region extends from residues 222-381, with its membrane-bound segment comprising residues 20-221 and 382-472 (
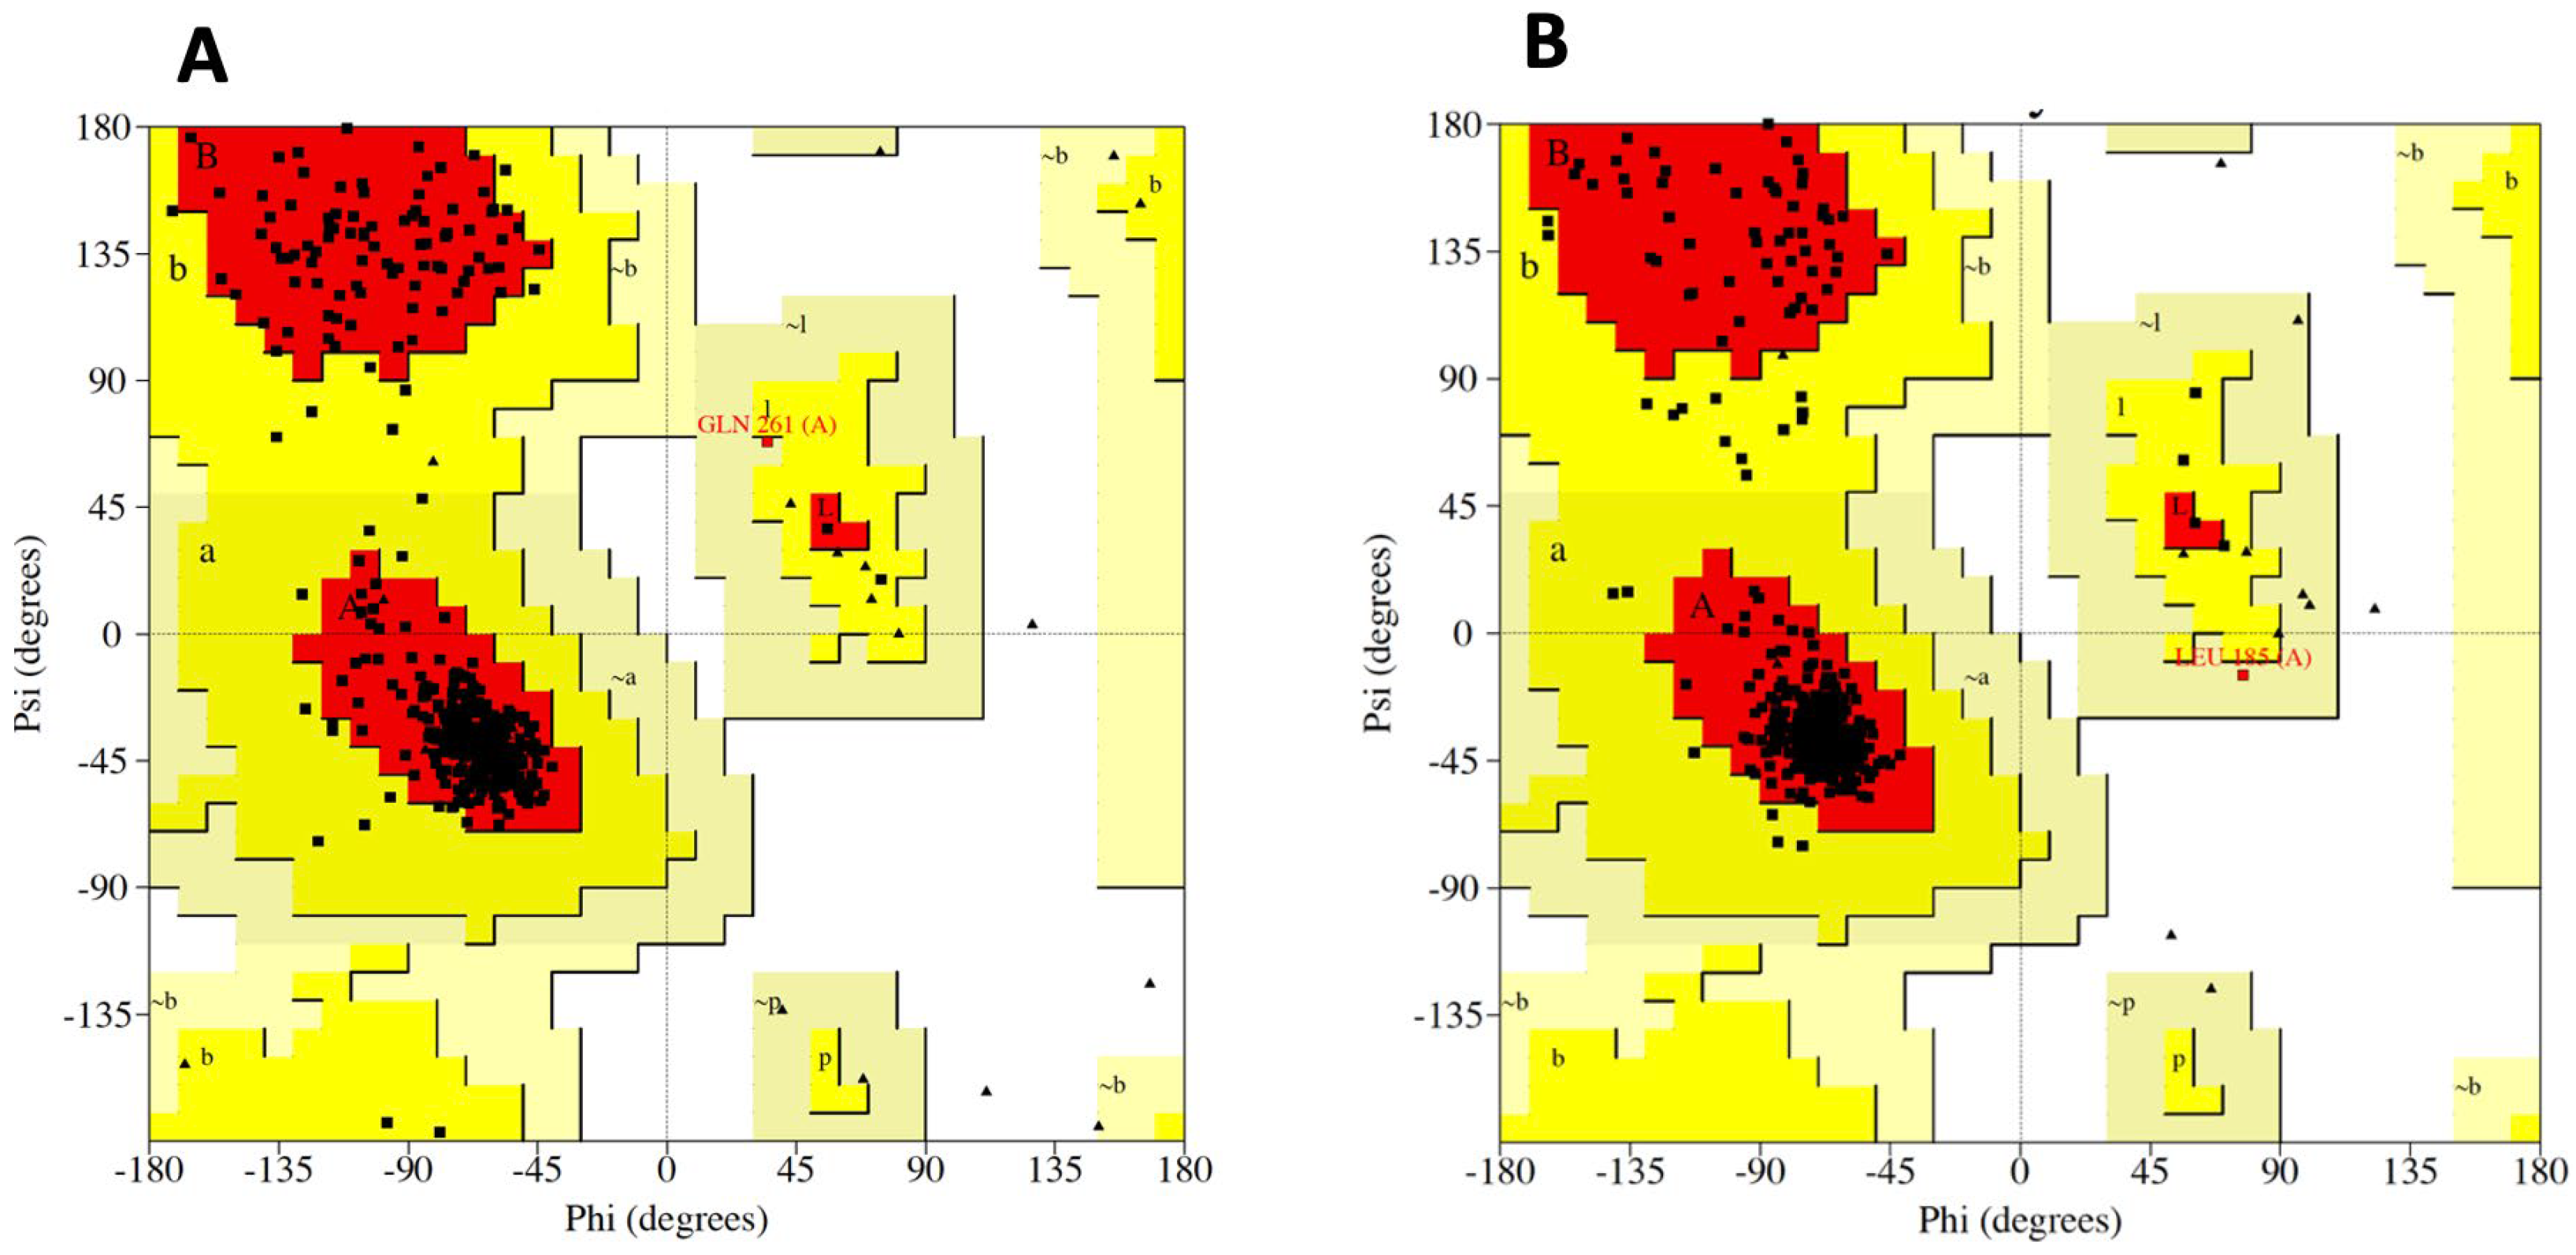
Figure A2). The Ramachandran statistics in
Table 1 indicate that for CB
1 94.2 % of amino acid residues in the favoured regions, thereby suggesting a reliable model consistent with known protein structural conformations Similarly,
Table 1 shows the CB
2 receptor model, with 94.4 % of residues occupying energetically favourable regions, signifying a well-structured protein model. Additionally, a small percentage of residues are in the additional allowed regions, 5.5 % for CB
1 and 5.4 % for CB
2, while an even smaller fraction, 0.2 % for both receptors, are in generously allowed regions. Notably, there are no residues in disallowed regions for either receptor, which further underscores the structural integrity of the models. The distribution of residues within these plots (
Figure A3) provides a qualitative measure of the overall quality of the protein homology models. It is a critical step in validating structural predictions for functional analyses.
Table 1.
Ramachandran plot statistics for homology models of pseudo CB1 and CB2 receptors.
Table 1.
Ramachandran plot statistics for homology models of pseudo CB1 and CB2 receptors.
| Plot Statistics |
Endocannabinoid Receptor 1 |
Endocannabinoid Receptor 2 |
| Residues in most favoured regions |
409 |
94.2 % |
385 |
94.4 % |
| Residues in additional allowed regions |
24 |
5.5 % |
22 |
5.4 % |
| Residues in generously allowed regions |
1 |
0.2 % |
1 |
0.2 % |
| Residues in disallowed regions |
0 |
0.0 % |
0 |
0.0 % |
| Number of residues present in the structure |
478 |
- |
449 |
- |
3.2. Solvation and Membrane System
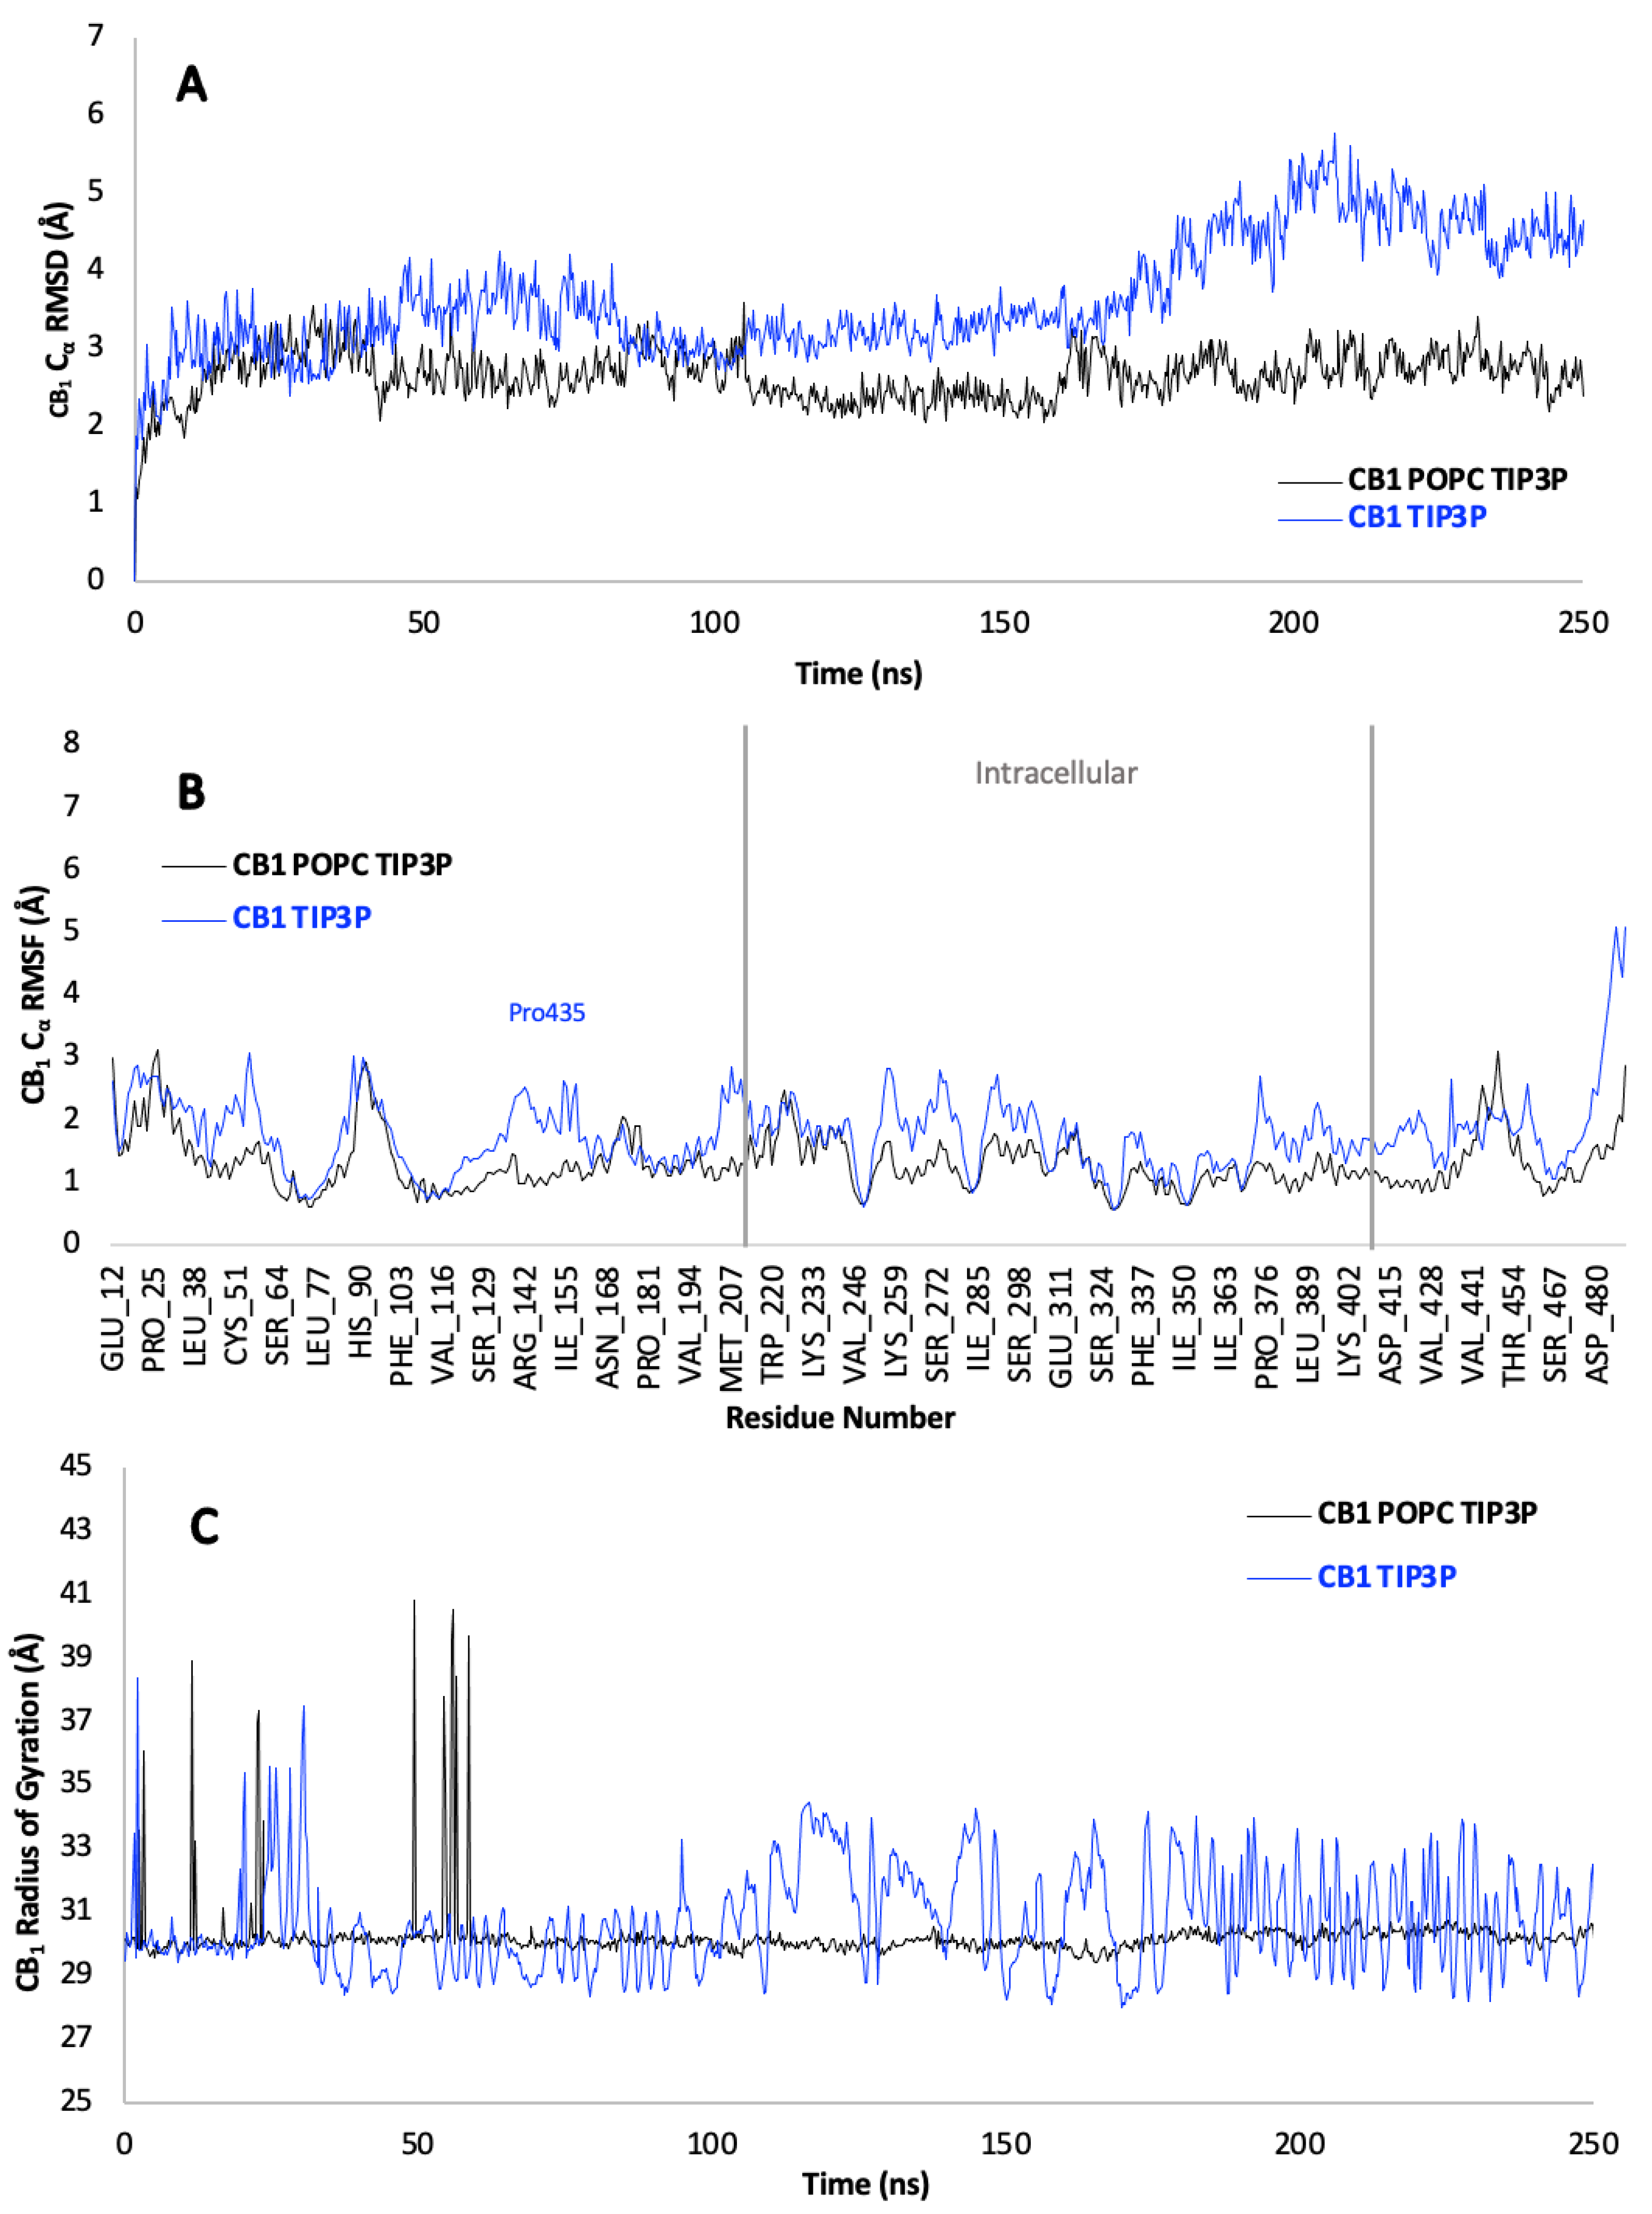
In computational biology, the structural analysis of proteins using MD simulations provides invaluable insights into their functional mechanisms. The CBRs are of particular interest, as their interaction with various ligands can be influenced by the lipid membrane environment. By comparing simulations of these proteins with and without a POPC membrane using the TIP3P water model, the role of the membrane in modulating receptor behaviour can be discerned.
For the CB1 receptor, MD analyses shed light on the stability and dynamics of the protein. Cα RMSD plots over time (
Figure A4A) suggest that the CB1 receptor within the POPC membrane environment deviates less from its initial conformation, indicating enhanced stability in comparison to the receptor in a purely aqueous TIP3P environment. TheCα RMSF (
Figure A4B) extends this notion, demonstrating that residues of the CB1 receptor exhibit decreased fluctuations in the presence of the membrane, a sign of increased rigidity and structural restraint. Moreover, the compactness of the receptor, inferred from the RoG (
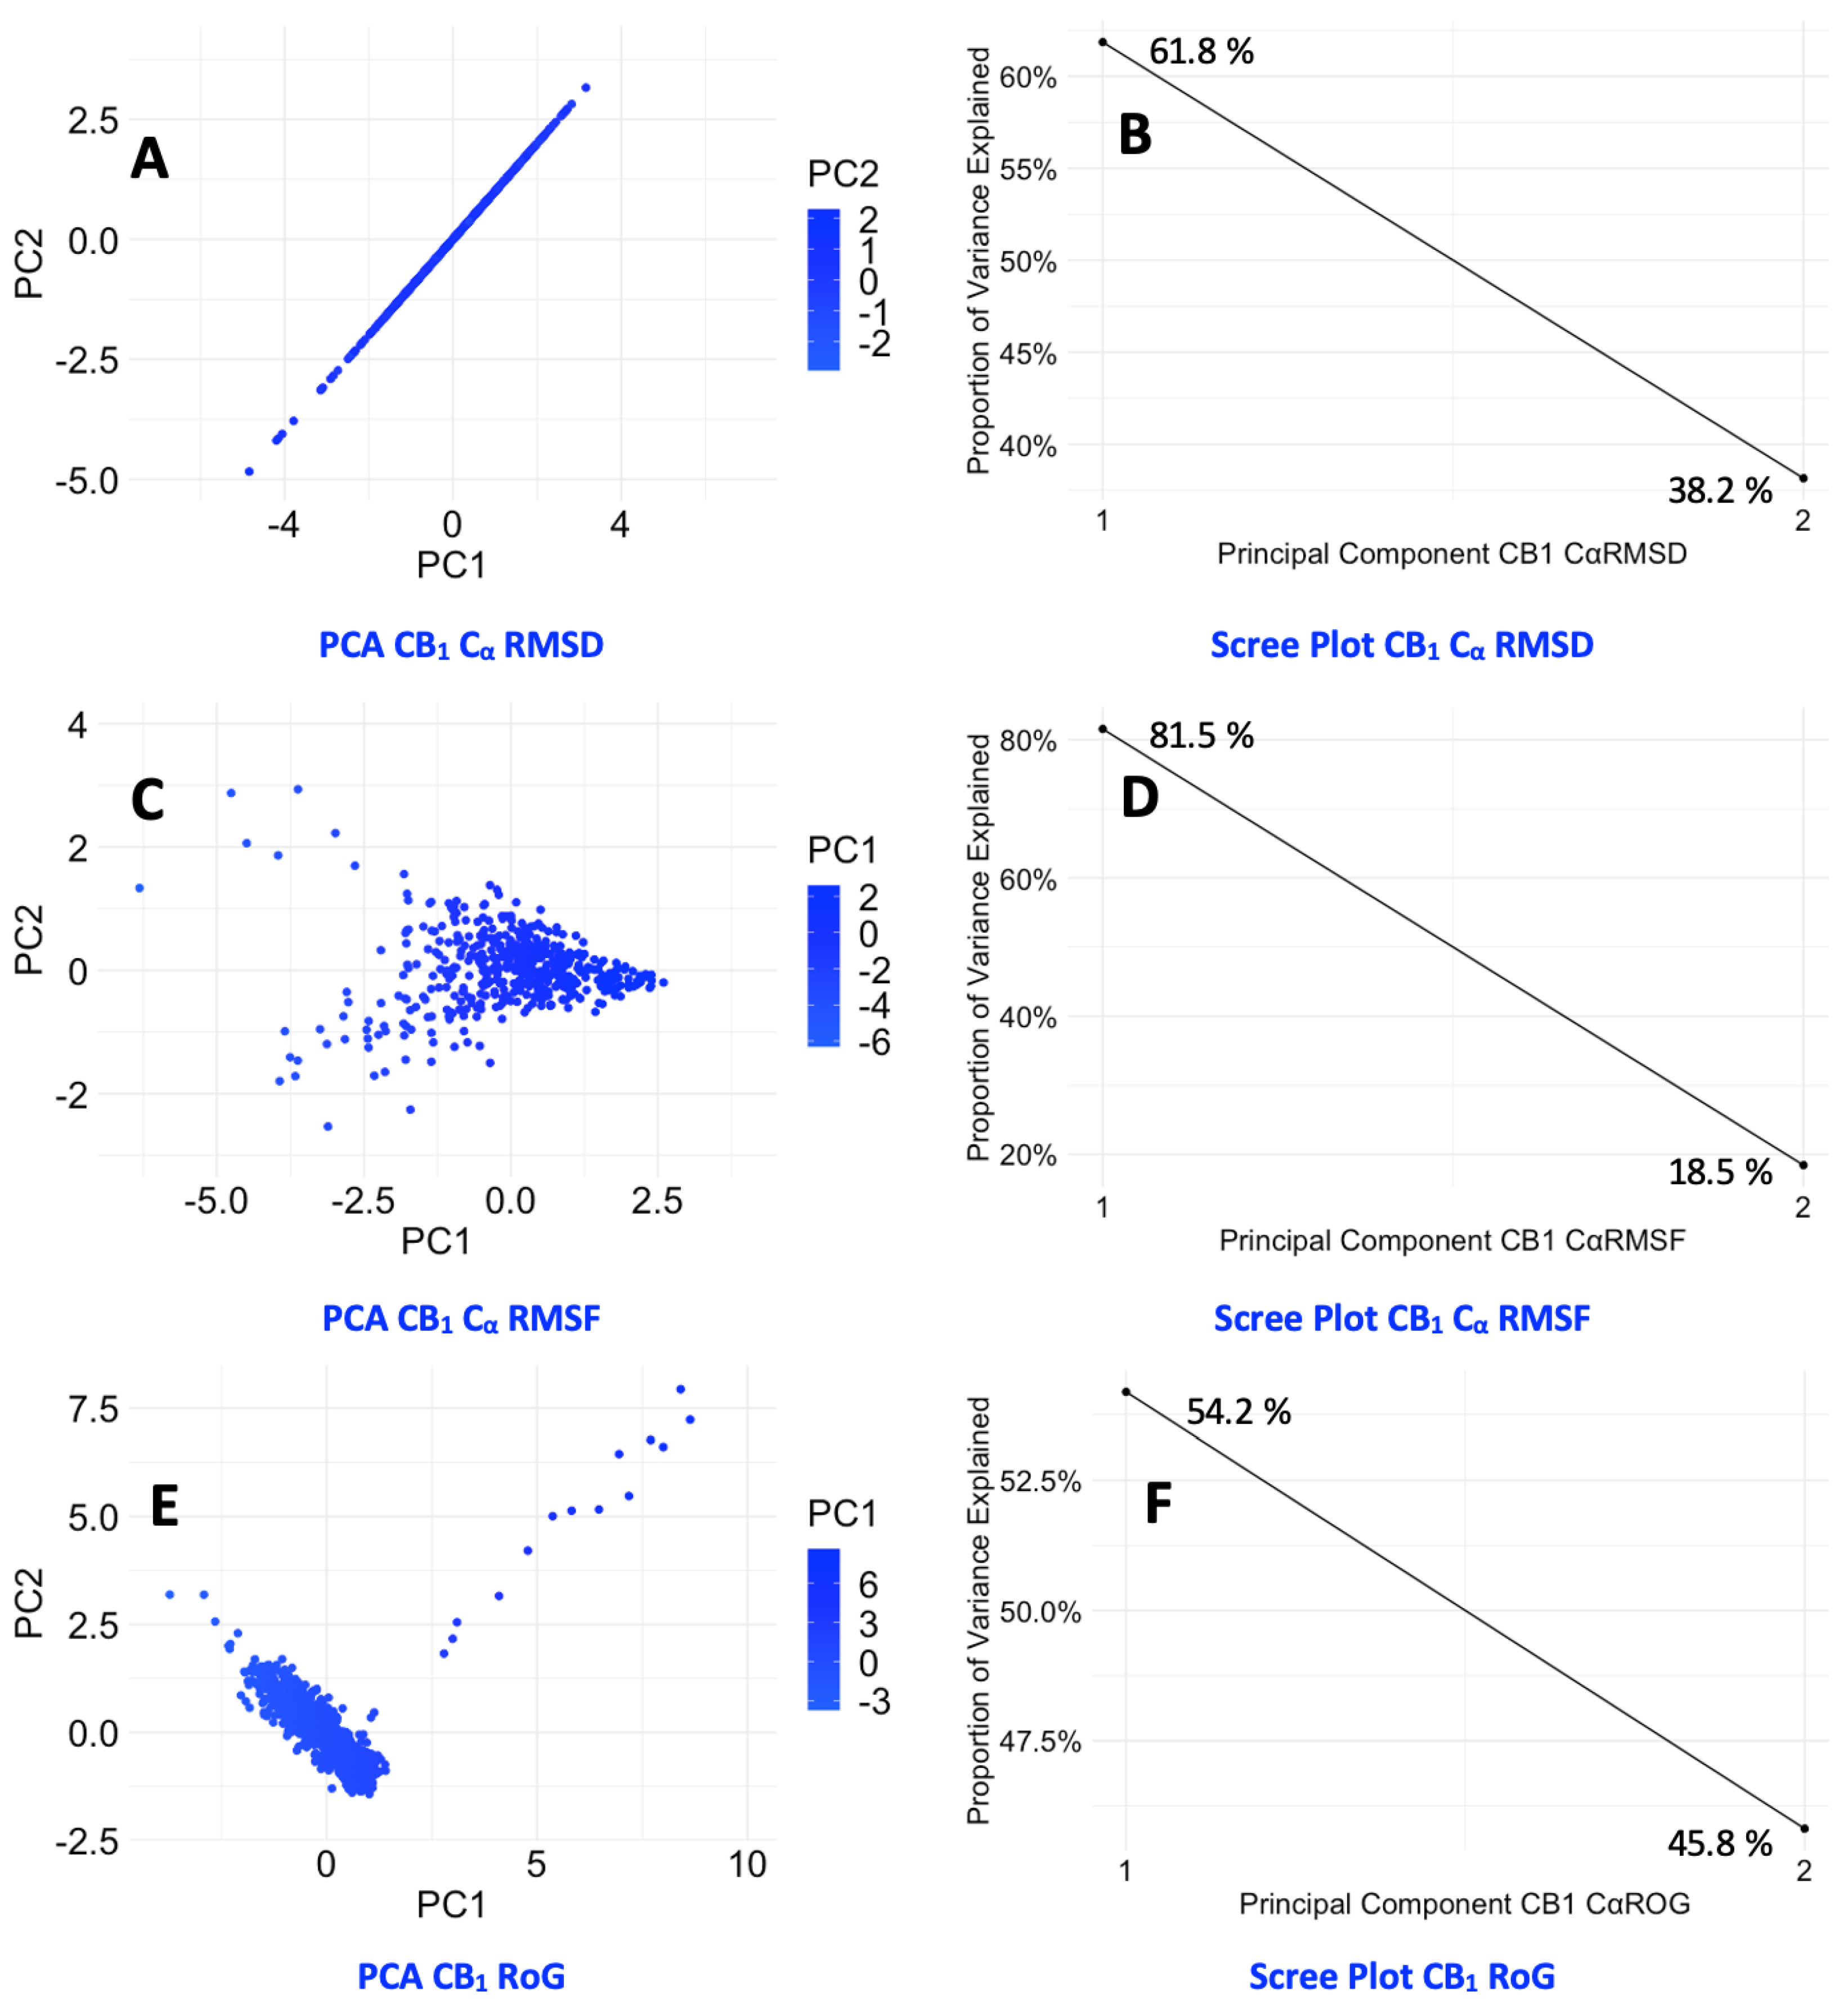
Figure A4C), appears more consistent and reduced within the membrane, highlighting a more stable, compact structure. The PCA plots and corresponding scree plots (
Figure A5) for the CB1 receptor supplement these findings by illustrating a less diverse conformational landscape when the receptor is associated with the POPC membrane.
Turning to the CB2 receptor, similarities in the structural stability over time are observed (Figure A6A). At various intervals, the membrane-bound receptor exhibits reduced Cα RMSD, pointing to sporadic phases of increased stability. The Cα RMSF data (Figure S6B) echo the trends observed for CB1, with certain residues demonstrating diminished fluctuations within the membrane context. The RoG (Figure A6C) reinforces the pattern of membrane-induced compactness. The PCA and scree plots for CB2 (Figure A7) also displays a broad array of sampled conformations, though the POPC membrane introduces constraints on the dynamics of the receptor. While a significant proportion of the movements of the receptor are captured by the first single PC, a complex dynamic profile persists in the absence of the membrane.
For both CBRs the presence of a POPC membrane generally confers structural stability and a more compact form on these CBRs. This is evident from the periods of lower Cα RMSD, restricted Cα RMSF, and reduced RoG, indicating that the membrane plays a stabilising role. The PCA and scree plots highlight these findings, revealing a less varied conformational space suggesting a more constrained range of motions for the membrane system. PCA also shows that the membrane causes a lower and more stable Cα RMSD and RoG. These insights show the practical implications for our understanding of receptor function. The stability and compactness influenced by the membrane are likely to be pivotal for interactions of the receptors with ligands, which naturally occur in a membrane environment. Recognising the influence of the lipid membrane on these interactions is therefore essential for grasping the biological roles of CBRs and can guide the design of therapeutic compounds targeting these receptors.
3.3. Ligand Interaction
In the analysis of IFD results, various ligands (
Figure 4) were evaluated with p-CBRs to determine their interaction profiles (
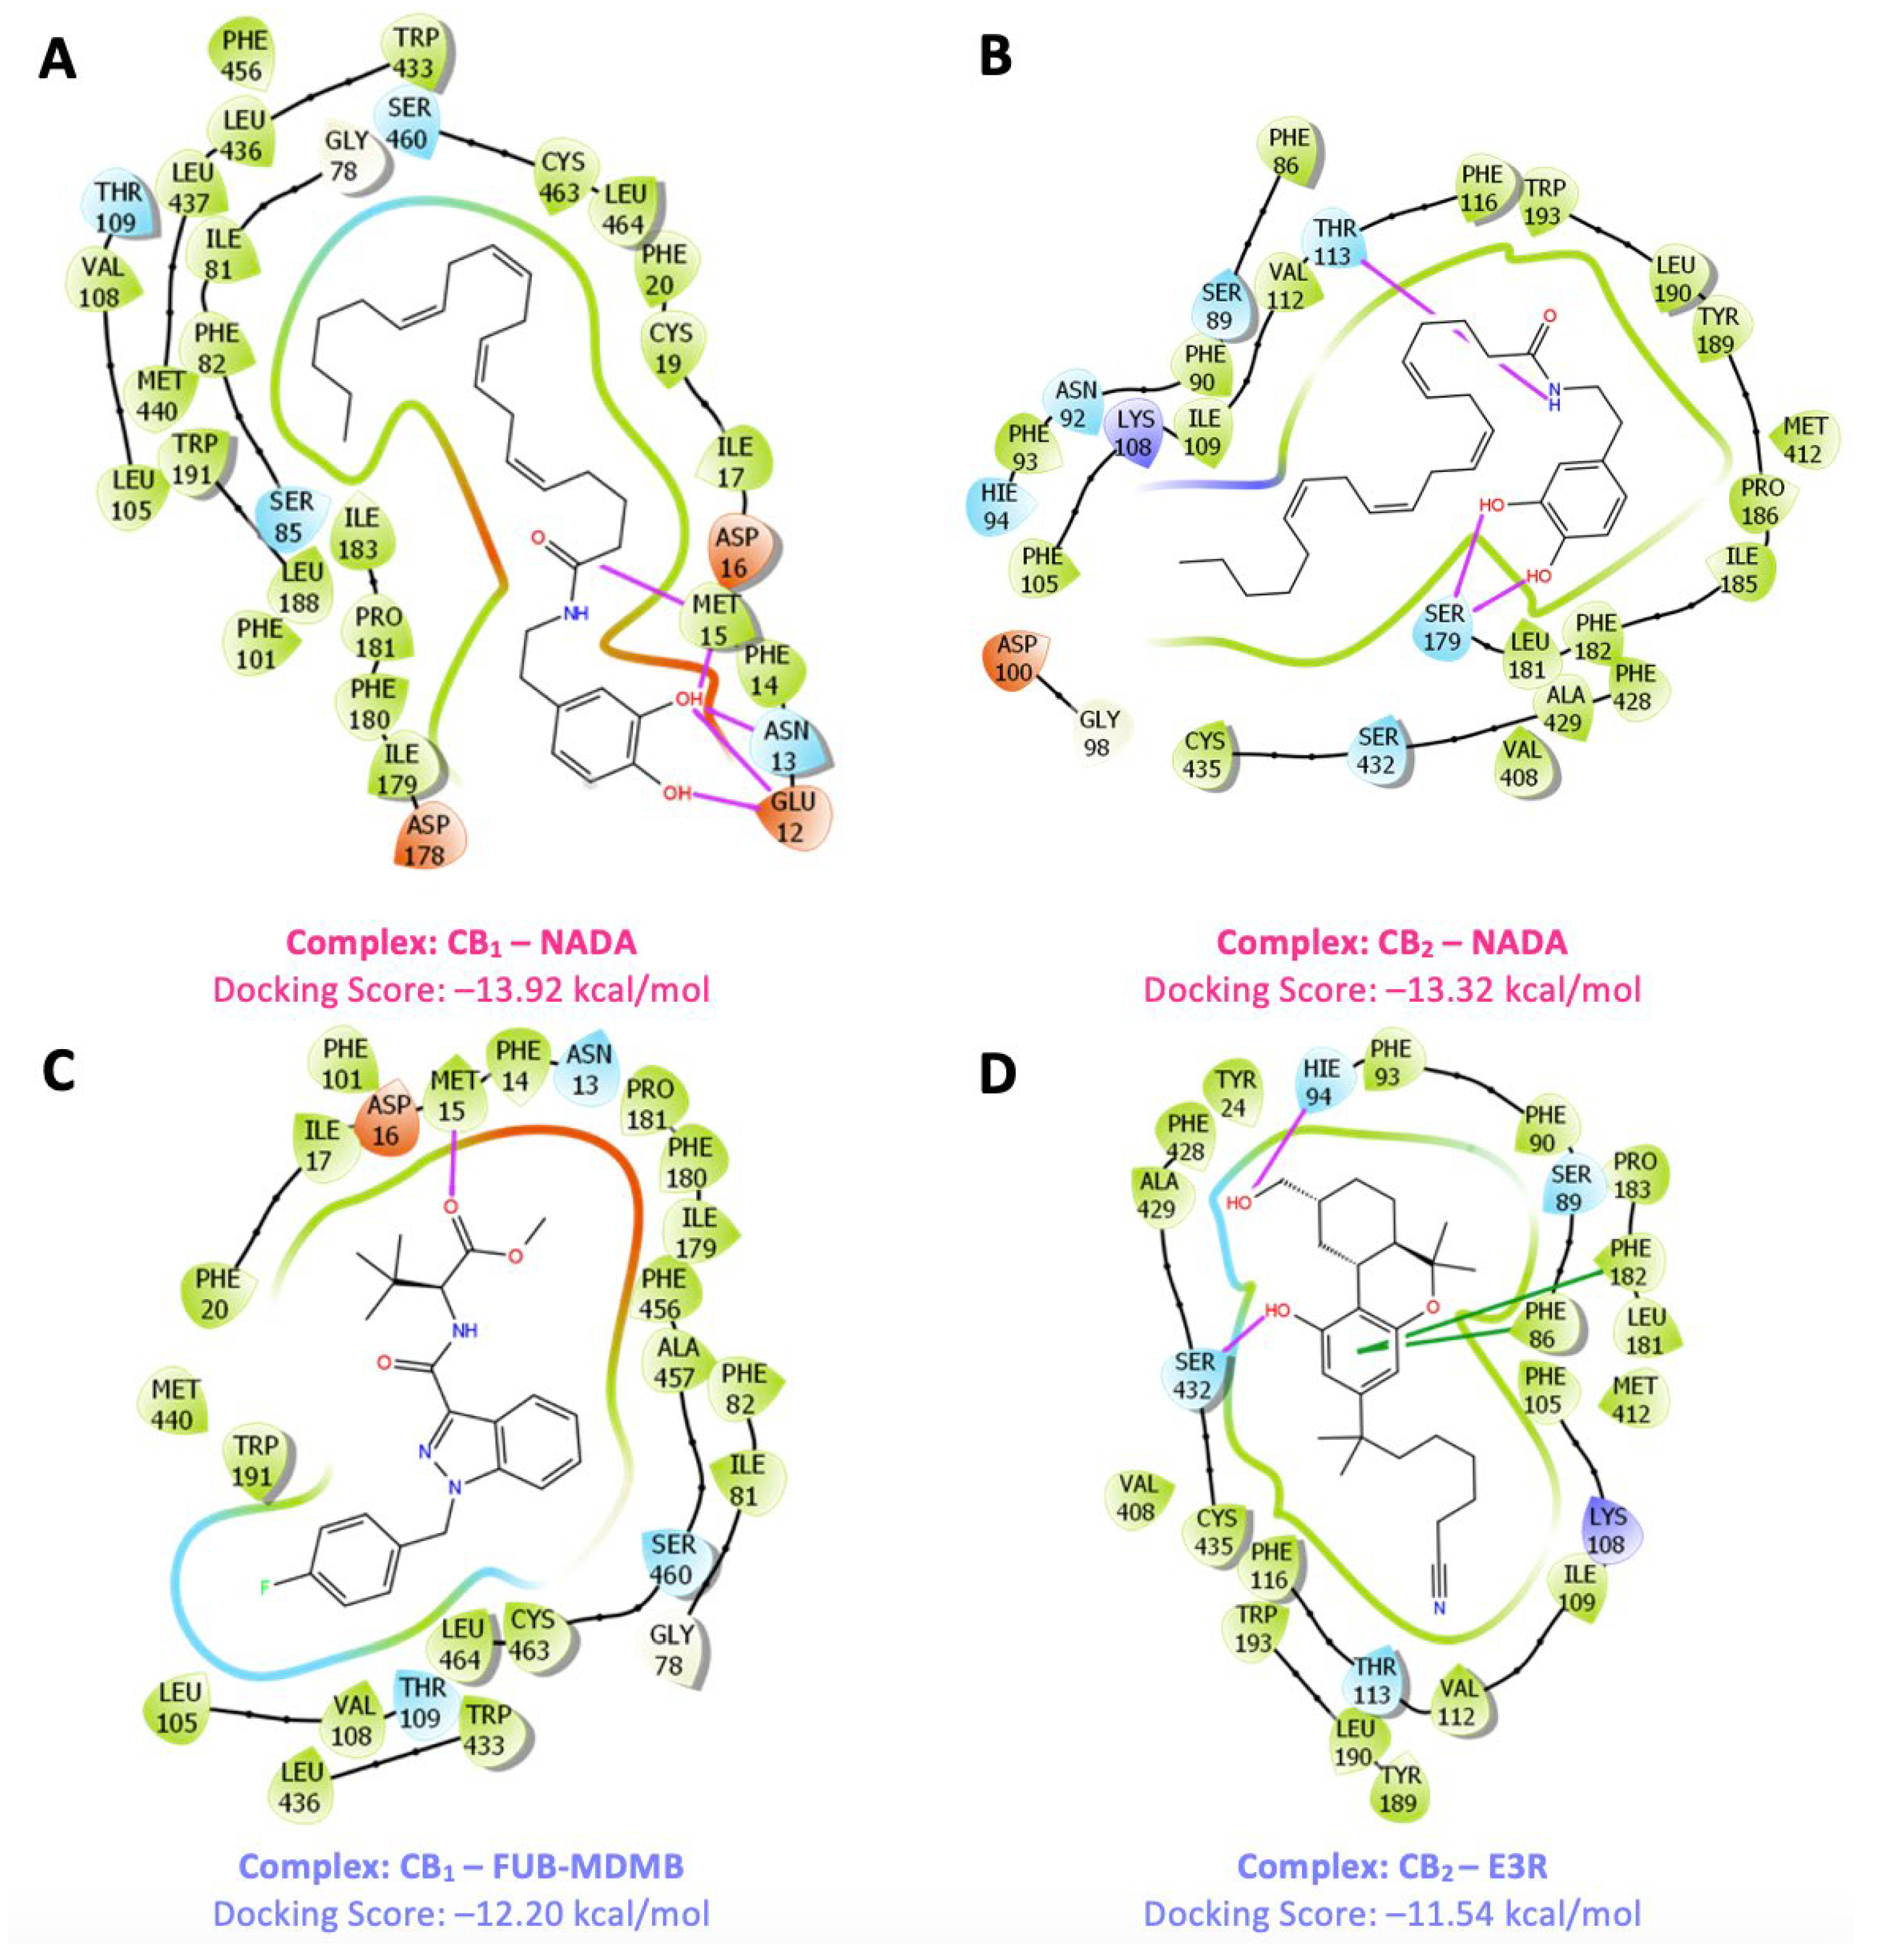
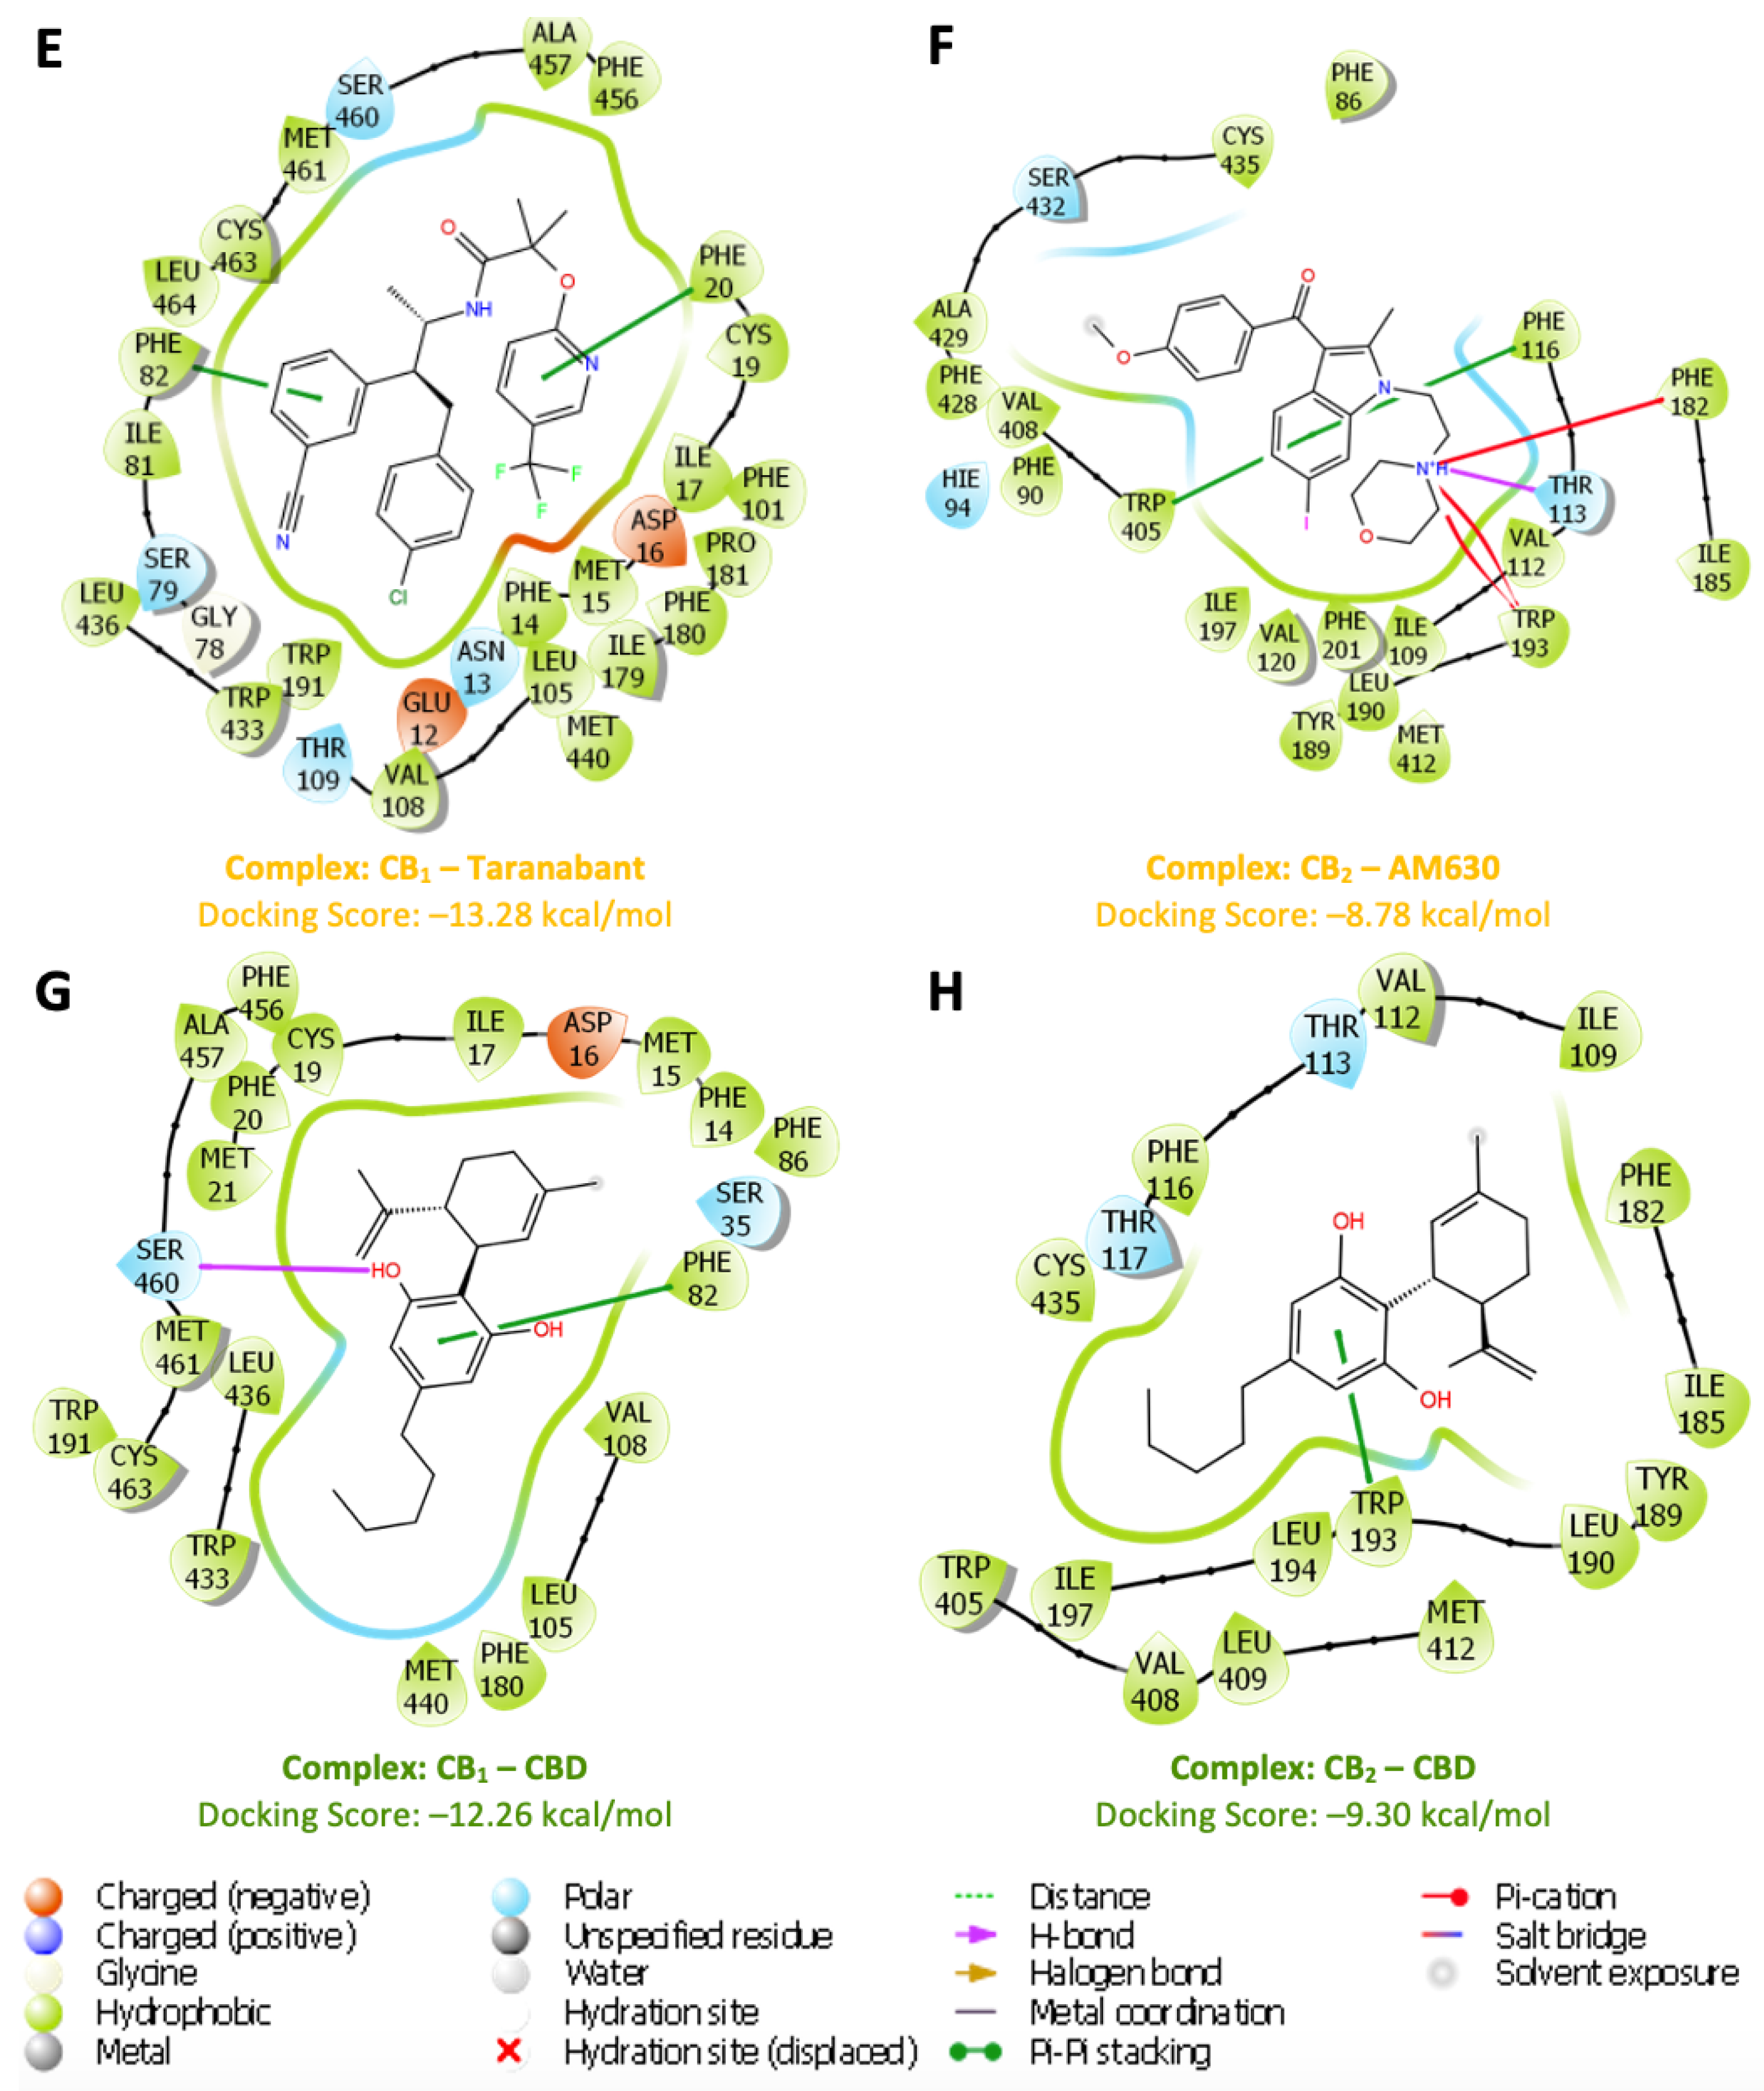
Figure 5). The docking scores provide insights into binding affinities where a negative score indicates a favourable interaction as it represents the free energy change associated with the binding process. The more negative the score, the more likely it is that the ligand will bind strongly to p-CBRs, suggesting a stable and potentially effective interaction in a biological environment. NADA exhibited the highest affinity for both receptors, scoring -13.92 kcal/mol for CB
1 and -13.32 kcal/mol for CB
2. The strong affinity between the NADA-CB
1 complex is supported by hydrogen bond (H-bond) interactions with residues such as Met15, Asn13, and Glu12 for CB
1, and Thr113 and Ser179 for CB
2, with the OH groups of NADA playing a key role necessary for ligand recognition and binding stability. The strong affinity of NADA for both receptors suggest a selective interaction based supported by its location in the body, thereby positioning it as a key candidate for
in silico validation of p-CBRs. FUB-MDMB shows significant affinity for CB
1, with a docking score of -12.20 kcal/mol through an H-bond interaction with Met15. Taranabant also displays strong binding to CB
1 with a docking score of -13.28 kcal/mol, due to π-π stacking with Phe20 and Phe82. Similarly, CBD binds to CB
1 through π-π stacking with Phe82 and a hydrogen bond with Ser460, resulting in a docking score of -12.26 kcal/mol. For CB
2, alongside NADA, E3R displays a notable docking score of -11.54 kcal/mol with H-bond interactions involving Ser432 and His94, as well as π-π stacking with Phe182 and Phe86. AM630, in contrast, exhibits the weakest binding to CB
2 with a score of -8.78 kcal/mol, suggesting a less stable interaction profile and indicating specificity in binding. AM630 formed π-cation bonds with Phe182 and Trp193, a H bond with Thr113, and π-π stacking between Phe116 and Trp405. The moderate affinity of CBD at -9.30 kcal/mol for CB
2 can be attributed to π-π stacking interactions with Trp193.
3.4. Energy Properties
The simulation quality analysis for both CB1 and CB2 systems (Tables 2.1. and 2.2.) over a 250 ns period demonstrates a slope energy of zero for all systems showing successful equilibration, with consistent temperatures at ~298 K. For CB1, the degrees of freedom peak with Taranabant and NADA, while CB2 displays higher degrees of freedom when interacting with NADA and E3R suggesting a more flexible simulation environment. This implies that the receptor can adopt a variety of conformations which is essential to the receptor's ability to bind to a diverse range of ligands or for the activation of different signalling pathways. When examining the energy properties of CB1-complexes, the average total energy and potential energy displayed a trend where NADA displayed the lowest energies, suggesting the most stable interaction, aligning with the natural affinity of endocannabinoids for CBRs. The CB1 apo state showed the highest total energy, which is normal as the unbound state of the receptor may not be the most energetically favourable configuration as ligand binding stabilises the conformation of GPCRs. Pressure variations are observed across all simulations which is normal and expected, as the system is dynamic and subject to fluctuations. These variations reflect the constantly changing interactions among molecules in the system and can indicate the level of system compactness or density . This is important as it helps ensure that the simulated environment behaves in a physically realistic way, which is crucial for the accuracy of the simulation's predictions about molecular behaviour and interactions. Volumetric analysis shows the largest systems with Taranabant for CB1 and NADA for CB2, corresponding to expanded receptor-ligand complexes. Each system is equilibrated, thereby confirming the stability of these dynamic molecular systems. The slope energy stability over time, remained at or near zero for all simulations which showed that the receptor maintains a stable conformation across various ligands with minor variations in energy, potentially reflecting different binding affinities and interactions within the binding pocket.
Table 2.1.
Simulation Quality Analysis Energy Properties for CB1 Systems.
Table 2.1.
Simulation Quality Analysis Energy Properties for CB1 Systems.
| Statistical Parameters |
Apo |
NADA |
FUB-MDMB |
Taranabant |
CBD |
| Simulation Period (ns) |
250.00 |
250.00 |
250.00 |
250.00 |
250.00 |
| Degrees of Freedom |
141853 |
161211 |
153736 |
164349 |
146648 |
| Number of Atoms |
65690 |
74517 |
71224 |
76178 |
68022 |
| Average Total Energy (kcal/mol) |
–116151.80 |
–125664.51 |
–124343.60 |
–123603.39 |
–121447.47 |
| Average Potential Energy (kcal/mol) |
–158158.88 |
–173394.12 |
–169867.49 |
–172266.69 |
–164876.64 |
| Temperature (K) |
298.04 |
297.97 |
298.02 |
298.00 |
298.05 |
| Pressure (bar) |
0.87 |
1.47 |
1.25 |
1.29 |
1.30 |
| Volume (Å3) |
638265.35 |
723028.60 |
692012.22 |
739565.77 |
661813.67 |
| Slope (ps-1) |
-0.001 |
0.000 |
0.000 |
-0.001 |
0.000 |
Table 2.2.
Simulation Quality Analysis Energy Properties for CB2 Systems.
Table 2.2.
Simulation Quality Analysis Energy Properties for CB2 Systems.
| Statistical Parameters |
Apo |
NADA |
E3R |
AM630 |
CBD |
| Simulation Period (ns) |
250.00 |
250.00 |
250.00 |
250.00 |
250.00 |
| Degrees of Freedom |
150195 |
154383 |
153622 |
140182 |
144228 |
| Number of Atoms |
69961 |
71701 |
71400 |
65151 |
66969 |
| Average Total Energy (kcal/mol) |
–128263.10 |
–126944.28 |
–127483.56 |
–118506.84 |
–119839.14 |
| Average Potential Energy (kcal/mol) |
–172746.90 |
–172660.86 |
–172976.50 |
–160023.83 |
–162550.75 |
| Temperature (K) |
298.08 |
298.03 |
298.04 |
298.07 |
298.05 |
| Pressure (bar) |
1.36 |
0.70 |
0.75 |
1.30 |
0.86 |
| Volume (Å3) |
682471.69 |
698028.68 |
695374.07 |
634755.01 |
651847.95 |
| Slope (ps-1) |
0.000 |
0.000 |
0.000 |
-0.001 |
-0.001 |
3.5. Protein Backbone Cα RMSD
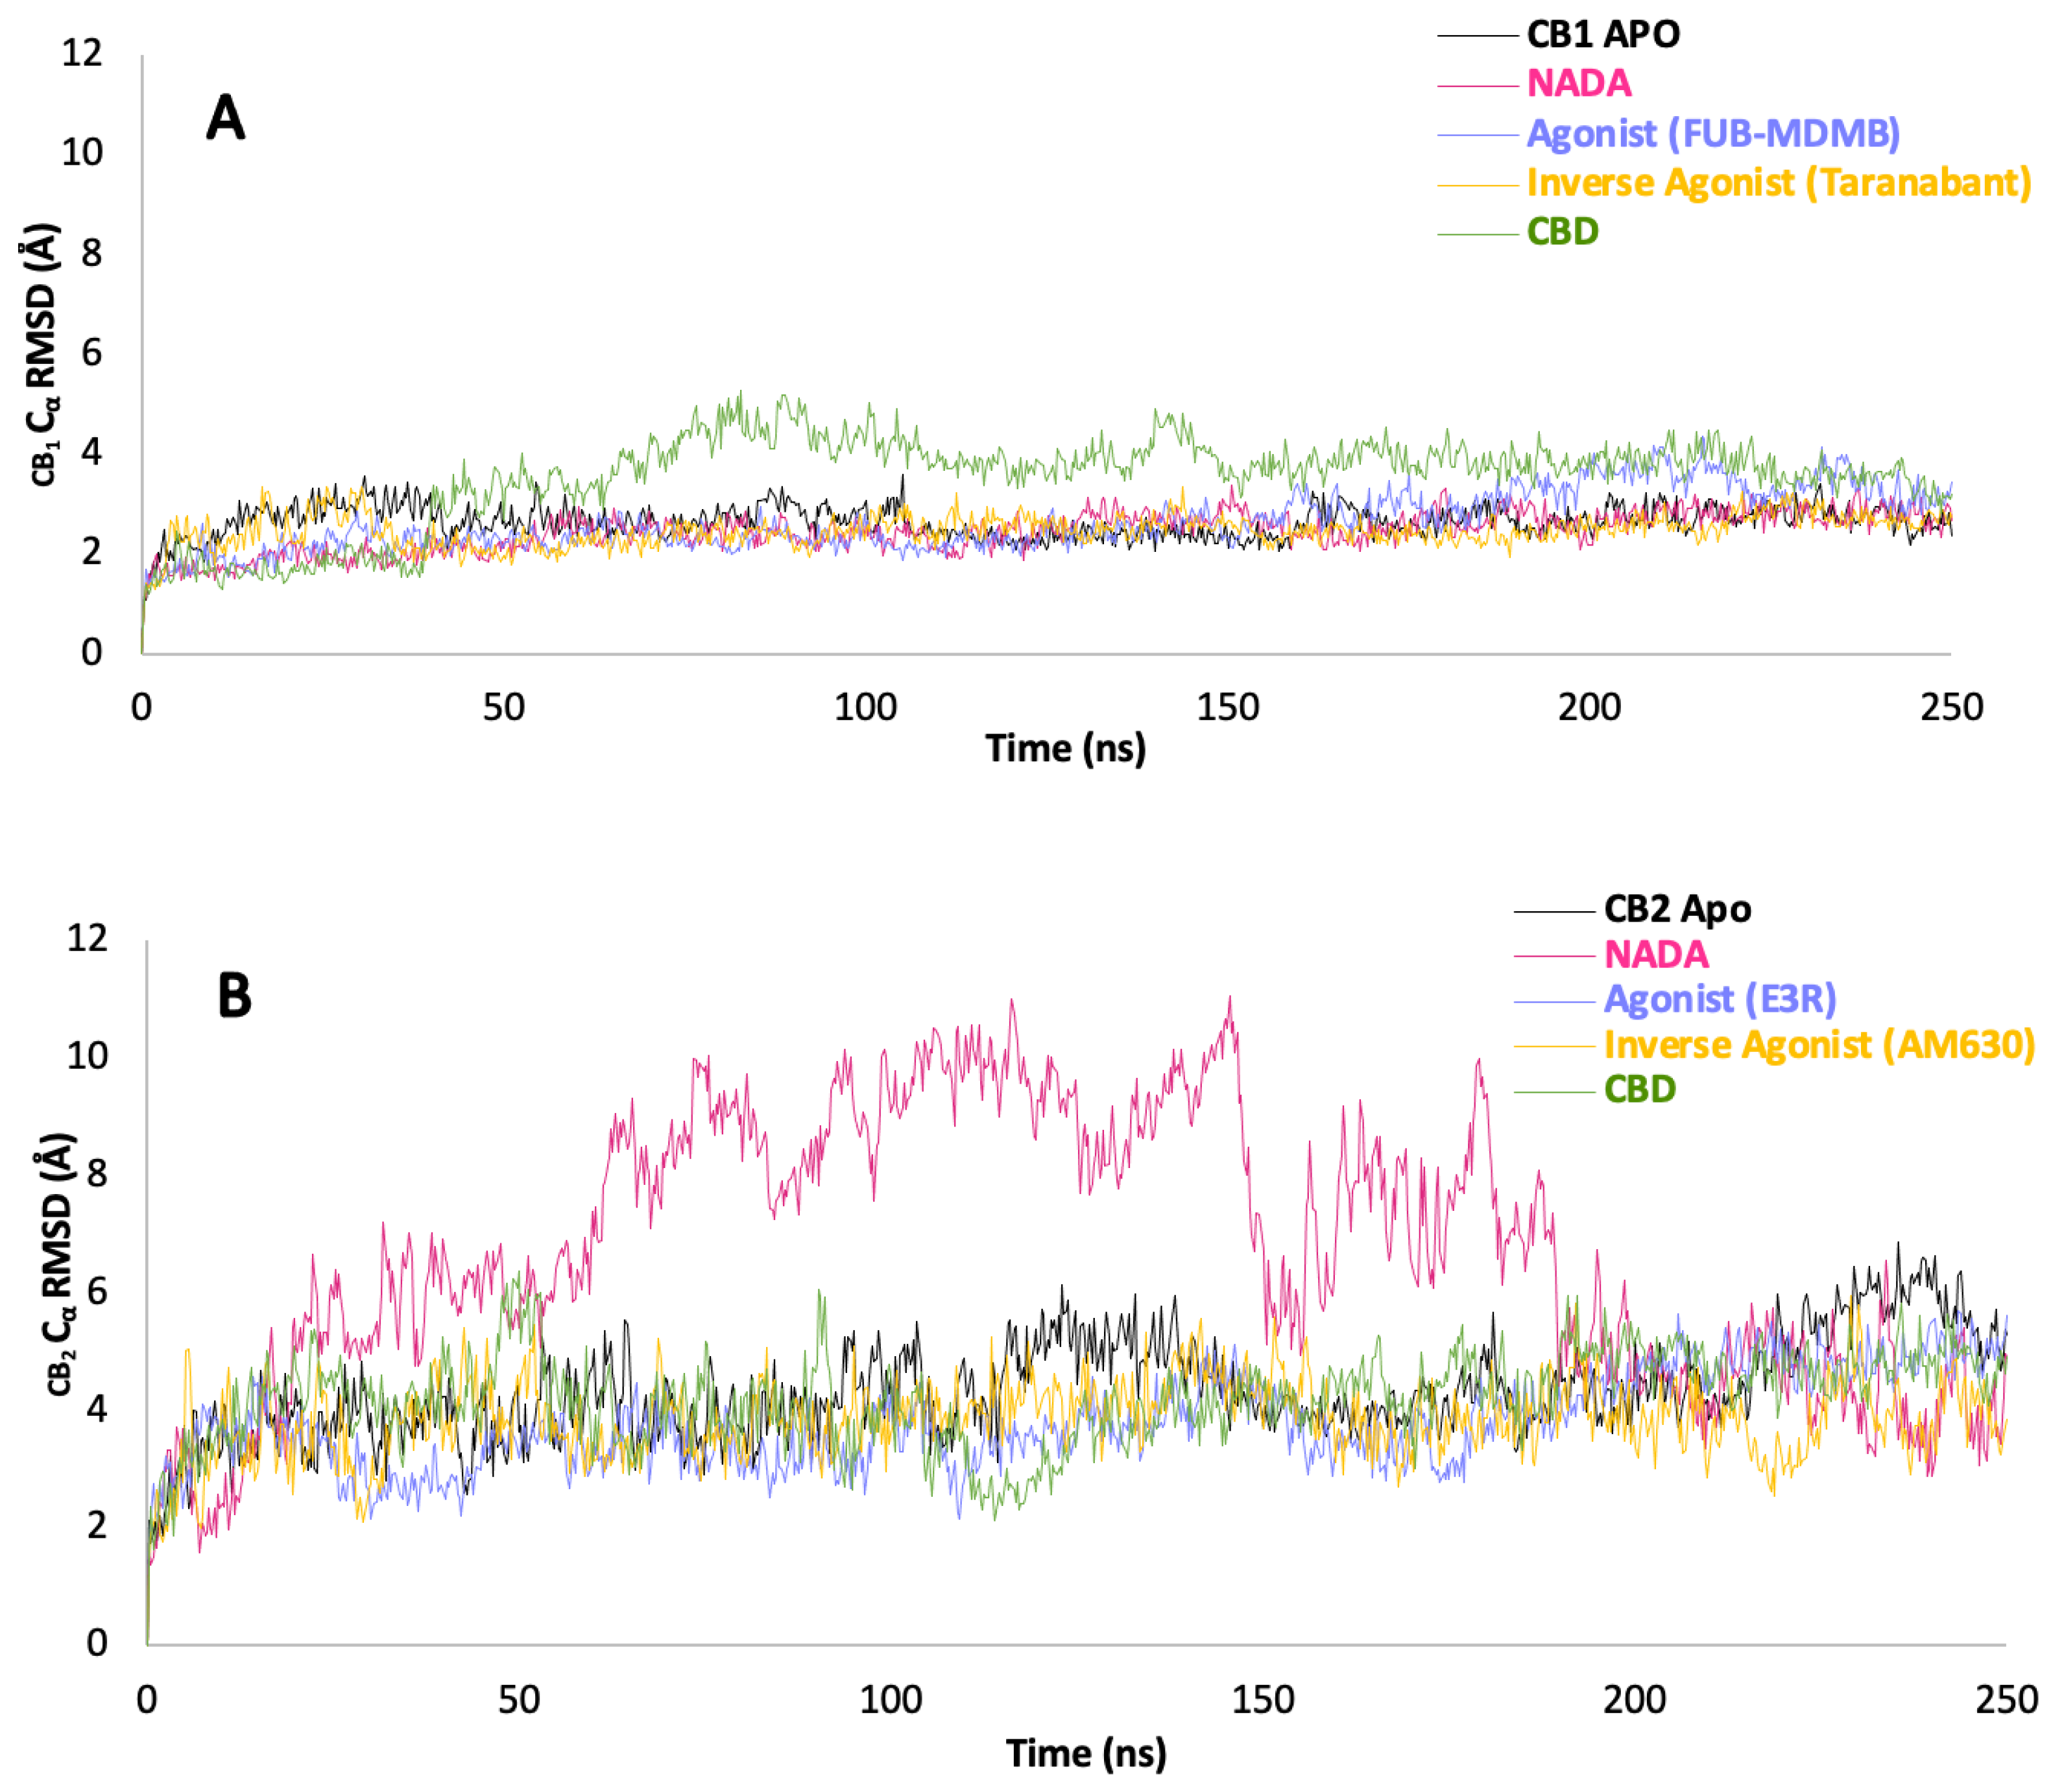
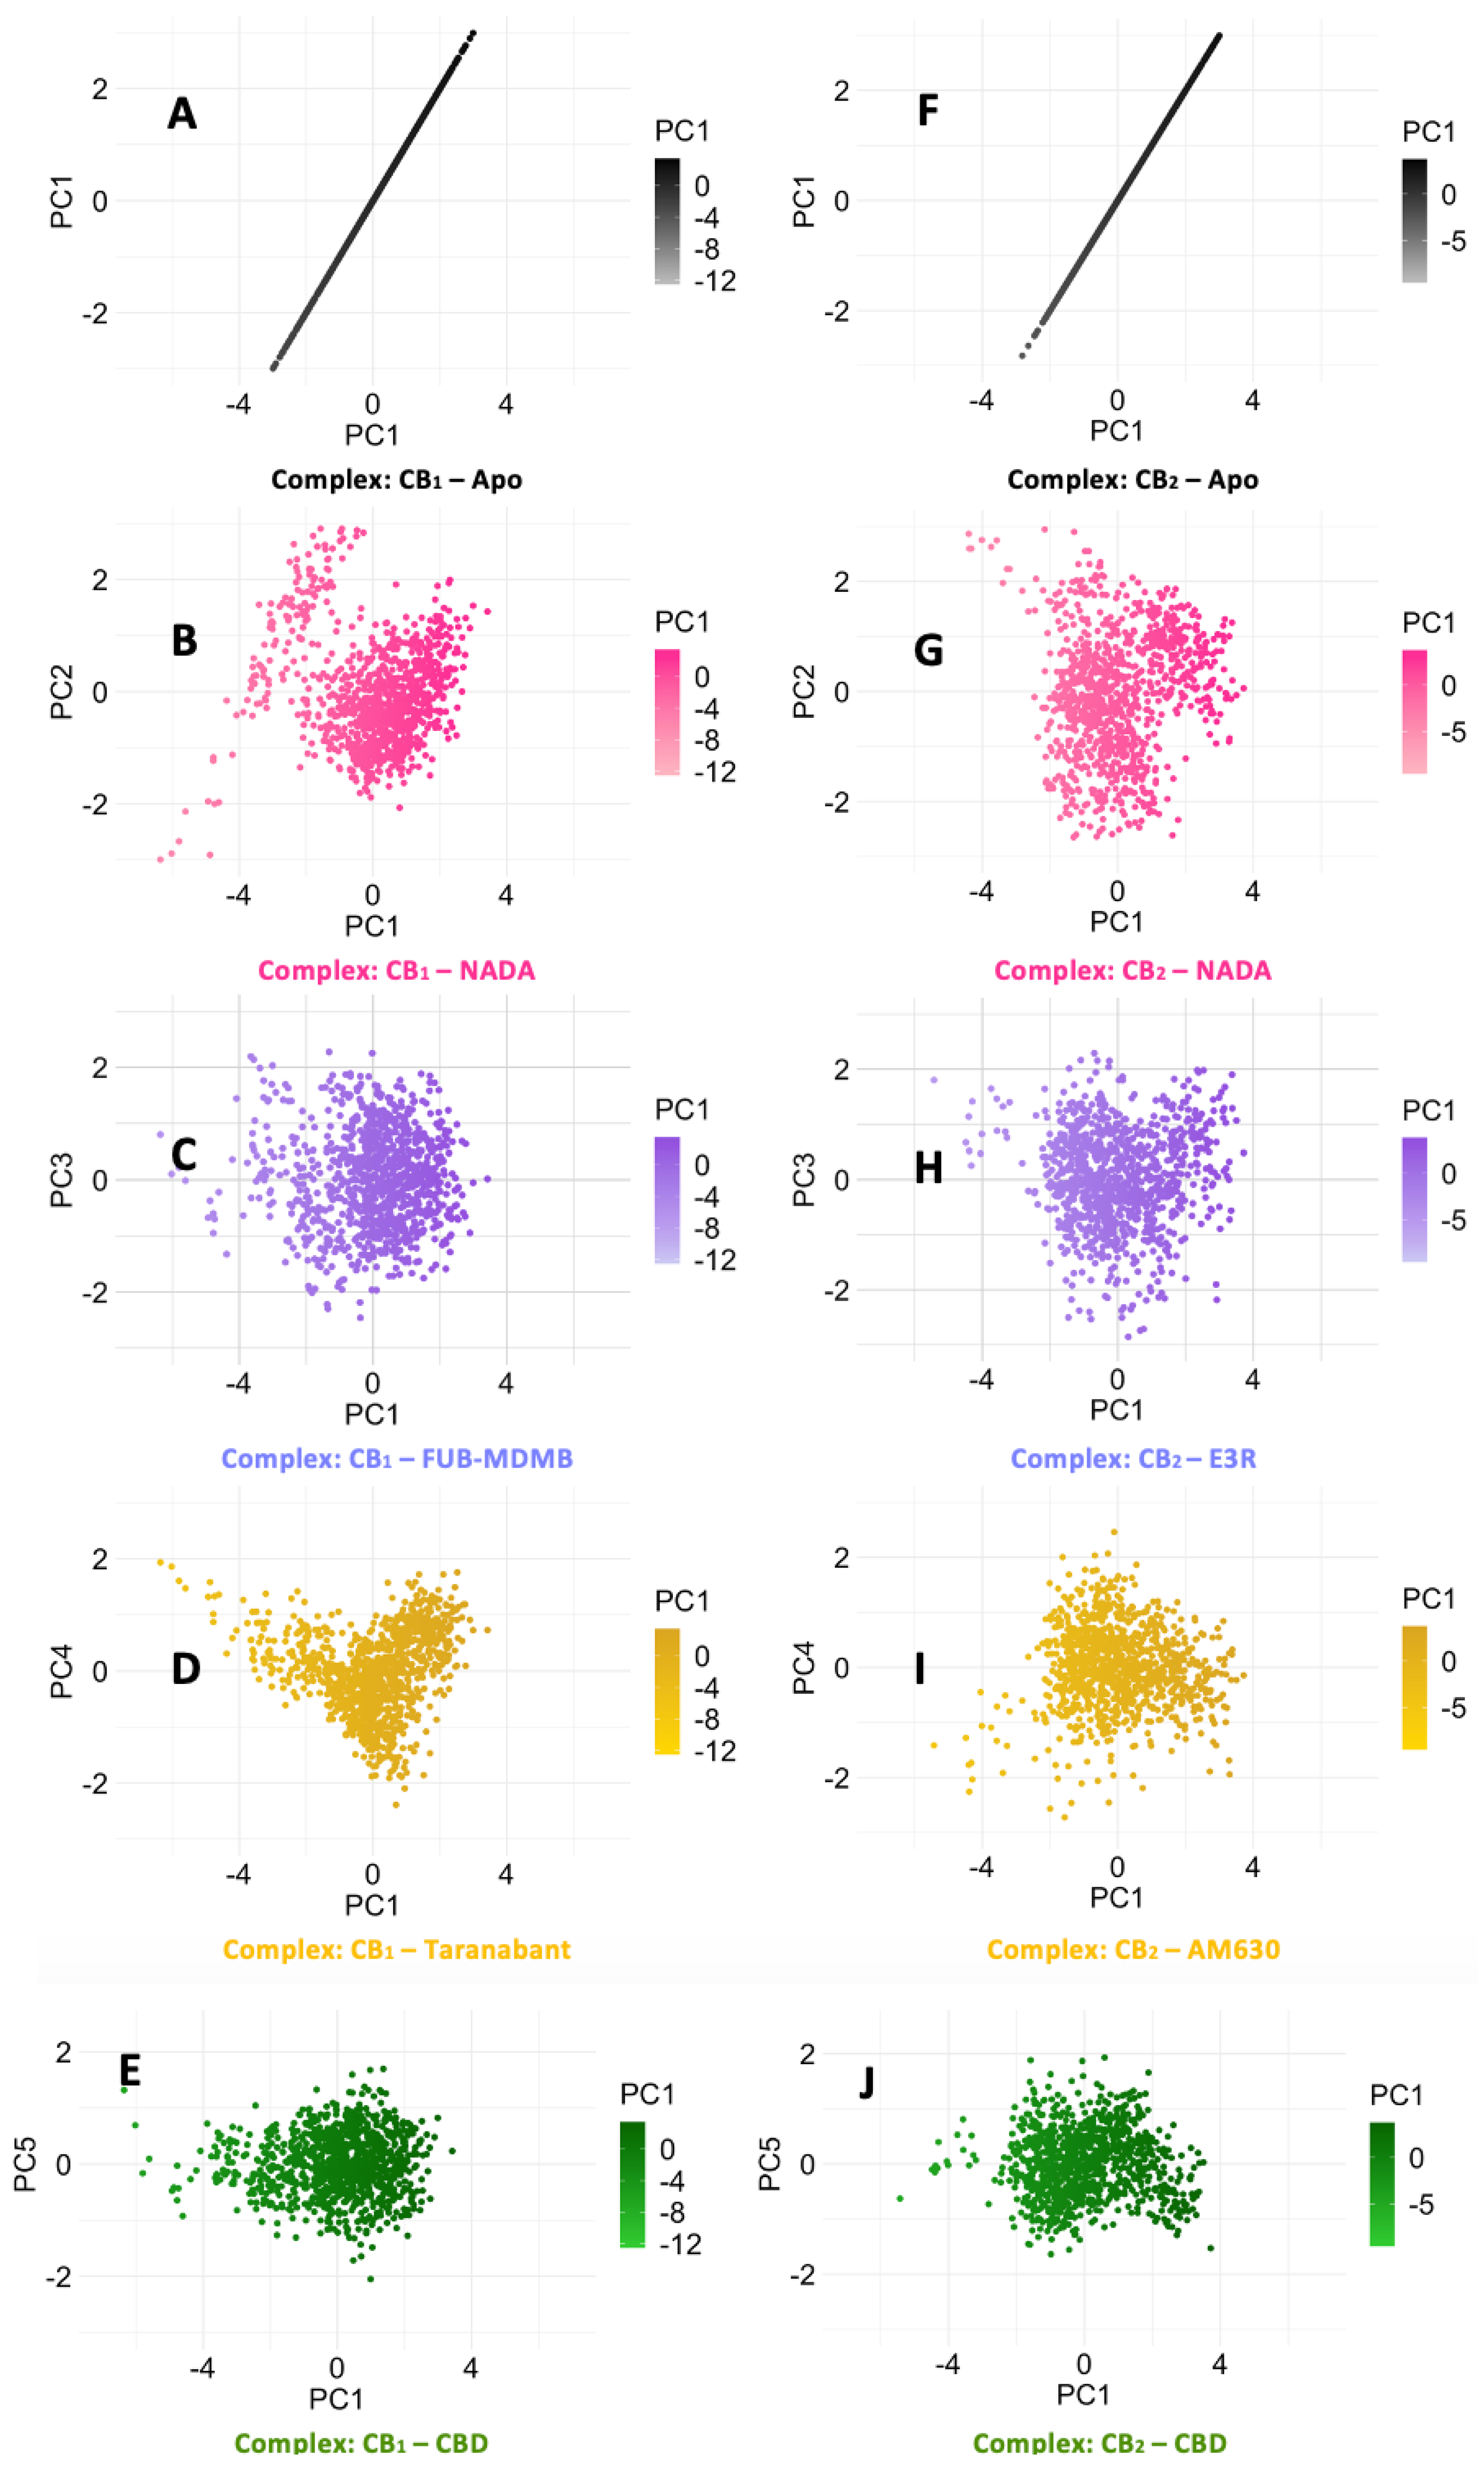
The Cα RMSD data for CB1, as represented in Graph A (Figure 6.1) along with their corresponding PCA plots A – E (Figure 6.2). The endogenous ligand NADA showed a highly stable Cα RMSD, consistently under between a range of 2 Å, aligning with the tight clustering seen in PCA plot B which is line with the ECSs natural affinity for NADA. FUB-MDMB and Taranabant also showed stability from 30 ns into the simulation, however they both displayed an increase in dynamics, shown by a broader spread in their respective PCA plots (C and D), indicating a change in dynamics when bound yet still is still a stable conformation. In contrast, CBD causes a unique conformational change (Figure 6.1A) where CBD exhibits a different Cα RMSD pattern, indicative of an alternative binding mode such as a modulator. CB2 receptor dynamics shown in Graph B (Figure 6.1) and PCA plots F – J (Figure 6.2) indicate a varied response to ligand interactions. The Cα RMSD for the CB2 apo form shows natural flexibility, which increases when bound to NADA. These significant Cα RMSD peaks, imply that NADA might induce a range of conformations within CB2, which is supported by the scattered PCA plot G. The agonist and inverse agonist exhibit Cα RMSD variability, thereby suggesting diverse conformational shifts. CBDs moderate Cα RMSD values display partially agonistic effect on CB2 receptor conformation. The larger spread in the PCA plots for CB2 compared to CB1, correlates with the higher Cα RMSD values observed for CB2, suggesting that CB2 may undergo more pronounced conformational changes upon ligand binding. Additionally, both proteins display more dynamism after ~50 ns.
Finally, the scree plots (Figure 6.3) offer a comparative analysis of the PCs that describe the variance in the Cα RMSD of for p-CBRs. For CB1, PC1 captures a sizeable portion of the variance (46.63 %), suggesting a dominant conformational change. The sharp decline to PC2 and gradual descent thereafter indicates that most of the dynamic behaviour is concentrated in the first two PCs. In contrast, the CB2 protein exhibits a more even distribution of variance across the PCs, with a less pronounced drop between PC1 (39.38 %) and PC2 (26.95 %), which could imply a more complex ensemble of conformational states or a more evenly distributed set of movements. The differences in the variance distribution between CB1 and CB2 suggest distinct conformational flexibility and their different mechanisms of action in response to ligand binding.
Figure 6.1.
Stability of ligand-receptor complexes over time Cα RMSD. (A) CB1 and (B) CB2 receptor dynamics represented by Cα RMSD measurements in Å over a 250 ns simulation. Each plot tracks the stability of CBRs in their apo form and in complex with various ligands: NADA, an agonist (FUB-MDMB for CB1 and E3R for CB2), an inverse agonist (Taranabant for CB1 and AM630 for CB2), and CBD. Higher Cα RMSD values indicate greater deviation from the initial structure, reflecting changes in conformational stability.
Figure 6.2.
PCA of CB1 and CB2 Cα RMSD receptor dynamics. PCA scatter plots (A – E) depict the Cα RMSD of various ligand-bound CB1 systems in comparison to its apo state, while plots (F – J) similarly illustrate the CB2 receptor dynamics. The spread of data points reflects the conformational diversity sampled during the simulations, with denser clusters indicating more frequently adopted conformations.
Figure 6.3.
Scree plots for CB1 and CB2 protein Cα RMSD variance. (A) depicts the variance explained by the principal components for the CB1 protein, while (B) shows the same for CB2.
Figure 6.3.
Scree plots for CB1 and CB2 protein Cα RMSD variance. (A) depicts the variance explained by the principal components for the CB1 protein, while (B) shows the same for CB2.
3.6. Protein Backbone Cα RMSF
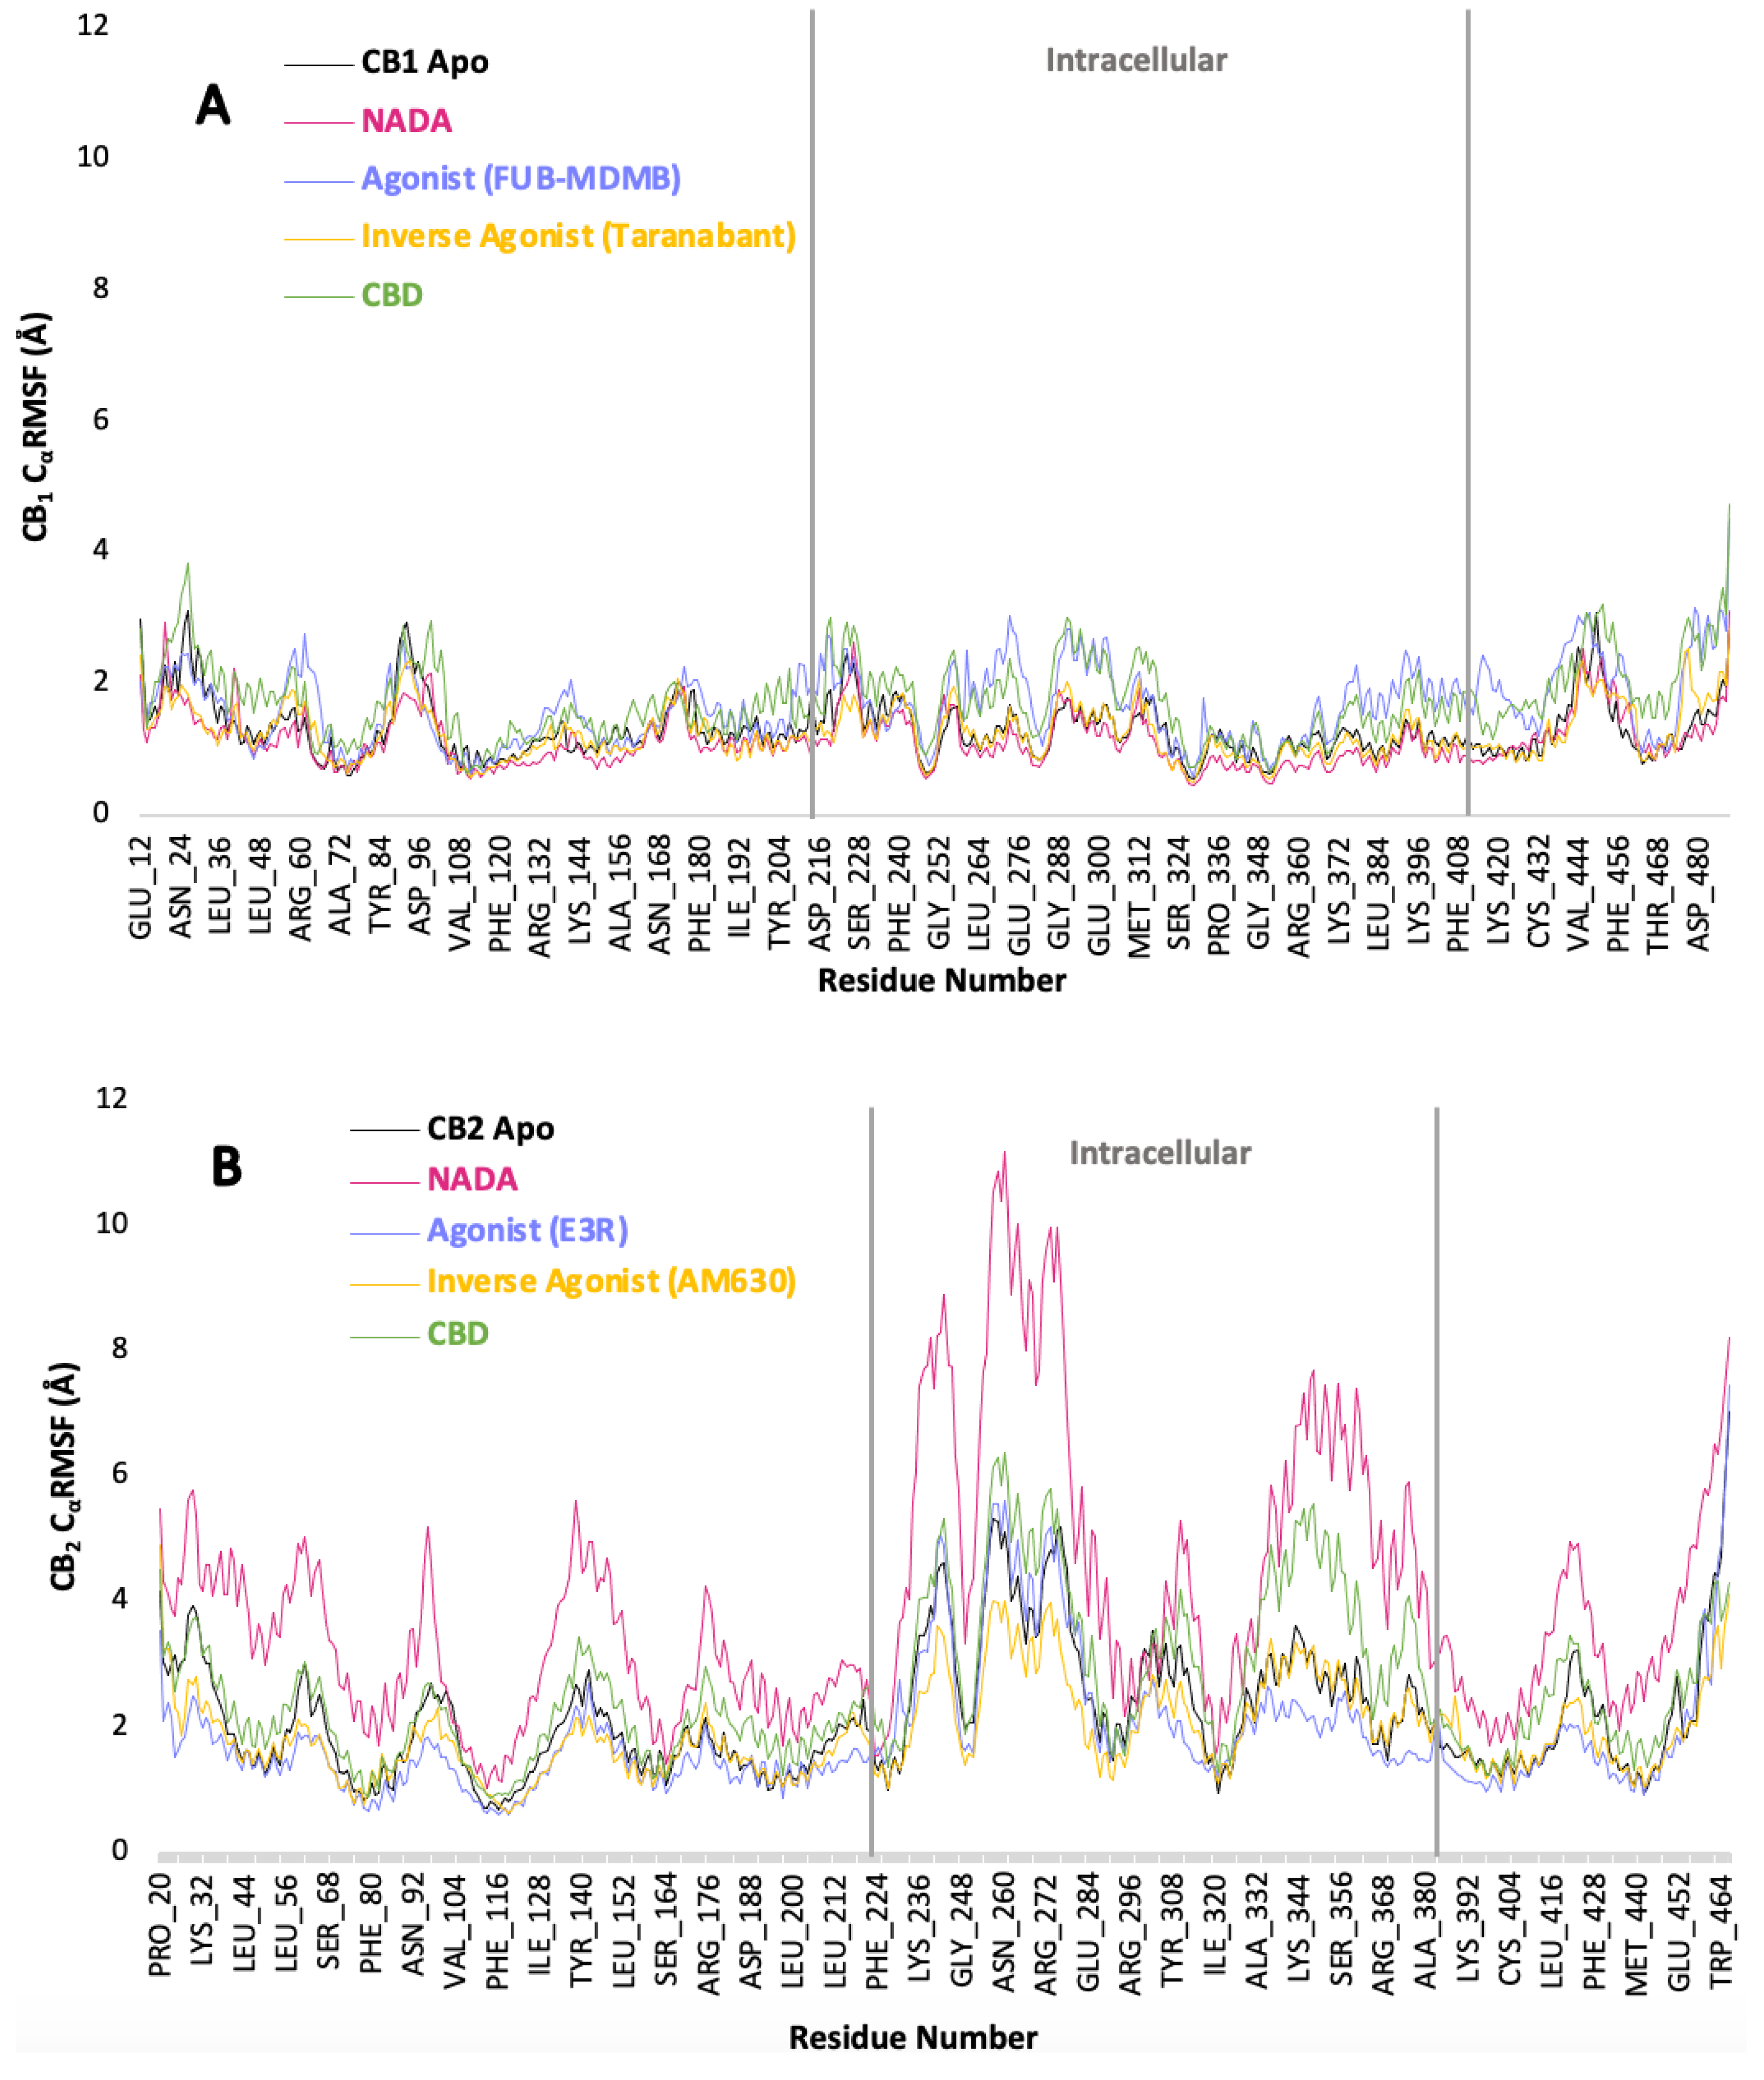
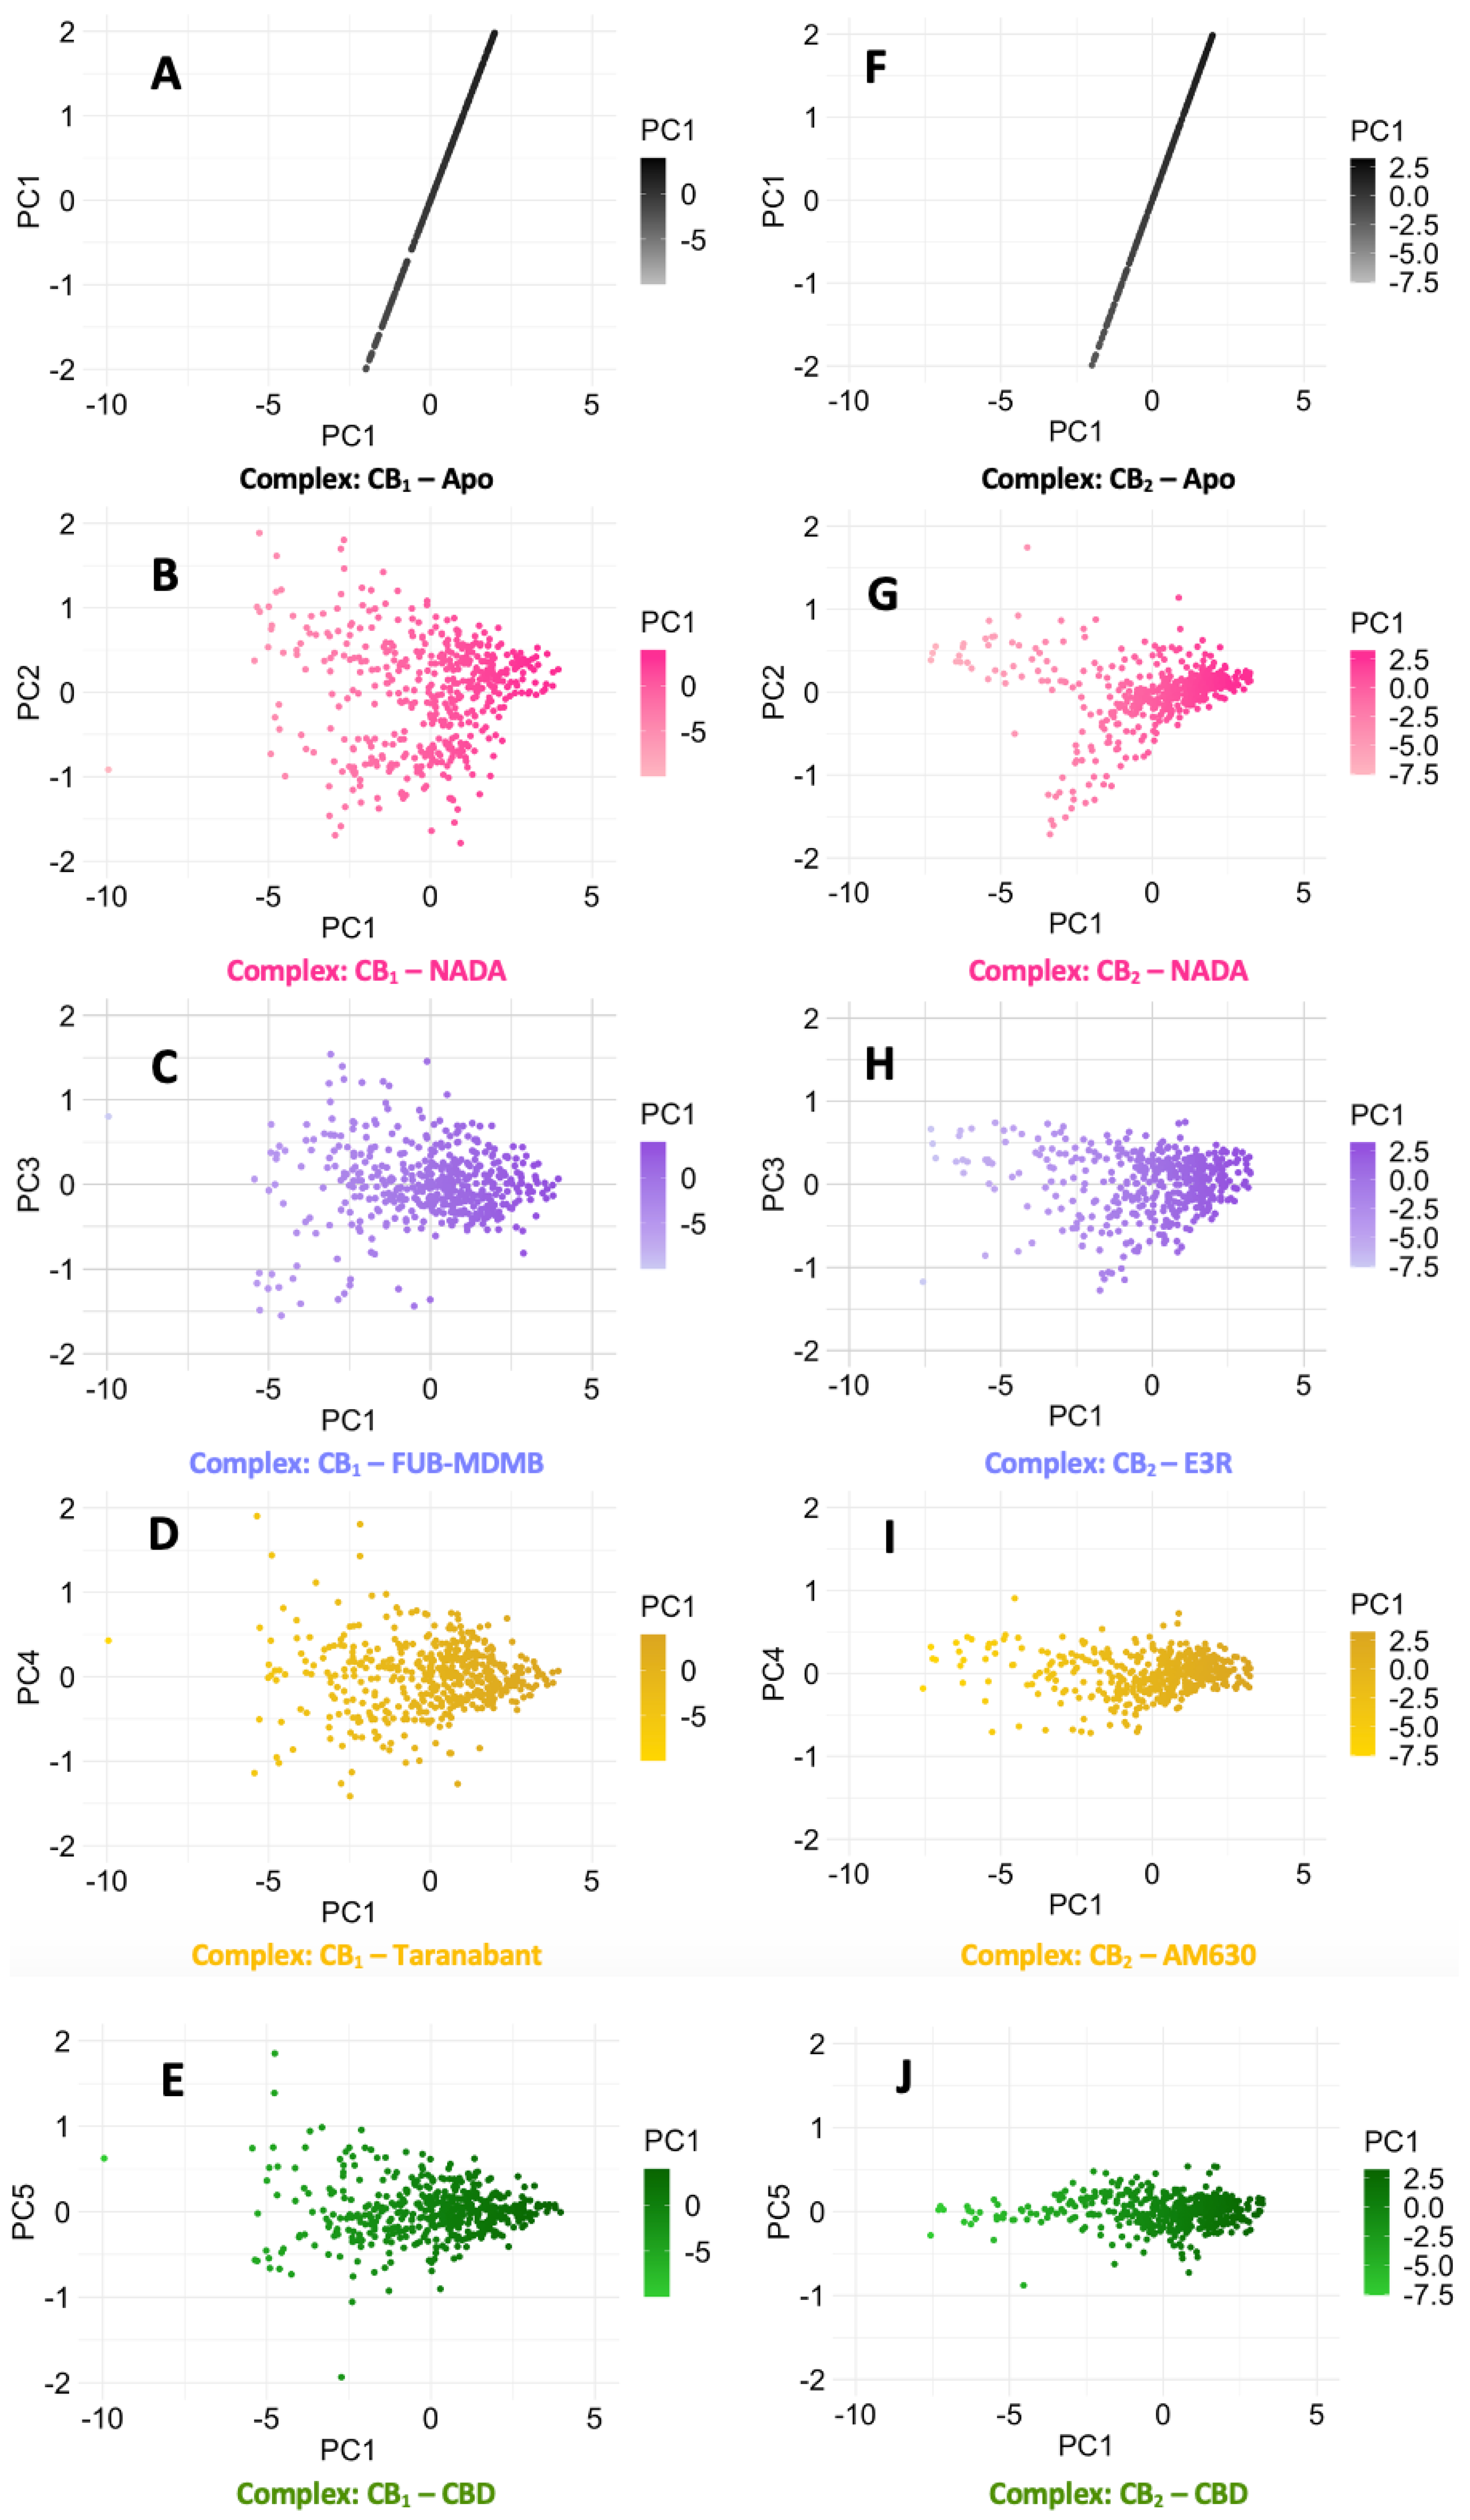
The Cα RMSF graph A for CB1 (Figure 7.1) shows a well-conserved dynamic profile across all residues when in the apo state and when interacting with ligands. NADA has a compact Cα RMSF which indicates a stable receptor-ligand interaction. FUB-MDMB and Taranabant have Cα RMSF peaks in the membrane bound regions that differ when compared to the apo. Therefore, causing subtle conformational changes within the receptor in membrane bound regions. CBD shows a unique Cα RMSF profile to its counterparts especially in the membrane bound region such as between residues, Ile192 – Tyr204 and more residues showing distinct structural changes. Its PCA plot E also suggests a unique binding conformation, highlighting the allosteric or modulatory nature of CBD. CBDs effect on CB2 presents an Cα RMSF profile with moderate fluctuations, aligning with its potential partial agonistic effect. However, CBD shows to be more dynamic than a full agonist as substantiated by PCA plot J (Figure 7.2). CB2 displays a broader range of conformational adaptability as evidenced by higher Cα RMSF values and the scattered distribution within its PCA plots, especially in the presence of synthetic ligands. This comparative analysis emphasises the differential conformational responses of CB1 and CB2 to various ligands and emphasises the importance of considering receptor flexibility in the development of cannabinoid-based therapeutics. These findings suggest that while CB1 may have a more rigid binding pocket, conferring specificity, CB2 flexible nature could allow for broader ligand accommodation, which might be significant for its role in immune modulation. The scree plots provided in figure 7.3 offer a detailed view of the dynamical properties of p-CBRs by analysing the Cα RMSF across PCs derived from a PCA (Figure 7.2). For CB1, PC1 accounts for a substantial 82.51 % of the total variance, indicating that a single collective motion characterises the flexibility and dynamic behaviour of the protein within the simulation period. This main fluctuation captured by PC1, may be associated with the protein's functional conformational changes or with its interactions with surrounding molecules. The steep drop to 8.05% variance explained by PC2 and even lower for subsequent PCs whereby fluctuations in the context of the protein's dynamics are minimal yet still affect signalling. Similarly, CB2 protein exhibits a more pronounced dominance in its first principal component (PC1 at 91.42 %), suggesting an even more constrained set of motions across residues, indicative of a more rigid or stable structure. Comparatively, CB2 displays less diversity in its motion patterns than CB1, as evidenced by the higher proportion of variance explained by its PC1. This could reflect differences in their respective ECS roles, ligand-binding affinities, and stability. The minimal contributions of higher-order PCs (PC2 through PC5) for both proteins suggest that these additional fluctuations play a lesser role in defining the proteins' overall dynamics yet still influences cellular signalling.
Figure 7.1.
Residue flexibility of ligand-receptor complexes. (A) CB1 and (B) CB2 Cα RMSF in Å across all residues. These plots illustrate the flexibility of each residue in the apo form and when bound to various ligands: NADA, an agonist (FUB-MDMB for CB1 and E3R for CB2), an inverse agonist (Taranabant for CB1 and AM630 for CB2), and CBD. The area between the grey lines shows the intracellular regions, while the rest represent membrane-bound regions. Higher Cα RMSF values indicate greater flexibility and potential dynamic regions within the protein structure.
Figure 7.2.
PCA of CB1 and CB2 Cα RMSF receptor dynamics. Scatter plots from (A – E) represent the Cα RMSF of the CB1 receptor in its apo form and complexed with various ligands, while plots (F – J) mirror this for CB2. The scatter of points across the PCA plots reveals the diversity of conformational states examined in the simulations, with areas of higher density indicating a greater frequency of certain conformations by the receptors. These plots provide insights into the flexibility and dynamic behaviour of each receptor-ligand complex.
Figure 7.3.
Scree plots for PCA of Cα RMSF in CB1 and CB2 proteins. (A) Presents the scree plot for CB1, and (B) for CB2. The plots illustrate the proportion of total variance in atomic fluctuations captured by each PC, indicating the relative significance of these components to the overall movement observed in the proteins.
3.7. Protein Backbone Cα Radius of Gyration
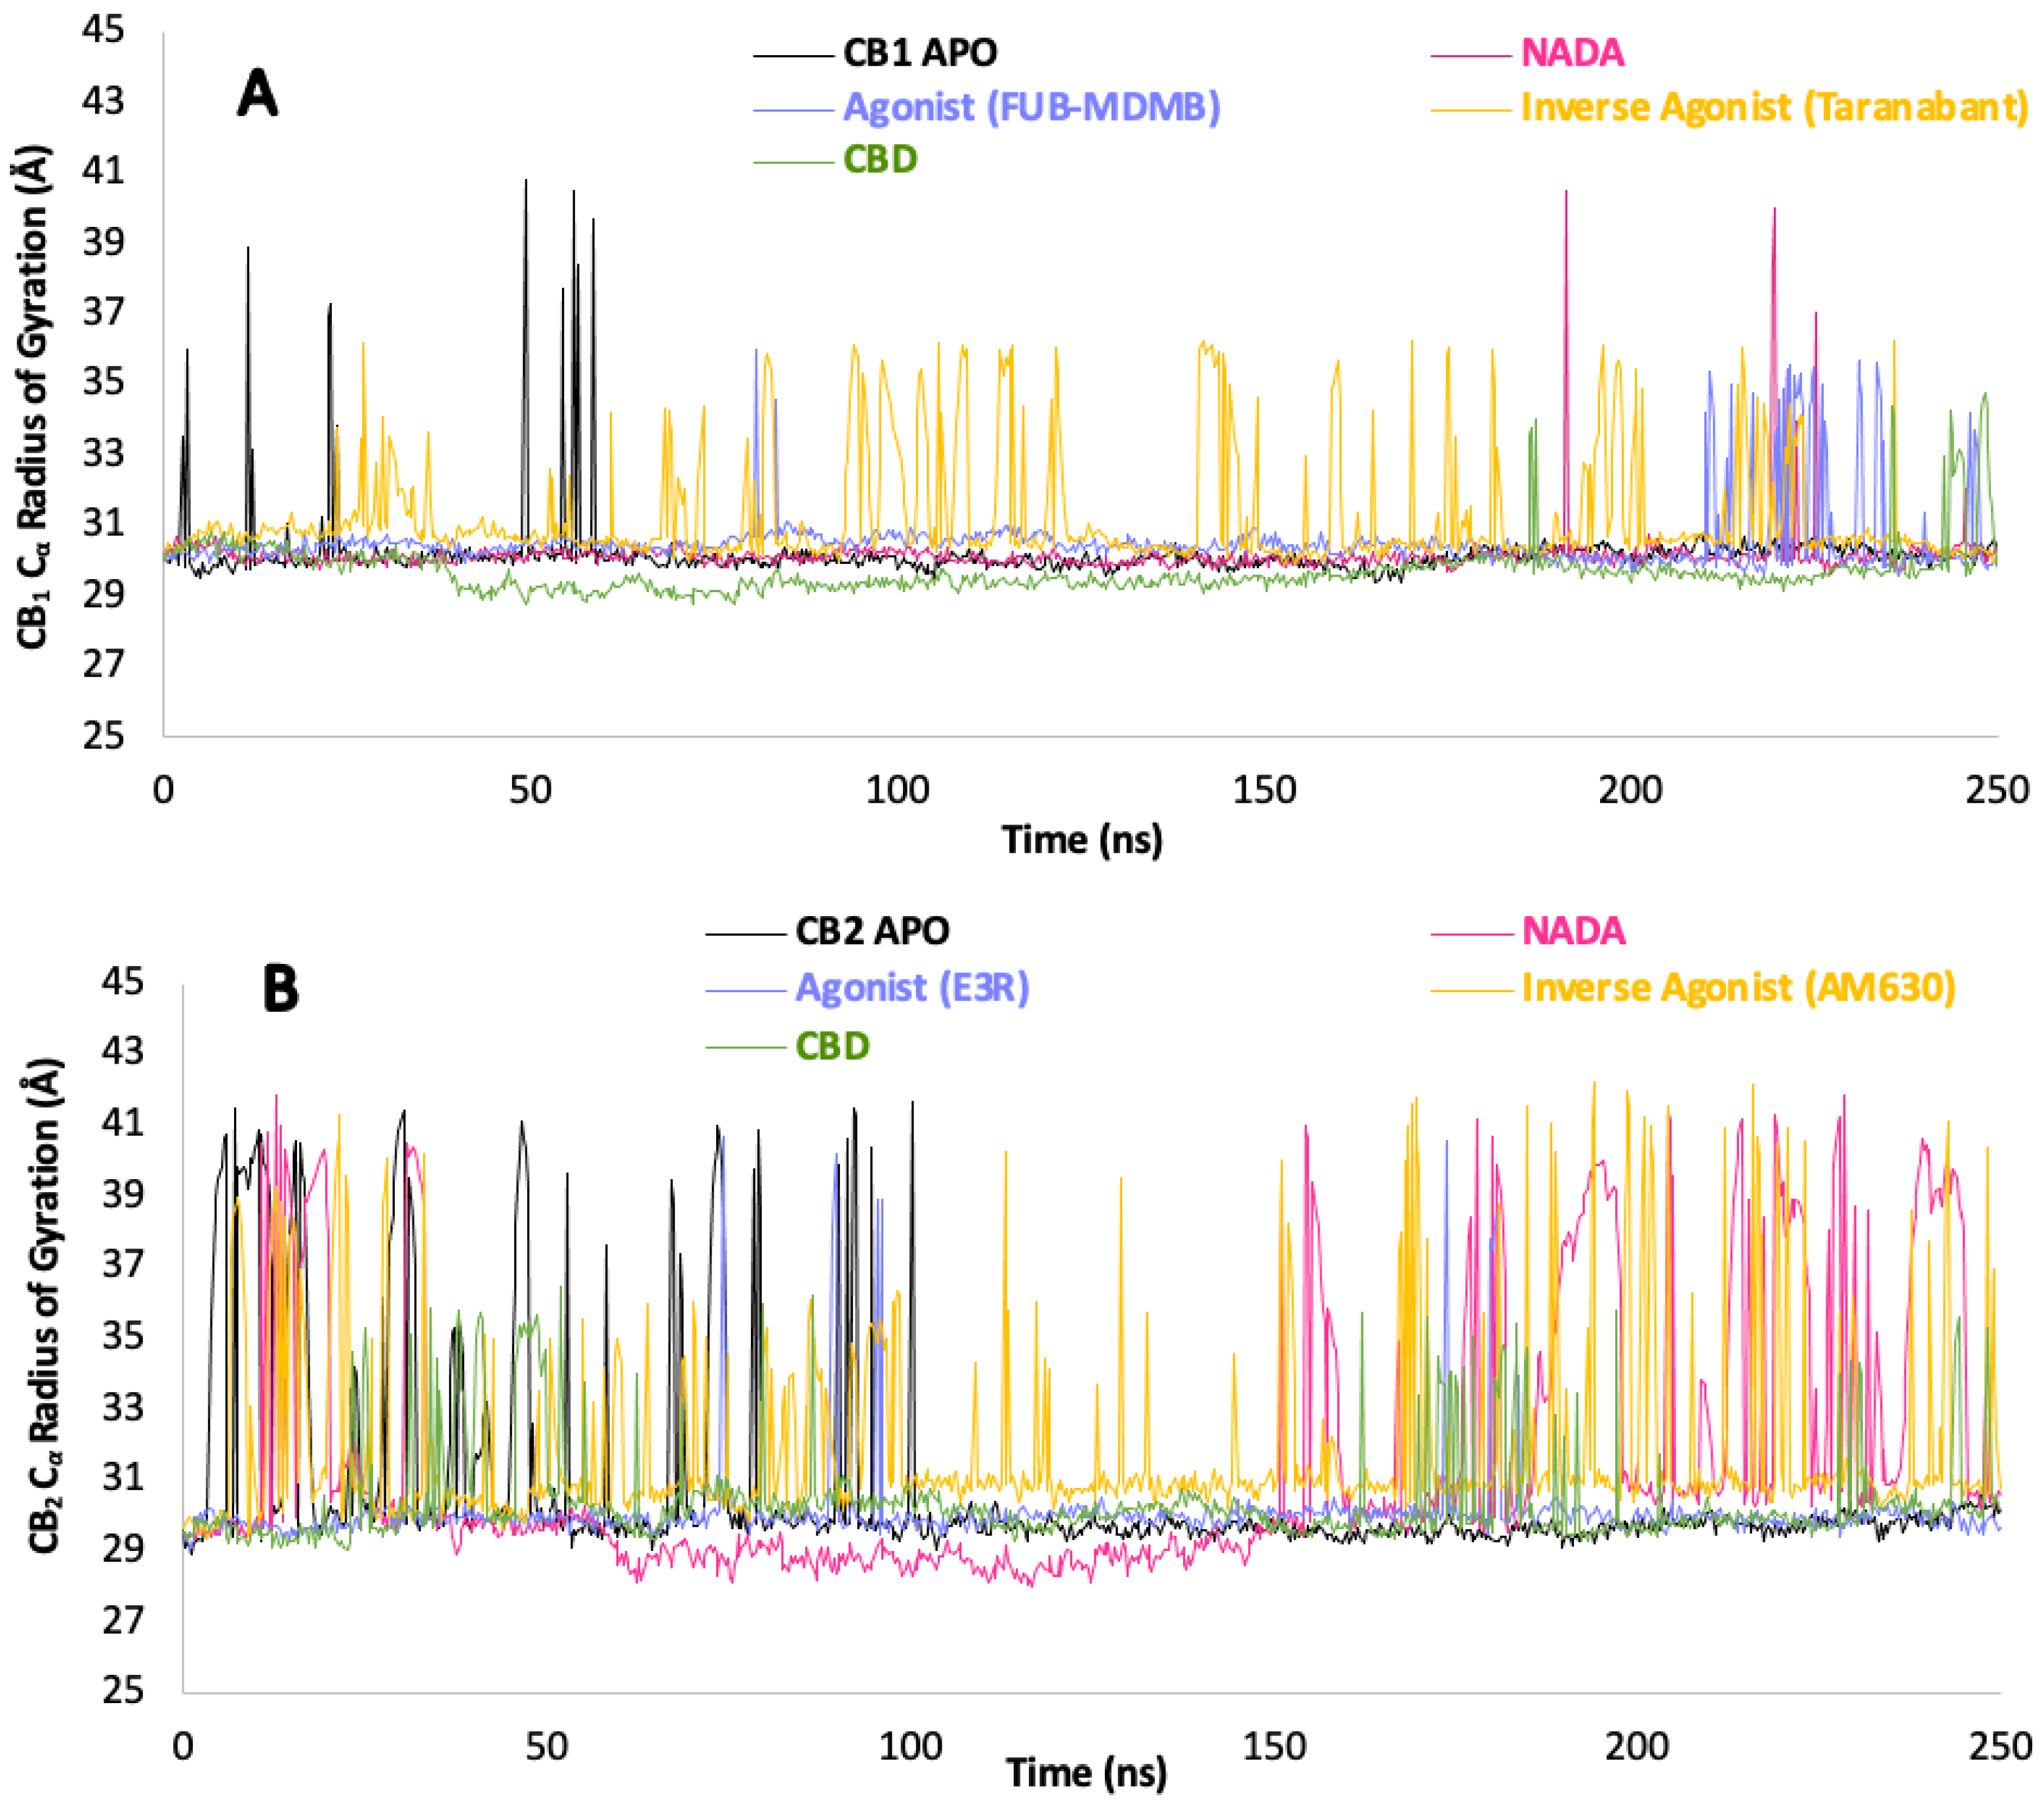
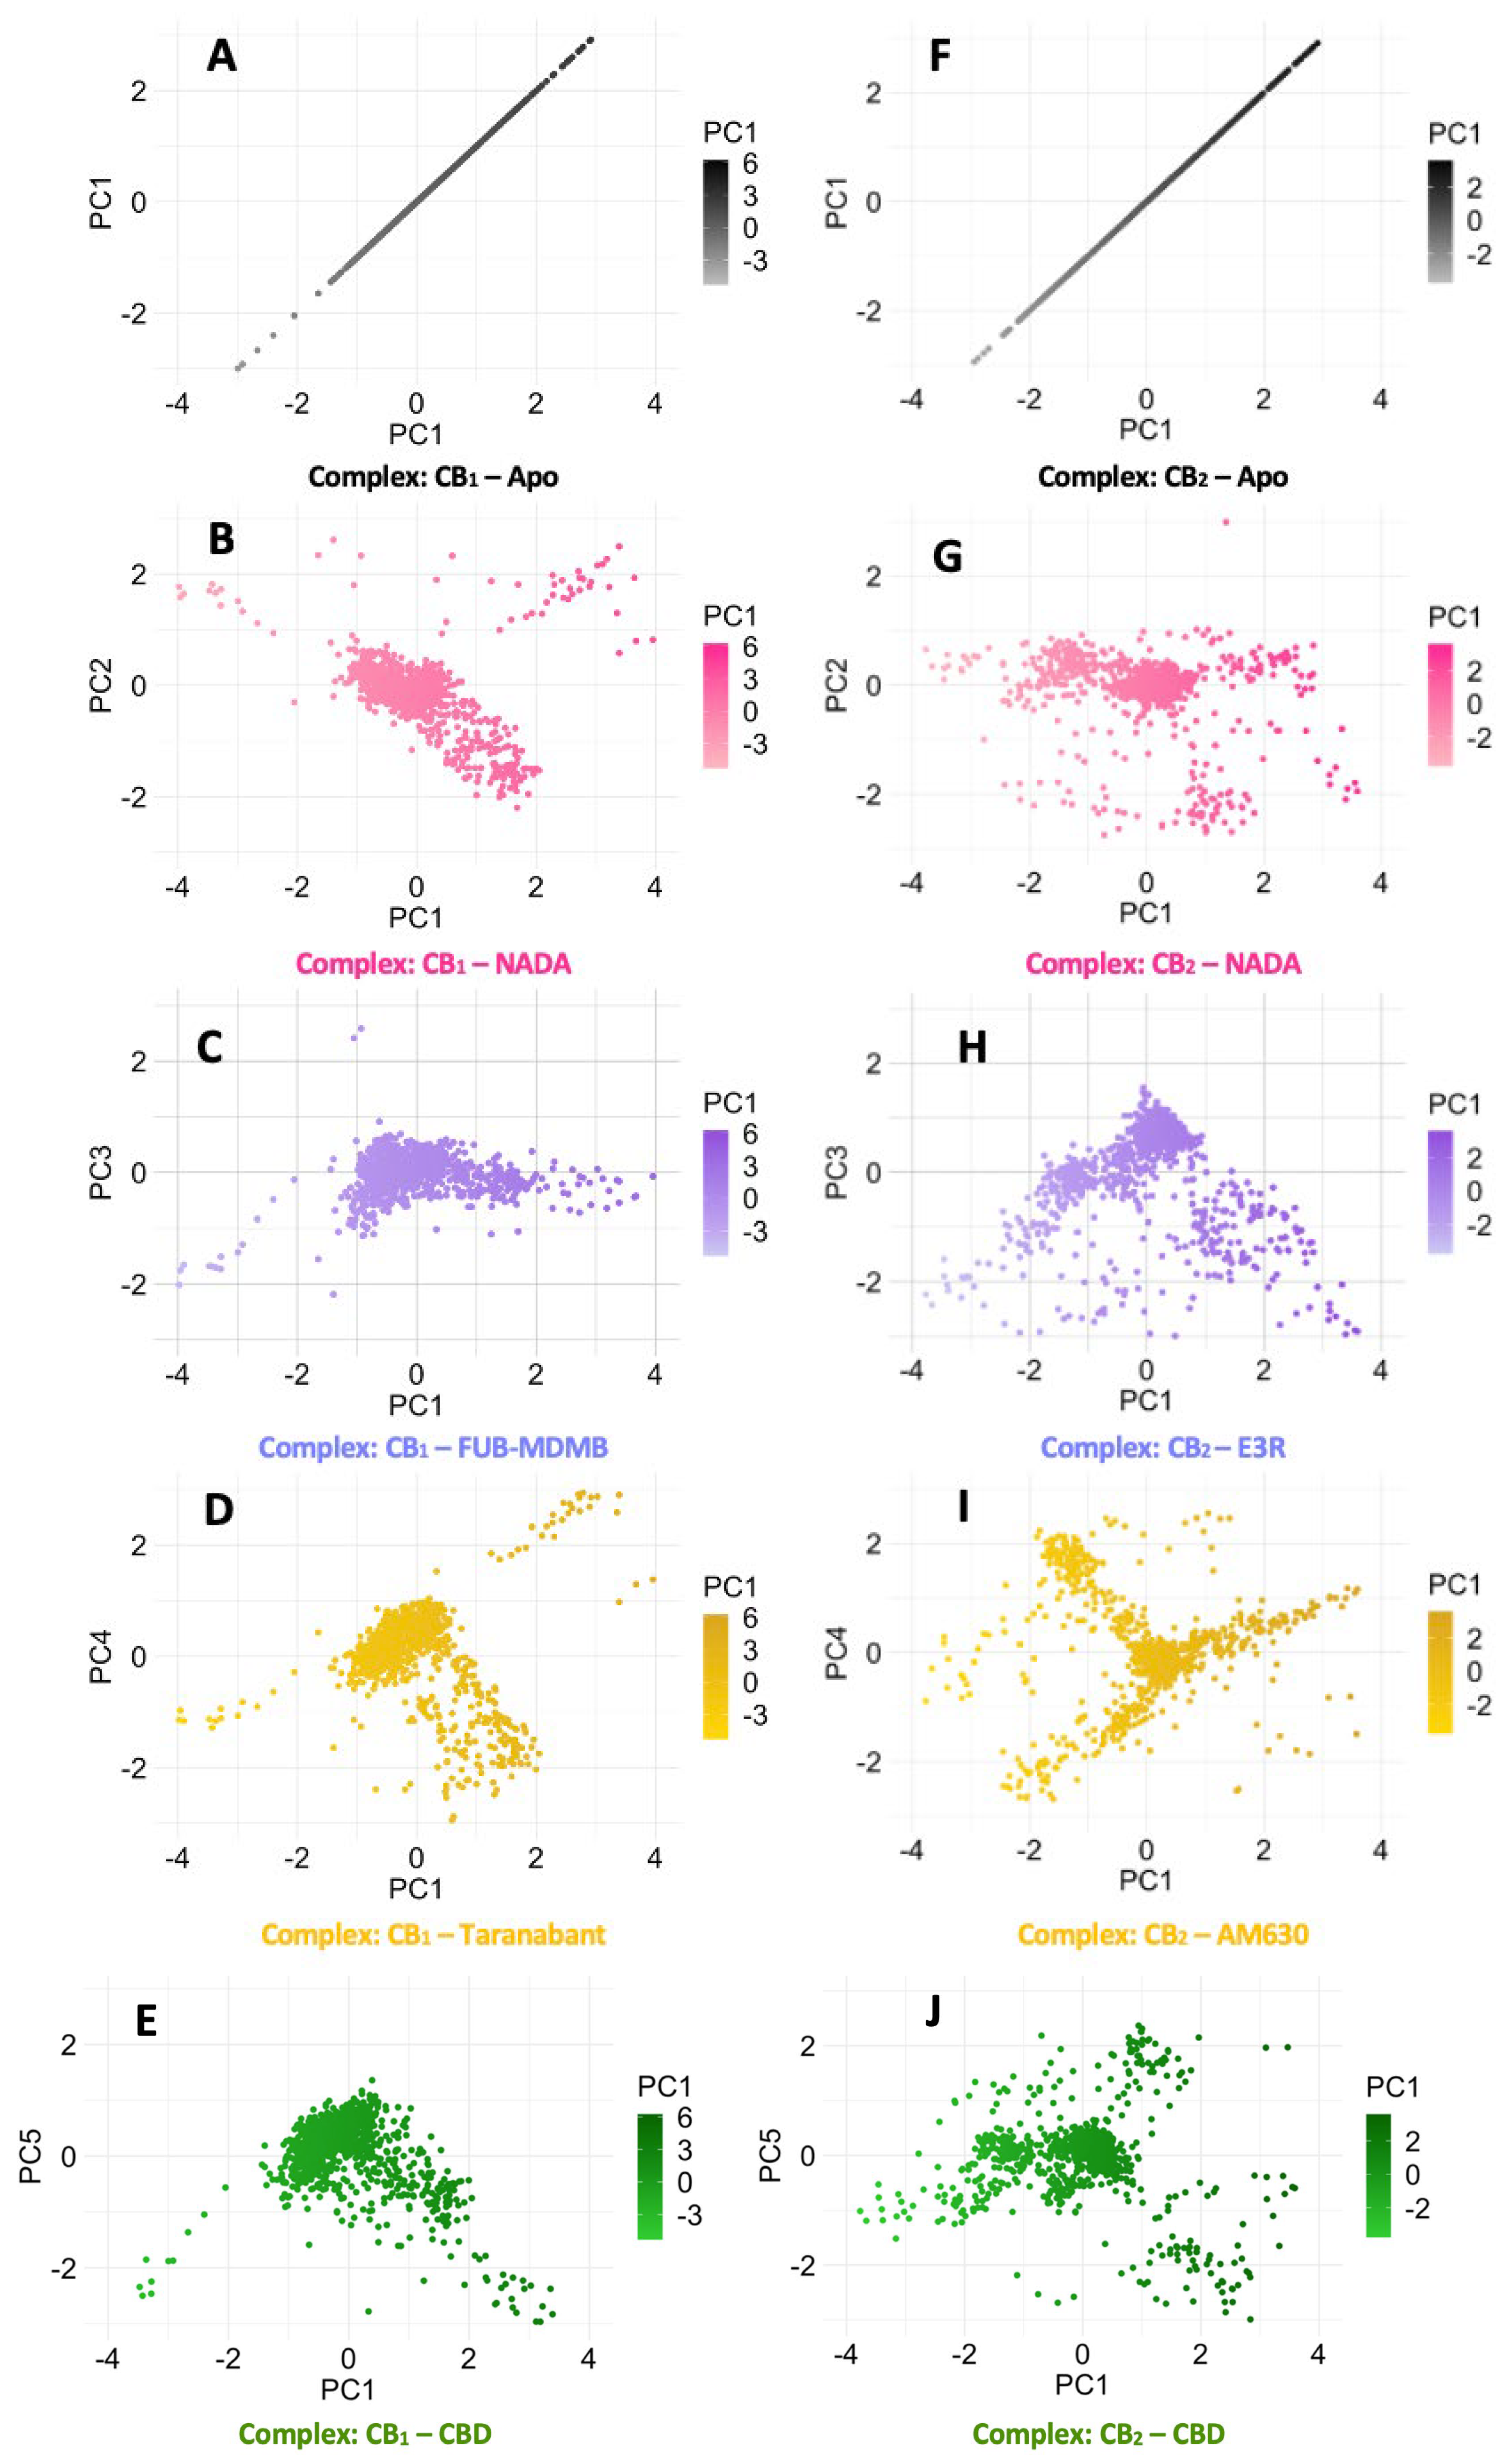
The RoG of CB1 (Figure 8.1 A) remains consistent in the apo form, suggesting a stable and well-folded state. Upon binding with Taranabant, the receptor has a lower level of compactness, as indicated by the RoG values while CBD increase the compactness, implying that these ligands significantly perturb the overall folding and stability of the receptor when compared to the apo. Interestingly, towards 200 ns CBDs interaction with CB1 shows a minor increase in RoG variability, suggesting subtle differences in the receptor’s compactness and perhaps slight changes in the folding dynamics, which is reflected in PCA plot E (Figure 8.2) with a slightly more dispersed cluster. The RoG plot for CB2 exhibits greater variability, particularly in response to ligand interactions, signifying a more dynamic structural behaviour. The receptor in its apo state already shows a higher degree of fluctuation, indicating intrinsic flexibility. Upon binding with ligands such as NADA and E3R, spikes in RoG values are observed, indicative of transient expansions in the receptor's structure, which represent regions undergoing conformational changes. The inverse agonist AM630 also causes significant fluctuations in RoG, further emphasising the dynamic nature of CB2 and its diverse ligand-induced states. These variations in protein compactness and folding dynamics are crucial for understanding the allosteric effects of ligand binding and the resulting functional outcomes.
The PCA of the RoG for p-CBRs (Figure 8.3) provides insightful data on the intrinsic flexibility and the dynamic nature of these proteins. The relatively even distribution of variance explained across the initial five PCs for both CB1 and CB2 suggests a complex interplay of gyrations within their structures. Specifically, CB1 demonstrates a relatively uniform decline in variance explained, with PC1 accounting for 23.9 %, and a gradual decrease to 16.3 % by PC5. This uniformity in variance distribution could indicate that no single conformational change dominates the dynamic behaviour of CB1, implying a more distributed and nuanced gyration pattern that may facilitate its interaction with various ligands. Similarly, CB2 RoG variance follows a close pattern with PC1 explaining 23.7 % of the variance, only marginally less than that of CB1, and PC5 accounting for 17.1 %. This suggests that CB2 also does not rely on predominant conformational changes, but rather a combination of motions contributing to its dynamic profile. The slightly higher variance captured by the first PC in both receptors might reflect the overall size and conformational changes, which are critical for understanding how these receptors adapt and respond to different ligands. The subsequent PCs capturing a substantial portion of variance indicate multiple, significant conformational fluctuations rather than a single, dominant motion, which is typical for flexible proteins that interact with diverse molecules.
Figure 8.1.
Cα Protein compactness analysis over time. (A) CB1 and (B) CB2 receptors structural compactness, indicated by the radius of gyration in measured in Å over a simulation period of 250 ns. The graphs compare the RoG of the apo CBRs to their complexes with NADA, agonists (FUB-MDMB for CB1 and E3R for CB2), inverse agonists (Taranabant for CB1 and AM630 for CB2), and CBD. .
Figure 8.2.
PCA of CB1 and CB2 radius of gyration. The PCA scatter plots from (A – E) correspond to the CB1 receptor in its apo state and complexed with various ligands: NADA, FUB-MDMB, Taranabant, and CBD. Similarly, plots from (F – J) represent the CB2 receptor in its apo state and in complex with NADA, E3R, AM630, and CBD. These plots assess the overall compactness of the protein-ligand complexes over the course of simulations, with the RoG serving as an indicator of the protein's structural integrity and folding dynamics.
Figure 8.3.
Comparative PCA of CB1 and CB2 radius of gyration. (A) The scree plot for the CB1 receptor's RoG across the first five PCs. (B) The scree plot for the CB2 receptor's RG across the first five PCs. Each plot illustrates the percentage of total variance explained by the corresponding PC, highlighting the distribution of conformational flexibility within the protein structure.
3.8. Simulation Trajectory Snapshots
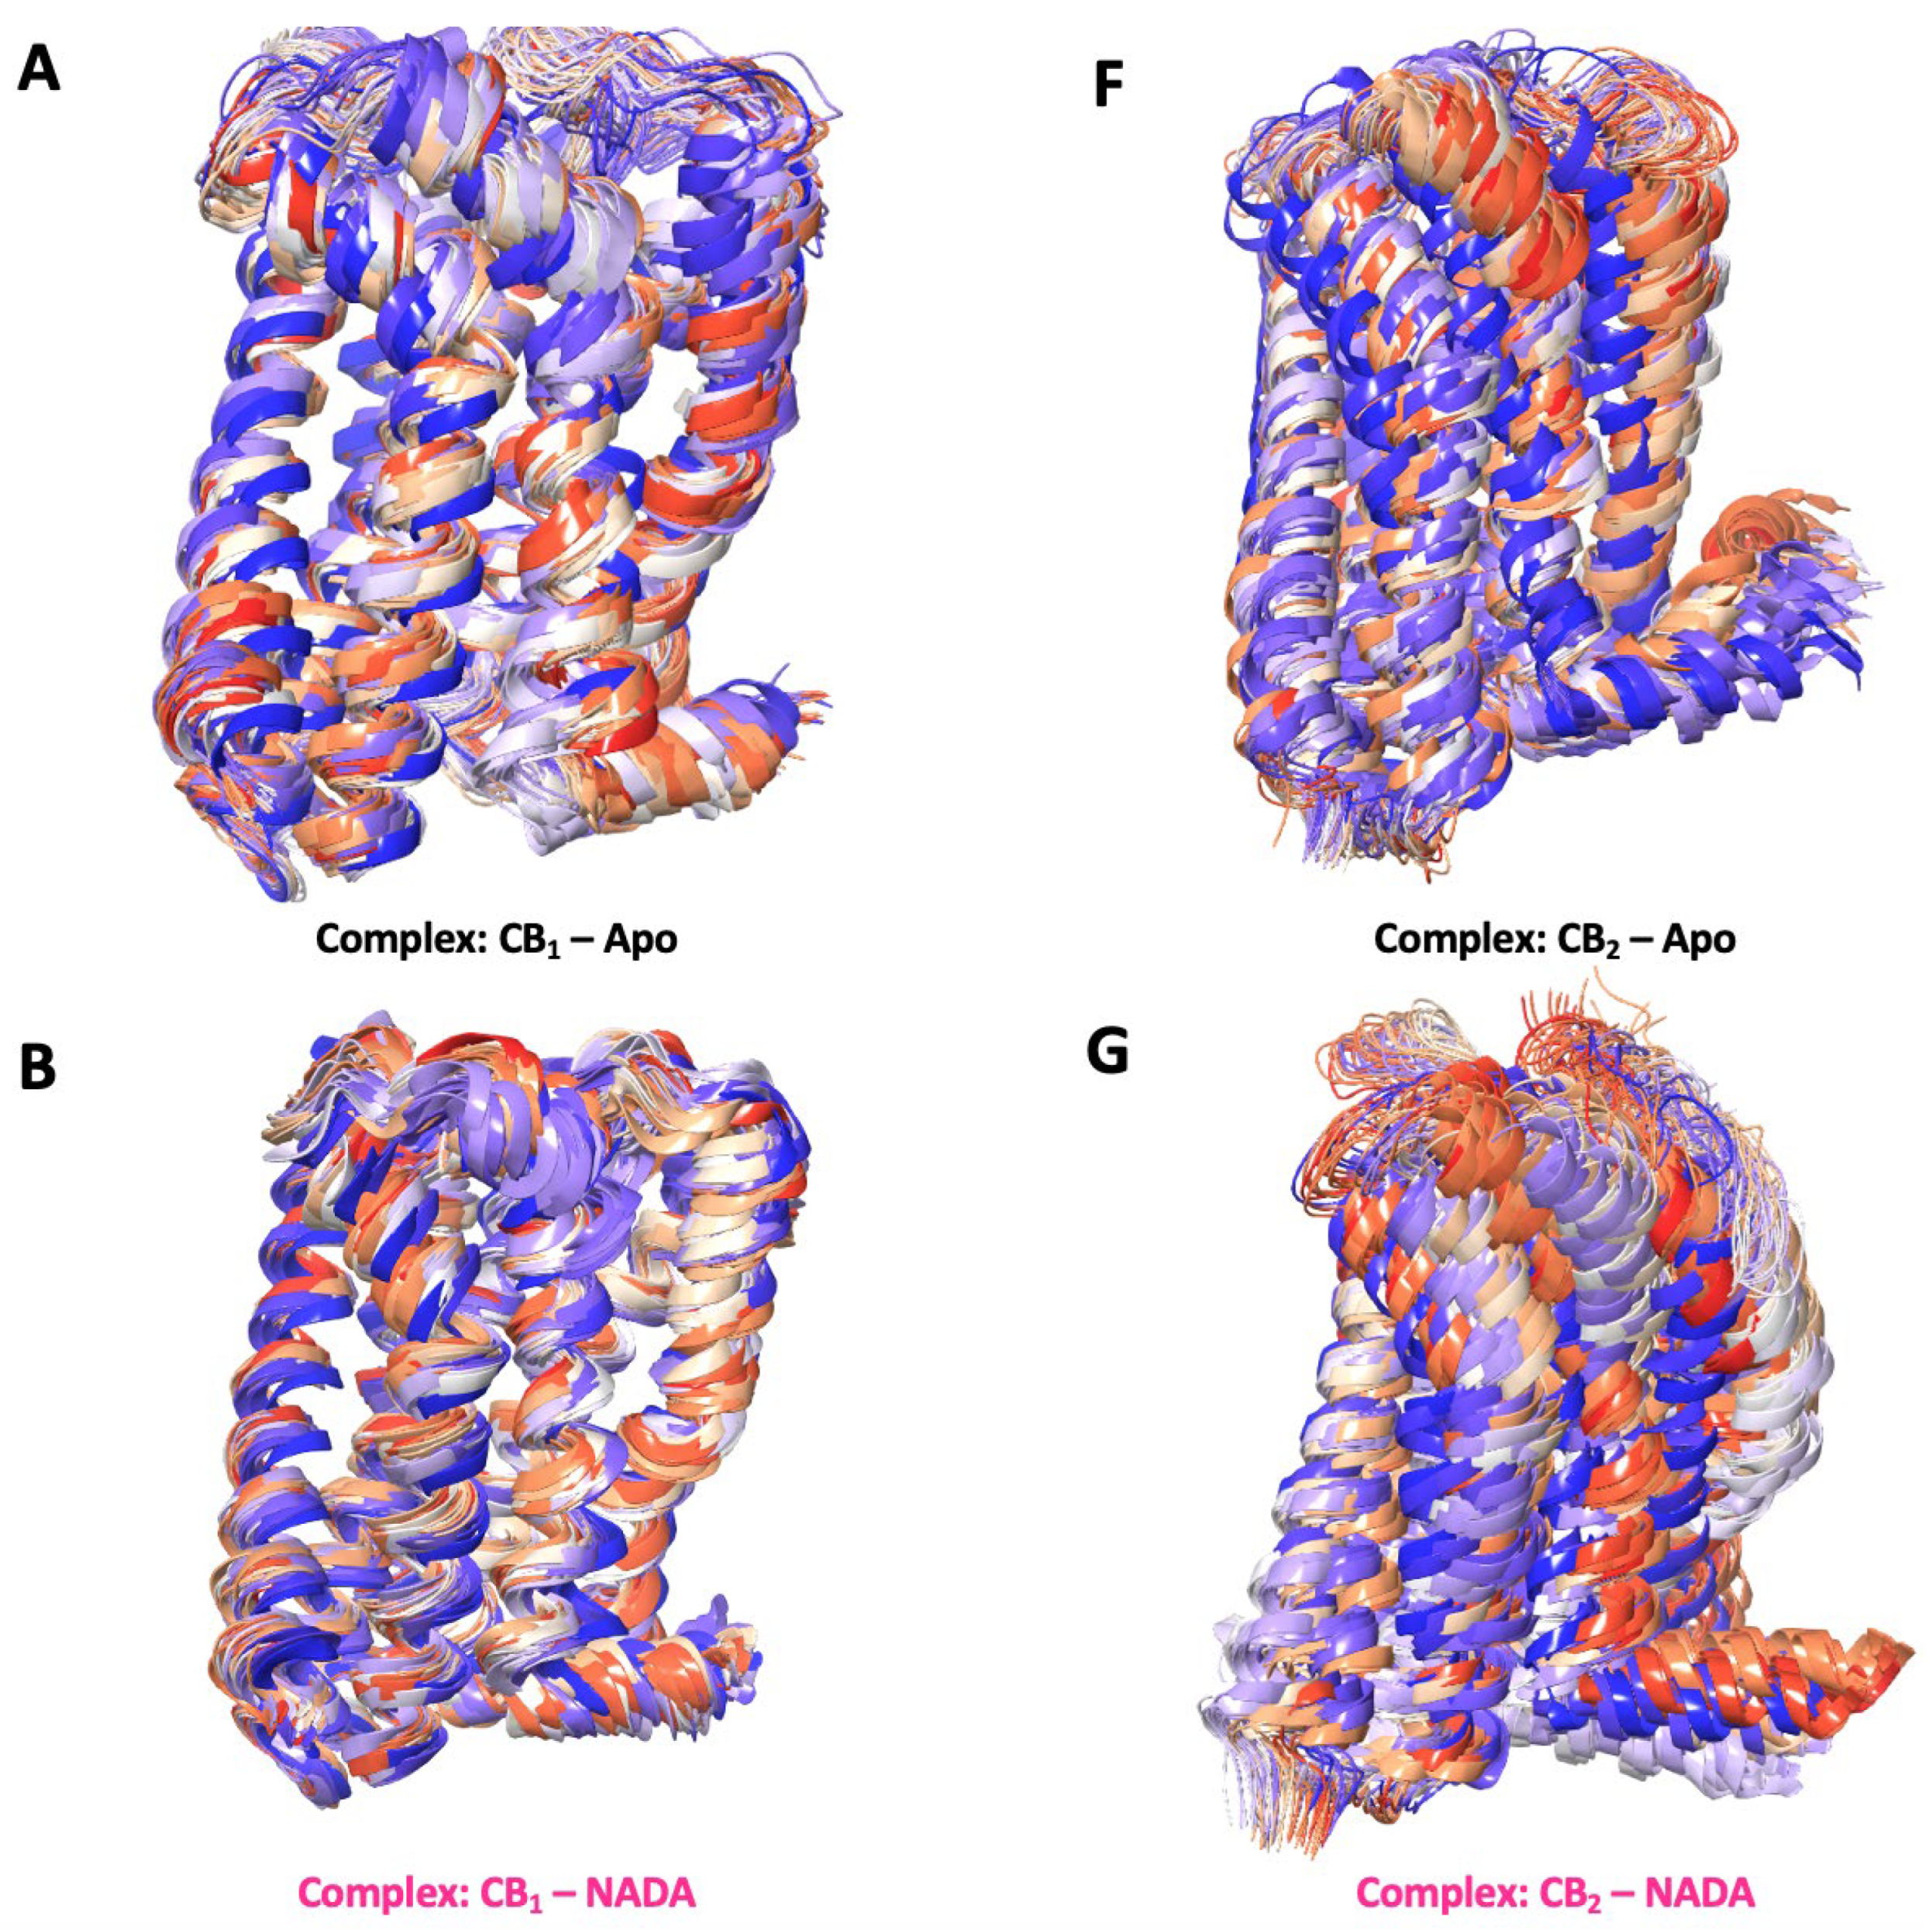
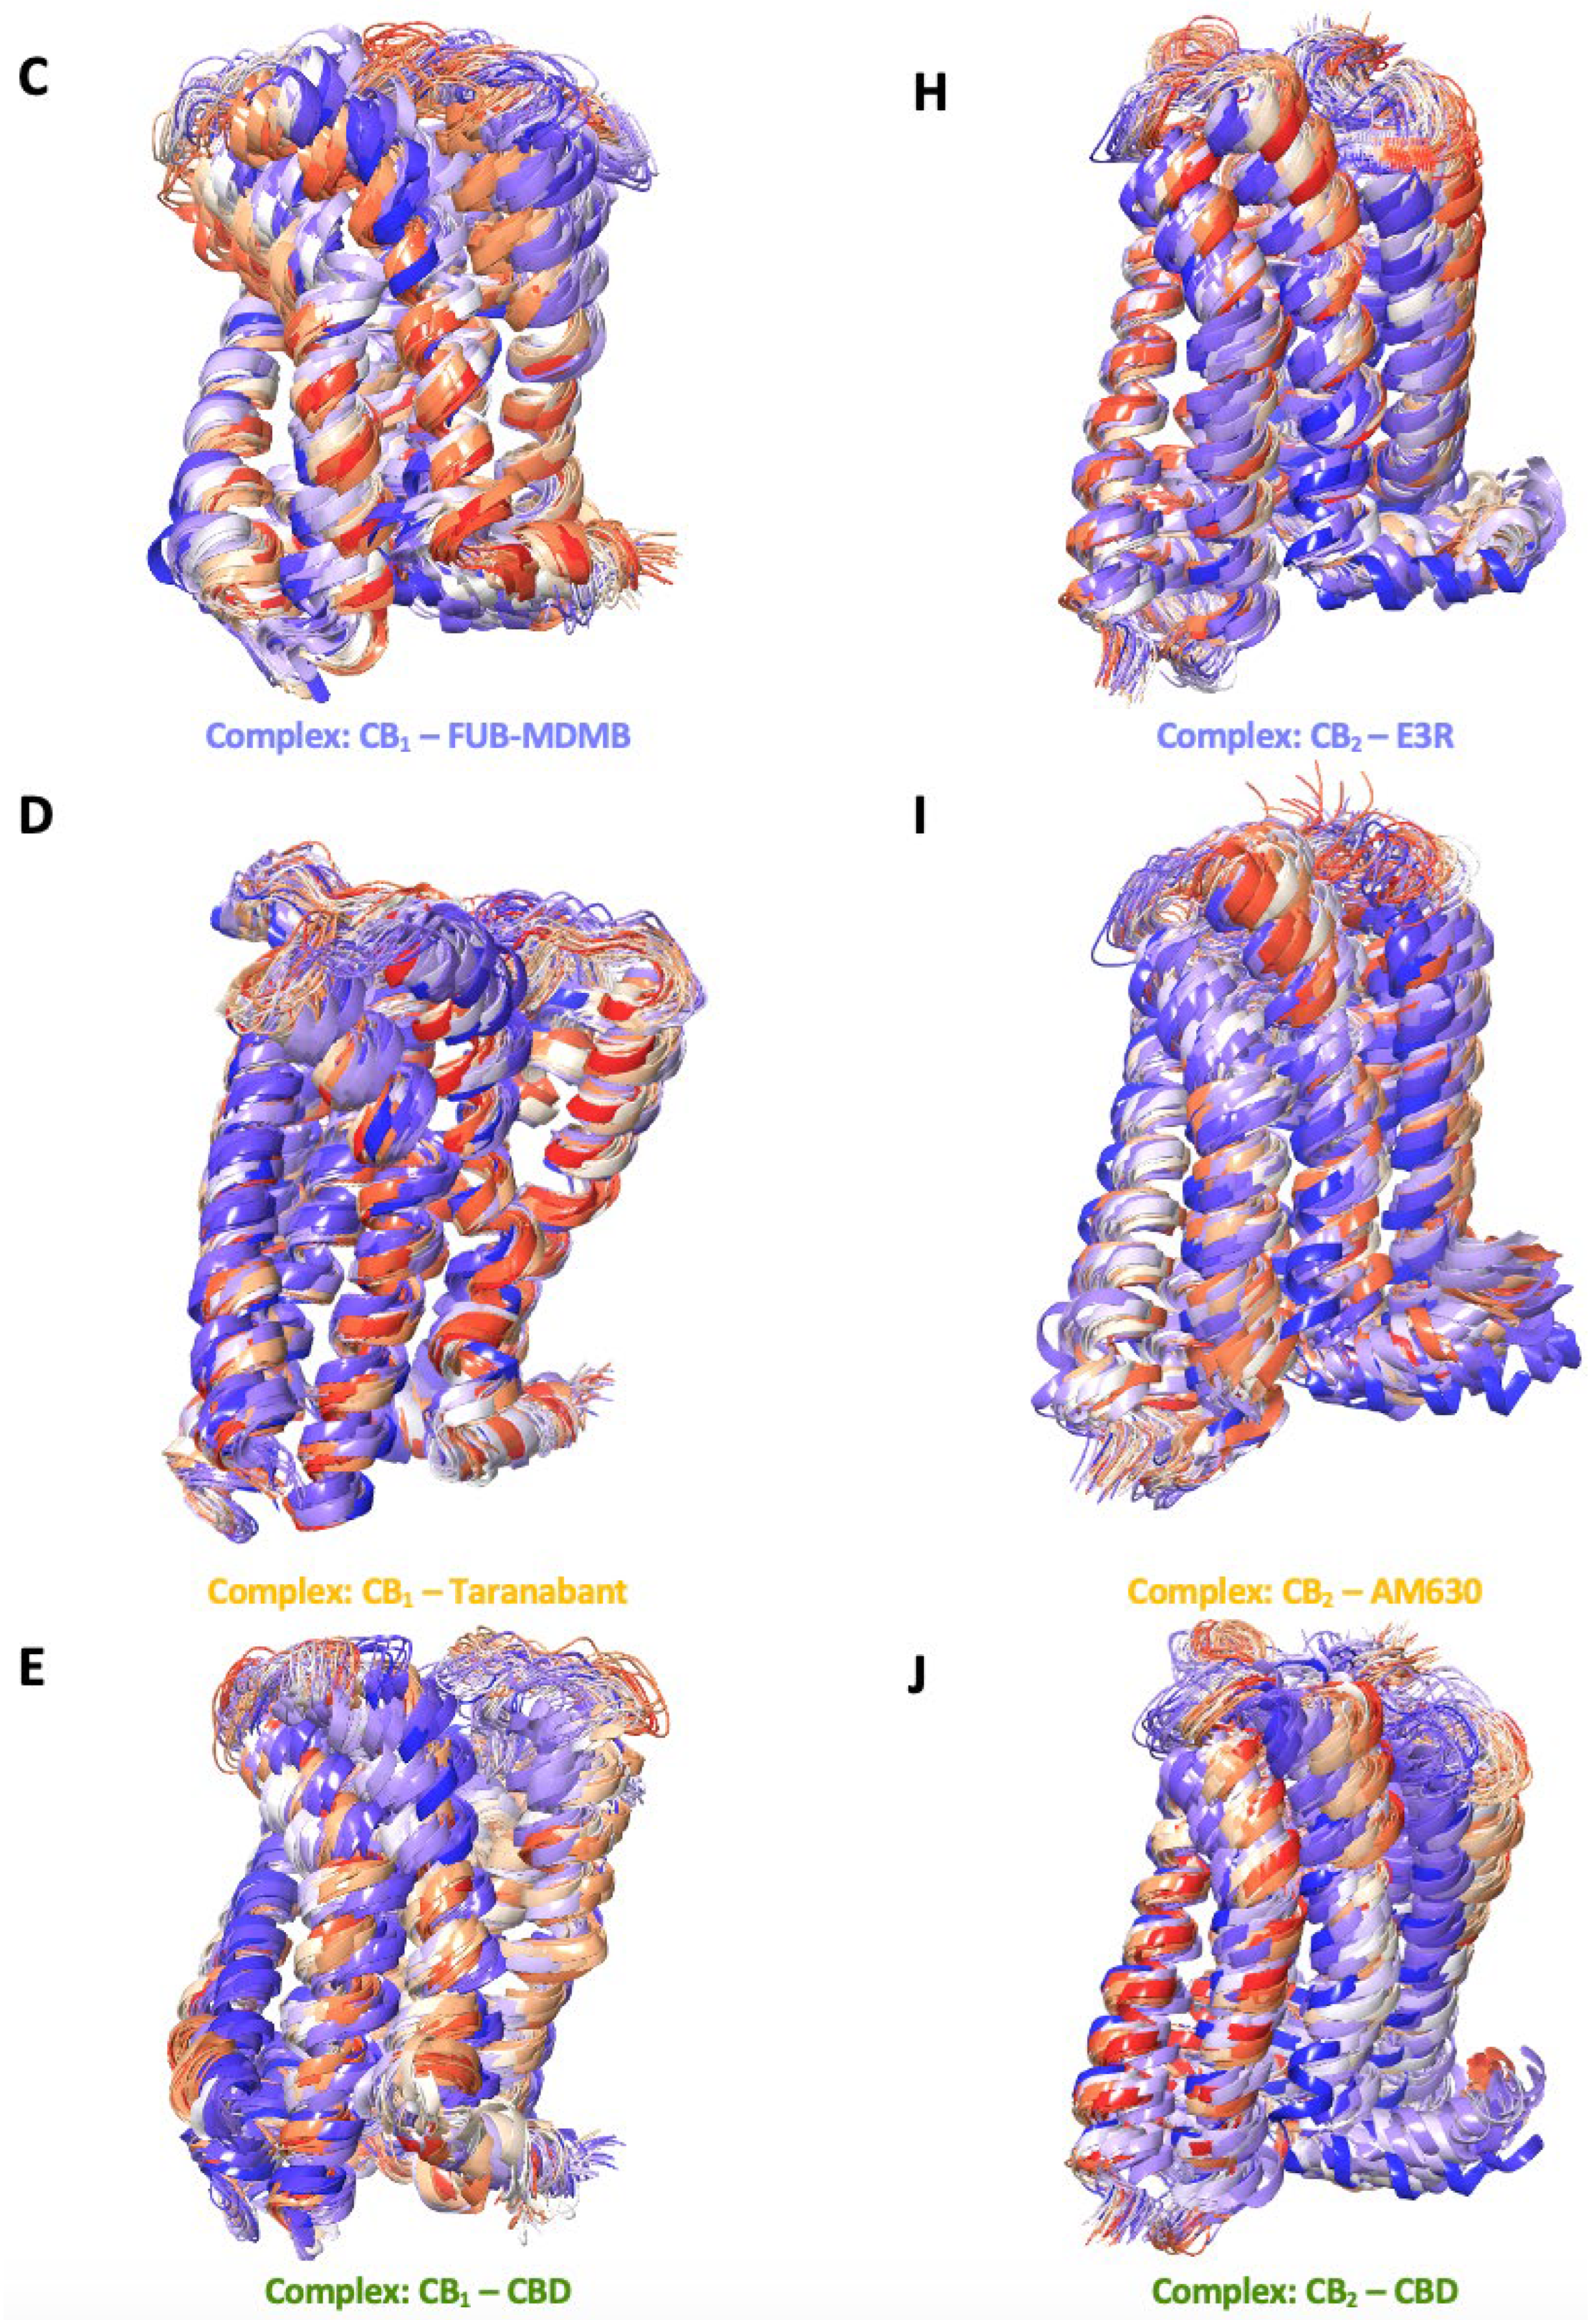
The series of structural snapshots presented in Figure 9.1 shows a vibrant depiction of the dynamic nature of CB1 and CB2 receptors in the context of their membrane-bound regions over a 250 ns MD simulation. The colour gradient from blue to red effectively illustrates the temporal progression of the simulation, where the blue structures represent the starting conformations, and the red structures signify the conformations at the end of the 250 ns simulation period. For CB1 in its apo state, the snapshots indicate a high degree of structural conservation with minor deviations from the initial conformation, suggesting a relatively stable receptor in the absence of a ligand. When bound to NADA, CB1 exhibits subtle conformational adaptations, demonstrating the natural ligand's compatibility with the receptors active site. The structural changes are more pronounced with synthetic ligands such as FUB-MDMB and Taranabant, where the snapshots reveal greater shifts, especially in the transmembrane domains. CBDs interaction with CB1 has deviations in its structure, thereby showing the structural changes over time influencing the structures signalling properties. In comparison, CB2 apo snapshots also show a more dynamic conformational baseline, yet the presence of NADA has more noticeable shifts throughout the simulation, indicating a dynamic interplay between the receptor and its endogenous ligand. Synthetic agonists like E3R and the inverse agonist AM630 produce significant conformational changes in CB2 suggesting a more flexible receptor that can accommodate various ligand-induced states. CBD's interaction with both receptors results in unique changes in CB1, implying its modulatory role while CBD acts as a partial agonist in CB2.
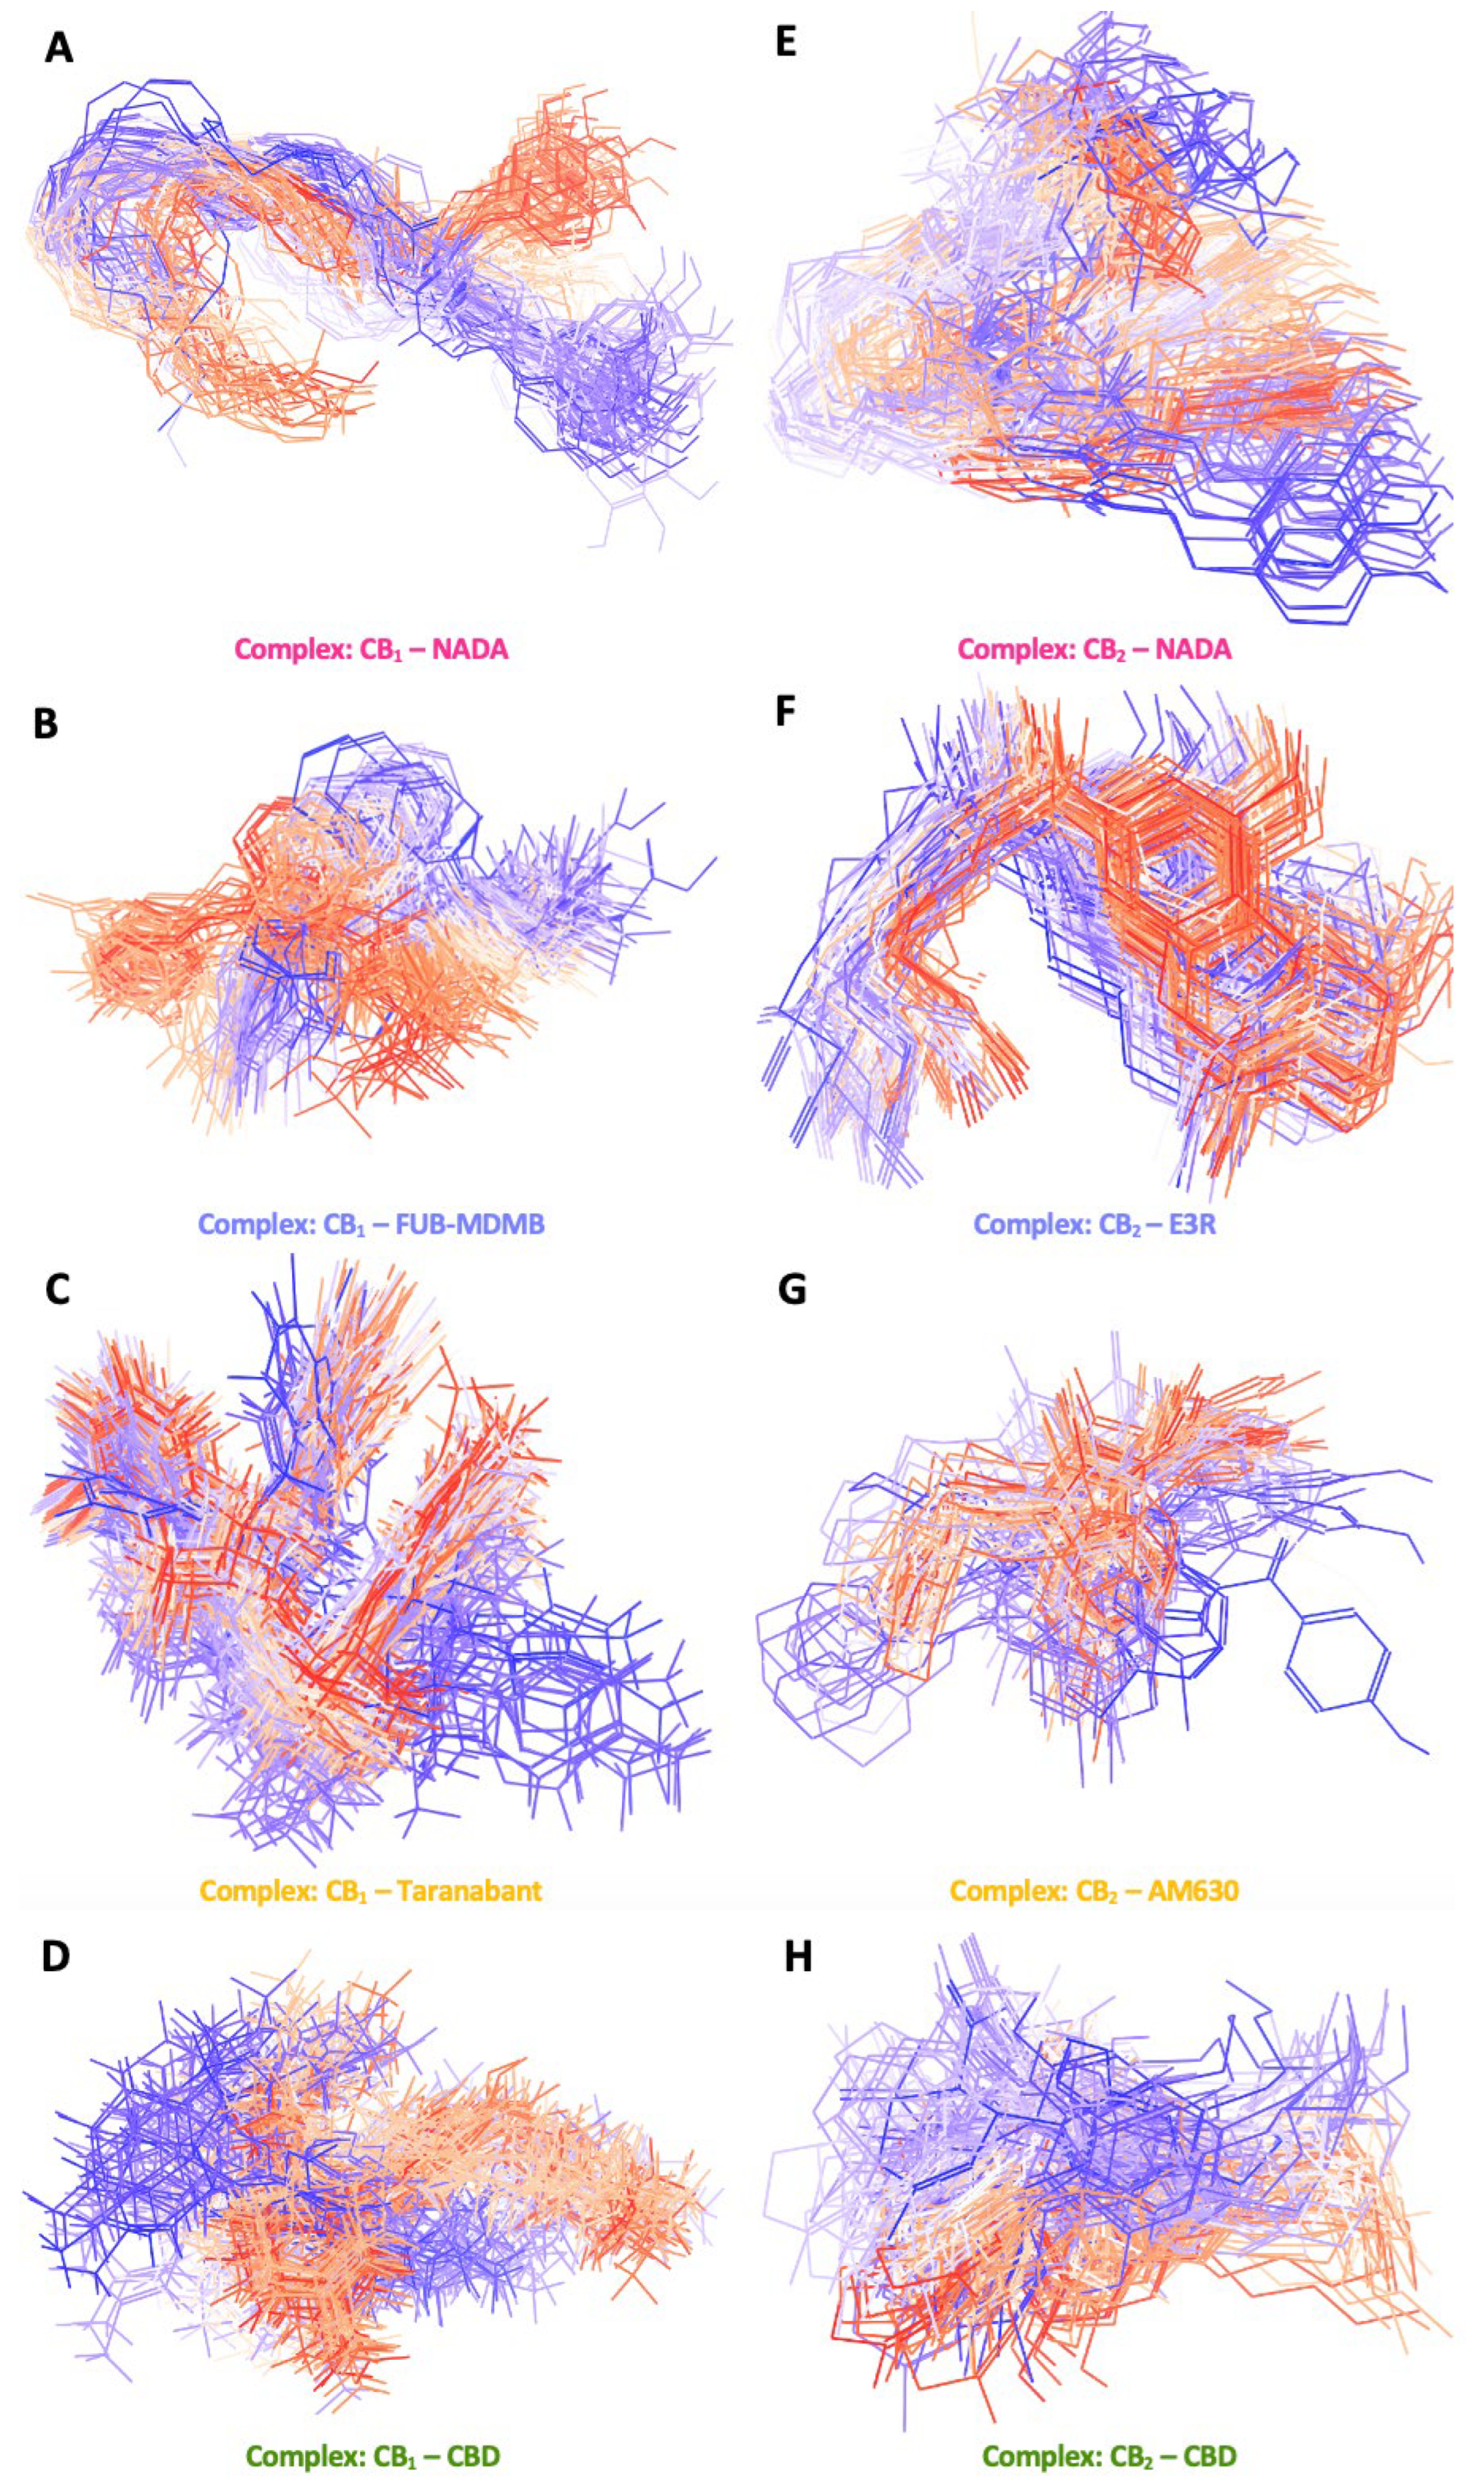
The ligand conformational snapshots over 250 ns in Figure 9.2 provide an intricate depiction of how various ligands occupy the binding sites of both p-CBRs, highlighting the dynamic nature of their interactions and the conformational flexibility within the protein environment. In A and C (Figure 9.3), NADA, and the synthetic agonist FUB-MDMB express a range of orientations within the CB1 binding site, with NADA showing a more focused array of two main conformations. One conformation is predominant at the start of the simulation, whereas the second stabilises later, indicating a precise fit within its endogenous receptor. FUB-MDMB also follows a similar pattern but shows more alternative binding modes suggesting a more adaptable interaction space. Taranabant, shows an even more diverse conformational spread, potentially reflecting its ability to induce various inactive receptor states, each with distinct structural configurations. NADAs interactions with CB2 show more flexibility compared to CB1, with NADA showing more conformational range. This might relate to CB2 role in modulating immune functions, requiring adaptability to a broader spectrum of endogenous ligand shapes. The synthetic agonist E3R shows one main conformation and the inverse agonist AM630 exhibits an extensive range of conformations, indicative of its capacity to explore and stabilise various inactive receptor conformations, which may correspond to different signalling outcomes or binding affinities with other ligands. The visual representation of CBD within the CB1 binding site reveals a significant conformational range, as denoted by the spread from the initial blue conformations to the final red conformations. The spectrum of conformations suggests that CBD interacts with the CB1 receptor in a versatile manner, potentially influencing various signalling pathways by inducing multiple receptor states. This aligns with CBDs known pharmacological profile as a compound with multiple mechanisms of action, including its role as a negative allosteric modulator that can alter receptor responsiveness. Similar to its interaction with CB1, CBD exhibits a variety of conformations within the CB2 binding site. However, the spread of conformations for CB2 appears to be slightly more constrained compared to CB1, which may reflect the distinct roles these receptors play in physiological processes. The dynamic interaction of CBD with CB2 might contribute to its therapeutic effects related to the immune system and inflammation, as CB2 is predominantly expressed in immune cells.
Figure 9.1.
Membrane-bound conformational snapshots over 250 ns. These figures highlight a series of secondary structural snapshots of CB1 and CB2, capturing the conformational changes between the membrane bound region. This illustrates the dynamic behaviour of the receptors in their apo state and when bound to various ligands: (A – E) NADA, FUB-MDMB, Taranabant, and CBD for CB1, and (F – J) NADA, E3R, AM630, and CBD for CB2. These snapshots highlight the flexibility and the varying degrees of conformational states that each receptor-ligand complex can adopt over 250 ns.
Figure 9.2.
Ligand conformational snapshots over 250 ns. This figure presents overlaid conformations of ligands within the binding sites of CB1 and CB2. The snapshots depict the flexibility and range of orientations for NADA, FUB-MDMB, Taranabant, and CBD when bound to CB1 (A – D) and NADA, E3R, AM630, and CBD when bound to CB2 (E – H). These visualisations emphasise the dynamic nature of ligand-receptor interactions and the conformations they exhibit within the protein environment.
3.9. Ligand RMSD and Simulation Protein-Ligand Interactions
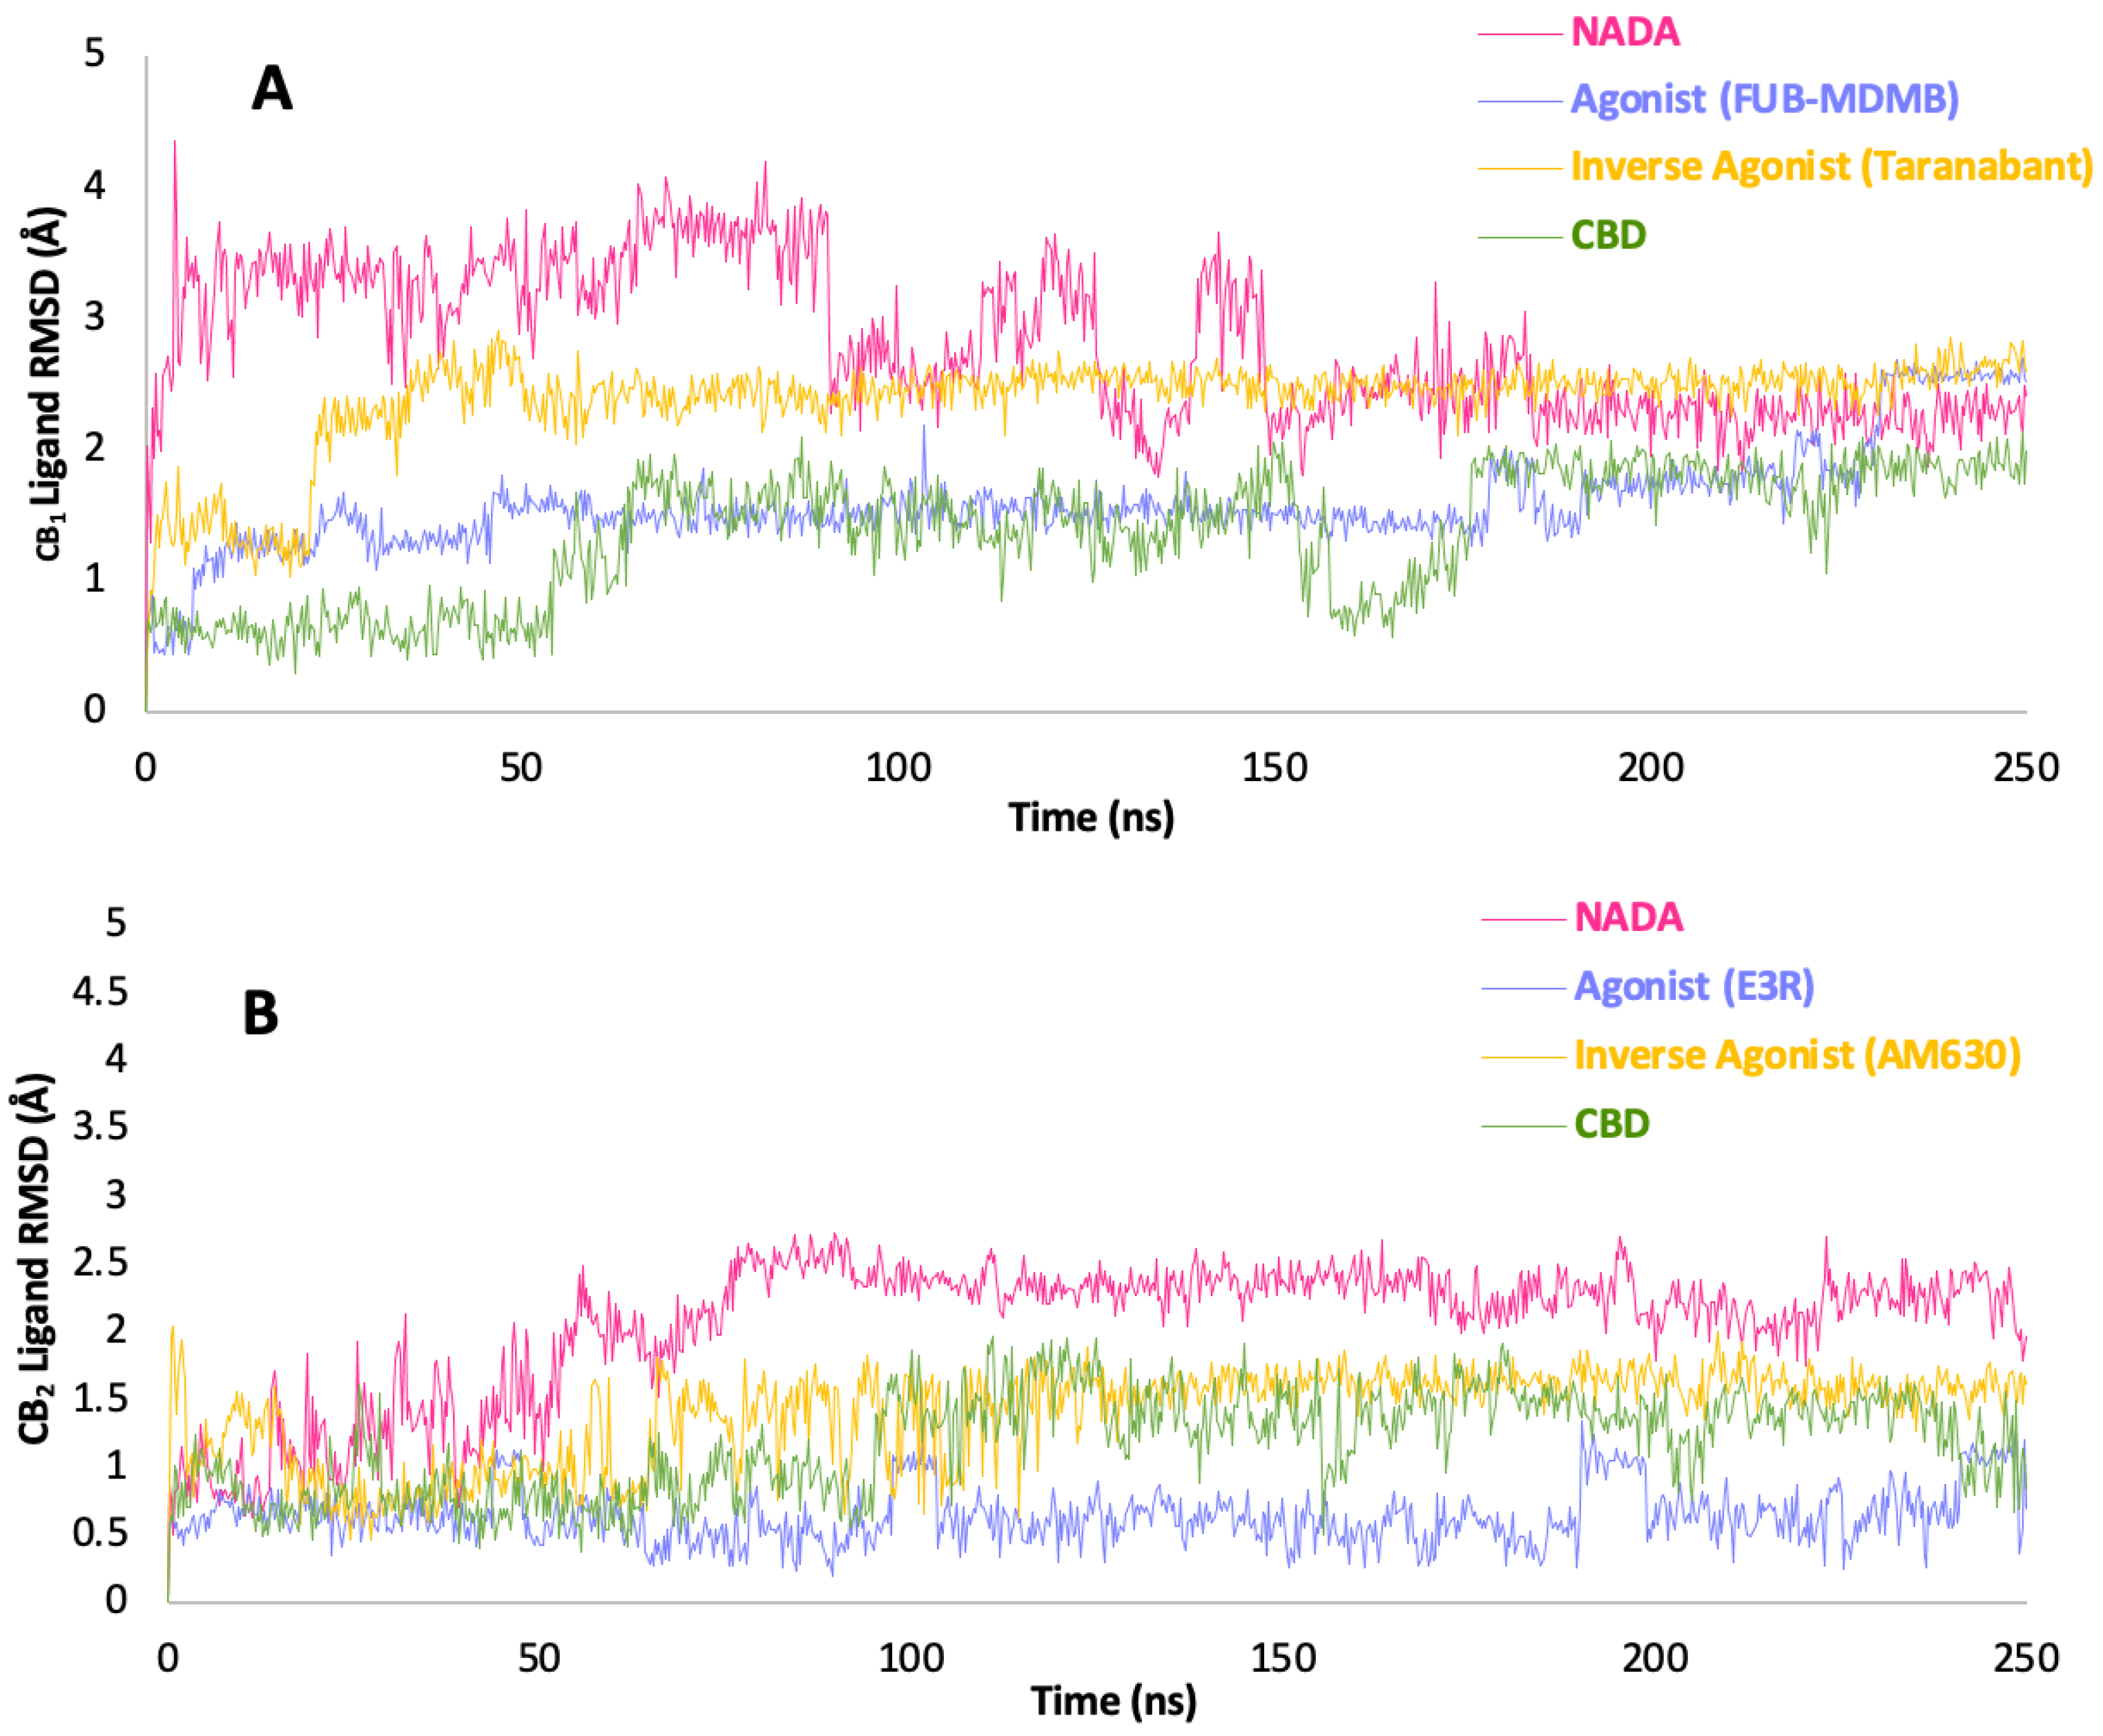
Figure 10 showcases the ligand RMSD trajectories for both CB
1 and CB
2 receptors over a simulation period of 250 ns, providing a quantitative depiction of the stability and conformational changes of various ligands while bound to CBRs. The lig-RMSD trajectory (
Figure 10) NADA bound to CB
1 demonstrates a stable interaction towards the end of the simulation with all ligands reaching stability at ~185 ns in the simulation. FUB-MDMB, exhibits a slightly higher lig-RMSD, indicating a more flexible interaction compared to NADA but still within a range suggestive of consistent binding. Taranabant, shows increased fluctuations at first then stabilises, reflecting its potential to induce diverse conformations in the receptor, which may correlate with its inverse agonistic activity. CBDs trajectory is characterised by a moderate level of fluctuation, consistent with its role as a modulator, potentially affecting the receptor conformation and thereby its signalling pathways. CB
2 lig-RMSD for NADA with CB
2 shows more pronounced fluctuations compared to CB
1, hinting at a more flexible interaction or multiple binding conformations within this receptor. E3R, another synthetic agonist, presents a lig-RMSD profile with significant variation, suggestive of a dynamic binding that may promote a range of receptor states. AM630, as an inverse agonist, displays a highly variable lig-RMSD, indicative of its ability to stabilise CB
2 in multiple conformations, potentially inactive ones. CBD with CB
2 exhibits a similar pattern to that observed with CB
1, with fluctuations that are indicative of its modulatory influence on the receptor dynamics. The overall lower lig-RMSD values for CB
1 across all ligands imply a tighter and more consistent binding pocket, which may influence the receptor's signalling specificity. The greater variability in lig-RMSD for CB
2 suggests a more adaptable ligand-binding environment, which could allow for a wider range of physiological responses. The differences in lig-RMSD profiles for synthetic agonists and inverse agonists when compared to NADA underscore the potential for these compounds to elicit varied therapeutic effects.
Figure 10.
Ligand-RMSD trajectories relative to protein. (A) illustrates the RMSD of each ligand when bound to the CB1 receptor, and (B) displays the same for the CB2 receptor, over a simulation time of 250 ns. Each trace represents the RMSD of ligand atomic positions relative to their initial frame, providing a measure of the ligands stability and conformational changes while bound to the receptor. The ligands include NADA, an agonist (FUB-MDMB for CB1 and E3R for CB2), an inverse agonist (Taranabant for CB1 and AM630 for CB2), and CBD. Stable RMSD values suggest a consistent interaction with the receptor, while fluctuations indicate dynamic binding and conformational adaptability.
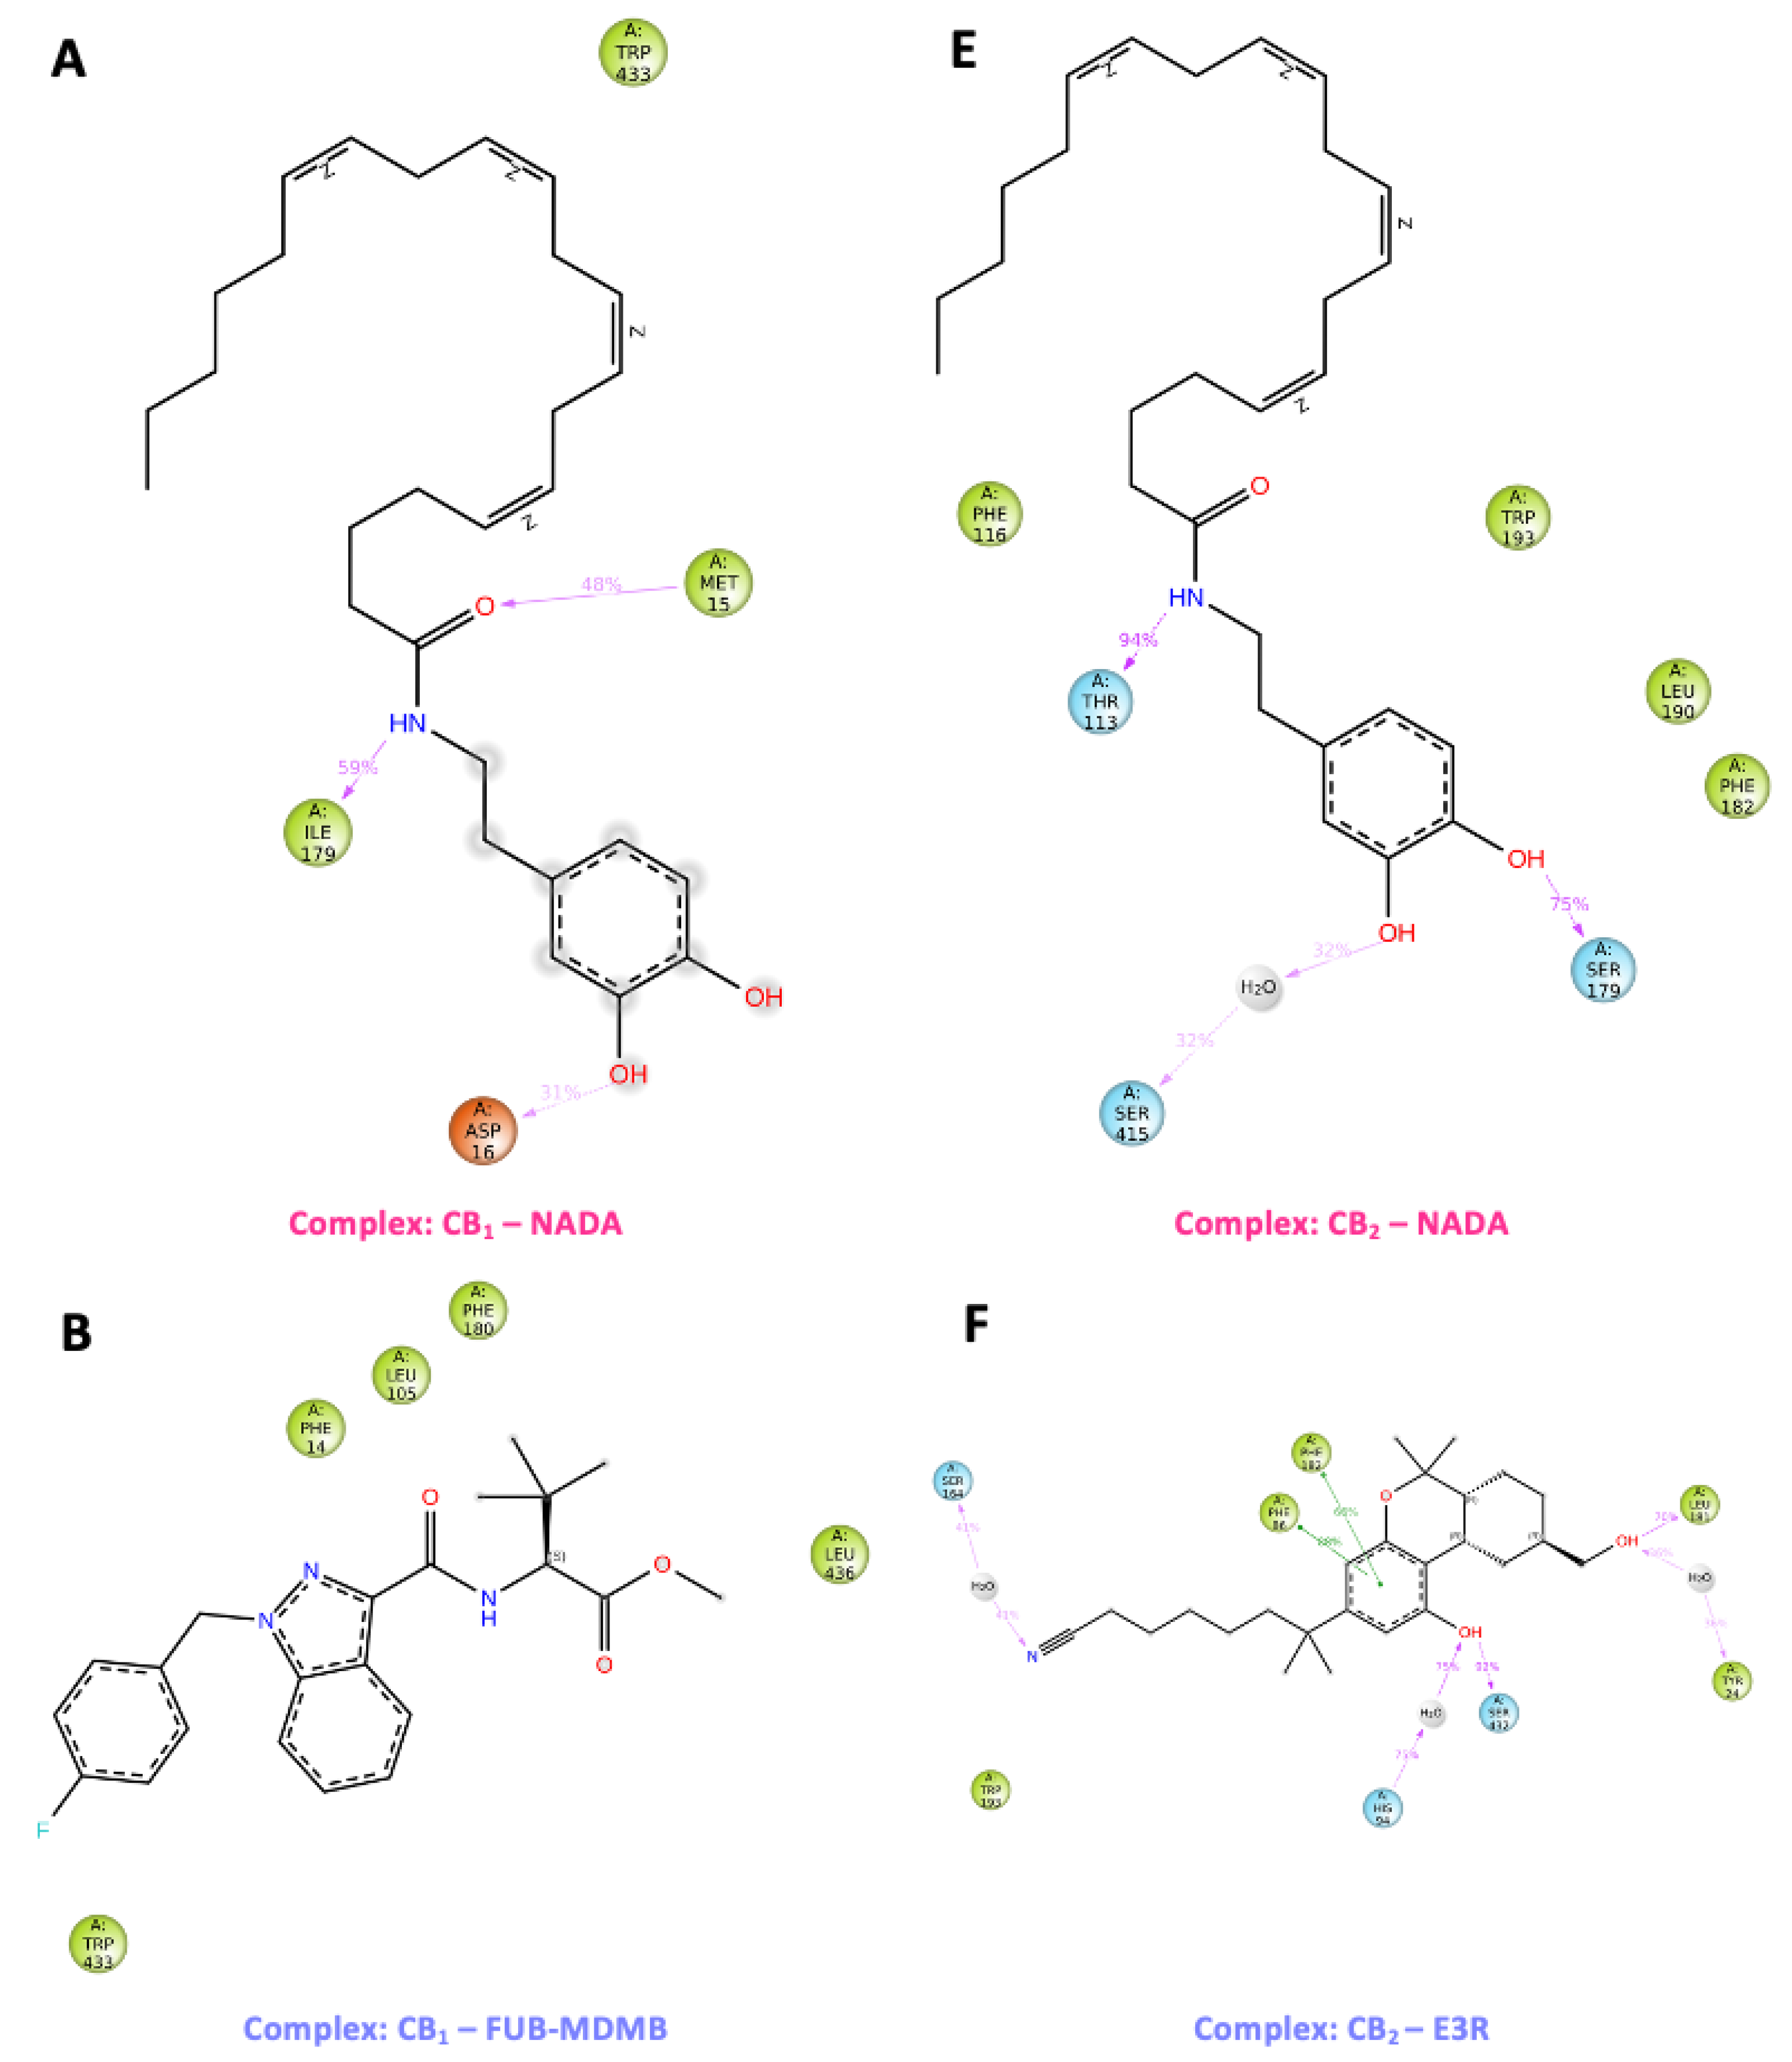
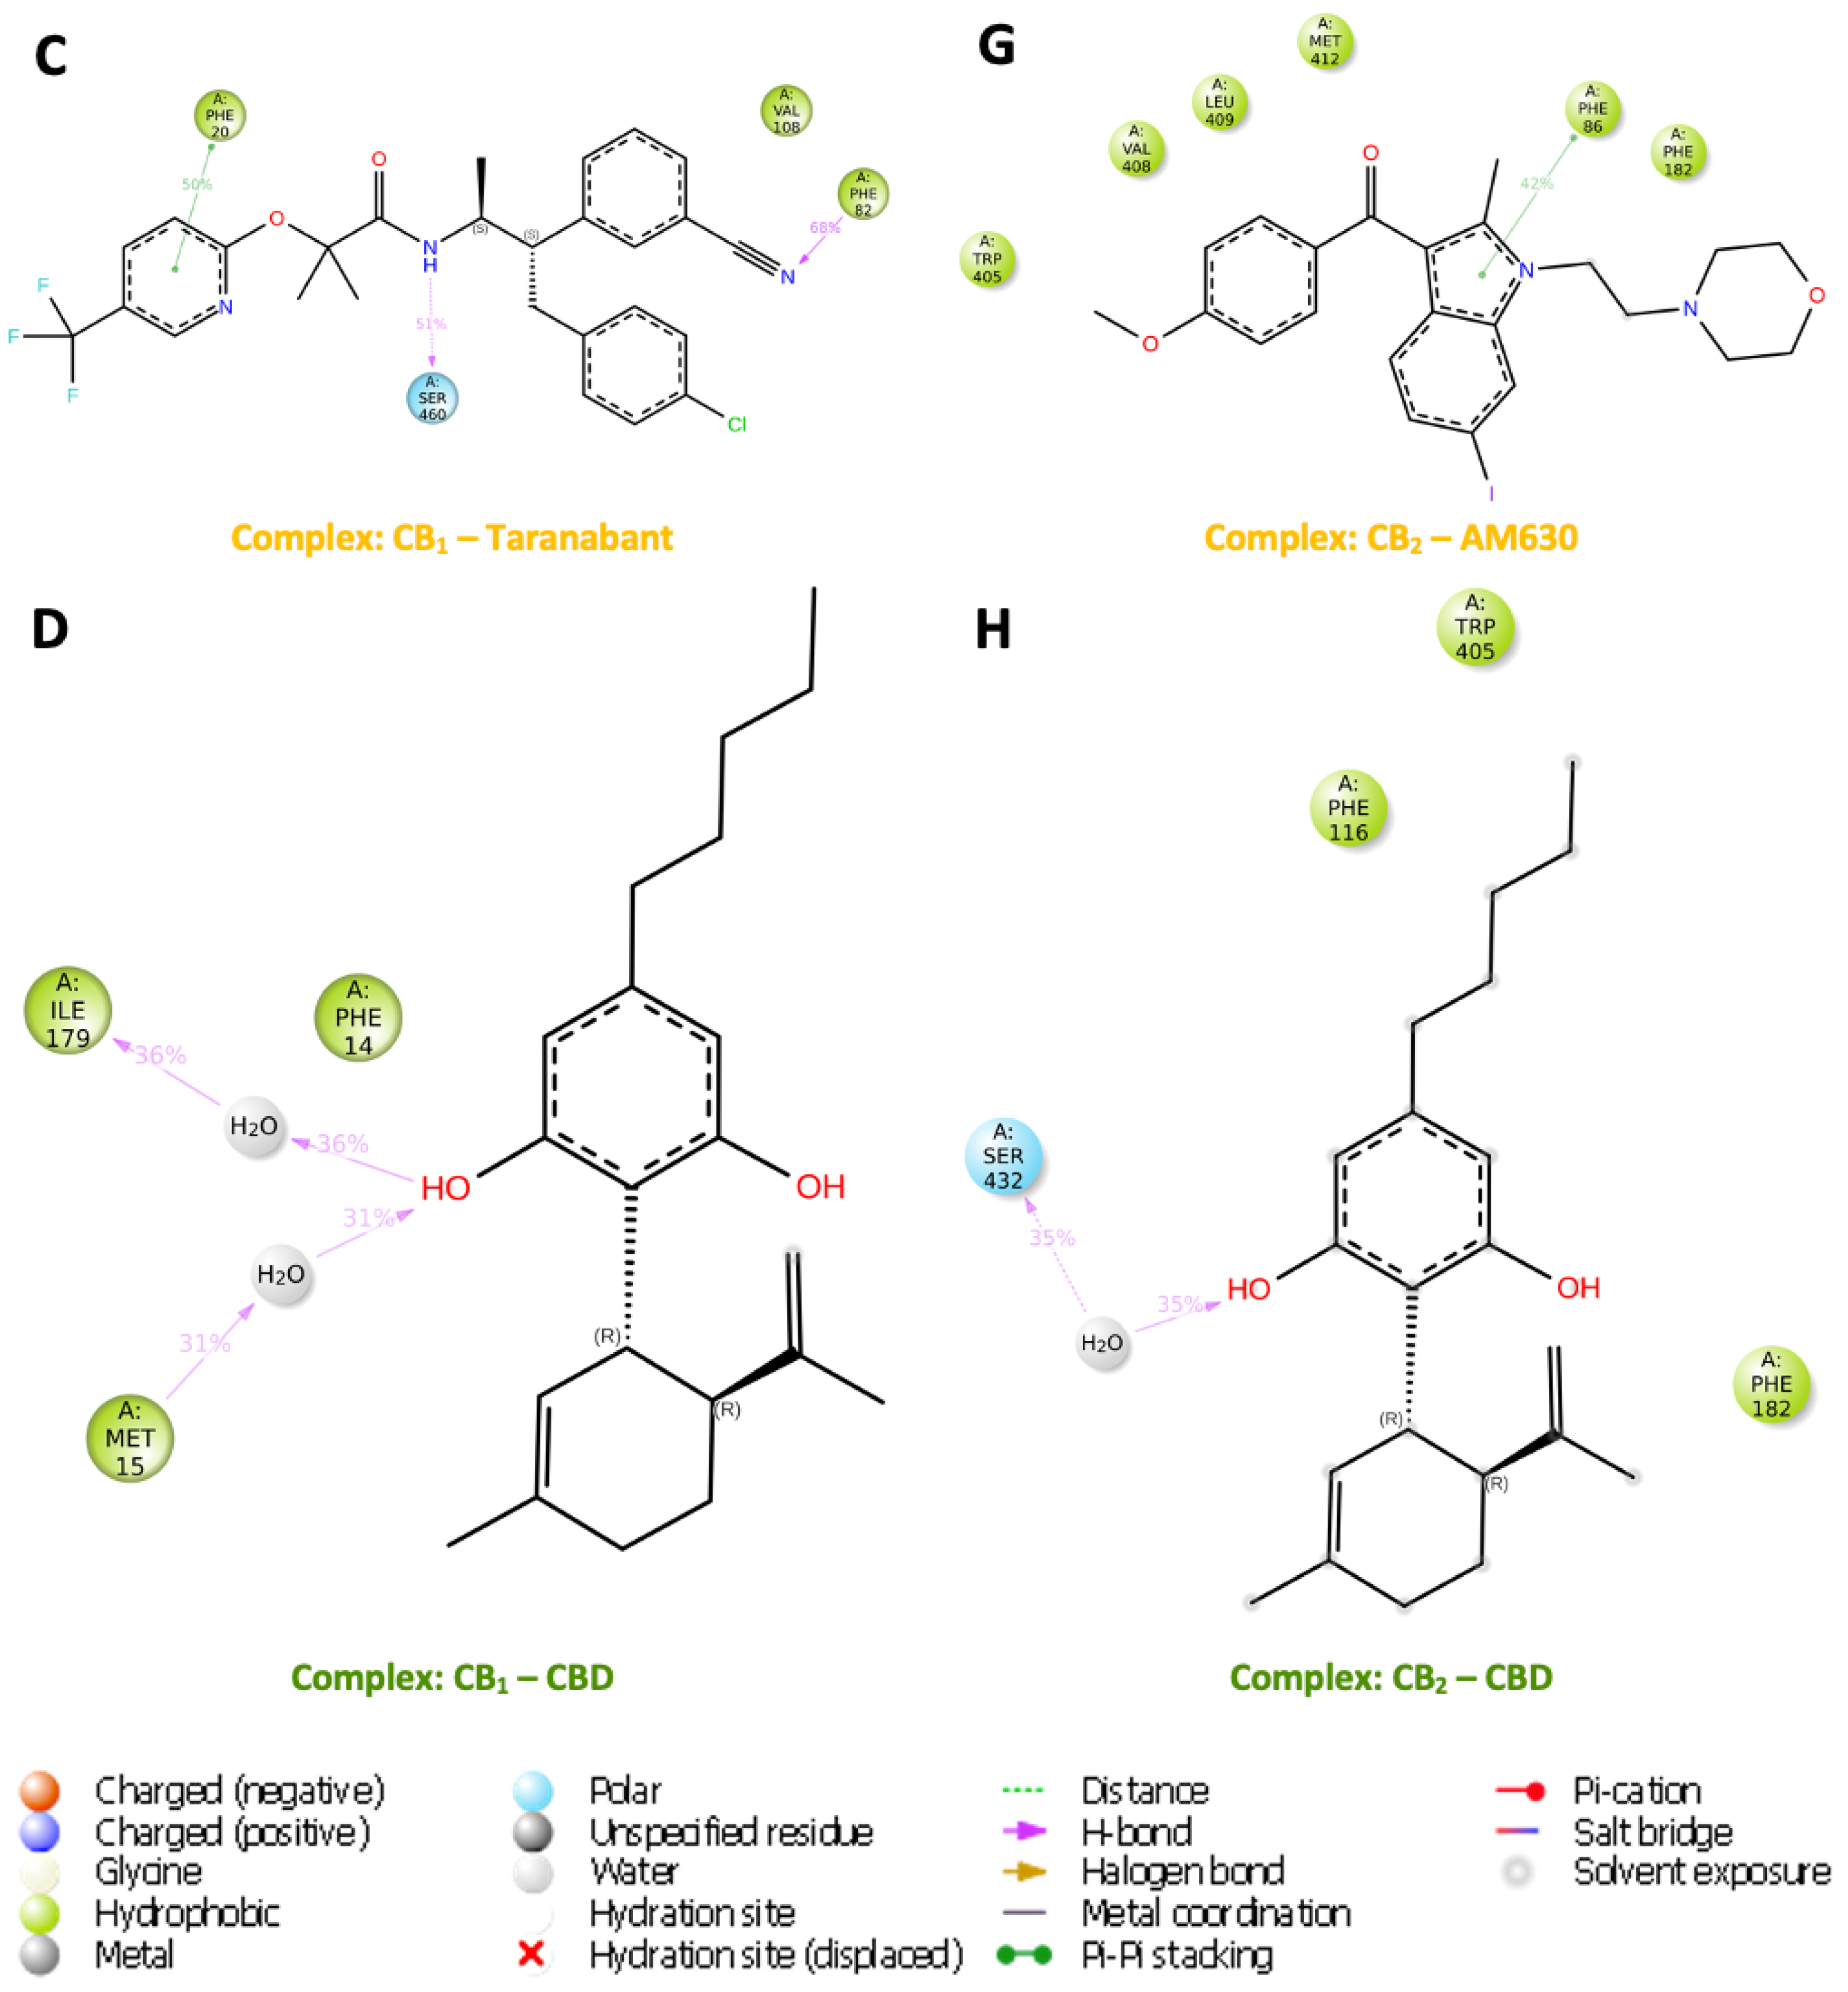
The images (
Figure 11) depict molecular structures of ligand atom contacts in complex with p-CBRs for more than 30.0% of the time during molecular dynamic simulations. Each ligand shows a distinct chemical structure with various functional groups that influence their interaction with the protein residues. NADA in both CB
1 and CB
2 complexes, NADA has a dopamine moiety that can be identified by its catechol structure and a long unsaturated fatty acid tail, which is a characteristic feature of endocannabinoids. NADA complexed with CB
1 has several key interactions such as the longest interaction between Ile179 and the NH group for 59% of the simulation while the O group attracted Met15 for 48 % of the simulation suggesting a stable hydrogen bond, potentially critical for signal transduction. The NH group of CB
2 complexed with NADA was in contact with Thr113 for 94 % of the simulation while a notable water was present at the OH group along with Ser415 (Fig 12). The other OH group was in contact with Ser179 for 75 % of the simulation showing a network of hydrogen bonds that might stabilise specific receptor conformations conducive to signalling.
FUB-MDMB shown in the CB1 complex, is a synthetic compound with a distinct indazole core with potentially high binding affinity due to its rigid structure. Alternatively, CB2 receptor agonist has two distinct π-π stacking bonds with its aromatic ring with residues Phe86 and Phe182 for 88 % and 66 % for the simulation, respectively. This stacking could be pivotal for stabilising the receptor in an active conformation, enhancing signal transduction. For the inverse agonists, Taranabant and CB1 has a more complex structure with multiple rings, which may contribute to its activity as an inverse agonist, potentially blocking the receptors active site and preventing activation with three main contacts influencing its binding such as π-π stacking with Phe20 while the N group attracted Phe82 and Ser460 attracted the NH group. For CB2, AM630 has a biphenyl structure linked to a heterocyclic moiety with a key π-π stacking interaction with Phe86 follows a similar pattern as CB1, with π-π stacking interactions suggesting a potential lock on the receptor's conformation, which may reduce its ability to signal. Present in both CB1 and CB2 complexes, CBD is a well-known cannabinoid with a resorcinol core and a pentyl chain. Notably, water molecules in both complexes mediate interactions with the OH groups; in CB1, they facilitate hydrogen bonding between OH and Met15, as well as OH and Ile179. In the CB2 complex, water is attached to both the OH group and Ser460. For CB1, the water-mediated hydrogen bonds suggest a dynamic modulation of receptor conformation. This water bridge could be essential for CBDs ability to modulate receptor activity subtly, rather than inducing a rigid active or inactive state. Such modulation could lead to nuanced signalling outcomes, which aligns with the known diverse physiological effects of CBD.
Figure 11.
Post-MD simulation ligand-contact summary. This figure compiles a visual representation of sustained ligand-protein interactions within the binding sites of CB1 and CB2 receptors throughout molecular dynamic simulations. (A – D) illustrate the contact profiles for the following ligands with CB1 with (E – H) depicting the ligand interactions with CB2: These images capture the intricate contact dynamics and diverse orientation landscapes that ligands adopt within the protein environment, emphasising the variable and complex nature of ligand-receptor interplay.
3.10. Water Analysis
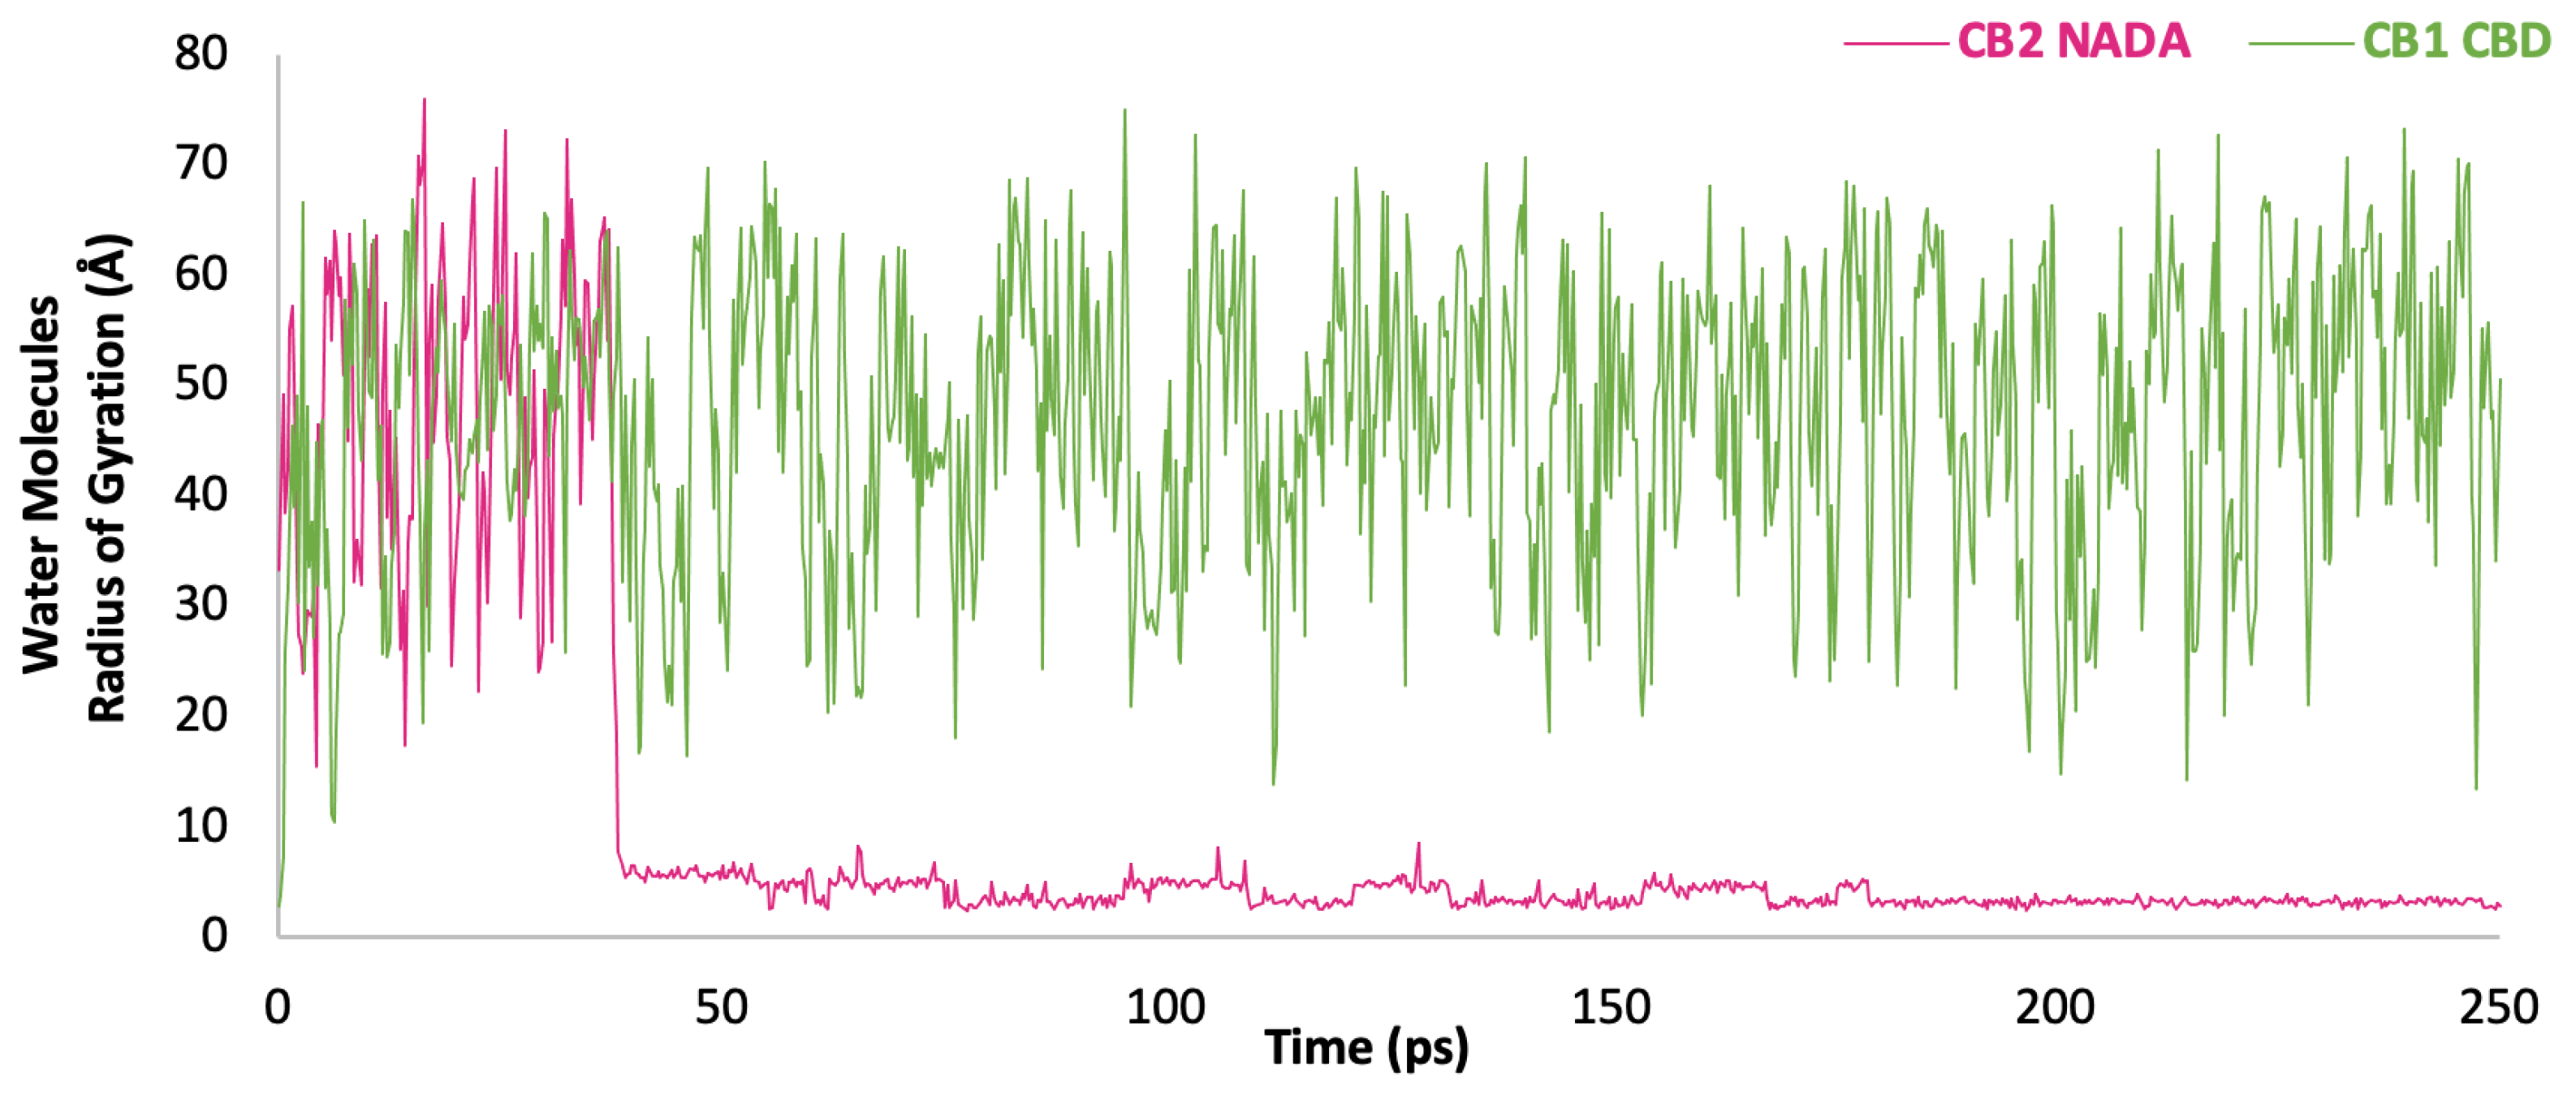
The distance of the water molecule 9906 (
Figure 12) demonstrates a notable stabilisation in its role as a bridge between the OH group of NADA and the Ser415 residue of CB
2. Initially, the distance between the interacting entities fluctuates, as indicated by the variable peaks early in the simulation. However, at ~ 45,000 ps into the simulation, we observe a significant change whereby the distance distinctly stabilises, hovering around a much lower value, indicative of a stable interaction being established. This stabilisation suggests that water 9906 has found an energetically favourable position where it can effectively mediate an H bond between the ligand and the receptor. The persistent short distance after 40,000 ps indicates that the water molecule maintains this bridge consistently for the remainder of the simulation. The implications of such a stable water bridge in the context of a lipid bilayer are interesting as the bilayer's hydrophobic environment typically restricts polar interactions to the periphery of the membrane, yet water 9906's persistent interaction deep within the membrane interface suggests a significant structural feature. This water bridge may play a crucial role in maintaining the conformational stability of the ligand-receptor complex, enabling correct signalling function such as a modulator. The provided plot (
Figure 12) captures the intricate fluctuations between water molecule 11077 and residue Ile179 within the CB
1 receptor, complexed with CBD, over 250 nanoseconds. This variability in proximity suggests a non-static interaction, which is significant within the typically hydrophobic environment of the lipid bilayer. The water molecules (11077) recurring proximity to Ile179 suggests its potential influence on the receptor conformation and, consequently, on signal transduction mechanisms. Despite the variability, the intermittent closeness to Ile179 implies episodic bridging interactions that may be integral to the modulation of CBDs influence on the CB
1 receptor. The presence of a water molecule in the hydrophobic environment of a lipid bilayer is noteworthy, as it suggests an energetically favourable interaction that overcomes the hydrophobic exclusion effect This can be indicative of a polar pocket or channel within the receptor that can accommodate water molecules, potentially impacting the receptor's conformation and function when interacting with CBD to enable it to act as a modulator much like CB
2 in complex with NADA.
Figure 12.
Interaction dynamics of water molecules 9906 with CB2-NADA Complex and Water 11077 with CB1-CBD Complex. This graph depicts the fluctuating distance (Å) between water molecules over the course of a 250 picosecond molecular dynamics simulation. The water (9906) stabilisation observed after 45 picoseconds highlight the formation of a significant water bridge, integral to the interaction network within the binding pocket. Water 11077 shows the dynamic nature of water molecule interactions within the receptor's binding site, with distance variations suggesting transient stabilising events.
4. Discussion
The purpose of the study was to validate computational models for future research on cannabinoids and related synthetic compounds, establishing a groundwork for discerning the nuances of cannabinoid interactions with these receptors. This foundational work is pivotal for the development of new therapeutics targeting cannabinoid receptors, enhancing our understanding of their pharmacological landscape. The modifications in p-CBR structures, such as truncating the N-terminal and incorporating different stabilising domains in the ICL3, have been essential for retaining functional integrity. This strategic modification is vital for accurate interpretations of cannabinoid receptor behaviour and interaction dynamics [
23,
30]. Taranabant and AM630 were selected for their roles in crystallising CB
1 in its inactive state and as a known inverse agonist for CB
2. FUB-MDMB and E3R, are documented agonists that stabilise the active receptor conformations substantiated by their active-state co-crystal structures (PDB codes 6N4B and 6KPF) [
29,
55]. Agonists and inverse agonists were preferred over antagonists to observe conformational changes, as antagonists often block ligands without blocking other ligands or necessarily prompting a significant conformational shift The agonists were expected to bind to CBR active site, leading to a change in the receptor's conformation by activating it. This activation results in G-protein coupling and subsequent signal transduction, enhancing receptor dynamics as it transitions between inactive and active states. In contrast, inverse agonists like AM630 stabilise an inactive receptor conformation, potentially reducing receptor dynamics due to the prevention of the active state formation. As IFD studies show, NADA was selected for its natural and high affinity for CBR while also possessing a benzene ring, a structural similarity to phytocannabinoids yet unique when compared to endocannabinoids [
56,
57]. These interactions, particularly H-bond and π-π stacking interactions with key residues, highlight p-CBR sensitivity to molecular changes, which allows for the development of highly selective cannabinoid-based therapeutics. Furthermore, the agonist dynamics were expected for CB
1 receptor interaction with NADA However, while the precise impact of NADA on the CB
2 receptor remains unclear, this study exhibits a distinctive dynamic profile between CB
2 and NADA compared to other ligands, suggesting a potential modulatory effect on the receptor's function. CBDs selection was due to its vast therapeutic potential and growing legal status worldwide. Modulators such as CBD, due to their distinct interaction mechanisms, may not cause the full activation or inactivation of the receptor but could influence its dynamics by altering the receptor's conformational landscape, affecting the efficacy or potency of other ligands. These effects on receptor dynamics are crucial for understanding how different ligands can modulate receptor signalling and subsequent cellular responses.
After MD simulations, the energy properties show that all systems achieved equilibration over a 250 ns simulation period, confirming the stability of the receptor-ligand complexes. Attaining equilibrium is fundamental for the acceptance of these models as valid representations of biological reality The lowest energy states observed with p-CBR in complex with NADA show a direct correlation between thermodynamic stability and the functional efficacy of the receptor-ligand interactions as NADA is naturally made for CBRs. Therefore, this suggests a direct correlation between thermodynamic stability and therapeutic potency. These stable energy values validate the system for further analysis and application in drug design, providing a credible basis for predicting binding efficiency, ligand interactions and implications. Equilibrium conditions are vital to ensure that the simulated molecular interactions are not transient phenomena but stable states that can provide information for drug efficacy and safety profiles Hence, the equilibrium state of these models supports their function in discovering how subtle molecular modifications can translate into significant therapeutic outcomes, providing a robust framework for the study of cannabinoids. By ensuring that the models have reached equilibrium, it can be trusted that the simulated behaviours of the molecules reflect a realistic and stable system, thereby enhancing the credibility and applicability of the simulation results in drug discovery processes [
59,
61].
The C
α RMSD and C
α RMSF data provide insight into the dynamic structural behaviour of p-CBR. NADAs stable C
α RMSD and the unique conformational changes induced by CBD on CB
1 yet CB
2 displays an opposite effect which highlights the potential of these ligands in modulating receptor activities differently The differential responses of CB
1 and CB
2 receptors to these ligands, as indicated by the distinct structural changes observed particularly in membrane-bound regions, emphasise the complexity of receptor-ligand interactions and the necessity to consider this in drug design [
63,
64]. Since, additions were made the crystal structure in the ICL3, the membrane-bound region of the protein was assessed using both temporal simulation snapshots depicting changes over 250 ns and C
α backbone data. The modulation effect by CBD on CB
1, suggested by its unique C
α RMSF profile, presents an interesting aspect of cannabinoid pharmacology that could lead to the development of novel therapeutic agents with minimised side effects. Additionally, this data does not only provide insight into the receptor conformational stability and flexibility but also, when combined with protein trajectory snapshots, illustrate the diverse structural dynamics under the influence of different ligands. These snapshots capture the real-time evolution of receptor shapes, highlighting how ligands such as NADA and CBD induce distinct conformational states in the receptors. Moreover, the RoG analysis sheds light on the impact of ligand binding on the overall folding and stability p-CBRs. For CB
1, the ligand interactions suggest a balance between structural stability and adaptability of its core residues essential for effective receptor function by showing a more compact and folded compared to CB
2 upon ligand binding. The dynamic behaviour of CB
2 suggests a receptor with a high degree of structural flexibility, which might be an adaptive advantage in interacting with a broad range of ligands [
63,
65]. These visualisations are crucial for understanding the complexity of receptor-ligand interactions, offering a perspective for drug design by displaying how subtle variations in ligand structure can lead to significant changes in receptor behaviour which then affects cellular signalling.
The unique conformational responses of CB1 and CB2 to various ligands, especially the distinct interactions of CBD, highlight the potential of cannabinoid-based therapies with potential as a therapeutic agent with fewer side effects compared to traditional agonists or antagonists CB1 specificity offers targeted therapeutic avenues for neurological disorders, while CB2 broader ligand profile holds promise for immunological conditions These computational studies bridge the gap to empirical work by rapidly screening and modelling interactions with emerging cannabinoids, thus expediting the drug discovery process. These computational models of p-CBRs can efficiently predict the behaviour of modified cannabinoids, providing a preclinical insight that can guide empirical studies and streamline the path to novel therapeutic agents. This approach is fundamental in a rapidly evolving field where modified cannabinoids are being continuously synthesised and require a swift and reliable method of evaluation for their potential therapeutic or adverse effects .
Author Contributions
Conceptualisation, M. Soobben, I. Achilonu and Y. Sayed; methodology, M. Soobben, I. Achilonu and Y. Sayed; software, I. Achilonu; validation, M. Soobben, I. Achilonu and Y. Sayed; formal analysis, M. Soobben; investigation, M. Soobben.; resources, I. Achilonu and Y. Sayed; data curation, M. Soobben; writing—original draft preparation, M. Soobben; writing—review and editing, M. Soobben, I. Achilonu and Y. Sayed; visualisation, M. Soobben; supervision, I. Achilonu and Y. Sayed; project administration, M. Soobben, , I. Achilonu All authors have read and agreed to the published version of the manuscript.

