Submitted:
13 August 2024
Posted:
14 August 2024
You are already at the latest version
Abstract

Keywords:
1. Introduction
2. Materials and Methods
2.1. Datasets
2.2. Data Feature Extraction
2.2.1. Edge Feature Extraction of Tumor Images
- Smooth images using bilateral filters
- Calculation of gradient change and direction of grayscale values
- Setting dual thresholds for edge detection
2.2.2. Transcriptome Feature Extraction
2.3. Multimodal Data Clustering
2.3.1. Soft Threshold Distance Calculation
2.3.2. Calculation of DissTOM Distance for the Soft Threshold Matrix
2.3.3. Construction of Similarity and Kernel Matrices
3. Results
3.1. Identification of the Three Subtypes Based on Sample Omics Data
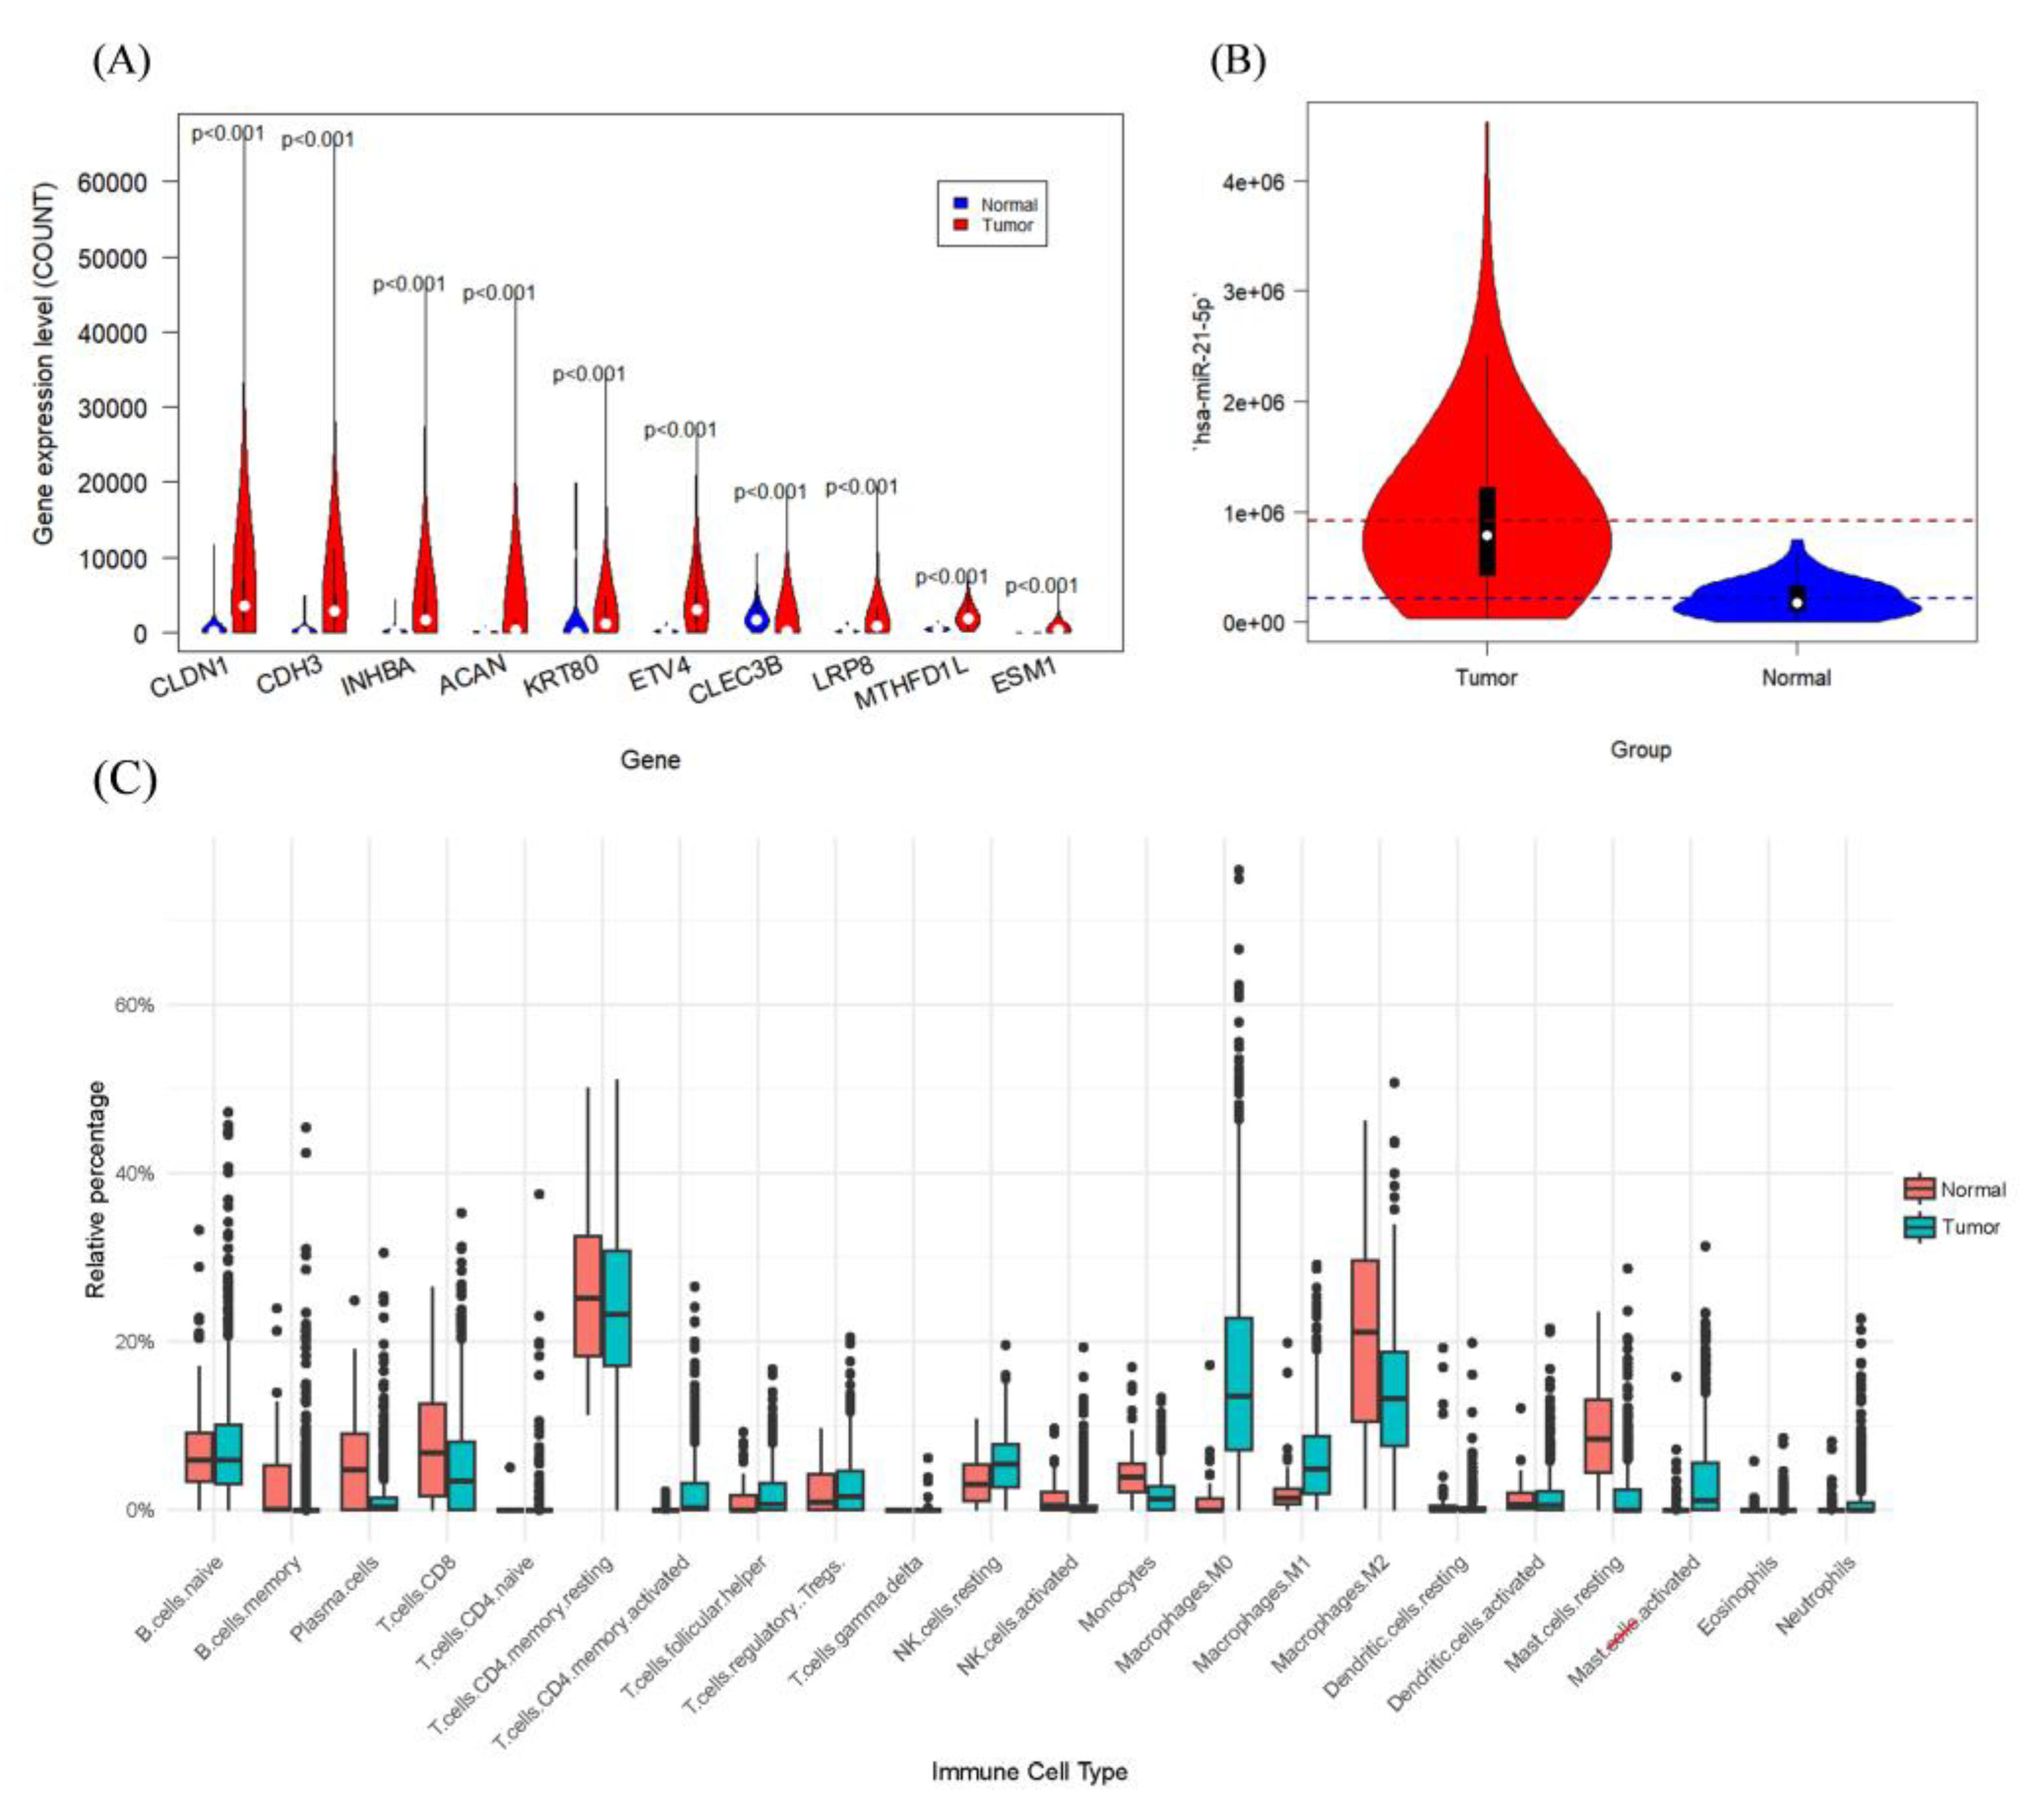
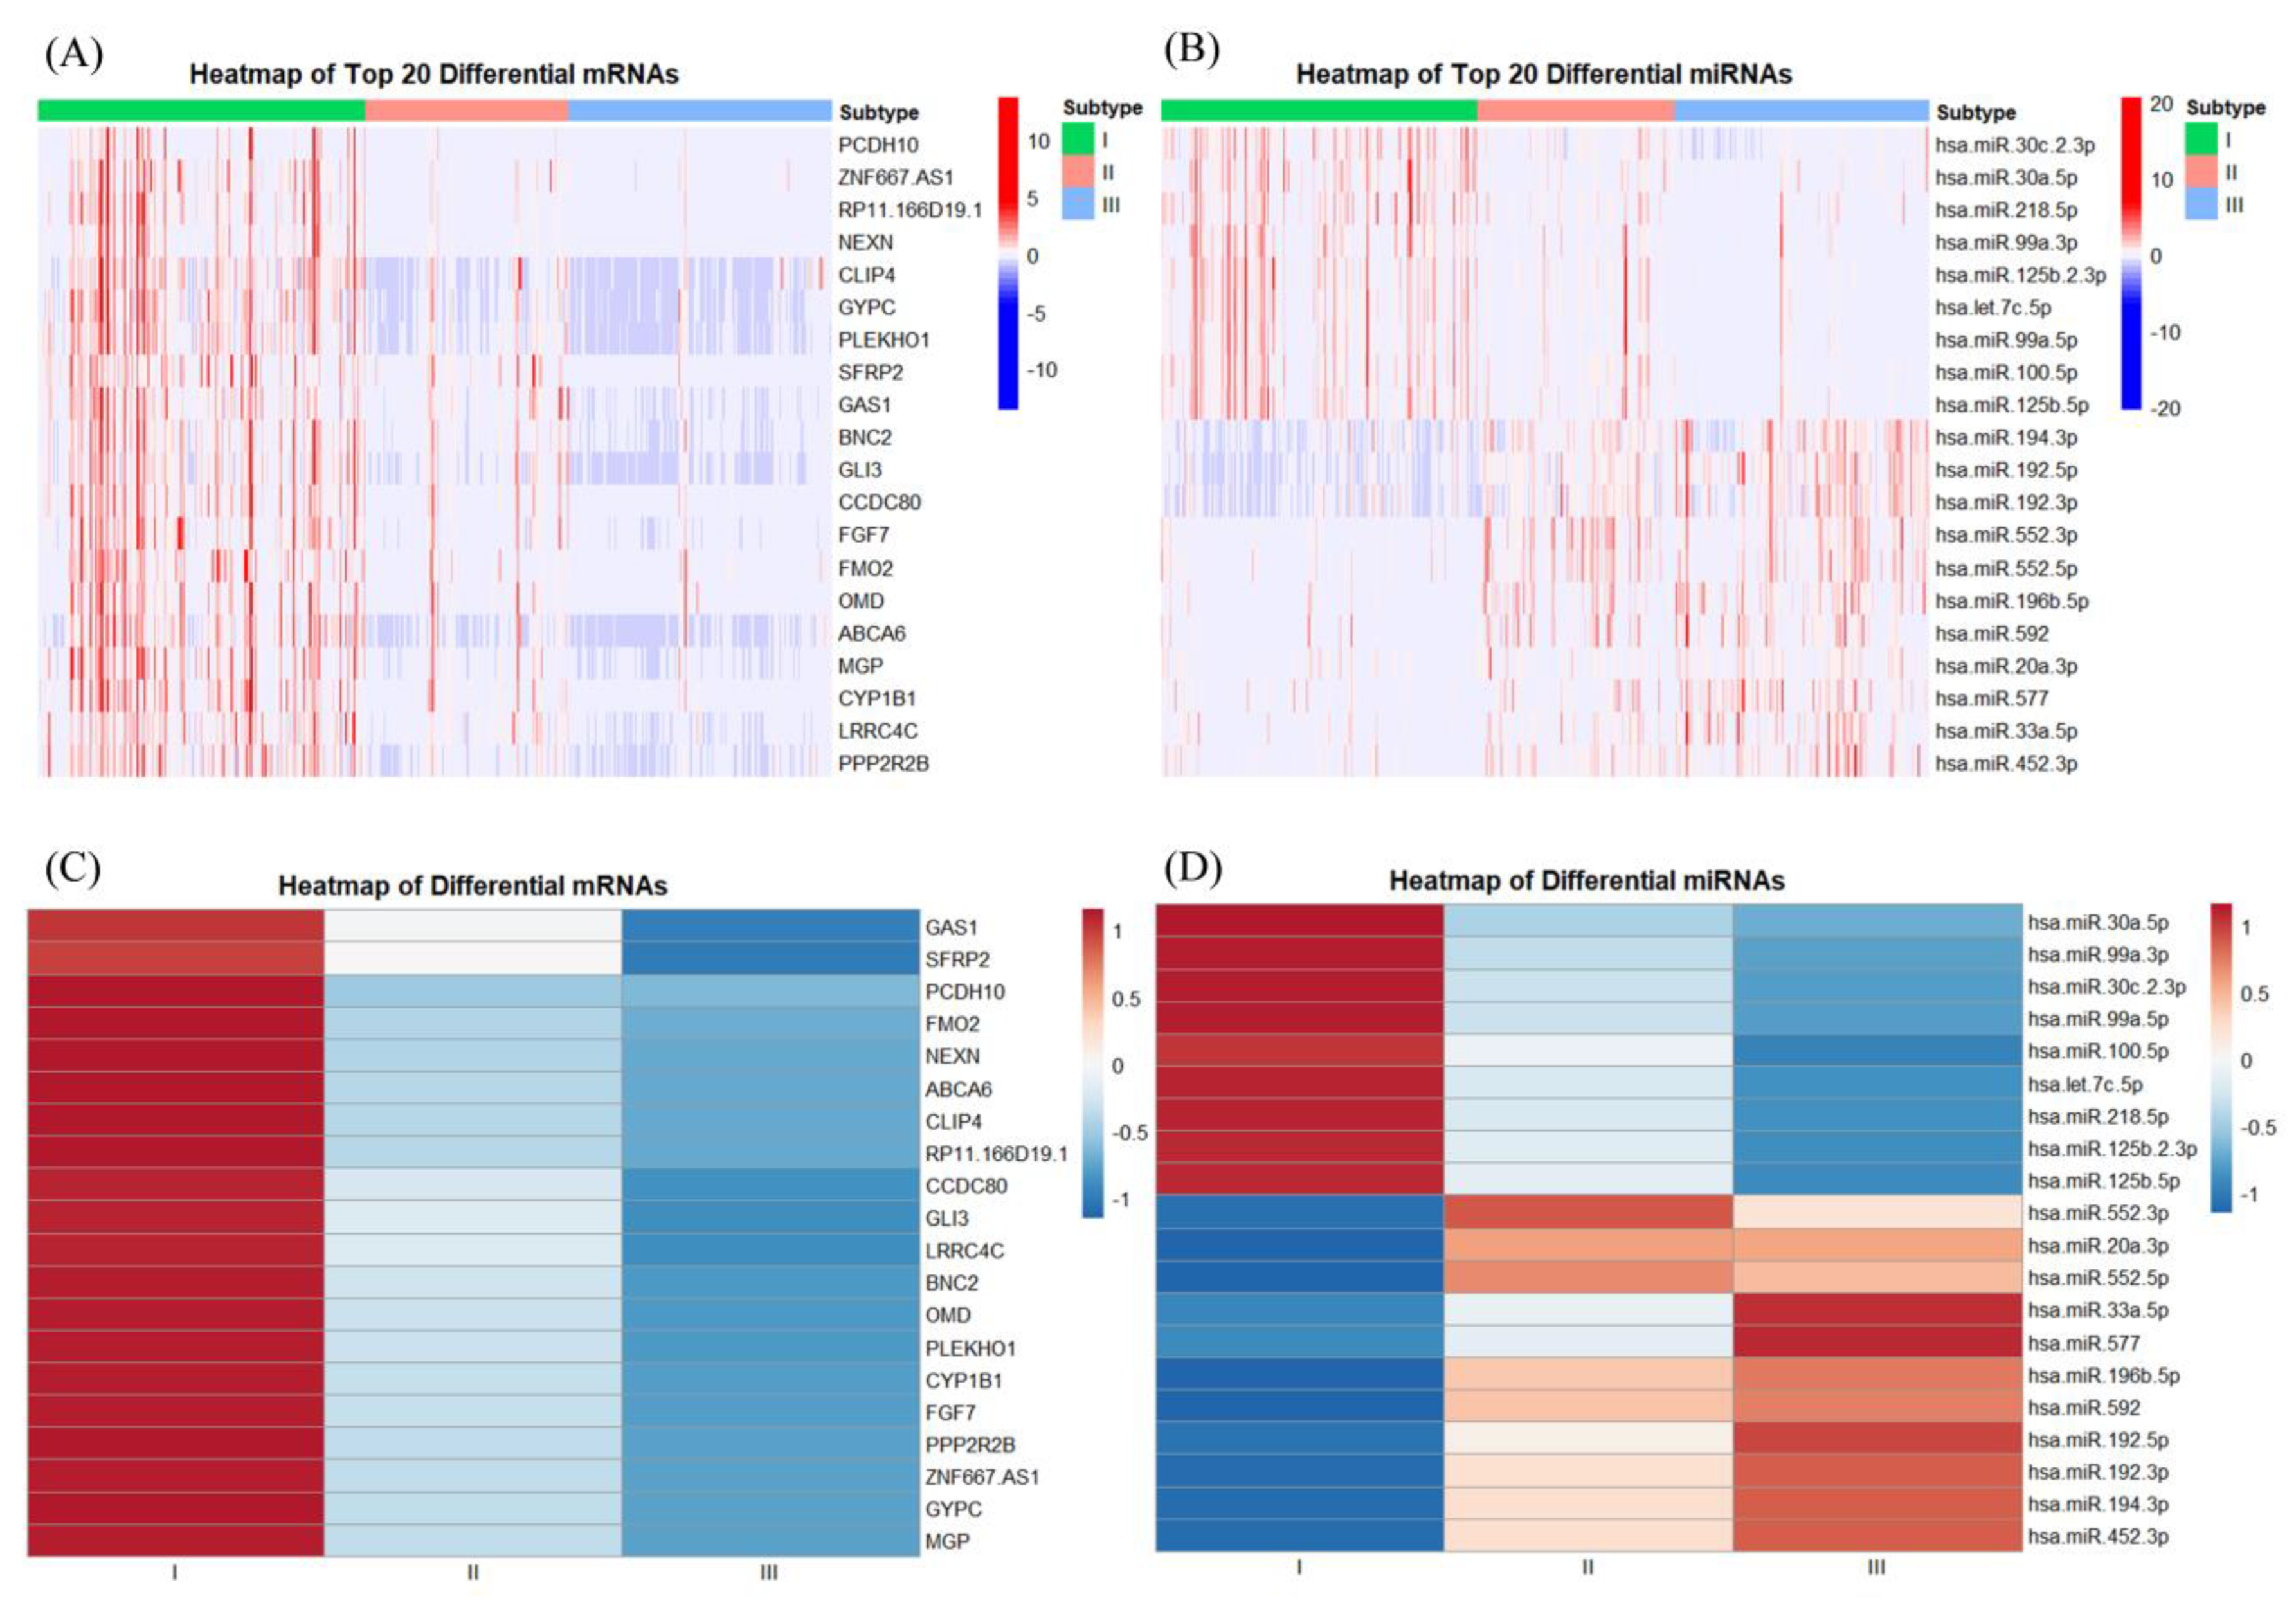
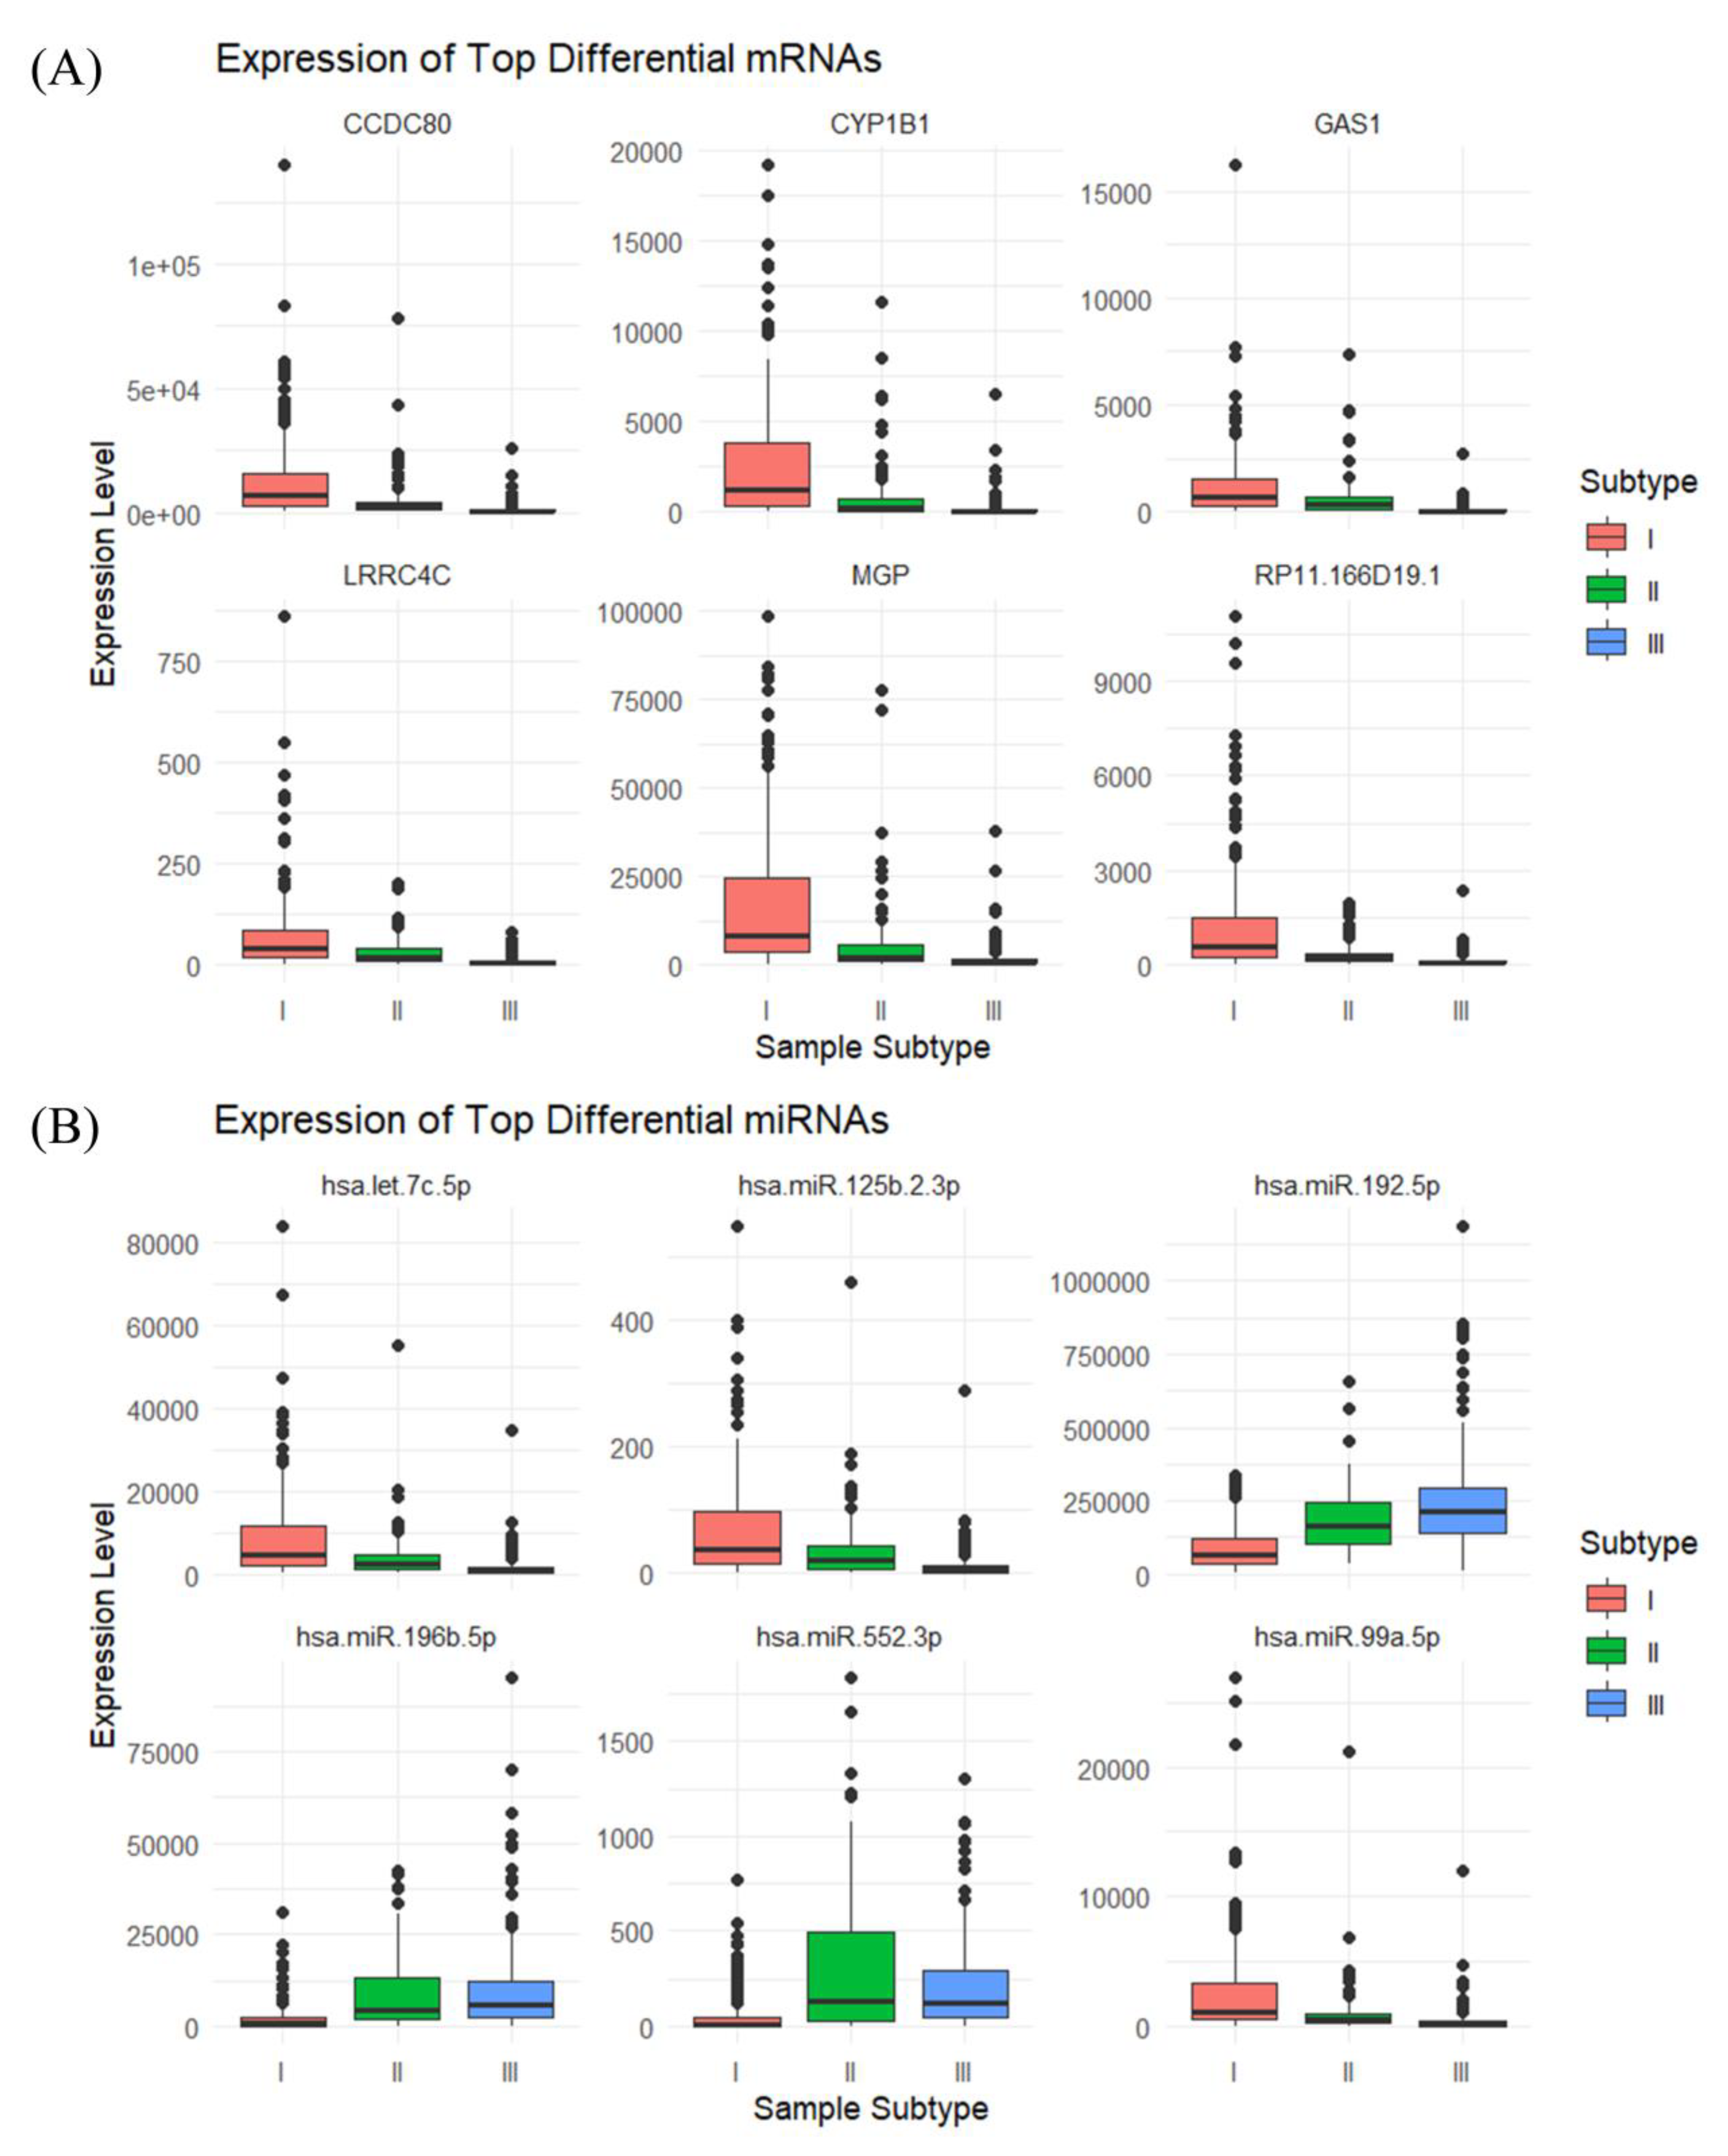
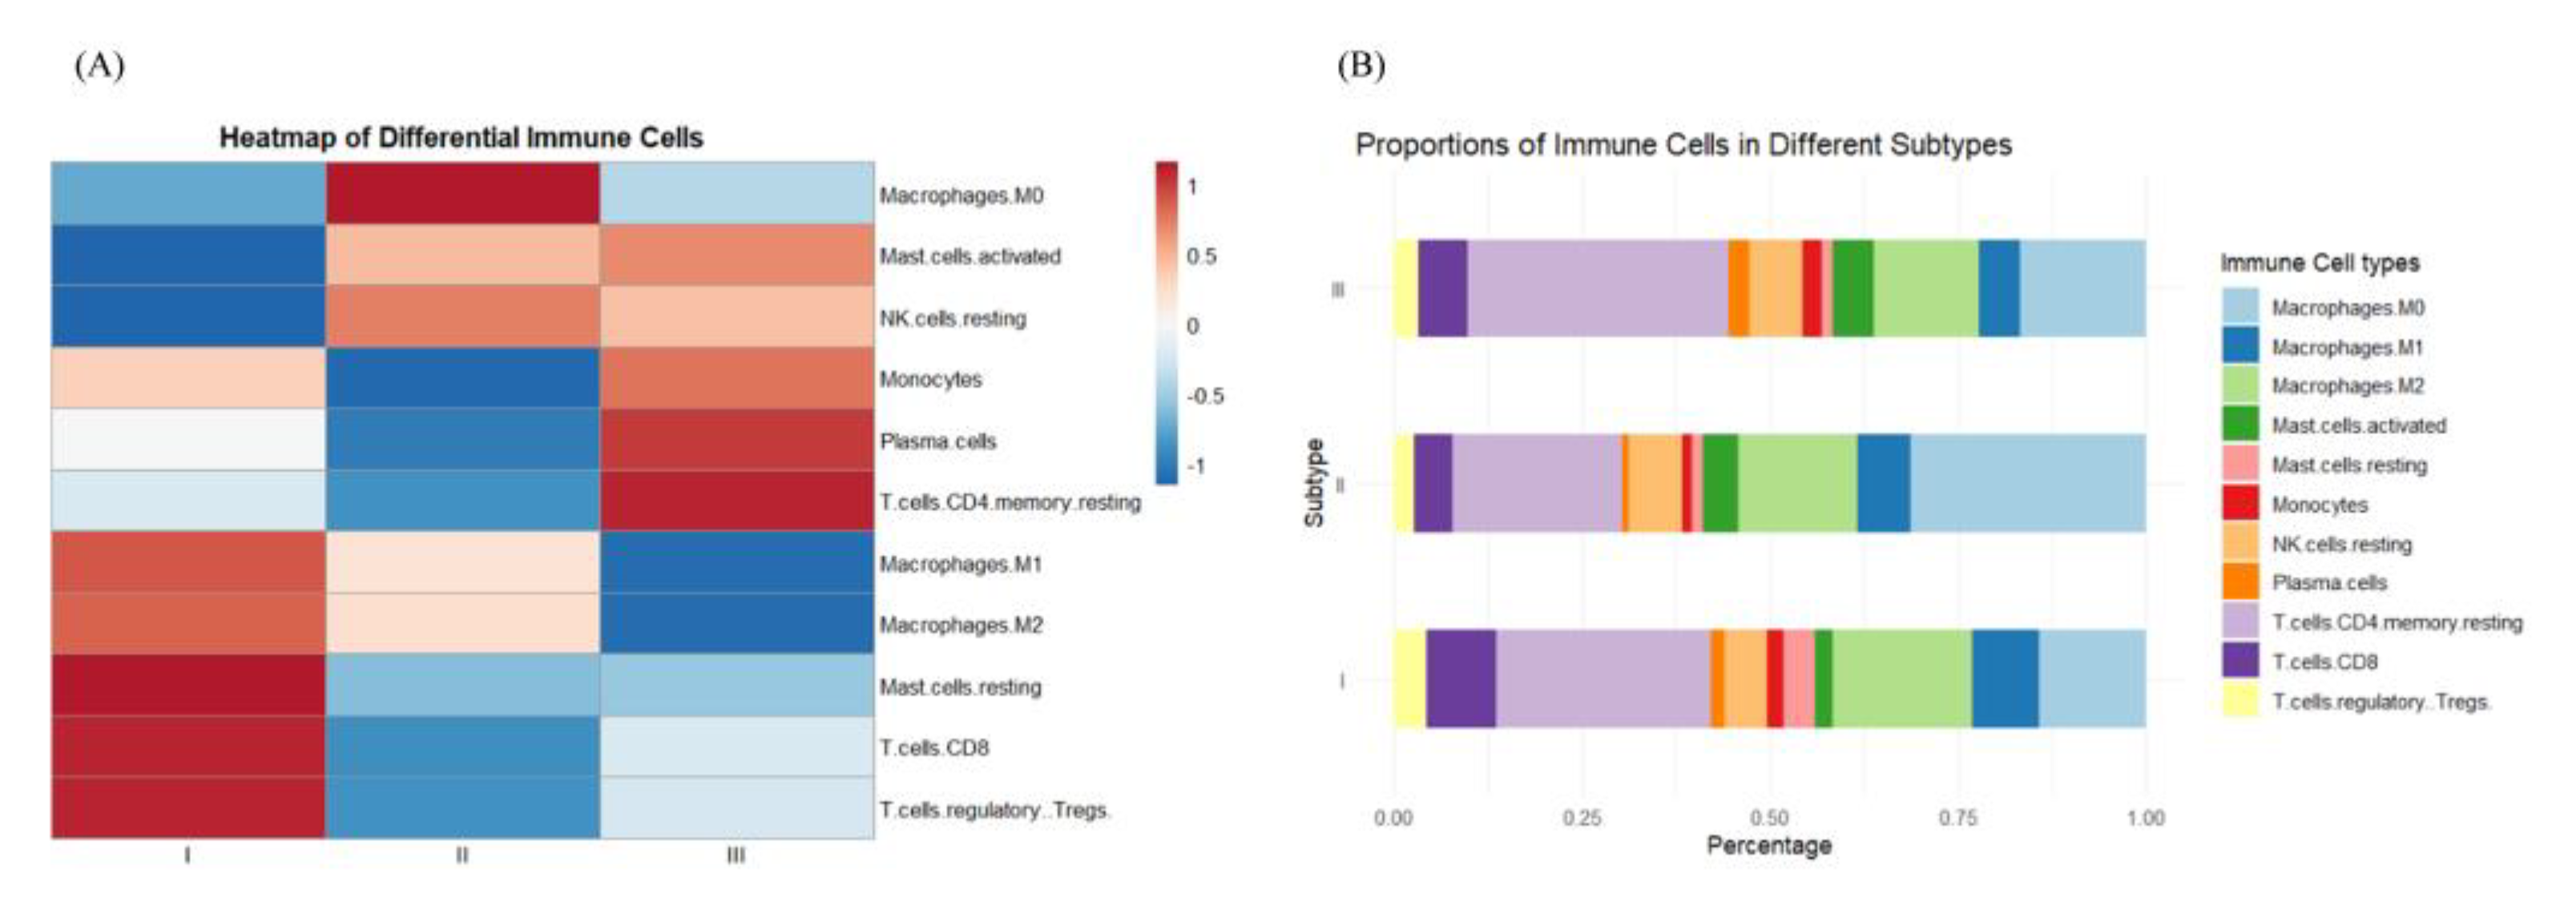
3.2. Identification of Hub Genes of Different Subtypes by WGCNA
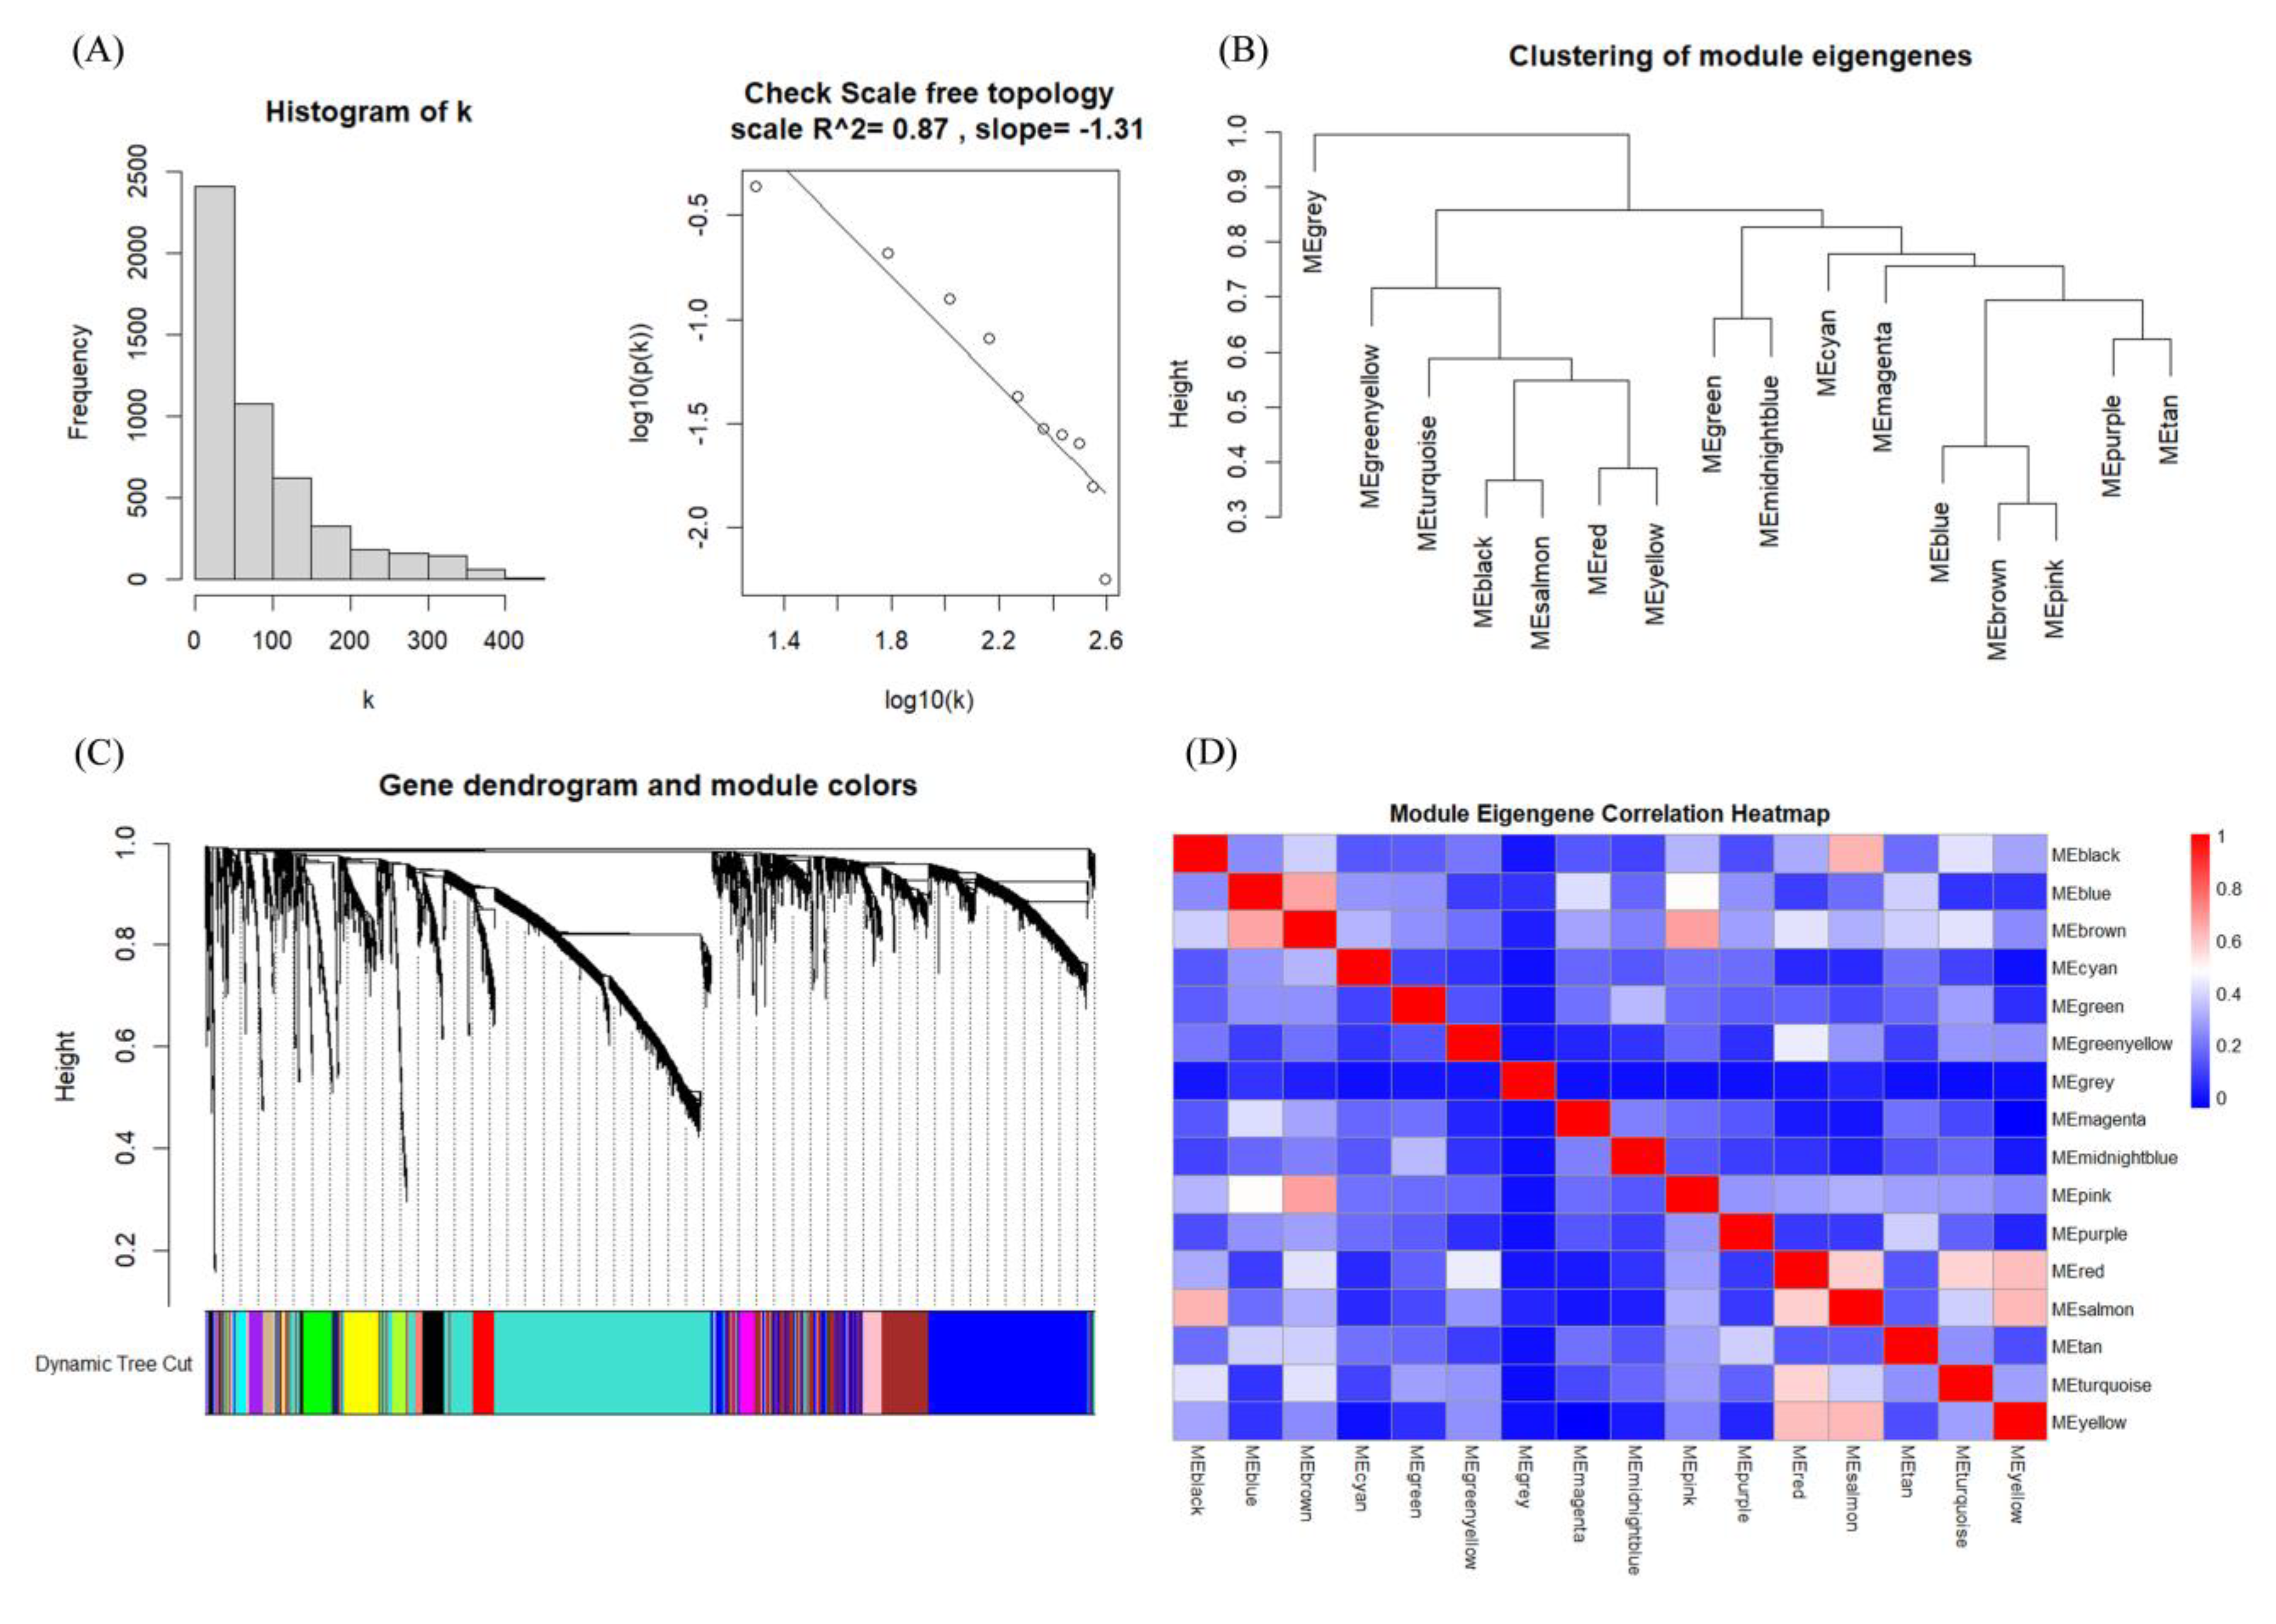
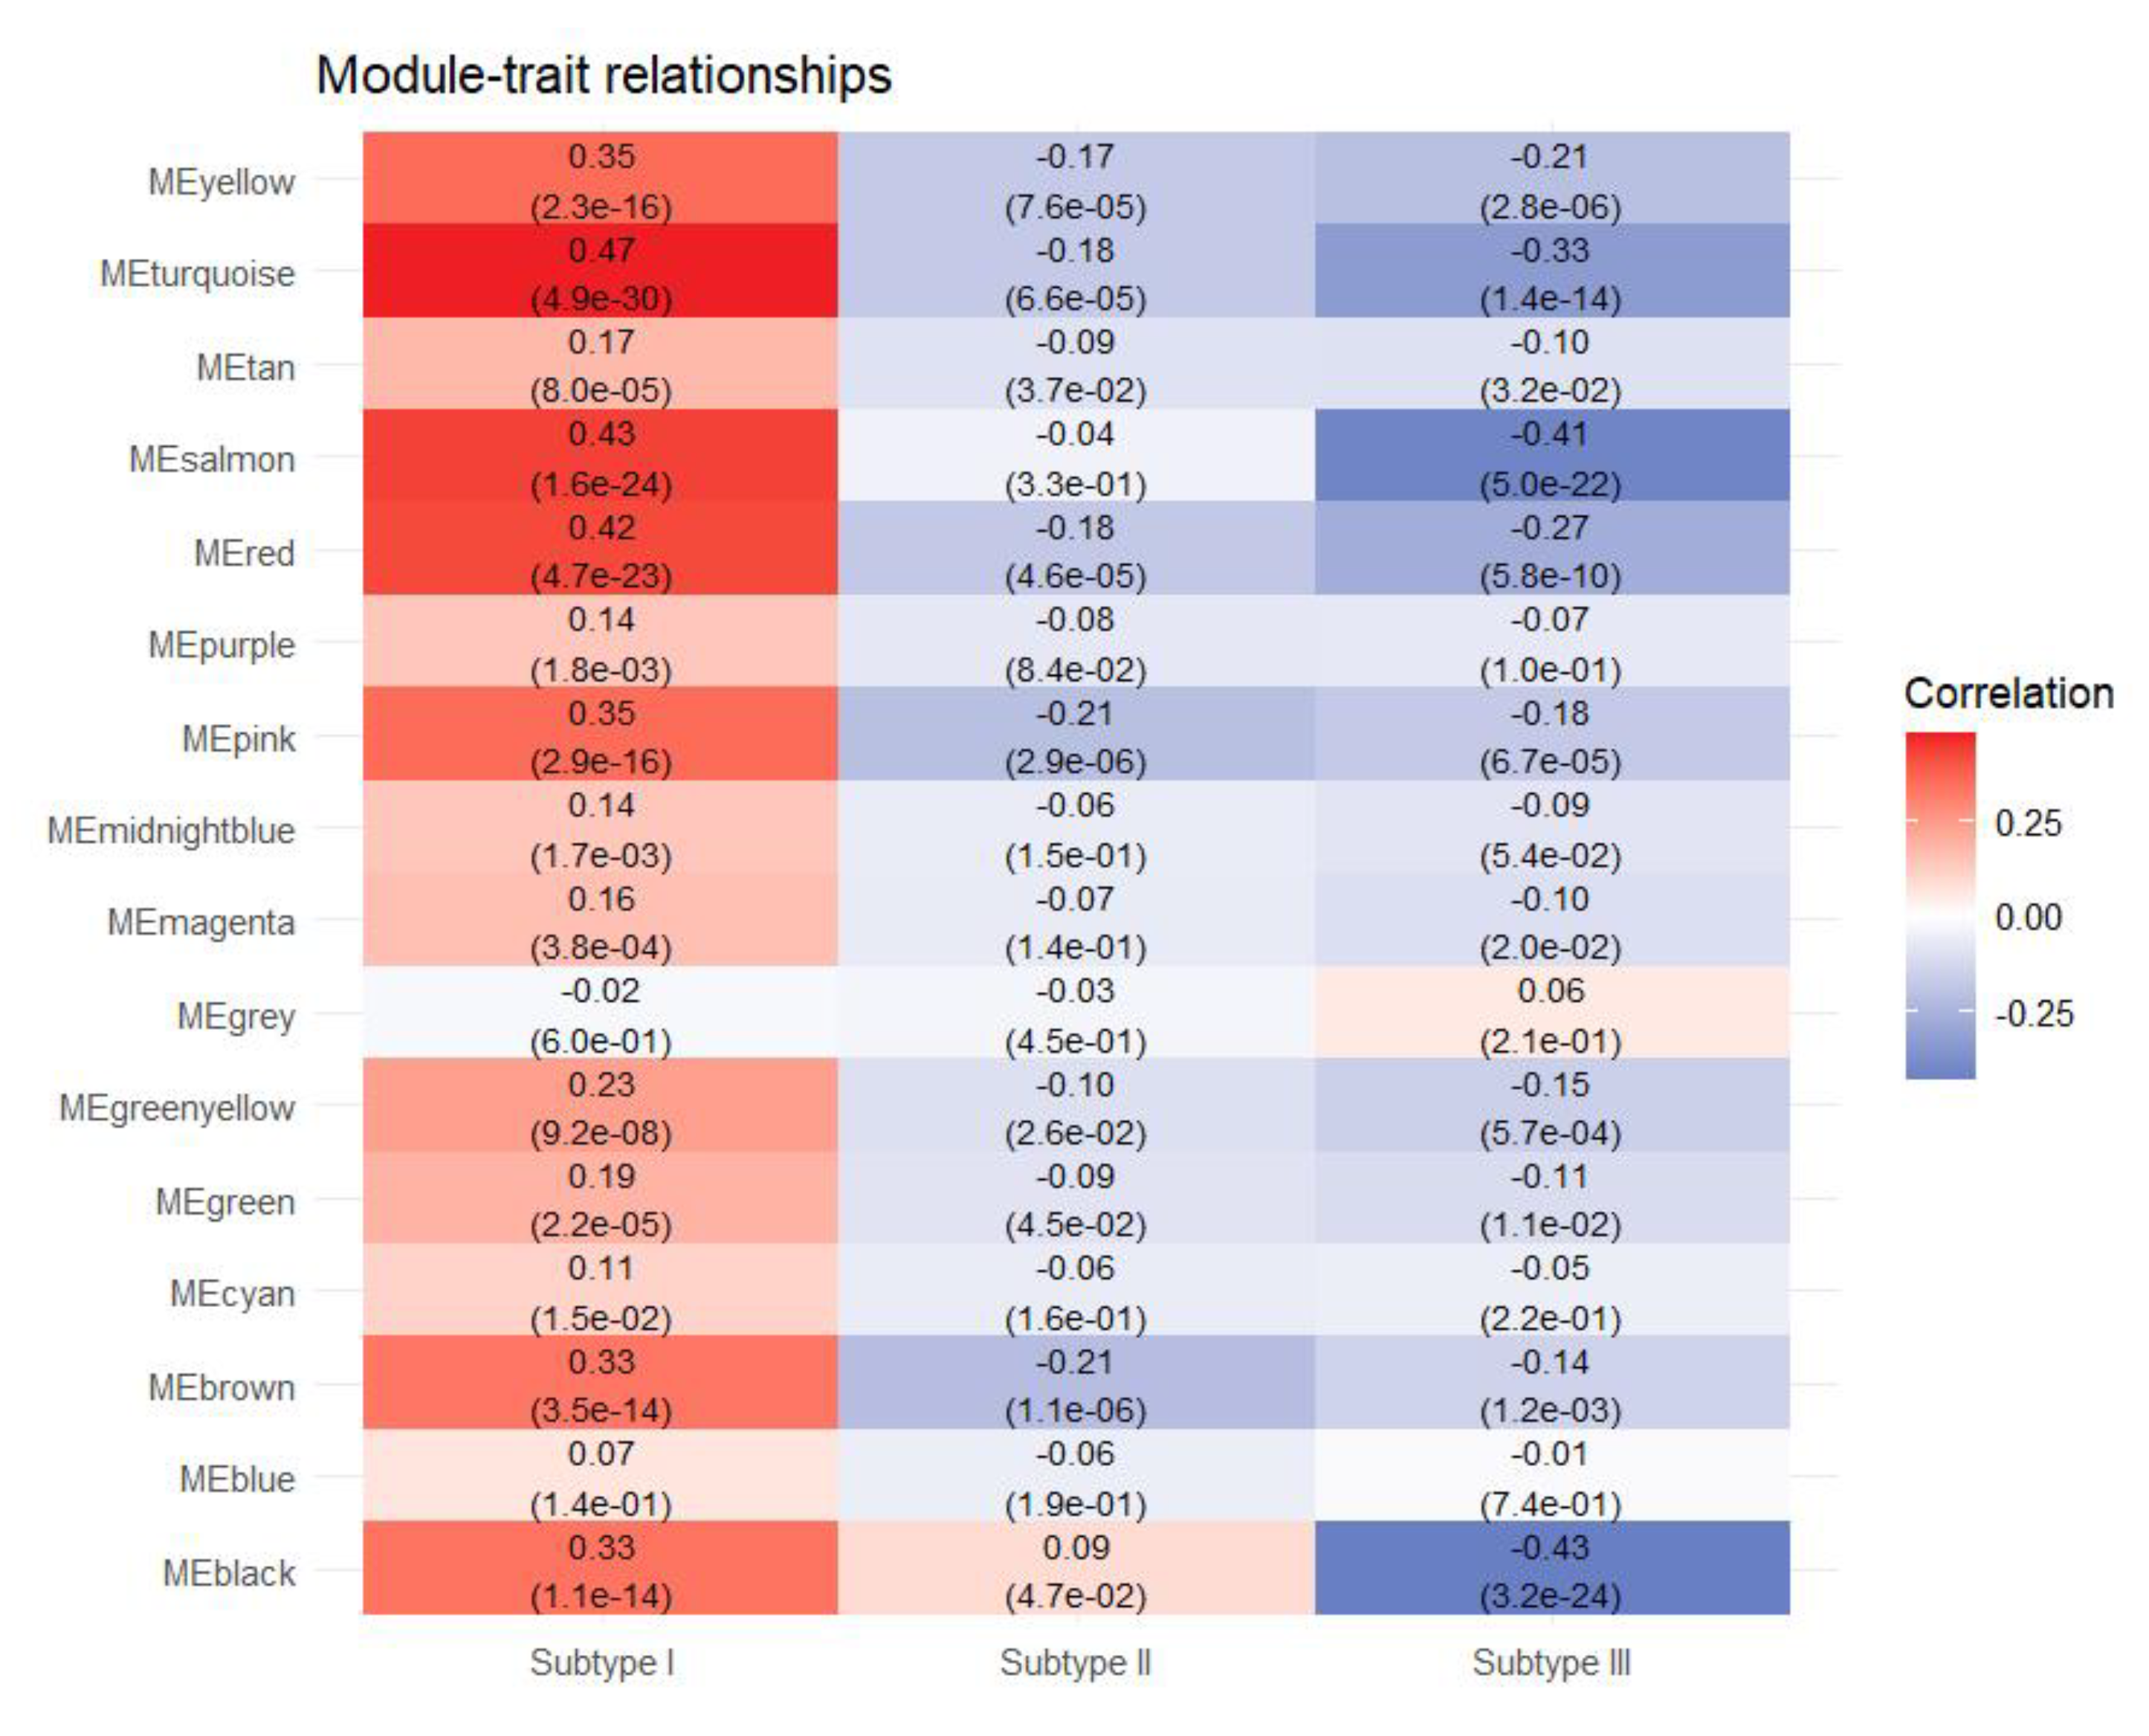
| Subtype I | kWithin | Subtype II | kWithin | Subtype III | kWithin |
| MAGI2-AS3 | 371.7129 | RP11-416A17.6 | 55.3853 | SPARC | 34.4698 |
| TTC28 | 345.3234 | RP11-166B2.3 | 52.2037 | FAP | 33.0935 |
| RBMS3 | 345.2273 | RP11-192H23.7 | 50.8855 | BGN | 29.6813 |
| CNRIP1 | 338.6266 | MALAT1 | 46.6874 | SULF1 | 29.6049 |
| PLEKHO1 | 323.7333 | RP11-49O14.2 | 46.2525 | CDH11 | 28.0017 |
| GYPC | 315.0139 | CTD-2014D20.1 | 46.0766 | PRRX1 | 26.9047 |
| C20orf194 | 313.7970 | LA16c-431H6.6 | 45.3105 | THY1 | 26.4728 |
| CLIP4 | 312.4037 | NPIPB5 | 40.0239 | NOX4 | 25.9135 |
| FOXN3 | 309.4977 | RYKP1 | 39.8201 | ||
| ATP8B2 | 300.8144 | ||||
| RP11-875O11.1 | 286.9392 | ||||
| PDE1A | 254.0221 | ||||
| NR3C1 | 249.1351 | ||||
| SLC9A9 | 248.7150 | ||||
| NR2F2-AS1 | 245.9516 | ||||
| RP11-730A19.9 | 226.7302 |
3.3. Impact of Hub Genes on the Development of Gastrointestinal Tumors
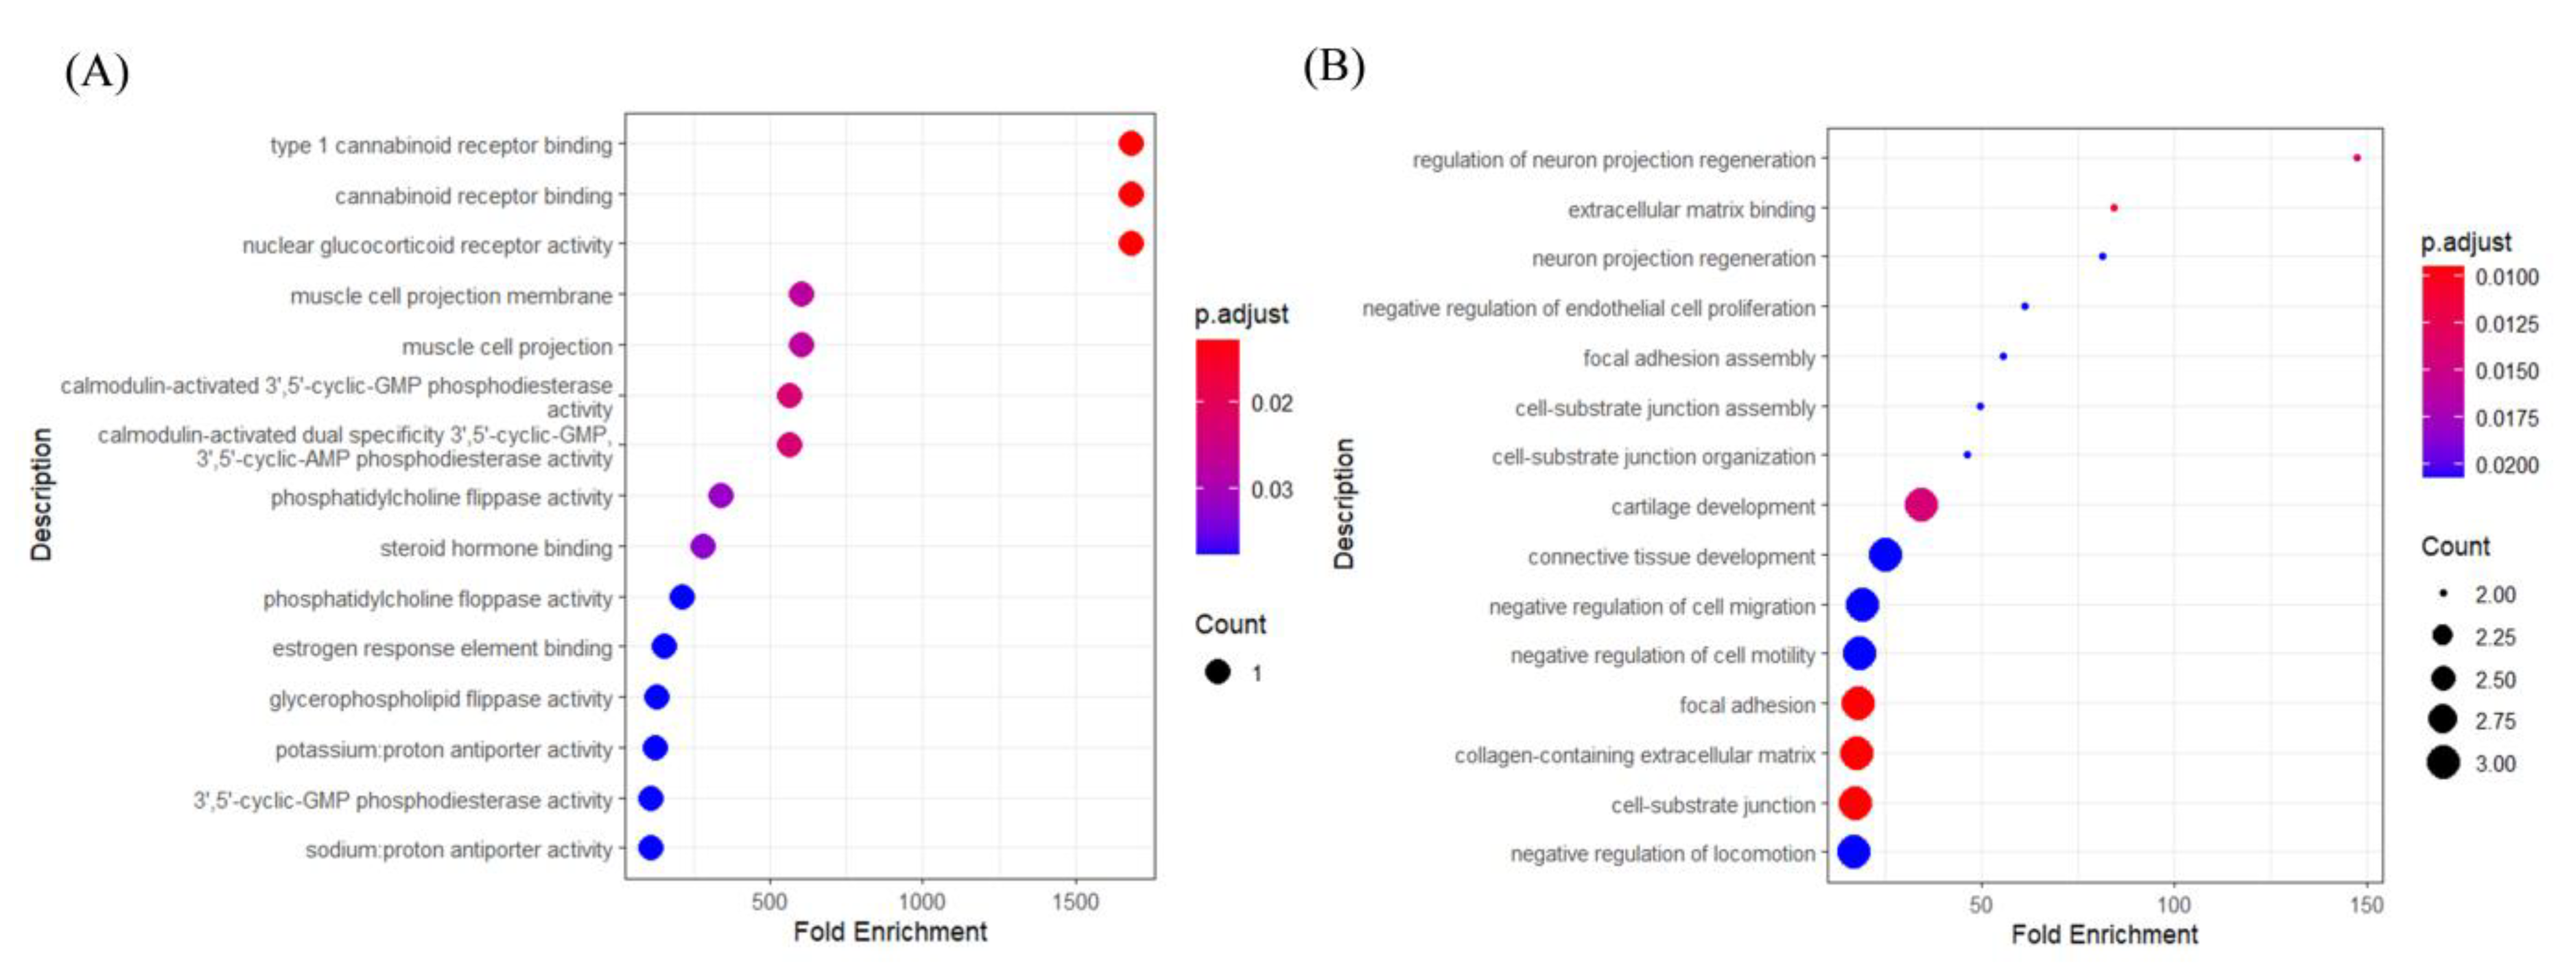
4. Discussion
5. Conclusions
Supplementary Materials
Author Contributions
Funding
Institutional Review Board Statement
Informed Consent Statement
Data Availability Statement
Acknowledgments
Conflicts of Interest
References
- Sung H., Ferlay J., Siegel R.L., Laversanne M., Soerjomataram I., Jemal A., et al. Global Cancer Statistics 2020: GLOBOCAN Estimates of Incidence and Mortality Worldwide for 36 Cancers in 185 Countries. CA Cancer J Clin, 2021, 71(3): 209-49. [CrossRef]
- Arnold M., Soerjomataram I., Ferlay J., Forman D. Global incidence of oesophageal cancer by histological subtype in 2012. Gut, 2015, 64(3): 381-7. [CrossRef]
- Torre L.A., Siegel R.L., Ward E.M., Jemal A. Global Cancer Incidence and Mortality Rates and Trends--An Update. Cancer Epidemiol Biomarkers Prev, 2016, 25(1): 16-27. [CrossRef]
- Xie Y., Shi L., He X., Luo Y. Gastrointestinal cancers in China, the USA, and Europe. Gastroenterol Rep (Oxf), 2021, 9(2): 91-104. [CrossRef]
- Lee J.H., Bae J.S., Ryu K.W., Lee J.S., Park S.R., Kim C.G., et al. Gastric cancer patients at high-risk of having synchronous cancer. World J Gastroenterol, 2006, 12(16): 2588-92. [CrossRef]
- Lim S.B., Jeong S.Y., Choi H.S., Sohn D.K., Hong C.W., Jung K.H., et al. Synchronous gastric cancer in primary sporadic colorectal cancer patients in Korea. Int J Colorectal Dis, 2008, 23(1): 61-5. [CrossRef]
- Yoon S.N., Oh S.T., Lim S.B., Kim T.W., Kim J.H., Yu C.S., et al. Clinicopathologic characteristics of colorectal cancer patients with synchronous and metachronous gastric cancer. World J Surg, 2010, 34(9): 2168-76. [CrossRef]
- Haffner M.C., Kronberger I.E., Ross J.S., Sheehan C.E., Zitt M., Mühlmann G., et al. Prostate-specific membrane antigen expression in the neovasculature of gastric and colorectal cancers. Human Pathology, 2009, 40(12): 1754-61. [CrossRef]
- Park J.G., Gazdar A.F. Biology of colorectal and gastric cancer cell lines. J Cell Biochem Suppl, 1996, 24: 131-41. [CrossRef]
- Lei Z., Tan I.B., Das K., Deng N., Zouridis H., Pattison S., et al. Identification of molecular subtypes of gastric cancer with different responses to PI3-kinase inhibitors and 5-fluorouracil. Gastroenterology, 2013, 145(3): 554-65. [CrossRef]
- Comprehensive molecular characterization of gastric adenocarcinoma. Nature, 2014, 513(7517): 202-9. [CrossRef]
- Budinska E., Popovici V., Tejpar S., D’Ario G., Lapique N., Sikora K.O., et al. Gene expression patterns unveil a new level of molecular heterogeneity in colorectal cancer. J Pathol, 2013, 231(1): 63-76. [CrossRef]
- Guinney J., Dienstmann R., Wang X., de Reyniès A., Schlicker A., Soneson C., et al. The consensus molecular subtypes of colorectal cancer. Nat Med, 2015, 21(11): 1350-6. [CrossRef]
- Li Q.L., Lin X., Yu Y.L., Chen L., Hu Q.X., Chen M., et al. Genome-wide profiling in colorectal cancer identifies PHF19 and TBC1D16 as oncogenic super enhancers. Nat Commun, 2021, 12(1): 6407. [CrossRef]
- Paz-Cabezas M., Calvo-López T., Romera-Lopez A., Tabas-Madrid D., Ogando J., Fernández-Aceñero M.J., et al. Molecular Classification of Colorectal Cancer by microRNA Profiling: Correlation with the Consensus Molecular Subtypes (CMS) and Validation of miR-30b Targets. Cancers (Basel), 2022, 14(21). [CrossRef]
- Nausheen N., Seal A., Khanna P., Halder S. A FPGA based implementation of Sobel edge detection. Microprocessors and Microsystems, 2018, 56: 84-91. [CrossRef]
- Hoang N.-D., Nguyen Q.-L. Metaheuristic Optimized Edge Detection for Recognition of Concrete Wall Cracks: A Comparative Study on the Performances of Roberts, Prewitt, Canny, and Sobel Algorithms. Advances in Civil Engineering, 2018, 2018: 7163580. [CrossRef]
- Topno P., Murmu G. An Improved Edge Detection Method based on Median Filter; proceedings of the 2019 Devices for Integrated Circuit (DevIC), F 23-24 March 2019, 2019 [C].
- Er-sen L., Shu-long Z., Bao-shan Z., Yong Z., Chao-gui X., Li-hua S. An Adaptive Edge-Detection Method Based on the Canny Operator; proceedings of the 2009 International Conference on Environmental Science and Information Application Technology, F 4-5 July 2009, 2009 [C].
- Luo S., Yingwei F., Chang W., Liao H., Kang H.X., Huo L. Classification of human stomach cancer using morphological feature analysis from optical coherence tomography images. Laser Physics Letters, 2019. [CrossRef]
- Pratiwi N., Magdalena R., Fuadah N., Saidah S. K-Nearest Neighbor for colon cancer identification. Journal of Physics: Conference Series, 2019, 1367: 012023. [CrossRef]
- Toomey P.G., Vohra N.A., Ghansah T., Sarnaik A.A., Pilon-Thomas S.A. Immunotherapy for gastrointestinal malignancies. Cancer Control, 2013, 20(1): 32-42. [CrossRef]
- Tomczak K., Czerwińska P., Wiznerowicz M. The Cancer Genome Atlas (TCGA): an immeasurable source of knowledge. Contemp Oncol (Pozn), 2015, 19(1a): A68-77. [CrossRef]
- Kather J.N., Pearson A.T., Halama N., Jäger D., Krause J., Loosen S.H., et al. Deep learning can predict microsatellite instability directly from histology in gastrointestinal cancer. Nature Medicine, 2019, 25(7): 1054-6. [CrossRef]
- Song R., Zhang Z., Liu H. Edge connection based Canny edge detection algorithm. Pattern Recognit Image Anal, 2017, 27(4): 740–7. [CrossRef]
- Yang Q., Tan K.H., Ahuja N. Shadow Removal Using Bilateral Filtering. IEEE Transactions on Image Processing, 2012, 21(10): 4361-8. [CrossRef]
- Ling Y.Z., Ma W., Yu L., Zhang Y., Liang Q.S. Decreased PSD95 expression in medial prefrontal cortex (mPFC) was associated with cognitive impairment induced by sevoflurane anesthesia. J Zhejiang Univ Sci B, 2015, 16(9): 763-71. [CrossRef]
- Yang D., Parrish R.S., Brock G.N. Empirical evaluation of consistency and accuracy of methods to detect differentially expressed genes based on microarray data. Comput Biol Med, 2014, 46: 1-10. [CrossRef]
- Li A., Horvath S. Network neighborhood analysis with the multi-node topological overlap measure. Bioinformatics, 2007, 23(2): 222-31. [CrossRef]
- Voigt A., Almaas E. Assessment of weighted topological overlap (wTO) to improve fidelity of gene co-expression networks. BMC Bioinformatics, 2019, 20(1): 58. [CrossRef]
- Zhang B., Horvath S. A general framework for weighted gene co-expression network analysis. Stat Appl Genet Mol Biol, 2005, 4: Article17. [CrossRef]
- Wang B., Mezlini A.M., Demir F., Fiume M., Tu Z., Brudno M., et al. Similarity network fusion for aggregating data types on a genomic scale. Nature Methods, 2014, 11(3): 333-7. [CrossRef]
- Wang B., Mezlini A.M., Demir F., Fiume M., Tu Z., Brudno M., et al. Similarity network fusion for aggregating data types on a genomic scale. Nat Methods, 2014, 11(3): 333-7. [CrossRef]
- Hashimoto I., Oshima T. Claudins and Gastric Cancer: An Overview. Cancers, 2022, 14(2): 290.
- Vonniessen B., Tabariès S., Siegel P.M. Antibody-mediated targeting of Claudins in cancer. Frontiers in Oncology, 2024, 14. [CrossRef]
- Shan M.-j., Meng L.-b., Guo P., Zhang Y.-m., Kong D., Liu Y.-b. Screening and Identification of Key Biomarkers of Gastric Cancer: Three Genes Jointly Predict Gastric Cancer. Frontiers in Oncology, 2021, 11. [CrossRef]
- Jiang R., Chen X., Ge S., Wang Q., Liu Y., Chen H., et al. MiR-21-5p Induces Pyroptosis in Colorectal Cancer via TGFBI. Frontiers in Oncology, 2021, 10. [CrossRef]
- Chen Y., Gao X., Dai X., Xia Y., Zhang X., Sun L., et al. Integrated Bioinformatics and Experimental Analysis of Long Noncoding RNA Associated-ceRNA as Prognostic Biomarkers in Advanced Stomach Adenocarcinoma. Journal of Cancer, 2024, 15(6): 1536-50. [CrossRef]
- Ren H., Li Z., Tang Z., Li J., Lang X. Long noncoding MAGI2-AS3 promotes colorectal cancer progression through regulating miR-3163/TMEM106B axis. Journal of Cellular Physiology, 2019, 235: 4824 - 33.
- Wu Q., Meng W.Y., Jie Y., Zhao H. LncRNA MALAT1 induces colon cancer development by regulating miR-129-5p/HMGB1 axis. J Cell Physiol, 2018, 233(9): 6750-7. [CrossRef]
- Chen S., Shen X. Long noncoding RNAs: functions and mechanisms in colon cancer. Mol Cancer, 2020, 19(1): 167. [CrossRef]
- Xu W., Ding M., Wang B., Cai Y., Guo C., Yuan C. Molecular Mechanism of the Canonical Oncogenic lncRNA MALAT1 in Gastric Cancer. Current Medicinal Chemistry, 2021, 28(42): 8800-9. [CrossRef]
- Ma J., Ma Y., Chen S., Guo S., Hu J., Yue T., et al. SPARC enhances 5-FU chemosensitivity in gastric cancer by modulating epithelial-mesenchymal transition and apoptosis. Biochemical and Biophysical Research Communications, 2021, 558: 134-40. [CrossRef]
- Mortezapour M., Tapak L., Bahreini F., Najafi R., Afshar S. Identification of key genes in colorectal cancer diagnosis by weighted gene co-expression network analysis. Computers in Biology and Medicine, 2023, 157: 106779. [CrossRef]
- Taschler U., Hasenoehrl C., Storr M., Schicho R. Cannabinoid Receptors in Regulating the GI Tract: Experimental Evidence and Therapeutic Relevance. Handb Exp Pharmacol, 2017, 239: 343-62. [CrossRef]
- Pagano E., Borrelli F. Targeting cannabinoid receptors in gastrointestinal cancers for therapeutic uses: current status and future perspectives. Expert Rev Gastroenterol Hepatol, 2017, 11(10): 871-3. [CrossRef]
- Tian D., Tian M., Han G., Li J.-L. Increased glucocorticoid receptor activity and proliferation in metastatic colon cancer. Scientific Reports, 2019, 9(1): 11257. [CrossRef]
- Brassart-Pasco S., Brézillon S., Brassart B., Ramont L., Oudart J.-B., Monboisse J.C. Tumor Microenvironment: Extracellular Matrix Alterations Influence Tumor Progression. Frontiers in Oncology, 2020, 10. [CrossRef]
Disclaimer/Publisher’s Note: The statements, opinions and data contained in all publications are solely those of the individual author(s) and contributor(s) and not of MDPI and/or the editor(s). MDPI and/or the editor(s) disclaim responsibility for any injury to people or property resulting from any ideas, methods, instructions or products referred to in the content. |
© 2024 by the authors. Licensee MDPI, Basel, Switzerland. This article is an open access article distributed under the terms and conditions of the Creative Commons Attribution (CC BY) license (http://creativecommons.org/licenses/by/4.0/).


