Submitted:
13 August 2024
Posted:
16 August 2024
You are already at the latest version
Abstract

Keywords:
1. Introduction
2. Results
2.1. Kinetics of ROS Production by Isolated Human Blood Neutrophils upon Activation by a CD Isolate ZvL2 and a Laboratory Strain MG1655 without and in the Presence of Autologous Serum
2.2. Production of Cytokines TNF-α, IL-6, IL-1β by Isolated Human Blood Neutrophils after Incubation with CD Isolate ZvL2 and Laboratory Strain MG1655 In Vitro and ζ-Potential
2.3. Comparative Proteomic Analysis of Membrane Fractions Isolated from the Cells of the CD Isolate ZvL2 and Laboratory Strain MG1655
2.3.1. 2D-DIGE
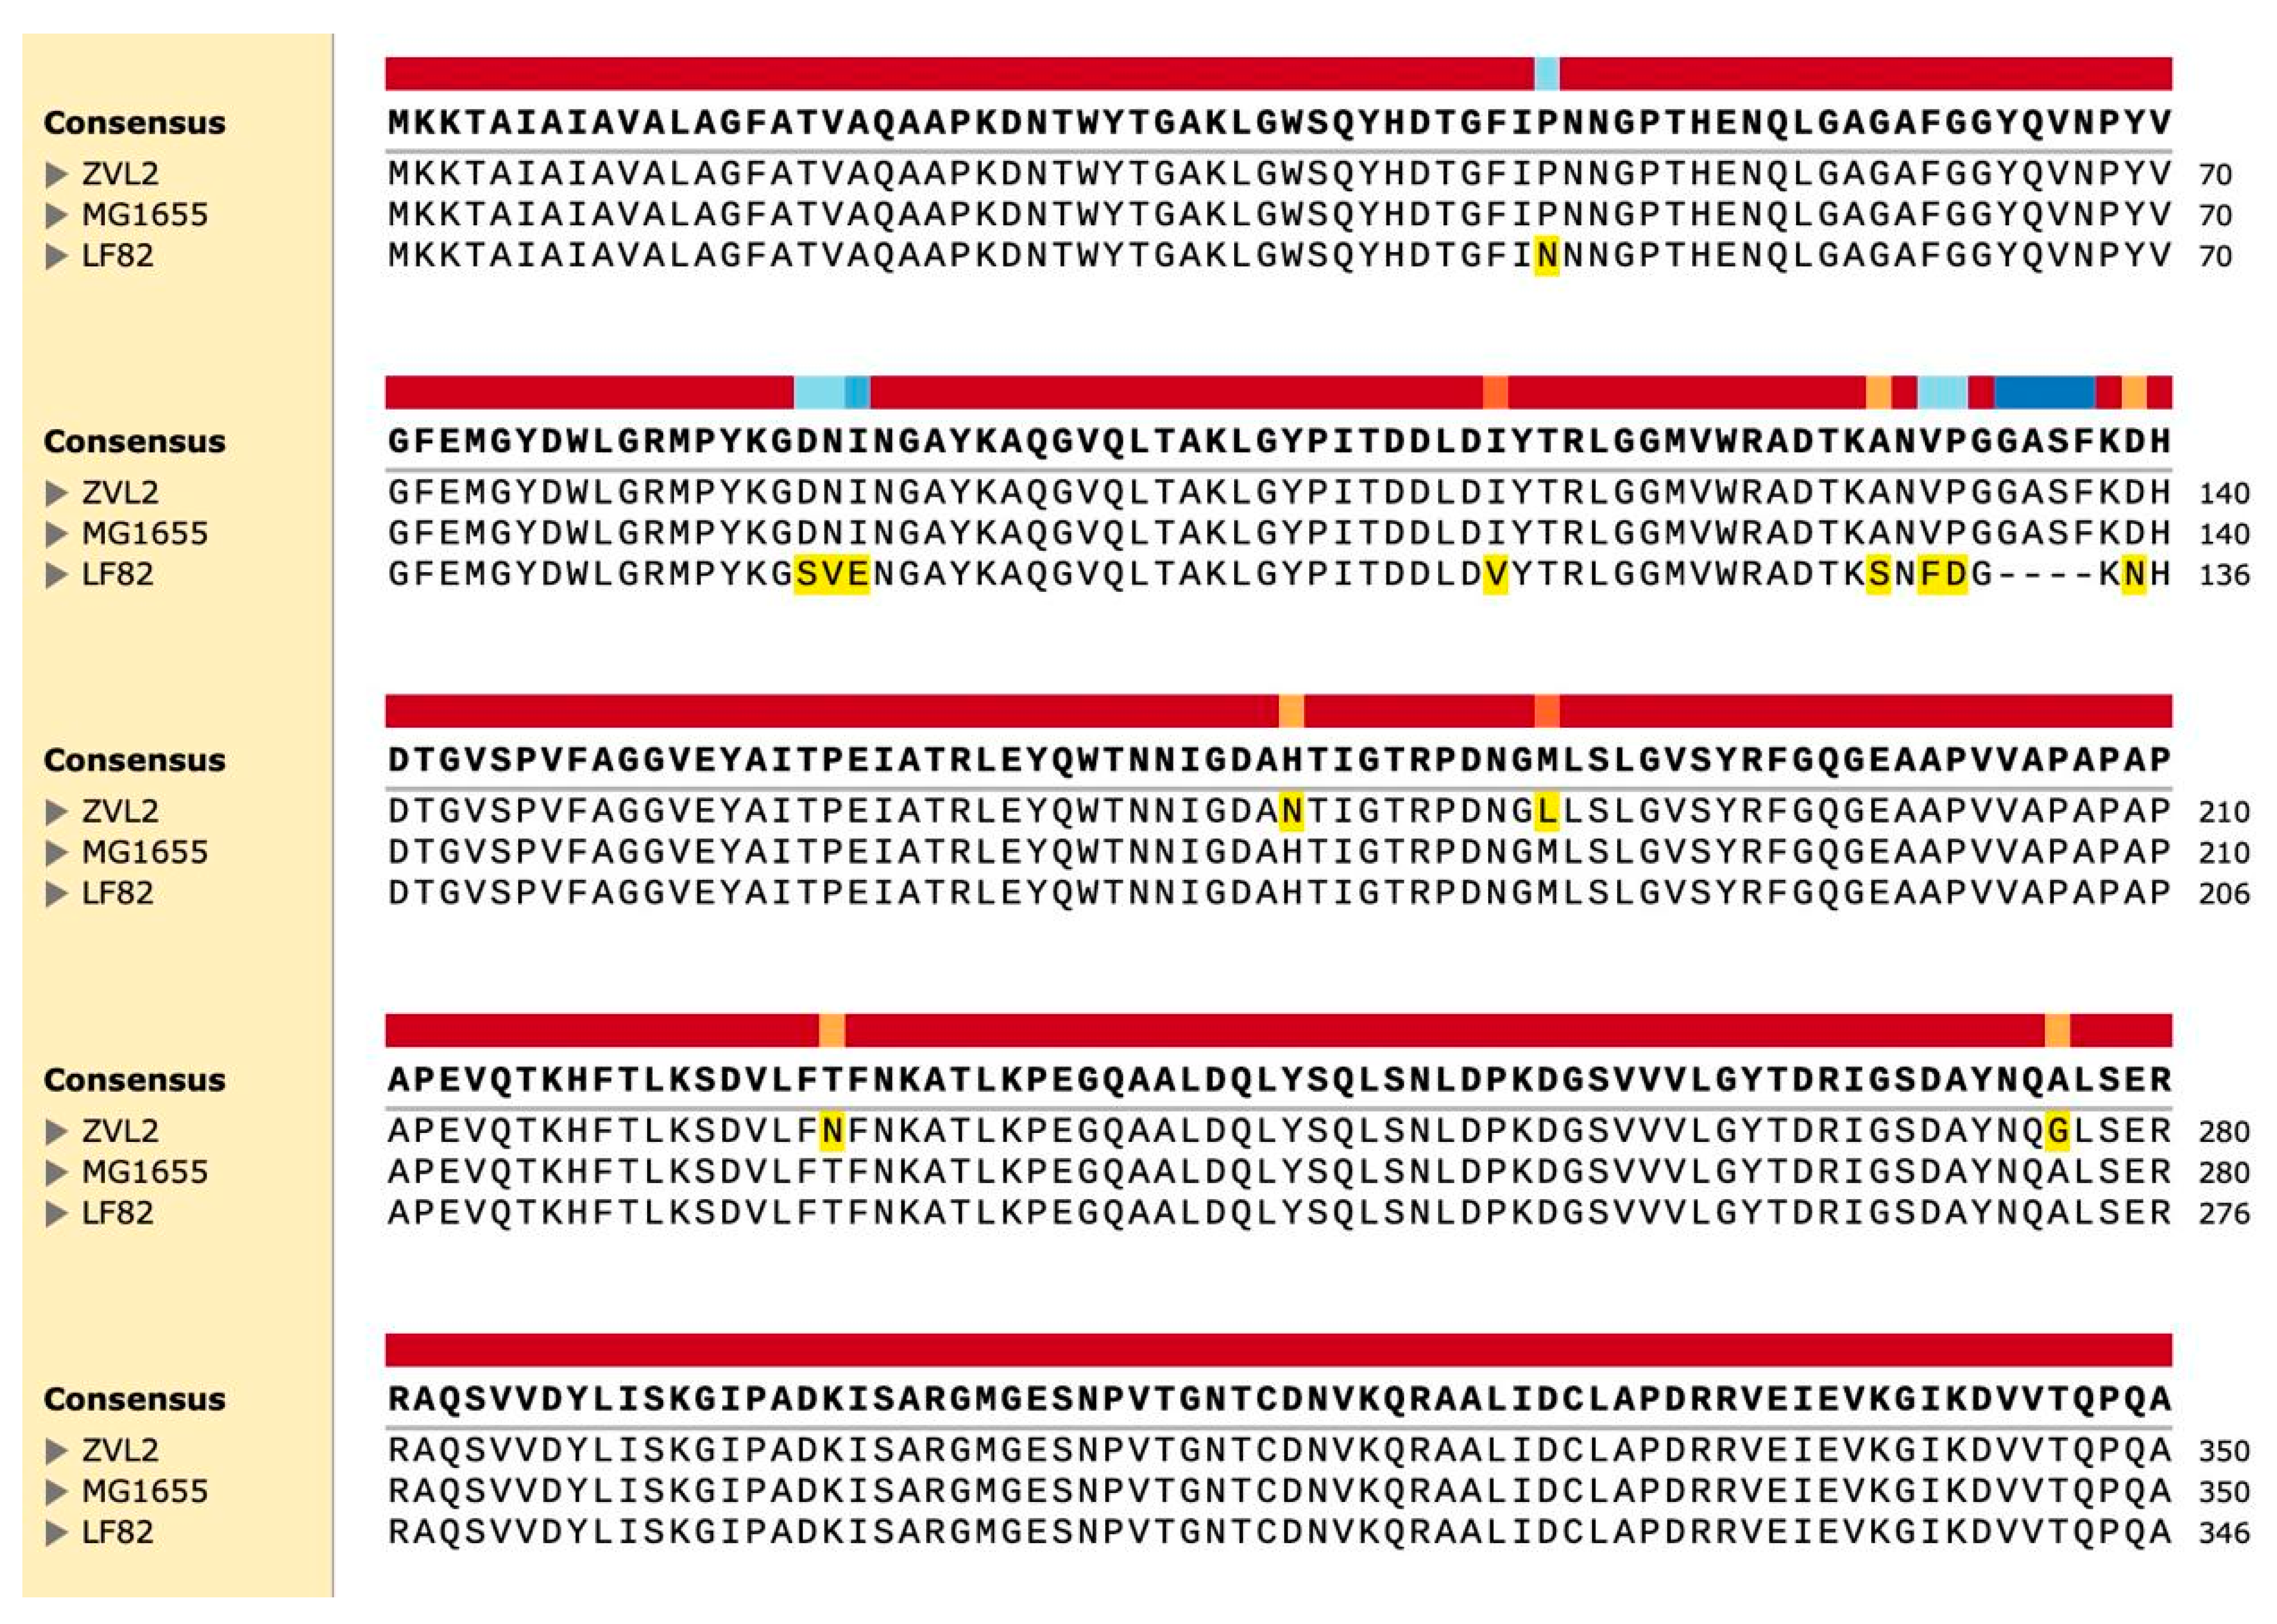
2.3.2. OmpA
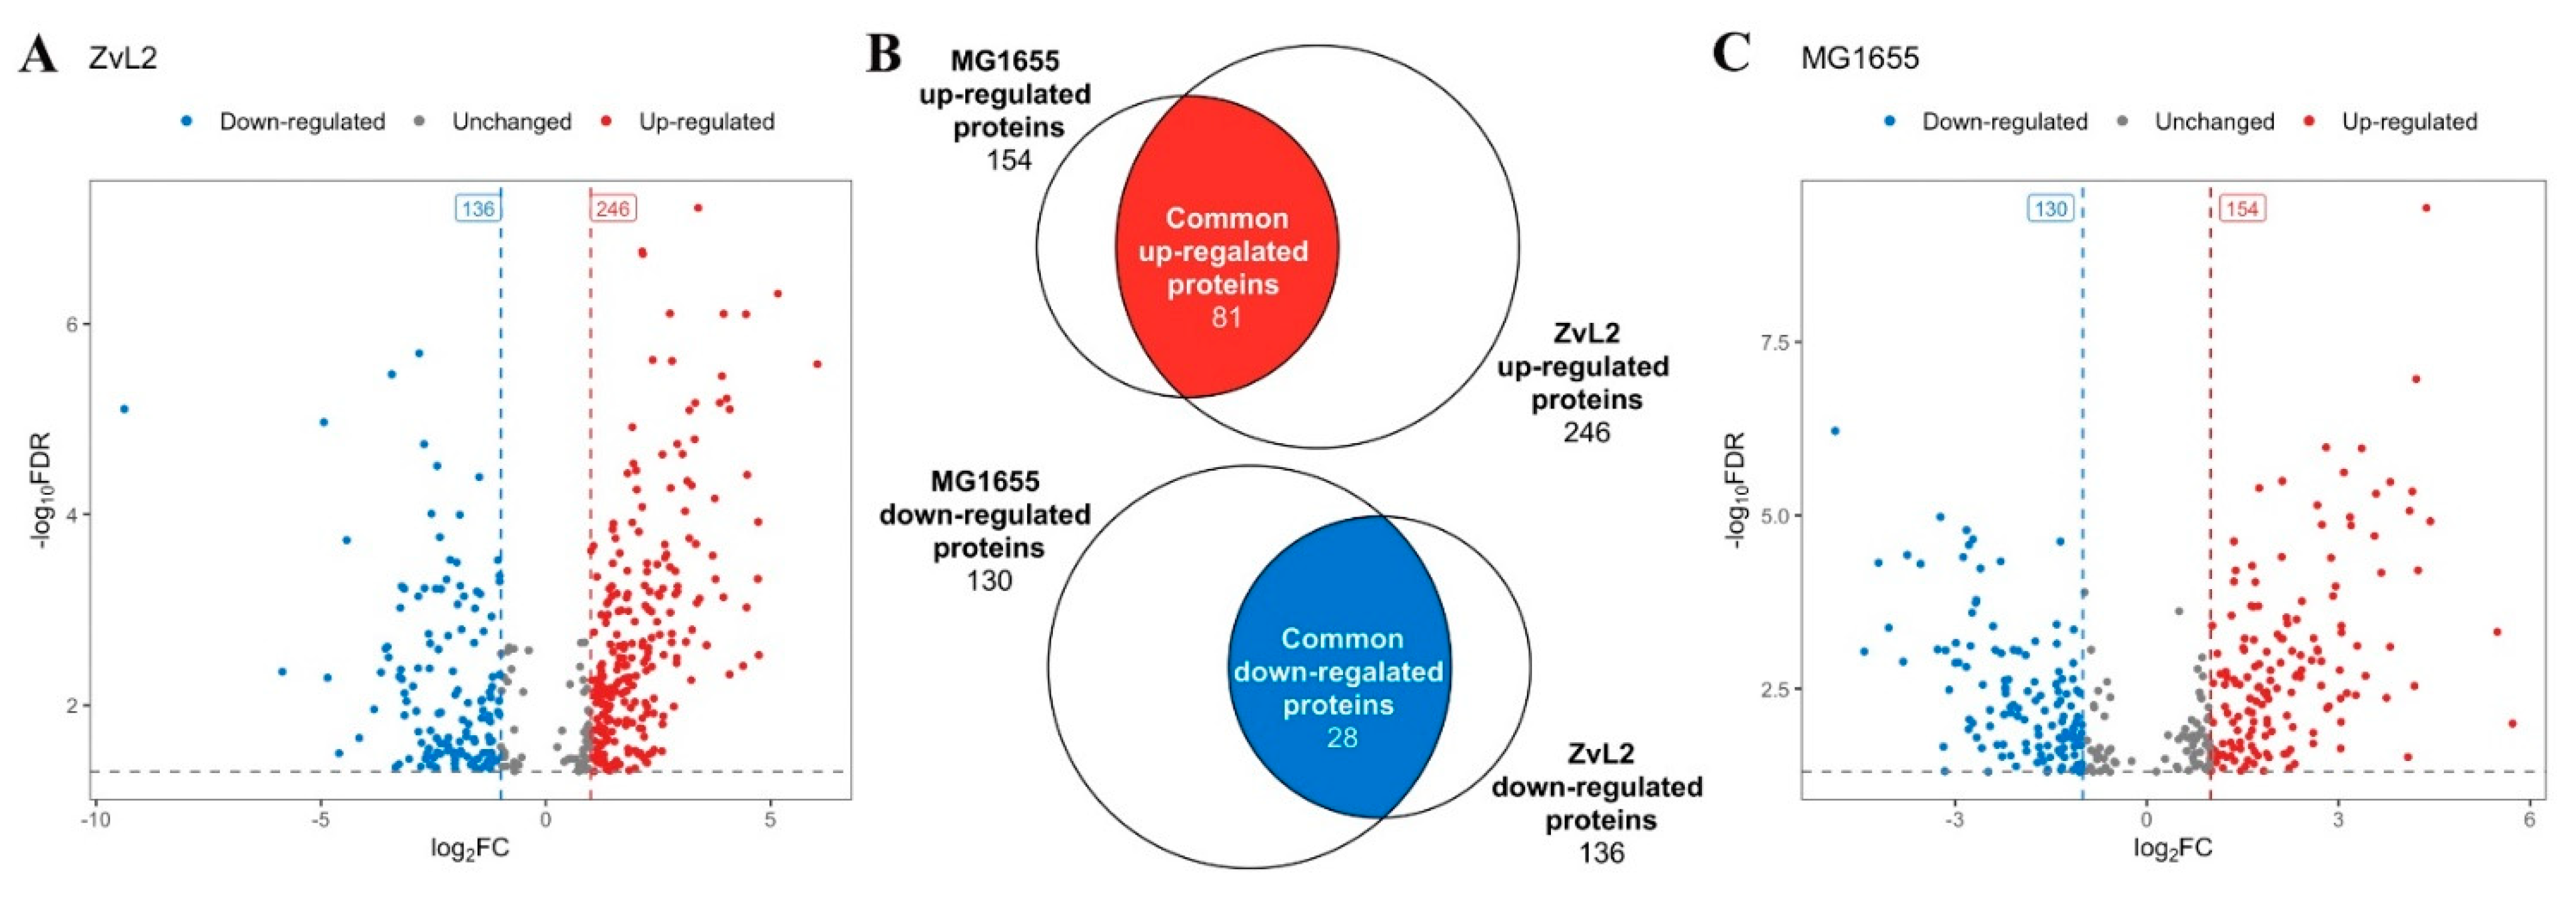
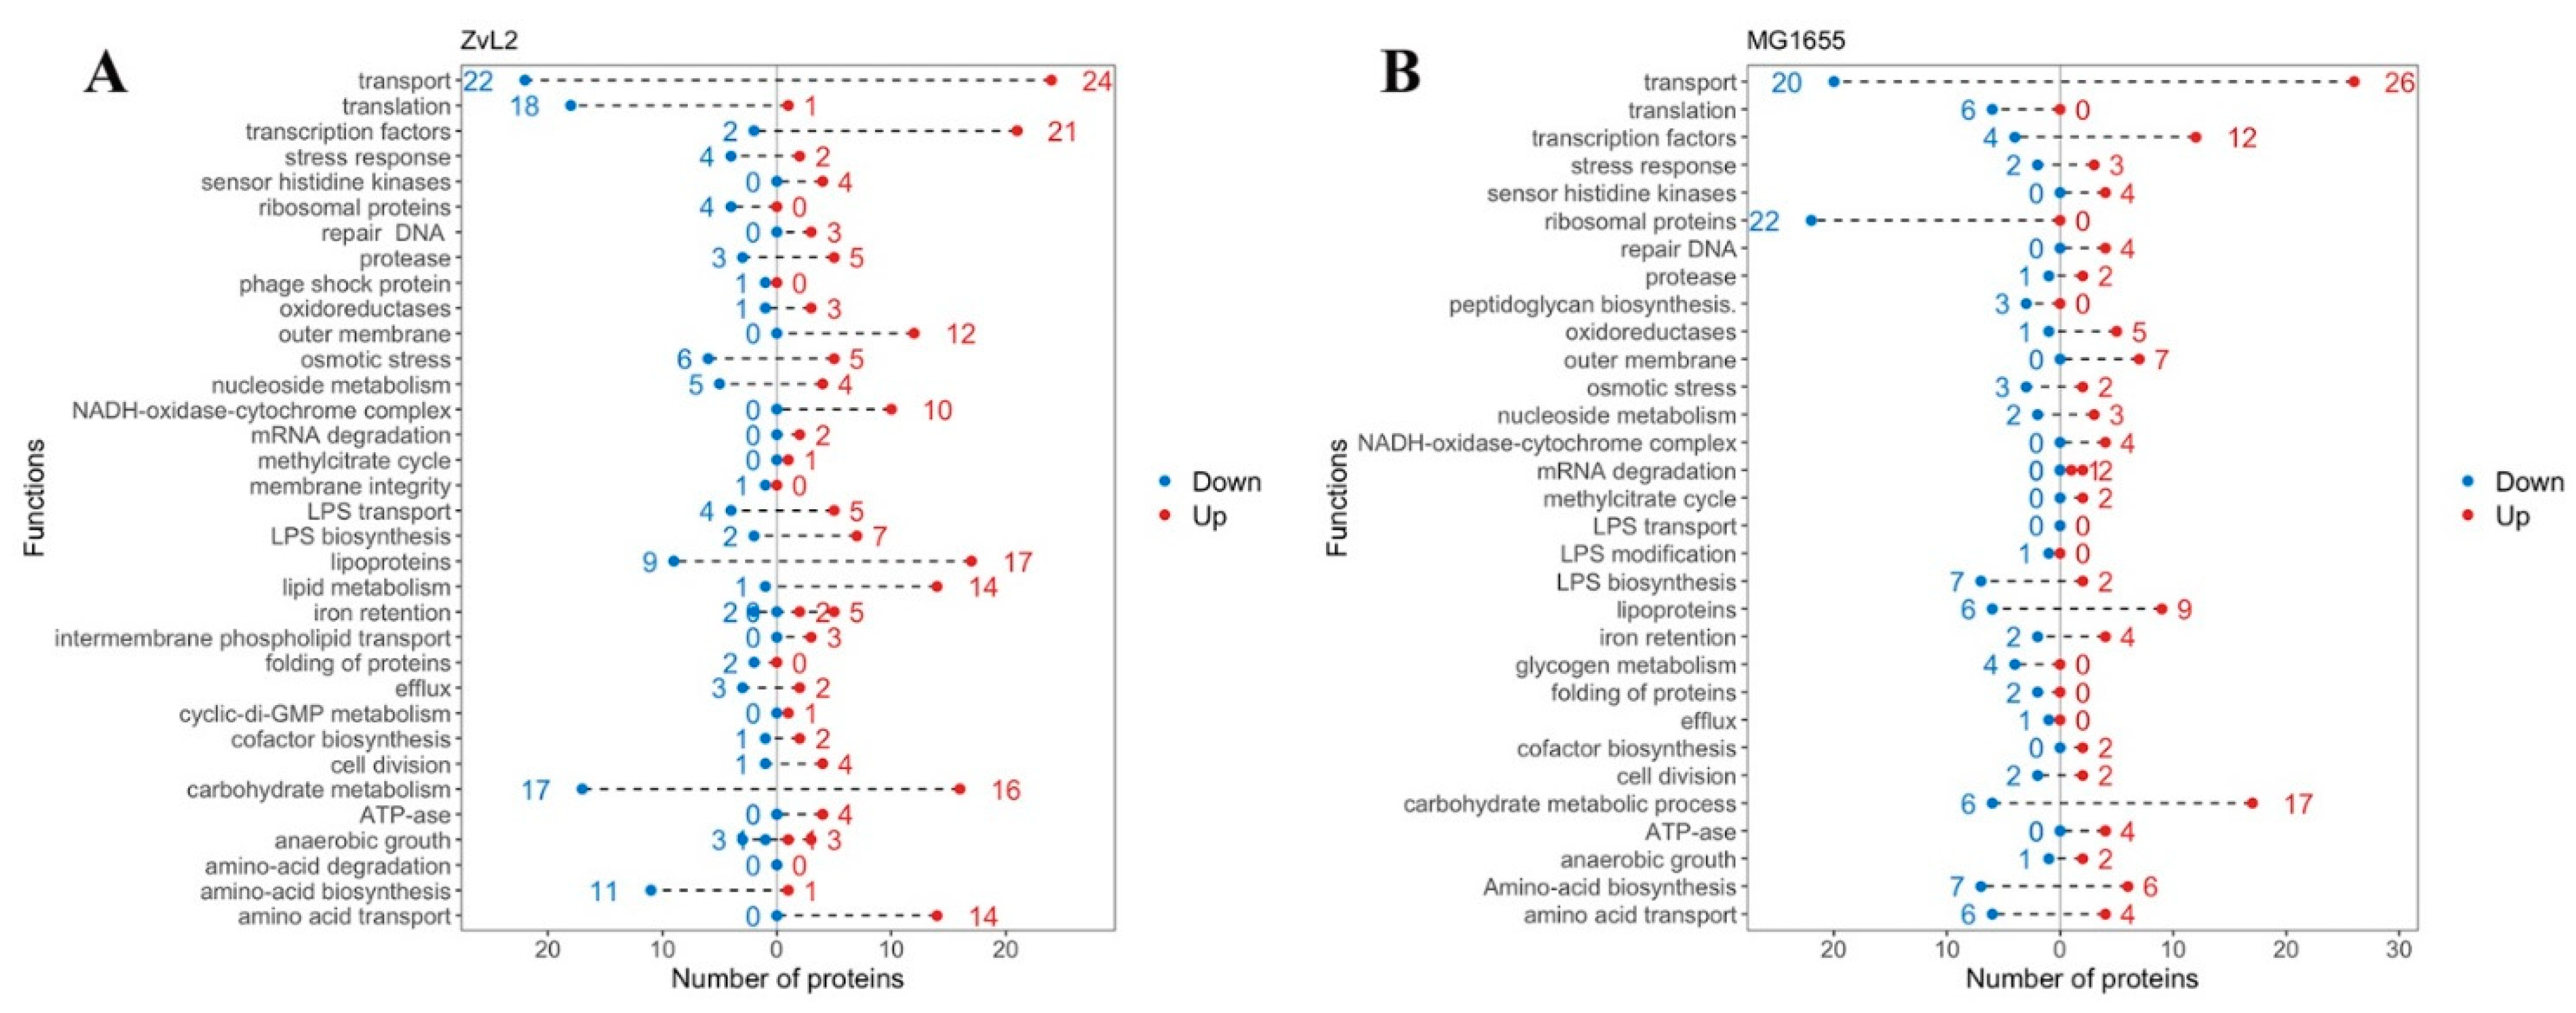
2.3.3. Shotgun LC-MC Analysis
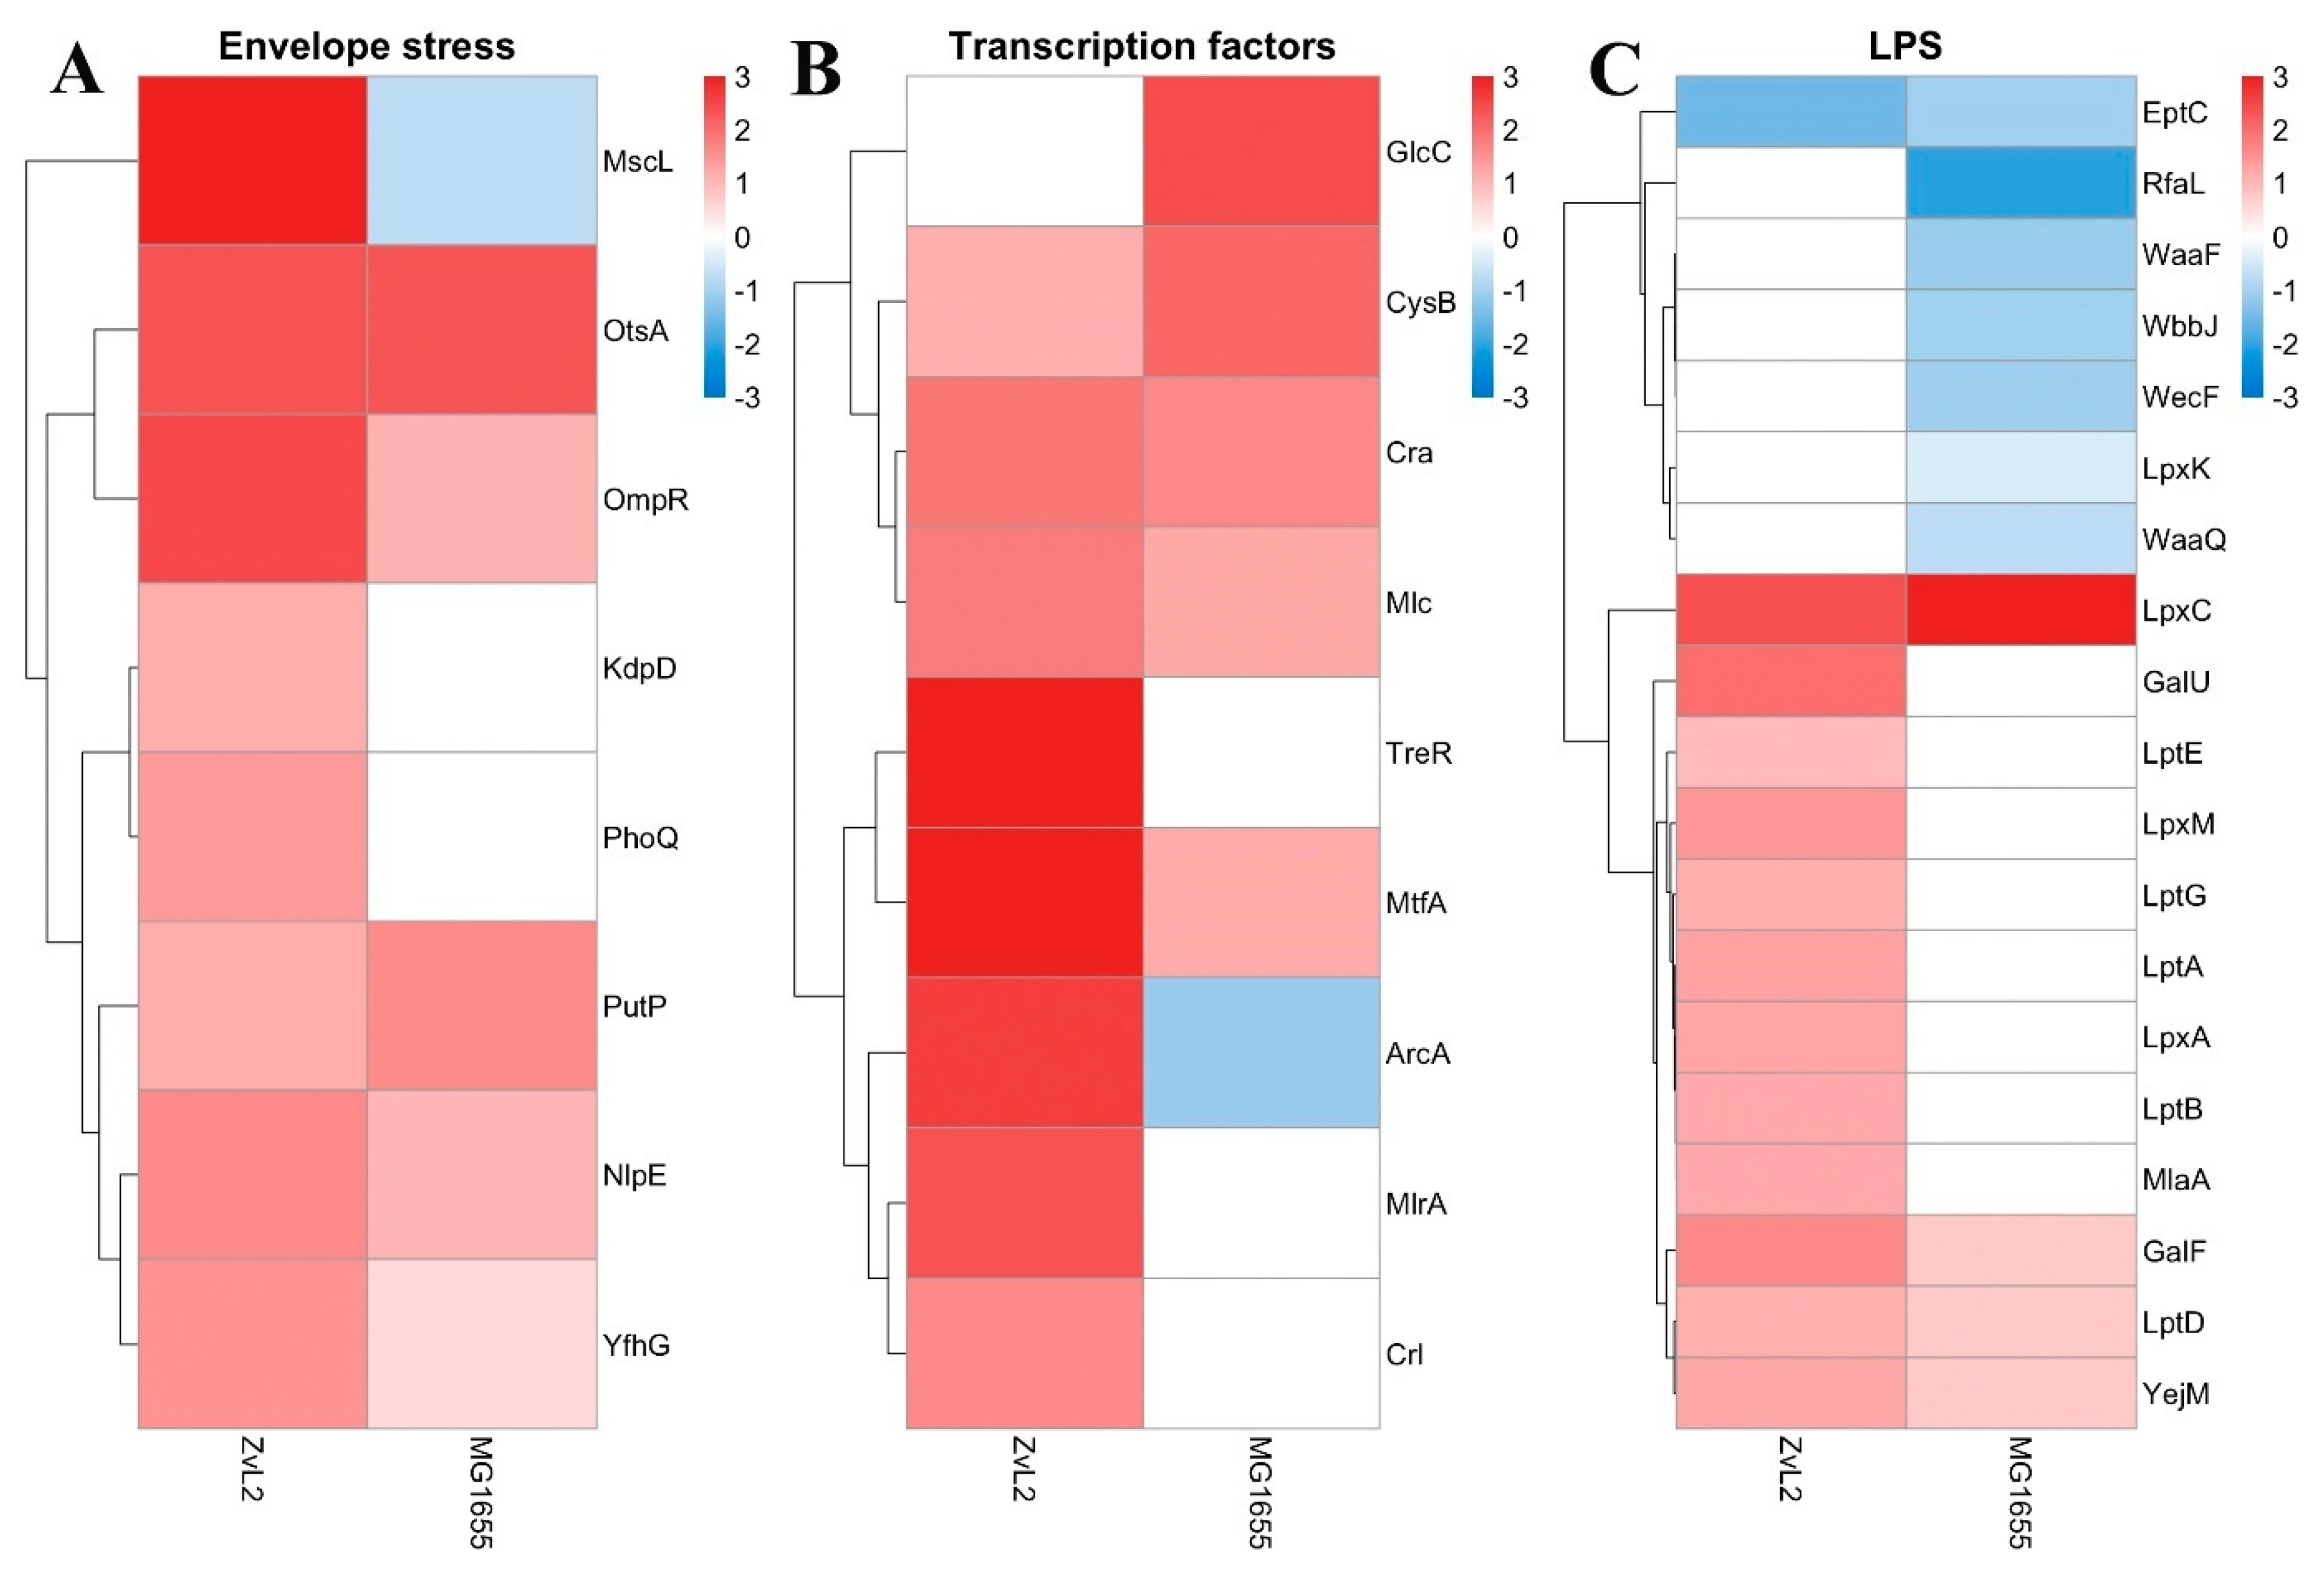
2.3.3.1. PA Upregulates Envelope Stress Proteins in Both Strains
2.3.3.2. PA-Induced Changes in Regulator Protein Abundance Differ between CD Isolate and Laboratory Strain
2.3.3.3. PA Upregulates LPS Proteins only in the CD Isolate
2.3.3.4. Outer Membrane Proteins
2.3.3.5. Transport and Iron Retention Proteins
3. Discussion
Conclusions
4. Materials and Methods
4.1. Cell Cultures
4.2. Luc-CL and Cytokines
4.3. ζ-Potential Measurement
4.4. Isolation of Membrane Fraction
4.5. 2D-DIGE
4.6. Tryptic Digestion and Protein Identification
4.7. Fluorescent Staining of Phosphorylated Proteins
4.8. Free-Gel Digestion of Protein of Membrane Fractions
4.9. LC-MS Analysis
4.10. Protein Identification, Quantification, and Comparative Proteomic Profiling
4.11. Data Processing and Statistical Analysis
Conclusions
Supplementary Materials
Author Contributions
Acknowledgments
Conflicts of Interest
References
- Boudeau, J.; Glasser, A.-L.; Masseret, E.; Joly, B.; Darfeuille-Michaud, A. Invasive Ability of an Escherichia coli Strain Isolated from the Ileal Mucosa of a Patient with Crohn’s Disease. Infect. Immun. 1999, 67, 4499–4509. [Google Scholar] [CrossRef]
- Darfeuille-Michaud, A.; Boudeau, J.; Bulois, P.; Neut, C.; Glasser, A.-L.; Barnich, N.; Bringer, M.-A.; Swidsinski, A.; Beaugerie, L.; Colombel, J.-F. High prevalence of adherent-invasive Escherichia coli associated with ileal mucosa in Crohn’s disease. Gastroenterology 2004, 127, 412–421. [Google Scholar] [CrossRef]
- Nash, J.H.; Villegas, A.; Kropinski, A.M.; Aguilar-Valenzuela, R.; Konczy, P.; Mascarenhas, M.; Ziebell, K.; Torres, A.G.; A Karmali, M.; Coombes, B.K. Genome sequence of adherent-invasive Escherichia coli and comparative genomic analysis with other E. coli pathotypes. BMC Genom. 2010, 11, 667–667. [Google Scholar] [CrossRef]
- Schippa, S.; Iebba, V.; Totino, V.; Santangelo, F.; Lepanto, M.; Alessandri, C.; Nuti, F.; Viola, F.; Di Nardo, G.; Cucchiara, S.; et al. A potential role of Escherichia coli pathobionts in the pathogenesis of pediatric inflammatory bowel disease. Can. J. Microbiol. 2012, 58, 426–432. [Google Scholar] [CrossRef]
- Conte, M.P.; Longhi, C.; Marazzato, M.; Conte, A.L.; Aleandri, M.; Lepanto, M.S.; Zagaglia, C.; Nicoletti, M.; Aloi, M.; Totino, V.; et al. Adherent-invasive Escherichia coli (AIEC) in pediatric Crohn’s disease patients: phenotypic and genetic pathogenic features. BMC Res. Notes 2014, 7, 748. [Google Scholar] [CrossRef]
- Hornef, M. Pathogens, Commensal Symbionts, and Pathobionts: Discovery and Functional Effects on the Host. ILAR J. 2015, 56, 159–162. [Google Scholar] [CrossRef]
- Camprubí-Font, C.; Martinez-Medina, M. Why the discovery of adherent-invasiveEscherichia colimolecular markers is so challenging? World J. Biol. Chem. 2020, 11, 1–13. [Google Scholar] [CrossRef] [PubMed]
- Rakitina, D.V.; Manolov, A.I.; Kanygina, A.V.; Garushyants, S.K.; Baikova, J.P.; Alexeev, D.G.; Ladygina, V.G.; Kostryukova, E.S.; Larin, A.K.; Semashko, T.A.; et al. Genome analysis of E. coli isolated from Crohn’s disease patients. BMC Genom. 2017, 18, 544. [Google Scholar] [CrossRef]
- Martinez-Medina, M.; Garcia-Gil, J.; Barnich, N.; Wieler, L.H.; Ewers, C. Adherent-Invasive Escherichia coli Phenotype Displayed by Intestinal Pathogenic E. coli Strains from Cats, Dogs, and Swine. Appl. Environ. Microbiol. 2011, 77, 5813–5817. [Google Scholar] [CrossRef]
- Camprubí-Font, C.; Ewers, C.; Lopez-Siles, M.; Martinez-Medina, M. Genetic and Phenotypic Features to Screen for Putative Adherent-Invasive Escherichia coli. Front. Microbiol. 2019, 10, 108. [Google Scholar] [CrossRef] [PubMed]
- Vazeille, E.; Chassaing, B.; Buisson, A.; Dubois, A.; de Vallée, A.; Billard, E.; Neut, C.; Bommelaer, G.; Colombel, J.-F.; Barnich, N.; et al. GipA Factor Supports Colonization of Peyerʼs Patches by Crohnʼs Disease-associated Escherichia Coli. Inflamm. Bowel Dis. 2016, 22, 68–81. [Google Scholar] [CrossRef]
- Dogan, B.; Belcher-Timme, H.F.; I Dogan, E.; Jiang, Z.-D.; DuPont, H.L.; Synder, N.; Yang, S.; Chandler, B.; Scherl, E.J.; Simpson, K.W. Evaluation of Escherichia coli pathotypes associated with Irritable Bowel Syndrome. FEMS Microbiol. Lett. 2018, 365. [Google Scholar] [CrossRef] [PubMed]
- Céspedes, S.; Saitz, W.; Del Canto, F.; De la Fuente, M.; Quera, R.; Hermoso, M.; Muñoz, R.; Ginard, D.; Khorrami, S.; Girón, J.; et al. Genetic Diversity and Virulence Determinants of Escherichia coli Strains Isolated from Patients with Crohn's Disease in Spain and Chile. Front. Microbiol. 2017, 8, 639. [Google Scholar] [CrossRef] [PubMed]
- Dogan, B.; Suzuki, H.; Herlekar, D.; Sartor, R.B.; Campbell, B.J.; Roberts, C.L.; Stewart, K.; Scherl, E.J.; Araz, Y.; Bitar, P.P.; et al. Inflammation-associated Adherent-invasive Escherichia coli Are Enriched in Pathways for Use of Propanediol and Iron and M-cell Translocation. Inflamm. Bowel Dis. 2014, 20, 1919–1932. [Google Scholar] [CrossRef] [PubMed]
- Barnich, N.; Carvalho, F.A.; Glasser, A.-L.; Darcha, C.; Jantscheff, P.; Allez, M.; Peeters, H.; Bommelaer, G.; Desreumaux, P.; Colombel, J.-F.; et al. CEACAM6 acts as a receptor for adherent-invasive E. coli, supporting ileal mucosa colonization in Crohn disease. J. Clin. Investig. 2007, 117, 1566–1574. [Google Scholar] [CrossRef]
- Rolhion, N.; Barnich, N.; Bringer, M.-A.; Glasser, A.-L.; Ranc, J.; Hébuterne, X.; Hofman, P.; Darfeuille-Michaud, A. Abnormally expressed ER stress response chaperone Gp96 in CD favours adherent-invasive Escherichia coli invasion. Gut 2010, 59, 1355–1362. [Google Scholar] [CrossRef]
- Low, D.; Tran, H.T.; Lee, I.; Dreux, N.; Kamba, A.; Reinecker, H.; Darfeuille–Michaud, A.; Barnich, N.; Mizoguchi, E. Chitin-Binding Domains of Escherichia Coli ChiA Mediate Interactions With Intestinal Epithelial Cells in Mice With Colitis. Gastroenterology 2013, 145, 602–612. [Google Scholar] [CrossRef]
- Martinez-Medina, M.; Garcia-Gil, L.J. Escherichia coli in chronic inflammatory bowel diseases: An update on adherent invasive Escherichia coli pathogenicity. World J. Gastrointest. Pathophysiol. 2014, 5, 213. [Google Scholar] [CrossRef]
- Barnich, N.; Boudeau, J.; Claret, L.; Darfeuille-Michaud, A. Regulatory and functional co-operation of flagella and type 1 pili in adhesive and invasive abilities of AIEC strain LF82 isolated from a patient with Crohn's disease. Mol. Microbiol. 2003, 48, 781–794. [Google Scholar] [CrossRef]
- Carvalho, F.A.; Barnich, N.; Sauvanet, P.; Darcha, C.; Gelot, A.; Darfeuille-Michaud, A. Crohnʼs disease-associated Escherichia coli LF82 aggravates colitis in injured mouse colon via signaling by flagellin. Inflamm. Bowel Dis. 2008, 14, 1051–1060. [Google Scholar] [CrossRef]
- Pobeguts, O.V.; Ladygina, V.G.; Evsyutina, D.V.; Eremeev, A.V.; Zubov, A.I.; Matyushkina, D.S.; Scherbakov, P.L.; Rakitina, D.V.; Fisunov, G.Y. Propionate Induces Virulent Properties of Crohn’s Disease-Associated Escherichia coli. Front. Microbiol. 2020, 11, 1460. [Google Scholar] [CrossRef] [PubMed]
- Cieza, R.J.; Hu, J.; Ross, B.N.; Sbrana, E.; Torres, A.G. The IbeA Invasin of Adherent-Invasive Escherichia coli Mediates Interaction with Intestinal Epithelia and Macrophages. Infect. Immun. 2015, 83, 1904–1918. [Google Scholar] [CrossRef]
- Stecher, B. The Roles of Inflammation, Nutrient Availability and the Commensal Microbiota in Enteric Pathogen Infection. Microbiol. Spectr. 2015, 3, 1–17. [Google Scholar] [CrossRef] [PubMed]
- Staib, L.; Fuchs, T.M. From food to cell: nutrient exploitation strategies of enteropathogens. Microbiology 2014, 160, 1020–1039. [Google Scholar] [CrossRef]
- Ferreyra, J.A.; Ng, K.M.; Sonnenburg, J.L. The Enteric Two-Step: nutritional strategies of bacterial pathogens within the gut. Cell. Microbiol. 2014, 16, 993–1003. [Google Scholar] [CrossRef]
- Ormsby, M.J.; Logan, M.; Johnson, S.A.; McIntosh, A.; Fallata, G.; Papadopoulou, R.; Papachristou, E.; Hold, G.L.; Hansen, R.; Ijaz, U.Z.; et al. Inflammation associated ethanolamine facilitates infection by Crohn's disease-linked adherent-invasive Escherichia coli. EBioMedicine 2019, 43, 325–332. [Google Scholar] [CrossRef]
- Therrien, A.; Chapuy, L.; Bsat, M.; Rubio, M.; Bernard, G.; Arslanian, E.; Orlicka, K.; Weber, A.; Panzini, B.; Dorais, J.; et al. Recruitment of activated neutrophils correlates with disease severity in adult Crohn’s disease. Clin. Exp. Immunol. 2018, 195, 251–264. [Google Scholar] [CrossRef]
- Kuroki, M., Abe H., Imakiirei T., Liao S., Uchida H., Yamauchi Y., Oikawa S., Kuroki M. Identification and comparison of residues critical for cell-adhesion activities of two neutrophil CD66 antigens, CEACAM6 and CEACAM8. J Leukoc Biol. 2001; 70(4):543-50.
- Hoffmann, J.J. Neutrophil CD64: a diagnostic marker for infection and sepsis. cclm 2009, 47, 903–16. [Google Scholar] [CrossRef] [PubMed]
- Yang, J.-N.; Wang, C.; Guo, C.; Peng, X.-X.; Li, H. Outer membrane proteome and its regulation networks in response to glucose concentration changes in Escherichia coli. Mol. Biosyst. 2011, 7, 3087–3093. [Google Scholar] [CrossRef]
- Hirakawa, H.; Suzue, K.; Takita, A.; Kamitani, W.; Tomita, H. Roles of OmpX, an Outer Membrane Protein, on Virulence and Flagellar Expression in Uropathogenic Escherichia coli. Infect. Immun. 2021, 89. [Google Scholar] [CrossRef]
- van Teeffelen, S.; Wang, S.; Furchtgott, L.; Huang, K.C.; Wingreen, N.S.; Shaevitz, J.W.; Gitai, Z. The bacterial actin MreB rotates, and rotation depends on cell-wall assembly. Proc. Natl. Acad. Sci. 2011, 108, 15822–15827. [Google Scholar] [CrossRef] [PubMed]
- Harvey, K.L.; Jarocki, V.M.; Charles, I.G.; Djordjevic, S.P. The Diverse Functional Roles of Elongation Factor Tu (EF-Tu) in Microbial Pathogenesis. Front. Microbiol. 2019, 10, 2351. [Google Scholar] [CrossRef] [PubMed]
- Mikhalchik, E.; Balabushevich, N.; Vakhrusheva, T.; Sokolov, A.; Baykova, J.; Rakitina, D.; Scherbakov, P.; Gusev, S.; Gusev, A.; Kharaeva, Z.; et al. Mucin adsorbed by E. coli can affect neutrophil activation in vitro. FEBS Open Bio 2020, 10, 180–196. [Google Scholar] [CrossRef] [PubMed]
- Butland, G.; Peregrin-Alvarez, J.M.; Li, J.; Yang, W.; Yang, X.; Canadien, V. Interaction network containing conserved and essential protein complexes in Escherichia coli. Nature 2005, 433, 531–537. [Google Scholar] [CrossRef] [PubMed]
- Soufo, H.J.D.; Reimold, C.; Breddermann, H.; Mannherz, H.G.; Graumann, P.L. Translation Elongation Factor EF-Tu Modulates Filament Formation of Actin-Like MreB Protein In Vitro. J. Mol. Biol. 2015, 427, 1715–1727. [Google Scholar] [CrossRef]
- Haslbeck, M.; Vierling, E. A First Line of Stress Defense: Small Heat Shock Proteins and Their Function in Protein Homeostasis. J. Mol. Biol. 2015, 427, 1537–1548. [Google Scholar] [CrossRef]
- Santos, T.M.A.; Lin, T.; Rajendran, M.; Anderson, S.M.; Weibel, D.B. Polar localization of Escherichia coli chemoreceptors requires an intact Tol–Pal complex. Mol. Microbiol. 2014, 92, 985–1004. [Google Scholar] [CrossRef]
- Raetz, C.R., Purcell S., Meyer M.V., Qureshi N., Takayama K. Isolation and characterization of eight A precursors from a 3-deoxy-D-manno-octylosonic acis-deficient mutant of Salmonella typhimurium. J Biol Chem. 1985; 260 (30):16080-8.
- Lai, E.; Nair, U.; Phadke, N.D.; Maddock, J.R. Proteomic screening and identification of differentially distributed membrane proteins in Escherichia coli. Mol. Microbiol. 2004, 52, 1029–1044. [Google Scholar] [CrossRef]
- Liao, C.; Liang, X.; Yang, F.; Soupir, M.L.; Howe, A.C.; Thompson, M.L.; Jarboe, L.R. Allelic Variation in Outer Membrane Protein A and Its Influence on Attachment of Escherichia coli to Corn Stover. Front. Microbiol. 2017, 8, 708. [Google Scholar] [CrossRef]
- Zakharian, E.; Reusch, R.N. Kinetics of Folding ofEscherichia coliOmpA from Narrow to Large Pore Conformation in a Planar Bilayer. Biochemistry 2005, 44, 6701–6707. [Google Scholar] [CrossRef]
- Gophna, U.; Ideses, D.; Rosen, R.; Grundland, A.; Ron, E.Z. OmpA of a septicemic Escherichia coli O78 – secretion and convergent evolution. Int. J. Med Microbiol. 2004, 294, 373–381. [Google Scholar] [CrossRef] [PubMed]
- Alphen, W.V.; Lugtenberg, B. Influence of osmolarity of the growth medium on the outer membrane protein pattern of Escherichia coli. J. Bacteriol. 1977, 131, 623–630. [Google Scholar] [CrossRef] [PubMed]
- Shin, S.; Park, C. Modulation of flagellar expression in Escherichia coli by acetyl phosphate and the osmoregulator OmpR. J. Bacteriol. 1995, 177, 4696–4702. [Google Scholar] [CrossRef]
- Gerstel, U.; Park, C.; Römling, U. Complex regulation of csgD promoter activity by global regulatory proteins. Mol. Microbiol. 2003, 49, 639–654. [Google Scholar] [CrossRef]
- Prigent-Combaret, C.; Brombacher, E.; Vidal, O.; Ambert, A.; Lejeune, P.; Landini, P.; Dorel, C. Complex Regulatory Network Controls Initial Adhesion and Biofilm Formation in Escherichia coli via Regulation of the csgD Gene. J. Bacteriol. 2001, 183, 7213–7223. [Google Scholar] [CrossRef] [PubMed]
- Vidal, O.; Longin, R.; Prigent-Combaret, C.; Dorel, C.; Hooreman, M.; Lejeune, P. Isolation of an Escherichia coli K-12 Mutant Strain Able To Form Biofilms on Inert Surfaces: Involvement of a New ompR Allele That Increases Curli Expression. J. Bacteriol. 1998, 180, 2442–9. [Google Scholar] [CrossRef]
- Cho, T.H.C.; Wang, J.; Tracy LRaivio, T.L. NlpE is an OmpA-associated outer membrane sensor of the Cpx 11 envelope stress response. bioRxiv 2023. [Google Scholar] [CrossRef]
- Shimizu, T.; Ichimura, K.; Noda, M. The Surface Sensor NlpE of Enterohemorrhagic Escherichia coli Contributes to Regulation of the Type III Secretion System and Flagella by the Cpx Response to Adhesion. Infect. Immun. 2016, 84, 537–549. [Google Scholar] [CrossRef] [PubMed]
- Dalebroux, Z.D.; Edrozo, M.B.; Pfuetzner, R.A.; Ressl, S.; Kulasekara, B.R.; Blanc, M.-P.; Miller, S.I. Delivery of Cardiolipins to the Salmonella Outer Membrane Is Necessary for Survival within Host Tissues and Virulence. Cell Host Microbe 2015, 17, 441–451. [Google Scholar] [CrossRef]
- Haraga, A.; Ohlson, M.B.; Miller, S.I. Salmonellae interplay with host cells. Nat. Rev. Microbiol. 2008, 6, 53–66. [Google Scholar] [CrossRef]
- Stout, V. Regulation of capsule synthesis includes interactions of the RcsC/RcsB regulatory pair. Res. Microbiol. 1994, 145, 389–392. [Google Scholar] [CrossRef] [PubMed]
- Castanié-Cornet, M.-P.; Cam, K.; Jacq, A. RcsF Is an Outer Membrane Lipoprotein Involved in the RcsCDB Phosphorelay Signaling Pathway in Escherichia coli. J. Bacteriol. 2006, 188, 4264–4270. [Google Scholar] [CrossRef] [PubMed]
- Nyström, T.; Larsson, C.; Gustafsson, L. Bacterial defense against aging: role of the Escherichia coli ArcA regulator in gene expression, readjusted energy flux and survival during stasis. EMBO J. 1996, 15, 3219–3228. [Google Scholar] [CrossRef] [PubMed]
- Liu, X.; De Wulf, P. Probing the ArcA-P Modulon of Escherichia coli by Whole Genome Transcriptional Analysis and Sequence Recognition Profiling. J. Biol. Chem. 2004, 279, 12588–12597. [Google Scholar] [CrossRef] [PubMed]
- Loui, C.; Chang, A.C.; Lu, S. Role of the ArcAB two-component system in the resistance of Escherichia colito reactive oxygen stress. BMC Microbiol. 2009, 9, 183–183. [Google Scholar] [CrossRef] [PubMed]
- Valvano, M.A. Remodelling of the Gram-negative bacterial Kdo2-lipid A and its functional implications. Microbiology 2022, 168, 001159. [Google Scholar] [CrossRef]
- Panda, G.; Dash, S.; Sahu, S.K. Harnessing the Role of Bacterial Plasma Membrane Modifications for the Development of Sustainable Membranotropic Phytotherapeutics. Membranes 2022, 12, 914. [Google Scholar] [CrossRef]
- Kang, K.N.; Klein, D.R.; Kazi, M.I.; Guérin, F.; Cattoir, V.; Brodbelt, J.S.; Boll, J.M. Colistin heteroresistance in Enterobacter cloacae is regulated by PhoPQ-dependent 4-amino-4-deoxy-l-arabinose addition to lipid A. Mol. Microbiol. 2019, 111, 1604–1616. [Google Scholar] [CrossRef]
- MacRae, M.R.; Puvanendran, D.; Haase, M.A.; Coudray, N.; Kolich, L.; Lam, C.; Baek, M.; Bhabha, G.; Ekiert, D.C. Protein–protein interactions in the Mla lipid transport system probed by computational structure prediction and deep mutational scanning. J. Biol. Chem. 2023, 299, 104744. [Google Scholar] [CrossRef]
- De Lay, N.R.; E Cronan, J. Genetic Interaction Between theEscherichia coliAcpT Phosphopantetheinyl Transferase and the YejM Inner Membrane Protein. Genetics 2008, 178, 1327–1337. [Google Scholar] [CrossRef]
- Chervy, M.; Barnich, N.; Denizot, J. Adherent-Invasive E. coli: Update on the Lifestyle of a Troublemaker in Crohn’s Disease. Int. J. Mol. Sci. 2020, 21, 3734. [Google Scholar] [CrossRef] [PubMed]
- Cho, S.-H.; Dekoninck, K.; Collet, J.-F. Envelope-Stress Sensing Mechanism of Rcs and Cpx Signaling Pathways in Gram-Negative Bacteria. J. Microbiol. 2023, 61, 317–329. [Google Scholar] [CrossRef]
- Lach, S.R.; Kumar, S.; Kim, S.; Im, W.; Konovalova, A. Conformational rearrangements in the sensory RcsF/OMP complex mediate signal transduction across the bacterial cell envelope. PLOS Genet. 2023, 19, e1010601. [Google Scholar] [CrossRef]
- Francez-Charlot, A.; Laugel, B.; Van Gemert, A.; Dubarry, N.; Wiorowski, F.; Castanié-Cornet, M.; Gutierrez, C.; Cam, K. RcsCDB His-Asp phosphorelay system negatively regulates the flhDC operon in Escherichia coli. Mol. Microbiol. 2003, 49, 823–832. [Google Scholar] [CrossRef] [PubMed]
- Dalebroux, Z.D.; I Miller, S. Salmonellae PhoPQ regulation of the outer membrane to resist innate immunity. Curr. Opin. Microbiol. 2014, 17, 106–113. [Google Scholar] [CrossRef]
- Dalebroux, Z.D.; Matamouros, S.; Whittington, D.; Bishop, R.E.; Miller, S.I. PhoPQ regulates acidic glycerophospholipid content of the Salmonella Typhimurium outer membrane. Proc. Natl. Acad. Sci. 2014, 111, 1963–1968. [Google Scholar] [CrossRef]
- Nyström, T.; Larsson, C.; Gustafsson, L. Bacterial defense against aging: role of the Escherichia coli ArcA regulator in gene expression, readjusted energy flux and survival during stasis. EMBO J. 1996, 15, 3219–3228. [Google Scholar] [CrossRef]
- Raetz, C.R.H.; Whitfield, C. Lipopolysaccharide Endotoxins. Annu. Rev. Biochem. 2002, 71, 635–700. [Google Scholar] [CrossRef]
- Dolan, S.K.; Wijaya, A.; Geddis, S.M.; Spring, D.R.; Silva-Rocha, R.; Welch, M. Loving the poison: the methylcitrate cycle and bacterial pathogenesis. Microbiology 2018, 164, 251–259. [Google Scholar] [CrossRef]
- Wang, Y. The Function of OmpA in Escherichia coli. Biochem. Biophys. Res. Commun. 2002, 292, 396–401. [Google Scholar] [CrossRef]
- Prasadarao, N.V.; Blom, A.M.; Villoutreix, B.O.; Linsangan, L.C. A Novel Interaction of Outer Membrane Protein A with C4b Binding Protein Mediates Serum Resistance of Escherichia coli K1. J. Immunol. 2002, 169, 6352–6360. [Google Scholar] [CrossRef] [PubMed]
- Sukumaran, S.K.; Selvaraj, S.K.; Prasadarao, N.V. Inhibition of Apoptosis byEscherichia coliK1 Is Accompanied by Increased Expression of BclXLand Blockade of Mitochondrial CytochromecRelease in Macrophages. Infect. Immun. 2004, 72, 6012–6022. [Google Scholar] [CrossRef] [PubMed]
- Orme, R.; Douglas, C.W.I.; Rimmer, S.; Webb, M. Proteomic analysis ofEscherichia coli biofilms reveals the overexpression of the outer membrane protein OmpA. Proteomics 2006, 6, 4269–4277. [Google Scholar] [CrossRef] [PubMed]
- Gophna, U.; Ideses, D.; Rosen, R.; Grundland, A.; Ron, E.Z. OmpA of a septicemic Escherichia coli O78 – secretion and convergent evolution. Int. J. Med Microbiol. 2004, 294, 373–381. [Google Scholar] [CrossRef] [PubMed]
- Hellman, J.; Loiselle, P.M.; Tehan, M.M.; Allaire, J.E.; Boyle, L.A.; Kurnick, J.T.; Andrews, D.M.; Kim, K.S.; Warren, H.S. Outer Membrane Protein A, Peptidoglycan-Associated Lipoprotein, and Murein Lipoprotein Are Released byEscherichia coliBacteria into Serum. Infect. Immun. 2000, 68, 2566–2572. [Google Scholar] [CrossRef] [PubMed]
- Sultan, A.; Jers, C.; Ganief, T.A.; Shi, L.; Senissar, M.; Køhler, J.B.; Macek, B.; Mijakovic, I. Phosphoproteome Study of Escherichia coli Devoid of Ser/Thr Kinase YeaG During the Metabolic Shift From Glucose to Malate. Front. Microbiol. 2021, 12. [Google Scholar] [CrossRef]
- Tang, H., Zhan Z., Zhang Y., Huang X. Propionylation of lysine, a new mechanism of short-chain fatty acids affecting bacterial virulence. Am J Transl Res. 2022; 14(8):5773-5784. eCollection 2022.
- Shevchenko, A.; Wilm, M.; Vorm, O.; Mann, M. Mass Spectrometric Sequencing of Proteins from Silver-Stained Polyacrylamide Gels. Anal. Chem. 1996, 68, 850–858. [Google Scholar] [CrossRef]
Disclaimer/Publisher’s Note: The statements, opinions and data contained in all publications are solely those of the individual author(s) and contributor(s) and not of MDPI and/or the editor(s). MDPI and/or the editor(s) disclaim responsibility for any injury to people or property resulting from any ideas, methods, instructions or products referred to in the content. |
© 2024 by the authors. Licensee MDPI, Basel, Switzerland. This article is an open access article distributed under the terms and conditions of the Creative Commons Attribution (CC BY) license (http://creativecommons.org/licenses/by/4.0/).


