Submitted:
14 August 2024
Posted:
14 August 2024
You are already at the latest version
Abstract
Keywords:
1. Introduction
2. Methods
2.1. Calibration Schemes
2.1.1. Evolution Algorithms
2.2.2. Optional Evaluator
2.2. Composited Metrics
2.3. Performance Evaluation
2.3.1. Parameter
2.3.2. Objective
2.3.3. Simulation
3. Experiments
3.1. Model and Data
3.2. Experimental Description
4. Results
4.1. Case Perspective
4.1.1. Model Configure
4.1.2. Forecast Problem
4.2. Effects on Calibration
4.2.1. Optimal Parameters
4.2.2. Effectiveness and Efficiency
4.2.3. Optimal Simulation
4.3. Effects on Forecast
4.3.1. Linear and Gaussian Fitting
4.3.2. Spatial Difference and Similarity
4.3.3. Surface States Intercomparison
4.4. Configure and Benefit
5. Discussion
6. Conclusions
Supplementary Materials
Author Contributions
Funding
Institutional Review Board Statement
Informed Consent Statement
Acknowledgments
Conflicts of Interest
References
- Min, J.; Guo, Y.; Wang, G. Impacts of Soil Moisture on Typical Frontal Rainstorm in Yangtze River Basin. Atmo., 2016, 7. [CrossRef]
- Li, K.; Zhang, J.; Wu, L.; Yang, K.; Li, S. The role of soil temperature feedbacks for summer air temperature variability under climate change over East Asia. Earth's Future, 2022, 10, e2021EF002377.
- García-García, A.; Cuesta-Valero, F.J.; Miralles, D.G.; Mahecha, M.D.; Quaas, J.; Reichstein, M.; Zscheischler, J.; Peng, J. Soil heat extremes can outpace air temperature extremes. Nat. Clim. Chang., 2023, 13,1237–1241.
- Guo, Y.; Shao, C.; Su, A. Investigation of Land-Atmosphere Coupling during the Extreme Rainstorm of 20 July 2021 over Central East China. Atmos., 2023, 14. [CrossRef]
- Gao, Y.; Li, K.; Chen, F.; Jiang, Y.; Lu, C. Assessing and improving Noah-MP land model simulations for the central Tibetan Plateau. Journal of Geophysical Research: Atmospheres 2015, 120, 9258-9278. [CrossRef]
- Li, C.; Lu, H.; Yang, K.; Han, M.; Wright, J.; Chen, Y.; Yu, L.; Xu, S.; Huang, X.; Gong, W. The Evaluation of SMAP Enhanced Soil Moisture Products Using High-Resolution Model Simulations and In-Situ Observations on the Tibetan Plateau. Remote Sensing 2018, 10. [CrossRef]
- Chen, Y.; Yang, K.; He, J.; Qin, J.; Shi, J.; Du, J.; He, Q. Improving land surface temperature modeling for dry land of China. J. Geophys. Res. Atmos., 2011, 116(D20104).
- He, Q.; Lu, H.; Yang, K.; Zhao, L.; Zou, M. Improving Land Surface Temperature Simulation of NOAH-MP on the Tibetan Plateau. In Proceedings of the 2021 IEEE International Geoscience and Remote Sensing Symposium IGARSS, 2021; pp. 6217-6220.
- Guo, Y.; Yuan, B.; Su, A.; Shao, C.; Gao, Y. Calibration for Improving the Medium-Range Soil Temperature Forecast of a Semiarid Region over Tibet: A Case Study. Atmos., 2024, 15. [CrossRef]
- Gupta, H.V.; Kling, H.; Yilmaz, K.K.; Martinez, G.F. Decomposition of the mean squared error and NSE performance criteria,Implications for improving hydrological modelling. J. Hydro., 2009, 377(1-2), 80-91.
- Kumar, S.; Kolassa, J.; Reichle, R.; Crow, W.; Lannoy, G.; Rosnay, P.; MacBean, N.; Girotto, M.; Fox, A.; Quaife, T. et al. An agenda for land data assimilation priorities, Realizing the promise of terrestrial water, energy,and vegetation observations from space. J. Adv. Model Earth Sys., 2022, 14, c2022MS003259.
- Ma, Y.M.; Yao, T.D.; Zhong, L.; Wang, B.B.; Xu, X.D.; Hu, Z.Y.; Ma, W.Q.; Sun, F.L.; Han, C.B.; Li, M.S.; et al. Comprehensive study of energy and water exchange over the Tibetan Plateau: A review and perspective: From GAME/Tibet and CAMP/Tibet to TORP, TPEORP, and TPEITORP. Earth-Sci. Rev. 2023, 237, 104312.
- Clerc, M.K., J.. The particle swarm - explosion, stability, and convergence in a multidimensional complex space. IEEE Transactions on Evolutionary Computation 2002, 6, 58-73. [CrossRef]
- Kennedy, J. Bare bones particle swarms. In Proceedings of the Proceedings of the 2003 IEEE Swarm Intelligence Symposium. SIS'03 (Cat. No.03EX706), Indianapolis, IN, USA, 2003; pp. 80-87.
- Shami, T.M.; El-Saleh, A.A.; Alswaitti, M.; Al-Tashi, Q.; Summakieh, M.A.; Mirjalili, S. Particle Swarm Optimization: A Comprehensive Survey. IEEE Access 2022, 10, 10031-10061. [CrossRef]
- Ketabchi, H.; Ataie-Ashtiani, B. Evolutionary algorithms for the optimal management of coastal groundwater: A comparative study toward future challenges. Journal of Hydrology 2015, 520, 193-213. [CrossRef]
- Deng, Y.; Yang, Q.; Zuo, H.; Li, W. Land Surface Model and Particle Swarm Optimization Algorithm Based on the Model-Optimization Method for Improving Soil Moisture Simulation in a Semi-Arid Region. Plos One 2016, 11. [CrossRef]
- Yang, Q.; Ling, C.; Du, B.; Wang, L.; Yang Y. Application of the particle swarm optimization in the land surface model parameters calibration. Plateau Meteorology 2017, 36(4), 1060-1071. (In Chinese). [CrossRef]
- Duan, Q.; S., Soroosh; Gupta, Vuai. Effective and Efcient Global Optimizationfor Conceptual Rainfall-Runoff Models. Water Resources Research 1992, 28, 1015-1031.
- Duan, Q.S., Soroosh; Gupta, Vuai. Optimal use of the SCE-UA global optimization method forcalibrating watershed models. Journal of Hydrology 1994, 158, 265-284.
- Jeon, J.-H.; Park, C.-G.; Engel, B. Comparison of Performance between Genetic Algorithm and SCE-UA for Calibration of SCS-CN Surface Runoff Simulation. Water 2014, 6, 3433-3456. [CrossRef]
- Naeini, M.A., B. ; Gupta, H.V; Duan, Q.; Sorooshiana, S. Three decades of the Shufed Complex Evolution(SCE-UA)optimization algorithm: Review andapplications. Scientia lranica, Transaclions A: Civil Engineering 2019, 26, 2015-2031. [CrossRef]
- Liu, Y.Q.; Gupta, H.V.; Sorooshian, S.; , L.A.; Shuttleworth, W.J. Exploring parameter sensitivities of the land surface using a locally coupled land-atmosphere model. J Geophys Res-Atmos 2004, 109, doi:Artn D2110110.1029/2004jd004730. [CrossRef]
- Bastidas, L.A.; Hogue, T.S.; Sorooshian, S.; Gupta, H.V.; Shuttleworth, W.J. Parameter sensitivity analysis for different complexity land surface models using multicriteria methods. J Geophys Res-Atmos 2006, 111, doi:Artn D2010110.1029/2005jd006377. [CrossRef]
- Peng, F.; Sun, G.D. Identifying Sensitive Model Parameter Combinations for Uncertainties in Land Surface Process Simulations over the Tibetan Plateau. Water 2019, 11, doi:ARTN 172410.3390/w11081724. [CrossRef]
- Gudmundsson, L.; Cuntz, M. Soil Parameter Model Intercomparison Project (SP-MIP): Assessing theinfluence of soil parameters on the variability of Land Surface Models; GEWEX–SoilWat workshop, Leipzig, German, 28–30 June 2016; pp. 1–6. Available online: https://www.gewexevents.org/wp-content/uploads/GLASS2017_SP-MIP_Protocol.pdf (accessed on 30 April 2024).
- Chaney, N.W.; Herman, J.D.; Ek, M.B.; Wood, E.F. Deriving global parameter estimates for the Noah land surface model using FLUXNET and machine learning. J. Geophys. Res. Atmos. 2016, 121, 13218–13235.
- Zeng, Y.; Anne, V.; Or, D.; Cuntz, M.; Gudmundsson, L.; Weihermueller, L.; Kollet, S.; Vanderborght, J.; Vereecken, H. GEWEX-ISMC SoilWat Project:Taking Stock and Looking Ahead; GEWEX GLASS meeting, USA, 23-25 November, 2020; GEWEX QUARTERLY II 2021, 31(2), 4-9; pp. 4–9. Available online: https://gewex.org/gewex-content/files_mf/1633983474Q22021.pdf (accessed on 30 April 2024).
- Stephens, G.; Polcher, J.; Zeng, X.B.; van Oevelen, P.; Poveda, G.; Bosilovich, M.; Ahn, M.H.; Balsamo, G.; Duan, Q.Y.; Hegerl, G.; et al. The First 30 Years of GEWEX. Bull. Amer. Meteor. Soc. 2023, 104, E126–E157.
- Zhao, X.; Liu C.; Tong, B.; Li, Y.; Wang, L.; Ma, Y.; Gao, Z. Study on Surface Process Parameters and Soil Thermal Parameters at Shiquanhe in the Western Qinghai-Xizang Plateau. Plateau Meteorol. 2021, 40, 711–723. (In Chinese).
- Sun, S.; Chen, B.; Che, T.; Zhang, H.; Chen, J.; Che, M.; Lin, X.; Guo, L. Simulating the Qinghai—Tibetan Plateau seasonal frozen soil moisture and improving model’s parameters—A case study in the upper reaches of Heihe River. Plateau Meteorol. 2017, 36, 643–656. (In Chinese).
- Chen, F.; Dudhia, J. Coupling an advanced land-surface/hydrology model with the Penn State/NCAR MM5 modeling system. Part I, Model implementation and sensitivity, Mon. Weather. Rev. 2001, 129, 569–585.
- Hogue, T.S.; Bastidas, L.A.; Gupta, H.V.; Sorooshian, S. Evaluating model performance and parameter behavior for varying levels of land surface model complexity. Water Resour. Res. 2006, 42, W08430.
- Rosero, E.; Yang, Z.L.; Gulden, L.E.; Niu, G.Y.; Gochis, D.J. Evaluating Enhanced Hydrological Representations in Noah LSM over Transition Zones: Implications for Model Development. J Hydrometeorol 2009, 10, 600-622. [CrossRef]
- Yang, K.; Qin, J.; Zhao, L.; Chen, Y.; Tang, W.; Han, M.; Lazhu; Chen, Z.; Lv, N.; Ding, B.; et al. A multi-scale soil moisture and freeze-thaw monitoring network on the third pole. Bull. Amer. Meteor. Soc. 2013, 94, 1907–1916.
- Yang, K.; Chen, Y.Y.; Qin, J. Some practical notes on the land surface modeling in the Tibetan Plateau. Hydrol. Earth Sys. Sci. 2009, 13, 687–701.
- Coon, E.T.; David Moulton, J.; Painter, S.L. Managing complexity in simulations of land surface and near-surface processes. Environmental Modelling & Software 2016, 78, 134-149. [CrossRef]
- Fisher, R.A.; Koven, C.D. Perspectives on the Future of Land Surface Models and the Challenges of Representing Complex Terrestrial Systems. Journal of Advances in Modeling Earth Systems 2020, 12. [CrossRef]
- Crow, W.T.; Wood, E.F.; Pan, M. Multiobjective calibration of land surface model evapotranspiration predictions using streamflow observations and spaceborne surface radiometric temperature retrievals. J Geophys Res-Atmos 2003, 108, doi:Artn 472510.1029/2002jd003292. [CrossRef]
- Coudert, B.; Ottle, C.; Boudevillain, B.; Demarty, J.; Guillevic, P. Contribution of thermal infrared remote sensing data in multiobjective calibration of a dual-source SVAT model. J Hydrometeorol 2006, 7, 404-420. [CrossRef]
- Khaki, M. Land Surface Model Calibration Using Satellite Remote Sensing Data. Sensors 2023, 23. [CrossRef]
- Dembélé, M.; Hrachowitz, M.; Savenije, H.H.G.; Mariéthoz, G.; Schaefli, B. Improving the Predictive Skill of a Distributed Hydrological Model by Calibration on Spatial Patterns with Multiple Satellite Data Sets. Water Resources Research 2020, 56, doi:ARTN e2019WR02608510.1029/2019WR026085. [CrossRef]
- Zhou, J.; Wu, Z.; Crow, W.T.; Dong, J.; He, H. Improving Spatial Patterns Prior to Land Surface Data Assimilation via Model Calibration Using SMAP Surface Soil Moisture Data. Water Resources Research 2020, 56. [CrossRef]
- Abhervé, R.; Roques, C.; Gauvain, A.; Longuevergne, L.; Louaisil, S.; Aquilina, L.; de Dreuzy, J.-R. Calibration of groundwater seepage against the spatial distribution of the stream network to assess catchment-scale hydraulic properties. Hydrol Earth Syst Sc 2023, 27, 3221-3239. [CrossRef]
- Adeyeri, O.E.; Folorunsho, A.H.; Ayegbusi, K.I.; Bobde, V.; Adeliyi, T.E.; Ndehedehe, C.E.; Akinsanola, A.A. Land surface dynamics and meteorological forcings modulate land surface temperature characteristics. Sustainable Cities and Society 2024, 101. [CrossRef]
- Cunha, A.P.M.A.; Alvalá, R.C.S.; Sampaio, G.; Shimizu, M.H.; Costa, M.H. Calibration and Validation of the Integrated Biosphere Simulator (IBIS) for a Brazilian Semiarid Region. J Appl Meteorol Clim 2013, 52, 2753-2770. [CrossRef]
- Burke, E.J.; Shuttleworth, W.J.; Houser, P.R. Impact of horizontal and vertical heterogeneities on retrievals using multiangle microwave brightness temperature data. Ieee T Geosci Remote 2004, 42, 1495-1501. [CrossRef]
- Hagedorn, B. Hydrograph separation through multi objective optimization: Revealing the importance of a temporally and spatially constrained baseflow solute source. Journal of Hydrology 2020, 590, doi:ARTN 12534910.1016/j.jhydrol.2020.125349. [CrossRef]
- Kuban, M.; Parajka, J.; Tong, R.; Pfeil, I.; Vreugdenhil, M.; Sleziak, P.; Adam, B.; Szolgay, J.; Kohnová, S.; Hlavcová, K. Incorporating Advanced Scatterometer Surface and Root Zone Soil Moisture Products into the Calibration of a Conceptual Semi-Distributed Hydrological Model. Water 2021, 13, doi:ARTN 336610.3390/w13233366. [CrossRef]
- Zitzler, E.; Thiele, L.; Laumanns, M.; Fonseca, C.M.; da Fonseca, V.G. Performance assessment of multiobjective optimizers: an analysis and review. IEEE Transactions on Evolutionary Computation 2003, 7, 117-132. [CrossRef]
- Coello, C.A.C.L., G. B. ; Veldhuizen, D. A. V. . Evolutionary Algorithms for Solving Multi-Objective Problems Second Edition; Springer: New York, USA, 2007; pp. XXI, 800.
- Loridan, T.; Grimmond, C.S.B.; Grossman-Clarke, S.; Chen, F.; Tewari, M.; Manning, K.; Martilli, A.; Kusaka, H.; Best, M. Trade-offs and responsiveness of the single-layer urban canopy parametrization in WRF: An offline evaluation using the MOSCEM optimization algorithm and field observations. Quarterly Journal of the Royal Meteorological Society 2010, 136, 997-1019. [CrossRef]
- Yapo, P.; Gupta, H.; Sorooshian, S. Multi-objective global optimization for hydrologic models. Journal of Hydrology 1998, 204, 83-97.
- Vrugt, J.A.; Gupta, H.V.; Bastidas, L.A.; Bouten, W.; Sorooshian, S. Effective and efficient algorithm for multiobjective optimization of hydrologic models. Water Resources Research 2003, 39. [CrossRef]
- Fenicia, F.; Savenije, H.H.G.; Matgen, P.; Pfister, L. A comparison of alternative multiobjective calibration strategies for hydrological modeling. Water Resources Research 2007, 43, doi:Artn W0343410.1029/2006wr005098. [CrossRef]
- Deng, L.; Guo, S.; Yin, J.; Zeng, Y.; Chen, K. Multi-objective optimization of water resources allocation in Han River basin (China) integrating efficiency, equity and sustainability. Scientific Reports 2022, 12. [CrossRef]
- Dumedah, G.; Berg, A.A.; Wineberg, M. An Integrated Framework for a Joint Assimilation of Brightness Temperature and Soil Moisture Using the Nondominated Sorting Genetic Algorithm II. J Hydrometeorol 2011, 12, 1596-1609. [CrossRef]
- Li, M.; Yang, S.; Liu, X. Pareto or Non-Pareto: Bi-Criterion Evolution in Multiobjective Optimization. IEEE Transactions on Evolutionary Computation 2016, 20, 645-665. [CrossRef]
- Liu, Y.; Zhu, N.; Li, K.; Li, M.; Zheng, J.; Li, K. An angle dominance criterion for evolutionary many-objective optimization. Information Sciences 2020, 509, 376-399. [CrossRef]
- Pool, S.; Vis, M.; Seibert, J. Evaluating model performance: towards a non-parametric variant of the Kling-Gupta efficiency. Hydrological Sciences Journal 2018, 63, 1941-1953. [CrossRef]
- Knoben, W.J.M.; Freer, J.E.; Woods, R.A. Technical note: Inherent benchmark or not? Comparing Nash–Sutcliffe and Kling–Gupta efficiency scores. Hydrol Earth Syst Sc 2019, 23, 4323-4331. [CrossRef]
- Vrugt, J.A.; de Oliveira, D.Y. Confidence intervals of the Kling-Gupta efficiency. Journal of Hydrology 2022, 612. [CrossRef]
- Mathevet, T.; Le Moine, N.; Andréassian, V.; Gupta, H.; Oudin, L. Multi-objective assessment of hydrological model performances using Nash–Sutcliffe and Kling–Gupta efficiencies on a worldwide large sample of watersheds. Comptes Rendus. Géoscience 2023, 355, 1-25. [CrossRef]
- Chai, T.; Draxler, R.R. Root mean square error (RMSE) or mean absolute error (MAE)? – Arguments against avoiding RMSE in the literature. Geoscientific Model Development 2014, 7, 1247-1250. [CrossRef]
- Hodson, T.O. Root-mean-square error (RMSE) or mean absolute error (MAE): when to use them or not. Geoscientific Model Development 2022, 15, 5481-5487. [CrossRef]
- Armstrong, R.A. Should Pearson's correlation coefficient be avoided? Ophthalmic and Physiological Optics 2019, 39, 316-327. [CrossRef]
- Schober, P.; Boer, C.; Schwarte, L.A. Correlation Coefficients: Appropriate Use and Interpretation. Anesthesia & Analgesia 2018, 126, 1763-1768. [CrossRef]
- Cheng, C.L.; Shalabh; Garg, G. Coefficient of determination for multiple measurement error models. Journal of Multivariate Analysis 2014, 126, 137-152. [CrossRef]
- Contessi, D.; Recati, A.; Rizzi, M. Phase diagram detection via Gaussian fitting of number probability distribution. Physical Review B 2023, 107, L121403. [CrossRef]
- Rodell, M.; Houser, P.R.; Jambor, U.; Gottschalck, J.; Mitchell, K.; Meng, C.; Arsenault, K.; Cosgrove, B.; Radakovich, J.; Bosilovich, M.; et al. The Global Land Data Assimilation System. Bull. Amer. Meteor. Soc. 2004, 85, 381–394.
- Yang, K.; He, J.; Tang, W.; Lu, H.; Qin, J.; Chen, Y.; Li, X. China Meteorological Forcing Dataset (1979–2018). TPDC. 2019. https://data.tpdc.ac.cn/en/data/8028b944-daaa-4511-8769-965612652c49 (accessed on 30 August 2024).
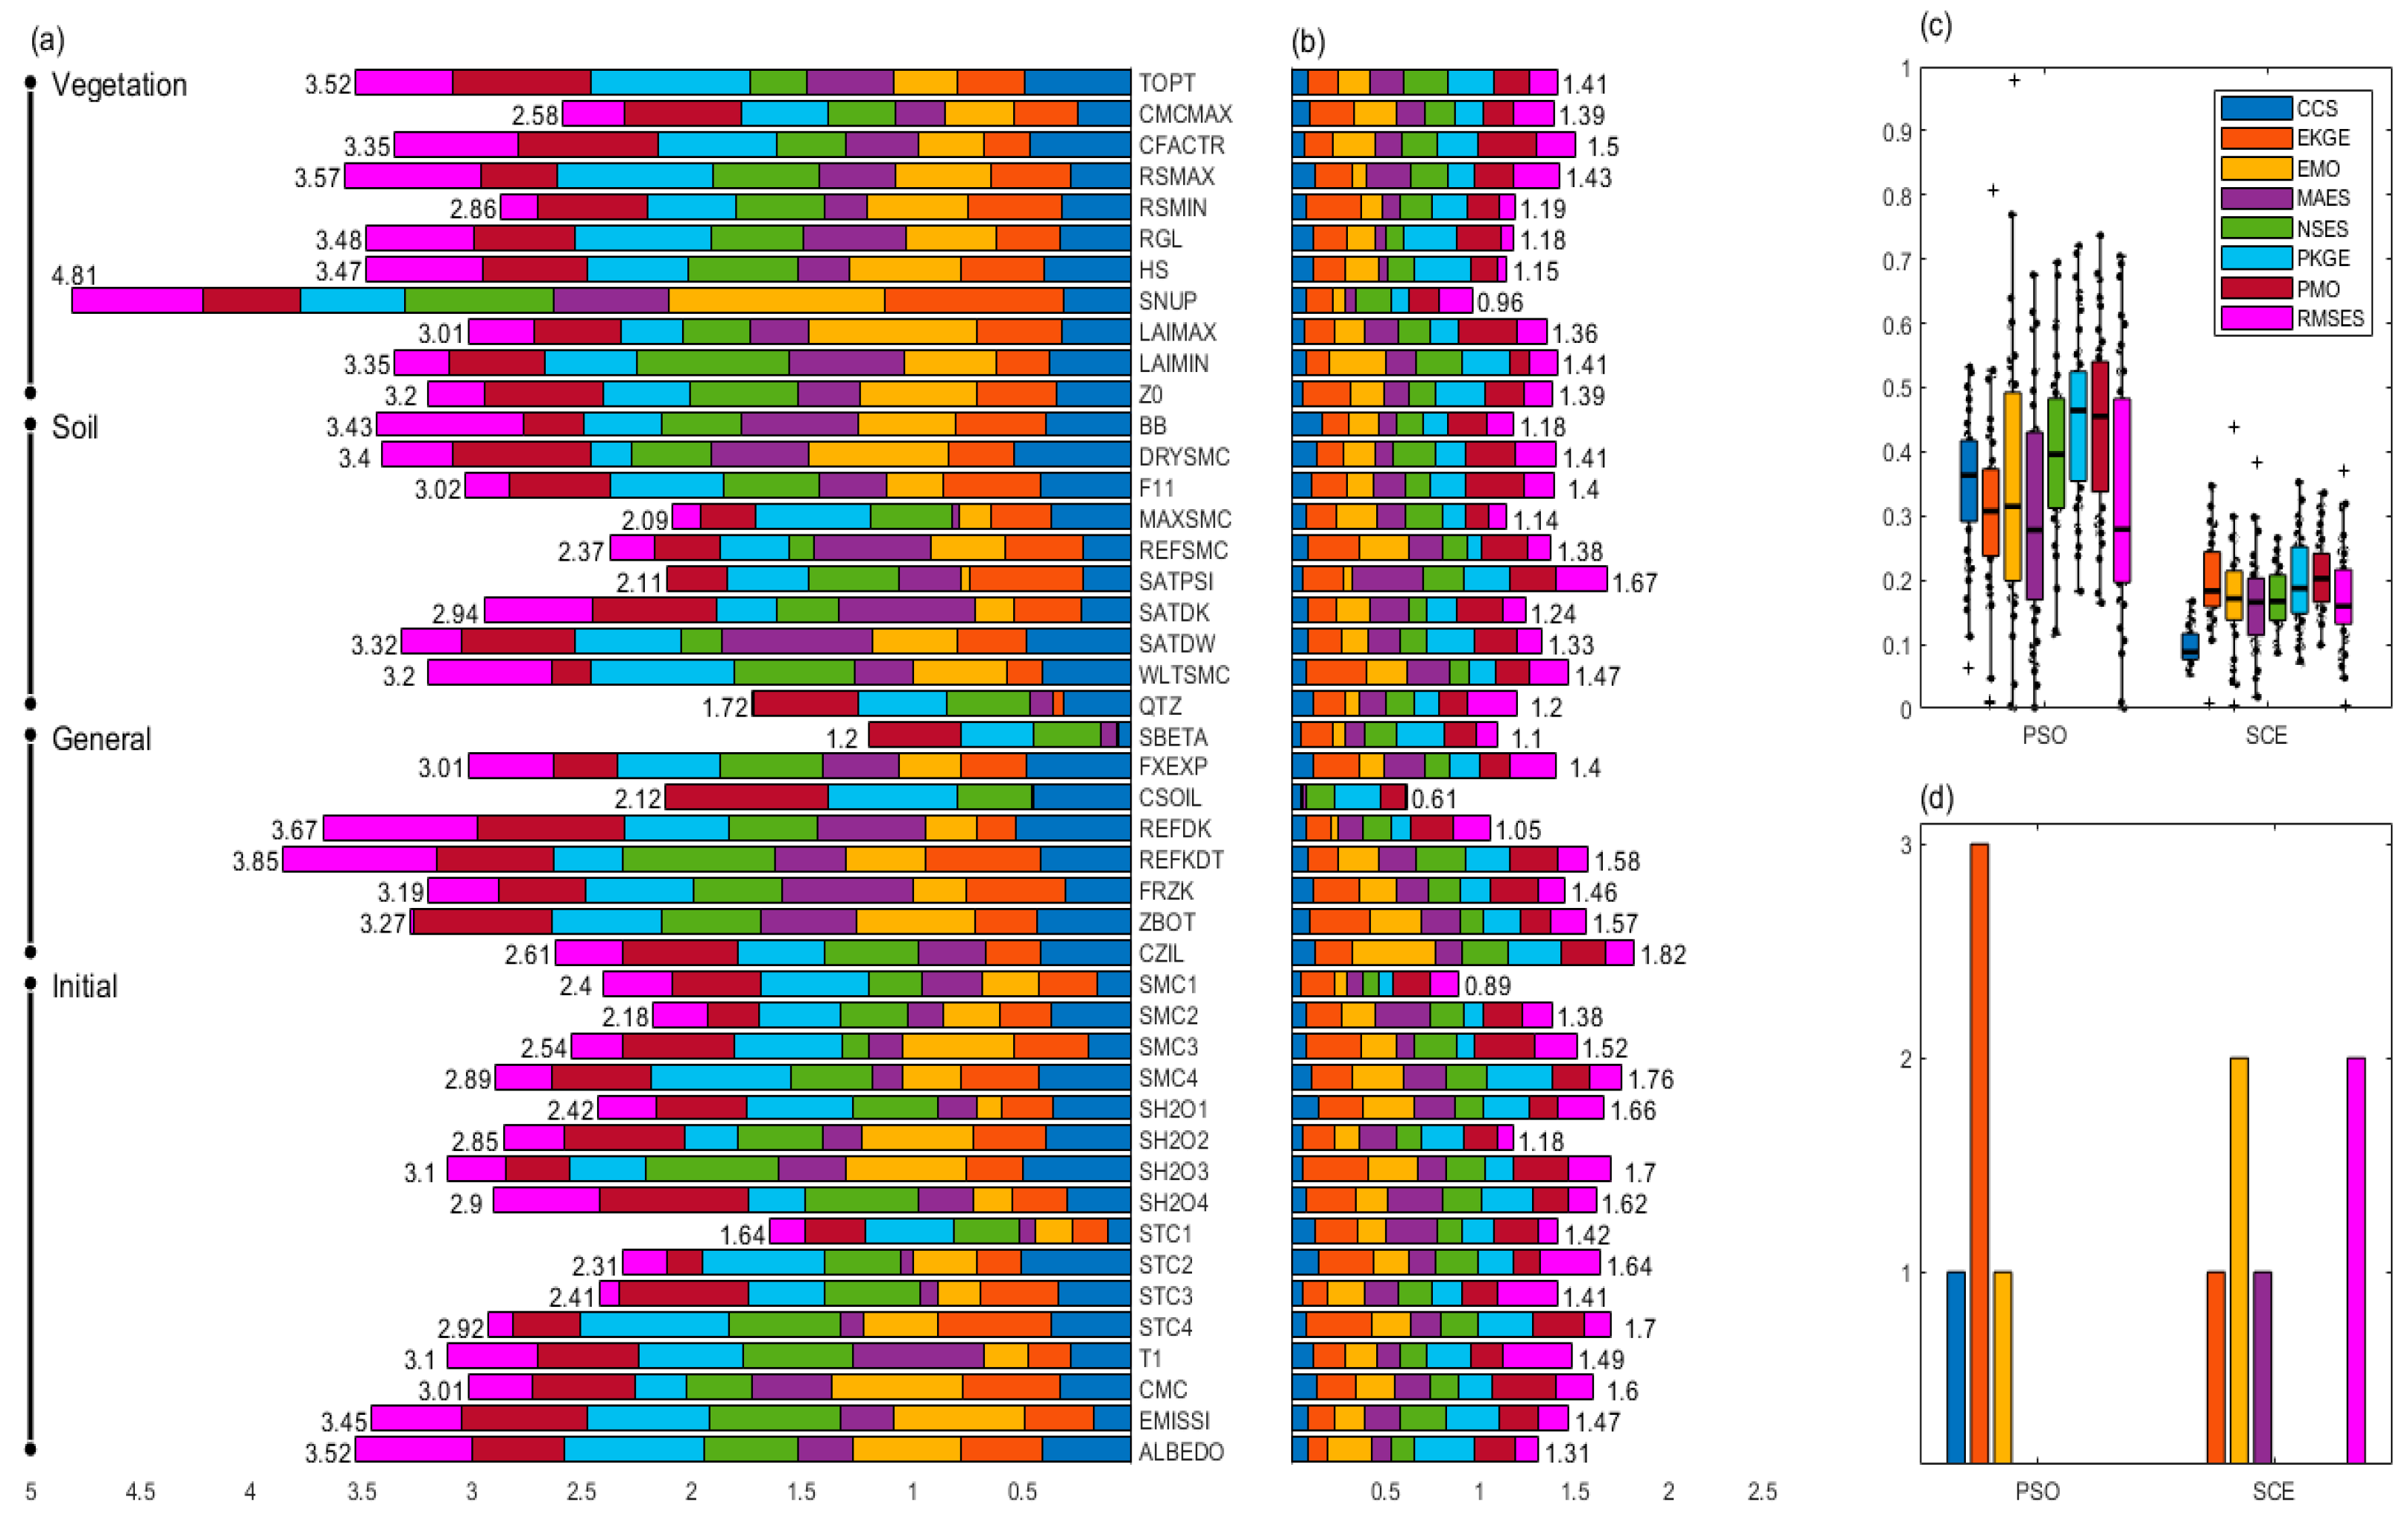
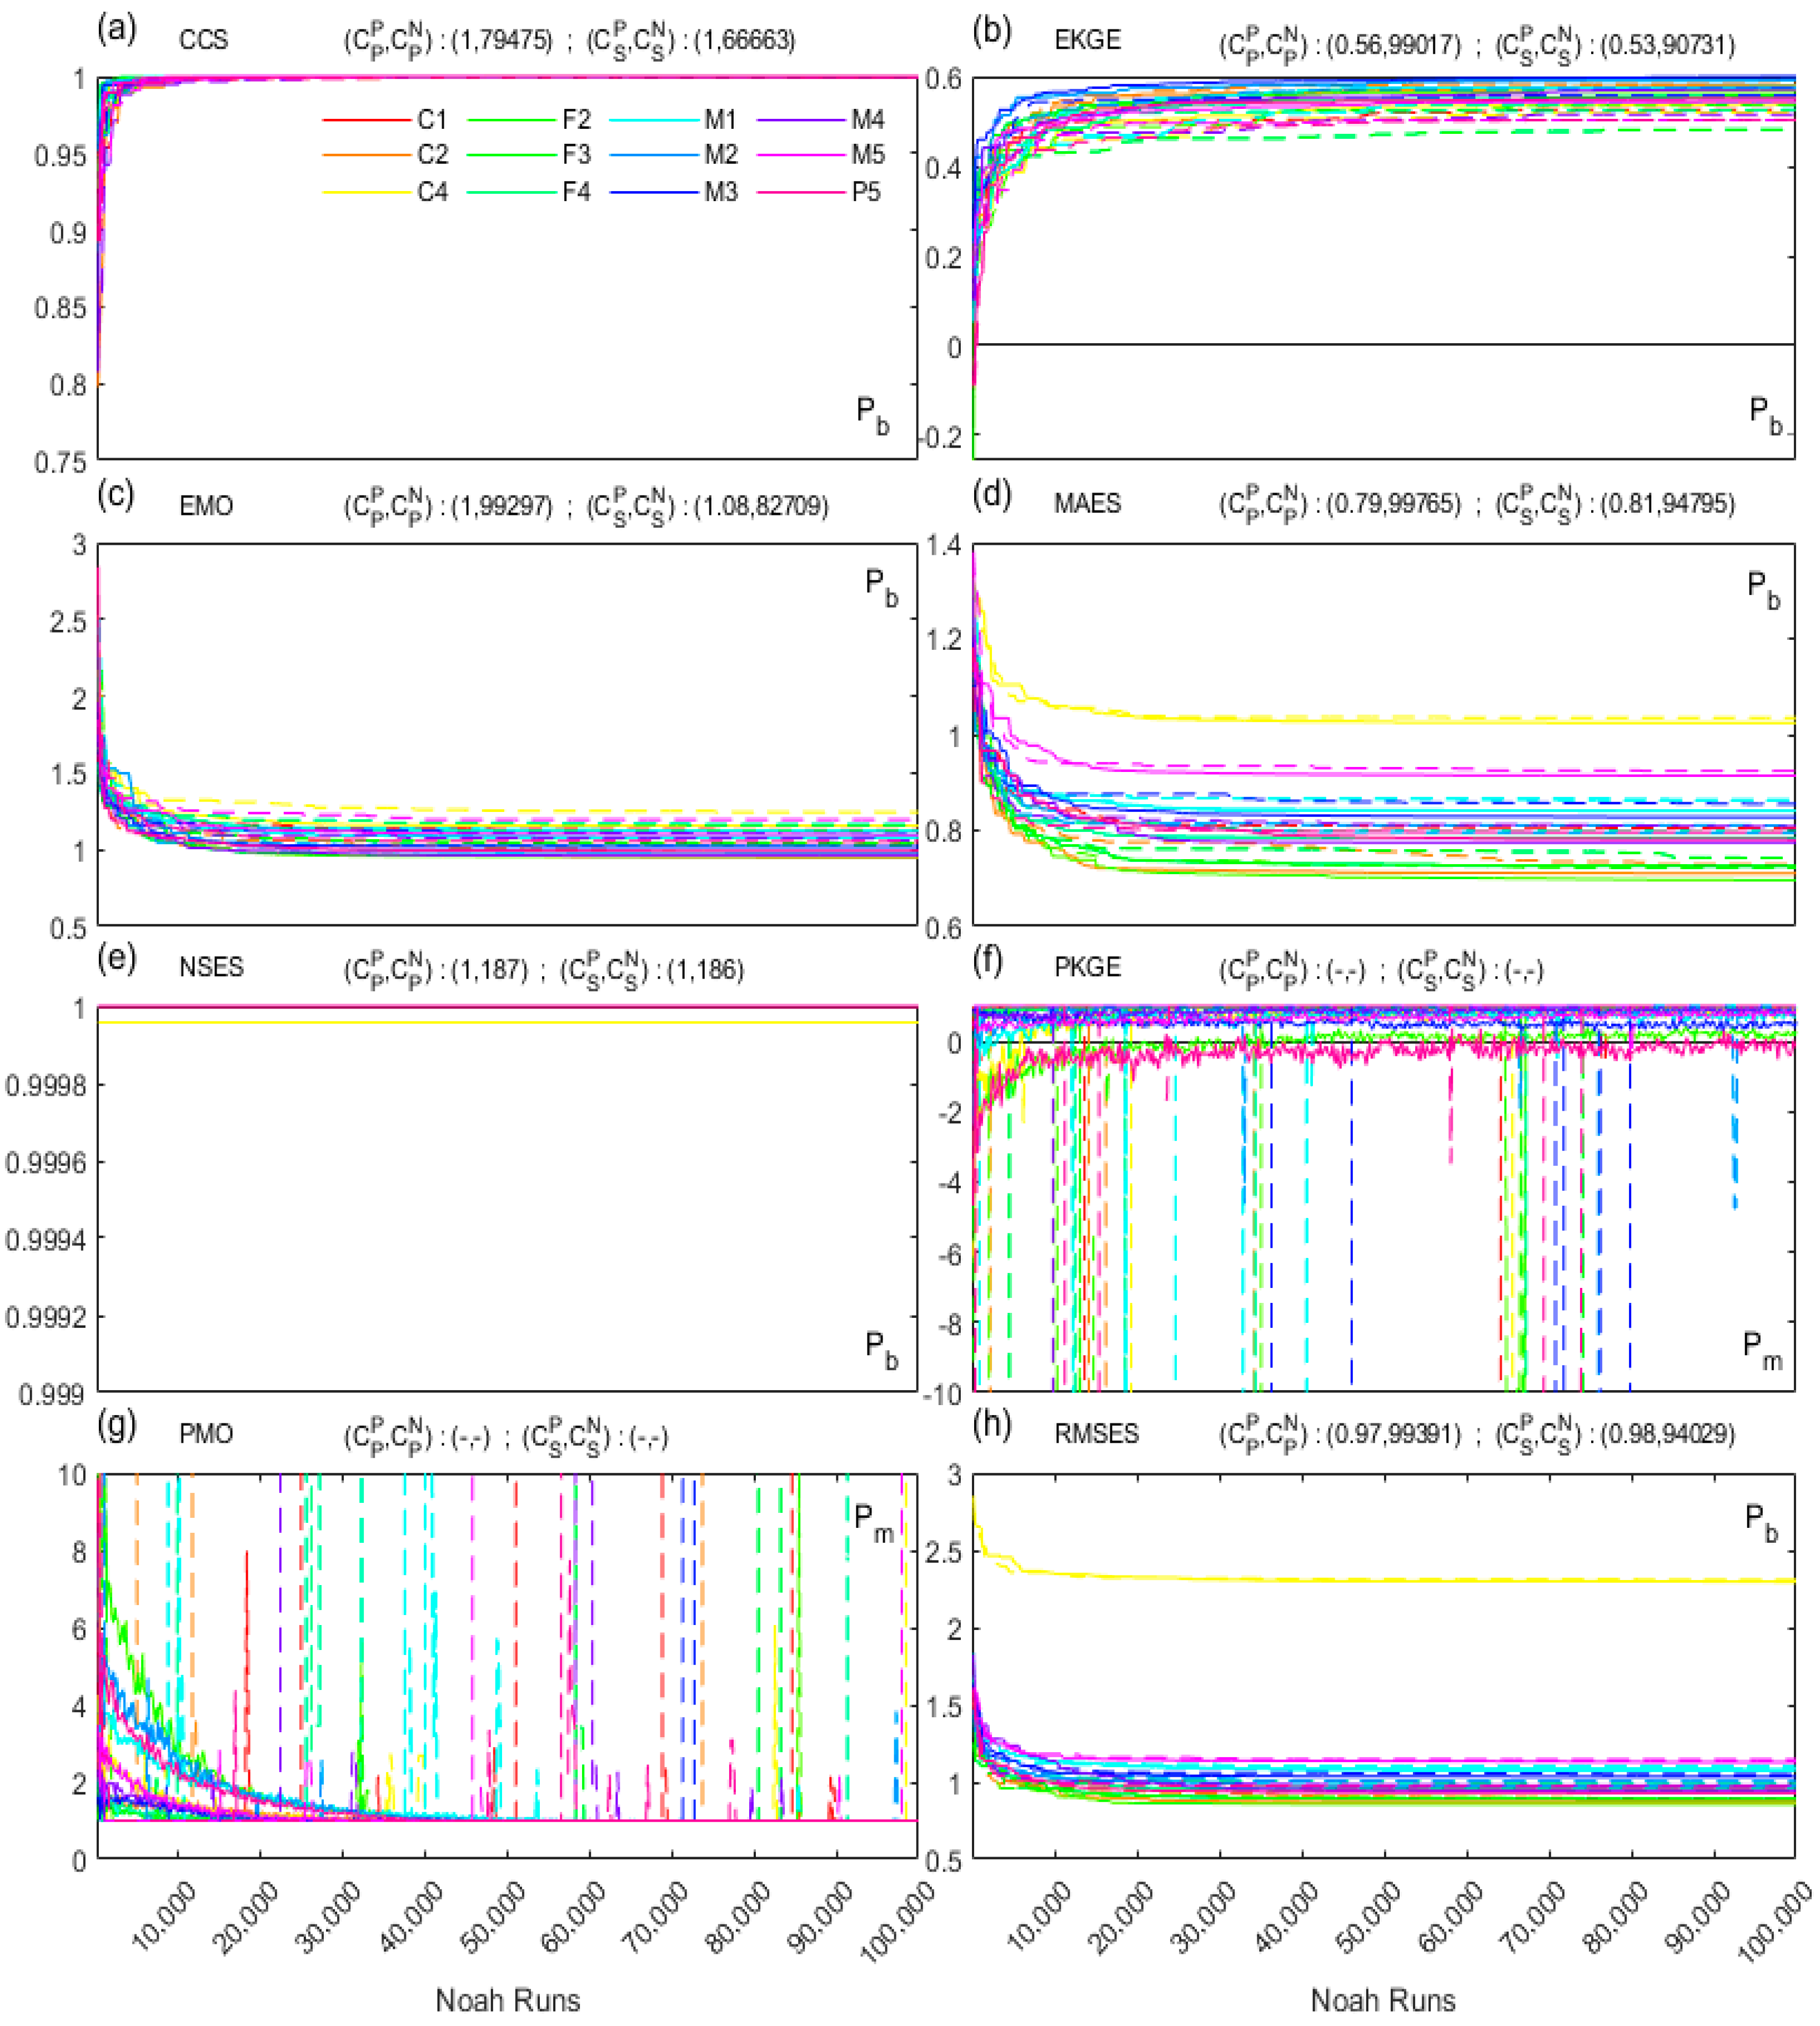
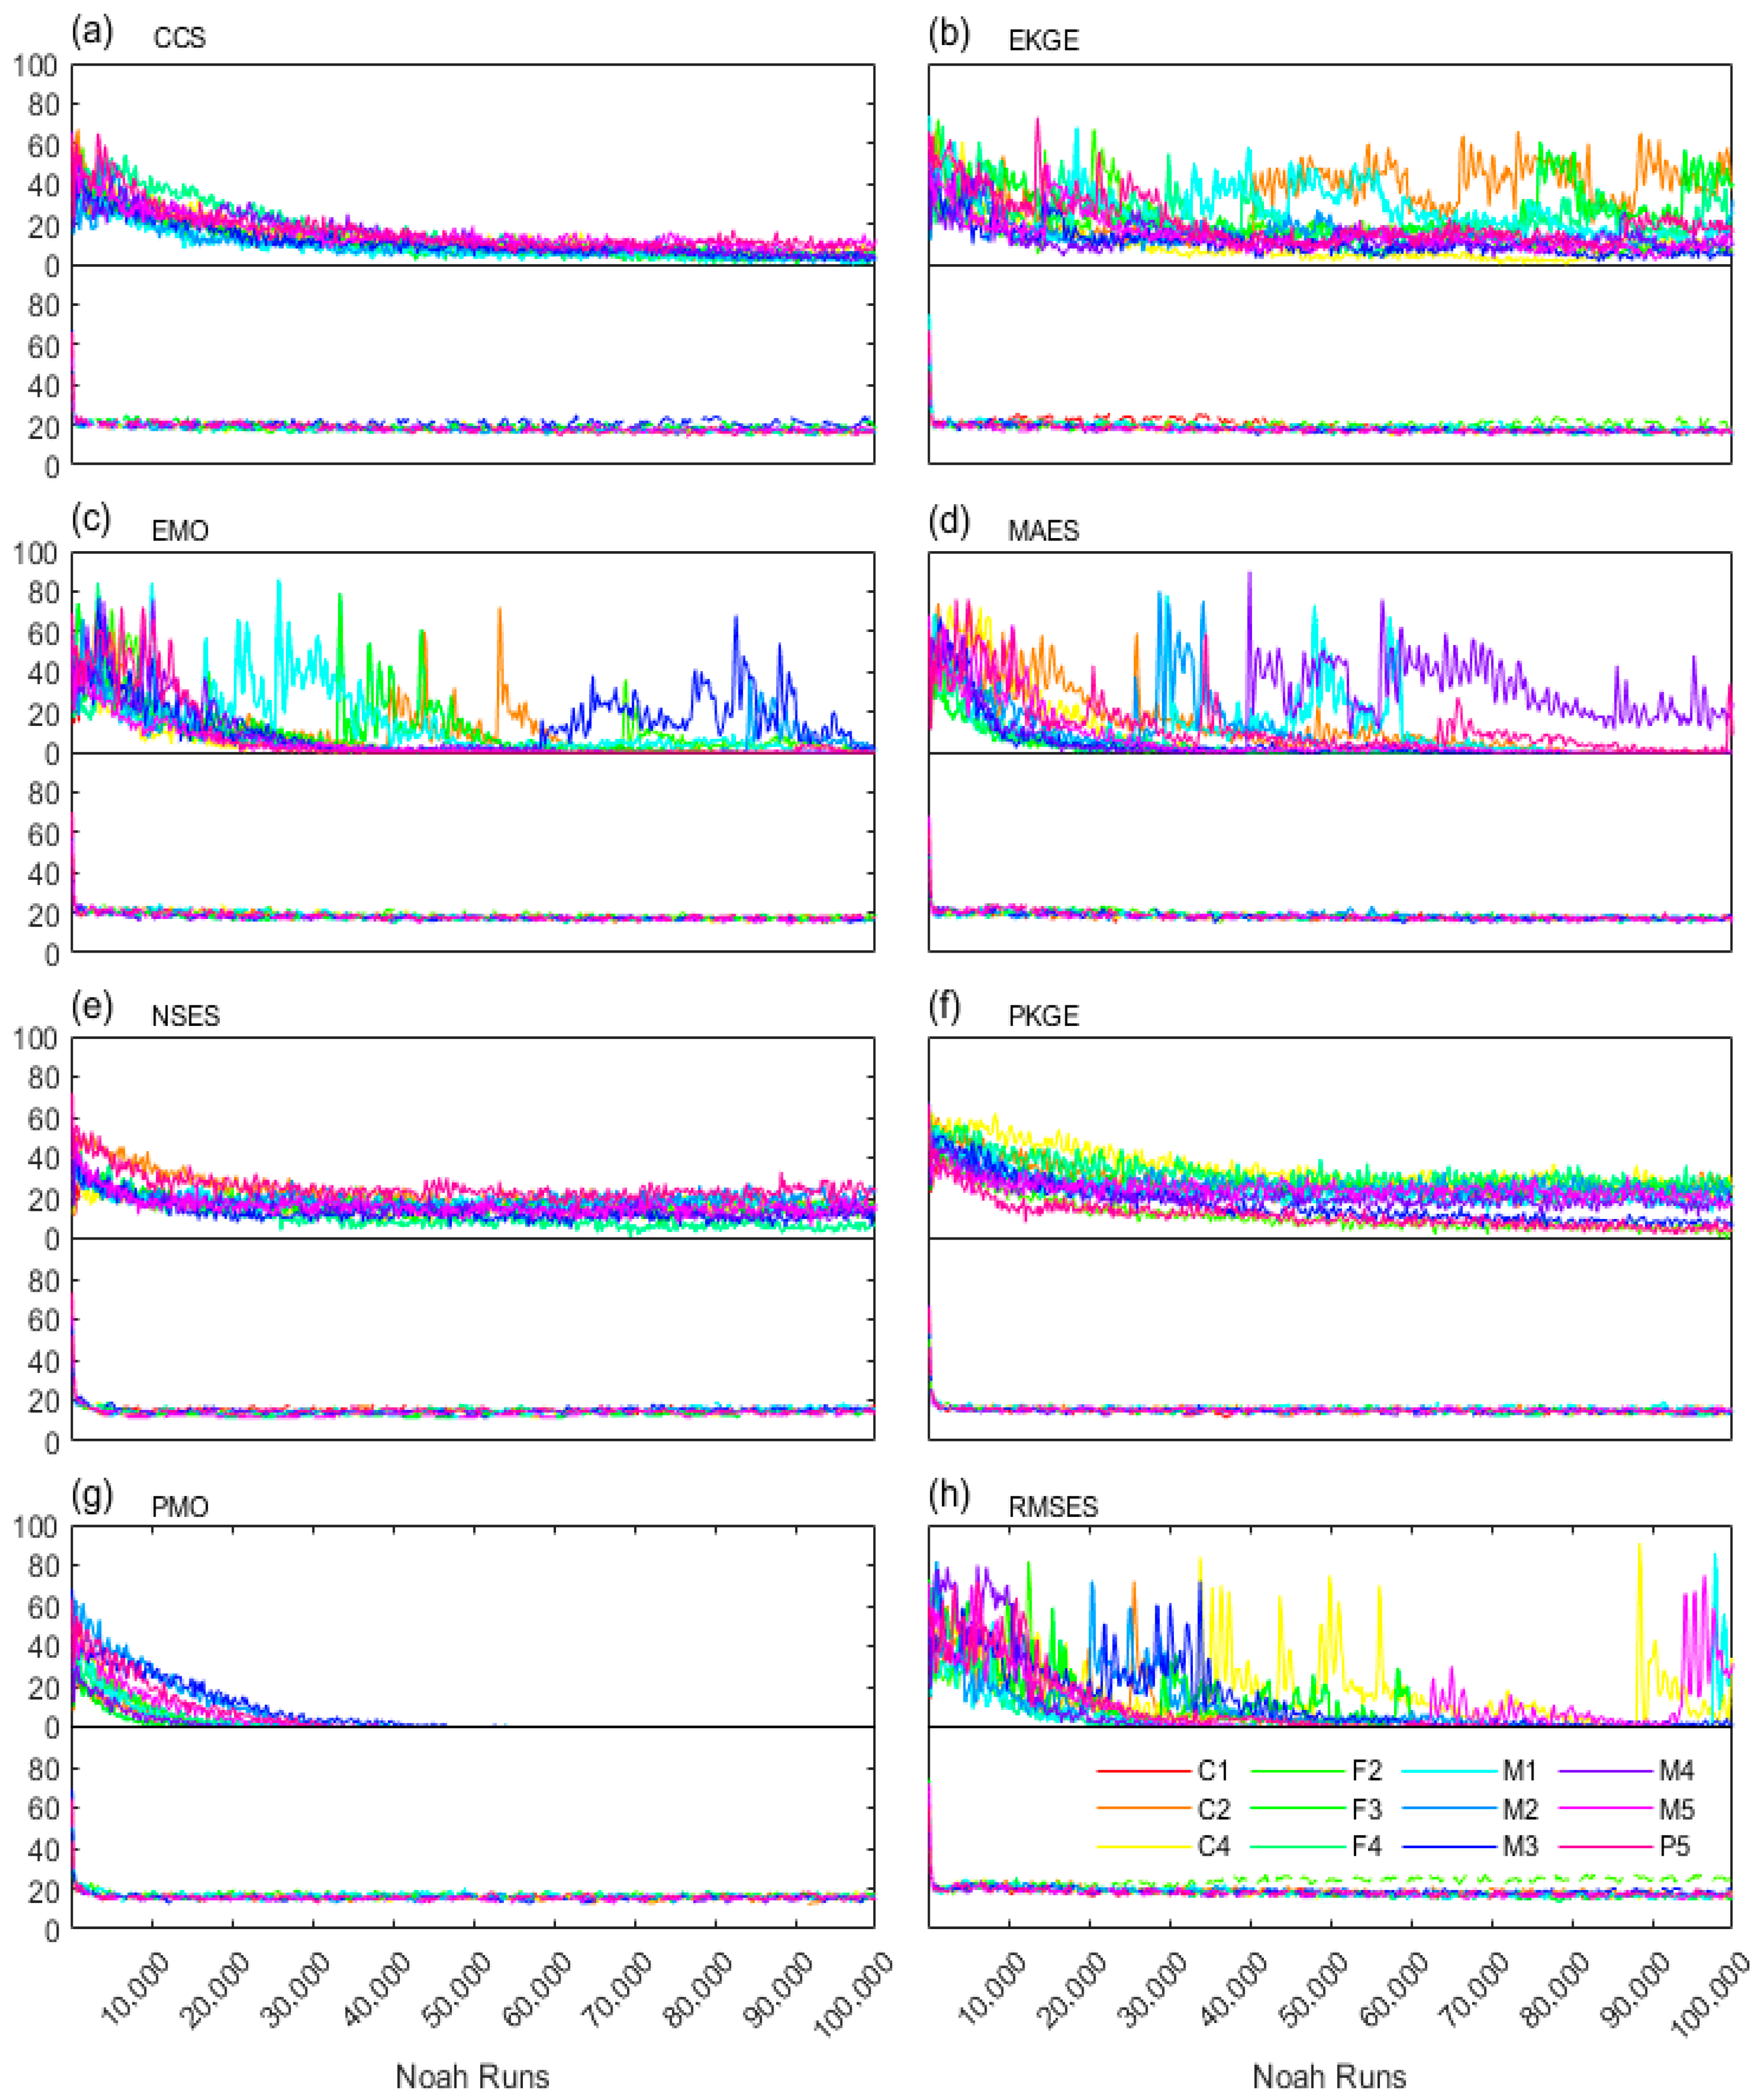
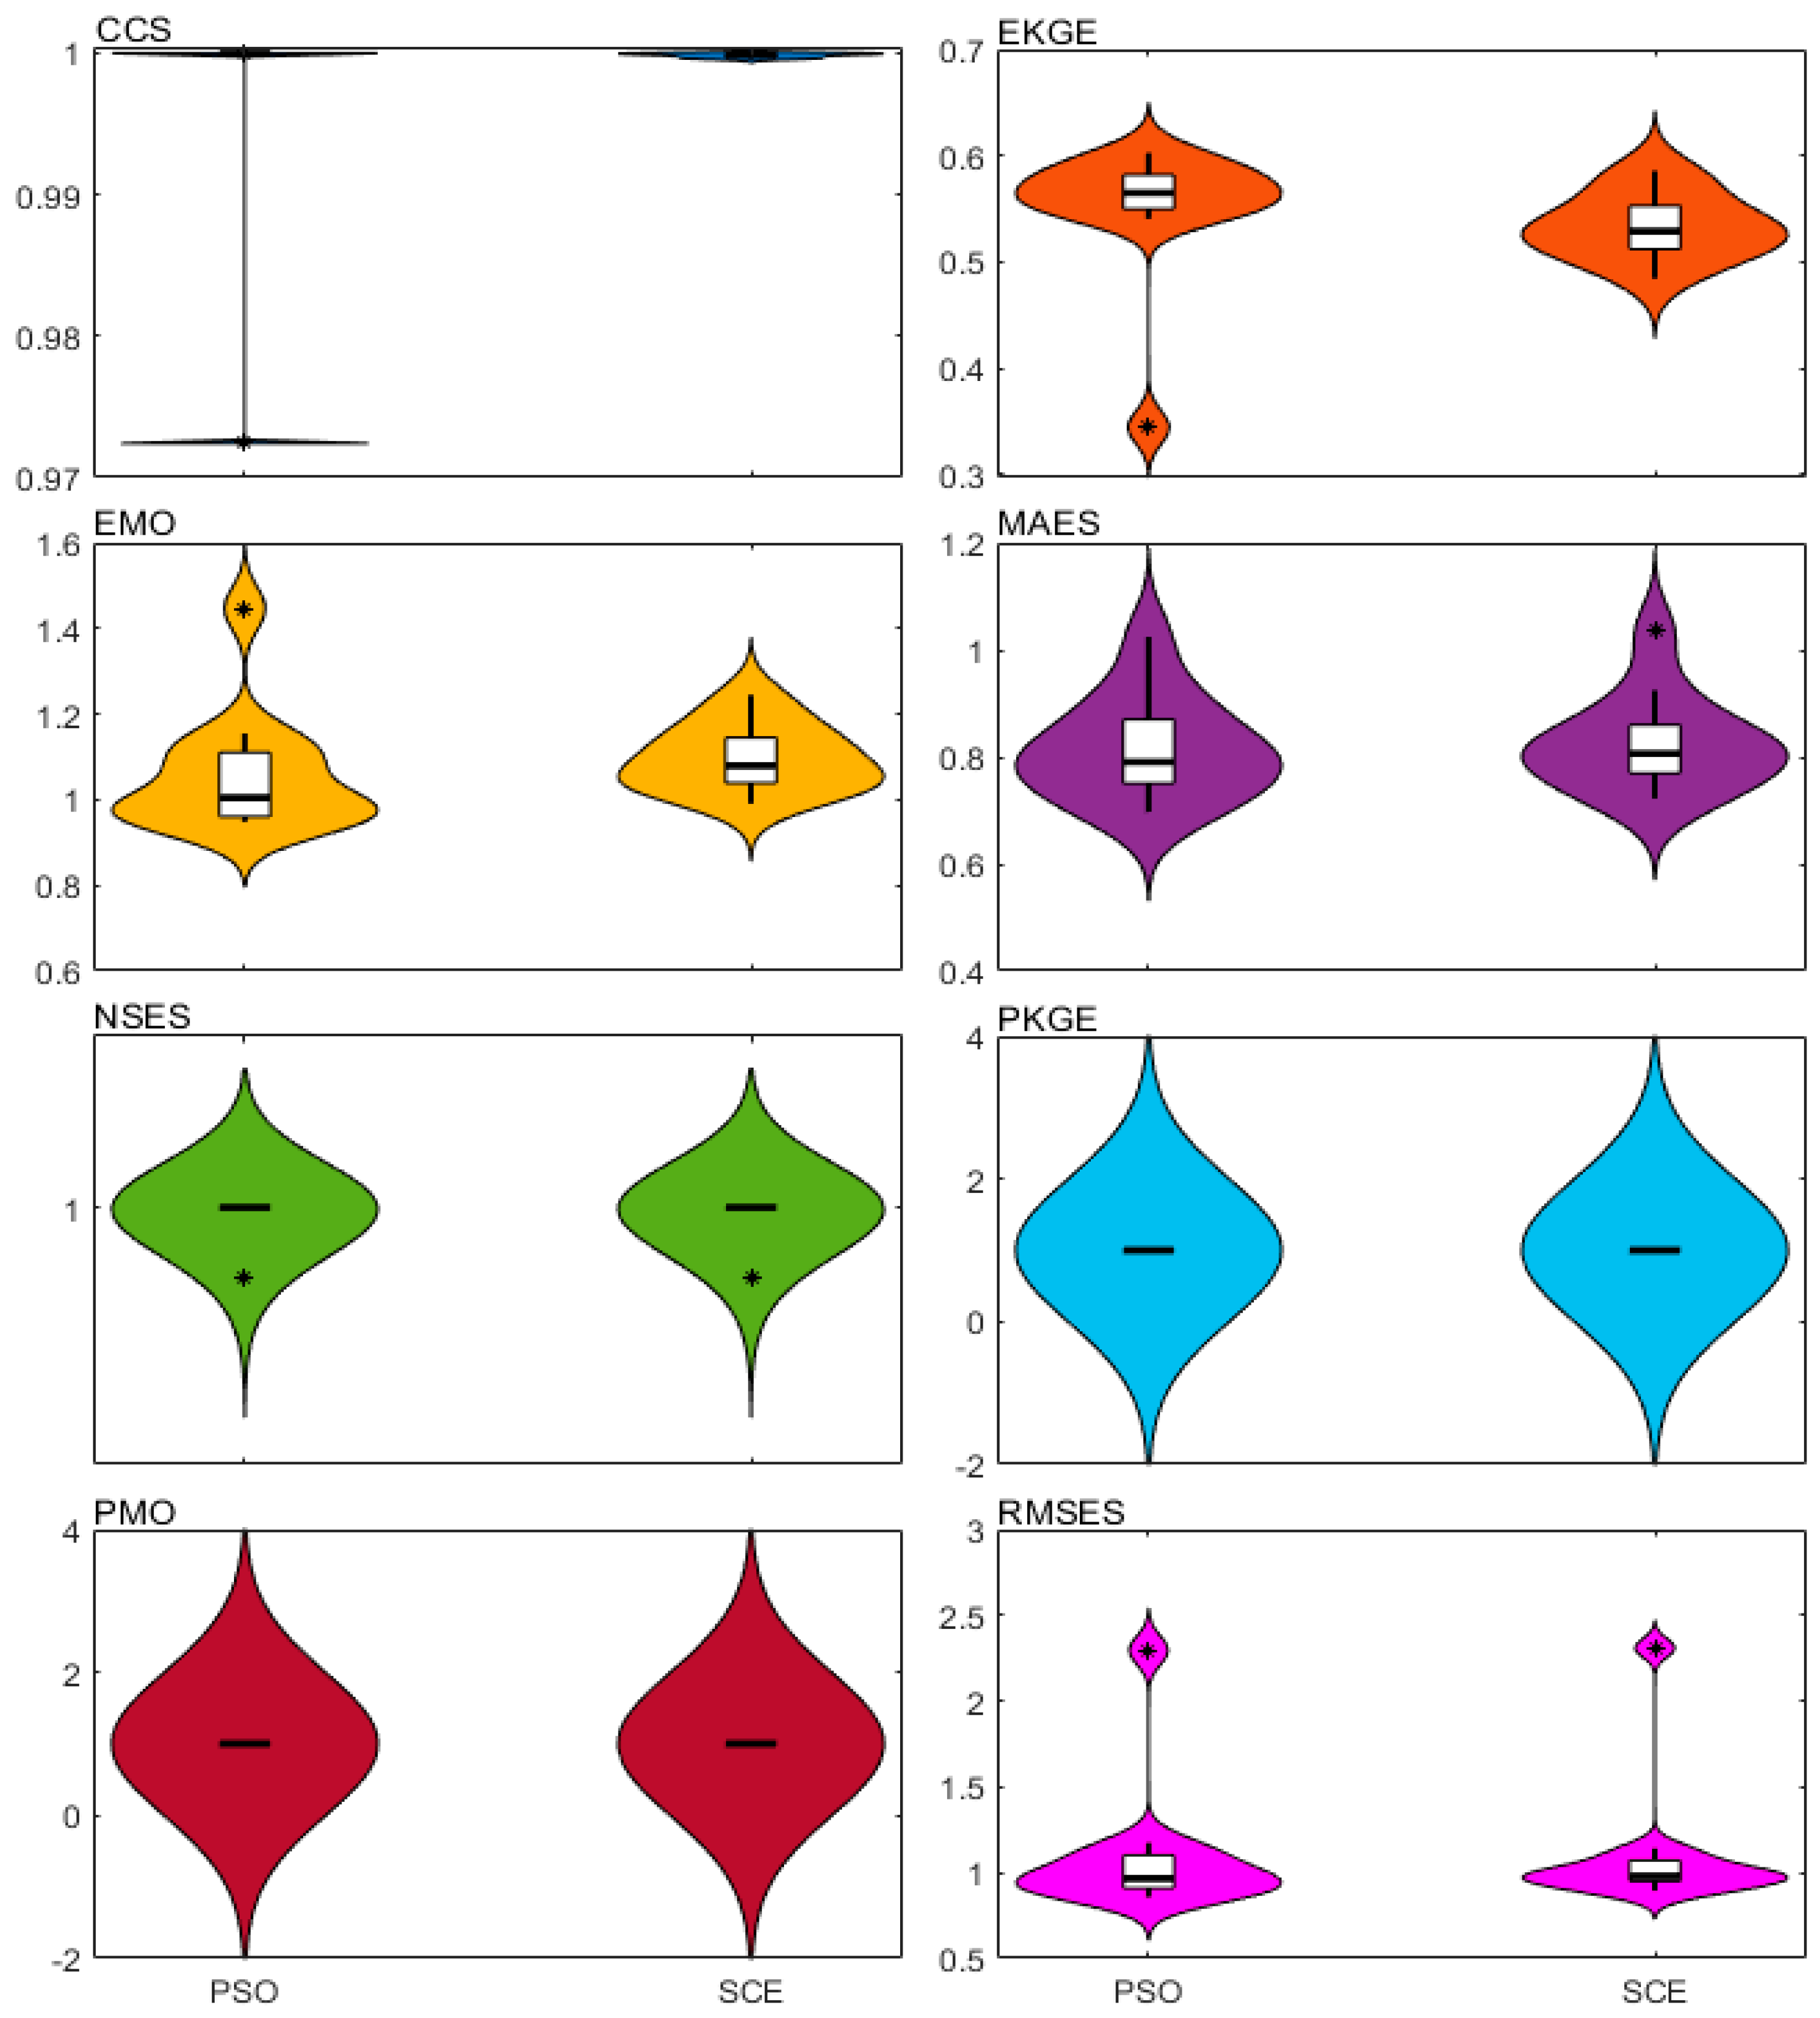
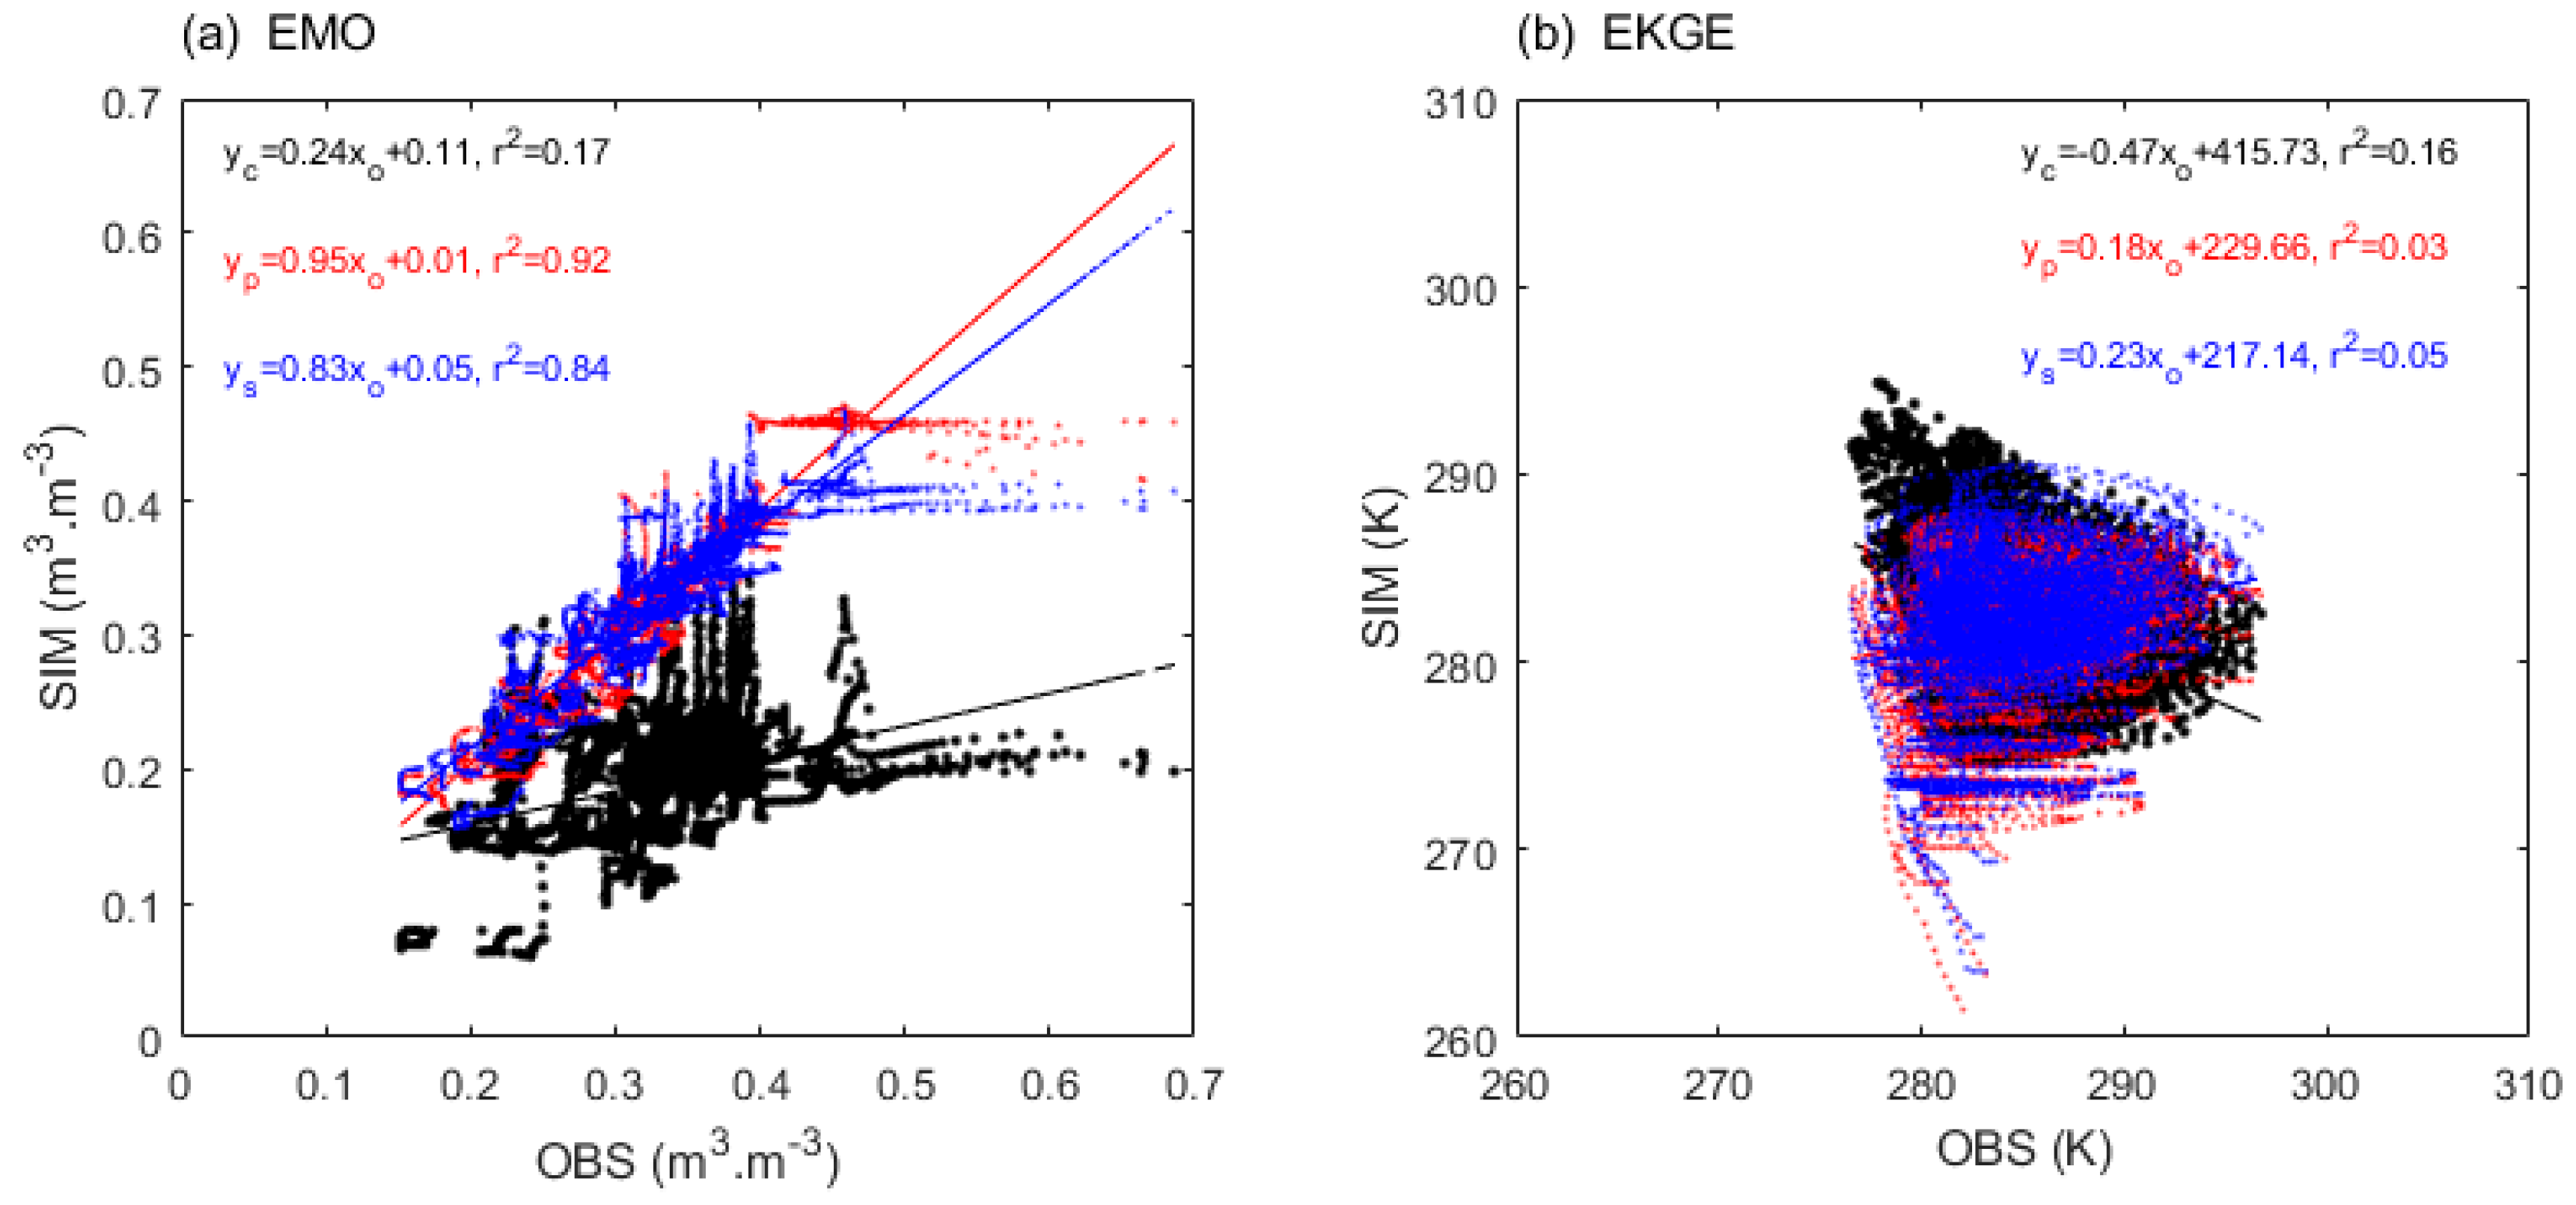
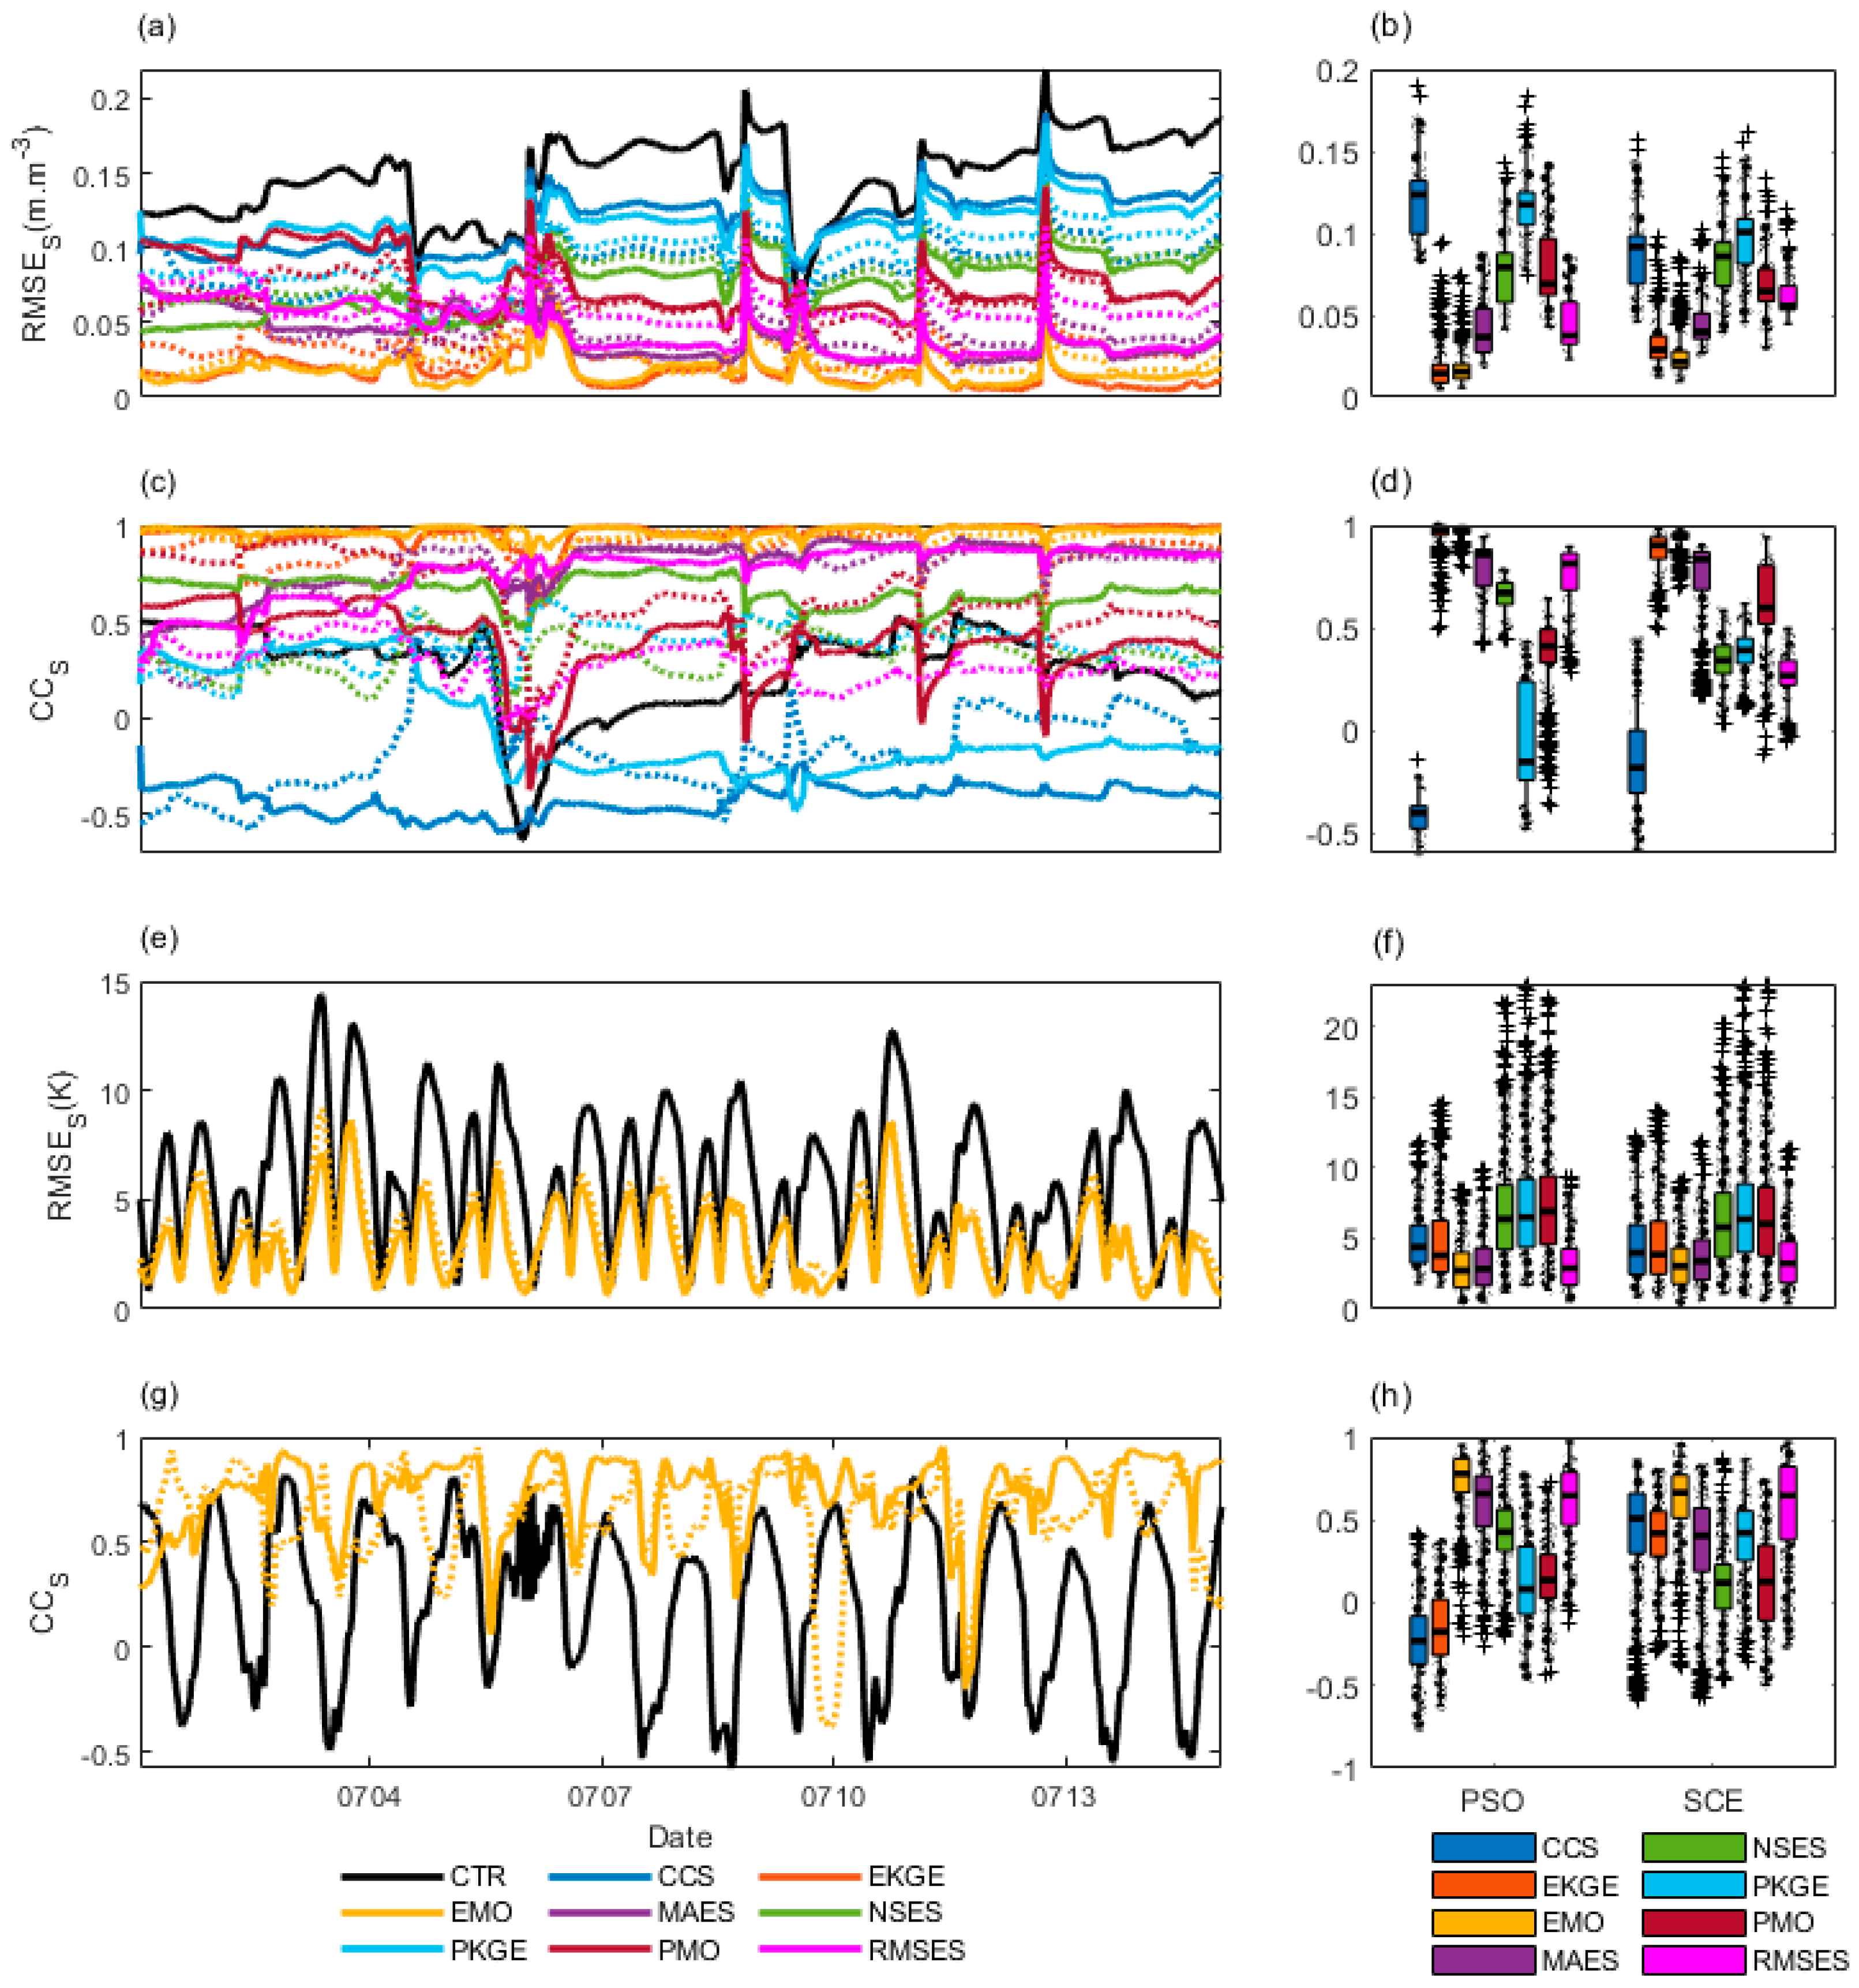


| Metric | Reference Formula* | Direction, Optima | |
|---|---|---|---|
| CCS | Correlation coefficients | ||
| EKGE | Enhanced Kling-Gupta efficiency |
|
|
| EMO | Enhanced multiple objectives | ||
| MAES | Mean absolute errors | ||
| NSES | Nash Sutcliffe efficiencies | ||
| PKGE | Pareto dominant KGE |
|
|
| PMO | Pareto dominant MO |
|
|
| RMSES | Root mean square errors |
| Metrics | Vegetation (Hp, Hs) * | Soil (Hp, Hs) | General (Hp, Hs) | Initial (Hp, Hs) |
|---|---|---|---|---|
| CCS | 0, | 0, | 1, | 0, 1 |
| EKGE | 0, 0 | 1, 3 | 2, 2 | 4, 2 |
| EMO | 0, 0 | 2, 2 | 2, 2 | 3, 2 |
| MAES | 0, 0 | 1, 1 | 1, 1 | 2, 1 |
| NSES | 0, 0 | 0, 0 | 0, 0 | 2, 0 |
| PKGE | 0, 0 | 0, 0 | 0, 0 | 0, 0 |
| PMO | 0,0 | 0, 0 | 0, 0 | 0, 0 |
| RMSES | 0, 0 | 2, 1 | 1, 1 | 2, 0 |
| Metrics | Vegetation (PNL, ONR) * |
Soil (PNL, ONR) * |
General (PNL, ONR) * |
Initial (PNL, ONR) * |
|---|---|---|---|---|
| CCS | NA, -2 | NA, -1 | 1, -2 | NA, -1 |
| EKGE | 2, -1 | 2, 2 | 2, 1 | 2, 1 |
| EMO | NA, -1 | 3, 3 | 3, 2 | 1, 5 |
| MAES | NA, -5 | 2, -1 | 3, 0 | NA, 2 |
| NSES | NA, -5 | NA, -1 | NA, -2 | NA, 2 |
| PKGE | NA, -1 | NA, -2 | NA, -2 | NA, -4 |
| PMO | NA, 0 | 1, 3 | NA, -1 | NA, 0 |
| RMSES | NA, -3 | 4, 4 | 3, 1 | NA, 1 |
| Metrics | PSO SM (s, r2) * | SCE SM (s, r2) | PSO ST (s, r2) | SCE ST (s, r2) |
|---|---|---|---|---|
| CCS | 0.29, 0.11 | 0.03, 0.01 | 0, 0 | 0.1, 0.01 |
| EKGE | 0.91, 0.9 | 0.73, 0.75 | 0.18, 0.03 | 0.23, 0.05 |
| EMO | 0.96, 0.92 | 0.83, 0.84 | 0.14, 0.1 | 0.11, 0.04 |
| MAES | 0.76, 0.6 | 0.44, 0.55 | 0.13, 0.05 | 0.06, 0.01 |
| NSES | 0.57, 0.39 | 0.25, 0.2 | -0.41, 0.05 | -0.44, 0.08 |
| PKGE | 0.19, 0.04 | 0.26, 0.11 | -0.57, 0.1 | -0.56, 0.11 |
| PMO | 0.68, 0.31 | 0.74, 0.48 | -0.63, 0.11 | -0.51, 0.09 |
| RMSES | 0.77, 0.57 | 0.16, 0.13 | 0.12, 0.05 | 0.09, 0.02 |
| Metrics | PSO SM (f, c) * | SCE SM (f, c) | PSO ST (f, c) | SCE ST (f, c) |
|---|---|---|---|---|
| CCS | 350, -0.04 | 295, 0.11 | 216, 2.13 | 167, 1.07 |
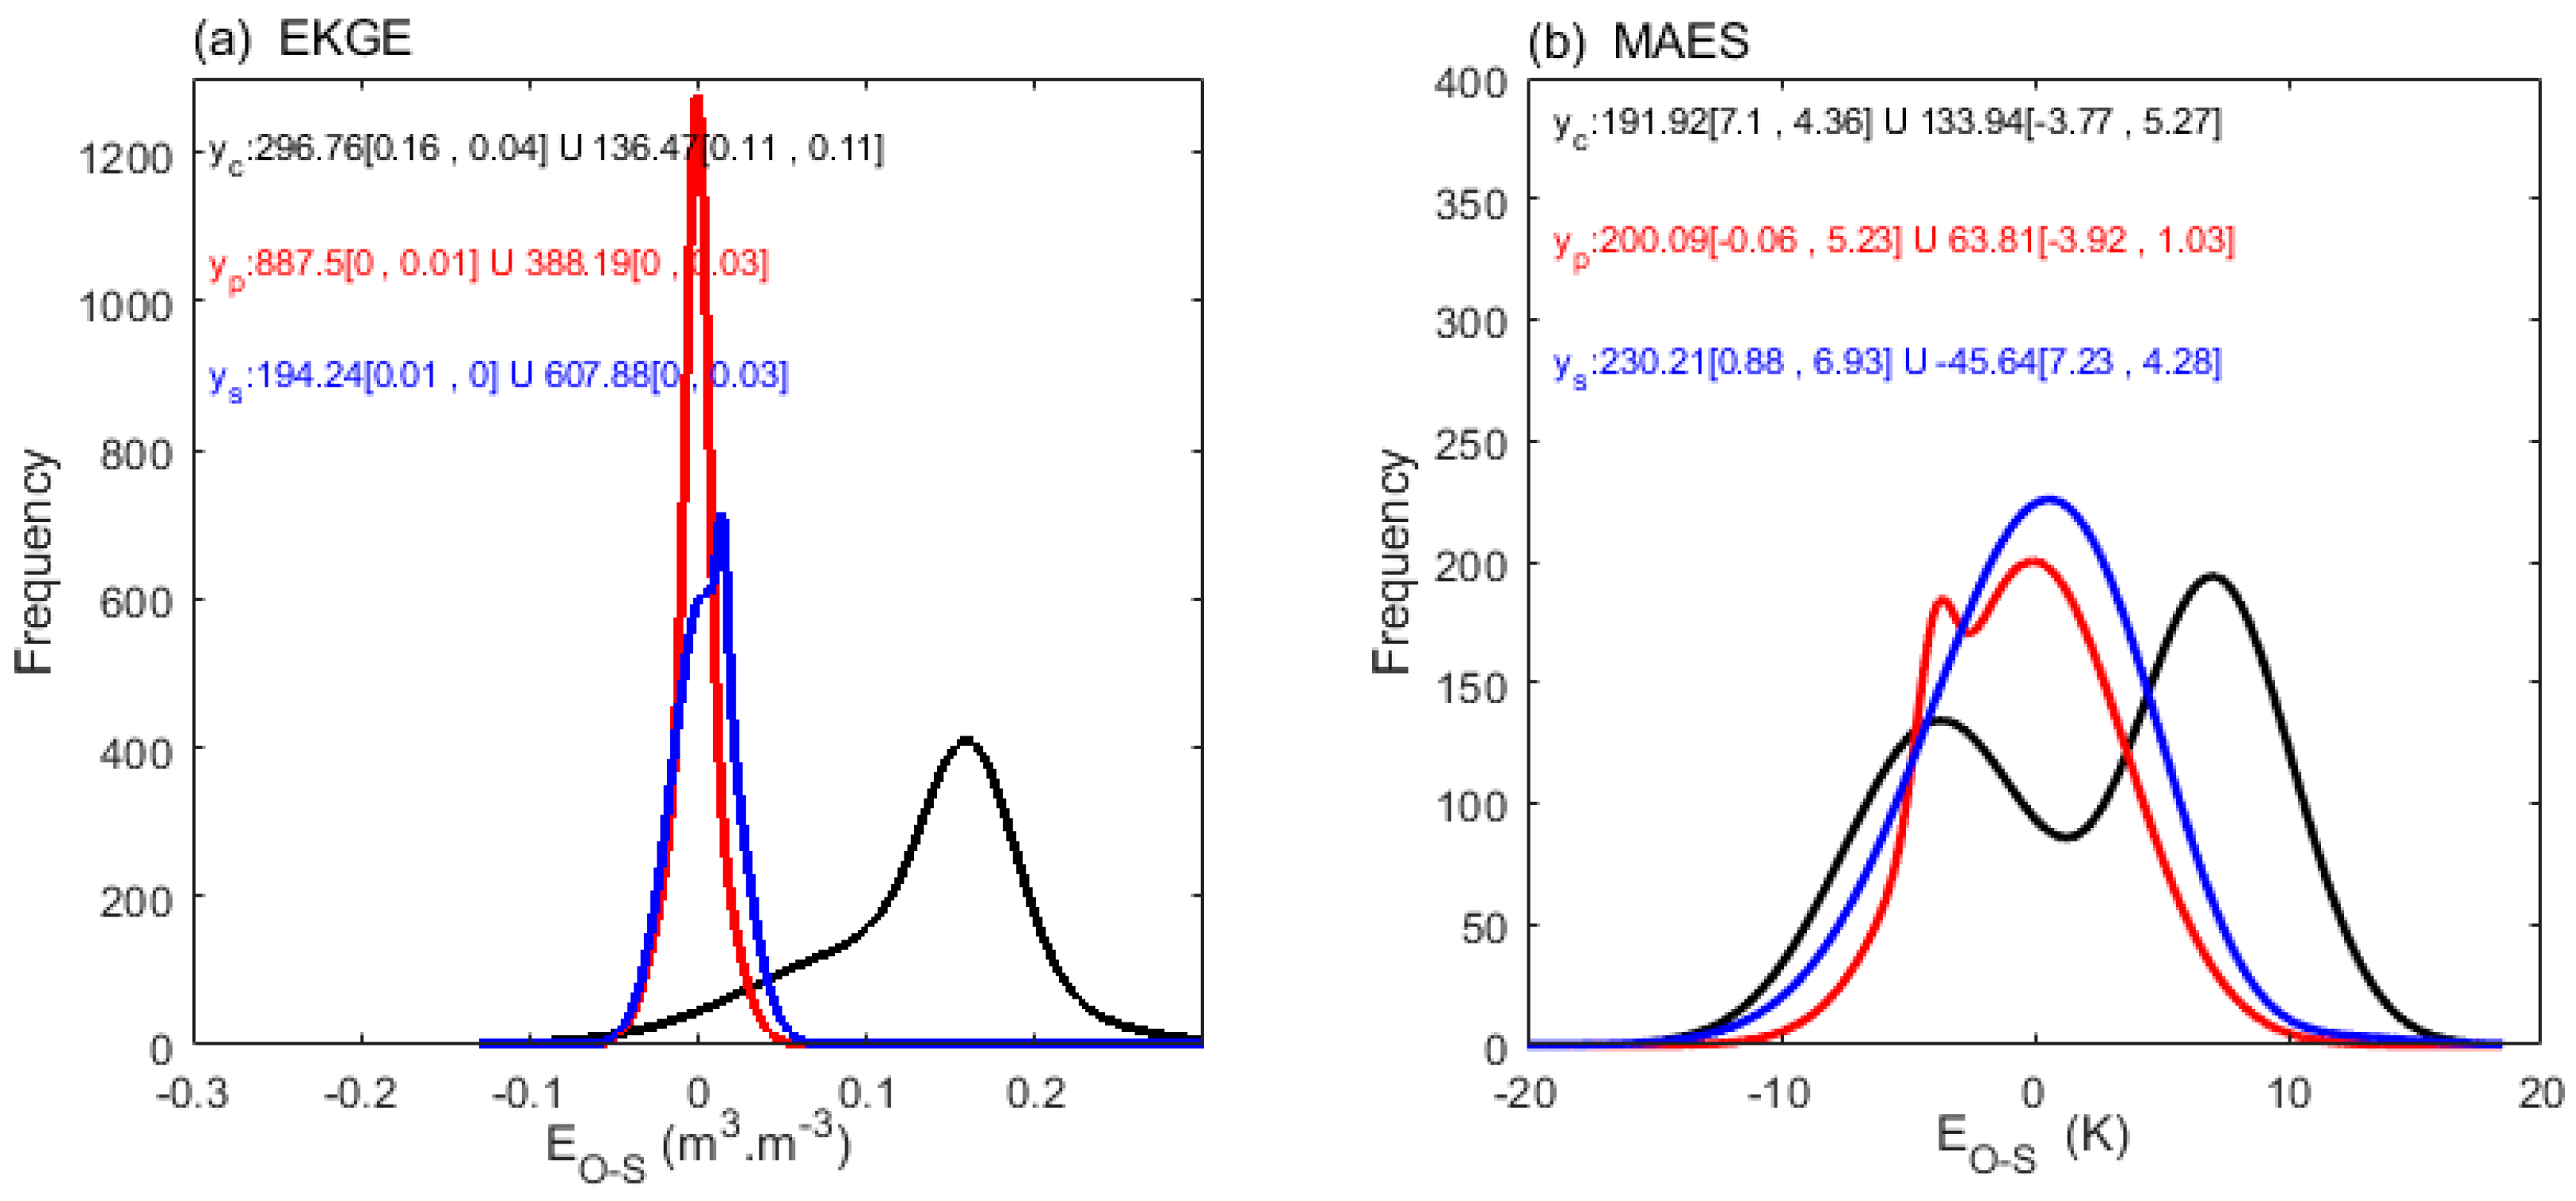
| EKGE | 1276, 0 | 608, 0 | 142, 4.37 | 204, 2.48 |
| EMO | 1178, 0 | 386, 0.01 | 170, 0.85 | 206, 1.23 |
| MAES | 344, 0.01 | 416, 0.02 | 200, -0.06 | 230, 0.88 |
| NSES | 274, 0.05 | 230, 0.05 | 169, 5.86 | 213, 5.03 |
| PKGE | 322, 0.08 | 325, 0.11 | 237, 4.91 | 152, 5.01 |
| PMO | 480, 0.02 | 444, 0.03 | 300, 6.10 | 224, 5.19 |
| RMSES | 426, -0.02 | 296, 0 | 200, 0.16 | 206, 1.29 |
| Metrics | PSO SM (s, r2) * | SCE SM (s, r2) | PSO ST (s, r2) | SCE ST (s, r2) |
|---|---|---|---|---|
| CCS | -0.32, 0.08 | -0.07, 0.02 | 0.04, 0 | 0.15, 0.04 |
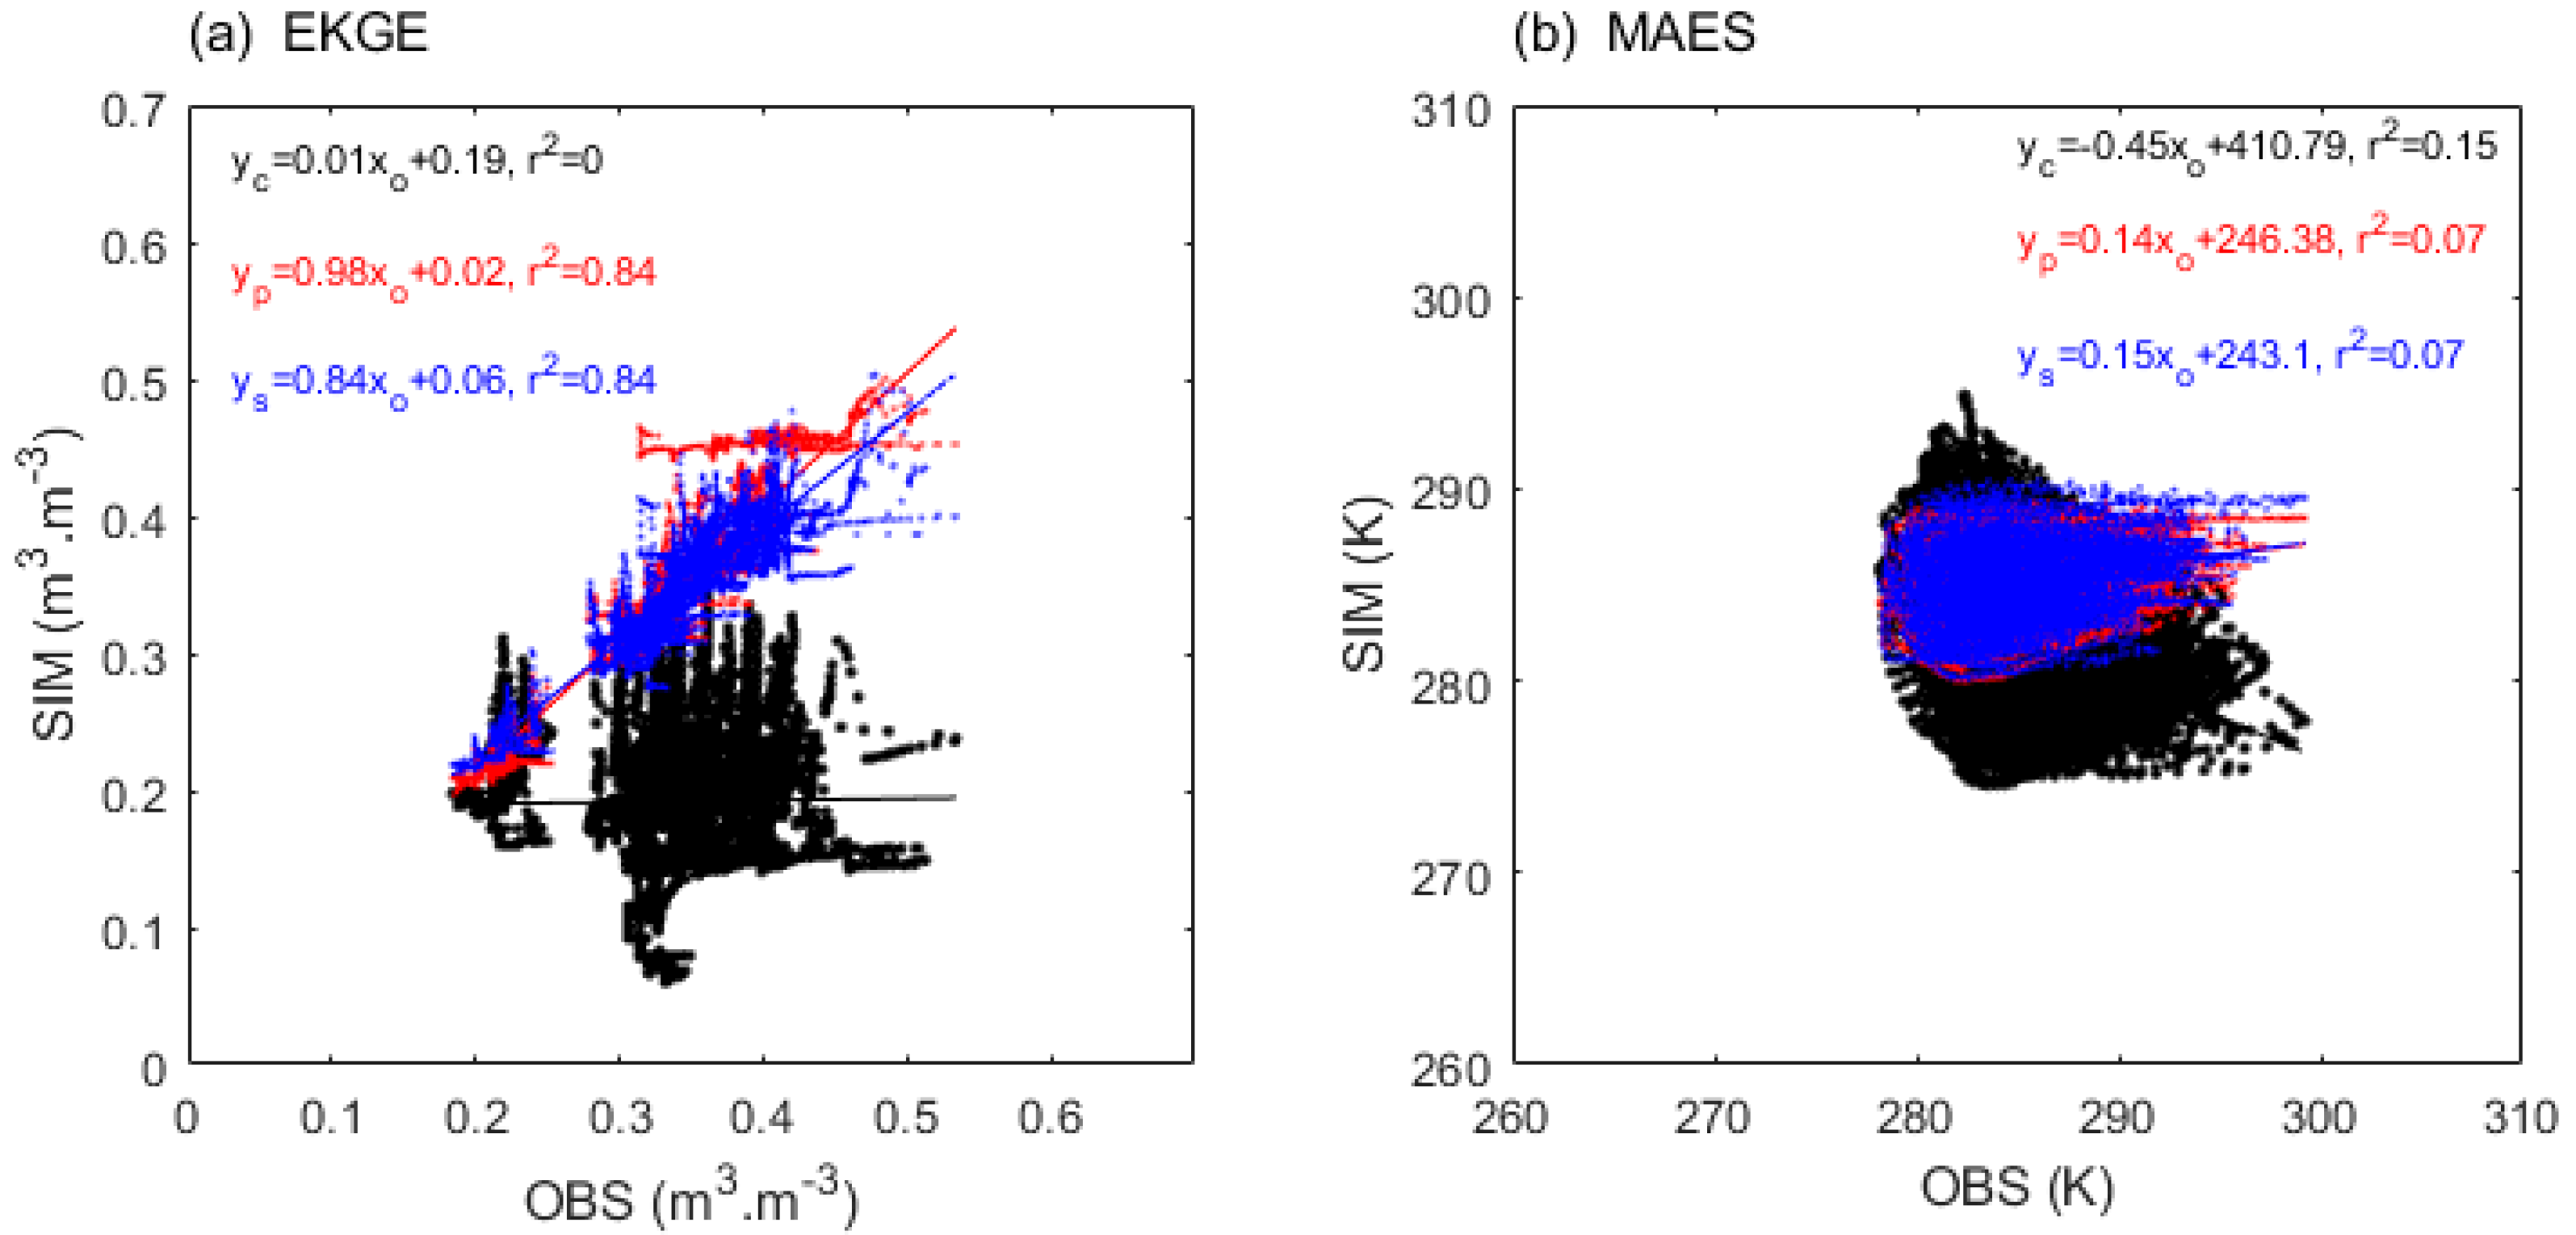
| EKGE | 0.98, 0.84 | 0.84, 0.84 | 0.04, 0.01 | 0.1, 0.04 |
| EMO | 0.96, 0.78 | 0.86, 0.82 | 0.09, 0.08 | 0.1, 0.07 |
| MAES | 0.83, 0.58 | 0.42, 0.37 | 0.14, 0.07 | 0.15, 0.07 |
| NSES | 0.75, 0.45 | 0.31, 0.27 | -0.45, 0.07 | -0.33, 0.05 |
| PKGE | -0.04, 0 | -0.21, 0.14 | -0.53, 0.1 | -0.54, 0.1 |
| PMO | 0.52, 0.30 | 0.46, 0.31 | -0.58, 0.11 | -0.46, 0.09 |
| RMSES | 0.77, 0.56 | 0.16, 0.08 | 0.13, 0.08 | 0.14, 0.09 |
| Metrics | PSO SM (f, c) * | SCE SM (f, c) | PSO ST (f, c) | SCE ST (f, c) |
|---|---|---|---|---|
| CCS | 189, 0.15 | 225, 0.07 | 187, 3.2 | 181, -0.38 |
| EKGE | 383, 0 | 363, 0 | 143, -0.09 | 189, 3.39 |
| EMO | 416, 0 | 359, 0 | 175, -1.41 | 148, -0.98 |
| MAES | 359, -0.01 | 284, 0 | 181, 0.49 | 206, 0.29 |
| NSES | 343, 0.06 | 322, 0.05 | 204, 5.81 | 210, 4.56 |
| PKGE | 234, 0.13 | 365, 0.06 | 214, 4.9 | 217, 5.69 |
| PMO | 367, 0.01 | 323, 0.04 | 221, 6.17 | 187, 5.47 |
| RMSES | 293, -0.02 | 326, 0.01 | 194, 0.55 | 198, 0.32 |
Disclaimer/Publisher’s Note: The statements, opinions and data contained in all publications are solely those of the individual author(s) and contributor(s) and not of MDPI and/or the editor(s). MDPI and/or the editor(s) disclaim responsibility for any injury to people or property resulting from any ideas, methods, instructions or products referred to in the content. |
© 2024 by the authors. Licensee MDPI, Basel, Switzerland. This article is an open access article distributed under the terms and conditions of the Creative Commons Attribution (CC BY) license (http://creativecommons.org/licenses/by/4.0/).


