1. Introduction
In the last two decades a clear trend for developing of the emission-free and sustainable society is being observed and the transportation electrification plays an important role in this process [
1,
2,
3,
4]. Along the way of pursuing constantly growing goals in emission reduction, it is also important to develop technologies, which are energy-efficient and economically justified at the same time. It is especially important in automotive industry, as it is an extremely competitive market and the vehicle manufacturers are constantly forced to push the limits of their technology. It presents a great challenge to achieve this and maintain the product prize affordable for the customers.
It causes a demand for the everlasting optimization of the electrical drives’ in pursue of the cost and dimensions reduction. In this process it is desirable for both academia and industry to have access to highly optimized reference designs. One of the important examples why it is important, is a need to compare the developed new technologies with the current state-of-the-art solutions [
5]. In course of these actions, it is important that the new solutions and improvements are compared with the possibly competitive reference design, which also needs to be well-defined, i.e., the information about the product parameters and it’s performance should be reliable and validated.
The aim of this paper is to provide the readers with such a reference design model for the traction machine of the hybrid road vehicle, i.e., the traction motor from the 4th generation of the Toyota Prius. The Toyota Prius model series is one of the most impressive success stories on the electrified vehicles market. It is also very interesting to observe the consistent evolution and optimization of the consecutive versions of the hybrid transaxle from Toyota [
6,
7].
Since the 1st Prius generation produced in 1997-2003, the Interior Permanent Magnet Motor (IPMSM) is used as the traction machine. Unfortunately, there is not much public information regarding the first model. An important milestone for the researchers was the 2nd Prius generation produced in 2003-2009, as the detailed Finite Element Method (FEM) based electromagnetic model of it’s traction machine was made public thanks to the report [
8]. It aided many researchers worldwide, helping them to evaluate their own designs [
5] or to re-shape this construction to meet different system requirements [
9].
Other examples of the trend for supplying the academic community with the complete numerical model of the successful industrial product are the induction machine from the Tesla Model S60 [
10] and IPMSM from the BMWi3 [
11]
The 3rd Prius generation produced in 2009-2015 is the especially well-known design, thanks to the very comprehensive reverse engineering report from the Oak Ridge National Laboratory [
6]. This report contains very detailed information about the power electronics and machine together with the efficiency maps measured under different voltage levels. Nevertheless, the numerical data and the detailed machine geometry was not made public, so it is hard to use this machine as the reference design.
The 4th Prius generation was produced in 2015-2023, and since the 2023 the newest 5th generation model is on the market (according to the best authors’ knowledge, there are currently no reverse engineering reports available for the 5th generation model).
The drivetrain from the 4th generation model was reverse engineered by the Oak Ridge National Laboratory and the results were published in [
7]. Unfortunately, the level of published details was nowhere near as deep as for the previous model [
6].
Since the authors have used the traction machine from the 4th generation of the Toyota Prius during their research activities, they gained a detailed knowledge about it’s parameters and decided to share this knowledge with the community. The aim of this paper is to provide the researchers from different fields with the data useful for their particular research field.
The machine design engineers are provided with the full numerical FEM model of the machine developed in the Ansys Motor-CAD software [
12]. For the ones not using this particular tool, the full set of data required to build that model in the different software is provided. The data include the detailed machine geometry in vector file format and material properties.
The drive control engineers are provided with the flux linkage and inductance maps of the machine, which are necessary for the dynamic modelling of the machine and the control system design.
The system engineers are provided with the numerical data for the optimal operational points map.
Finally, the drivetrain, vehicle and heat transfer engineers are provided with the efficiency and loss maps of the machine.
2. Materials and Methods
2.1. Basic System and Machine Information
The machine under consideration is the traction machine from the 4th generation of the Toyota Prius Hybrid Transaxle (called P610 according to the nomenclature of the Toyota). The construction of the whole transaxle is described in documents of Toyota [
14,
15,
16]. The video [
17] showcases the inner construction of the transaxle and explains its manner of operation.
The hybrid drive of Toyota consists of the Internal Combustion Engine, Electrical Generator and Traction Motor, all connected together via sophisticated power split device. The traction machine is connected to the ring gear (output) of the planetary gear and drives the vehicle wheels thorough the differential gear.
The maximal values of traction motor parameters are given in [
14,
15,
16]. They include maximal power, torque and speed values. The machine is supplied by IGBT based, two-level voltage inverter. The DC-link of the inverter is supplied from the battery thorough the boost DC/DC converter, which boosts the battery voltage from 200 V to 600 V [
7]. The set of the most important drive parameters is summarized in
Table 1.
The traction machine is of the Interior Permanent Magnet Motor (IPMSM) type. The pictures of the machine are depicted in
Figure 1. In contradiction to the previous transaxle versions, the hairpin winding was utilized for the first time in this model (see [
6] for comparison of different motor constructions from Toyota).
2.2. Machine Geometry and Materials
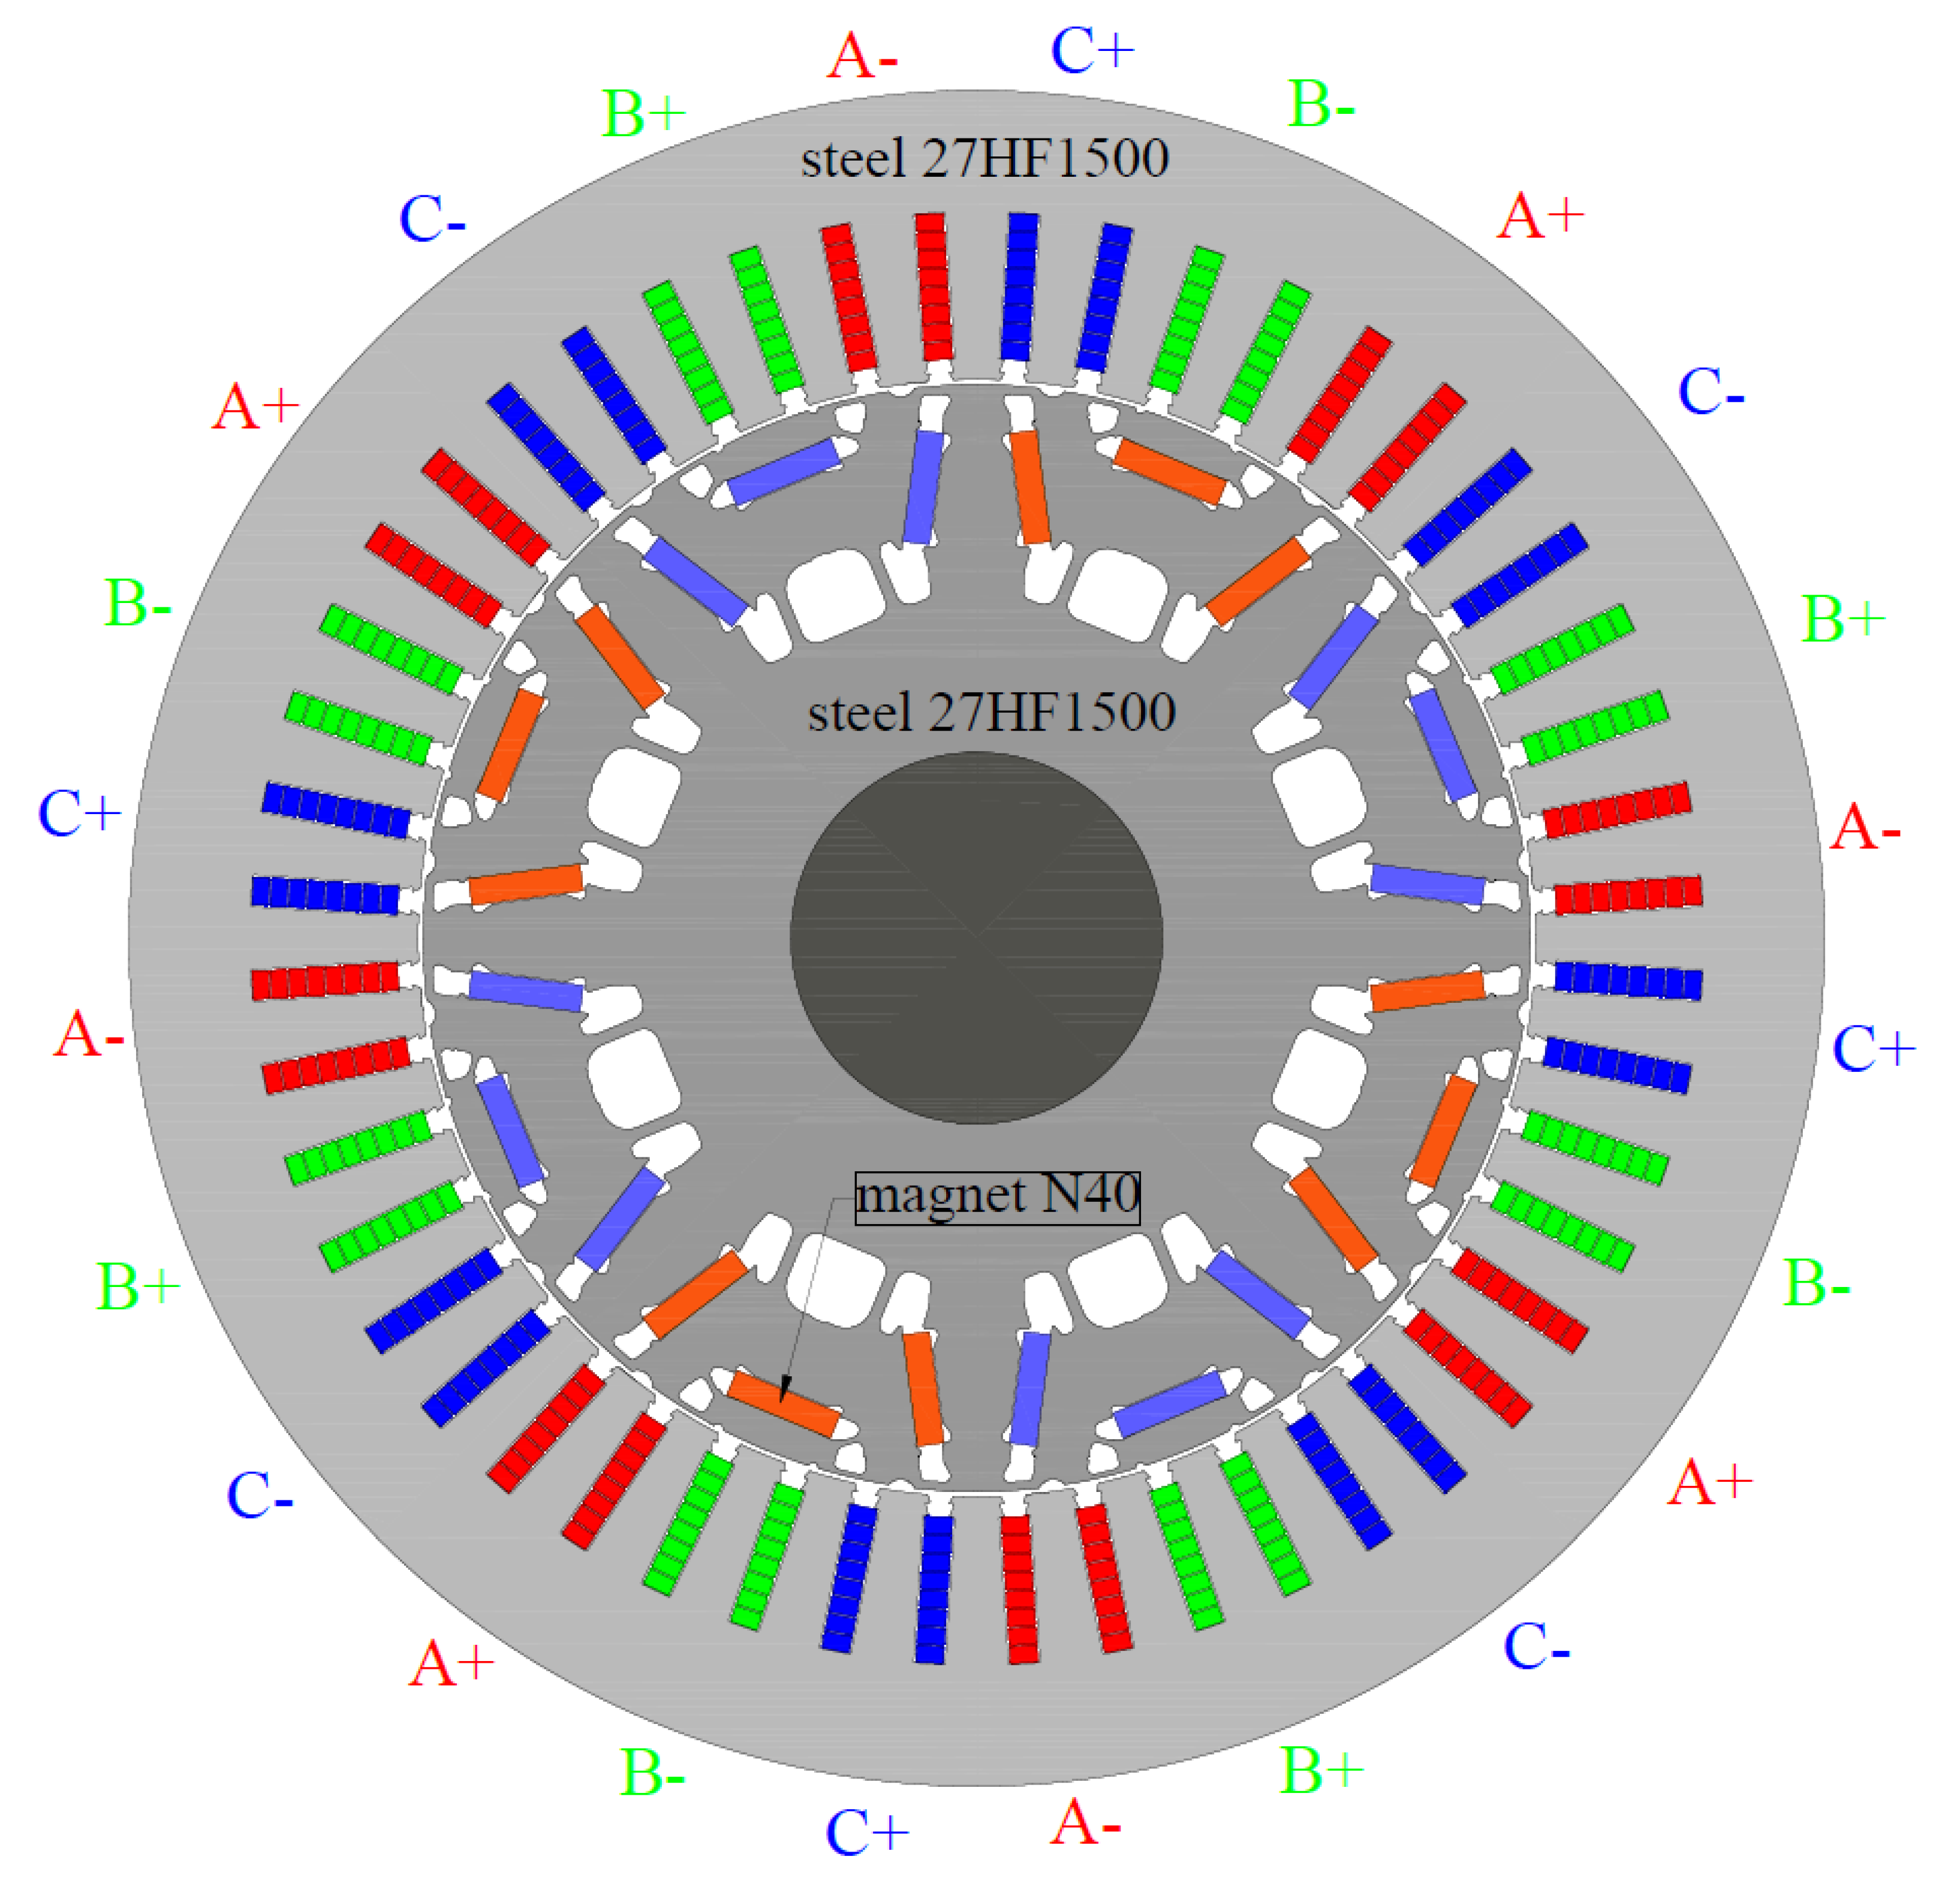
The machine geometry and the used materials are depicted in
Figure 2. The main dimensions are summarized in
Table 2. The machine has
pole pairs. The stator has 48 slots of rectangular shape and the winding is a distributed winding type made of segmented rectangular rods of the hairpin type. The direction of current in each coil side is depicted in
Figure 2. Letters A, B and C are phase names. ’+’ means current flowing into the drawing plane. ’-’ means current flowing out of the drawing plane.
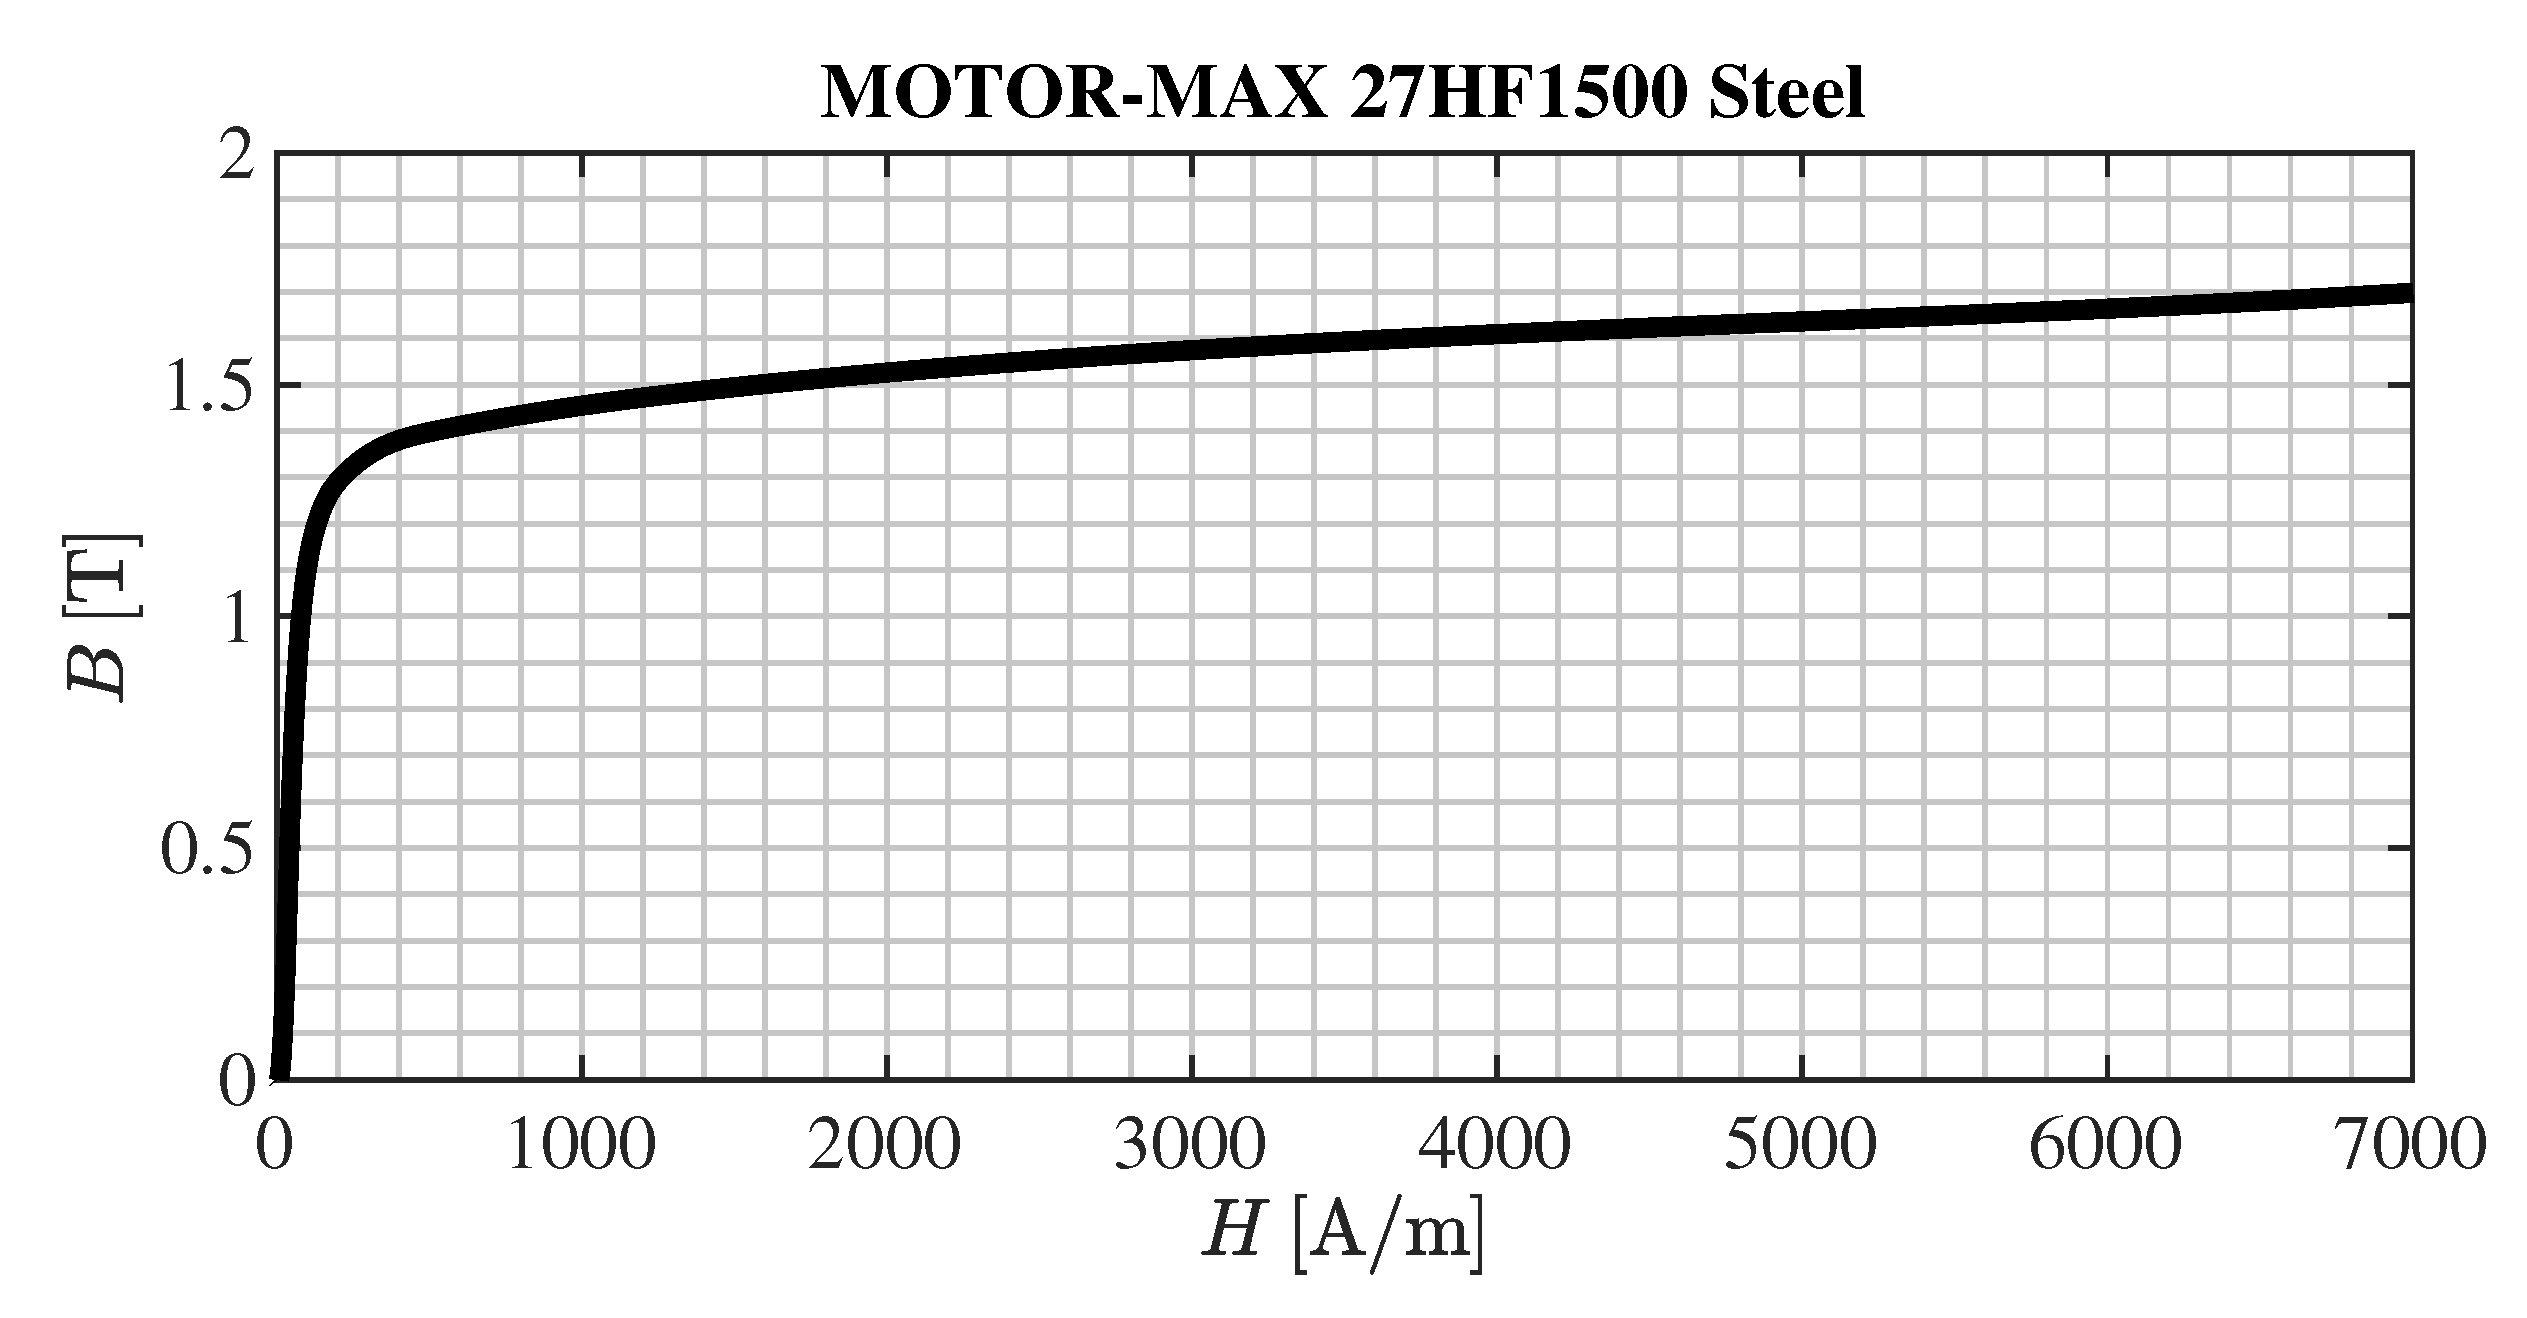
Both stator and rotor cores are made of the steel sheets of 0.27 mm thickness. It was found out that the steel MOTOR-MAX 27HF1500 from Cleveland-Cliffs was utilized in both stator and rotor [
18]. The
-curve of this steel is depicted in
Figure 3. The detailed steel parameters in numerical form are supplied to the reader as the Supplementary Materials attached to this paper (file ’SteelCharacteristics.xlsx’).
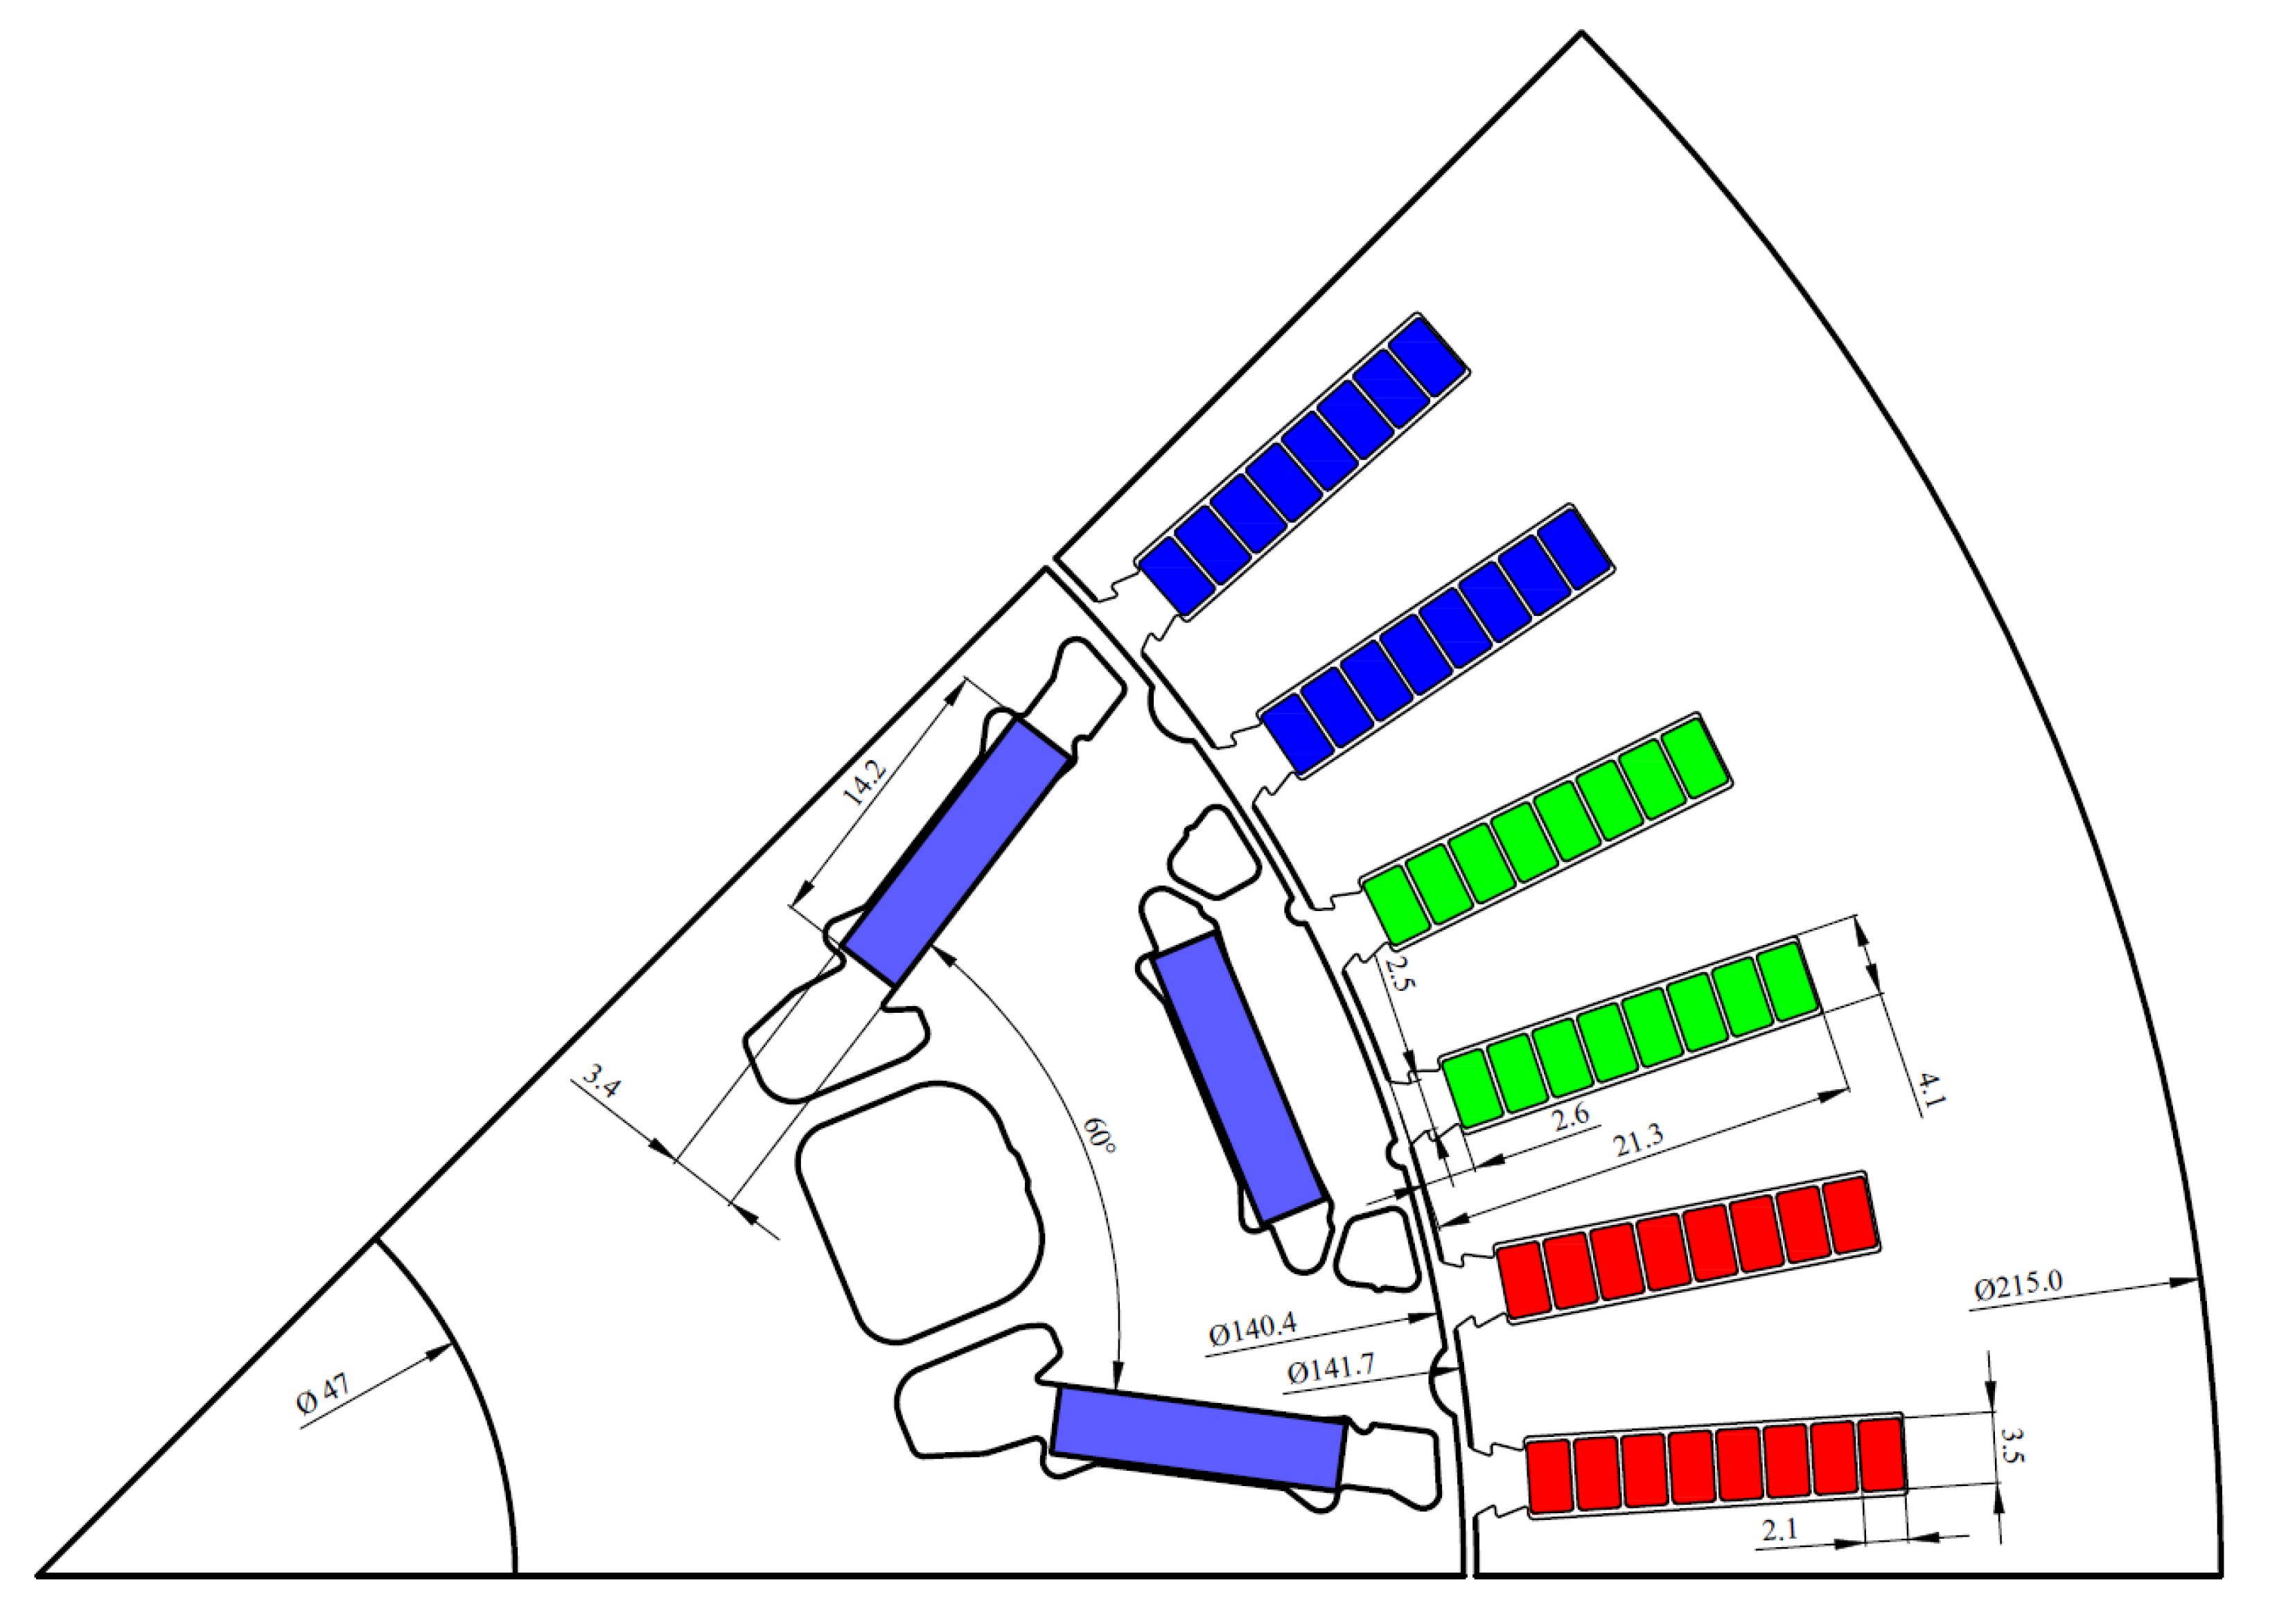
The more detailed geometry zoomed at one pole is depicted in
Figure 4. The detailed geometry in vector format is supplied to the reader as supplementary material to this paper (files ’GeometryFull.dxf’ and ’GeometryOnePole.dxf’).
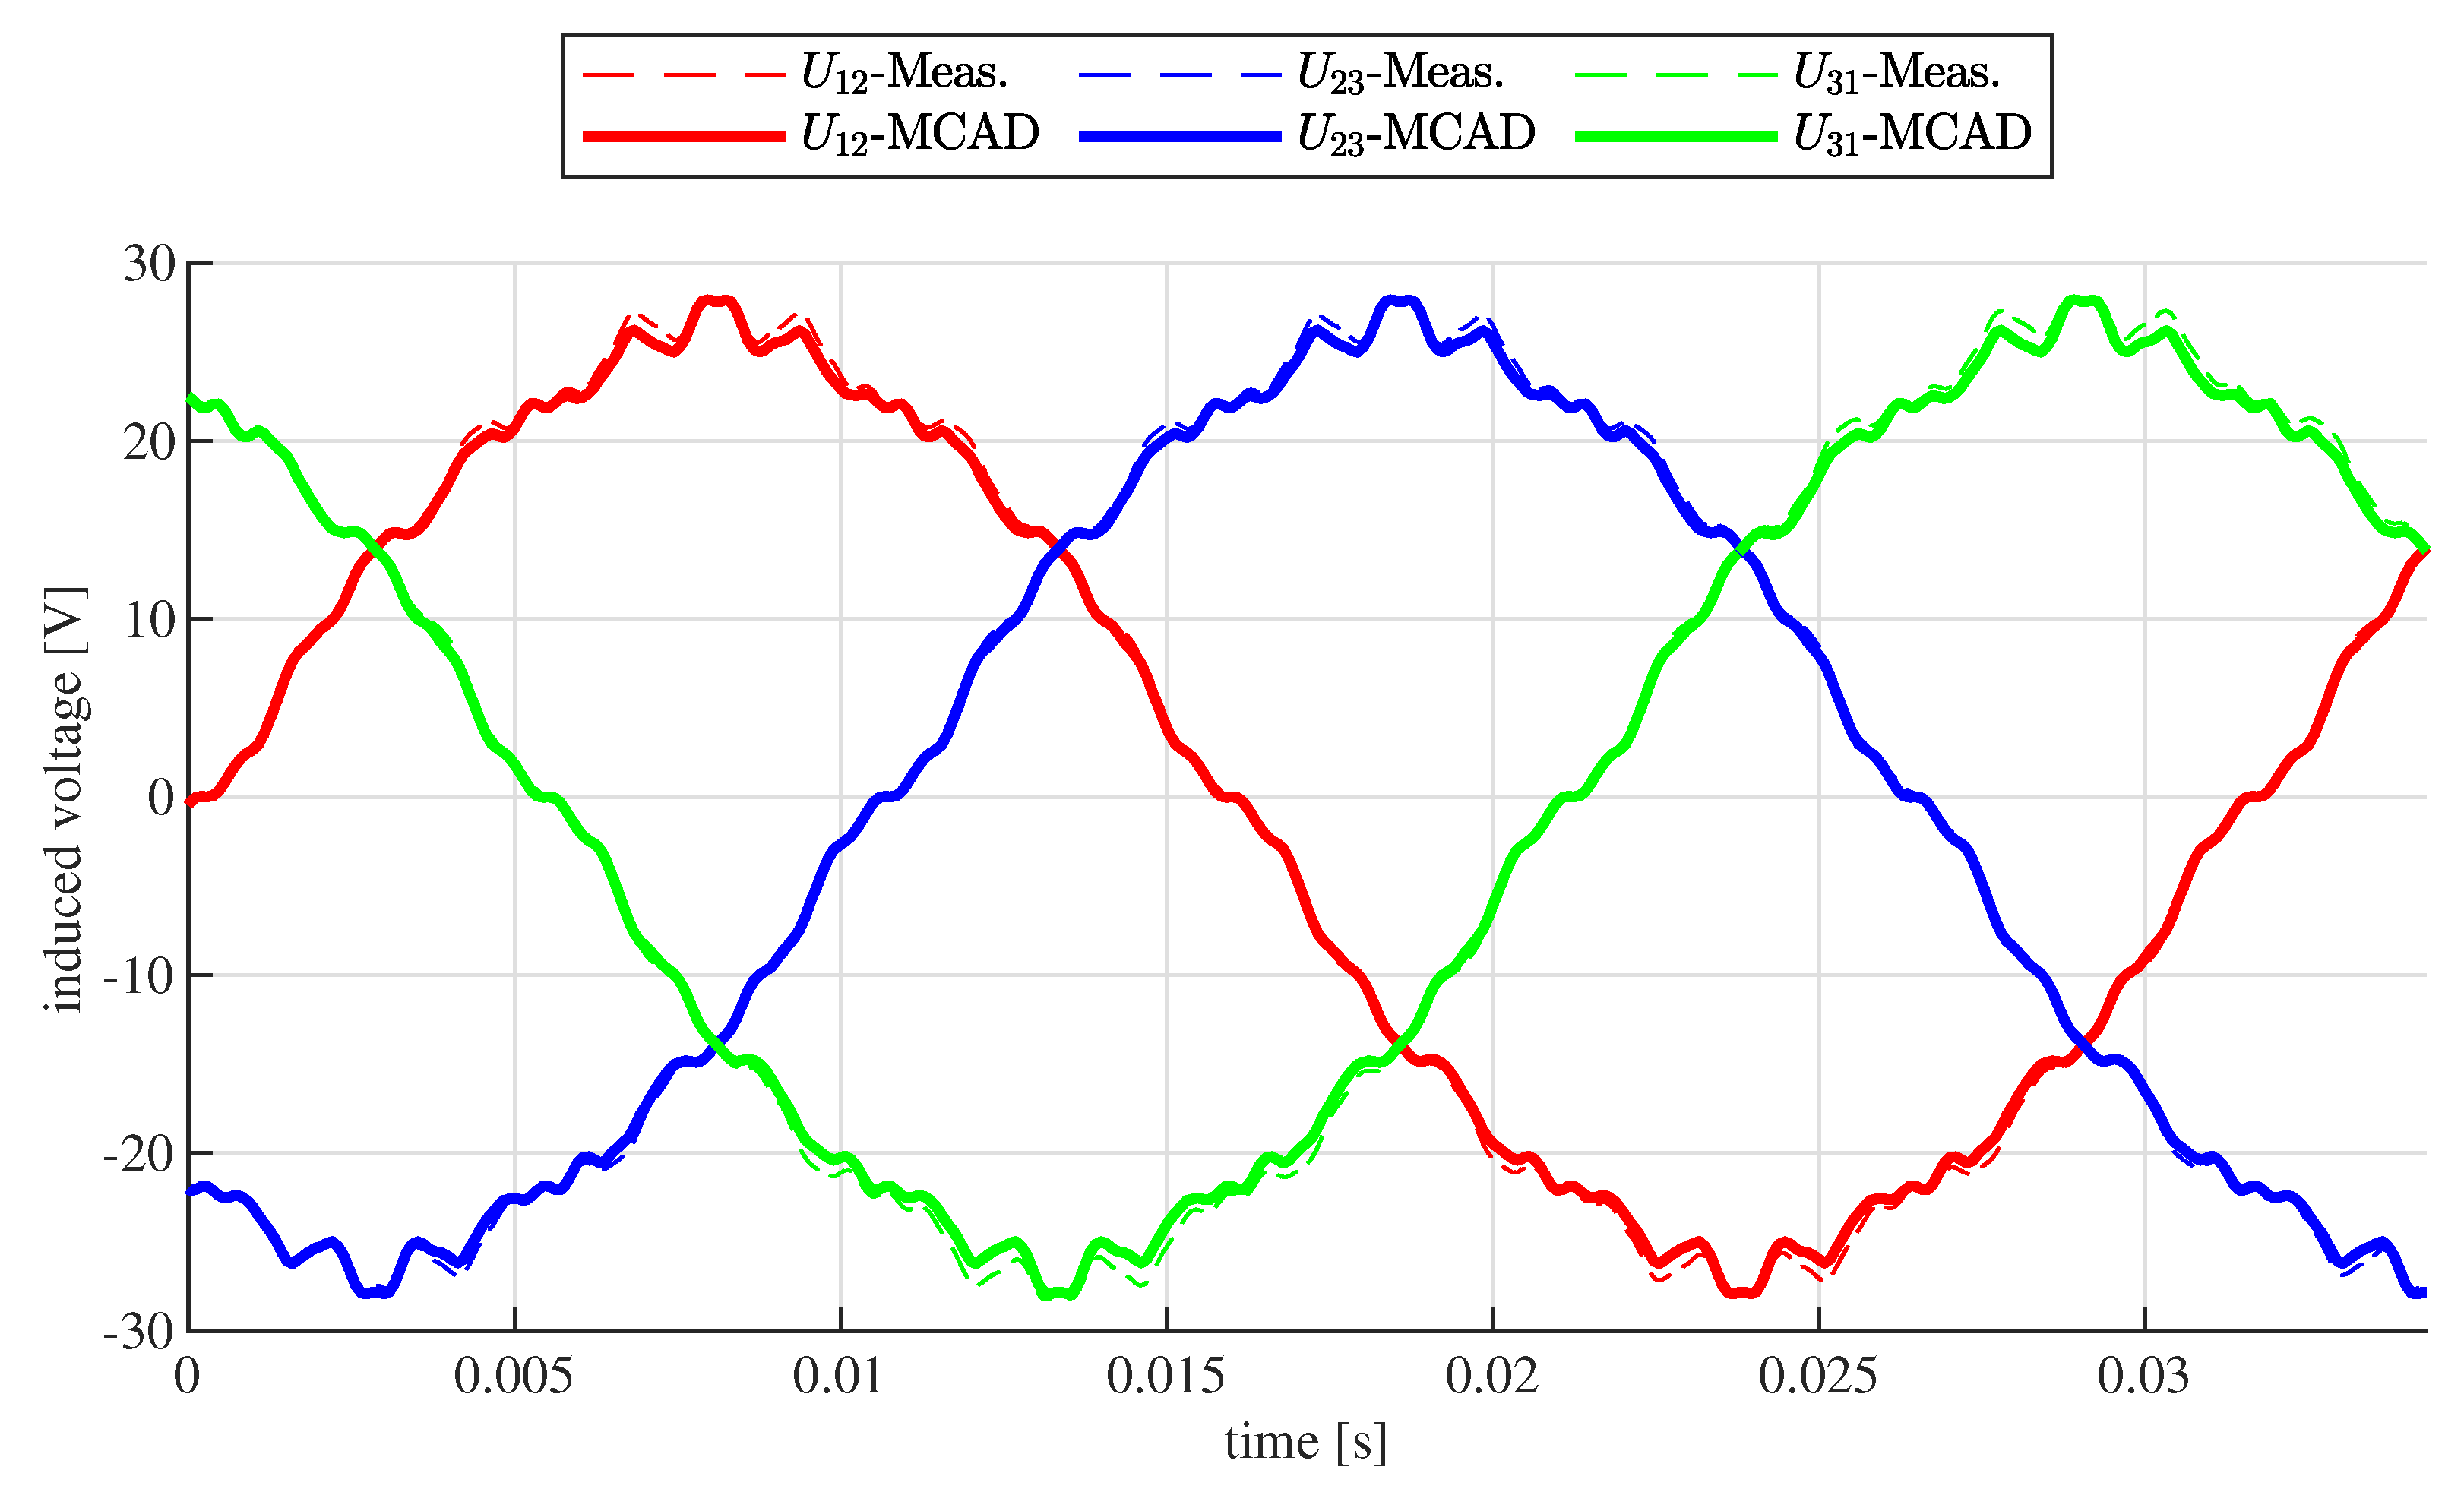
The characteristics of the magnet were found out based on the induced voltage test. The motor was run via external drive with a constant speed of
rpm and the open-winding line voltages were measured. The test results are depicted in
Figure 5 (dashed lines).
Afterwards, the established simulation model (Motor-CAD [
12]) was run with many different values of remanent flux density
. Via trial and error technique it was found out that the value of the
T gives the best matching between the induced voltage values obtained in simulation and the experimental results. Since the experiments were conducted in the temperature of the 20 °C, the authors searched for the magnet, which has the obtained value of the remanent flux density
for that temperature. Finally, the magnet N40 was chosen as the candidate for the model, as the searched value of the remanent flux-density lies within it’s tolerance band [
19].
2.3. Winding Configuration
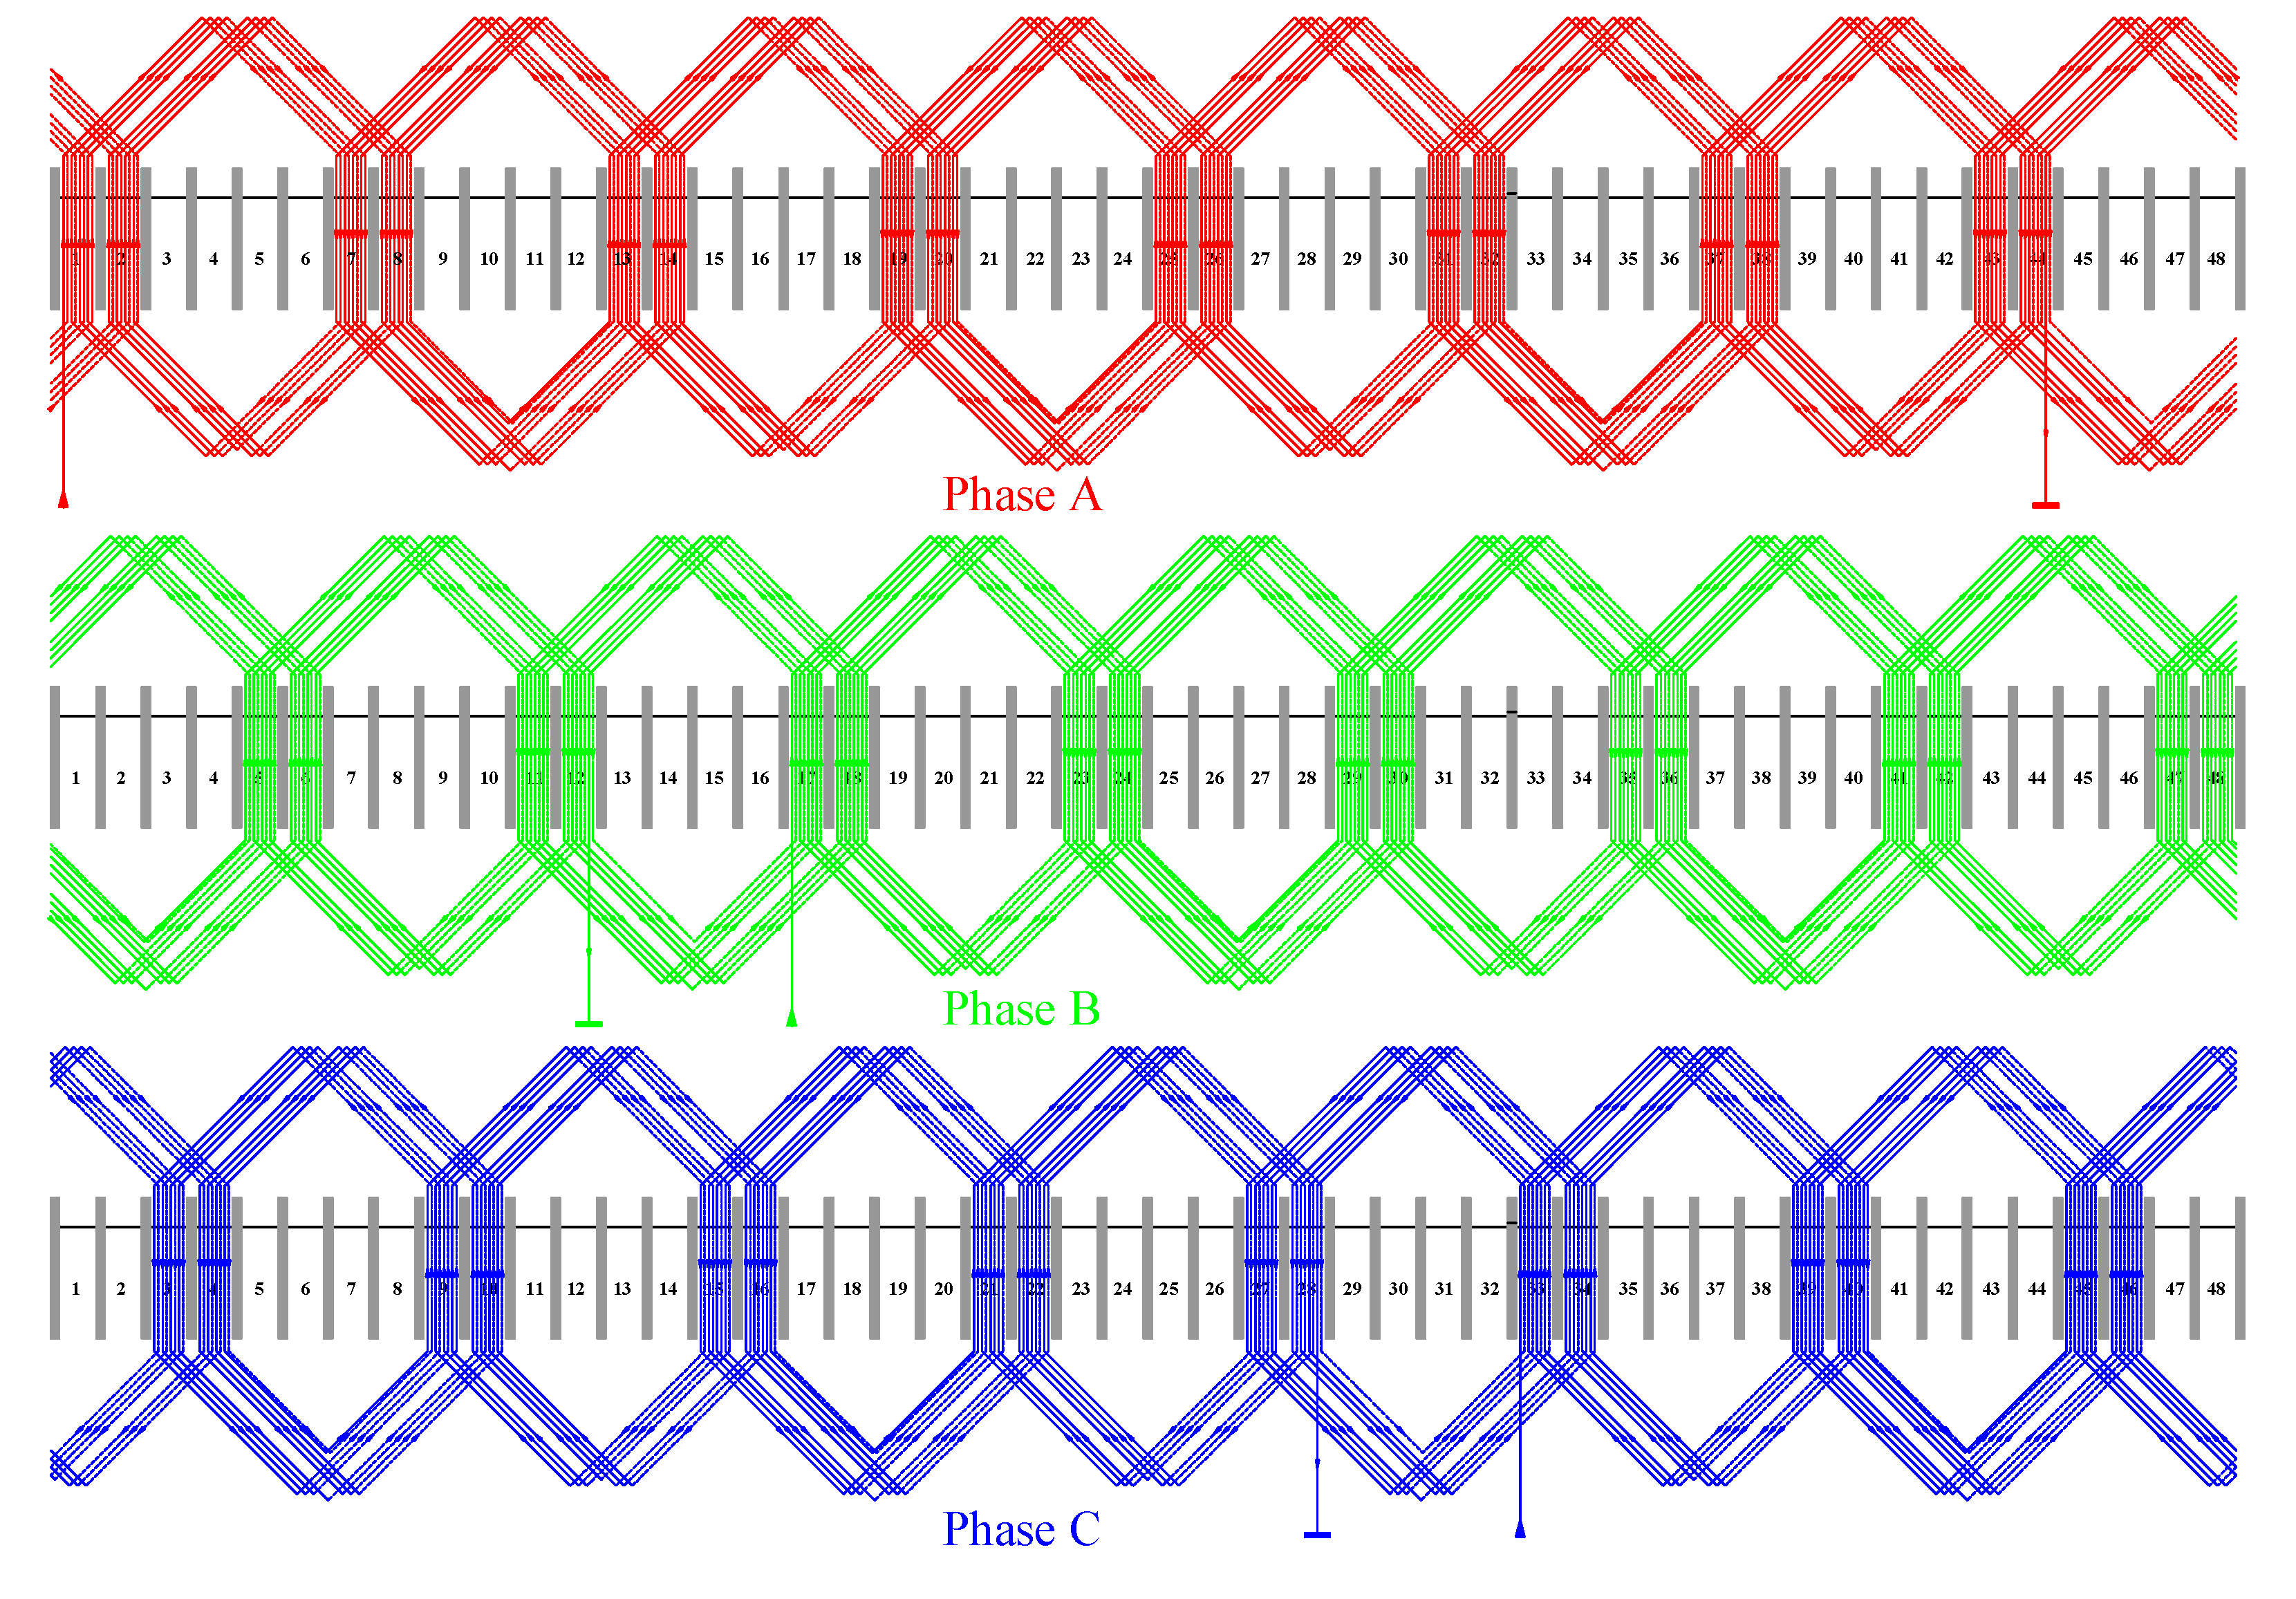
The winding for each phase consists of 8 groups (8 turns each) and all groups within one phase are connected in series. The coil span equals
slots (1→7). Number of slots per phase and pole
. The winding diagram is depicted in
Figure 6. The three phases are connected in star configuration with isolated neutral point. The resistance of one phase was found out to be equal
m
.
2.4. Finite Element Method Model of the Machine
Based on the information described above, the Finite Element Method (FEM) based simulation model of the machine was build in the Ansys Motor-CAD software (version 2023.2.2) [
12]. The model is supplied to the reader as supplementary material attached to this paper (file ’P610_v2_5_5.mot’).
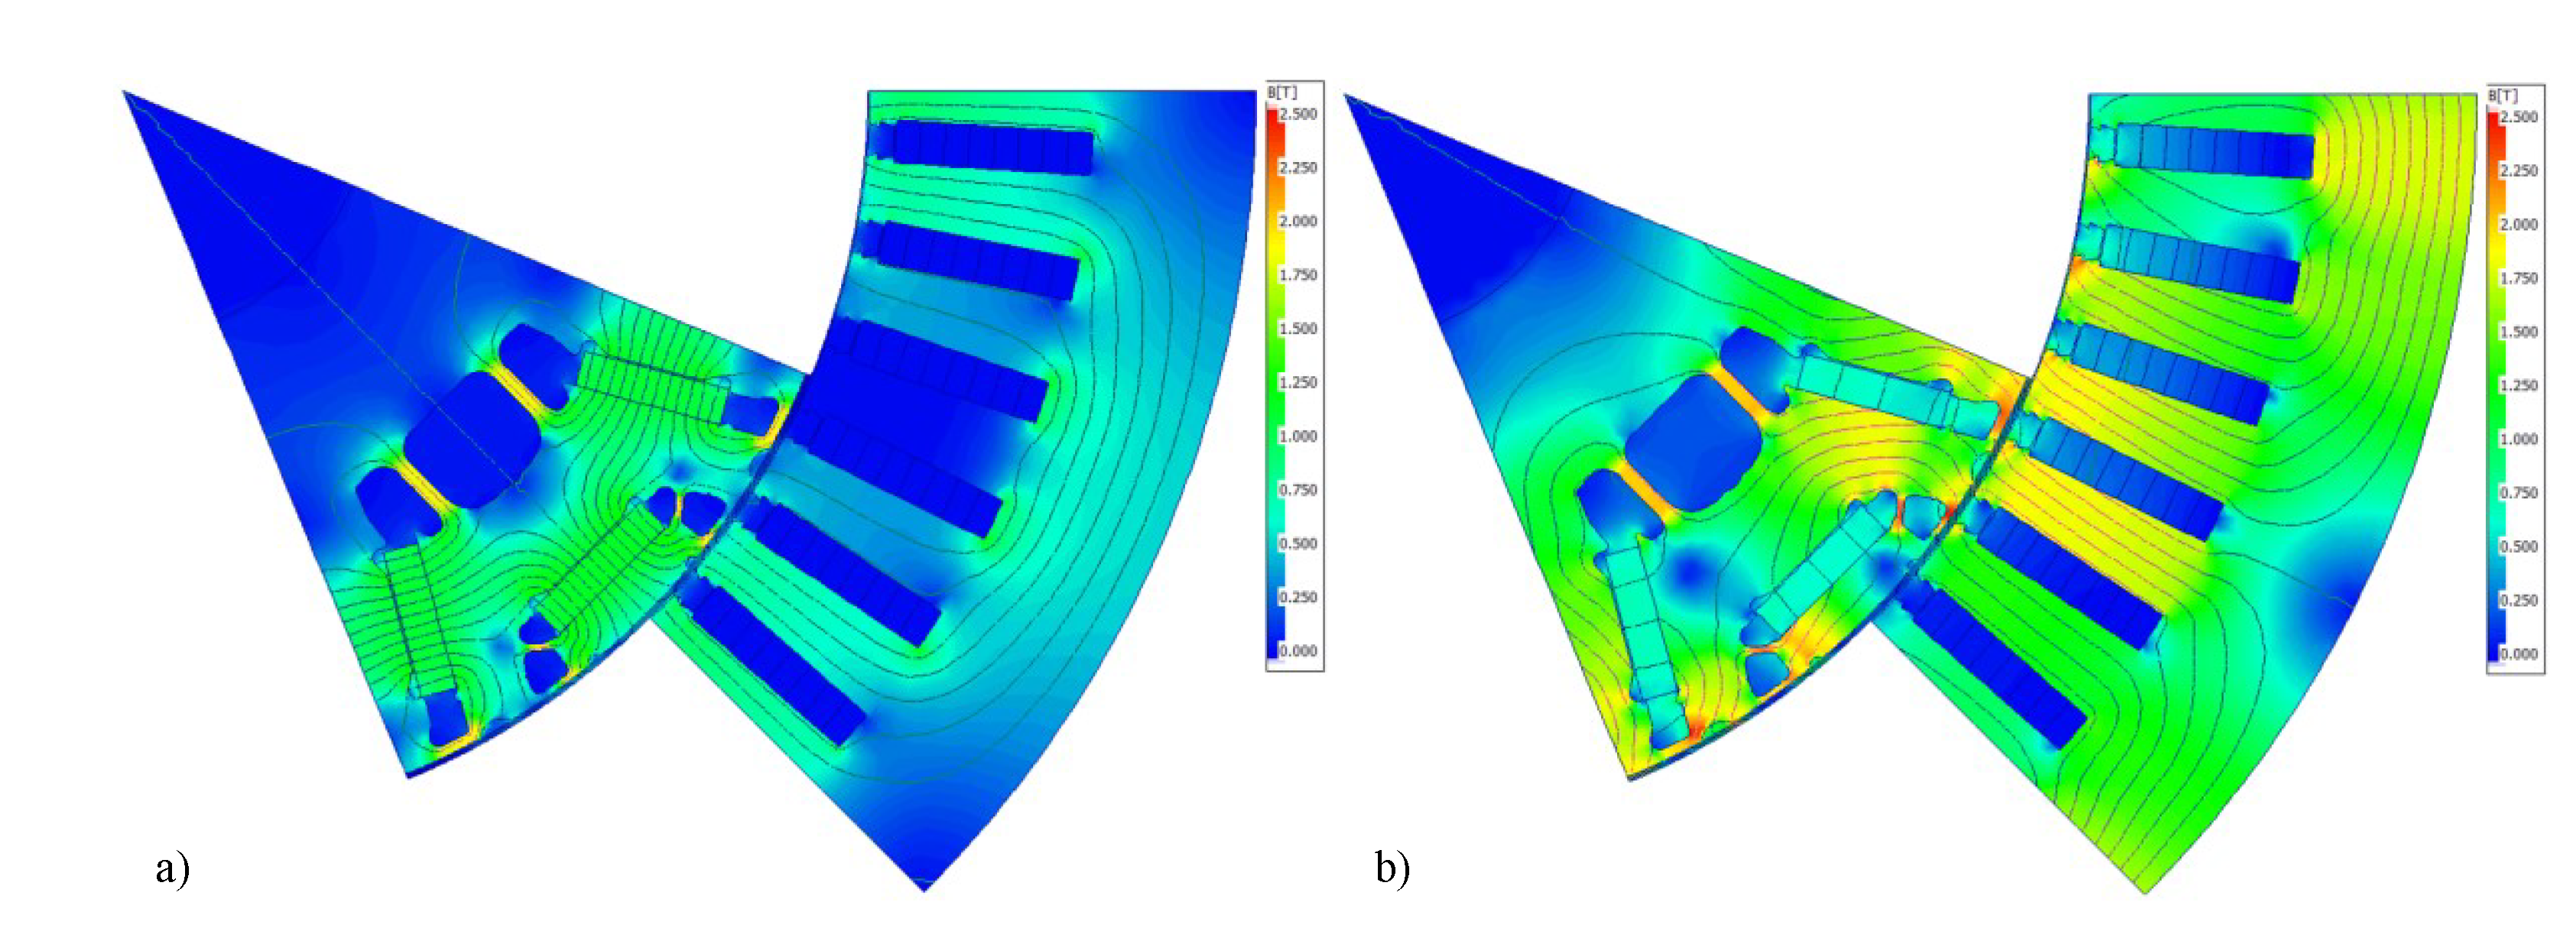
The exemplary simulation results obtained with the model are depicted in
Figure 7. In this example, the flux density distribution is shown for two cases. The first case (
Figure 7a) is the no-load operation of the drive, i.e., both the d-axis current
and q-axis current
are equal zero. The second case (
Figure 7b) is the motor operation with the maximal torque, i.e.,
A and
A.
The flux density distribution should be analyzed together with the
-curve of the steel (see
Figure 3). The ’knee’ of the steel characteristic lies about 1.3 T. Hence, the yellow areas at
Figure 7 indicate highly saturated regions (see the legend, yellow color starts above 1.75 T). During no-load operation (see
Figure 7a) only the ribs around the flux-barriers are highly saturated. The saturation of this region is a necessary feature of each IPMSM, as it allows to force the magnetic field outside of the rotor thorough the air gap. At maximal torque (see
Figure 7b), the bulk saturation can be observed in numerous regions of the machine, i.e., in rotor core, stator teeth and stator yoke. It indicates an extreme utilization of the steel material and the consequences of that are discussed in next sections of this paper.
2.5. Test Setup
In order to perform the experimental investigation of the machine, some manipulations had to be made in its mechanical construction. Normally, the machine is internal part of the transaxle and there is no direct access to its shaft from the outside. Additionally, the machine bearings are part of the transaxle enclosure, so it is not possible to easily take the machine out and run it at the test bench. Moreover, the machine is originally cooled using the oil. The stator is cooled with the oil mist sprayed over it from the outside. The rotor is cooled from the inside using the oil pumped through the channel going inside of the rotor and its shaft.
For the above reasons, the machine was dismounted from the transaxle and some additional mechanical parts needed to be designed. First of all, a new shaft and bearing shields were manufactured. Additionally, a cooling water jacket with a spiral channel was designed and manufactured.
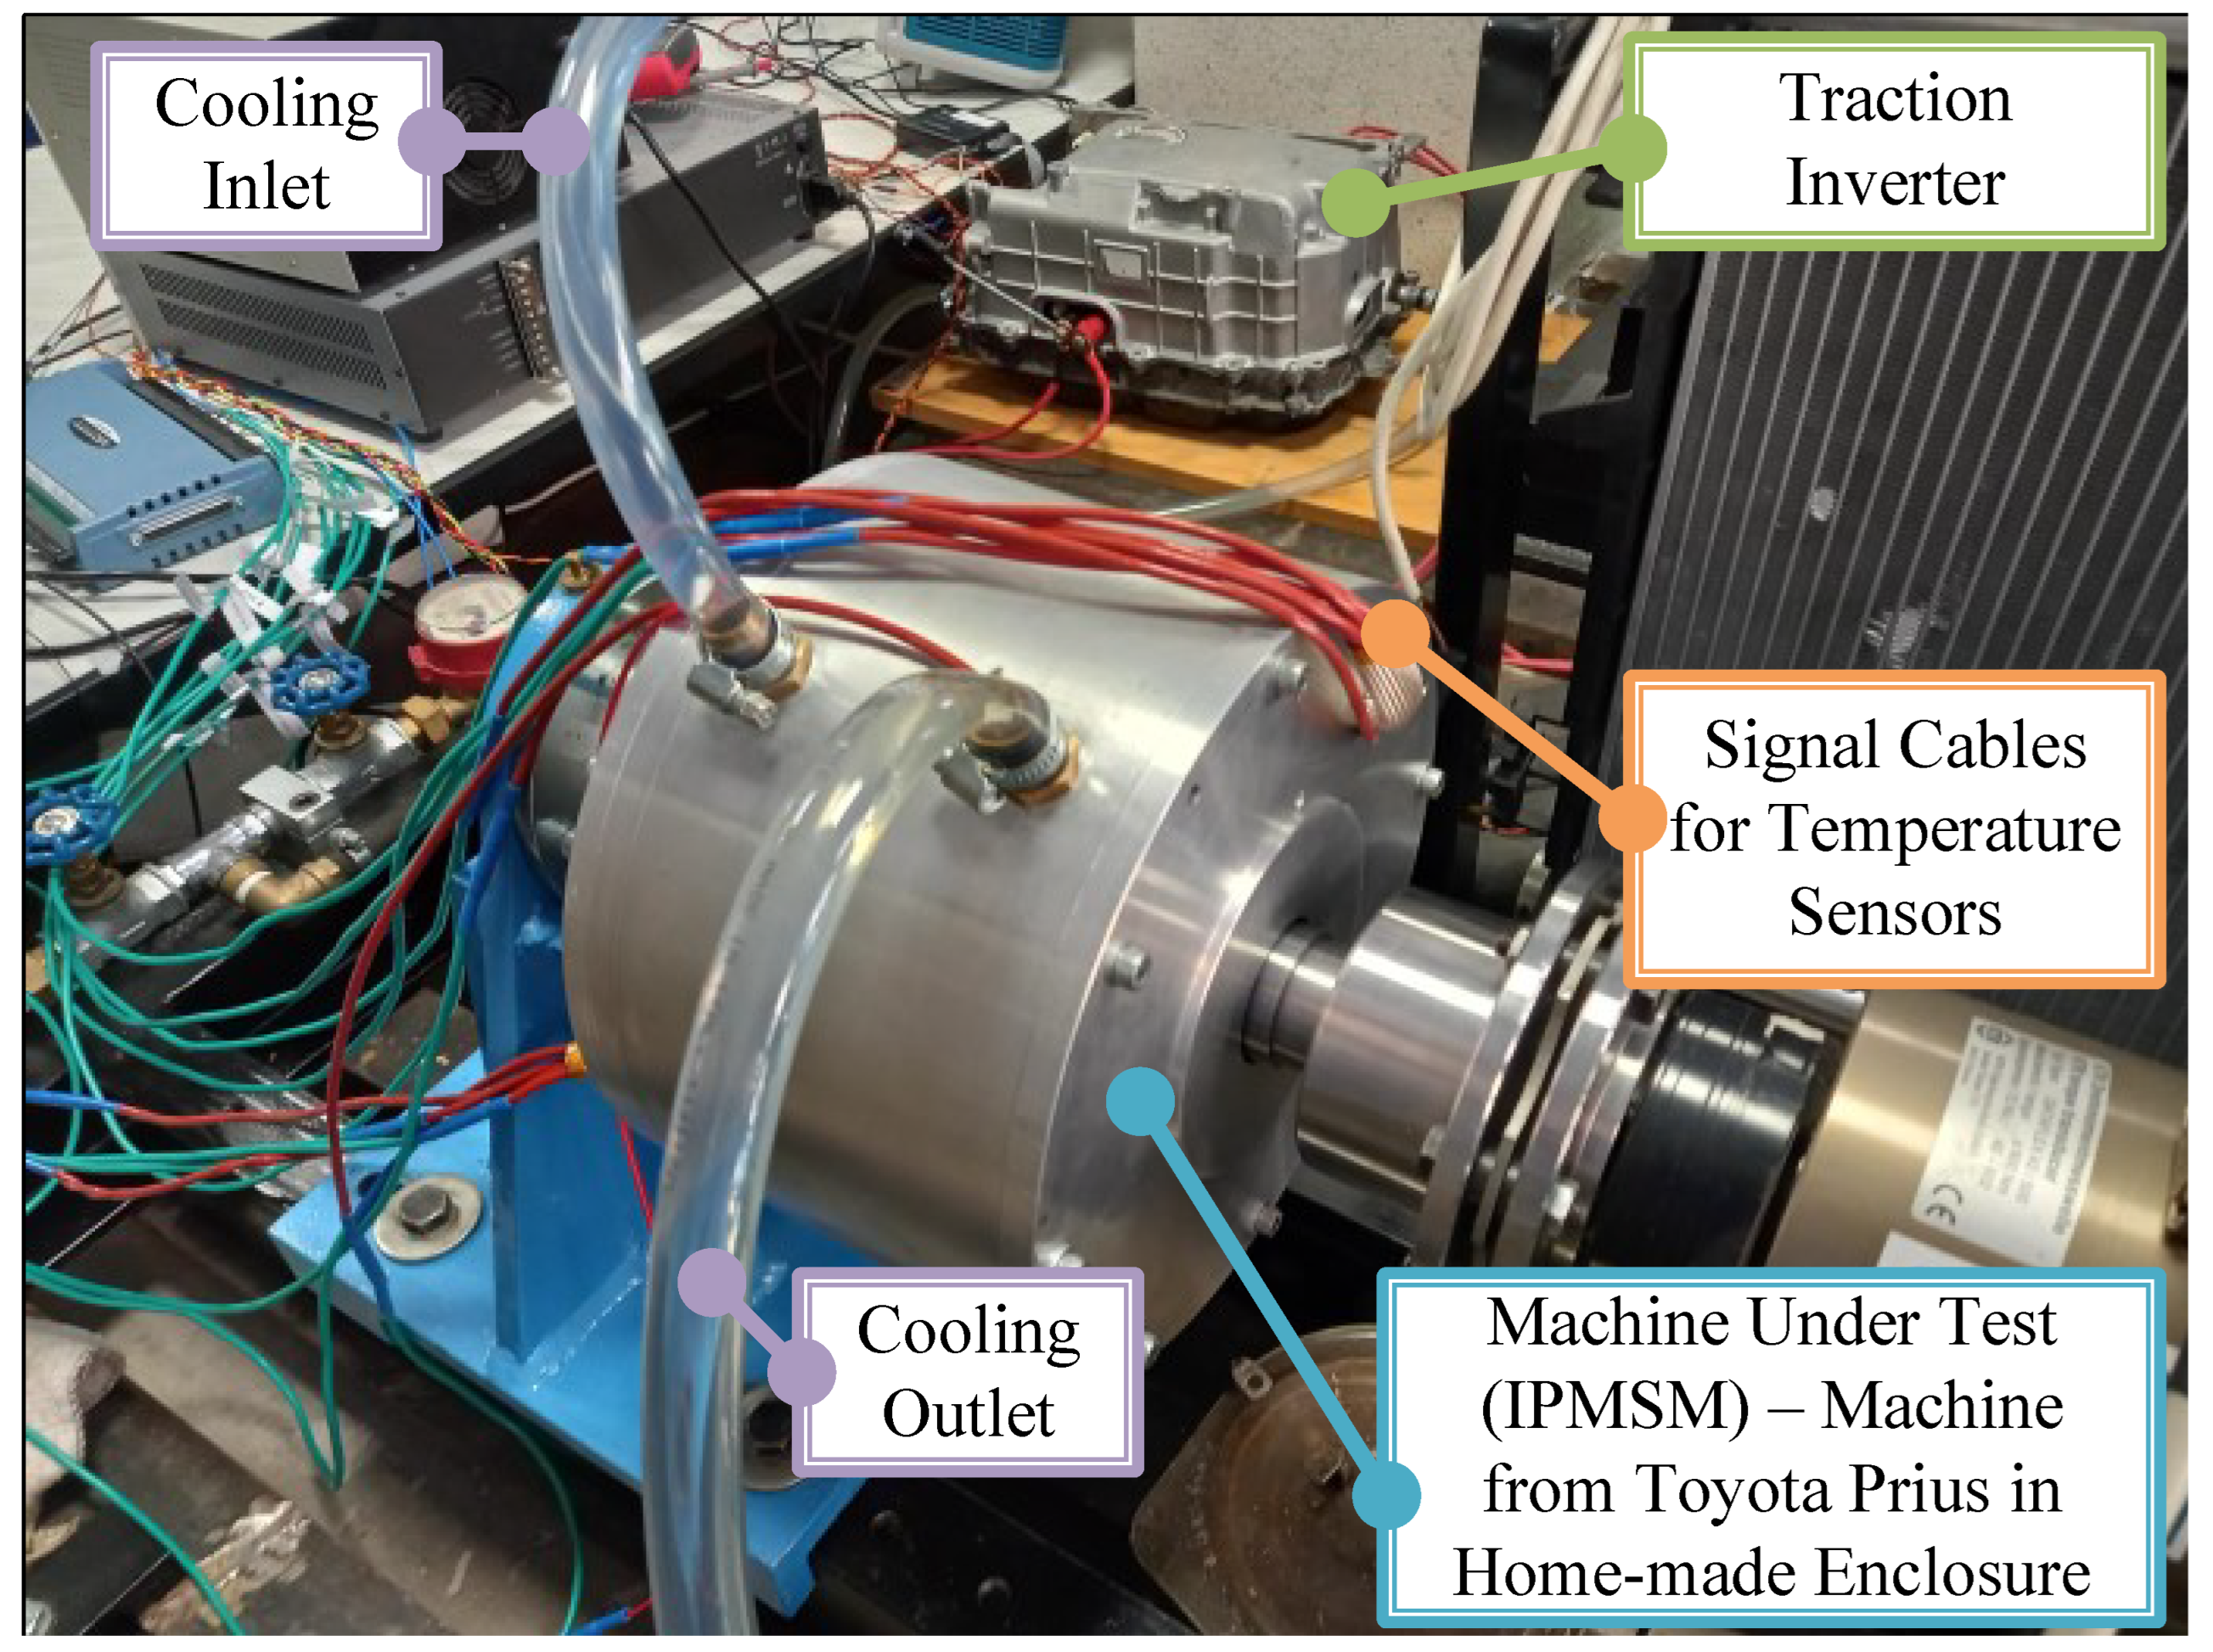
The picture of the motor closed in the home-made enclosure is depicted in
Figure 8. The motor shaft is connected with the auxiliary load drive via the torque measurement sensor DATAFLEX 42/200 from KTR. The auxiliary drive is responsible for controlling the speed at constant value during experiments. This drive is connected to the examined machine using the reduction gear of ratio 1:6 in order to rise it’s torque to the level required by the Prius machine. It results in the maximal speed limitation of the test bench at the level of
rpm. For this reason, the tests described in next chapter are performed at speed of
rpm, i.e., slightly under the maximal limit.
The motor is supplied from the two-level voltage inverter. The original power stage of the Toyota Prius was used, but it was complemented with the home-made control interface, in order to control the drive freely. The control interface was built using the TMS320F28335 digital signal processor from Texas Instruments. The authors have implemented their own Field-Oriented Control (FOC) algorithm allowing to set the desired current values in d- and q-axes.
Additionally, the machine was equipped with temperature sensors inside. Thanks to that it is possible to monitor the temperature of the cooling liquid and internal machine parts.
3. Results
3.1. Model Validation - Torque Measurements
For the model validation/tuning purposes the torque measurement test was conducted. The speed during the test was held constant at value of
rpm. The current was varied in such a way that it’s amplitude is constant and the angle of the current space vector was varied between 0 and 180 degrees in 10° increments. Such a test was conducted for many different values of the current amplitude. For each measurement point the
d- and
q-axis current components were calculated as:
where:
and
are
d- and
q-axis current components respectively [A],
is the current amplitude [A],
is the current space vector angle [°].
At the beginning, it was found out that the simulated torque values are much higher than the measured ones. The reason for that is the fact that the remanent flux density of the magnet decreases with rising temperature. During the experiments the machine parts heat up. Unfortunately the temperature of the magnets can not be directly measured as it is attached to the rotating part of the machine, but it is safe to assume that it reached temperatures higher than the 20 °C. It was found out that the best matching between the experimental and simulation results is achieved for the remanent flux density value of
T. As the N40 magnet has the reversible temperature coefficient of
%/°C it corresponds to the magnet temperature of the 40 °C [
19], which seems to be a reasonable value. Hence, all the following analyses are conducted assuming the magnet temperature of 40 °C.
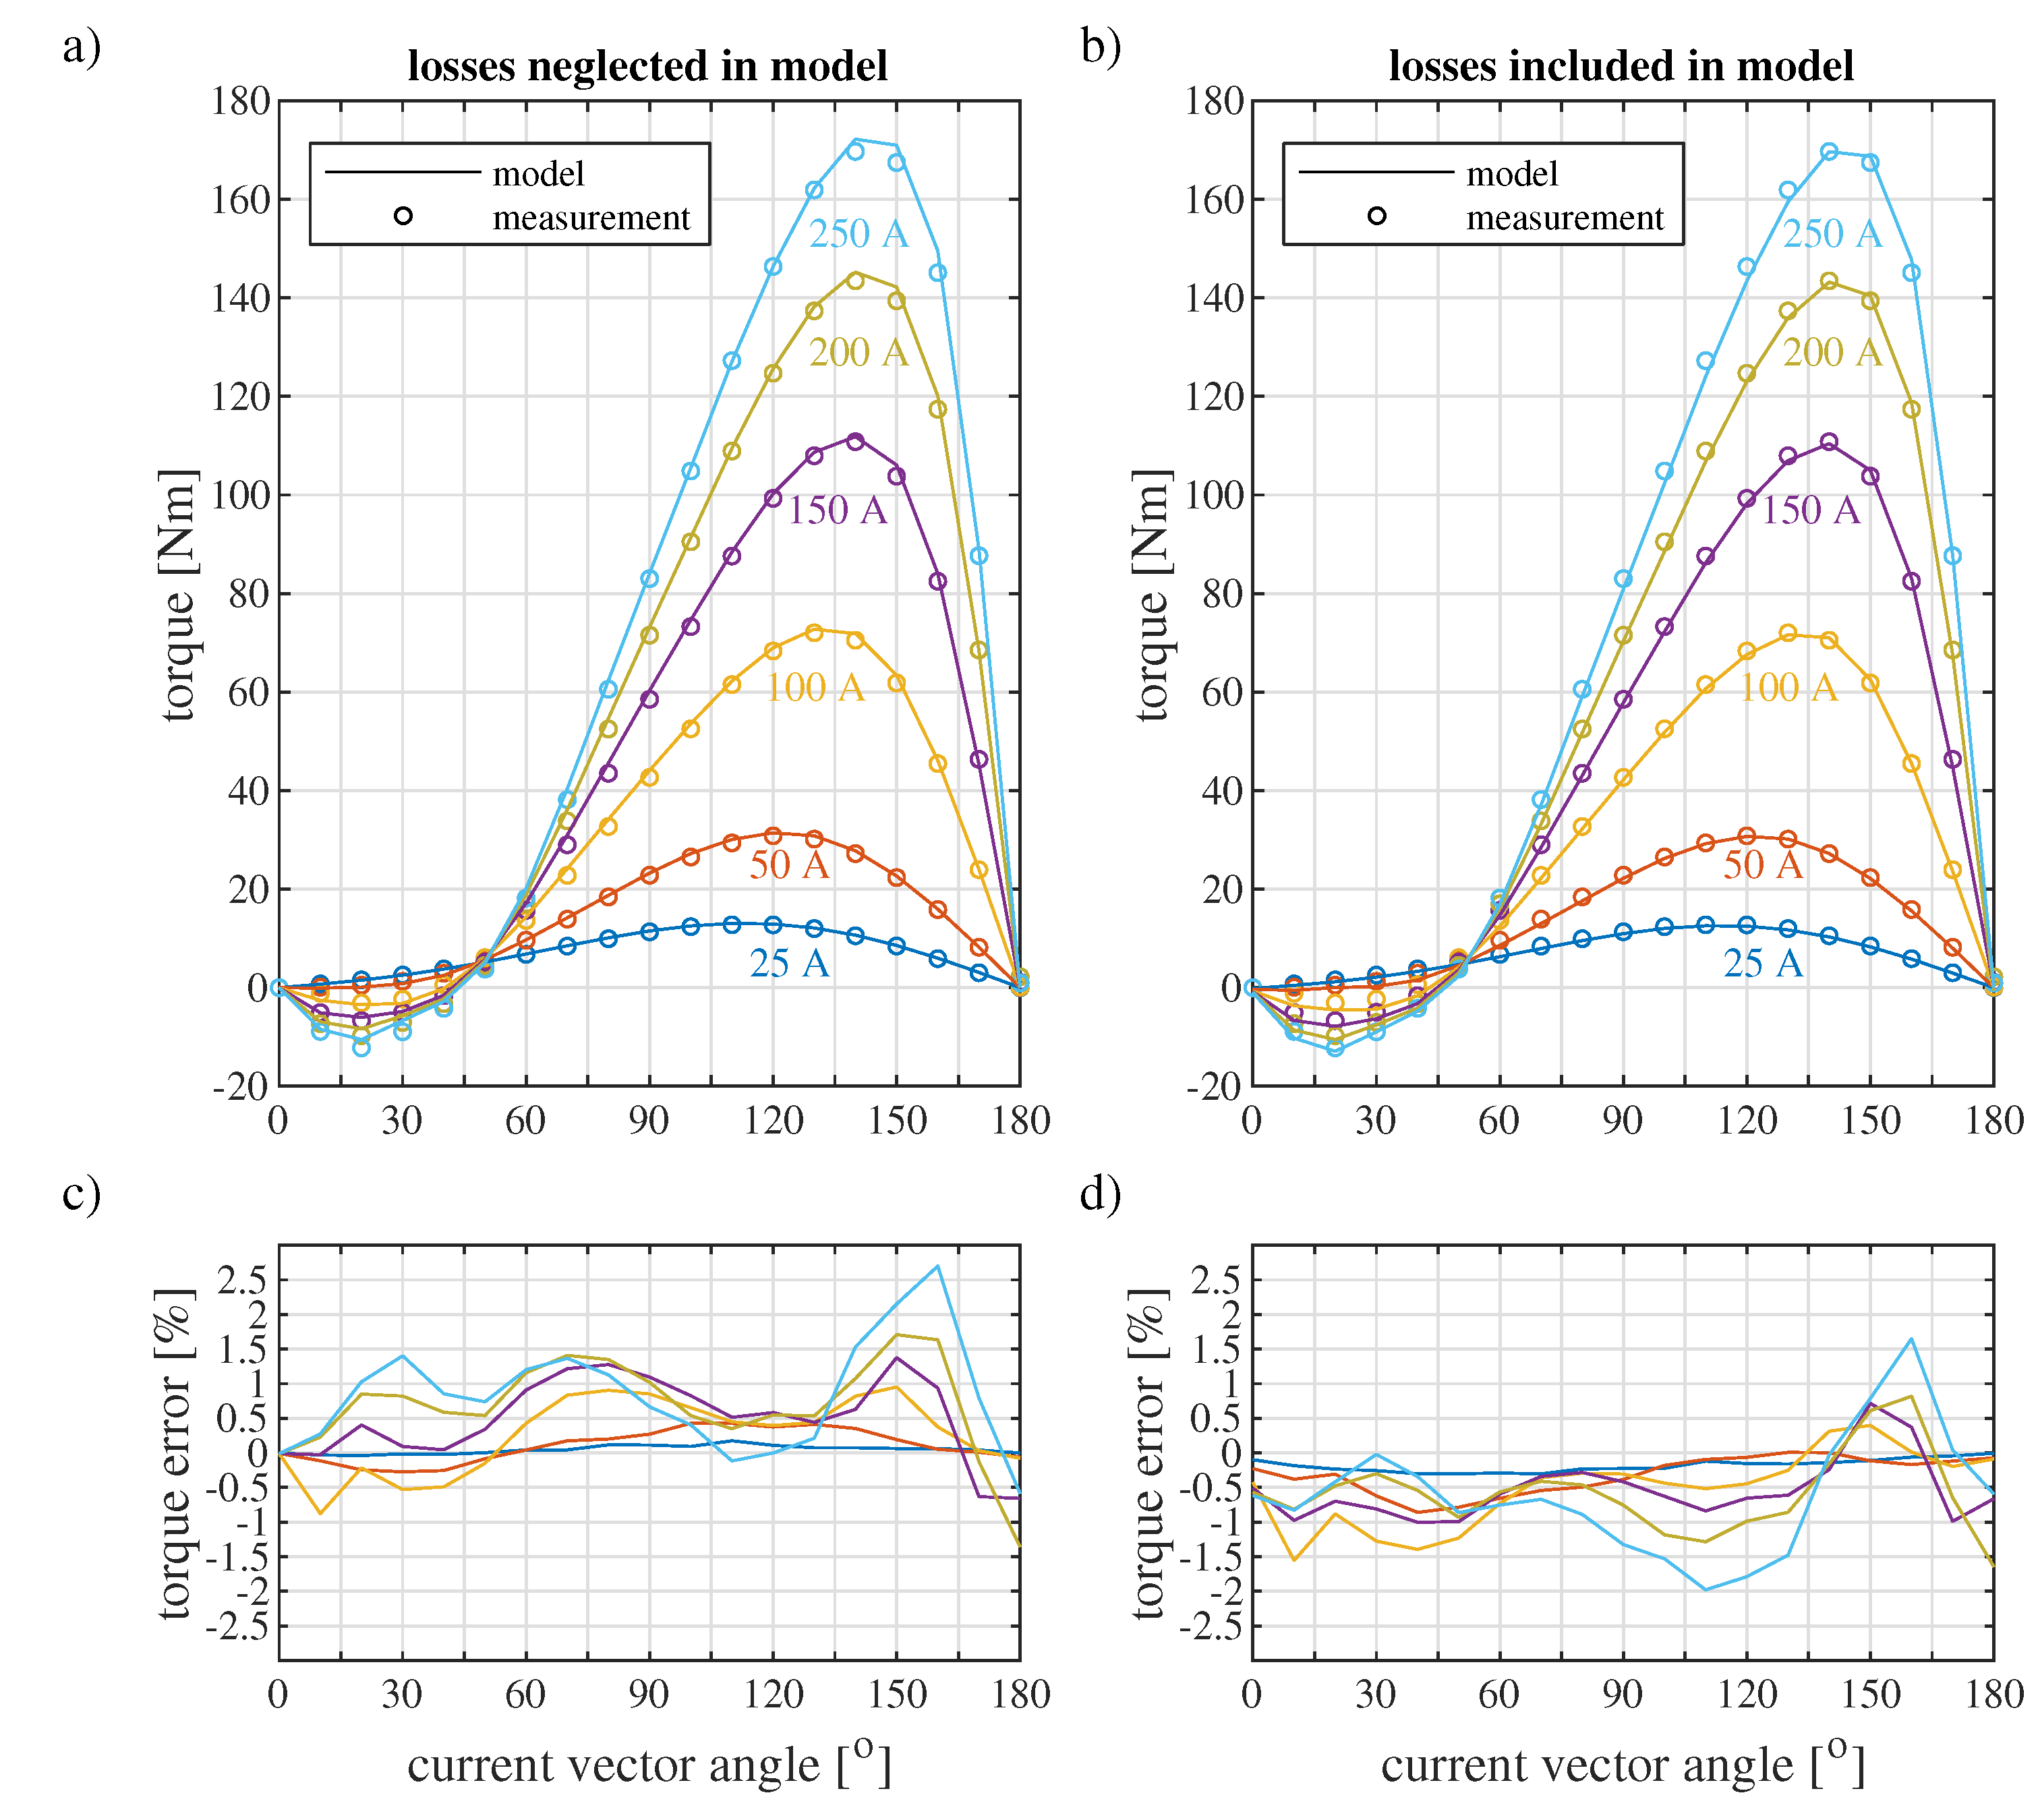
The comparison of the experimental results and the model output is depicted in
Figure 9. The left column (
Figure 9a,c) depicts the simulation results when machine losses are neglected. In that case the model inaccuracy reaches 2.7% of the official maximal torque value of 163 Nm. The right column (
Figure 9b,d) depicts the results after inclusion of the losses in the simulation model. In that case the matching is better, since the remanent flux density value of the magnet was tuned based on these results. In that case the model accuracy is always better than 2%. Based on these results an excellent matching of the model can be stated.
It is worth mentioning that the highest torque value obtained during the measurements equals 169.7 Nm, which is 4% higher than the value published by Toyota [
16]. It should be emphasized that the torque sensor was send to the calibration right before the measurements and the presented test results were obtained directly after the calibration. Hence, the measured value can be considered as reliable. Probably, Toyota considered some additional mechanical losses inside of the transaxle or very high magnet temperature.
3.2. Flux-Linkage Maps
As the simulation model is established and validated, it can now be utilized to obtain data needed by drive control engineers. It is a common practice to describe the machine dynamics using the space-vector-based equations in the
rotor reference frame. The flux-linkage-based model can be described as [
1,
2]:
where:
and
are
d- and
q-axis voltages respectively [V],
and
are
d- and
q-axis flux linkages respectively [Wb],
is the phase resistance [
],
is electrical angular speed [rad/s],
p is the number of pole pairs [-],
is the electromagnetic torque [Nm].
The state-of-the-art control algorithm for IPMSMs is the FOC, which facilitates current controllers [
13]. Hence, the model expressed with (
Section 3.2) needs to be converted into the current-based one. For the highly saturated machine, the flux linkages should be considered as functions of current:
Considering the exact integral of (
3) in (
Section 3.2) leads to the following current-based machine dynamics model:
with differential inductances defined as:
where:
is a
d-axis differential self-inductance [H],
is a
q-axis differential self-inductance [H],
and
are cross-saturation inductances [H].
It should be emphasized that this model considers only the DC conduction losses and all the other machine losses are neglected. Hence, the machine parameters needed for this model are generated using the simulation with losses neglected.
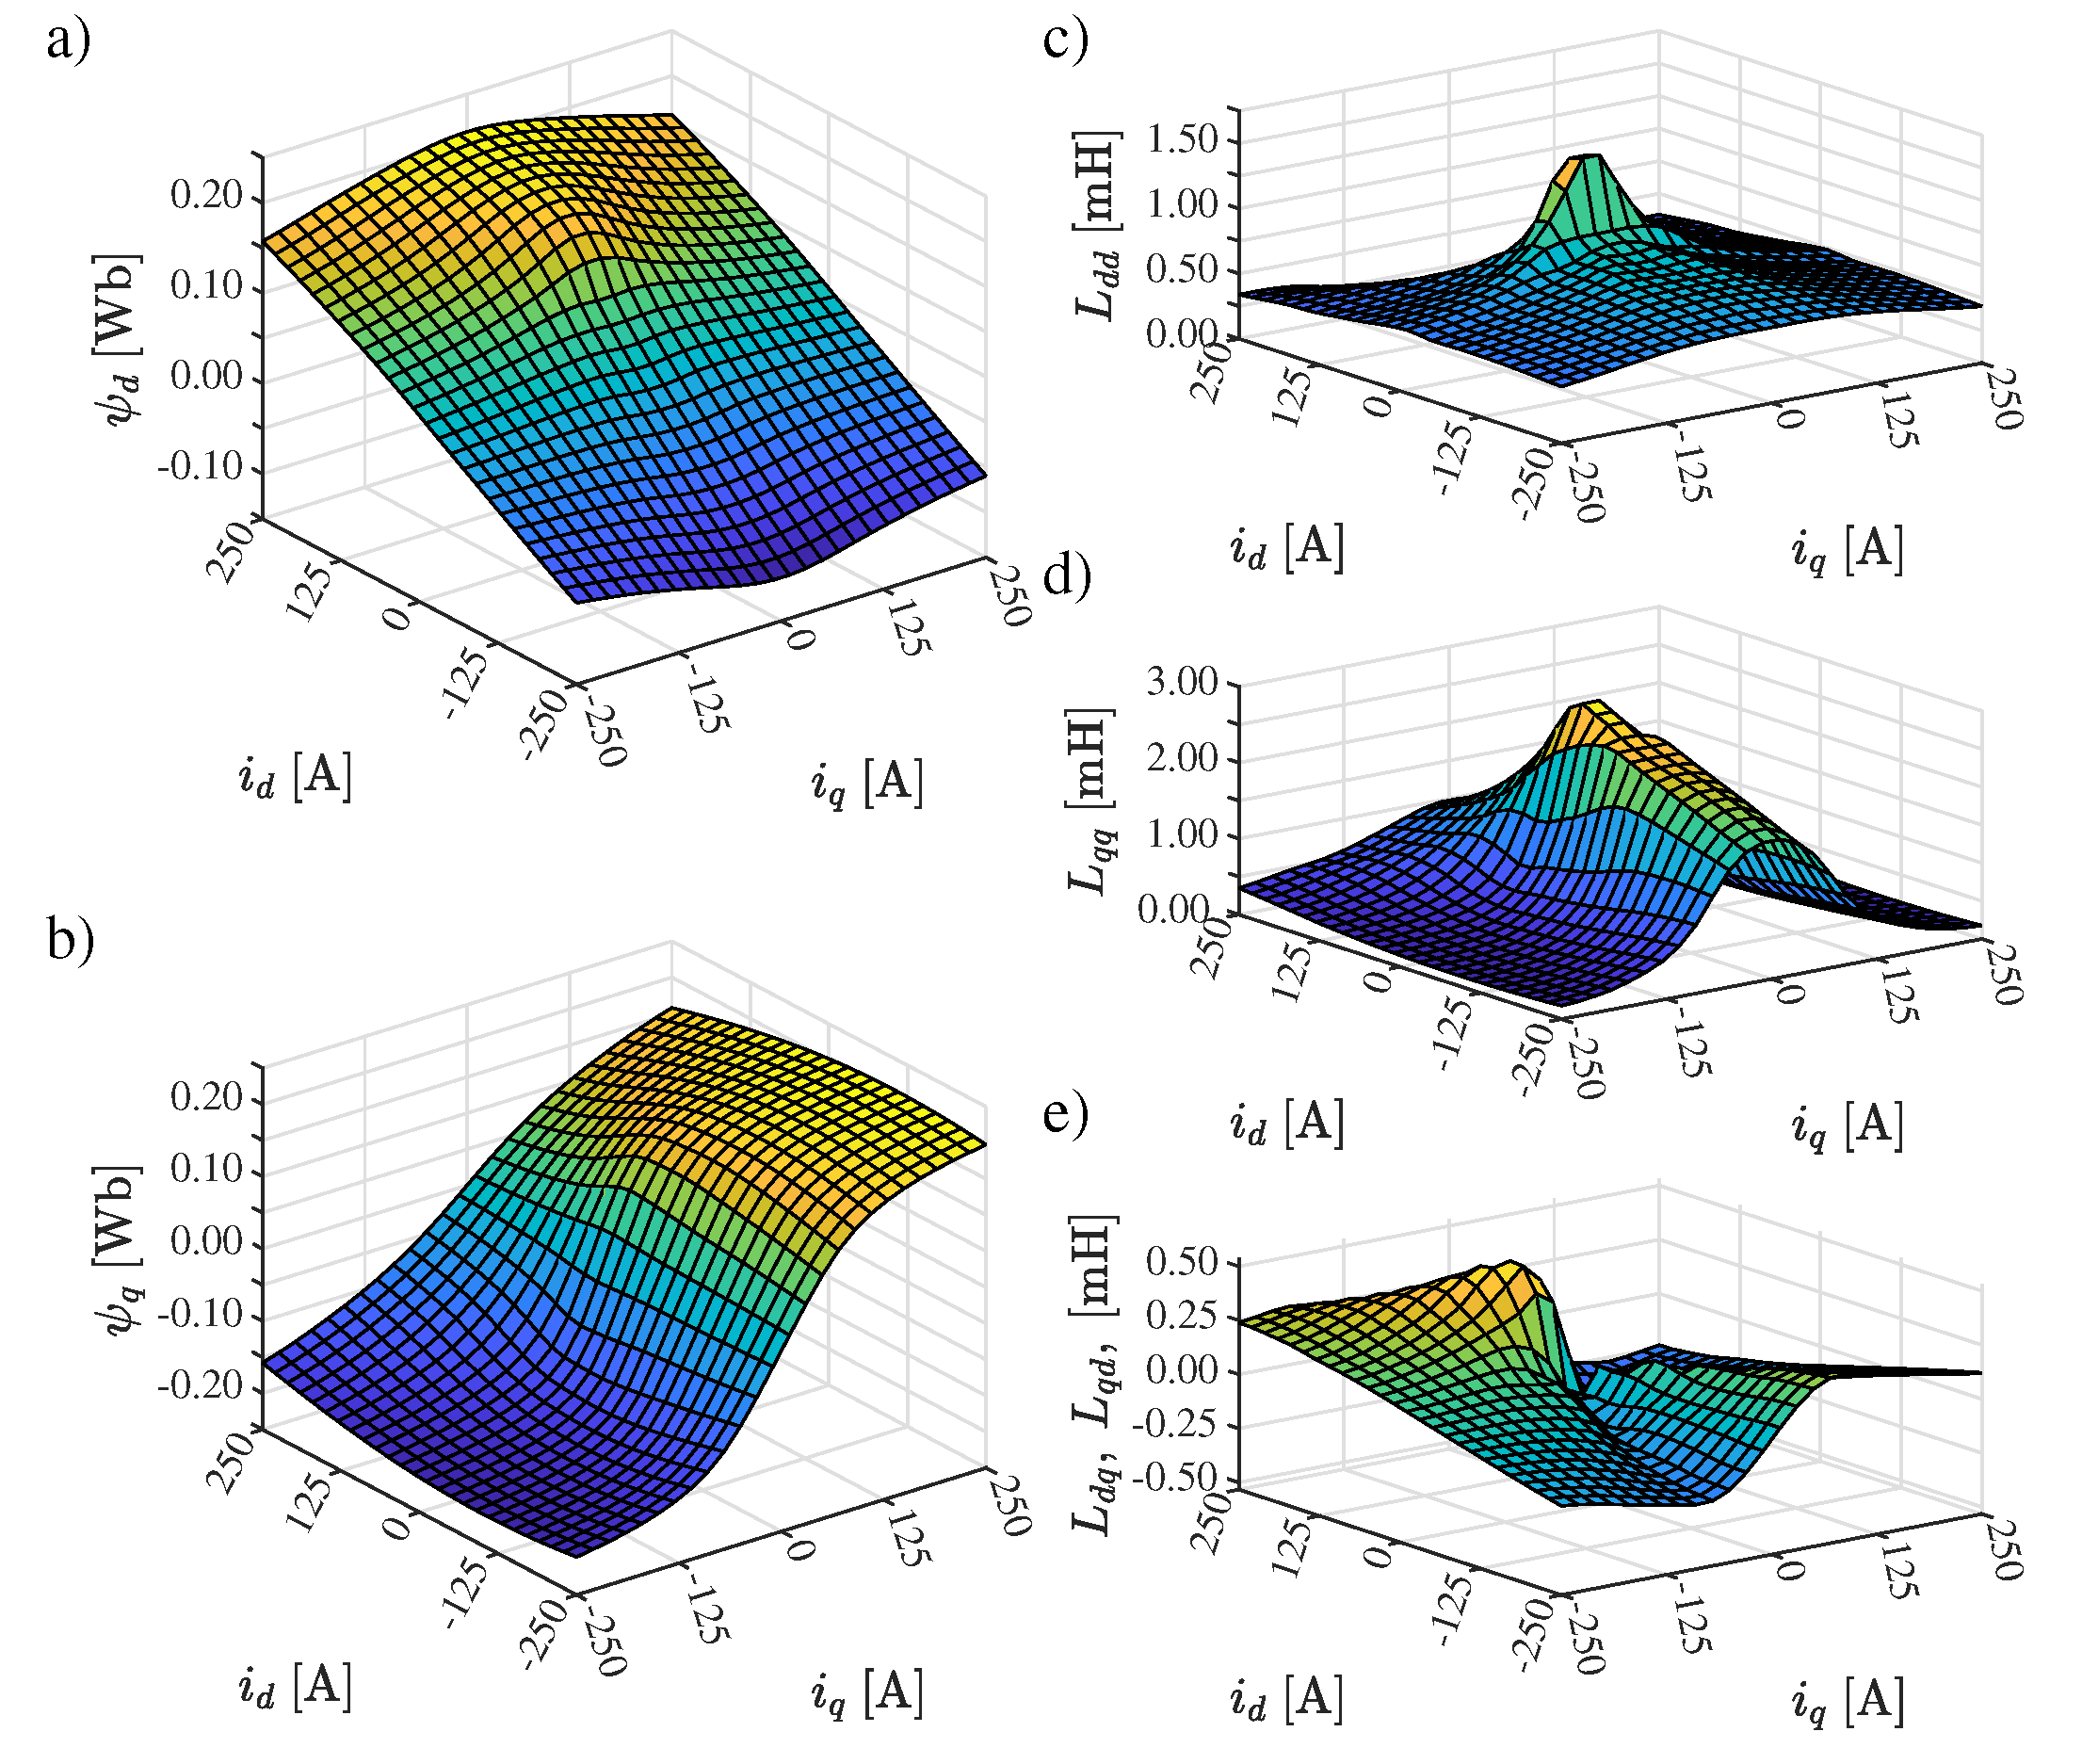
The simulation results are depicted in
Figure 10. The numerical data in the spreadsheet form are available to the reader as the supplementary material attached to this paper (file ’FluxMaps.xlsx’).
The extreme magnetic circuit saturation, already mentioned in the previous section, is clearly visible in the flux-linkage surfaces (see
Figure 10a,b). It is especially clear looking at the differential self-inductances in
Figure 10c,d, as for the linear magnetic circuit they would be constant in the whole depicted region. The cross-saturation is also visible, as the
d-axis flux-linkage depends on the
q-axis current, and
q-axis flux-linkage depends on the
d-axis current. This is also indicated by non-zero values of the cross-saturation inductances (see
Figure 10e). It should be also mentioned that the cross-saturation inductances
and
are equal. This is a result of the reciprocity condition [
20,
21,
22]. This condition is derived based on the energy conservation rule, when the iron losses are neglected. Hence, the results obtained with the lossless FEM model should also fulfill the reciprocity condition, i.e.,
. For the more detailed explanation of the physical meaning of the surfaces’ shapes depicted in
Figure 10 please refer to [
21,
22].
3.3. Maximal Torque per Current and Field Weakening
The next important task for the drive control is calculation of optimal current reference points for the controllers. This calculation can be performed based on the model (
Section 3.2) and machine parameters obtained with the lossless model (see
Figure 10).
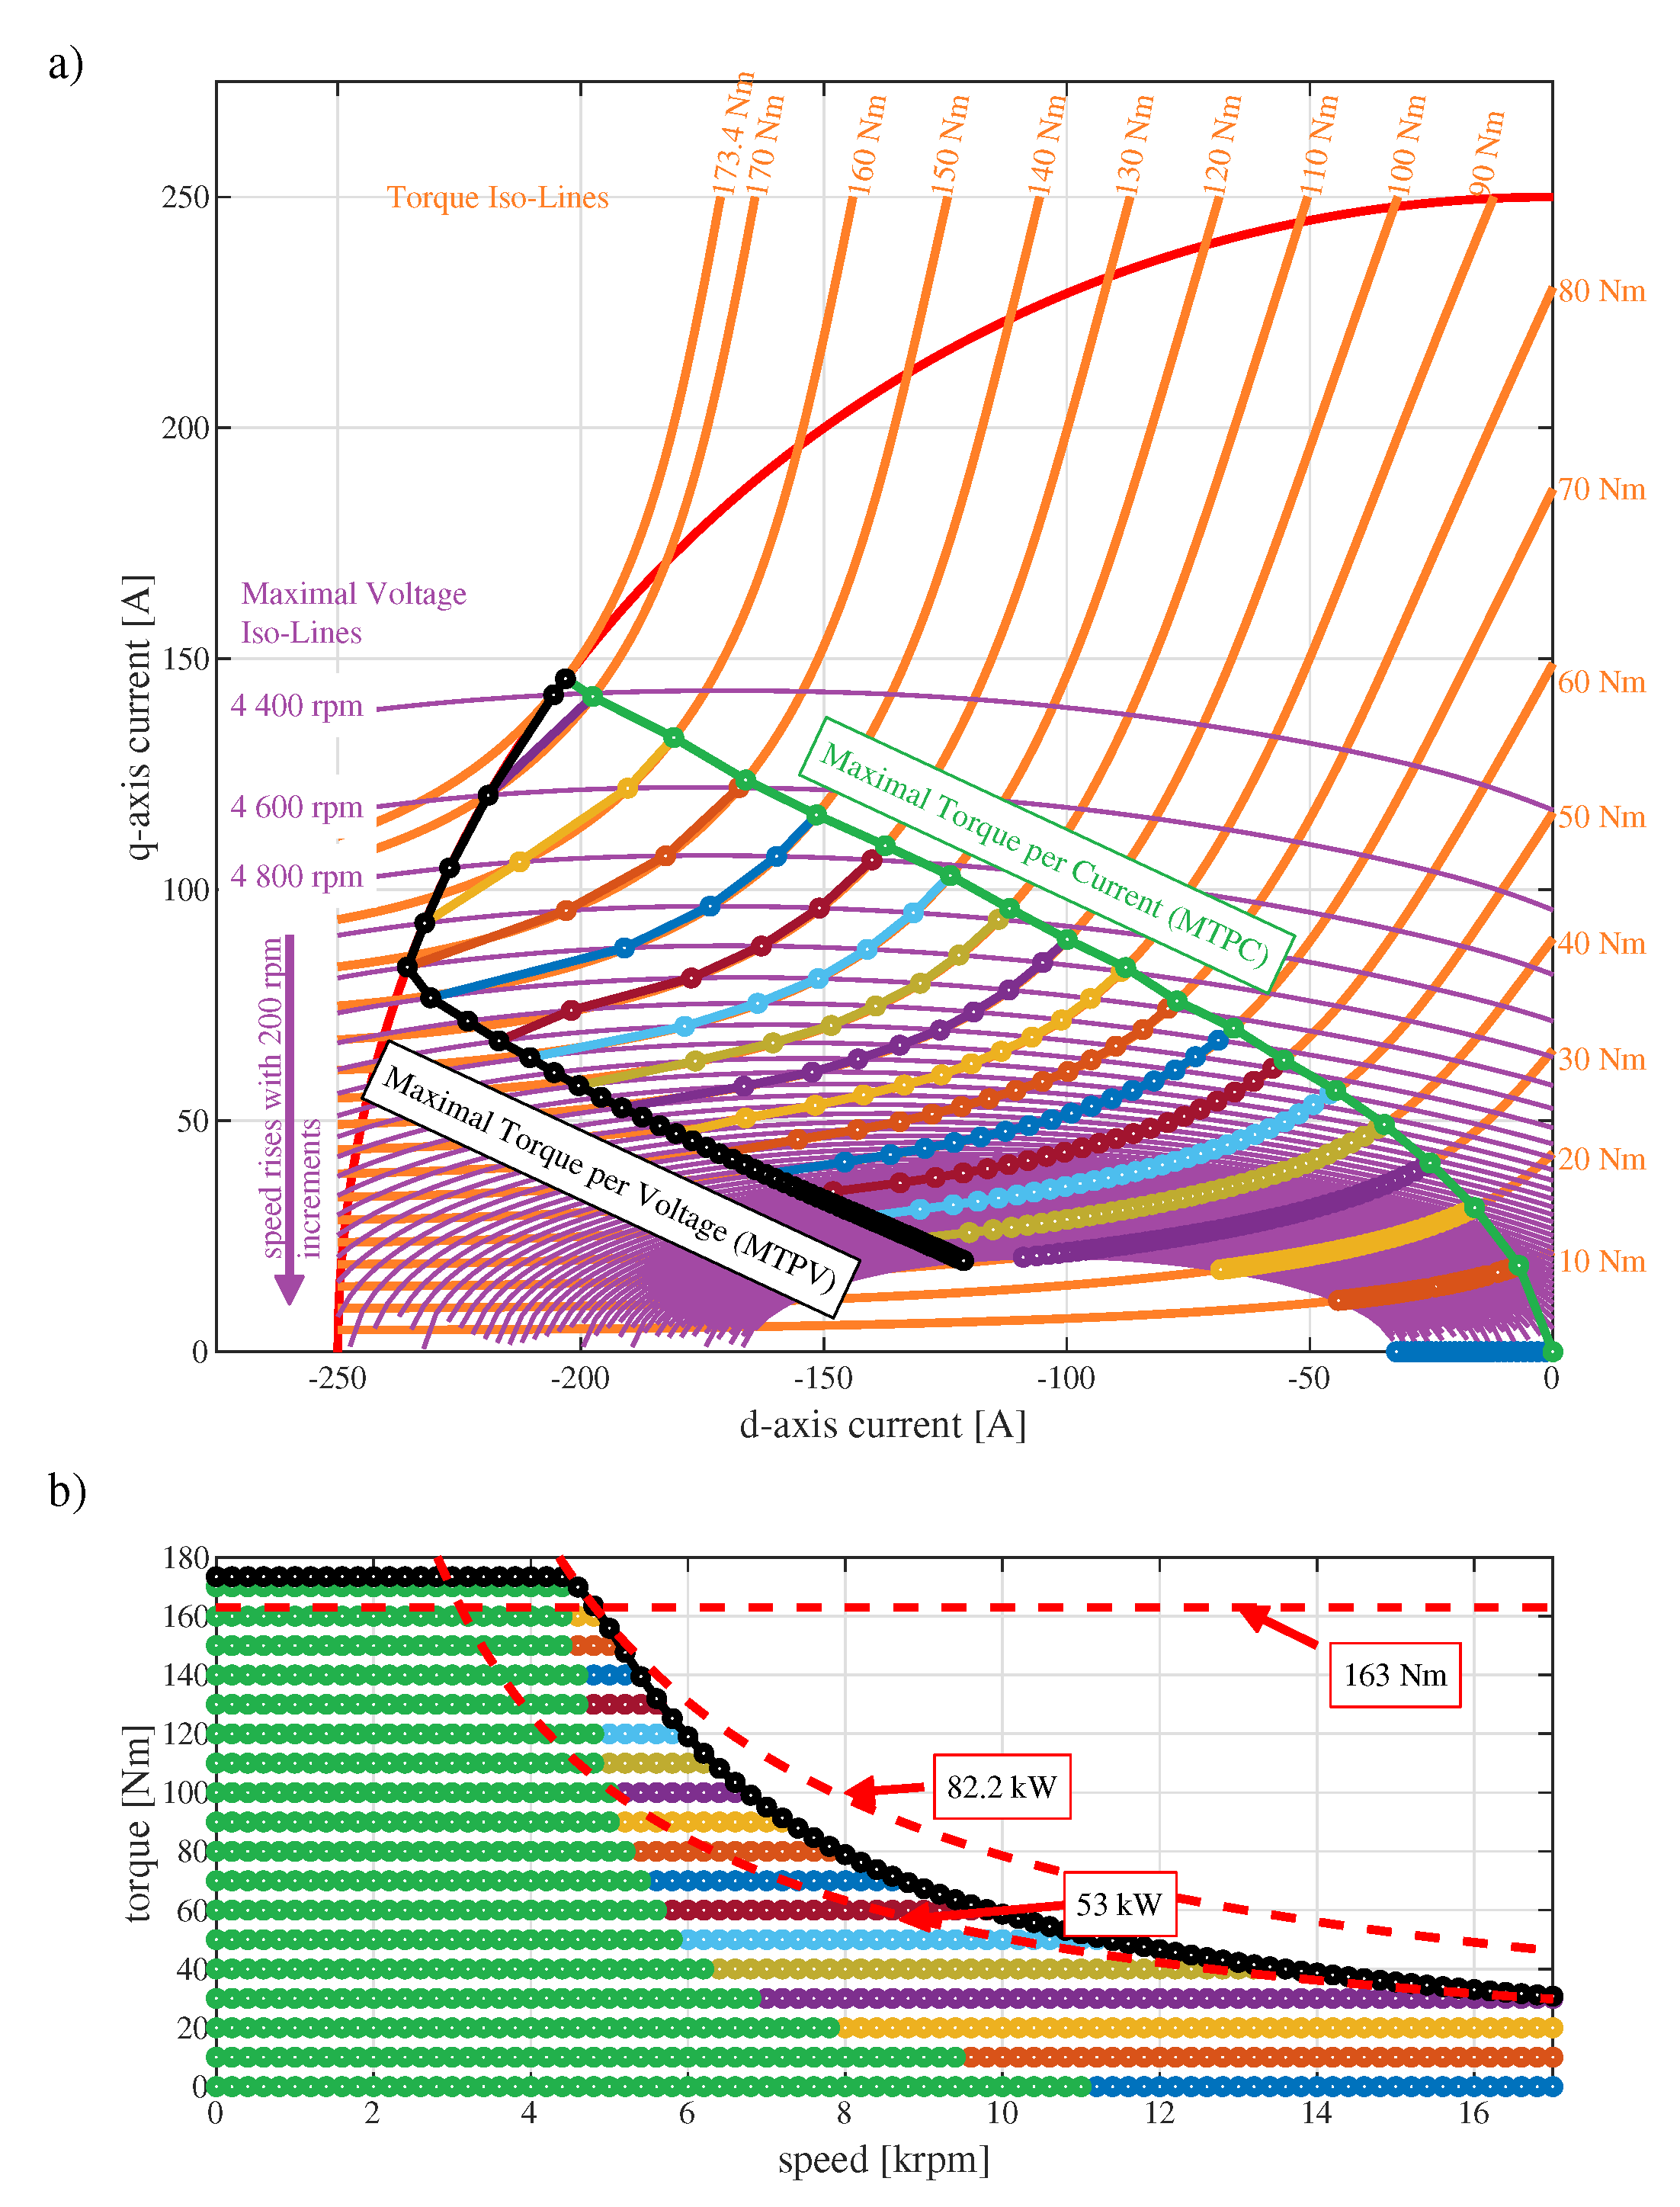
The calculation was performed with the numerical search algorithm written by the authors in MATLAB software. The results of the calculation are depicted in
Figure 11. The numerical data are available to the reader, since they are included in the supplementary materials attached to this paper (file ’MTPC_FieldWeakening.xlsx’)
The operational points in the base speed region were chosen using the state-of-the art solution, i.e., the Maximal Torque per Current (MTPC) strategy [
1,
2,
13,
23,
24,
25]. This strategy assumes the minimization of the current for the given reference torque, as discussed in [
24,
25]. The constant torque iso-lines are depicted in
Figure 11a as orange lines. For each reference torque iso-line, the point of the minimal current space vector’s length was chosen as the reference operational point. The resulting MTPC locus is depicted with green color in
Figure 11a. The maximal torque obtained with the given parameters equals 173.4 Nm.
According to (
Section 3.2) the voltage needed to reach some current space vector rises with speed. Above some speed (different for each torque value) the voltage available for the current controllers is not enough for following the MTPC strategy any longer. Assuming the Space Vector Modulation (SVM) is applied, the maximal phase voltage on the inverters’ output is limited to the value of:
where:
is the maximal phase voltage amplitude [V],
is the DC-link voltage of the inverter [V]. The presented calculation results were obtained with the maximal DC-link voltage of Toyota Prius, i.e.,
V. The operational points which can be reached using the MTPC strategy under the assumed conditions are marked with green color in
Figure 11b.
The maximal voltage iso-lines drawn in the current
-plane (see purple lines in
Figure 11a) have ellipsoidal shapes and converge with the rising speed to a very specific point, i.e., the motor characteristic current. This current is defined as the
d-axis current amplitude sufficient to weaken the
d-axis flux to zero, i.e.,:
where:
is the motor characteristic current [A]. This is a very important value, which defines the field weakening performance of the drive [
24]. For the examined machine this value equals
A.
Above the speeds, where the MTPC points can be reached, the field weakening strategy needs to be applied. The maximal torque for a given speed is limited by the Maximal Torque per Voltage (MTPC) strategy. The current space vector locus for this strategy lies at the points, where the torque iso-lines are tangential to the voltage iso-lines at given speed [
24]. The maximal drive torque obtained with the MTPV strategy is depicted with black color in
Figure 11b. The maximal power achieved equals 82.2 kW (see constant power hyperbole depicted in
Figure 11b). This value is much higher then the official value of the 53 kW published by Toyota. Hence, the constant power hyperbole for the value of 53 kW was drawn too. It reveals that the torque curve of the drive converges to this official value. It means that the official value published by Toyota does not refer to the peak power, but to the maximal power available in the wide speed range. The fact that the calculated torque curve matches so closely with the official value of the maximal power acts as an additional validation of the presented model.
For the partial load operation, i.e., for torque values lower than the MTPV curve, another field wekaning strategy needs to be developed. In that case, the space vectors lying on the intersection of the torque iso-lines (for given torque) and maximal voltage iso-lines (for the given speed) should be chosen. These points are depicted in different color for each torque value in
Figure 11. The colors for each torque value in
Figure 11a and in
Figure 11b match with each other.
3.4. Efficiency and Losses
The previous analysis was carried out using the lossless model. Hence, it should be complemented by the results obtained with the model where losses are included. For this purpose the dedicated sub-module of the Motor-CAD software was utilized [
26].
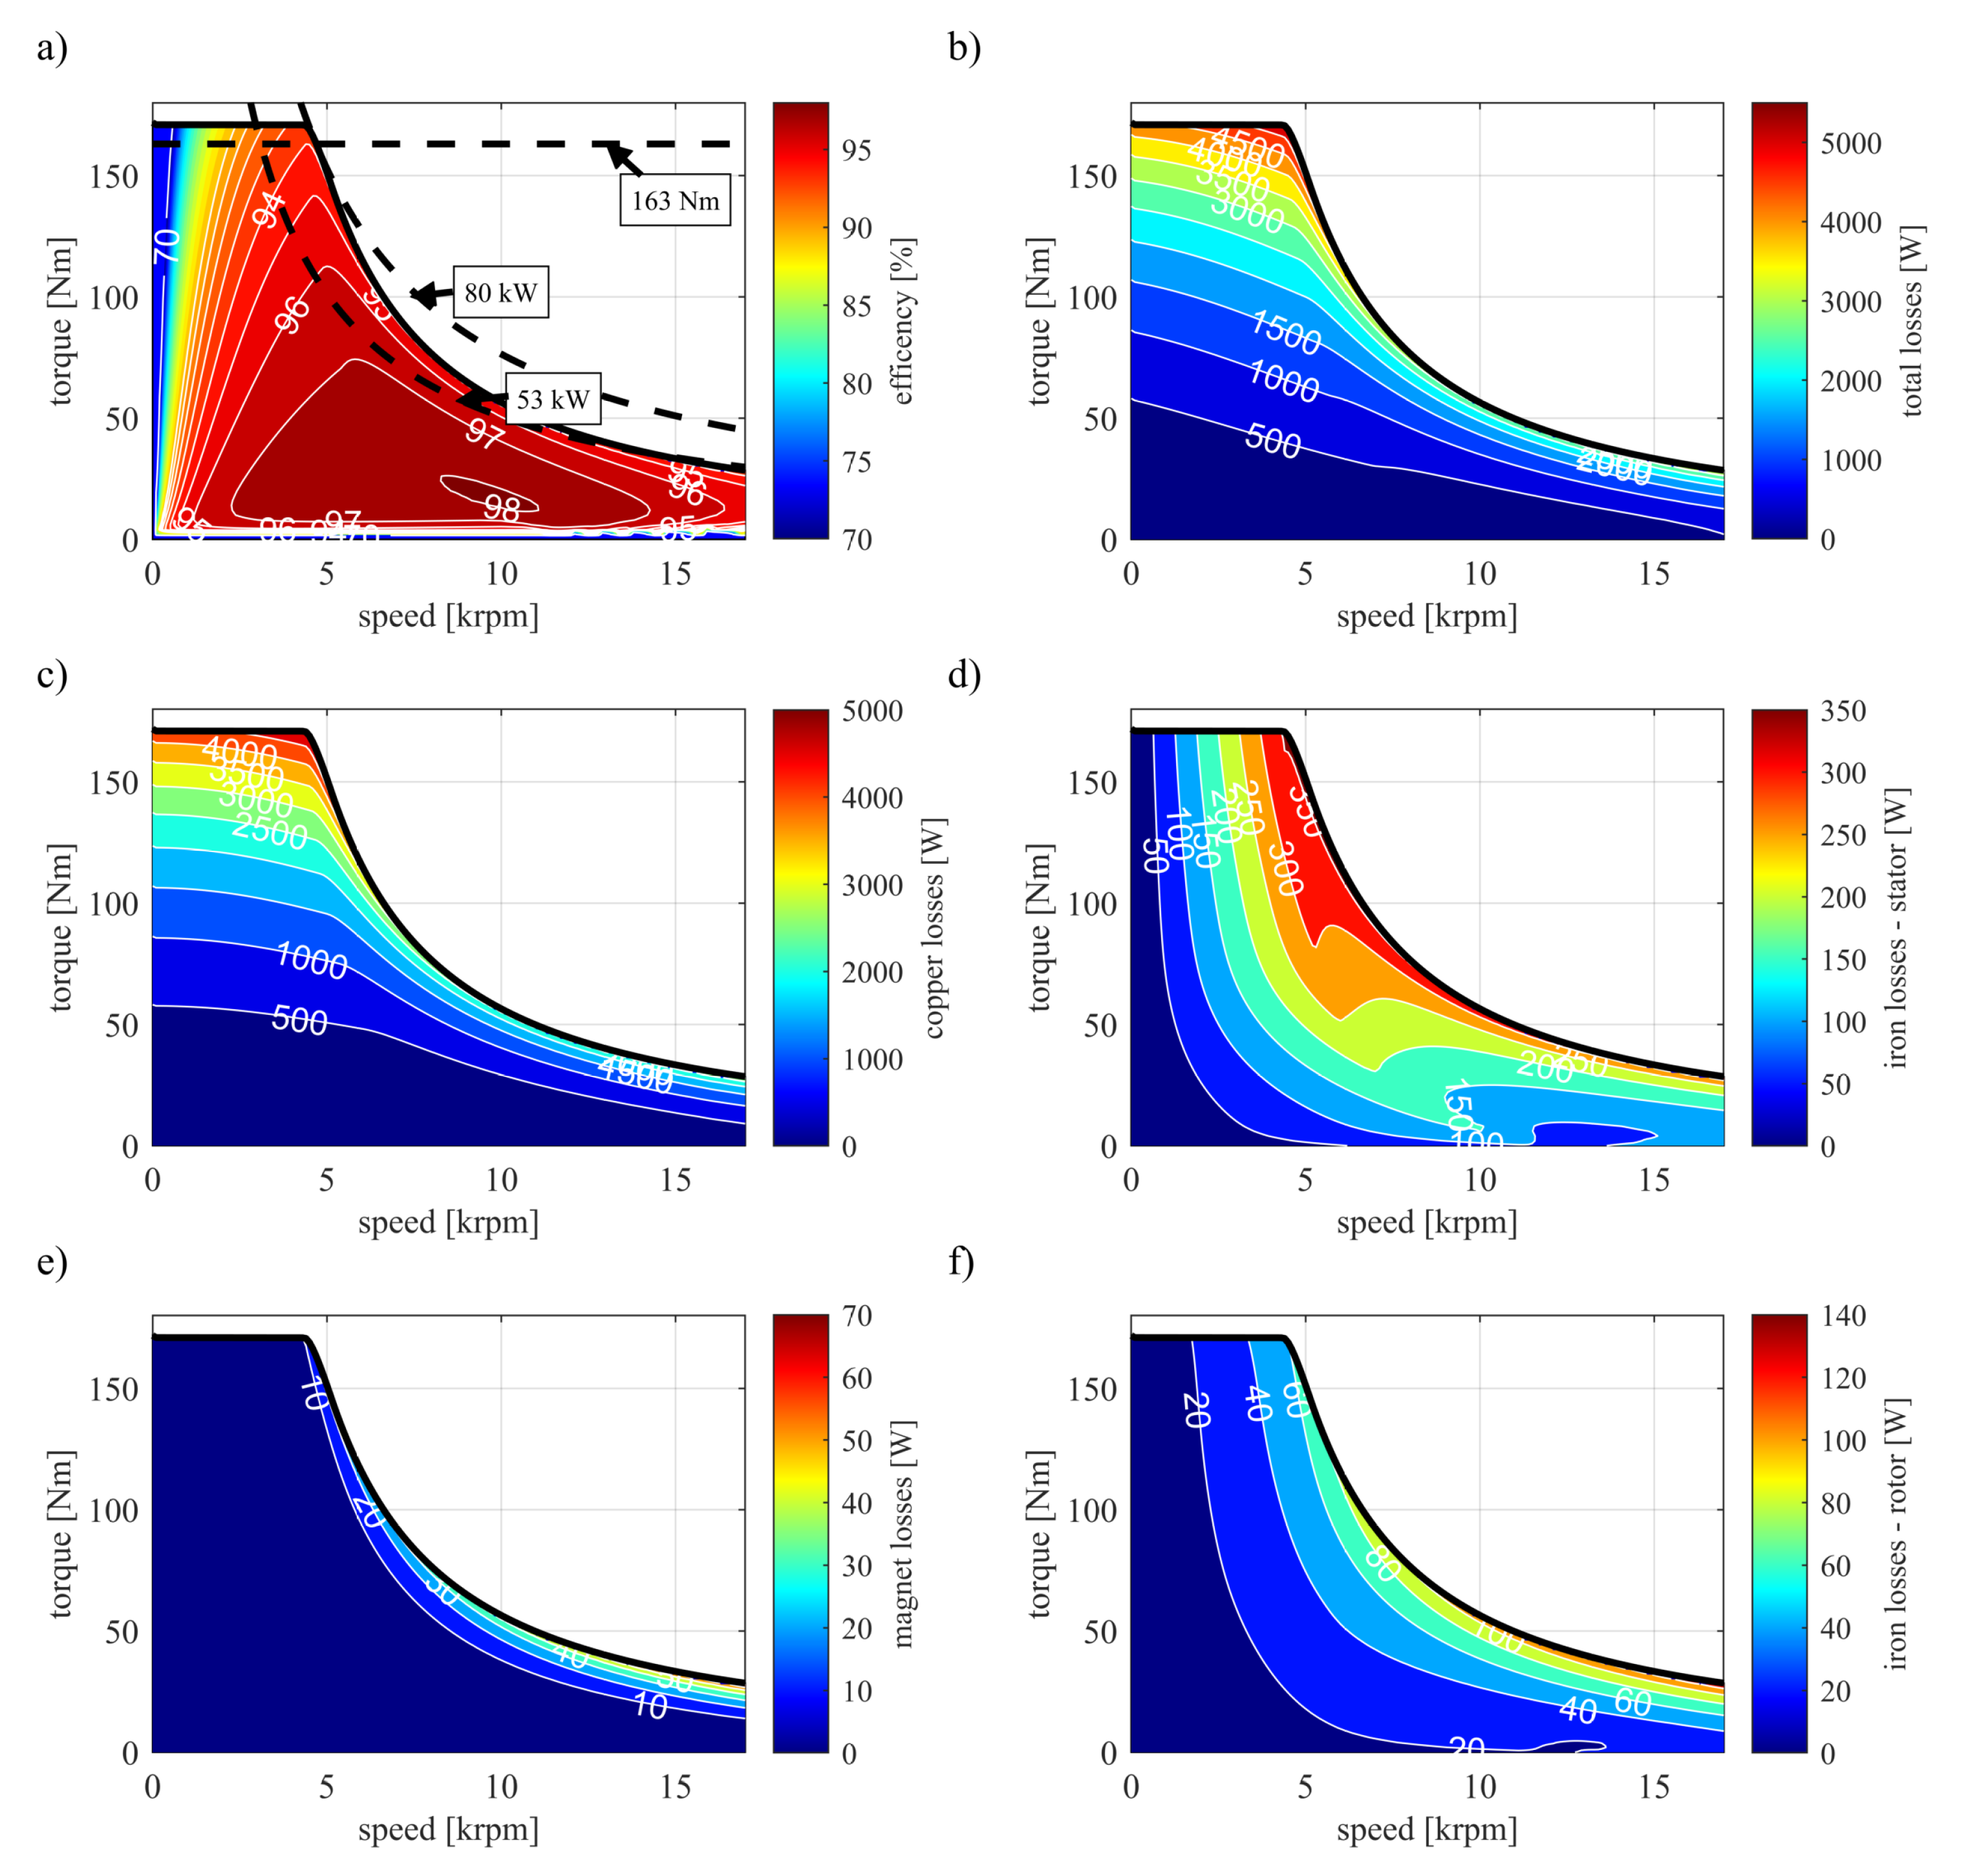
The simulation results are depicted in
Figure 12. The numerical source data are available to the reader as supplementary materials attached to this paper (file ’EfficiencyLossMaps.xlsx’).
After considering the losses the maximal torque of the drive equals 171.8 Nm and the peak power drops to 80 kW in comparison to the results obtained with the lossless model. The torque curve at high speed again converges to the officially published value of 53 kW.
The peak machine efficiency is very high and equals 98%. The high-efficiency operational region is very wide. In comparison to the previous generation of Toyota Prius, the efficiency at high speeds risen by approximately 2% [
6].
The total losses in the machine (see
Figure 12b) reach peak value of 5.5 kW. The majority of the total machine losses consists of the copper losses (see
Figure 12c). In comparison, the iron losses (see
Figure 12d,f) are much lower and the magnet losses are almost negligible (see
Figure 12e).
Since the main source of the losses are the joule losses in conductors, the total losses map of the machine has similar shape to the copper losses map. In the base speed region the losses are mostly torque dependent (since higher torque means higher current). On the other hand, the iron losses are mostly speed dependent. It can be also observed, that there is slight increase in the copper loses with rising speed. This is caused by the AC component of the copper losses, which is frequency dependent.
In deep field weakening region all the losses seem to be rather power dependent.
4. Discussion
The characteristic current of the machine is an important factor impacting the field weakening performance of the drive. According to the theory derived in [
24], it can be used to describe a level of the inverters’ volt-ampere rating utilization. For this purpose a so called drive characteristic factor should be calculated first as:
where:
is the drive characteristic factor [-]. It is a well-known fact that the value of
divides the PMSM drives into two sub-classes [
24,
25]. For
the drive has finite maximal speed and poor field weakening performance. For
the drive has infinite maximal speed and good field weakening performance, but it is achieved in cost of the low power factor and poor inverter volt-ampere rating utilization [
24].
It is a common practice to design the drives exactly on the boundary of these two sub-classes, i.e., with
, as it provides a good compromise between the field weakening performance and inverter utilization. A good example of such a practice is the traction machine from the BMWi3 described in [
11].
The examined drive from the Toyota Prius is a counter-example of this practice. With the drive characteristic factor of
it is an extreme example of the infinite maximal speed drive class. Let’s put it in numbers. For the Toyota Prius inverter the volt-ampere rating of the inverter can be calculated as:
where:
S is the inverter apparent power [VA]. According to the approximations derived in [
24] the asymptotic power reached by the drive at high speed can be approximated by:
where:
is the approximated power reached at high speeds [W]. Substituting
yields that one could design the motor, which could reach approx. 129.9 kW power at the shaft when supplied from the Toyota Prius inverter. At the same time, substituting the value from the Toyota Prius motor, i.e.,
, results in the shaft power of
kW, which is very near to the value 53 kW obtained in the simulation (it should be remembered that the equation (
9) is only an approximation). It means that only 40.8% of the potential power of the inverter is utilized.
Hence, it is aimful to inquire the reason for this design decision. In authors opinion, the answer lies in the space vector locus for field weakening operation for partial loads (see
Figure 11a). Since the MTPV locus converges to the (
) point, the reduction of the characteristic current allows to reduce the current amplitude during the field weakening operation and as a result to reduce the conduction losses (which are the main source of losses). This is probably the reason of such a good machine efficiency at torques below 50 Nm (see
Figure 12).
It should me emphasized that the drive designed for the full inverter utilization, i.e.,
, has different current locus and current amplitudes rise drastically during the field weakening operation (see results for BMWi3 published in [
24]). Hence, the authors have a hypothesis that in general case rising of the drive characteristic factor
besides of decreasing the inverter utilization offers the limitation of losses instead. Nevertheless, at this point it is only a hypothesis and more analysis is necessary to draw such a generalized conclusions. This is another example why it is so important to provide the researchers worldwide with possibly many of the well-defined reference designs, as this may be the great way for gaining the insight about optimal drive design strategies.
5. Conclusions
The FEM model of the 4th Toyota Prius generation traction machine was presented. This model series is a good example of the consistent improvement and optimization of the product design with each model iteration. As reported in [
7], each next design of the machine had more compact dimensions and higher power-density. The simulation results also shown an increase in efficiency in comparison with the previous model.
The simulation results have proven an extreme utilization of the magnetic circuit. First of all, it is visible in the flux density distribution at high currents. In that state the bulk magnetic saturation of wide machine regions is observed. The saturation is also clearly visible in the flux maps of the machine. In consequence, the MTPC current locus achieves relatively high load angles (i.e., angles between the current space vector and the q-axis) exceeding the 45°. It should be emphasized, that for the linear magnetic model the maximum of the reluctance torque is achieved at angle 45°. Hence, the MTPC current locus exceeding that angle can occur only for extremely saturated machine, which is another indicator of a very high magnetic material utilization leading to compact design.
The characteristic current of the machine has relatively low value, leading to good field weakening performance, i.e., low current is sufficient for weakening of the d-axis flux linkage to zero. It results in relatively low losses at high speeds and a very high efficiency of over 97% in wide speed range. On the other hand, it leads also to a relatively low inverter volt-ampere rating utilization.
The above facts prove the maturity of the Toyota Prius traction machine design and its usefulness as the reference design for new machine designs and improvements.
Supplementary Materials
The following supporting information can be downloaded at the website of this paper posted on
Preprints.org.
Author Contributions
Conceptualization, M.G. and R.J.; methodology, M.G. and R.J.; software, M.G. and R.J.; validation, M.G., and R.J.; formal analysis, M.G. and R.J.; investigation, M.G., R.J., M.S., M.J. and E.K.; resources, M.G., R.J., M.S., M.J., E.K. and L.M.G. ; data curation, M.G., R.J. and E.K.; writing—original draft preparation, M.G. and R.J.; writing—review and editing, M.S., M.J., E.K. and L.M.G.; visualization, M.G. and R.J.; supervision, M.G. and L.M.G.; project administration, M.G. and L.M.G.; funding acquisition, M.G., R.J. and L.M.G. All authors have read and agreed to the published version of the manuscript.
Funding
Research was funded by POB Energy of Warsaw University of Technology within the Excellence Initiative: Research University (IDUB) programme under Grant "ENERGYTECH-3", project title: "Modelling and characterization of electromagnetic and thermal features of traction drives with permanent magnet synchronous motor and synchronous reluctance motor".
Data Availability Statement
The data presented in this study are available partly in article and partly in Supplementary Material.
Conflicts of Interest
The authors declare no conflicts of interest.
Abbreviations
The following abbreviations are used in this manuscript:
| FEM |
Finite Element Method |
| FOC |
Field Oriented Control |
| IGBT |
Insulated Gate Bipolar Transistor |
| IPMSM |
Interior Permanent Magnet Synchronous Motor |
| MTPC |
Maximal Torque per Current |
| MTPV |
Maximal Torque per Voltage |
| SVM |
Space Vector Modulation |
References
- Gao, J.; Li, C.; Dai. L.; Huang, S.; Xu, W. A practical analytical expression and estimation for average torque of high saturation permanent magnet synchronous motor for special vehicles. IEEE Trans. Veh. Technol. 2023, 1, 357–366. [Google Scholar] [CrossRef]
- Rabiei, A.; Thiringer, T.; Alatalo, M.; E. A. Grunditz, E.A. Improved maximum-torque-per-ampere algorithm accounting for core saturation, cross-coupling effect, and temperature for a pmsm intended for vehicular applications. IEEE Trans. Transp. Electrific. 2016, 2, 150–159. [CrossRef]
- Tarczewski, T.; Szczepanski, R.; Erwinski, K.; Hu, X.; Grzesiak, L.M. A novel sensitivity analysis to moment of inertia and load variations for pmsm drives. IEEE Trans. Power Electron. 2022, 11, 13299–13309. [Google Scholar] [CrossRef]
- DÄ
baÅa, K. ; Kaźmierkowski. M. Converter-fed electric vehicle (car) drives â a critical review. PrzeglÄ
d Elektrotechniczny, /: 1–12. http, 1173. [Google Scholar]
- Takeno, M.; Chiba, A.; Hoshi, N.; Ogasawara, S.; Takemoto, M.; Rahman, M.A. Test Results and Torque Improvement of the 50-kW Switched Reluctance Motor Designed for Hybrid Electric Vehicles. IEEE Trans. Ind. Appl. 2012, 48(4), 1327–1334. [Google Scholar] [CrossRef]
- Oak Ridge National Laboratory, EVALUATION OF THE 2010 TOYOTA PRIUS HYBRID SYNERGY DRIVE SYSTEM. Available online: https://info.ornl.gov/sites/publications/files/Pub26762.pdf (accessed on 11 August 2024).
- Oak Ridge National Laboratory, 2017 Annual Progress Report - Electrification. Available online: https://www.energy.gov/sites/prod/files/2018/05/f52/Electrification_FY2017_APR_Final.compressed.pdf (accessed on 11 August 2024).
- Topic â Motor Application Note Study of a Permanent Magnet Motor with MAXWELL 2D: Example of the 2004 Prius IPM Motor. Available online: https://www.academia.edu/35037357/Topic_Motor_Application_Note_Study_of_a_Permanent_Magnet_Motor_with_MAXWELL_2D_Example_of_the_2004_Prius_IPM_Motor (accessed on 11 August 2024).
- Grunditz, E.A. Design and Assessment of Battery Electric Vehicle Powertrain, with Respect to Performance, Energy Consumption and Electric Motor Thermal Capability. Ph.D. Thesis, Chalmers University of Technology, Goteborg, Sweden, 2016. [Google Scholar]
- 2D finite element model of the Tesla Model S 60 induction motor. Available online: https://g2elab.grenoble-inp.fr/fr/le-laboratoire/download-the-new-2d-finite-element-model-of-the-tesla-model-s-60-induction-motor (accessed on 11 August 2024).
- Gierczynski, M.; Grzesiak, L.M. Comparative Analysis of the Steady-State Model Including Non-Linear Flux Linkage Surfaces and the Simplified Linearized Model when Applied to a Highly-Saturated Permanent Magnet Synchronous MachineâEvaluation Based on the Example of the BMW i3 Traction Motor. Energies 2021, 14, 2343. [Google Scholar] [CrossRef]
- Ansys Motor-CAD. Available online: https://www.ansys.com/products/electronics/ansys-motor-cad(Accessed on 11 August 2024).
- GemaÃmer, T. Effiziente und dynamische Drehmomenteinprägung in hoch ausgenutzten Synchronmaschinen mit eingebetteten Magneten. Ph.D. Thesis, KIT - Karlsruher Institut für Technologie, Karlsruhe, Germany, 12 February 2015. https://publikationen.bibliothek.kit.edu/1000046666.
- Sano, S.; Yashiro, T.; Takizawa, K.; Mizutani, T. Development of New Motor for Compact-Class Hybrid Vehicles. World Electr. Veh. J. 2016, 8, 443–449. [Google Scholar] [CrossRef]
- Kitazawa, O.; Kikuchi, T.; Nakashima, M.; Tomita, Y.; Kosugi, H.; Kaneko, T. Development of Power Control Unit for Compact-Class Vehicle. SAE IJAP 2016, 5(2), 278–285. http://www.jstor.org/stable/26169132.
- Suzuki, Y.; Nishimine, A.; Baba, S.; Miyasaka, K.; Tsuchida, M.; Endo, H.; Yamamura, N. Development of New Plug-In Hybrid Transaxle for Compact-Class Vehicles. SAE Tech. Pap. 2017. https://www.sae.org/publications/technical-papers/content/2017-01-1151/.
- 2016 - 2022 Prius, Prius Prime Transaxle - P610 Quick Look. Available online: https://www.youtube.com/watch?v=vHc-_E8xWnM&ab_channel=WeberAuto (accessed on 11 August 2024).
- Cleveland-Cliffs, MOTOR-MAX Steels. Available online: https://www.clevelandcliffs.com/products/motor-max-steels (accessed on 11 August 2024).
- ARNOLD MAGNETIC TECHNOLOGIES, Sintered Neodymium-Iron-Boron Magnets, N40. Available online: https://www.arnoldmagnetics.com/wp-content/uploads/2017/11/N40-151021.pdf(Accessed on 11 August 2024).
- Vagati, A.; Pastorelli, M.; Scapino, F.; Franceschini, G. Impact of cross saturation in synchronous reluctance motors of the transverse-laminated type. IEEE Trans. Ind. Appl. 2000, 36(4), 1039–1046. [Google Scholar] [CrossRef]
- Mingardi, D.; Morandin, M.; Bolognani, S.; Bianchi, N. On the Proprieties of the Differential Cross-Saturation Inductance in Synchronous Machines. IEEE Trans. Ind. Appl. 2017, 53(2), 991–1000. [Google Scholar] [CrossRef]
- Su, S.W.; Hackl, C.M.; Kennel, R. Analytical Prototype Functions for Flux Linkage Approximation in Synchronous Machines. IEEE open j. Ind. Electron. 2022, 3, 265–282. [Google Scholar] [CrossRef]
- Feng, G.; Lai, C.; Tan, X.; Kar, N.C. Maximum-torque-per- square-ampere control for interior pmsms considering cross-saturation inductances. IEEE Trans. Transp. Electrific. 2021, 7, 1482–1492. [Google Scholar] [CrossRef]
- Gierczynski, M.; Grzesiak, L. Per Unit Approach Based Assessment of Torque Production Capability of PMSMs Operating in the Field Weakening Region. In Proceedings of the 2019 Fourteenth International Conference on Ecological Vehicles and Renewable Energies (EVER), Monte-Carlo, Monaco, 08-10 May 2019. [Google Scholar] [CrossRef]
- Soong, W.L. Design and Modelling of Axially-Laminated Interior Permanent Magnet Motor Drives for Field-Weakening Applications. Ph.D. Thesis, University of Glasgow, Glasgow, Scotland, 1993. https://theses.gla.ac.uk/75707/1/13818424.pdf.
- Ansys Motor-CAD: Lab Module. Available online: https://econengineering.com/wp-content/uploads/2020/03/ansys-motor-cad-brochure_lab.pdf (accessed on 11 August 2024).
|
Disclaimer/Publisher’s Note: The statements, opinions and data contained in all publications are solely those of the individual author(s) and contributor(s) and not of MDPI and/or the editor(s). MDPI and/or the editor(s) disclaim responsibility for any injury to people or property resulting from any ideas, methods, instructions or products referred to in the content. |
© 2024 by the authors. Licensee MDPI, Basel, Switzerland. This article is an open access article distributed under the terms and conditions of the Creative Commons Attribution (CC BY) license (http://creativecommons.org/licenses/by/4.0/).

