1. Introduction
1.1. Renewable Energy Growth
In recent years, wind energy has shown significant growth within the UK as well as the rest of the world. Globally, the wind power capacity is at 1045.95GW [
1]. At the time of the writing of this paper, the total capacity of offshore and onshore wind was 13.6GW and 14.5GW respectively [
2]. The capacity over the years has been steadily increasing with a desire for more reliance on renewable energy. Some aspects of renewables may have inefficiencies, such as unpredictability with wind turbines. Clearly the world desires a cleaner source of energy but, as shown in
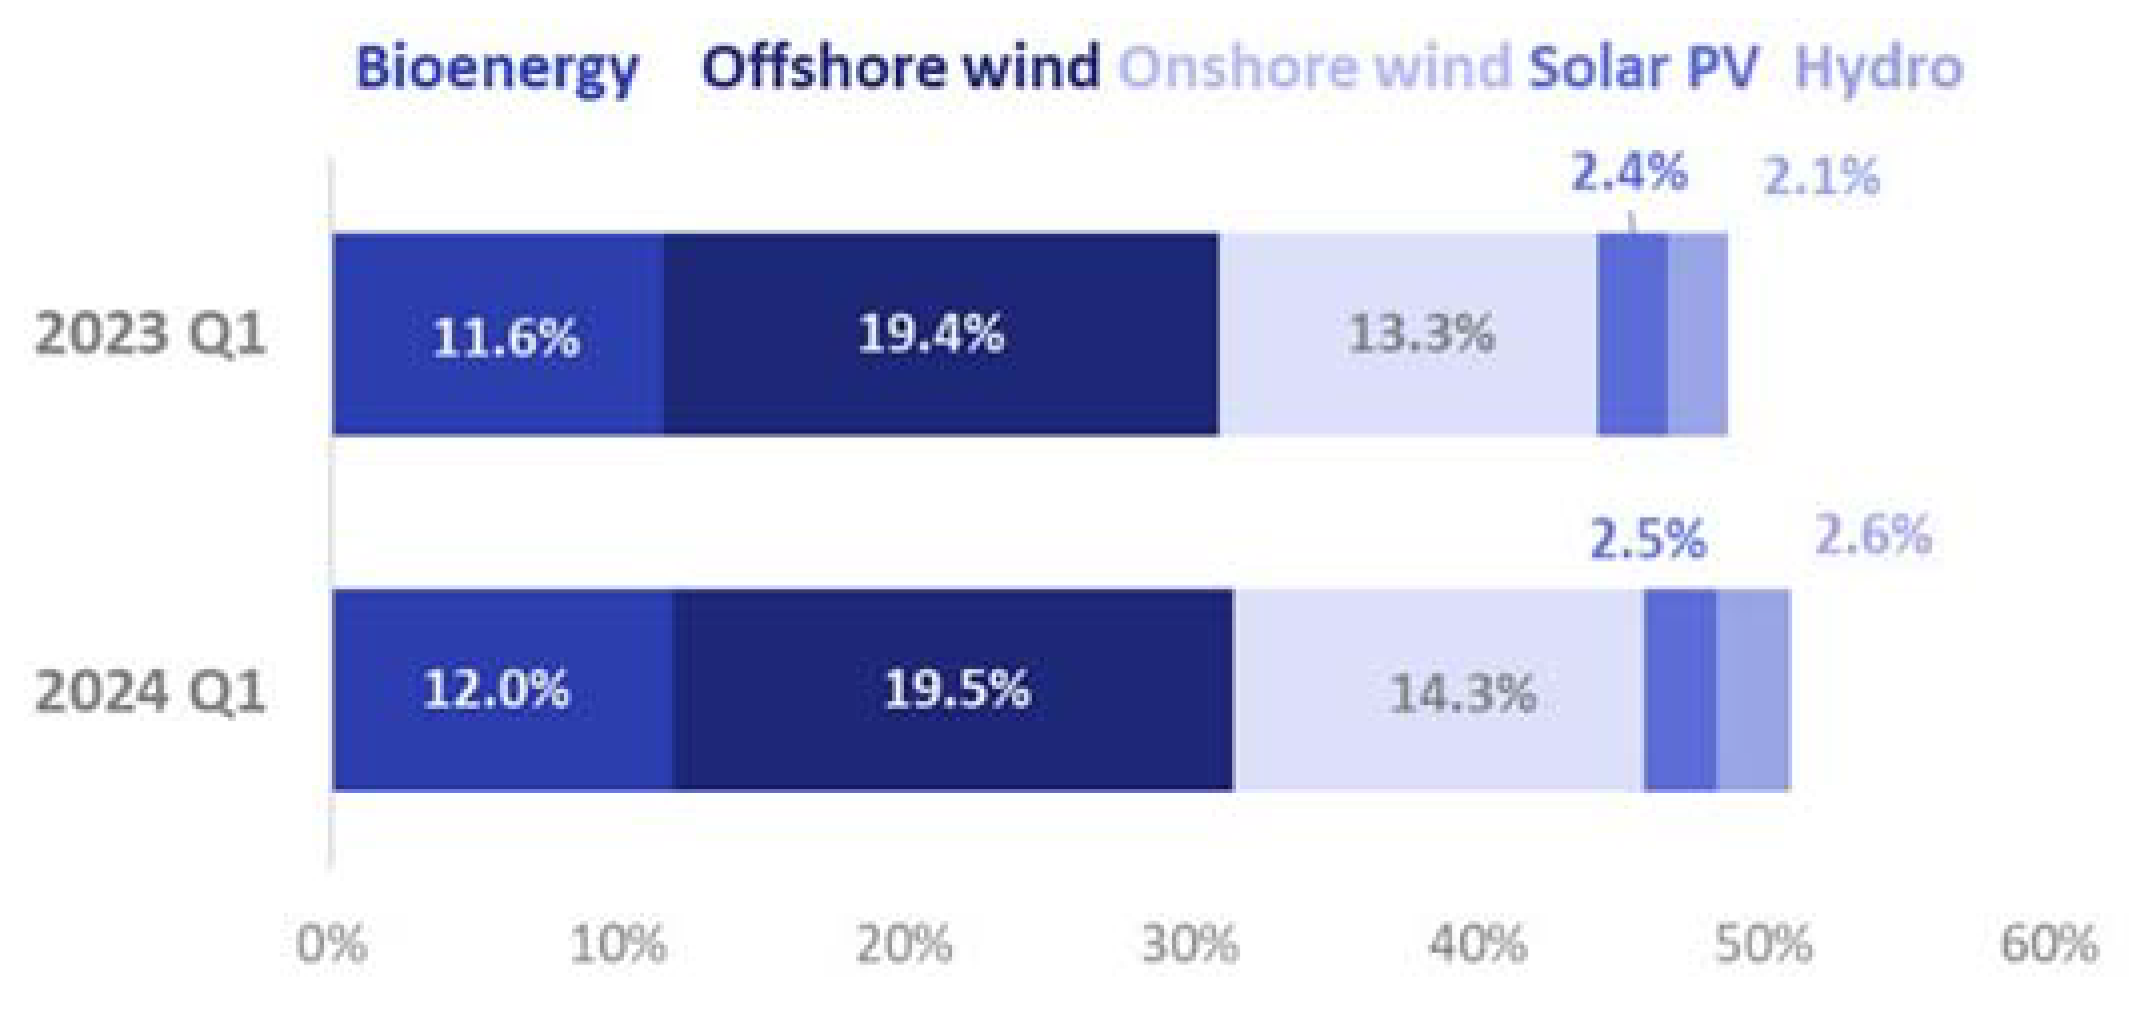
Figure 1, the source from renewables is not sufficient at present to meet demand. Hence, there is a need to increase the energy efficiency from existing technologies and one such approach is to improve material performance.
As shown in
Figure 1, wind energy supplied approximately 33.8% of the UK’s electricity generation in the first quarter of 2024. The combined generation of the other renewables contributed 17.1%. This means that the total share of renewable energy to the UK was 50.9%. Clearly, the UK still relies on other means of electricity generation heavily. However, with a 2.1% increase in total renewable generation compared to 2023 Q1, it is also clear that improvements are being made [
2].
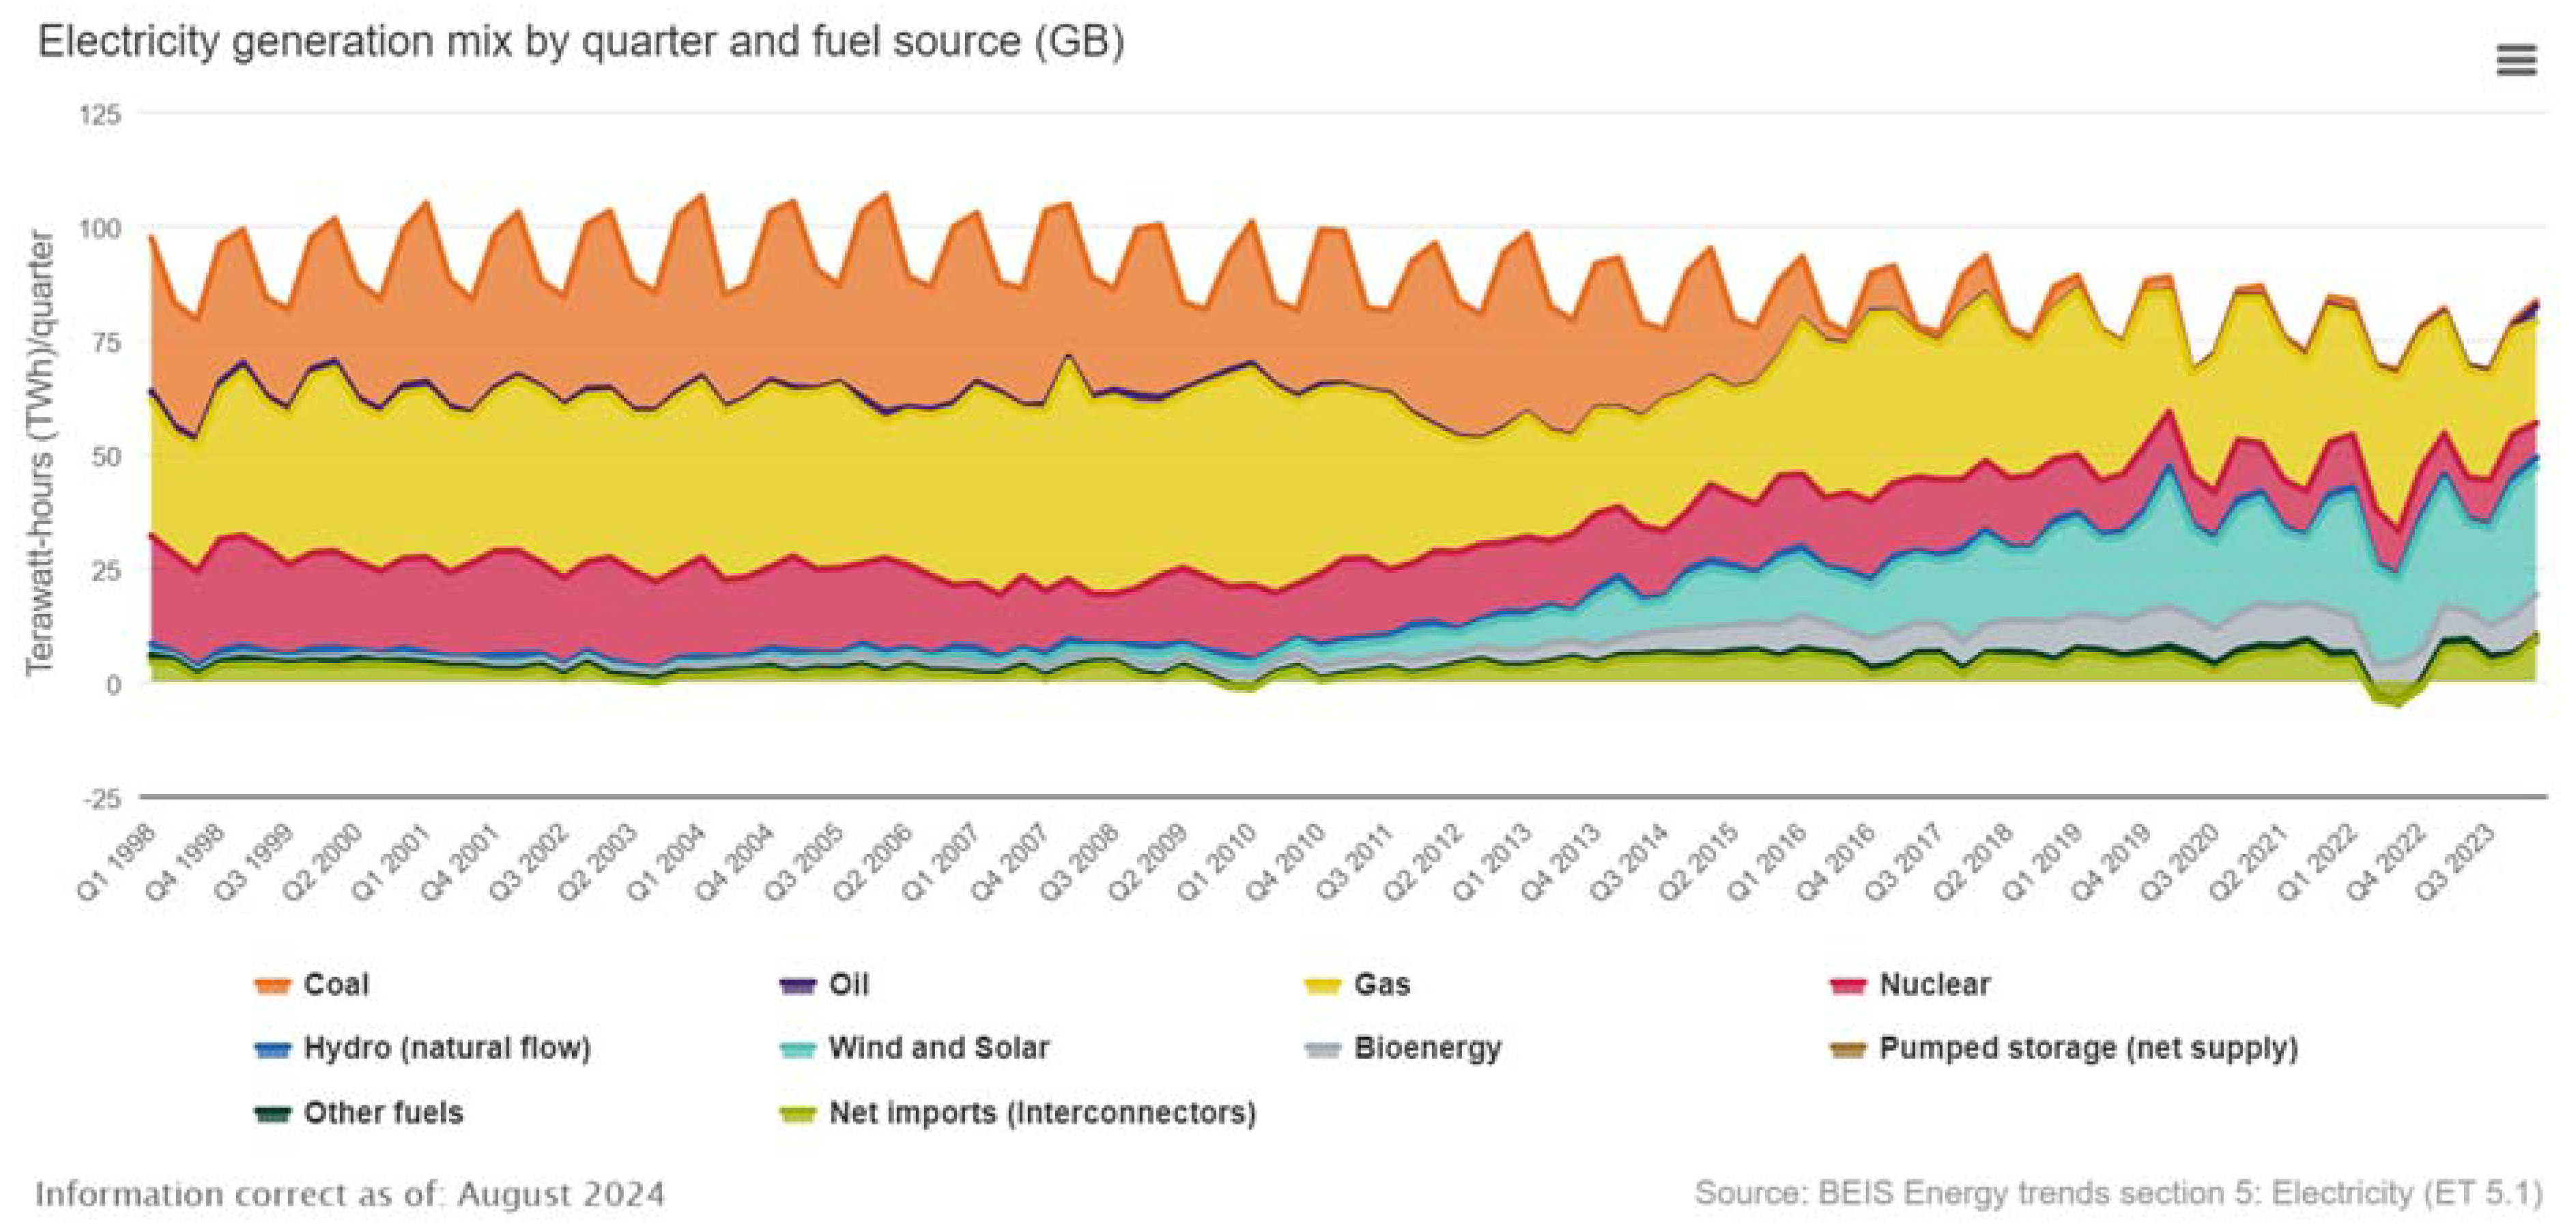
Figure 2 shows a visual representation of the development of wind energy over the years, compared to other energy sources. The graph shows that the UK’s dependence on harmful sources of energy production has decreased. The graph shows that more reliance has shifted to wind, solar and bioenergy. Although not the major reliance, the change shows a significant improvement for the future.
1.2. Wind Turbine Growth
Wind energy has shown itself to be a booming industry. A much more efficient system than solar has shown many countries using wind turbines as a source to their national grids. With the global wind capacity reaching 1045.95 Giga Watts at the time of writing, the world is realising the need to switch reliance from fossil fuels and onto renewable sources (1).
With the growing demand, so too does the need for manufacturers to innovate and advance their design. Wind turbines need to be bigger and rotate faster to maximise energy production. Blade manufacturers have turned to optimising their materials so that longer blades can be used, while also being lighter without sacrificing strength. Additionally, coatings are being advanced to protect the blades in harsh environments so that a longer life can be achieved.
Various manufacturers are developing blades of increasing size for both onshore and offshore performance [
4,
5]. With the growth and interest in wind turbines rapidly increasing so too does the issues associated with them. The demand for wind turbines to be bigger means stronger materials are needed to support the span of the blades. The demand for wind turbines to go faster means that the environmental conditions will be more severe.
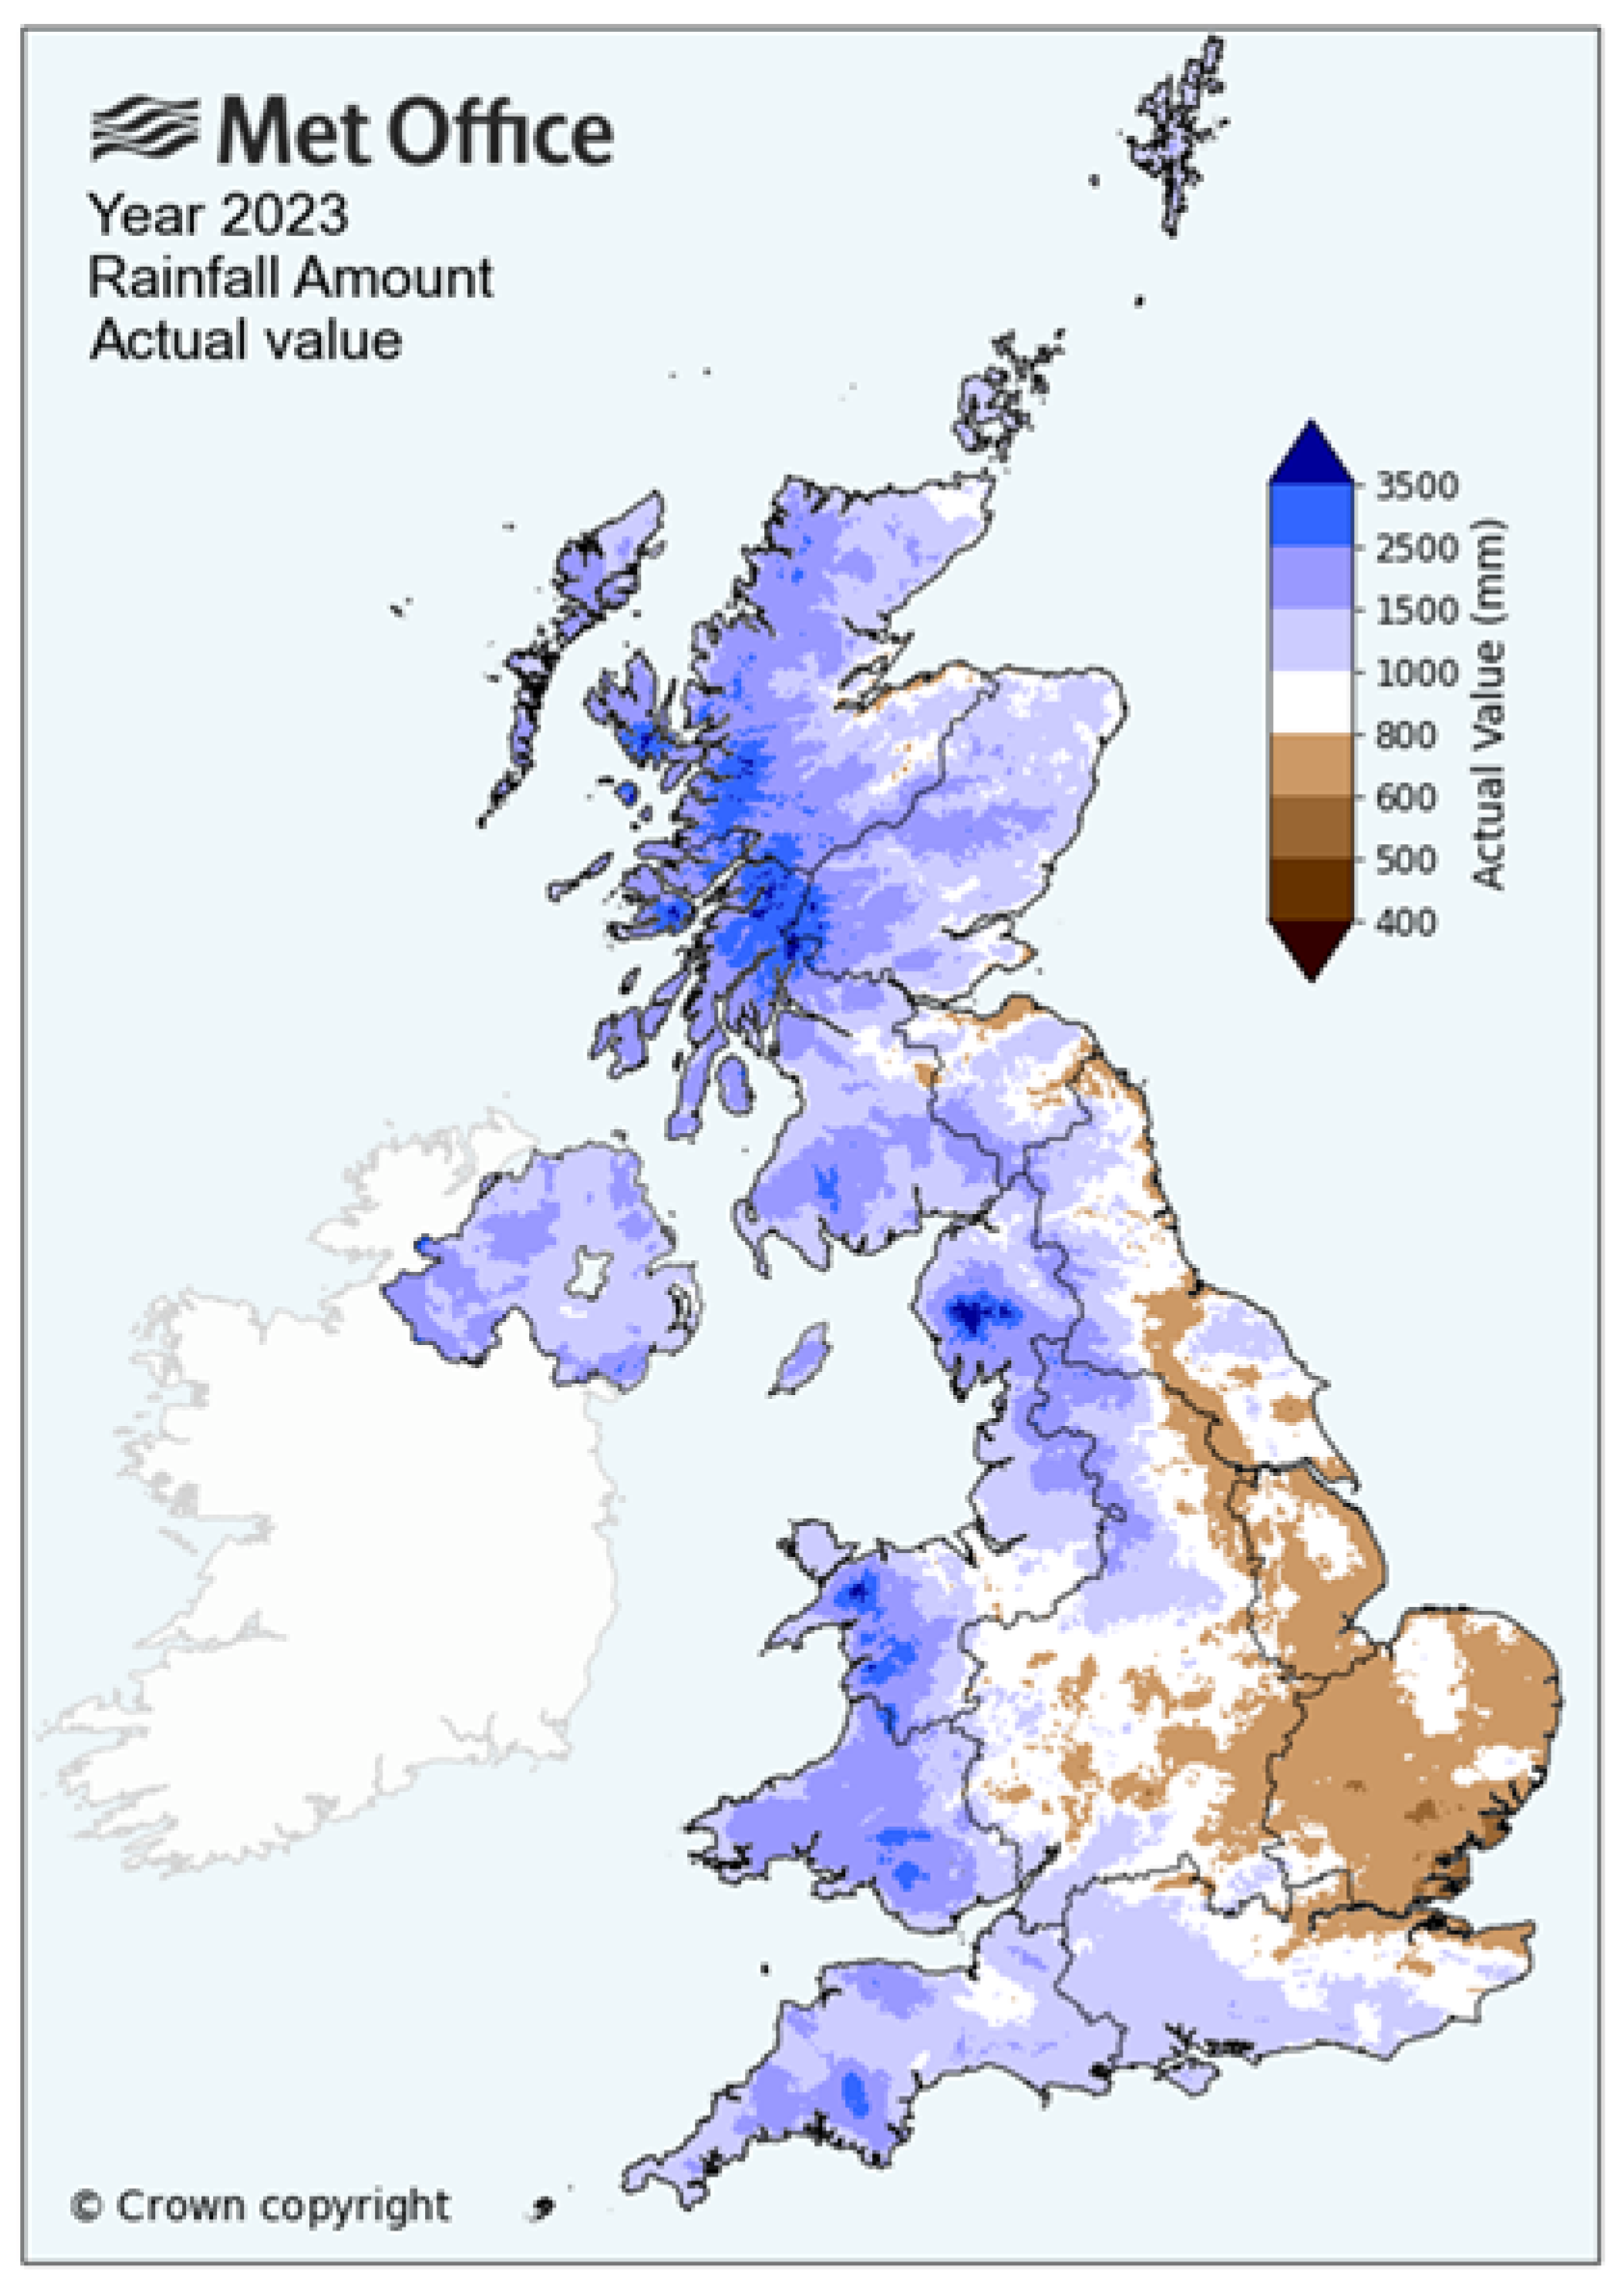
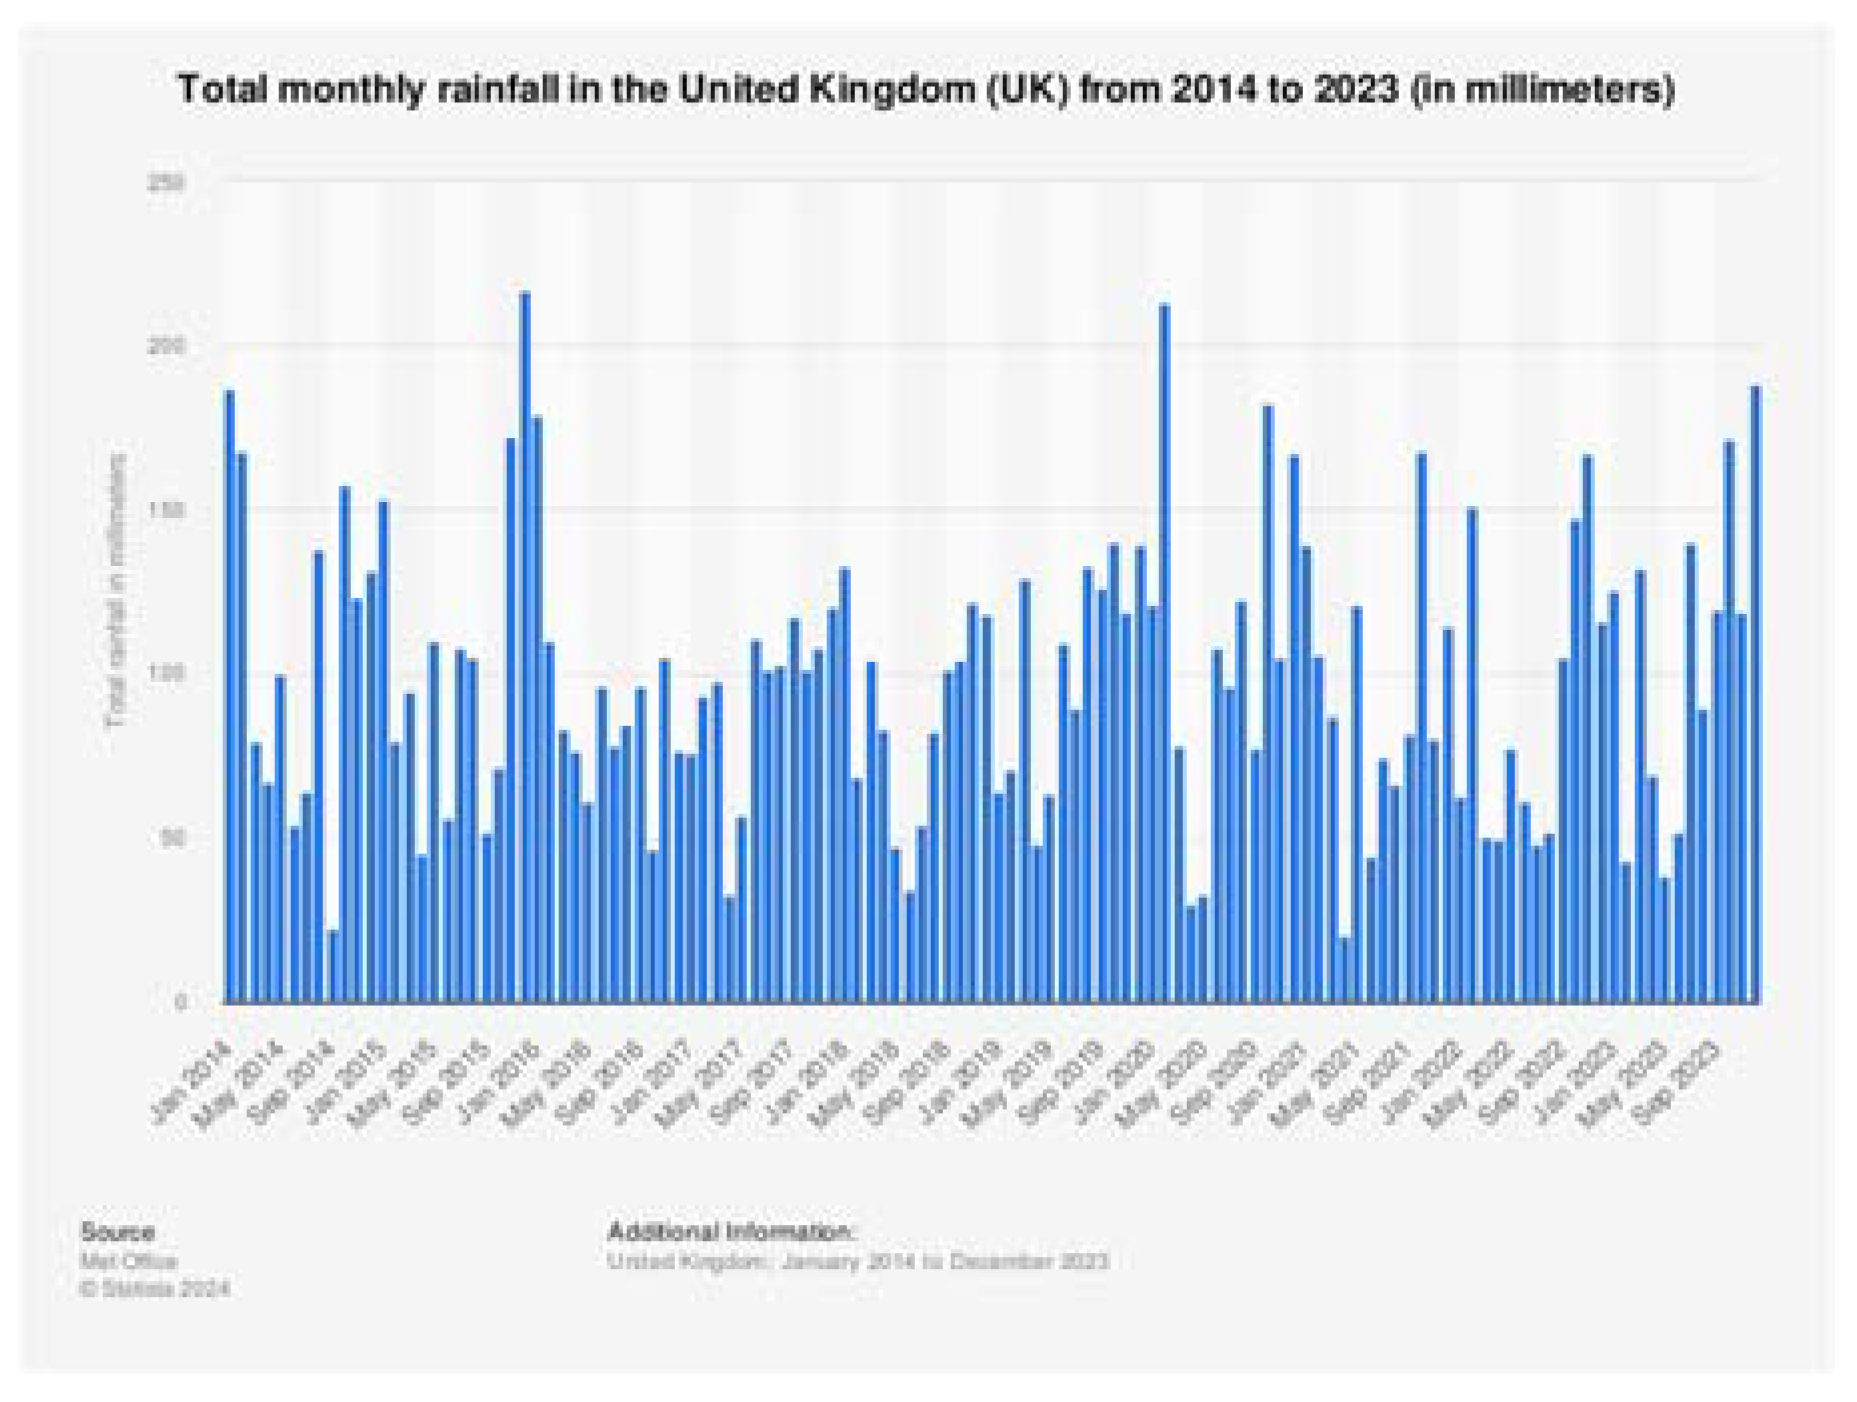
Figure 3 shows the rainfall distribution in the UK and Northern Ireland during 2018 and
Figure 4 show the rainfall history in the UK from the past 5 years. These figures are a good representation of the frequency and distribution of rainfall.
Figure 4 shows that rainfall is at it’s highest in the winter periods and lowest in the summer periods.
Figure 3 reveals that rainfall was highest during 2023 on the west coast, with peak rainfall in the north-west of Scotland.
Online sources generally agree that the maximum diameter of a raindrop is 4 millimetres [
8]. Raindrops that are bigger than this will split when falling. Additionally, raindrops of this size will normally fall at about 9 metres per second [
9].
However, the velocity of the raindrop falling is not what causes the issue, it’s the rotational velocity of the wind turbine.
1.3. Leading Edge Issues
As shown previously, wind turbines are advancing considerably and with that advancement they are getting bigger and rotating faster. As wind turbines develop longer blades then the tip of the blade will rotate faster, assuming the rotational speed is constant. This means that there is a higher likelihood of damage occurring in this area and thus, more maintenance needed.
The literature states that erosion is most likely to occur at the tip and on the leading edge of wind turbine blades. This should not be overly surprising as the tip is the maximum speed that the turbine will be operating at and the leading edge will have more compressional force acting on it.
This issue presents a significant problem to industry as the leading edge is the profile of the blade that faces the motion. The geometry of the blade is important as while a smooth finish will allow for optimum rotation and thus energy production, a rough finish will significantly hinder the turbines efficiency [
10]. However, with problems also comes solutions. The leading edge issue is one that many companies have taken on board to address. The growing problem has led many coatings companies to present paints, sprays and tapes as solutions to leading edge issues [
11].
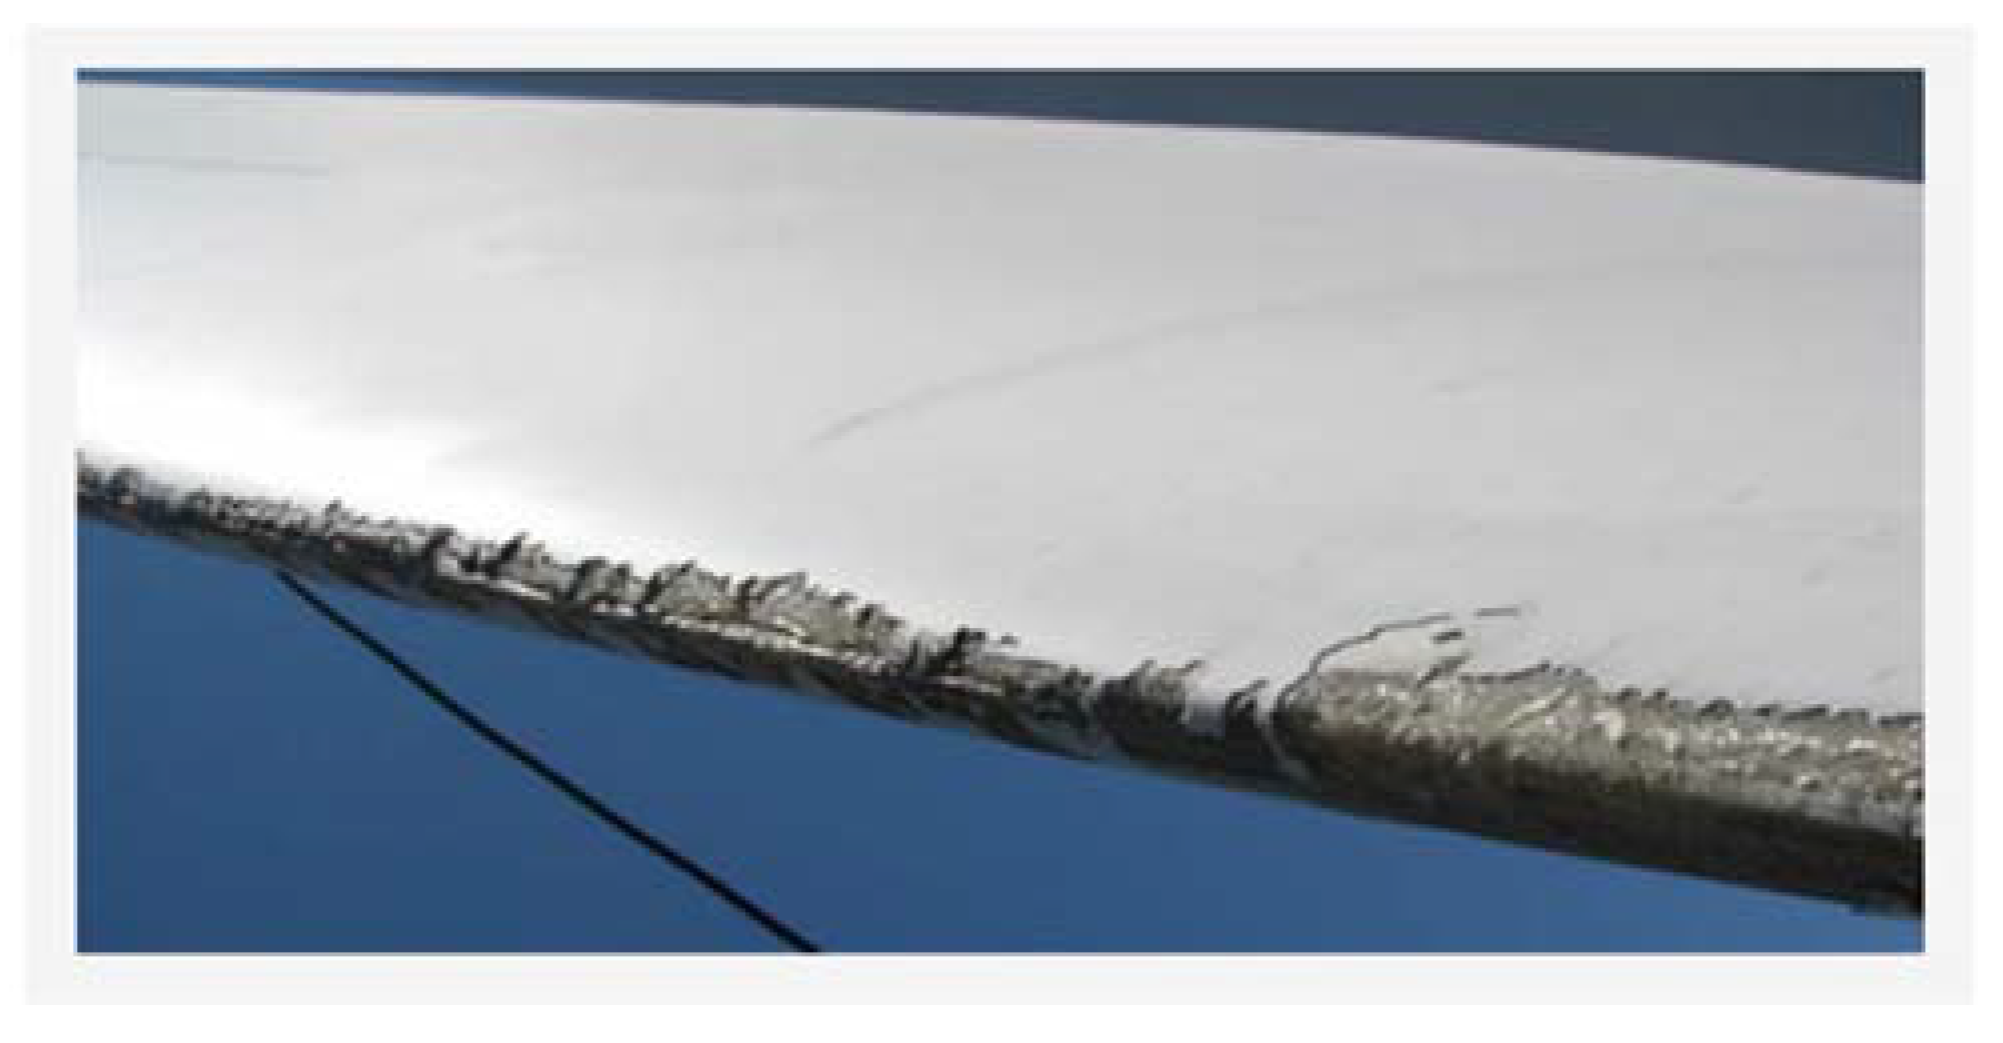
Figure 5 shows the damage that can occur on the leading edge of a wind turbine blade. The damage in this photo is likely caused by a series of different impact objects and has eroded the protection away. Rain erosion is just one part of this damage but due to the prevalence of rain in the UK it is a high influence.
The damage shown in
Figure 5 would have a high impact on the aerodynamic efficiency and thus energy generation, if the blade wasn’t repaired [
10]. Herein lies an issue for blade manufacturers and owners. The protection layer needs to protect against a variety of factors. The damage caused by this can be detrimental to the performance of the turbine. While a blade can have a life expectancy of 20 years, many coatings only have a life expectancy of 5 years [
11]. The blades need regular upkeep and monitoring to keep them performing at their best. It would be useful to have a guide for when maintenance should be carried out aside from visual inspections.
1.4. Material Selection
1.4.1. Blade Material
Wind turbines are massive structures that are constantly under loading. The wind supplies a heavy load on the blades as well as the span of each blade on larger wind turbines. Additional environmental factors can cause damage to the blades. These depend on location of the turbine. The toll of these loads mean that a wind turbine blade must be sufficiently strong so that it can operate.
However, for blades to operate efficiently then they must also be light. Herein lies a problem in the development and manufacture of wind turbine blades. With it comes the possibility of innovative advancement. While traditional metals could be used for blade strength, the weight of the resulting product would make it inefficient to generate electricity [
12].
It is for this reason that many blade manufacturers opt to use Fibre Reinforce Polymers (FRPs). FRPs are materials where a matrix, in the form of fibres, are introduced into a polymer for reinforcement. This is typically done to create a final product that has the desired properties of both the polymer and matrix [
13].
The matrix used can be many materials but the most commonly used in blade design are glass fibre (GFRP) and carbon fibre (CFRP). CFRP has been used across industry to take advantage of the beneficial properties of carbon. CFRP has been shown to have superior mechanical properties to that of GFRP, as well as being lighter. The problem that many blade manufacturers have with producing a blade made fully out of CFRP is with damage tolerance and compressive strength.
Difficulties with manufacturing CFRP mean that it isn’t very suitable due to the high compressive loads that wind turbine blades face. Additionally, carbon has been shown to have a low damage tolerance which would make it impractical when considering the projectiles that meet blades when operational. Moreover, the cost of using CFRP far exceeds the cost of GFRP.
While the drawbacks of having a full skin of CFRP is evident, the advantages should not be ignored. CFRP is lighter and has superior mechanical properties. The issue is that it would be impractical to have a blade made completely out of CFRP. Recently blade manufacturers have begun optimising their blades by incorporating CFRP into GFRP blades as a reinforcement.
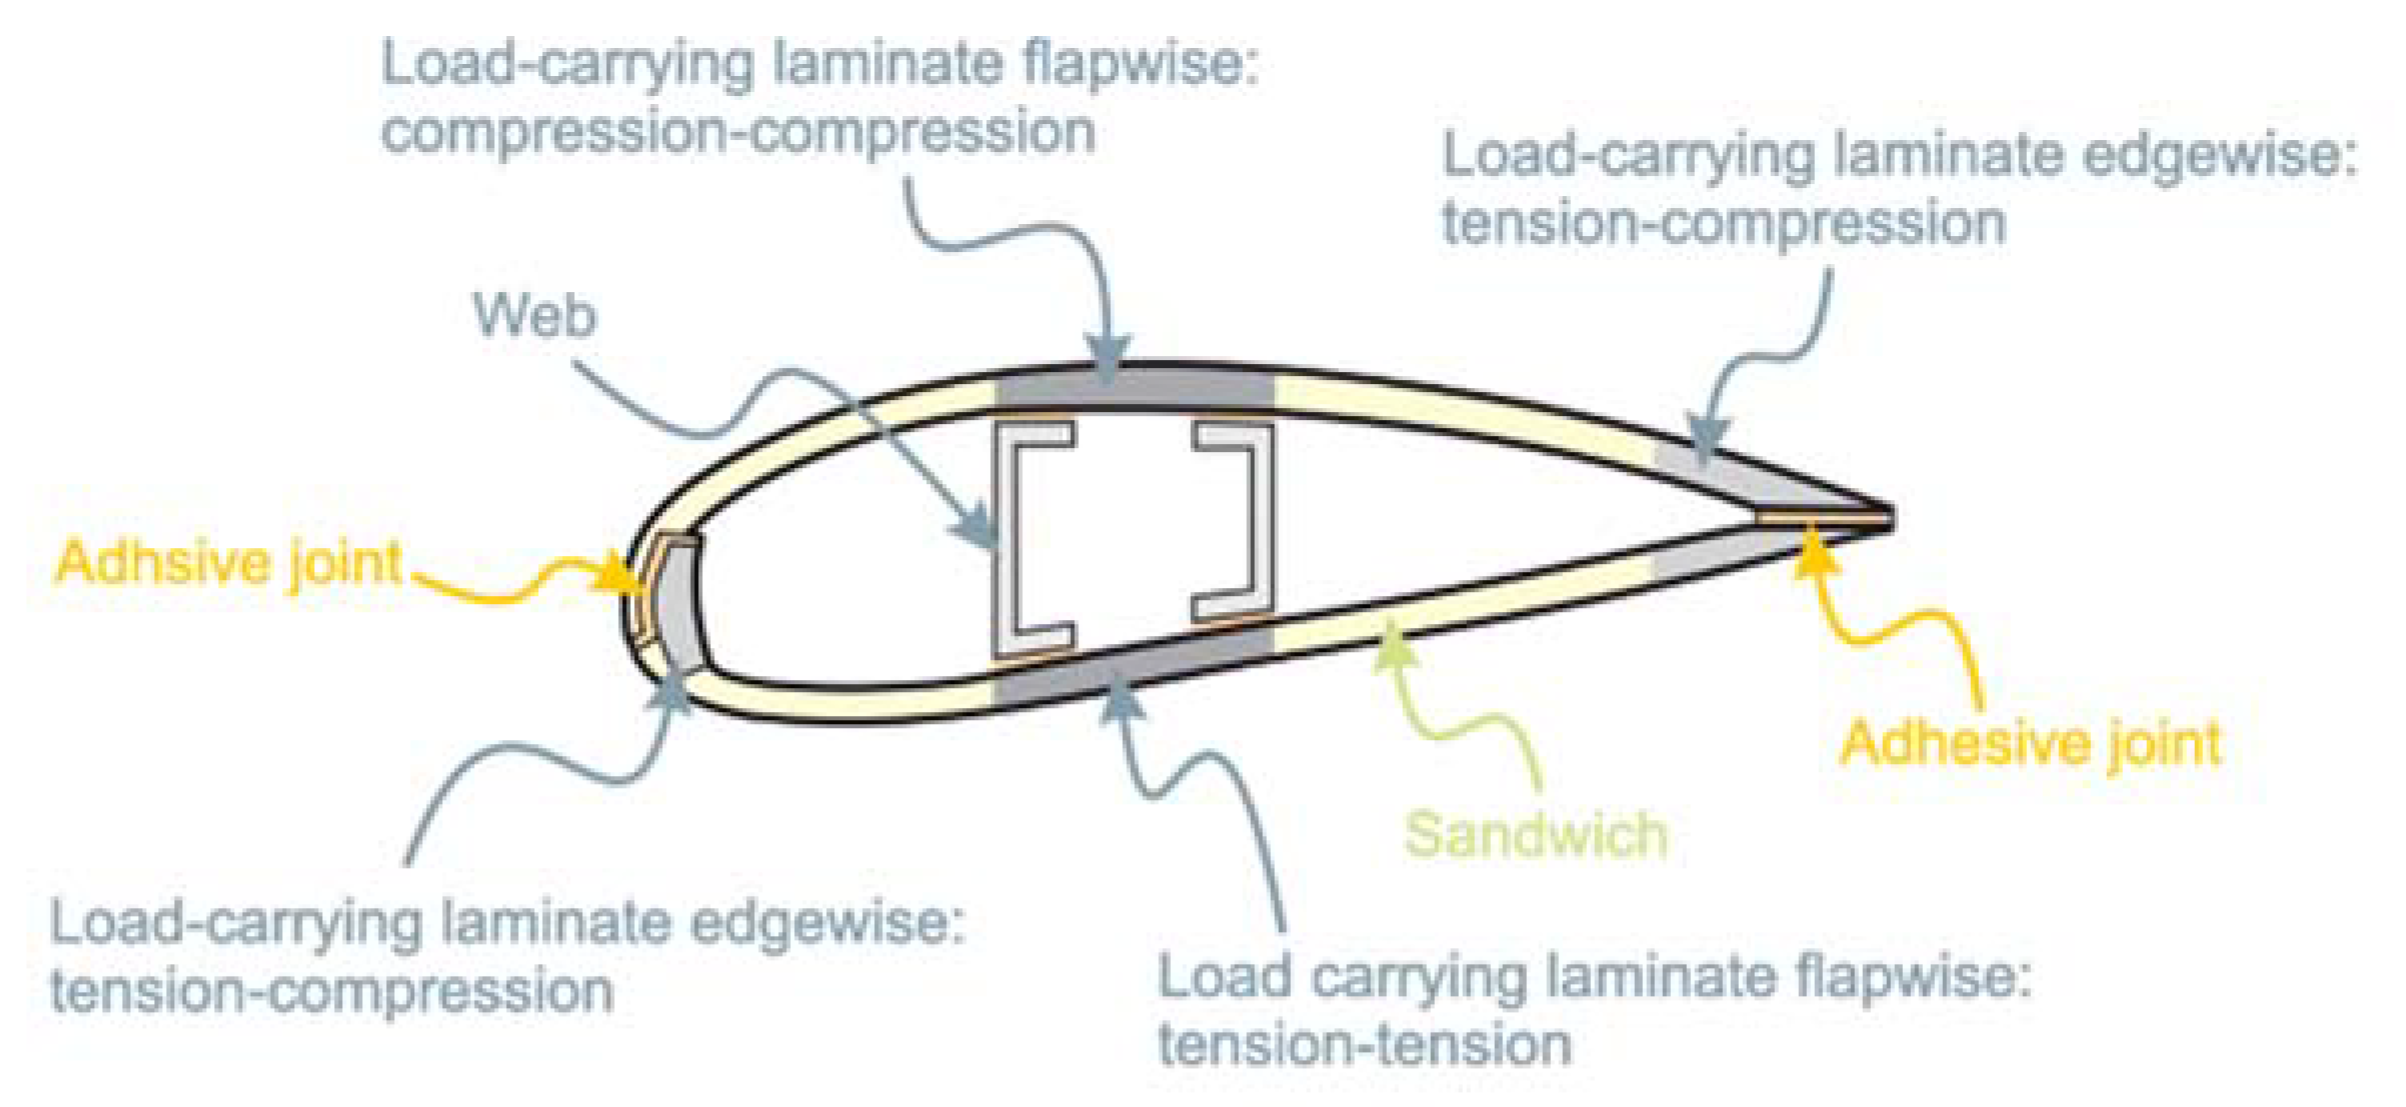
Figure 6 shows the structure of how a wind turbine blade is formed. This cross section is an aerofoil. The specific shape of this varies but this is what m moves the wind turbine when wind hits it. The outer shell is made of composite (FRPs). The inner materials are used as a structure, or a webbing. This method gives the structure strength while also keeping it light. Other than the internal web structure, the wind turbine blade is hollow.
1.4.2. Blade Coating
While the choice between CFRP and GFRP for blade design is essential so that the blade can perform well under high loads and generate electricity efficiently, the blade coating is important to protect against the elements.
Wind turbines can be exposed to many harsh environments. The effects that these bring is dependent upon the area. For example, in the UK, wind turbines can be exposed to a high volume of rain and hail. Additional extraneous material and insects can prove damaging to the blade’s efficiency. Bird strikes can also have serious damage [
14,
15].
The effects that rain, hail and extraneous material have on the blade is typically predicated upon the coating used. Coatings are developed by companies to protect the blade against the harsh environment it will be in.
2. Methodology of model
2.1. Raindrop Impact
The nature of the raindrop impacting a wind turbine blade is a complex one. This is due to the unpredictability of rainfall combined with a rotating structure. The impact phenomena are hard to precisely characterise, so the best effort is to make reasonable assumptions. These assumptions are in the form of impact equations that can be used as a comparison.
2.2. Springer Model
Springer suggested that the water hammer equation, given in Equation 1, was a good way to estimate the impact pressure of a raindrop on a solid surface [
16].
where P is the pressure generated by the droplet on the surface, ρ is the density of the raindrop, c is the speed of sound in the raindrop and V is the speed of the raindrop on impact. While a good estimation, the above equation fails to account for;
The material properties of the impacted surface
The material properties of the raindrop will remain constant
Impact angle is negligible
The size of the droplet is negligible
These are quite important assumptions to make in a study such as this and contradict the investigation plan put forward in this study. Despite this contradiction, the water hammer equation was thought to be a good comparison to make against the results of this study.
A modified water hammer pressure equation was suggested by Springer to account for the material properties of the impacted surface and the angle of impact of the droplet. This modified equation is given in Equation 2 [
16].
where the subscripts L and S denote the properties of the liquid and solid, respectively. This formula is a more accurate representation of the pressure generated by a droplet upon a solid surface. A limitation this modified equation shares with the original is lacking to consider whether the droplet volume will influence the pressure generated.
2.3. Raindrop Impact Development
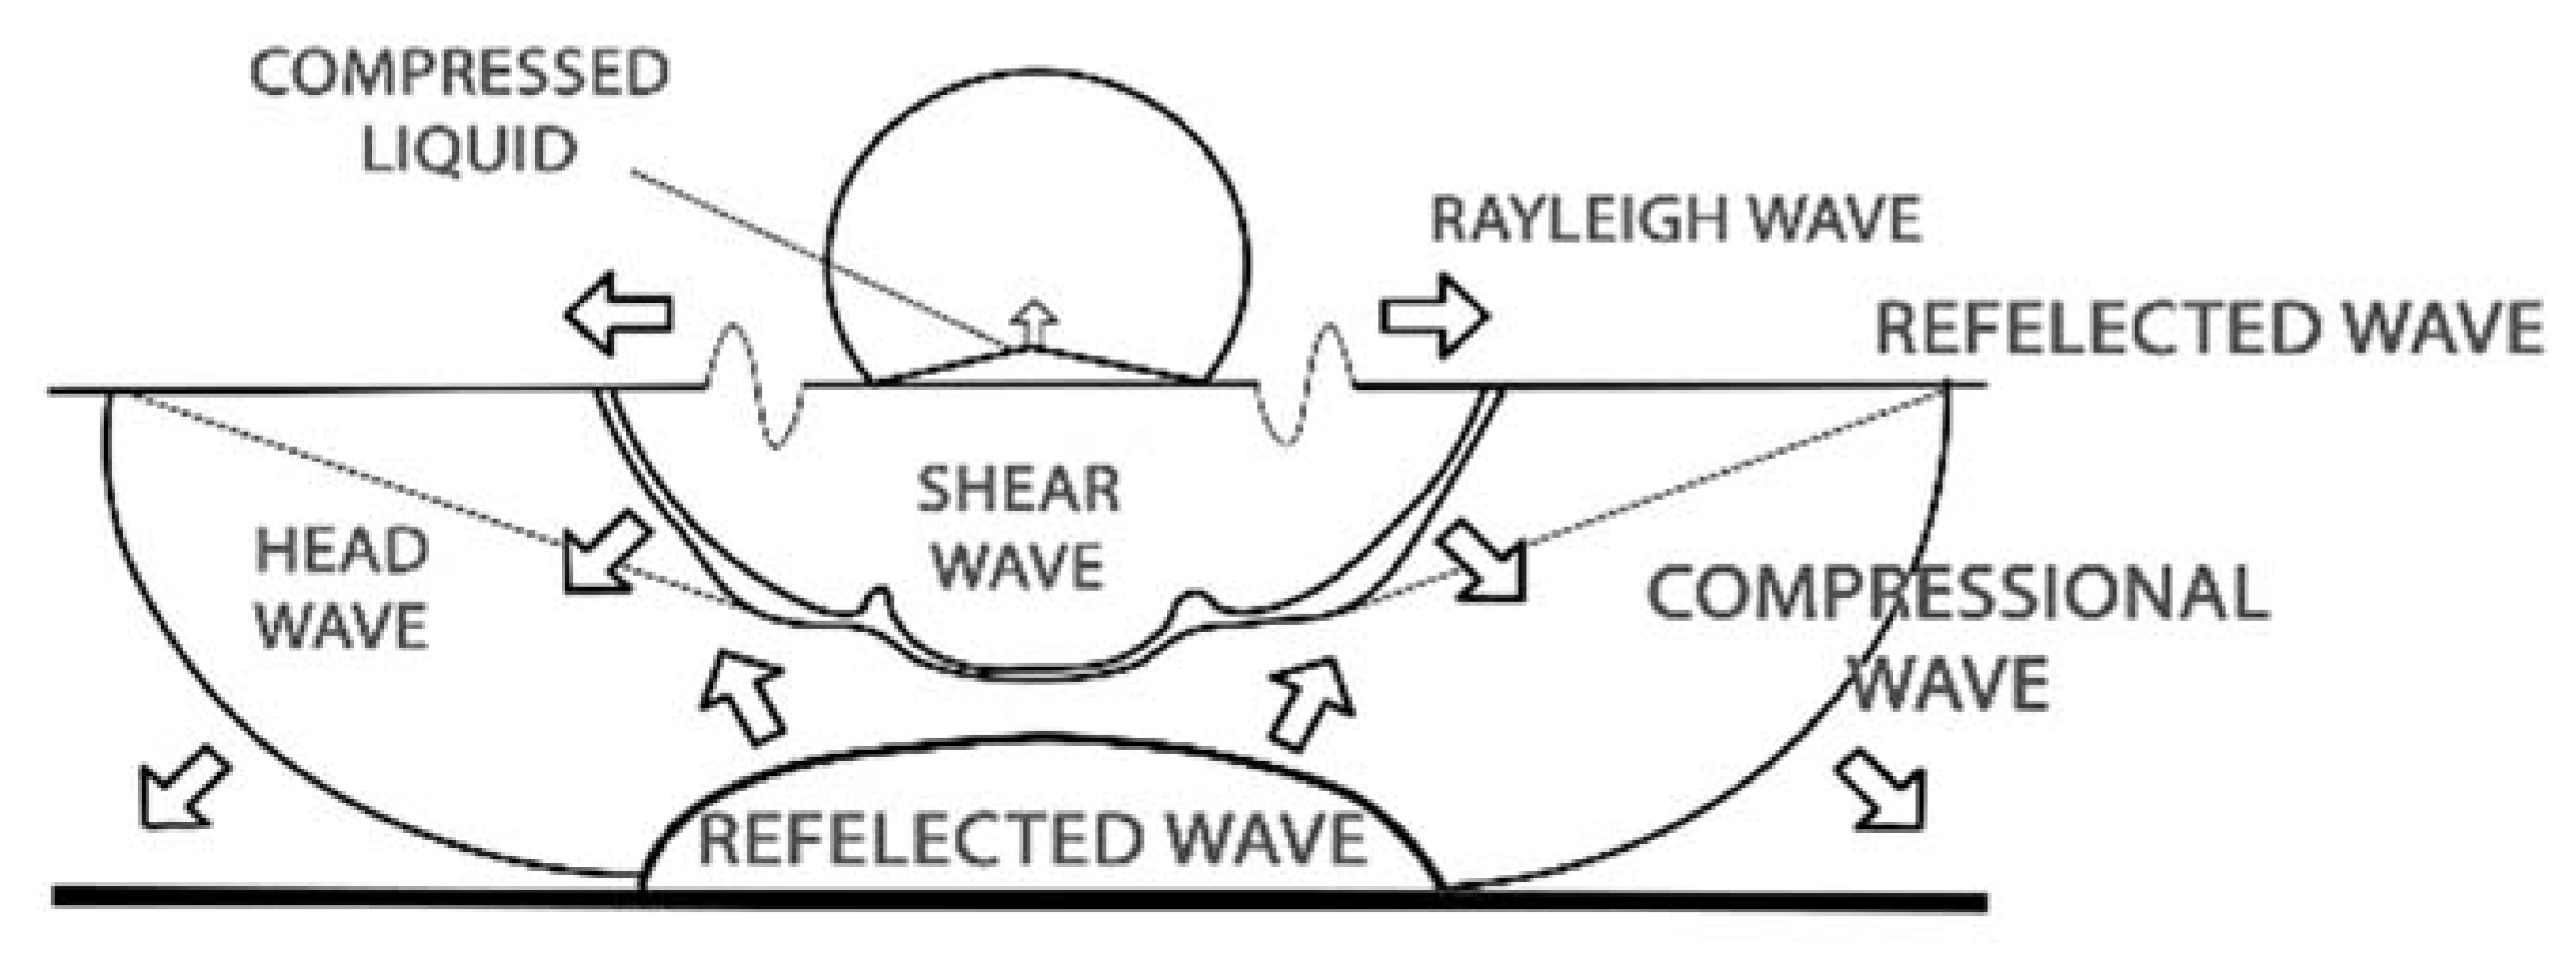
As previously stated, the pressure equations may be used to characterise the initial impact event. However, this is not the only important event in the development of the impact event. The pressure equations describe the initial impact and therefore the stresses generated by this impact. Subsequent to this initial impact, a shock wave propagates through the solid material.
Figure 7 shows this propagation through the material. The initial wave created, the Rayleigh wave, is restricted to the surface of the impacted solid and is responsible for ~2/3 of the impact energy generated by the droplet [
17].
Gohardani goes on to describe how the liquid impact can be separated into two different stages;
Compressible Pressure
Static Pressure
The compressible pressure stage is governed by the first impact stage and represents the water hammer pressure generated by the droplet on a solid surface. The static pressure stage is represented by
Gohardani also states that the compressible pressure is far greater than the static pressure. For this reason, in terms of setting up a droplet impact simulation, the compressible pressure event is focused on.
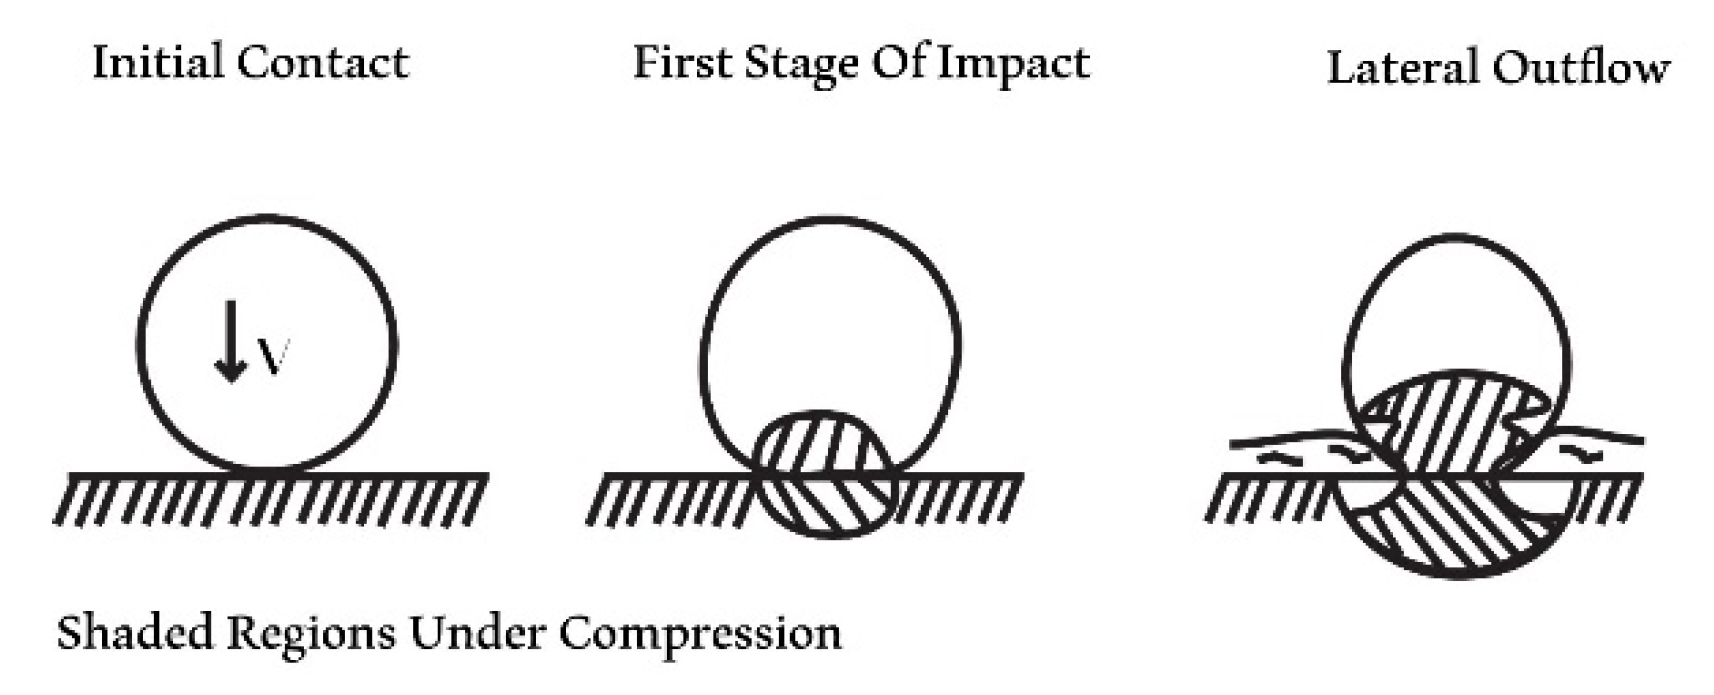
Springer also mentions the compression pressure impact phenomena. The work conducted by Springer suggests that this stage, before lateral outflow, is the influence of damage caused by the impact [
16].
Figure 8 shows the development of a liquid droplet upon impact with a solid object. The picture shows the droplet and solid response to the impact. The work described here suggests that the highest compressible pressure occurs before lateral outflow. So, the droplet will impact the solid. The solid will compress fluid back into the droplet, deforming the droplet. The compression causes shock waves to occur in the material as shown in
Figure 7. After this stage lateral outflow will begin which is where the droplet will deform more and spread outwards. This stage can cause additional damage if there are deformities in the solid.
2.4. Modelling Methods
When modelling a high velocity impact event such as this, there are three commonly used methods.
Lagrangian/Lagrangian – This is the standard method when analysing an impact scenario. The standard Lagrangian method is applied to all methods. Although this is the standard used it is unsuitable to be used in simulations where large deformations are likely to occur – such as the simulations used in this study.
Eulerian/Lagrangian – This method uses the Lagrangian method to model the impacted solid, where deformation is expected to be low. However, the droplet projectile would be modelled using a Eulerian method. The Eulerian method employs the use of a Eulerian domain which surrounds the model and a mesh is applied to this volume. Bodies within the Eulerian domain will adapt as deformations occur [
18].
Smoothed Particle Hydrodynamics (SPH) – This method uses a mesh free system applied to bodies. Instead of a mesh applied, the SPH method uses particles that are represented by the density of the body. The number of these particles, like a traditional mesh, can be as many as you like. This method has been used in many applications such as rain and hail erosion as well as bird strike analyses [
19].
Due to the high deformations expected in a raindrop geometry when it collides with a solid surface, it is expected that the Eulerian/Lagrangian or Smoothed Particle Hydrodynamics are best to be employed in subsequent impact simulations.
2.5. Model Development
Based on the findings found in the literature review, it was decided that a series of simulations should be conducted for high velocity raindrop impacts using the Eulerian/Lagrangian and SPH methods. The results from each simulation could then be compared to the theoretical equations presented by Springer. Finally, a comparison between the two methods will be made to show the most suitable method for further simulations.
Figure 7 is a representation of how the water hammer pressure will be estimated within the models. The water hammer pressure will be valued as the pressure within the droplet before lateral outflow begins.
3. Results
3.1. Eulerian/Lagrangian Model
3.1.1. Impact Parameters
The overall purpose of these simulations was to confirm that the droplet behaviour was correct. The behaviour of the target body was of no interest and therefore was assigned as a rigid body. Therefore, the material for the target body was selected to be structural steel as this was easily preloaded in the Ansys Workbench database. The material labelled ‘Water’ in the material database was chosen for the droplet. The target body was a square plate with a Lagrangian mesh assignment. The droplet was a Eulerian modelled sphere with a diameter of 3 millimetres.
The duration of the simulation was dependent upon the speed of the droplet, since this was varied from 40 to 140 metres per second.
The simulation was repeated with impact velocity being the only parameter that was varied. The average time for the simulation to solve was approximately one hour.
3.1.2. Impact Results
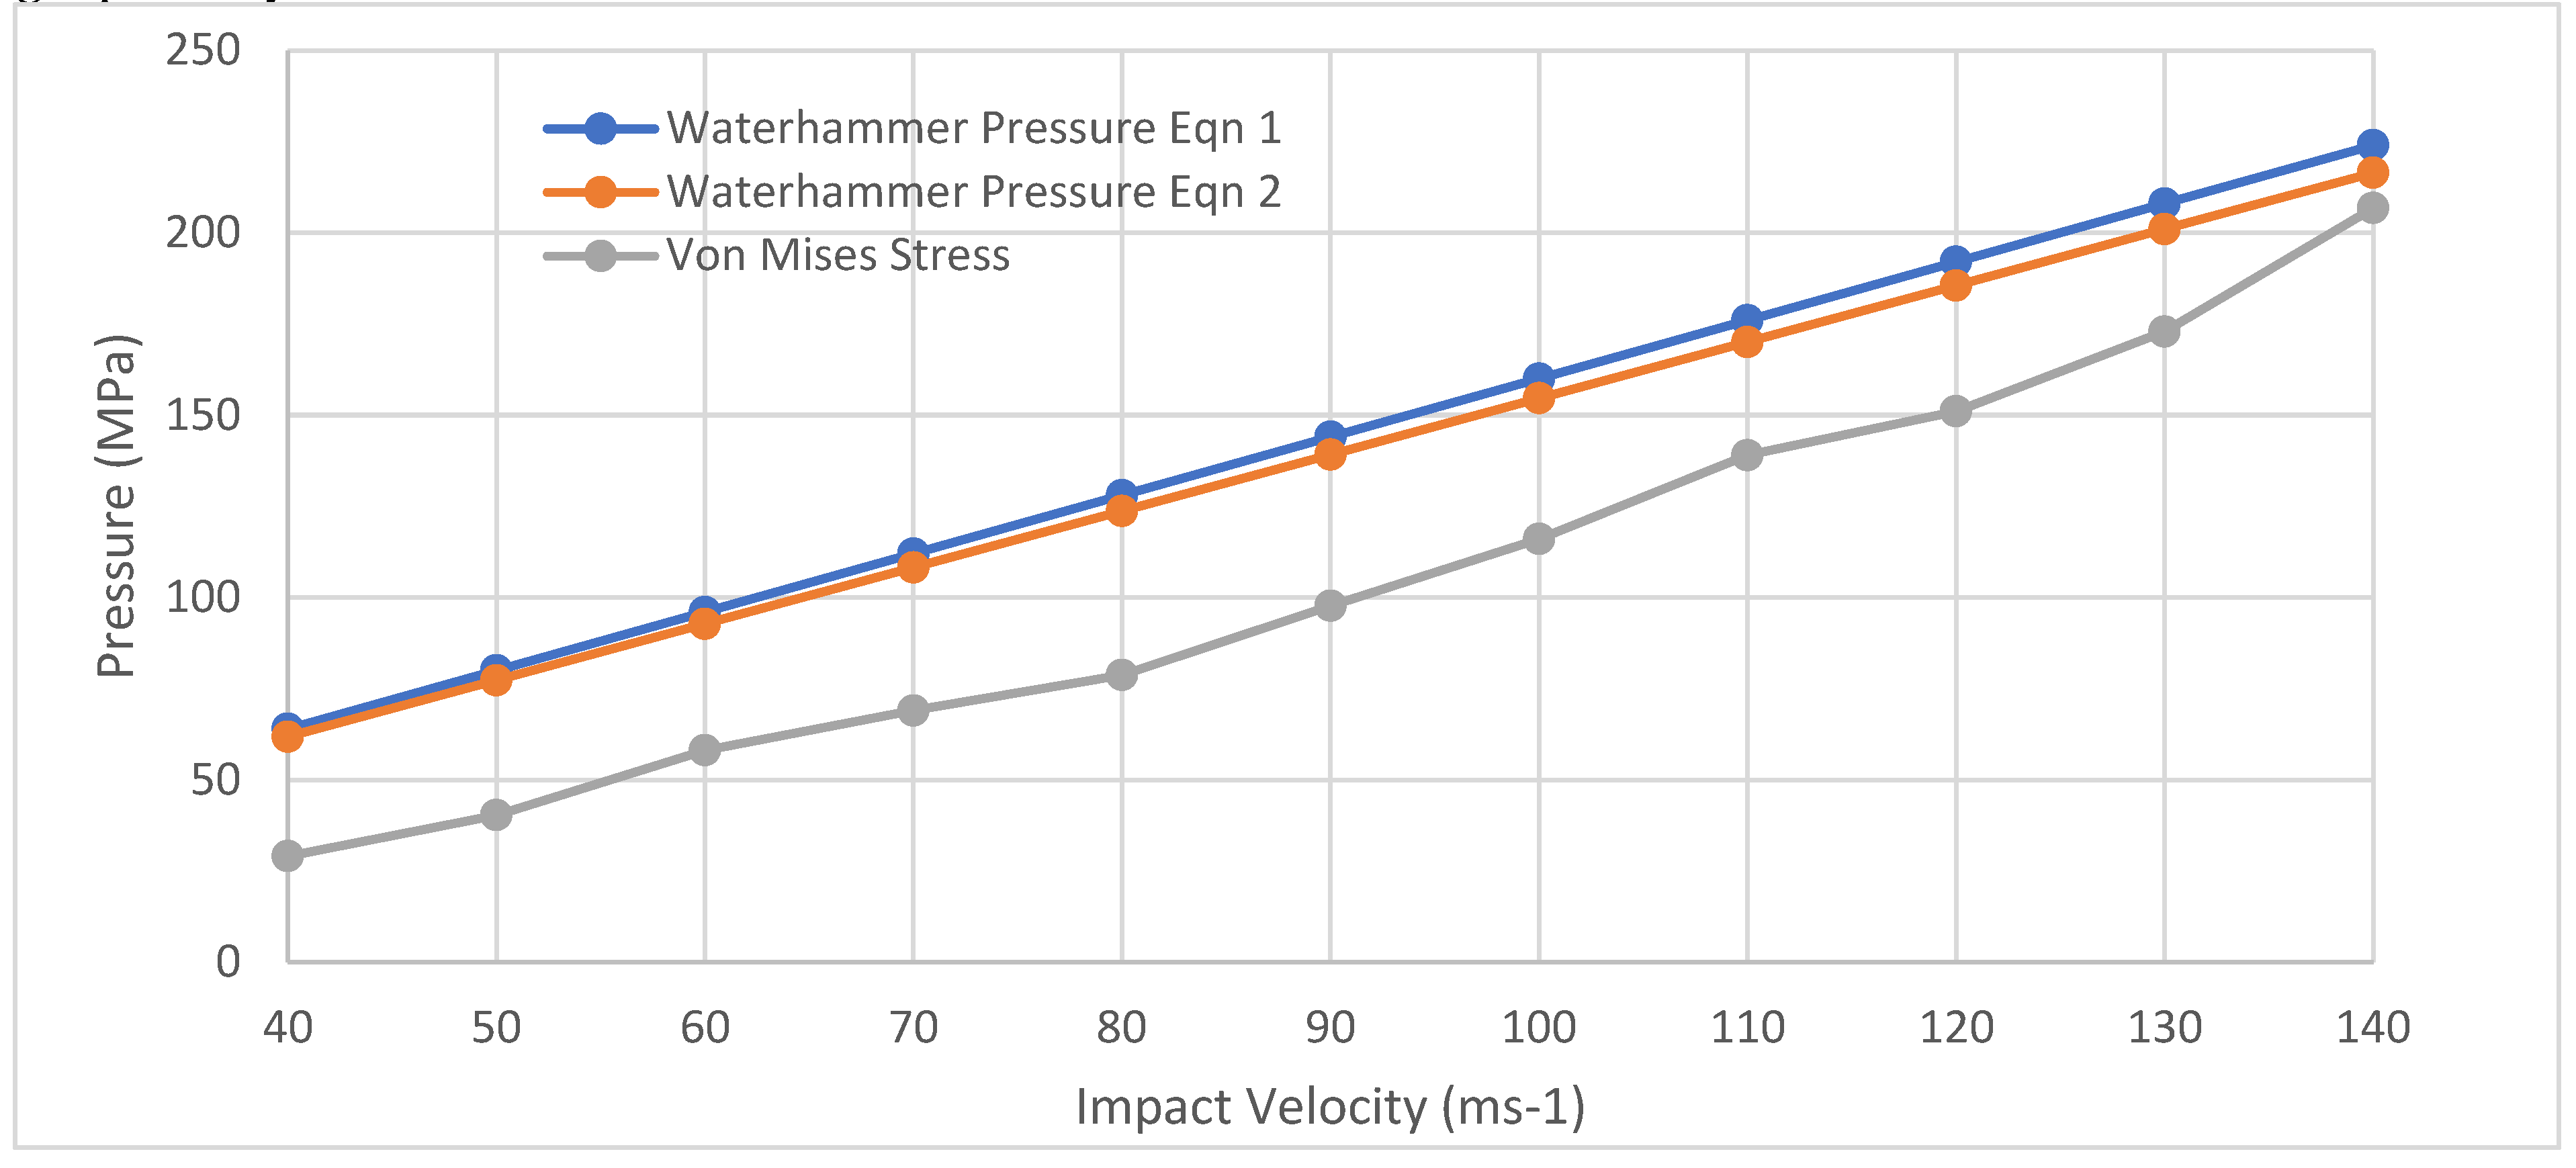
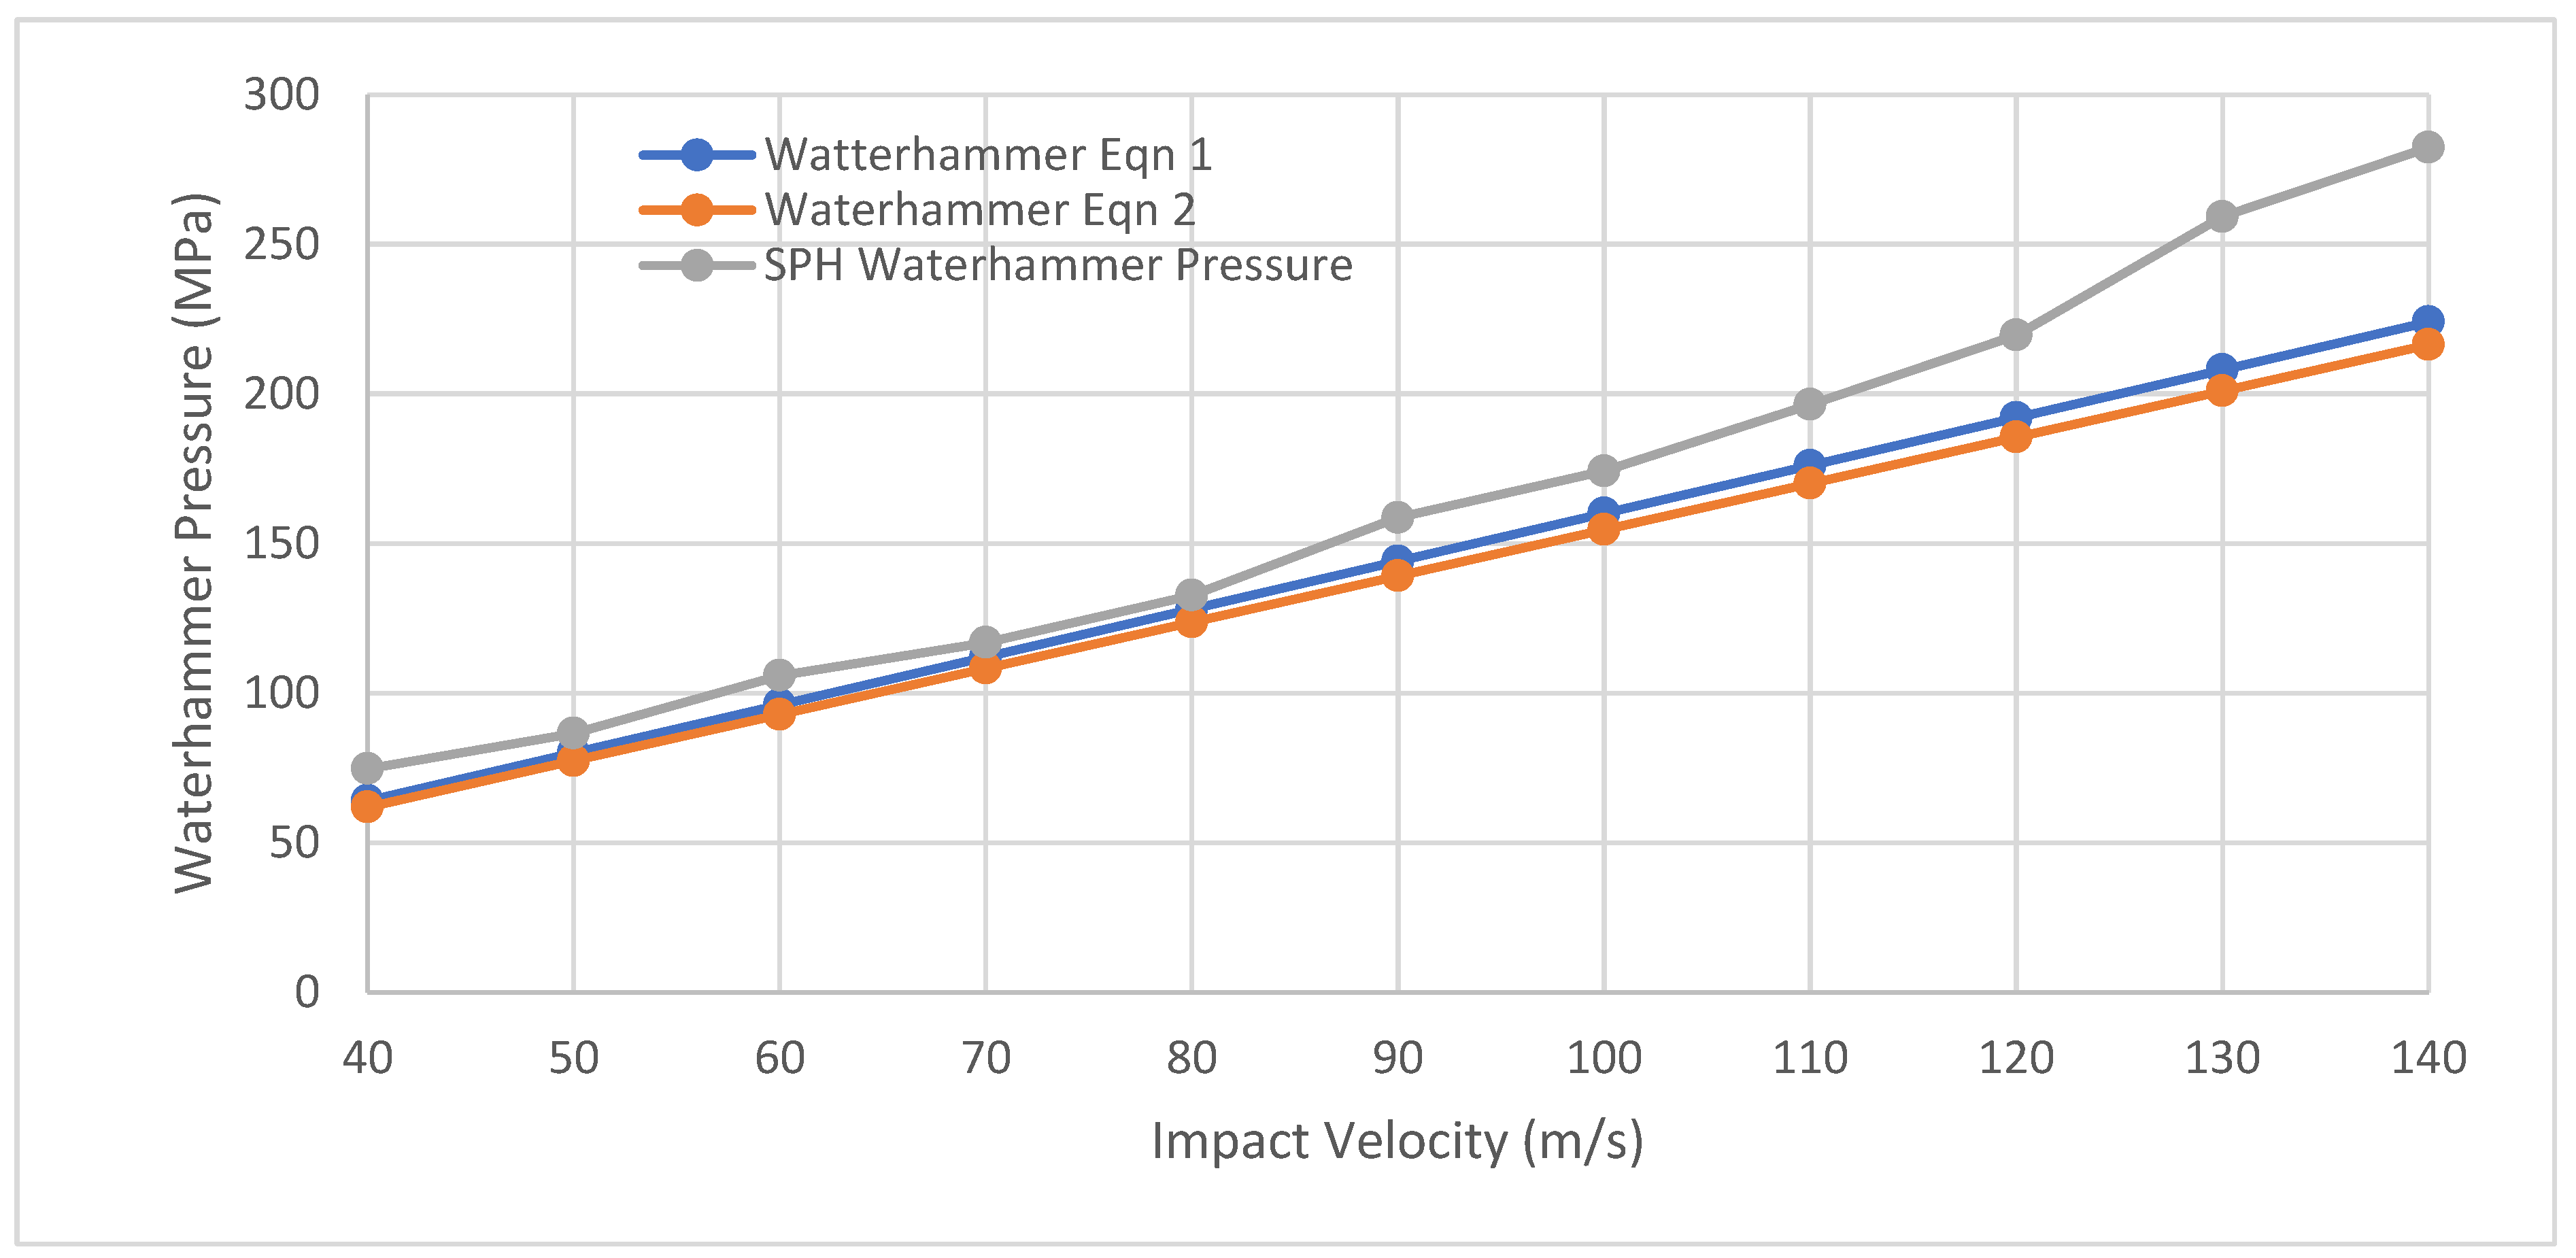
Shown below is the water hammer pressure generated by the droplet for each simulation at different speeds. This result was then compared against the theoretical equations. This is shown graphically.
Figure 9.
Graph comparing the Eulerian/Lagrangian analysis against the theoretical water hammer equations.
Figure 9.
Graph comparing the Eulerian/Lagrangian analysis against the theoretical water hammer equations.
From this analysis it can be shown that each equation and the pressure generated by the droplet follow a similar trend. Additionally, the results closely resemble each other with only a slight deviation. This could be due to factors not included in the water hammer pressure equations, such as the droplet diameter.
3.2. Smoothed Particle Hydrodynamic Model
The Smoothed Particle Hydrodynamics (SPH) model utilises the LS-DYNA software. The LS-PrePost tool was utilised for both pre-processing and post-processing work [
20].
3.2.1. Geometry Creation
For the rigid material, the Shape Mesher tool was used to create a square box with the dimensions 10x10x1 mm. This size was thought to be enough to record the impact properties for the droplet. An arbitrary mesh of 100 elements was applied to the box.
For the water droplet, the SPH generation tool was used to generate a sphere of diameter 3 millimetres with a density of 998kg/m3. The table below contains additional information regarding the model. The sphere was assigned with SPH nodes by specifying the required number in the x, y and z directions. The total number of SPH nodes assigned to the geometry is the multiplication of the x, y and z values. This value represents a node total for a cube. Since a sphere is symmetric in these directions it was decided that the value chosen in each direction would be the same. However, a sphere with the same diameter as a cube’s length will have a smaller volume. The value of the nodes within the droplet was shown to be equivalent to the volume of a sphere, where the radius is half the value chosen for the direction value.
3.2.2. Model Creation
The LS-DYNA software uses a keyword system to generate simulations. This system was used to specify the material properties of the droplet and rigid surface, the initial and boundary conditions, the parameters to record and when to stop the simulation.
The water droplet was assigned its material properties using the MAT_NULL and EOS_GRUNEISEN keywords. The first to show waters density and the second to model the droplet with an equation of state. These values can be shown below.
Table 4.
Table showing the material properties used for the water droplet.
Table 4.
Table showing the material properties used for the water droplet.
| MAT_NULL |
|
| Density (kg/m3) |
998 |
| EOS_GRUNEISEN |
|
| C (m/s) |
1647 |
| S1 |
1.921 |
| S2 |
0 |
| γ |
0 |
Other values used in the simulations can be shown below.
Table 5.
Table showing the parameters used in the model.
Table 5.
Table showing the parameters used in the model.
| Number of SPH nodes |
65k |
| Viscous Dampening |
40% |
| Velocity of Droplet |
40-140m/s |
| Impact Angle |
90 degrees |
The impact angle was kept constant throughout this run of simulations. The purpose of these simulations was to attempt to validate a model, not show the effects of varying parameters. The number of nodes used and the value for dampening were done by running convergence tests.
3.2.3. Post Processing
The results of each simulation were analysed using the LS-PrePost tool. For each simulation, only the velocity of the droplet was considered. The results recorded were the pressure generated by the droplet on impact. These results were plotted using excel so that a comparison to the theoretical water hammer equations could be made. The results of the water hammer pressure generated by the SPH water droplet can be shown in the graph below. The average time for the simulations to be completed was 6 minutes.
4. Discussion
As can be seen from
Figure 4 and
Figure 5 both graphs follow a similar linear trend to the results obtained from the water hammer equations.
Figure 5 shows results that more closely resemble that to the theoretical water hammer equations. The usefulness of this comparison shows that the properties of the impacting material do matter. The first water hammer equation (reference)only assumes influence of liquid properties whereas the second asserts that the properties of the impacted solid material are of equal importance.
Indeed, the impacted material should have a consideration. As stated by Gohardani (17) in his work with material response, the shock waves within the material cause damage. The material properties have an effect on the erosion signature. Density and speed of sound will influence the spreading and reflection of the shock waves in the material.
Equally, the water hammer pressure effects are similar to the theoretical equations in
Figure 5 but vastly different in
Figure 4. The differing between the two modelling methods results is a cause for concern when considering a comparison, though should not be surprising. The two methods are very different in how they solve the problem presented. Moreover, the results outputted are vastly different. The results shown in the Eulerian analysis [
21] are showing a material response in the form of the Von Mises stress [
22] whereas the SPH results show the development of pressure within the droplet. However, the question remains as to which the correct answer is.
Given that the SPH results
Figure 10 show a closer comparison to the theoretical equations it would be fair to assume that this is more accurate. However, referring to the modified water hammer pressure reveals the flaw in such an argument. The equation does not consider everything that the models do, such as droplet diameter. However, when considering the size of the droplets it must be considered how much difference it will make.
Other considerations that must be compared of the two models are the computational time and thus the performance of each software. Ansys completed each simulation at an average computational time of 1 hour. Considering the tracking elements that the Eulerian domain uses in the Eulerian/Lagrangian analysis, this is a fair completion time. However, the SPH analysis, that uses a mesh free system, performed far better with an average computational speed of 5 minutes.
The consideration here is that these simulations are only considering the development of the water droplet. An argument could be made for the use of the Eulerian/Lagrangian analysis in favour of the SPH analysis. However, when considering that future simulations will be more complex, with the aim to solve material response and erosion then the SPH analysis is superior. Indeed, the analysis system used was designed for use with crash analysis which makes it ideal for high velocity droplet impact. The LS-DYNA software has shown to be more performance than functional. The keyword system is a fairly basic way to input parameters and is inferior to Ansys’ user interface. Whereas Ansys prefers an attractive user interface and is a general-purpose solver, LS-DYNA is made for a specific purpose which it excels at. Hence, the decision was made to carry out future simulations with the LS-DYNA software.
It is apparent that both modelling techniques presented in this paper have their merits and the software used are useful for different applications. The Ansys software has shown to be capable of carrying out the work required but is not as efficient as the LS-DYNA SPH analysis. The results from the SPH analysis has been assumed to be more accurate as the progression of the droplet in the SPH model appeared to behave more accurately.
Additionally, from research conducted, it appears that the LS-DYNA software has a better functionality for the future work that is planned.
Despite the extremely useful capability of this keyword, some immediate flaws can be seen. The CASE keyword would only allow the same droplet diameter to be simulated at the same impact angle and velocity. This is unlike what would happen in a real-life scenario, where droplets will impact the turbine blade at all kinds of sizes, velocities and angles. Also, it is near impossible to predict where and how often one droplet will impact a specific area of the blade. There is a possibility that there would be a large time gap between droplet impacts. There is also the possibility that multiple droplets will impact the same area in quick succession. Other issues to be addressed are shape of curved geometry, hybrid material structure, i.e. coated materials and multiple events. Hence, the planned setup of the multiple impact simulation would be a high likelihood of damage scenario. It cannot be presented as an accurate representation of real-life damage, but it can be a possible way to validate the results against experimental testing of real life scenarios of erosion of wind turbine blades. Further work will be to address these issues in addition to other erosion phenomena such as hail impact [
23,
24]
5. Conclusions
Various water hammer models were used to simulate rain drop erosion of materials.
The results showed differing trends dependent on the software used and dependence of the models on the impact variables.
The results indicate that care should be taken in selection of an erosion model using one water hammer equation exclusively due to the differing predictions of such models in the literature, particularly at higher velocities.
Nomenclature
| Symbol |
Meaning |
| P |
Pressure |
| ρ |
Density |
| c |
Speed of sound |
| V |
Velocity |
| θ |
Impact Angle |
| Subscript |
Meaning |
| l |
Liquid |
| s |
Solid |
| wh |
Water hammer |
| Abbreviation |
Meaning |
| GFRP |
Glass Fibre Reinforced Polymer |
| CFRP |
Carbon Fibre Reinforced Polymer |
References
- “World Wind Energy Association – Wind Power Capacity Worldwide Reaches 597 GW, 50,1 GW added in 2018.” Accessed: Aug. 09, 2024. [Online]. Available: https://wwindea.org/blog/2019/02/25/wind-power-capacity-worldwide-reaches-600-gw-539-gw-added-in-2018/.
- “Energy Trends: UK electricity - GOV.UK.” Accessed: Aug. 09, 2024. [Online]. Available: https://www.gov.uk/government/statistics/electricity-section-5-energy-trends.
- “Electricity generation mix by quarter and fuel source (GB) | Ofgem.” Accessed: Aug. 09, 2024. [Online]. Available: https://www.ofgem.gov.uk/data-portal/electricity-generation-mix-quarter-and-fuel-source-gb.
- “LM Wind Power sets record for the world’s longest wind turbine blade, again!” Accessed: Aug. 09, 2024. [Online]. Available: https://www.lmwindpower.com/en/stories-and-press/stories/news-from-lm-places/record-breaking-lm-88-4-blade.
- “World’s Largest Offshore Wind Turbine | Haliade-X | GE Renewable Energy.” Accessed: Aug. 09, 2024. [Online]. Available: https://www.ge.com/renewableenergy/wind-energy/offshore-wind/haliade-x-offshore-turbine.
- “UK actual and anomaly maps - Met Office.” Accessed: Aug. 09, 2024. [Online]. Available: https://www.metoffice.gov.uk/research/climate/maps-and-data/uk-actual-and-anomaly-maps.
- “• UK: Monthly rainfall 2014-2023| Statista.” Accessed: Aug. 09, 2024. [Online]. Available: https://www.statista.com/statistics/584914/monthly-rainfall-in-uk/.
- “Raindrops are Different Sizes.” Accessed: Sep. 07, 2018. [Online]. Available: https://www.usgs.gov/special-topic/water-science-school/science/raindrops-are-different-sizes?qt-science_center_objects=0#qt-science_center_objects.
- “Speed of a Falling Raindrop - The Physics Factbook.” Accessed: Oct. 17, 2018. [Online]. Available: https://hypertextbook.com/facts/2007/EvanKaplan.shtml.
- A. Sareen, C. A. Sapre, and M. S. Selig, “Effects of leading edge erosion on wind turbine blade performance,” Wind Energy, 2014. [CrossRef]
- “Leading Edge Erosion | armour EDGE.” Accessed: Apr. 16, 2019. [Online]. Available: https://www.armouredge.com/leading-edge-erosion/.
- “Specific stiffness - Specific strength.” Accessed: Dec. 12, 2018. [Online]. Available: http://www-materials.eng.cam.ac.uk/mpsite/interactive_charts/spec-spec/NS6Chart.html.
- L. Mishnaevsky, K. Branner, H. N. Petersen, J. Beauson, M. McGugan, and B. F. Sørensen, “Materials for wind turbine blades: An overview,” 2017. [CrossRef]
- “Wind Turbine Coatings - Onshore and Offshore | Coating.co.uk.” Accessed: Jan. 27, 2019. [Online]. Available: https://www.coating.co.uk/wind-turbine-coatings/.
- “Wind Turbine Blade Coating Repair and Maintenance | Wind Turbine Coatings.” Accessed: Jan. 09, 2019. [Online]. Available: https://www.windturbinecoatings.co.uk/wind-turbine-blade-coating-repair-and-maintenance/.
- G. Springer, Erosion by Liquid Impact. Scripta, 1976.
- O. Gohardani, “Impact of erosion testing aspects on current and future flight conditions,” 2011. [CrossRef]
- M. H. Keegan, D. H. Nash, and M. M. Stack, “Modelling rain drop impact of offshore wind turbine blades,” in Proceedings of the ASME Turbo Expo, 2012. [CrossRef]
- M. A. McCarthy et al., “Modelling of bird strike on an aircraft wing leading edge made from fibre metal laminates - Part 2: Modelling of impact with SPH bird model,” Applied Composite Materials, 2004. [CrossRef]
- LSTC, “Volume I Keyword,” 1992.
- S. Doagou-Rad and L. Mishnaevsky Jr, “Rain erosion of wind turbine blades: computational analysis of parameters controlling the surface degradation,” Meccanica, vol. 55, no. 4, pp. 725–743, 2020.
- W. Hu et al., “A computational model of wind turbine blade erosion induced by raindrop impact,” in Journal of Physics: Conference Series, IOP Publishing, 2020, p. 012048.
- J. R. Macdonald and M. M. Stack, “Some thoughts on modelling hail impact on surfaces,” Journal of Bio-and Tribo-Corrosion, vol. 7, pp. 1–7, 2021.
- J. Macdonald and M. M. Stack, “Generating composite material maps from numerical simulation of hailstone impact,” Journal of Bio-and Tribo-Corrosion, vol. 10, no. 3, pp. 1–8, 2024.
|
Disclaimer/Publisher’s Note: The statements, opinions and data contained in all publications are solely those of the individual author(s) and contributor(s) and not of MDPI and/or the editor(s). MDPI and/or the editor(s) disclaim responsibility for any injury to people or property resulting from any ideas, methods, instructions or products referred to in the content. |
© 2024 by the authors. Licensee MDPI, Basel, Switzerland. This article is an open access article distributed under the terms and conditions of the Creative Commons Attribution (CC BY) license (http://creativecommons.org/licenses/by/4.0/).

