I. Introduction
The stock market, as an important part of the modern economy, has attracted the attention of a large number of investors and researchers. The fluctuation of stock prices not only affects investors' returns, but also reflects the market's expectation of a company's future development potential. Therefore, accurate prediction of stock prices has become an important topic of research in many fields such as finance, economics, and computer science [
1]. With the development of information technology, especially the rise of big data and machine learning technologies, traditional stock analysis methods are gradually replaced by more complex and efficient algorithms [
2].
Historically, stock price prediction mainly relied on fundamental and technical analyses. Fundamental analysis focuses on factors such as a company's financial condition and industry outlook, while technical analysis focuses on historical price and volume data. However, these methods often fail to adequately capture the non-linear characteristics of the market and its complex dynamics, so researchers have begun to explore methods based on time series analysis to improve the accuracy of forecasts. Time series algorithms are an important tool for dealing with data that changes over time, and the core idea is to use past data to predict future trends. In stock price forecasting, time series models provide a basis for investment decisions by capturing patterns and regularities in historical price movements.
Common time series algorithms include the Autoregressive Moving Average Model (ARMA), the Seasonal Autoregressive Integrated Sliding Average Model (SARIMA), and the Long Short-Term Memory Network (LSTM). The ARMA model is suitable for smooth time series and forecasts because it establishes a linear relationship between current and past values. At the same time, SARIMA considers seasonal factors on this basis, making the model more flexible and applicable [
3].
Deep learning algorithms such as LSTM have received widespread attention in recent years for their powerful nonlinear modelling capabilities. LSTM can effectively capture long-term dependencies and is well suited to handle data with complex patterns and trends, such as stock prices. In addition, LSTM can be combined with other features (e.g., trading volume, macroeconomic indicators, etc.) to enhance the prediction effect further. In the research of stock price prediction, although traditional time series algorithms such as ARMA [
4], SARIMA [
5] and deep learning models such as LSTM show good results, they often face problems such as high computational complexity and long training time when dealing with large-scale data. In order to solve these challenges, Extreme Learning Machine (ELM) as an emerging machine learning method has gradually attracted the attention of researchers.
Extreme Learning Machine is a kind of Single-hidden Layer Feedforward Neural Network (SLFN), whose main feature is its fast learning and efficient generalisation ability. Unlike traditional neural networks that need to be trained iteratively by back-propagation algorithms, ELM only needs to randomly initialise the weights of the hidden layer nodes during the training process, and then directly calculate the output layer weights by the least squares method. This process significantly reduces the training time and makes ELM perform well when dealing with large-scale datasets [
6].
In stock price prediction, the Extreme Learning Machine is able to effectively capture nonlinear features and has strong generalisation ability. Since data in the financial market is usually complex and diverse, ELM can extract valuable information by reasonably selecting and pre-processing the input data. For example, historical prices, trading volumes, technical indicators, and macroeconomic factors can be used as input features to be integrated and analysed through the ELM model. In order to take advantage of the great potential of ELM in stock price prediction, this paper optimises the ELM based on the crown porcupine optimisation algorithm and adaptive bandwidth kernel function density estimation algorithm to predict the stock price, which is worth noting that it is a brand-new approach in stock price prediction.
II. Data from Data Analysis
The dataset selected for this paper is an open-source dataset that records opening, high and closing prices, it is a comprehensive collection of financial data that provides a detailed view of daily trading activity on the CBX. The dataset has been carefully designed to include important components of each trading day, such as the opening price (open), the day's high (high), the closing price at the end of the trading session (close), and volume. We select some of the data for presentation and the results are shown in
Table 1.
We select the time and the opening price in the data to be used in our experiment, which aims to predict the daily opening price of a stock through a time series algorithm.
III. Method
A. Extreme Learning Machine
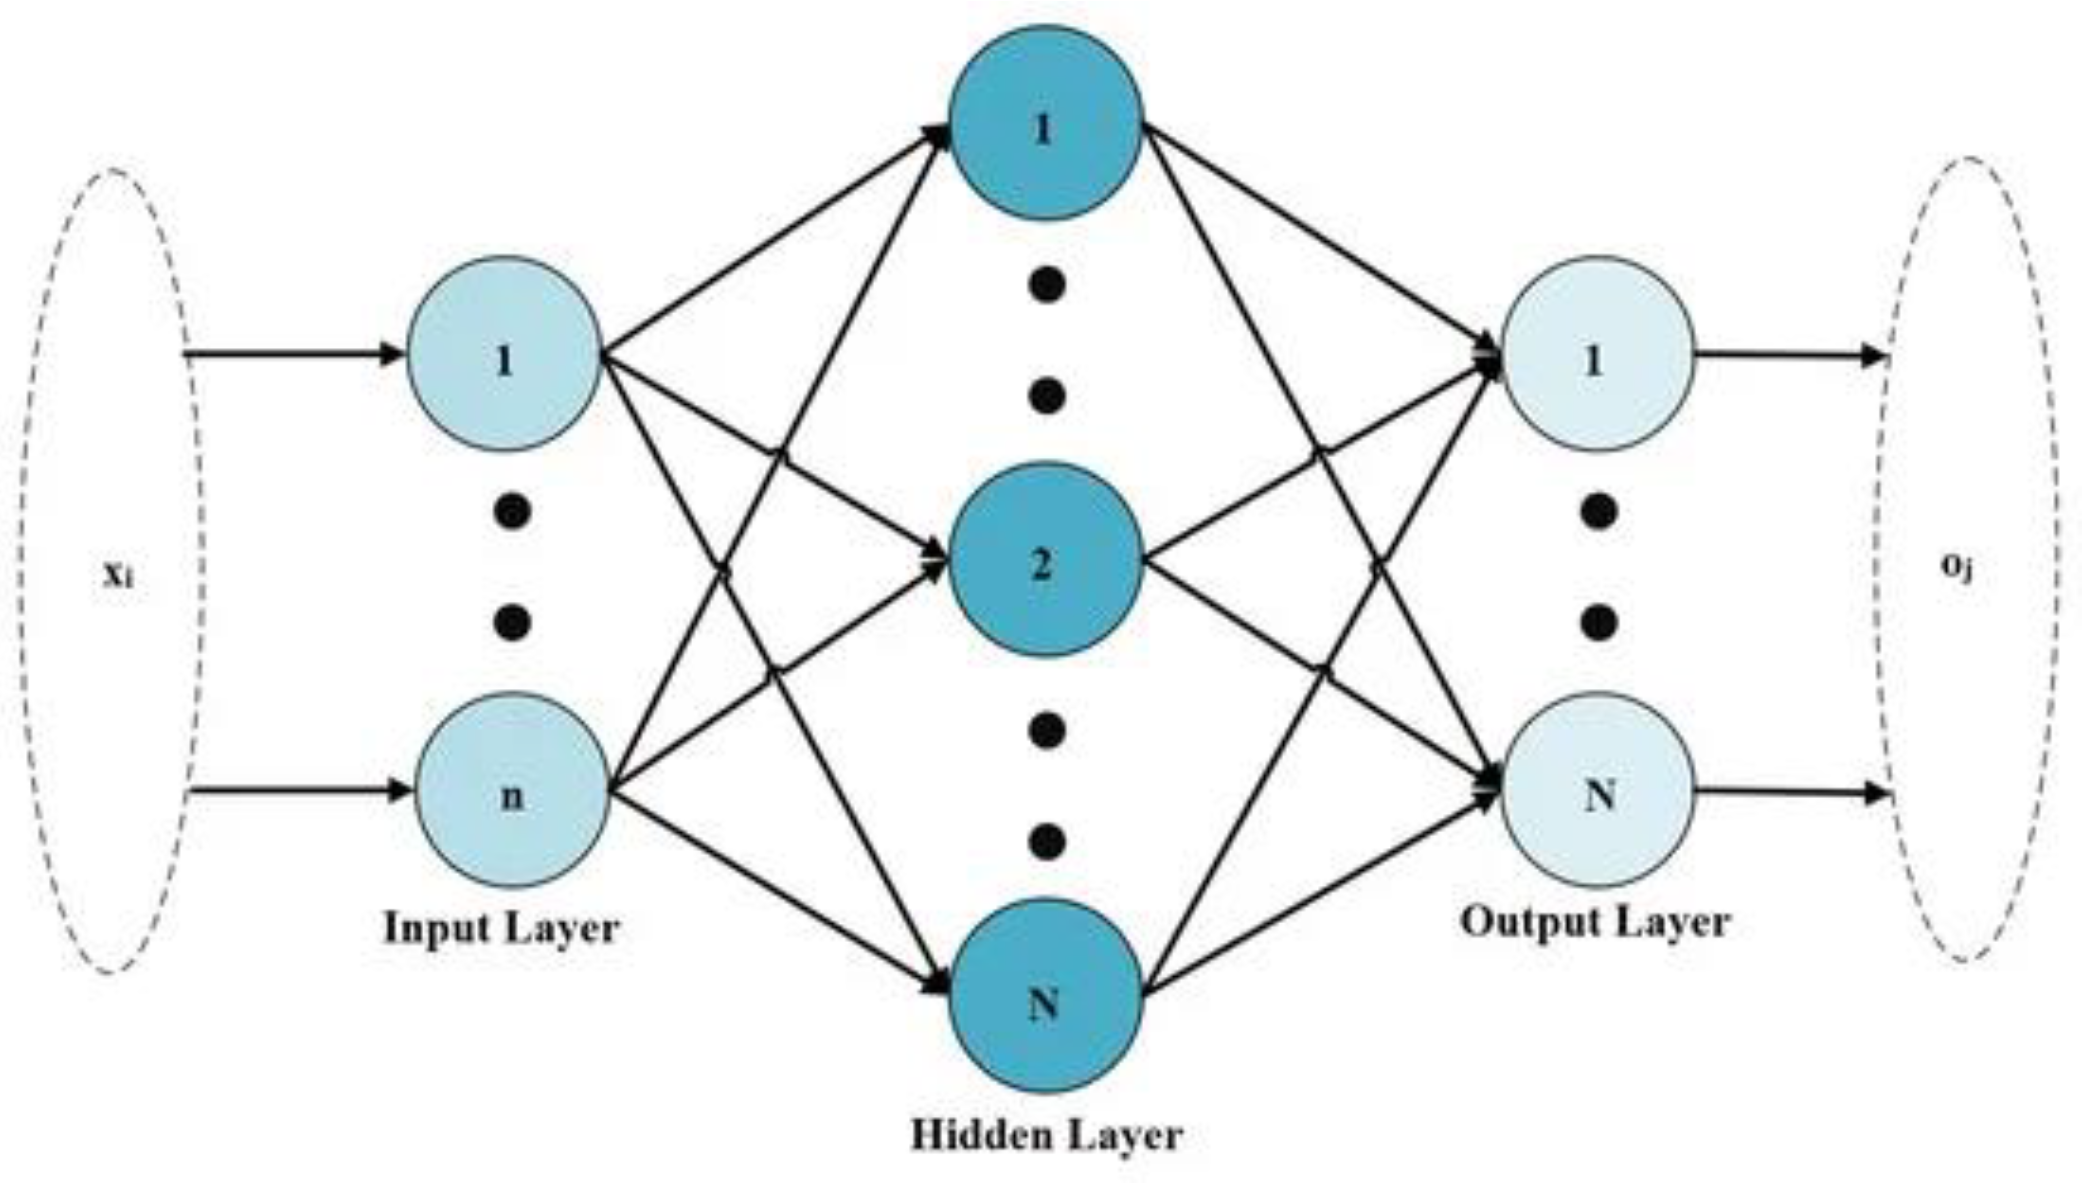
Extreme Learning Machine (ELM) is an emerging machine learning algorithm mainly used to train single hidden layer feedforward neural networks. Compared with traditional neural network training methods, ELM has significant advantages in speed and efficiency and is especially suitable for handling large-scale datasets. The structure of the Extreme Learning Machine is shown schematically in
Figure 1.
The basic principle of an Extreme Learning Machine is to map the input data through randomly generated hidden layer nodes and then calculate the output weights through simple linear regression. Specifically, ELM first randomly initialises the parameters of the hidden layer nodes, including weights and biases. These parameters are not adjusted during the training process, but are fixed. This process allows ELM to quickly construct a high-dimensional feature space, thus improving the model's performance [
7].
In ELM, the number of hidden layer nodes and the activation function are pre-set. By linearly combining the input samples, a hidden layer output matrix is generated H. Each column of H corresponds to the output of a hidden layer node, which are processed by activation functions (e.g., sigmoid, ReLU, etc.). Since these hidden layer nodes are randomly generated, the overfitting problem can be effectively avoided. Once the hidden layer output matrix H is obtained, the least squares method can be used to solve the output weights.
B. The Crowned Porcupine Optimisation
The Crowned Porcupine Optimisation (CHO) algorithm is an emerging population intelligence optimisation algorithm inspired by the behavioural traits of the Crowned Porcupine. The algorithm aims to solve complex optimisation problems by simulating the foraging and survival strategies of crowned porcupines in nature [
8].
The Crown Hedgehog Optimization Algorithm (CHOA) is an emerging nature-inspired optimisation algorithm inspired by the foraging and survival strategies of the Crown porcupine. The algorithm shows good performance in dealing with complex optimisation problems, especially for high-dimensional, nonlinear and multi-peaked functions.
The Crown Hedgehog is a small mammal that lives on the edges of grasslands and forests and is known for its unique foraging behaviour. When searching for food, this animal evaluates its surroundings through multiple senses, including smell, sight and hearing, and makes decisions accordingly. The Crowned Porcupine Optimisation Algorithm simulates this process to find the optimal solution by establishing a mechanism for information exchange and cooperation between individuals.
The implementation steps of the algorithm are:
Initialisation: a set of initial individual positions are randomly generated, each representing a potential solution, and their fitness values are calculated.
2. fitness evaluation: each individual is evaluated for fitness to determine their performance in the current solution space.
3. Information sharing: Based on the fitness value, the better-performing individual is selected as the "leader", and their information is shared with other individuals. This process allows the group to move in a better direction.
4. Position update: The position of each individual is updated based on the leader's information and its state. Position updating usually includes random perturbations and strategies for moving towards the leader to balance exploration and exploitation.
5. Iteration: repeat steps 2 to 4 until the stopping condition is met (e.g., the maximum number of iterations or the fitness reaches a preset threshold).
6. Output: return the individual's position corresponding to the best fitness, i.e., the optimal solution.
In conclusion, the Crowned Porcupine Optimization Algorithm is a novel and efficient group intelligence optimisation method, which provides a new way of thinking for solving complex optimisation problems by simulating the behaviour of crowned porcupines in nature.
C. Adaptive Bandwidth Kernel Function Density Estimation
Adaptive Bandwidth Kernel Function Density Estimation (ABKDE) is a nonparametric probability density function estimation method. Compared with traditional kernel density estimation (KDE), ABKDE improves the accuracy and flexibility of the estimation by adaptively adjusting the bandwidth, mainly when the data is unevenly distributed or has a complex structure.
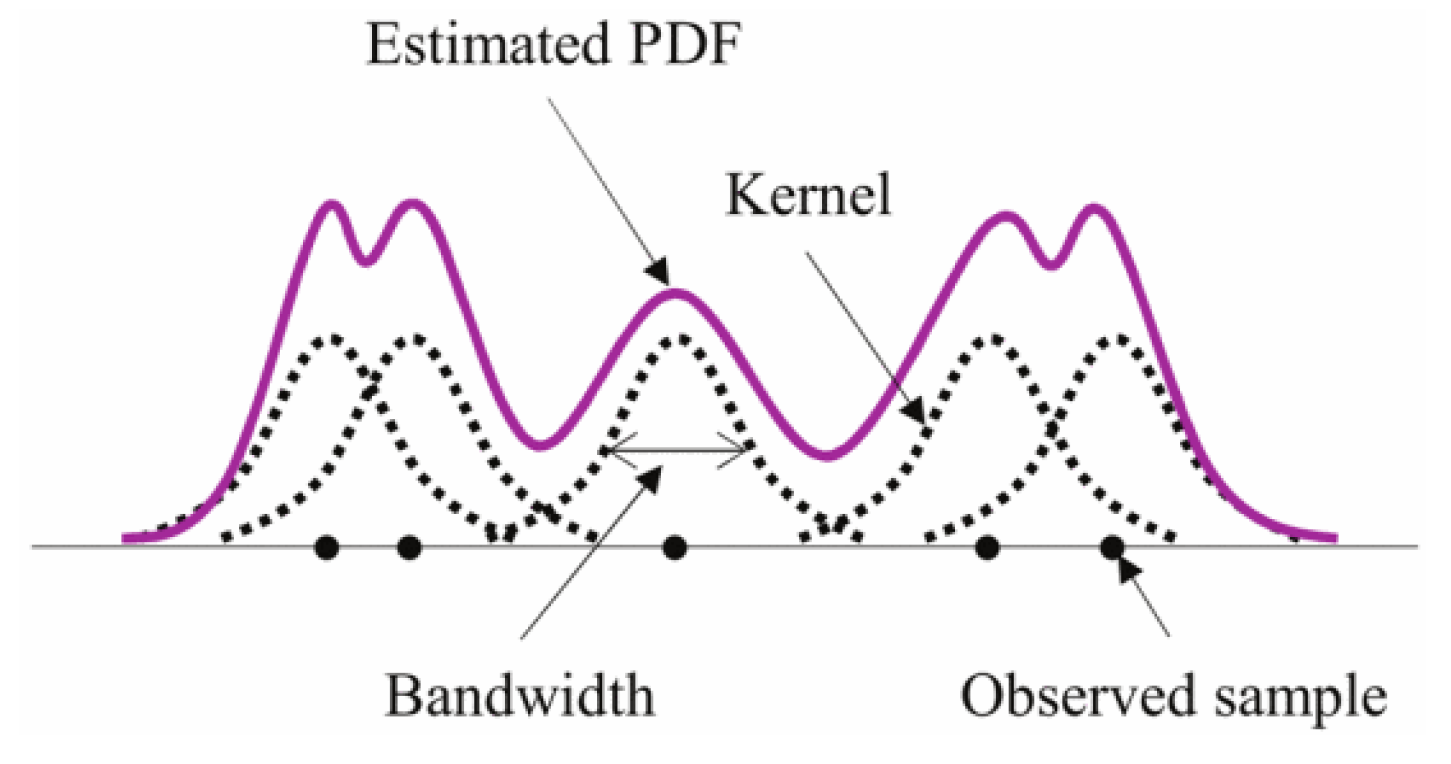
Kernel density estimation is a commonly used statistical method for inferring potential probability density functions from sample data. The basic idea is to obtain an overall density estimate by placing a kernel function (e.g., a Gaussian kernel) on each observation and superimposing the contributions of all kernel functions. Traditional KDEs use a fixed bandwidth to control the width of the kernel function, which works well when the data is more evenly distributed. Still, in the presence of significant data clustering or sparse regions, a fixed bandwidth can lead to overly smooth or overly volatile results. The specific principle of kernel density estimation is shown in
Figure 2.
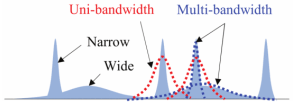
The core idea of adaptive bandwidth is to dynamically adjust the bandwidth according to the distribution of local data points. In regions with denser data points, a smaller bandwidth can capture more details. In contrast, in sparse regions, a larger bandwidth is used to avoid noise from significantly affecting the results. This flexibility allows ABKDE to reflect the actual distribution characteristics of the data more accurately. The specific principle of adaptive bandwidth is shown in
Figure 3.
The specific principle of adaptive bandwidth.
The implementation steps of the algorithm are:
select the kernel function: first, select a suitable kernel function, e.g., Gaussian kernel, Epanechnikov kernel, etc., which will determine the shape of the influence of each data point on the final density estimation.
Calculate local density: For each sample point, calculate the number of data points within a specific range around it and determine the required bandwidth at that location based on the information of those points. Commonly used methods include distance-based methods such as the k-Nearest Neighbour (k-NN) method, which sets the local bandwidth by selecting the k nearest neighbours.
Update bandwidth: Dynamically adjust the bandwidth corresponding to each sample point according to the number and distribution of local data points. Typically, denser regions get smaller bandwidths, while sparse regions get larger bandwidths.
Perform density estimation: the final kernel density estimation is performed using the adaptive bandwidth, where each sample point corresponds to its adaptively computed bandwidth, and all results are summed to obtain the overall probability density function.
Post-processing: Optionally, the results can be smoothed to eliminate possible small-scale fluctuations and improve interpretability.
In conclusion, the adaptive bandwidth kernel function density estimation algorithm overcomes some of the shortcomings of the fixed bandwidth method by dynamically adjusting the data influence in the local region, making the probability density estimation more flexible and accurate [
9].
An Extreme Learning Machine Stock Price Prediction Algorithm Based on the Optimisation of the Crown Porcupine Optimisation Algorithm with an Adaptive Bandwidth Kernel Function Density Estimation Algorithm
A new ELM optimisation framework is formed by combining the crown porcupine optimisation algorithm with the adaptive bandwidth kernel function. In this framework, CHOA is firstly utilised to search for the optimal hyperparameter configurations, including the number of hidden layer nodes, the type of activation function, and the adaptive bandwidth parameter. In this way, the large amount of time and effort required for manual parameter tuning can be effectively avoided.
Secondly, in the feature mapping stage, the input data is processed by the adaptive bandwidth kernel function, which enables the ELM to better capture the nonlinear features in the data. This process not only improves the fitting ability of the model on the training set, but also enhances its generalisation performance on the test set [
10].
IV. Experiment
In the division of the dataset, we divide the training set and test set according to the ratio of 7:3, 70% of the data is used for training, and 30% of the data is used for testing the trained model. This experiment is conducted using a local server with a 3090 graphics card and 32G of RAM, this experiment is based on Matlab R2023b.
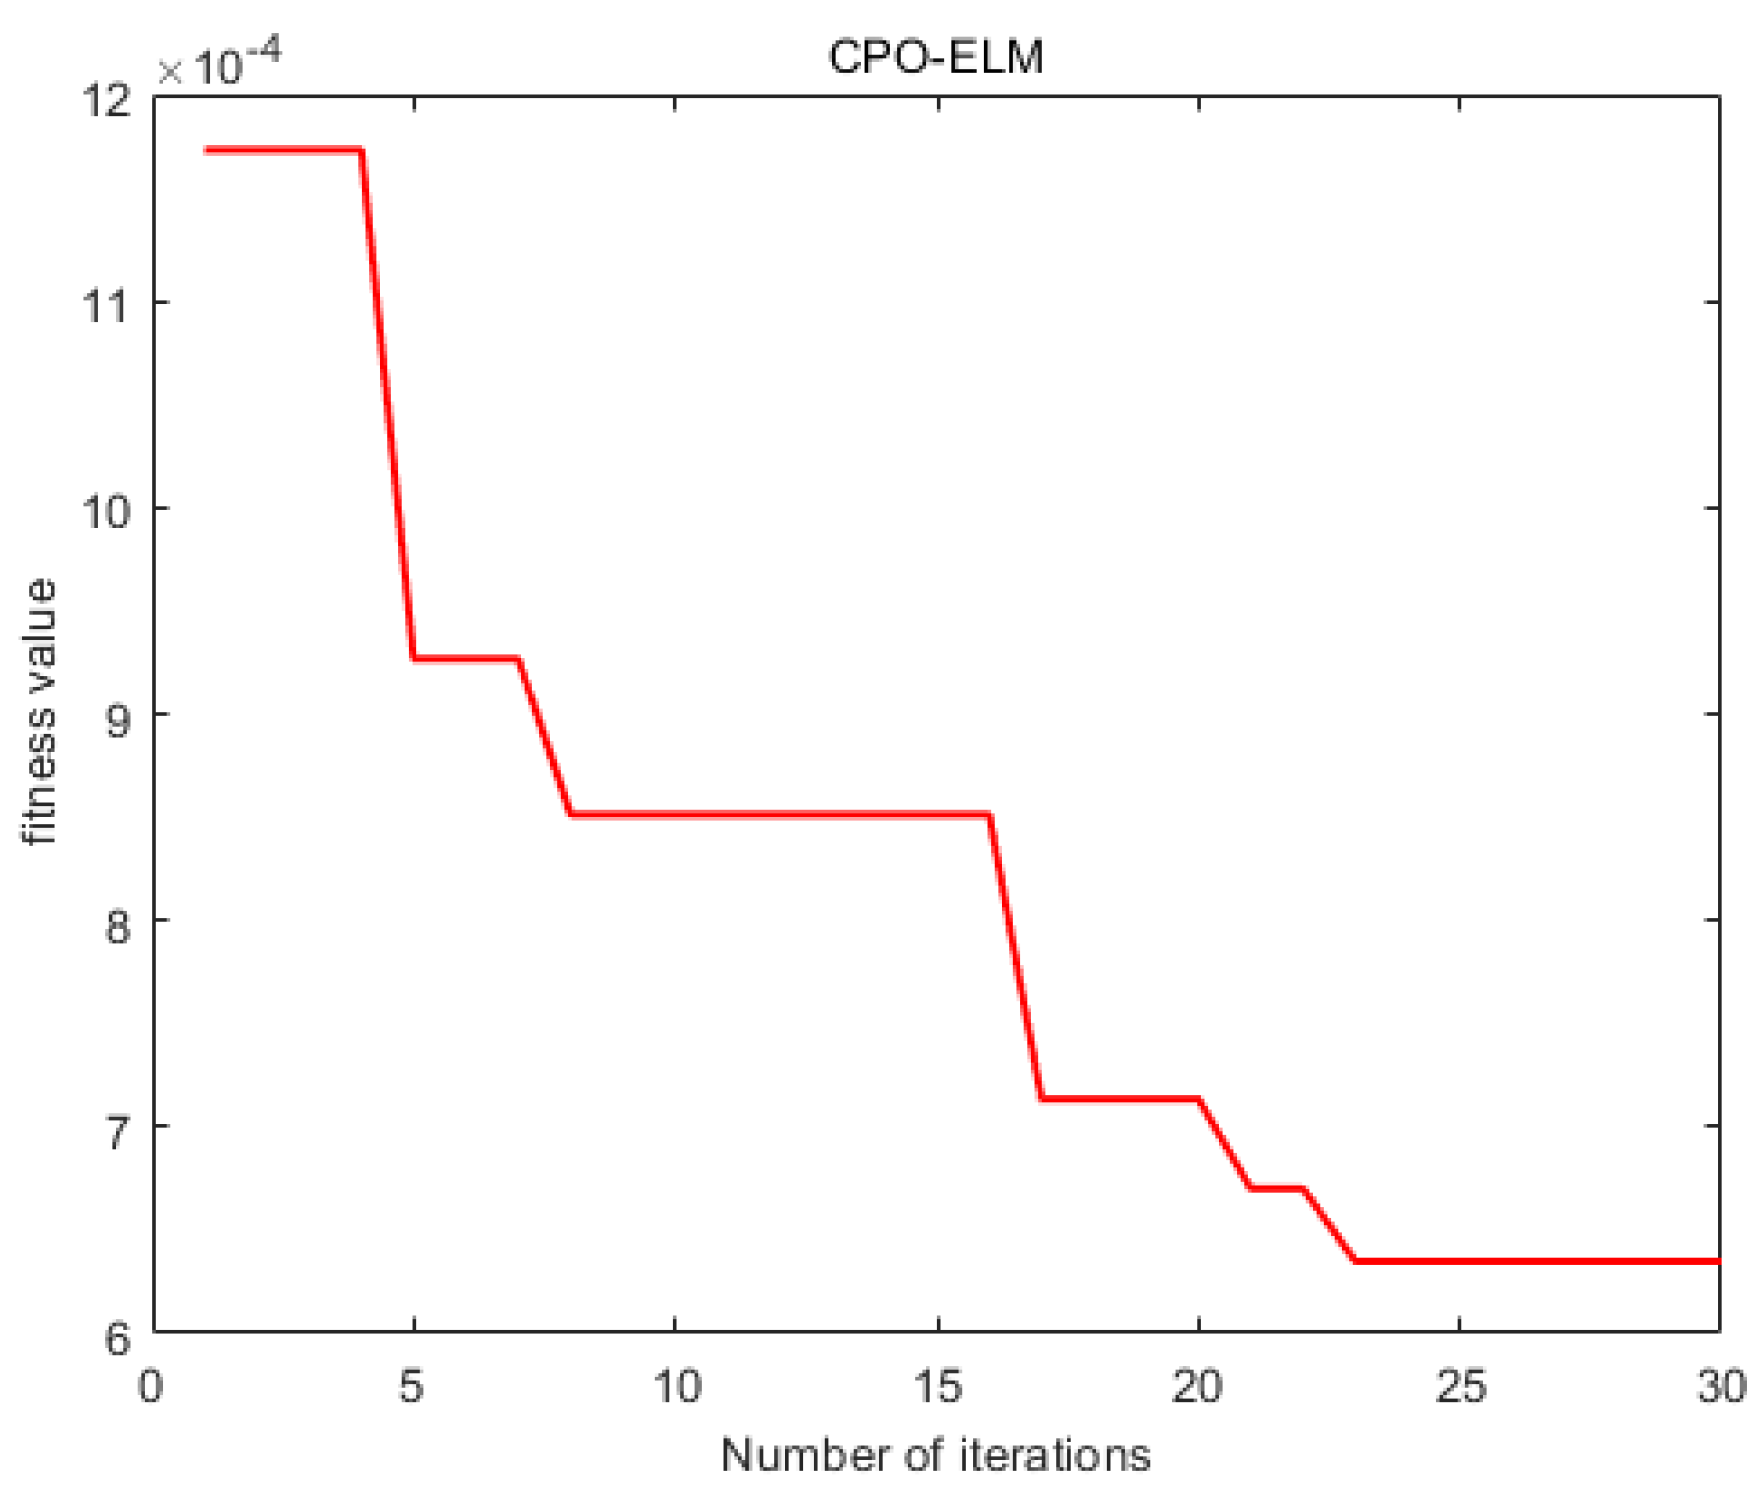
The adaptation curve during the model training process is shown in
Figure 4, which shows that the training effect of the model becomes better gradually from the model adaptation curve.
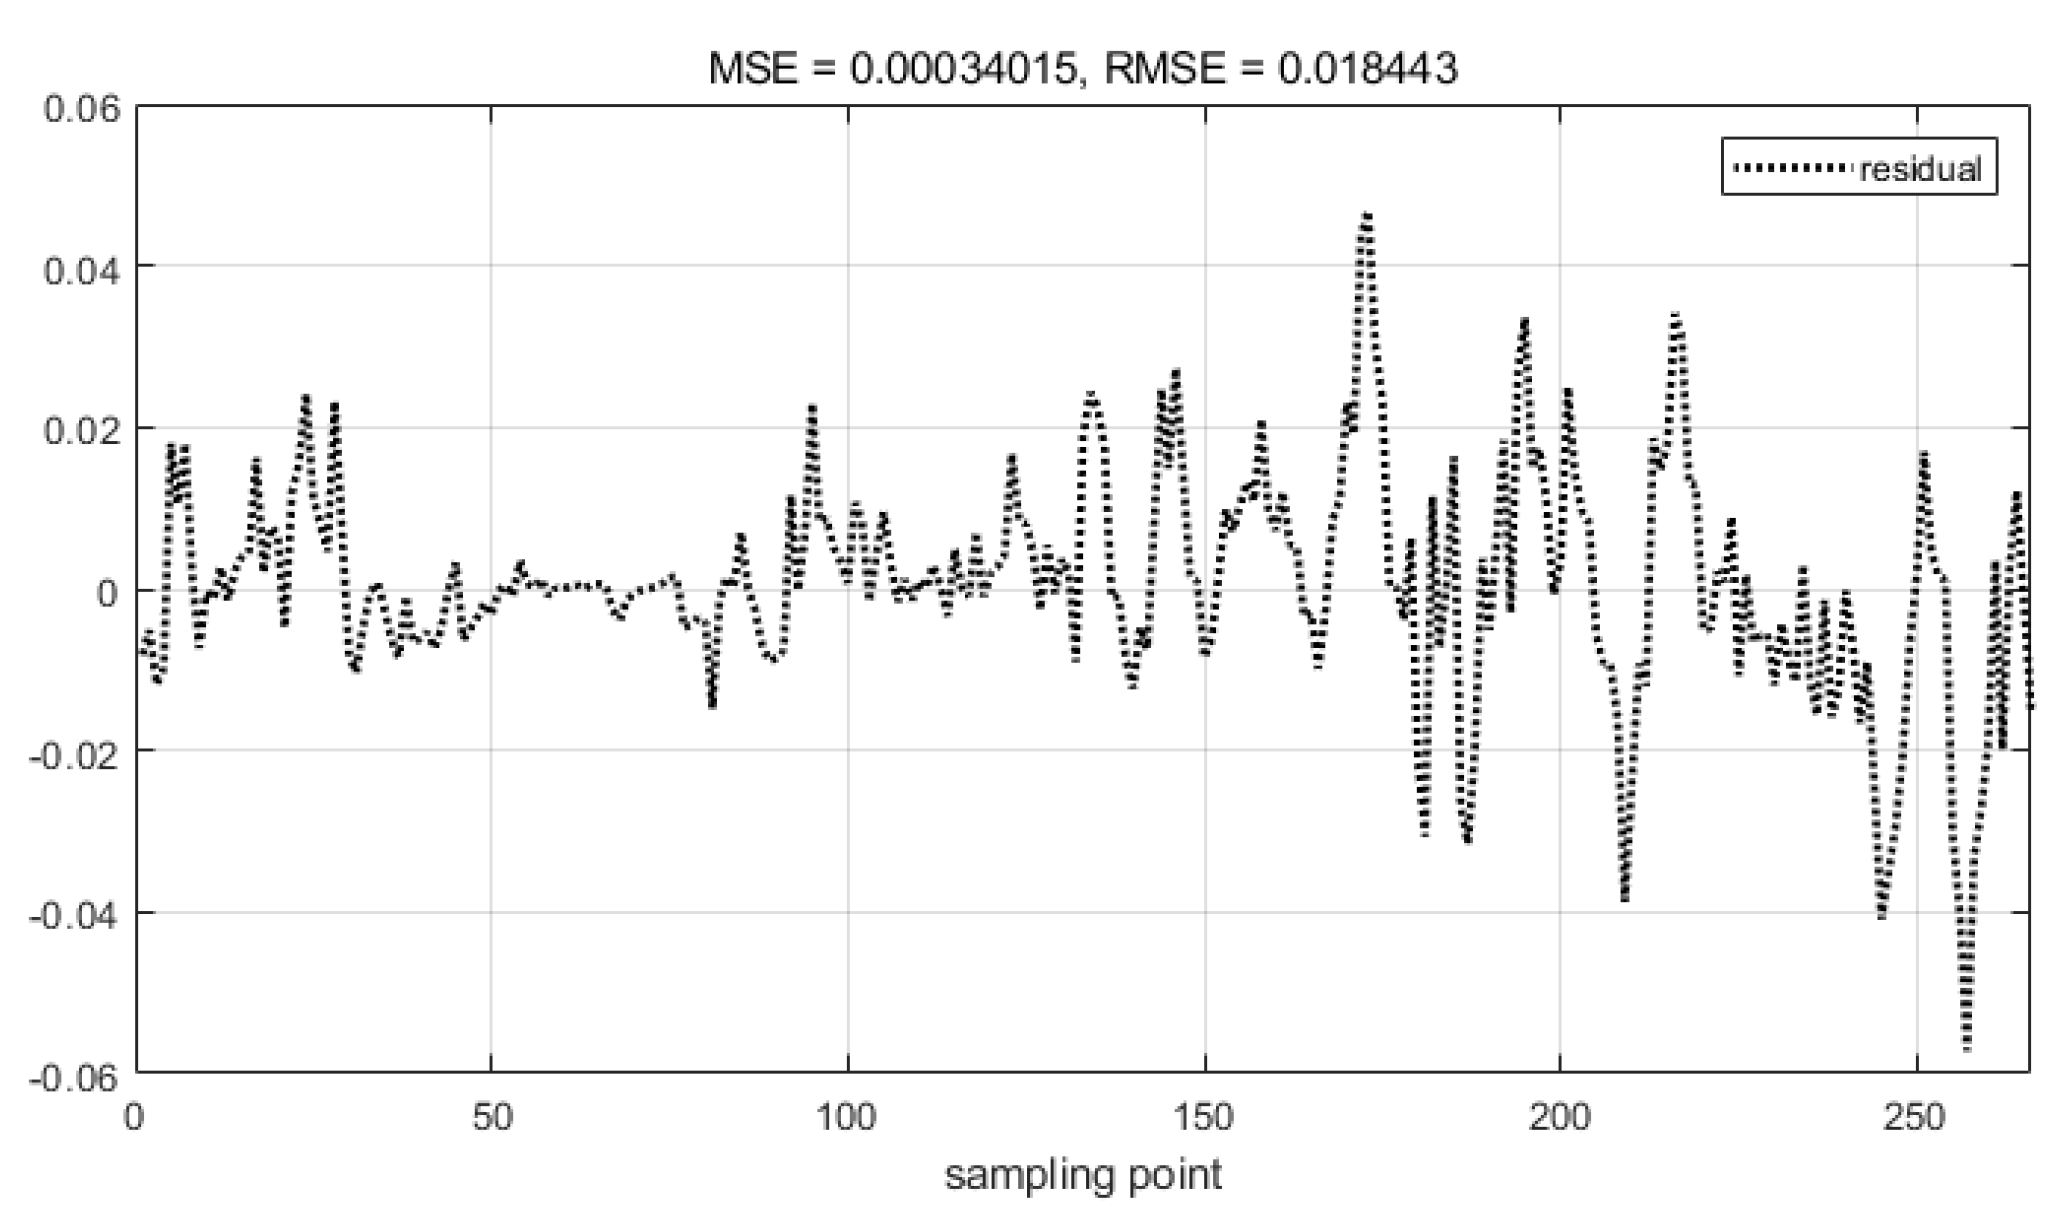
Using the test set to test the prediction effect of the model, draw the residual plot of the model, i.e. the difference between the actual value and the predicted value, the results are shown in
Figure 5, from
Figure 5, it can be seen that the residuals are mainly distributed in the top and bottom of 0 and fluctuation amplitude is not large, the RMSE value of 0.018, which indicates that the model in the test set of the performance of the effect of the model, the model's ability of the generalisation of the model is relatively strong.
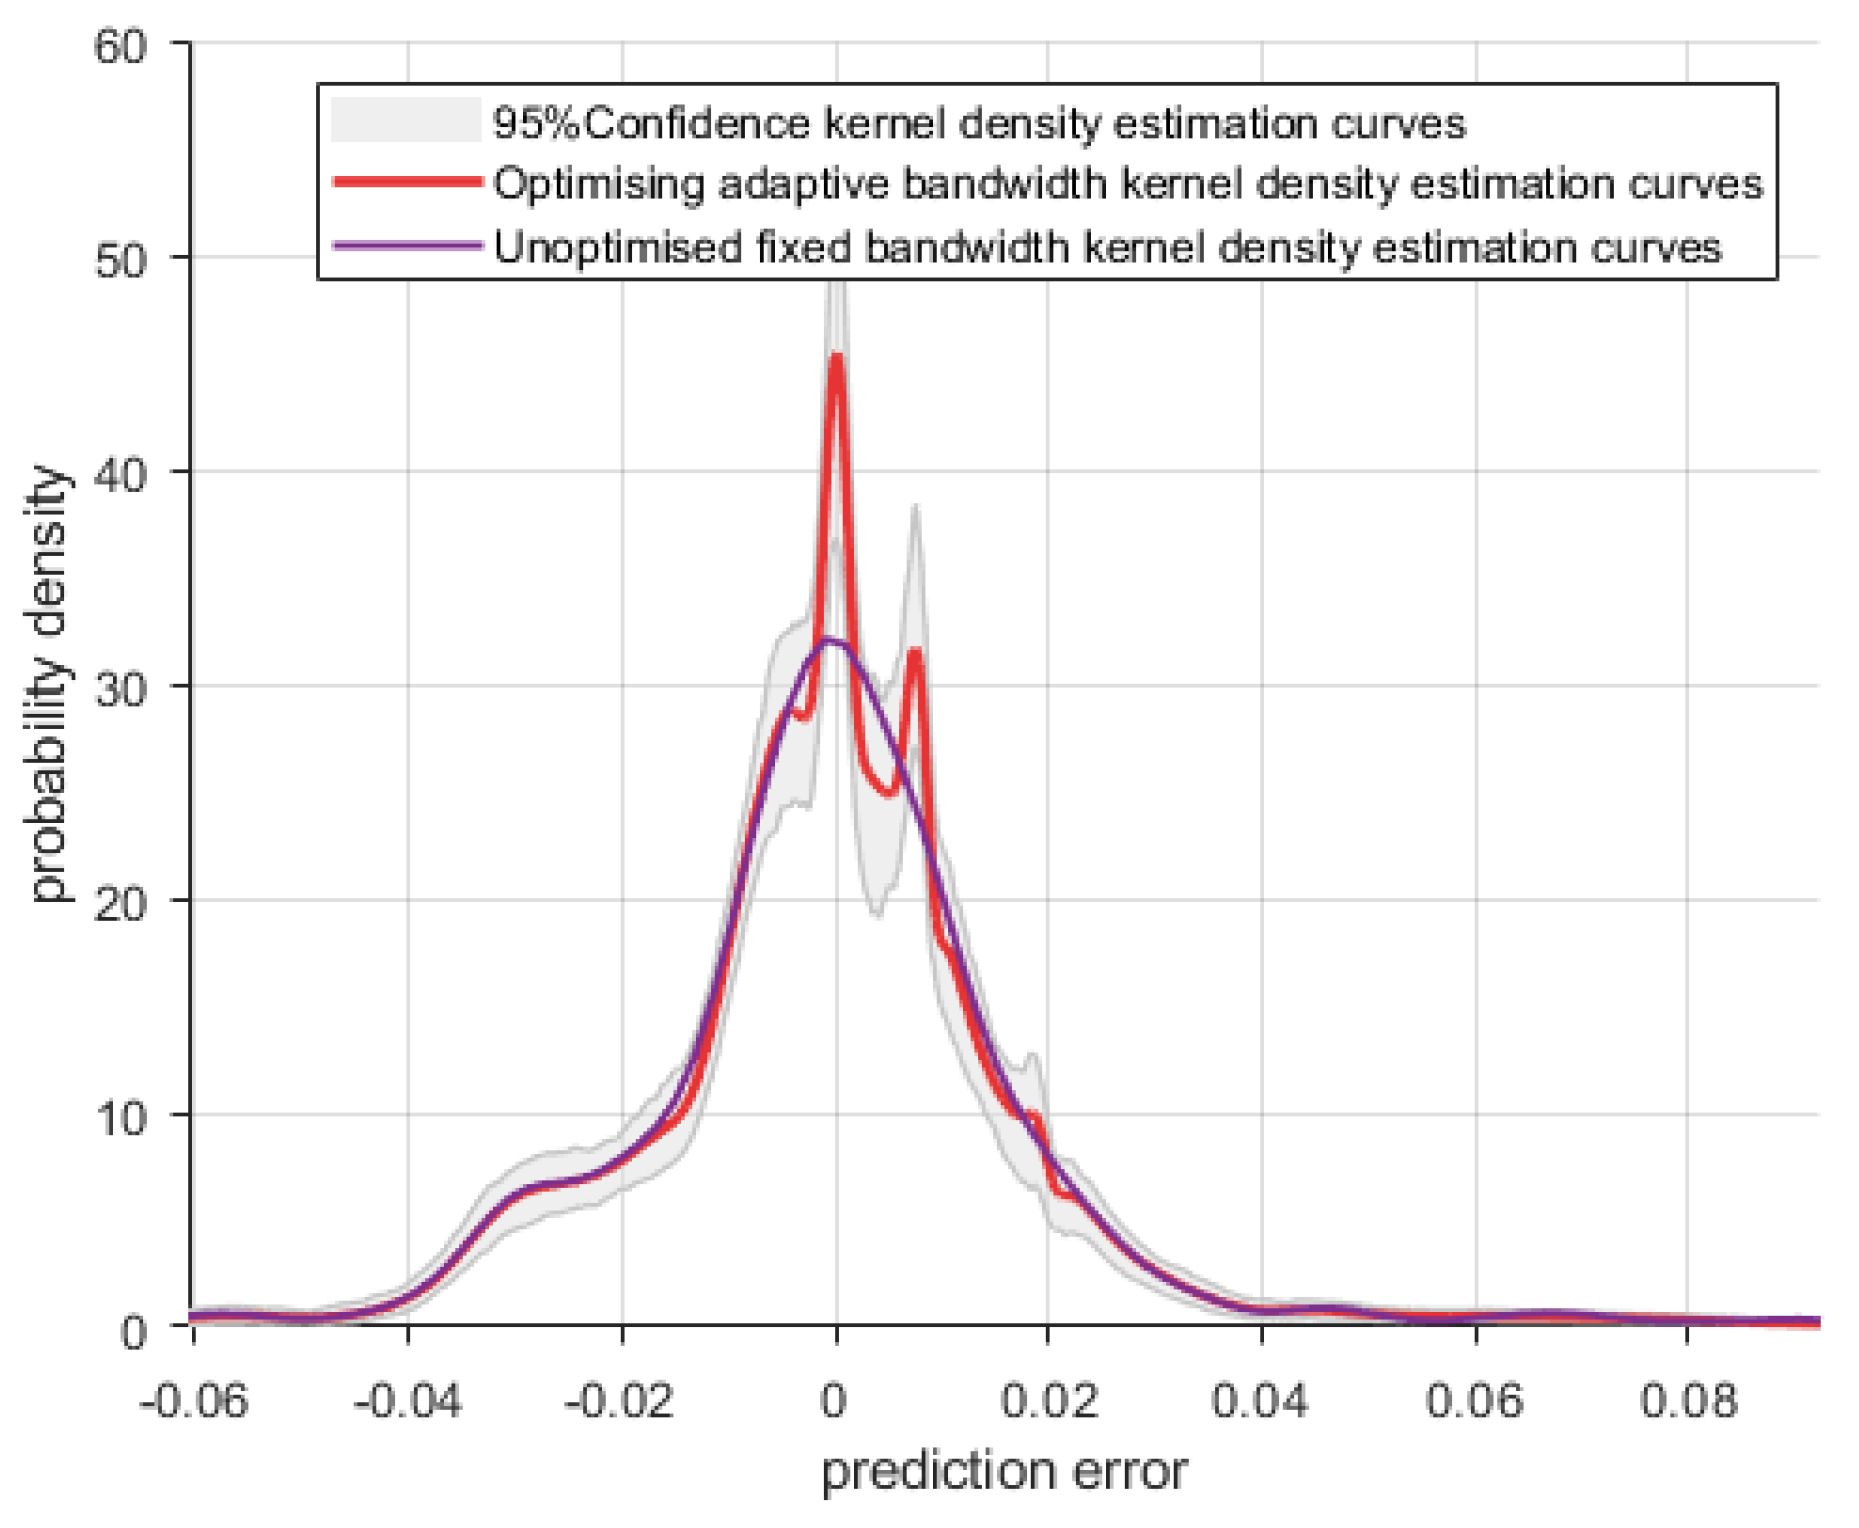
The model prediction effectiveness is evaluated by outputting 95% confidence kernel density estimation curves, optimised adaptive bandwidth kernel density estimation curves and unoptimised fixed bandwidth kernel density estimation curves and the results are shown in
Figure 6.
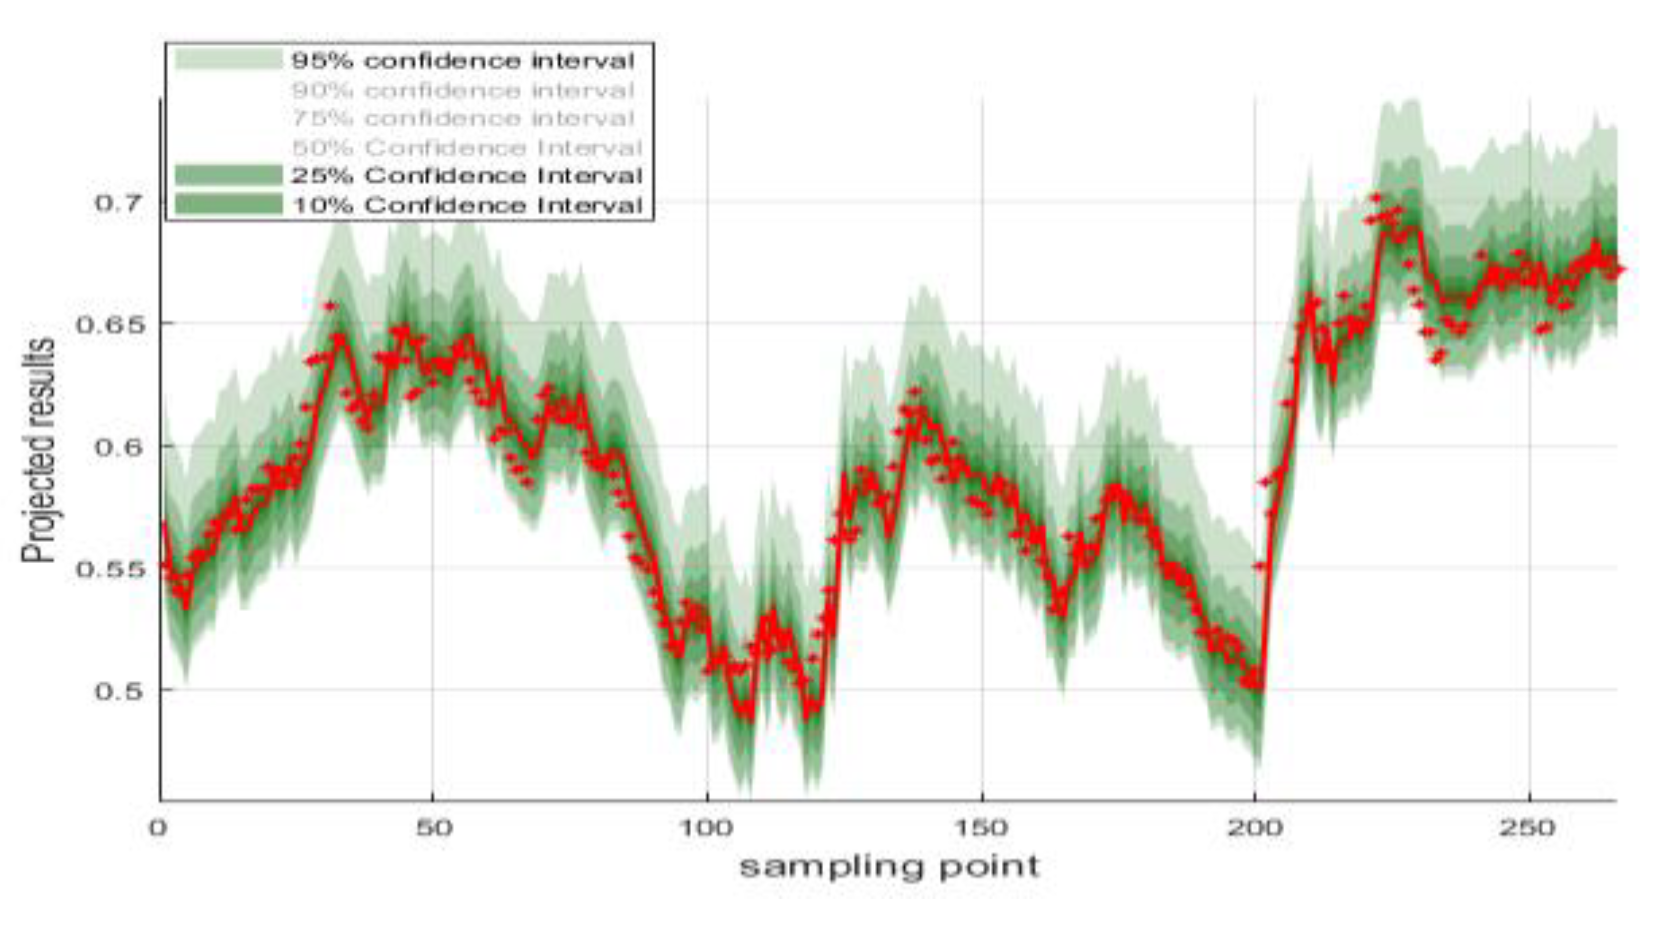
Confidence intervals for the predicted values are plotted around the actual values and the results are shown in
Figure 7.
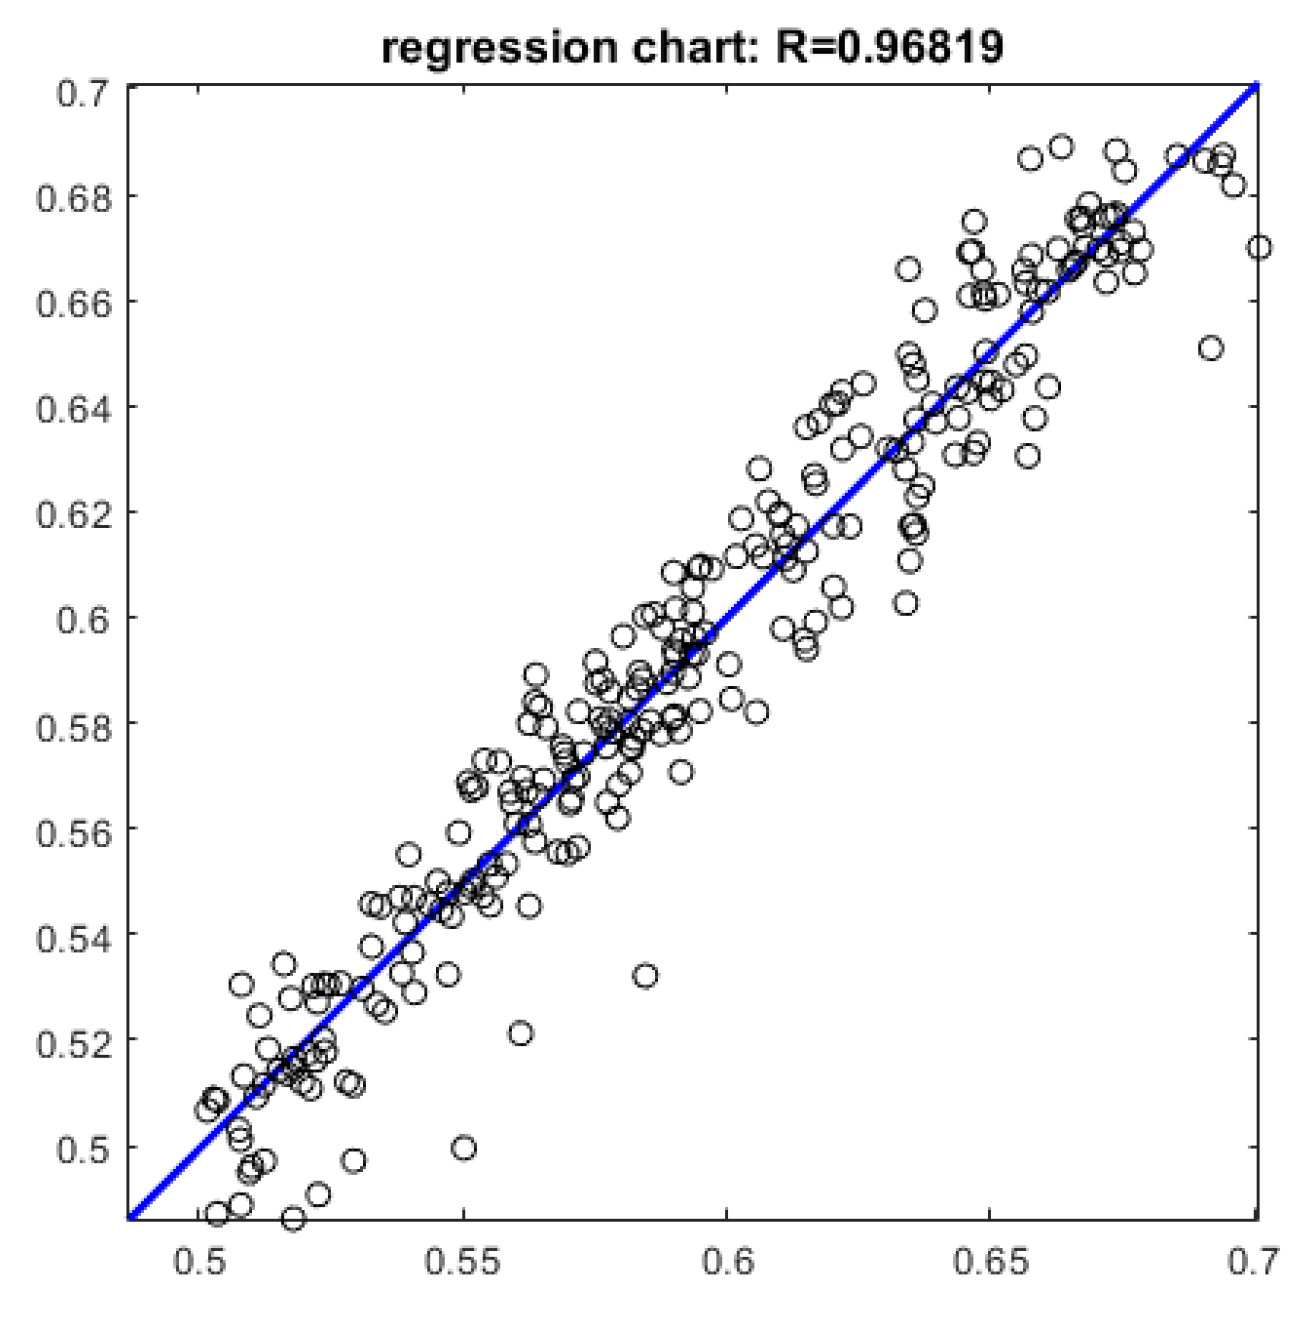
The scatter plot of predicted and actual values of the test set is plotted and the results are shown in Figure 8. As can be seen from the results, R=0.968, which indicates that the model has a good prediction effect and can predict the stock price well.
The prediction effectiveness of the training and test sets is evaluated using R2, MAE, RMSE and MAPE and the results are shown in
Table 2.
The R2 of the training set is 0.987, while the R2 of the test set is 0.954, which is not much different from each other, indicating that the model has a better generalisation ability. Meanwhile, on the MAE, RMSE and MAPE, both the training set and test set perform well.
V. Conclusion
In this paper, we delve into the potential application of Extreme Learning Machines (ELMs) in stock price prediction and optimise them effectively with the Crown Porcupine optimisation algorithm and the Adaptive Bandwidth Kernel Function Density Estimation algorithm. Specifically, we divide the dataset into training and testing sets in the ratio of 7:3 to ensure that the model can be effectively validated in different data environments.
In addition, we calculated the correlation coefficient R and obtained a value of 0.968, a value that further emphasises the reliability of the model in terms of stock price prediction. By comparing the coefficient of determination R2 for the training and test sets, we found that the training set is 0.987 while the test set is 0.954, which is not much different. This indicates that our model not only fits the training data well, but also has a strong generalisation ability to effectively deal with unseen data.
In summary, this study has deeply optimised the ELM by introducing advanced optimisation algorithms and kernel function density estimation techniques, so that it demonstrates excellent performance in the stock price prediction task. In the future, with the increasing volume and complexity of data in the financial market, this method is expected to provide new solutions to a wider range of financial prediction problems. Meanwhile, it also provides a useful reference for further research on applying machine learning algorithms in finance.
VI. Discussion
Extreme Learning Machine (ELM), as an emerging machine learning method, has shown good performance in the field of stock price prediction. Combining the Crown Porcupine optimisation algorithm and the adaptive bandwidth kernel function density estimation algorithm, the ELM is effectively optimised to make it more efficient and accurate in handling complex financial data. This optimisation not only improves the learning ability of the model, but also enhances its sensitivity to market fluctuations, thus providing investors with more reliable decision support.
In our study, the correlation coefficient R reaches 0.968, a high value that fully demonstrates the model's reliability in stock price prediction. Usually, the closer the correlation coefficient is to 1, the stronger the linear relationship between the predicted and actual values. By comparing the coefficient of determination R2 between the training and test sets, we find that the training set is 0.987 while the test set is 0.954, which is not much different. This result suggests that although the model was well fitted during training, it also has a strong generalisation ability to deal effectively with unseen data. This is particularly important for financial markets, where the market environment changes rapidly, and the model needs to be adaptable to maintain a stable predictive performance.
In conclusion, by combining the Crown Porcupine optimisation algorithm with the adaptive bandwidth kernel function density estimation algorithm, we have successfully enhanced the effectiveness of the Extreme Learning Machine in stock price prediction. These research results provide new perspectives for academics and strong support for investment decisions in practice. In the future, we can continue to explore more optimisation methods and apply them to other financial fields to improve model performance further and create greater value for investors.
References
- Xu, Y., Liu, Y., Xu, H., & Tan, H. (2024). AI-Driven UX/UI Design: Empirical Research and Applications in FinTech. International Journal of Innovative Research in Computer Science & Technology, 12(4), 99-109.
- Liu, Y.; Xu, Y.; Song, R. Transforming User Experience (UX) through Artificial Intelligence (AI) in interactive media design. Eng. Sci. Technol. J. 2024, 5, 2273–2283. [Google Scholar] [CrossRef]
- Zhang, P. A STUDY ON THE LOCATION SELECTION OF LOGISTICS DISTRIBUTION CENTERS BASED ON E-COMMERCE. J. Knowl. Learn. Sci. Technol. Issn: 2959-6386 (online) 2024, 3, 103–107. [Google Scholar] [CrossRef]
- Zhang, P., & Gan, L. I. U. (2024). Optimization of Vehicle Scheduling for Joint Distribution in Logistics Park based on Priority. Journal of Industrial Engineering and Applied Science, 2(4), 116-121.
- Li, H.; Wang, S.X.; Shang, F.; Niu, K.; Song, R. Applications of Large Language Models in Cloud Computing: An Empirical Study Using Real-world Data. Int. J. Innov. Res. Comput. Sci. Technol. 2024, 12, 59–69. [Google Scholar] [CrossRef]
- Ping, G., Wang, S. X., Zhao, F., Wang, Z., & Zhang, X. (2024). Blockchain Based Reverse Logistics Data Tracking: An Innovative Approach to Enhance E-Waste Recycling Efficiency.
- Xu, H.; Niu, K.; Lu, T.; Li, S. Leveraging artificial intelligence for enhanced risk management in financial services: Current applications and future prospects. Eng. Sci. Technol. J. 2024, 5, 2402–2426. [Google Scholar] [CrossRef]
- Shi, Y., Shang, F., Xu, Z., & Zhou, S. (2024). Emotion-Driven Deep Learning Recommendation Systems: Mining Preferences from User Reviews and Predicting Scores. Journal of Artificial Intelligence and Development, 3(1), 40-46.
- Wang, S.; Xu, K.; Ling, Z. Deep Learning-Based Chip Power Prediction and Optimization: An Intelligent EDA Approach. Int. J. Innov. Res. Comput. Sci. Technol. 2024, 12, 77–87. [Google Scholar] [CrossRef]
- Li, A.; Zhuang, S.; Yang, T.; Lu, W.; Xu, J. Optimization of logistics cargo tracking and transportation efficiency based on data science deep learning models. Appl. Comput. Eng. 2024, 69, 71–77. [Google Scholar] [CrossRef]
- Xu, J.; Yang, T.; Zhuang, S.; Li, H.; Lu, W. AI-based financial transaction monitoring and fraud prevention with behaviour prediction. Appl. Comput. Eng. 2024, 67, 76–82. [Google Scholar] [CrossRef]
- Guo, L.; Song, R.; Wu, J.; Xu, Z.; Zhao, F. Integrating a machine learning-driven fraud detection system based on a risk management framework. Appl. Comput. Eng. 2024, 87, 80–86. [Google Scholar] [CrossRef]
- Ling, Z.; Xin, Q.; Lin, Y.; Su, G.; Shui, Z. Optimization of autonomous driving image detection based on RFAConv and triplet attention. Appl. Comput. Eng. 2024, 67, 68–75. [Google Scholar] [CrossRef]
- Bao, W.; Xiao, J.; Deng, T.; Bi, S.; Wang, J. The Challenges and Opportunities of Financial Technology Innovation to Bank Financing Business and Risk Management. Financial Eng. Risk Manag. 2024, 7, 82–88. [Google Scholar] [CrossRef]
- He, Z., Shen, X., Zhou, Y., & Wang, Y. (2024, January). Application of K-means clustering based on artificial intelligence in gene statistics of biological information engineering. In Proceedings of the 2024 4th International Conference on Bioinformatics and Intelligent Computing (pp. 468-473).
- Gong, Y., Zhu, M., Huo, S., Xiang, Y., & Yu, H. (2024, March). Utilizing Deep Learning for Enhancing Network Resilience in Finance. In 2024 7th International Conference on Advanced Algorithms and Control Engineering (ICAACE) (pp. 987-991). IEEE.
- Xin, Q.; Xu, Z.; Guo, L.; Zhao, F.; Wu, B. IoT traffic classification and anomaly detection method based on deep autoencoders. Appl. Comput. Eng. 2024, 69, 64–70. [Google Scholar] [CrossRef]
- Fruehwirth, Jane Cooley, Alex Xingbang Weng, and Krista MPerreira."The effect of social media use on mental health ofcollege students during the pandemic." Health Economics (2024).
- Li, J.; Wang, Y.; Xu, C.; Liu, S.; Dai, J.; Lan, K. Bioplastic derived from corn stover: Life cycle assessment and artificial intelligence-based analysis of uncertainty and variability. Sci. Total. Environ. 2024, 946, 174349. [Google Scholar] [CrossRef] [PubMed]
- Yang, T.; Li, A.; Xu, J.; Su, G.; Wang, J. Deep learning model-driven financial risk prediction and analysis. Appl. Comput. Eng. 2024, 67, 54–60. [Google Scholar] [CrossRef]
- Haowei, M.; Ebrahimi, S.; Mansouri, S.; Abdullaev, S.S.; Alsaab, H.O.; Hassan, Z.F. CRISPR/Cas-based nanobiosensors: A reinforced approach for specific and sensitive recognition of mycotoxins. Food Biosci. 2023, 56. [Google Scholar] [CrossRef]
- Zhou, Y.; Zhan, T.; Wu, Y.; Song, B.; Shi, C. RNA secondary structure prediction using transformer-based deep learning models. Appl. Comput. Eng. 2024, 64, 88–94. [Google Scholar] [CrossRef]
- Weng A. Depression and Risky Health Behaviors[J]. Available at SSRN 4843979.
- Liu, B.; Cai, G.; Ling, Z.; Qian, J.; Zhang, Q. Precise positioning and prediction system for autonomous driving based on generative artificial intelligence. Appl. Comput. Eng. 2024, 64, 42–49. [Google Scholar] [CrossRef]
- Cui, Z.; Lin, L.; Zong, Y.; Chen, Y.; Wang, S. Precision gene editing using deep learning: A case study of the CRISPR-Cas9 editor. Appl. Comput. Eng. 2024, 64, 134–141. [Google Scholar] [CrossRef]
- Zhang, X. Machine learning insights into digital payment behaviors and fraud prediction. Appl. Comput. Eng. 2024, 67, 61–67. [Google Scholar] [CrossRef]
- Zhang, X. (2024). Analyzing Financial Market Trends in Cryptocurrency and Stock Prices Using CNN-LSTM Models.
- Ping G, Wang S X, Zhao F, et al. Blockchain Based Reverse Logistics Data Tracking: An Innovative Approach to Enhance E-Waste Recycling Efficiency[J]. 2024.
- Shang F, Shi J, Shi Y, et al. Enhancing E-Commerce Recommendation Systems with Deep Learning-based Sentiment Analysis of User Reviews[J]. International Journal of Engineering and Management Research, 2024, 14(4): 19-34.
- Xu Y, Liu Y, Xu H, et al. AI-Driven UX/UI Design: Empirical Research and Applications in FinTech[J]. International Journal of Innovative Research in Computer Science & Technology, 2024, 12(4): 99-109.
- Xu H, Niu K, Lu T, et al. Leveraging artificial intelligence for enhanced risk management in financial services: Current applications and future prospects[J]. Engineering Science & Technology Journal, 2024, 5(8): 2402-2426.
|
Disclaimer/Publisher’s Note: The statements, opinions and data contained in all publications are solely those of the individual author(s) and contributor(s) and not of MDPI and/or the editor(s). MDPI and/or the editor(s) disclaim responsibility for any injury to people or property resulting from any ideas, methods, instructions or products referred to in the content. |
© 2024 by the authors. Licensee MDPI, Basel, Switzerland. This article is an open access article distributed under the terms and conditions of the Creative Commons Attribution (CC BY) license (http://creativecommons.org/licenses/by/4.0/).

