Preprint
Article

Tubular Release of N-acetylglucosaminidase Into Glomerular Filtrate is Minimally Related to Cadmium-Induced Nephron Destruction

Altmetrics

Downloads

72

Views

180

Comments

0

This version is not peer-reviewed

Submitted:

15 August 2024

Posted:

16 August 2024

You are already at the latest version

Alerts
Abstract
Exposure to even low levels of the environmental pollutant cadmium (Cd), increases the risk of kidney damage. The body burden of Cd at which kidney damage occurs is not, however, reliably defined. Here, multiple-regression and mediation analyses were applied to data from 737 non-diabetic Thai nationals, of which 32.2% had hypertension and 9.1% had an estimated glomerular filtration rate (eGFR) ≤ 60 mL/min/1.73 m2 (low eGFR). The excretion rates of Cd (ECd) and N-acetyl-β-D-glucosaminidase (ENAG), a marker of tubular injury, were normalized to creatinine clearance (Ccr) as ECd/Ccr and ENAG/Ccr. Doubling ECd/Ccr increased the risks of having a low eGFR [POR = 2.71 (95% CI:1.97, 3.74), p < 0.001] and severe tubular injury [POR = 4.80 (95% CI: 1.35, 17.1), p = 0.015]. ENAG/Ccr was strongly associated with ECd/Ccr in both men (β = 0.447, p <0.001) and women (β = 0.394, p <0.001), while showing a moderate inverse association with eGFR only in women (β = −0.178, p = 0.002). A moderate association of ENAG/Ccr and ECd/Ccr was found in the low- (β = 0.287, p = 0.001), and the high-Cd body burden groups (β = 0.145, p = 0.004), but ENAG/Ccr was inversely associated with eGFR only in the high-Cd body burden group (β = −0.223, p <0.001). These findings together with an insignificant mediated effect suggested that Cd-induced injury that causes release of NAG plays little or no role in the nephron destruction that reduces GFR.
Keywords: 
Subject: Public Health and Healthcare  -   Public, Environmental and Occupational Health

1. Introduction

Chronic kidney disease (CKD) is a progressive disease with significant morbidity and mortality [1,2]. Globally, death from CKD rose from the 13th in 2000 to the 10th in 2019, and has now reached epidemic proportions, projected to be the fifth leading cause of years of life lost by 2040 [2]. Given the huge financial and community burden, this imposes developing strategies to halt its progression to kidney failure is imperative. Diagnostic criteria for CKD include a fall in the estimated glomerular filtration rate (eGFR) below 60 mL/min/1.73 m2, or albuminuria that persists for at least 3 months [3,4,5]. In its early stage, CKD is largely asymptomatic. This makes its early detection difficult and the initiation of early treatment, which can significantly prevent CKD progression, limited [4,5].
Exposure to the environmental pollutant, cadmium (Cd) is inevitable for most people because of its ubiquitous presence in the human diet, evident from a food safety monitoring program, called total diet studies [6,7,8]. Polluted air, active and passive smoking are additional Cd exposure routes [9,10,11]. Cd has no nutritional value or physiological role, and its health impact has long been underappreciated. Concerningly, a tolerable intake of Cd at 25 μg per kg body weight per month, equivalent to 0.83 μg per kg body weight per day (58 µg per day for a 70 kg person), set by the Joint FAO/WHO Expert Committee on Food Additives and Contaminants (JECFA) [12] is not low enough to be without an appreciable health risk. The JECFA “tolerable” intake level of Cd assumed a nephrotoxicity threshold of Cd excretion at 5.24 μg/g creatinine [12]. However, it is now known that most of excreted Cd originates from injured or dying tubular cells, and excretion of Cd reflects the injury at the present time, not the risk of injury in the future [13].
Environmental Cd exposure has been repeatedly linked to CKD in the general population of many countries across the world [6,14]. Studies from Japan reported the absorption rates of Cd among women to be as high as 24–45% [15,16]. Zinc status and body iron store status are key determinants the body burden of Cd [17]. Cd accumulates mostly in the kidney tubular epithelium [18,19,20]. Here, it impairs mitochondrial function and promotes the generation of reactive oxygen species (ROS) [21], disrupts calcium homeostasis by the endoplasmic reticulum with resultant tubular cell death [22,23]. Of interest, a recent study has shown that the ferroptosis and injury to kidney tubular cells due to Cd was through its induction of heme oxygenase-1 [24].
Ample evidence suggests that exposure to low-concentrations of Cd increases the risk of low eGFR [14]. Reductions in eGFR after Cd exposure are irreversible, and it is likely to decline even further if exposure persists [25]. The present study aimed to unveil a dose-response relationship and a cause-effect inference of Cd exposure, tubular injury and GFR reduction by multiple-regression and mediation analyses. It aimed also to determine the body burden of Cd at which kidney damage occurs.
Data were from apparently healthy, non-diabetics Thai nationals (n = 737) of which 32.2% and 9.1% had hypertension and low eGFR, respectively. Their excretion of Cd (ECd) and N-acetyl-β-D-glucosaminidase (ENAG), a marker of tubular cell damage, were normalized to creatinine clearance (Ccr), as ECd/Ccr and ENAG/Ccr. This Ccr-normalization corrects for urine dilution and the number of functioning nephrons, and it is not influenced by muscle mass [26]. For comparisons, ECd and ENAG were also normalized to creatinine excretion (Ecr), as ECd/Ecr and ENAG/Ecr. This Ecr-normalization corrects for urine dilution only, and it is affected by muscle mass which varies widely among people. Previously, Ecr-adjustment was found to introduce a high degree of a statistical uncertainty, leading to non-statistical significance of Cd effects, and underestimation of the severity of kidney damage due to a cumulative burden of Cd [27,28].

2. Materials and Methods

2.1. Study Subjects

This study was conducted following the principles outlined in the Declaration of Helsinki. To obtain a group of subjects with a wide range of Cd exposure level, appropriate for dose-response analysis, study subjects included residents of Bangkok (n = 200) and Mae Sot District, Tak province, where Cd contamination was endemic (n = 537). The Cd concentration of the paddy soil samples from the Mae Sot district exceeded the standard of 0.15 mg/kg and the rice samples collected from household storage contained four times the amount of the permissible Cd level of 0.1 mg/kg [29]. The reported prevalence of low eGFR in Mae Sot was 16.1% [30].
The Institutional Ethical Committees of Chulalongkorn University, Chiang Mai University and the Mae Sot Hospital approved the study protocol [31]. All subjects were provided with details of study objectives, study procedures, benefits, and potential risks. They were apparently healthy and resided at their current addresses for at least 30 years. Exclusion criteria were pregnancy, breast-feeding, a history of metal work, and a hospital record or physician’s diagnosis of an advanced chronic disease. All subjects gave informed consent prior to participation.

2.2. Ascertainment of Exposure and Adverse Effects on Kidneys

Assessment of Cd exposure and its effects on kidneys were based on a one-time measurement of urinary excretion of Cd (ECd), NAG (ENAG) and the estimated GFR, using the chronic kidney disease epidemiology collaboration (CKD-EPI) equations [32]. The CKD-EPI equations been validated with inulin clearance [33].
Samples of urine and whole blood were collected after overnight fast. Blood samples were collected within 3 h of urine collection. Aliquots of urine, blood and plasma samples were stored at −80 °C for later analysis.
Levels of Cd in urine were quantified by graphite furnace atomic absorption spectrometry with the Zeeman effect background correction system. Multielement standards (Merck KGaA, Darmstadt, Germany) were used for instrument calibration. The quality control and quality assurance of Cd quantitation were accomplished by simultaneous analysis of the reference urine metal control levels 1, 2 and 3 (Lyphocheck, Bio-Rad, Hercules, CA, USA).
The limit of detection (LOD) for Cd urine, defined as 3 times the standard deviation of at least 10 blank sample measurements, was 0.1 µg/L. The sample blanks and reference standards for urine were included in the assay together with samples of urine from subjects. Deionized water was used to zero an instrument. The coefficient of variation in Cd in the reference urine were within acceptable clinical chemistry standards. When a urine sample contained Cd below its LOD, the Cd concentration assigned was the LOD value divided by the square root of 2 [34].
The urinary NAG assay was based on colorimetry (NAG test kit, Shionogi Pharmaceuticals, Sapporo, Japan). Urinary and plasma creatinine concentrations were measured by the colorimetric method, based on the alkaline-picrate Jaffe’s reaction [35].

2.3. Normalization of Excretion Rate of Cd and NAG

Ex was normalized to creatinine clearance (Ccr) as Ex/Ccr = [Cd]u[cr]p/[cr]u, where x = Cd or NAG; [x]u = urine concentration of x (mass/volume); [cr]p = plasma creatinine concentration (mg/dL); and [cr]u = urine creatinine concentration (mg/dL). Ex/Ccr was expressed as an amount of x excreted per volume of the glomerular filtrate [26].
Ex was normalized to Ecr as [x]u/[cr]u, where x= Cd or NAG; [x]u = urine concentration of x (mass/volume) and [cr]u = urine creatinine concentration (mg/dL). Ex/Ecr was expressed in μg/g creatinine.

2.4. Mediation Analysis

Mediation analysis was employed to explore a cause-effect inference of Cd exposure (ECd], tubular injury (ENAG), and a reduction in eGFR [36]. Specifically, a simple mediation model, described by MacKinnon et al. [37], was used to test whether Cd decreases eGFR via tubular injury that releases NAG into tubular filtrate and excreted in urine. The Sobel test, described by Preacher and Hayes [38], was used to determine the statistical significance of the indirect effect of Cd.
Models depicting a tubular injury marker (ENAG) as a mediator (M) of an indirect effect of Cd [X] on the dependent variable, eGFR [Y] were detailed fully in Section 3.3 together with standardized β coefficients and the Sobel test results

2.5. Statistical Analysis

Data were analyzed with IBM SPSS Statistics 21 (IBM Inc., New York, NY, USA). The Mann–Whitney U test was used to assess male-female differences in mean values, and Pearson’s chi-squared test was used to assess differences in percentages. Departure from normal distribution of variables was assessed by one sample Kolmogorov–Smirnov test. Distribution of the variables was examined for skewness and those showing right skewing were subjected to logarithmic transformation before analysis, where required. Histograms showing distribution of age, eGFR, ECd and ENAG are provided in Figures S1–S4.
Multiple linear regression analysis was used to identify predictors of tubular injury and eGFR decline. Logistic regression analysis was used to define determinants of the prevalence odds ratio (POR) for low eGFR. Univariate analysis with Bonferroni correction in multiple comparisons was used to quantify the variation in eGFR (adjusted R2 ) and the contribution of Cd, and other variables to the eGFR variability (eta square, η2 values). For all tests, p-values ≤ 0.05 were considered to indicate statistical significance.

3. Results

3.1. Study Subjects

Environmental Cd exposure levels and demographic characteristics of study subjects can be found in Table 1.
The present cohort consisted of 737 persons with mean age of 48.1 (range: 16-87 years) and the overall mean ECd/Ccr of 0.051 µg/L filtrate and mean ECd/Ecr of 3.72 µg/g creatinine. The overall percentages of women and smokers were 60.7% and 42.7% respectively. Hypertension occurred more commonly (32.2%) than low eGFR (9.1%). There were 192 and 545 persons in a low-and high-Cd burden groups, defined as ECd/Ccr below 0.01 and ≥ 0.01 µg/L filtrate, respectively. Smoking was highly prevalent among men in both groups (43.5% vs. 81.8%).
In the low-Cd burden group, men and women were in equal numbers and they had the same mean values for all parameters measured, with an exception of age, where mean age in women was 6.2 years older than men. No male-female differences in mean values for ECd/Ecr, ENAG/Ecr, ECd/Ccr, or ENAG/Ccr.
In the high Cd-burden group, women constituted 62%, but they were of the same age as men (mean age 52.8 for men and 50.4 for women). The mean BMI, mean eGFR and % hypertension all were higher in women than men. However, the mean ECd/Ecr in women was lower, compared to men (4.21 vs 6.01 µg/g creatinine), due most likely to the very high prevalence of smoking in men (81.8% vs 32.3%). Mean values for ENAG/Ecr, ECd/Ccr and ENAG/Ccr in men and women of this high-Cd burden group were similar.

3.2. Moderate-to-Strong Association of ENAG/Ccr with ECd/Ccr

Results of the multiple linear regression of the tubular injury, ENAG/Ccr can be found in Table 2.
Age, BMI, eGFR and smoking appeared to have differential influences on ENAG/Ccr that depended on gender and a body burden level of Cd (Table 3). In comparison, ECd/Ccr and hypertension were consistently associated with ENAG/Ccr across four subgroups.
ENAG/Ccr varied directly with ECd/Ccr in men (β = 0.447), women (β = 0.394), the low-Cd burden (β = 0.287), and the high-Cd burden groups (β = 0.145). Similarly, a positive association between ENAG/Ccr and hypertension was observed in men (β = 0.167), women (β = 0.169), the low-Cd burden (β = 0.180), and the high-Cd burden groups (β = 0.158).
ENAG/Ccr varied directly with BMI in only women (β =0.132), while showing an inverse association with age in women (β = −0.170) and the high-Cd burden group (β = −0.124). An inverse association of ENAG/Ccr and eGFR was found also in women (β =−0.178) and the high-Cd burden group (β = −0.223). In comparison, an inverse association of ENAG/Ecr and eGFR was statistically insignificant in men, women and the low-Cd burden group (Table S1).

3.3.Qunatification of Effects of Cadmium and Tubular Injury on eGFR

Results of logistic regression of the low eGFR are provided in Table 3.
The prevalence odds ratio (POR) for low eGFR was little affected by gender, hypertension, and smoking, while age, BMI, ECd/Ccr and ENAG/Ccr quartile 4 level were associated with increases in risk of having low eGFR. Per each year increase in age, and per one kg/m2 increase in BMI, POR for low eGFR rose 16.7% (p = 0.001) and 10.9% (p = 0.037), respectively. The POR for low eGFR increased 2.71-fold per doubling ECd/Ccr (p <0.001) and 4.80-fold when ENAG/Ccr rose from quartile 1 to quartile 4 (p = 0.015).
Results of a univariate analysis of eGFR can be found in Table 4.
More than half (63.3%) of male eGFR variation was accounted for (Table 4). Age contributed the largest fraction (34%), followed by ECd/Ccr (8.1%) and hypertension (1.6%). In women. 44% of their eGFR variation were accounted for. Age, ECd/Ccr, and ENAG/Ccr respectively, contributed 24.9%,11.4% and 3.4% of the variation.
In the low-Cd burden group, 49.4% of the total eGFR variation was accounted for. Age contributed the most to the eGFR variability (38%), followed by smoking × hypertension × ENAG/Ccr interactions (5.9%) and gender (5.1%). ECd/Ccr contributed to only 0.034% of eGFR variation (p = 0.828).
In the high-Cd burden group, seven independent variables together accounted for a nearly half of the total variation in eGFR (49.3%) with no interaction complications. Age contributed the most to the eGFR variability (30%) followed by ECd/Ccr (15%) and ENAG/Ccr quartiles (1.3%).

3.4. Mediation Analysis

The scatterplots of the variables in mediation analysis for the low-Cd burden group are provided in Figure 1.
A linear dose-response relationship was evident for log[(ENAG/Ccr) × 103) vs log [(ECd/Ccr) × 105] (Figure 1a), eGFR vs log [(ECd/Ccr) × 105] (Figure 1b) in both men and women. For the eGFR vs log[(ENAG/Ccr) × 103), a dose-response relationship was present only in men (Figure 1c).
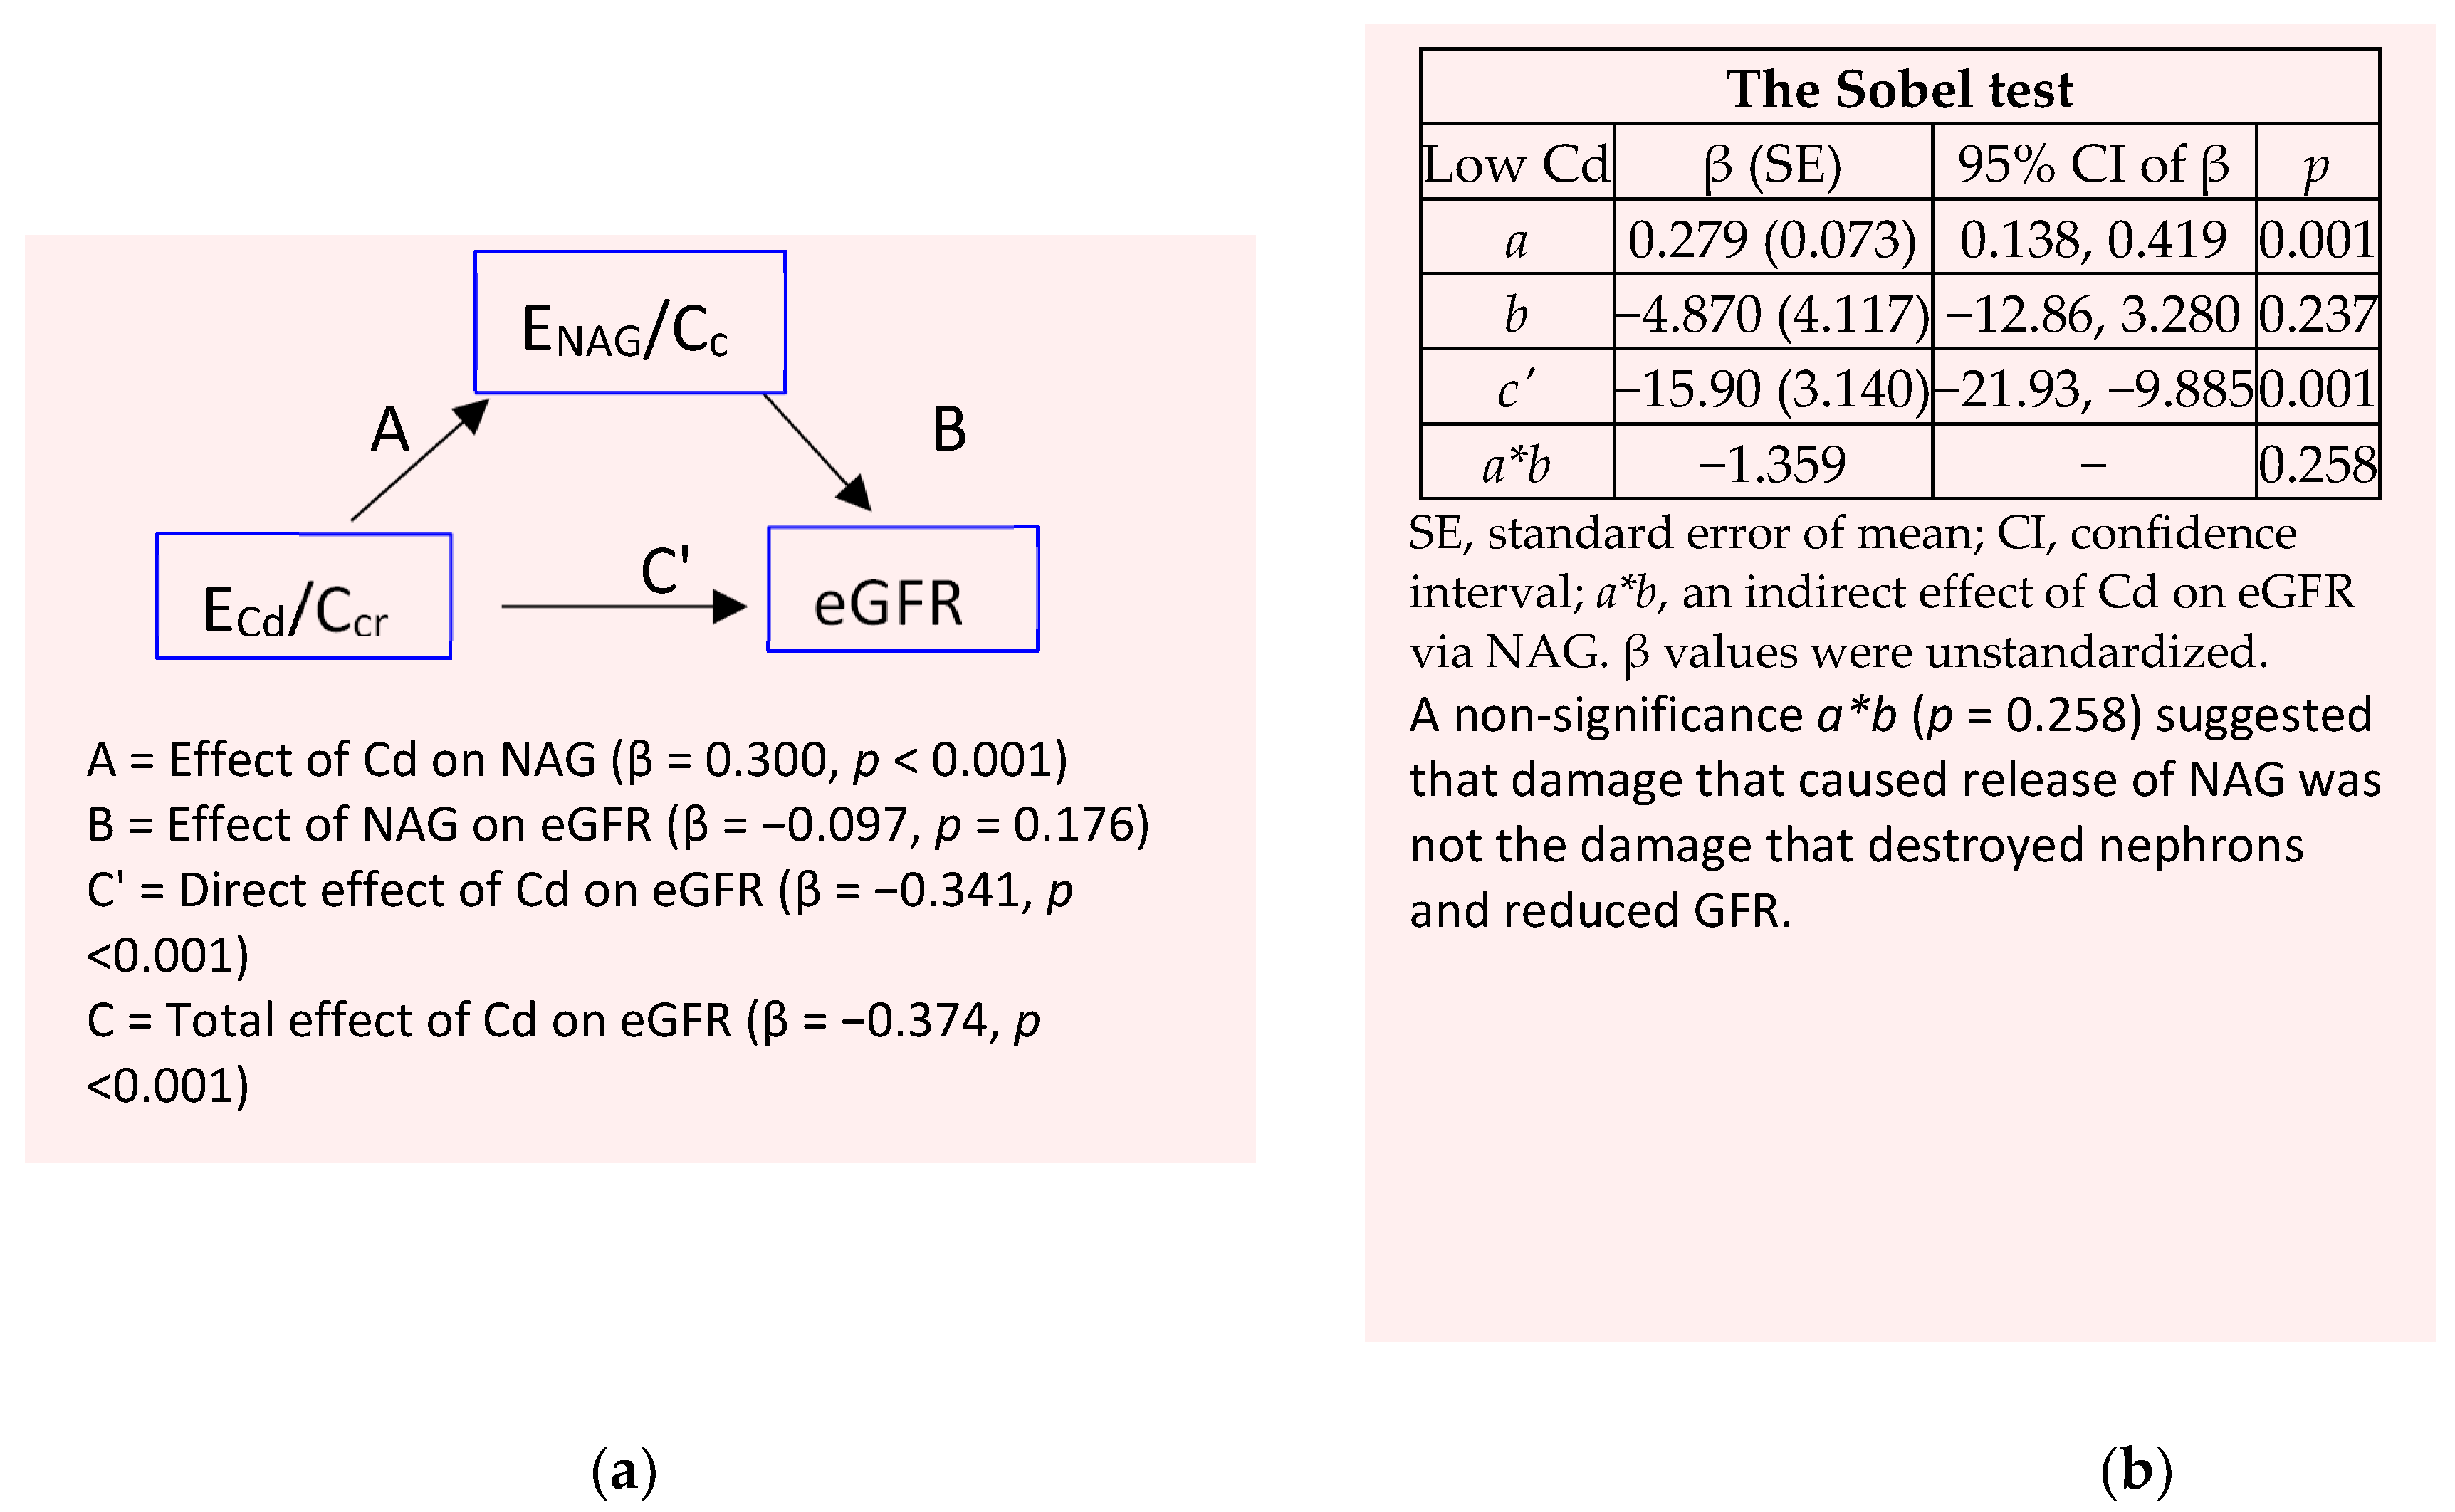
Results of mediation analysis model for the low-Cd burden group are provided in Figure 2.
In a simple mediation analysis model (Figure 2a), there was a significant effect of ECd/Ccr on eGFR (β = −0.374, p <0.001). However, none of its effect was mediated through ENAG/Ccr, suggested by a nonstatistical significance figure of a*b (p = 0.258) (Figure 2b).
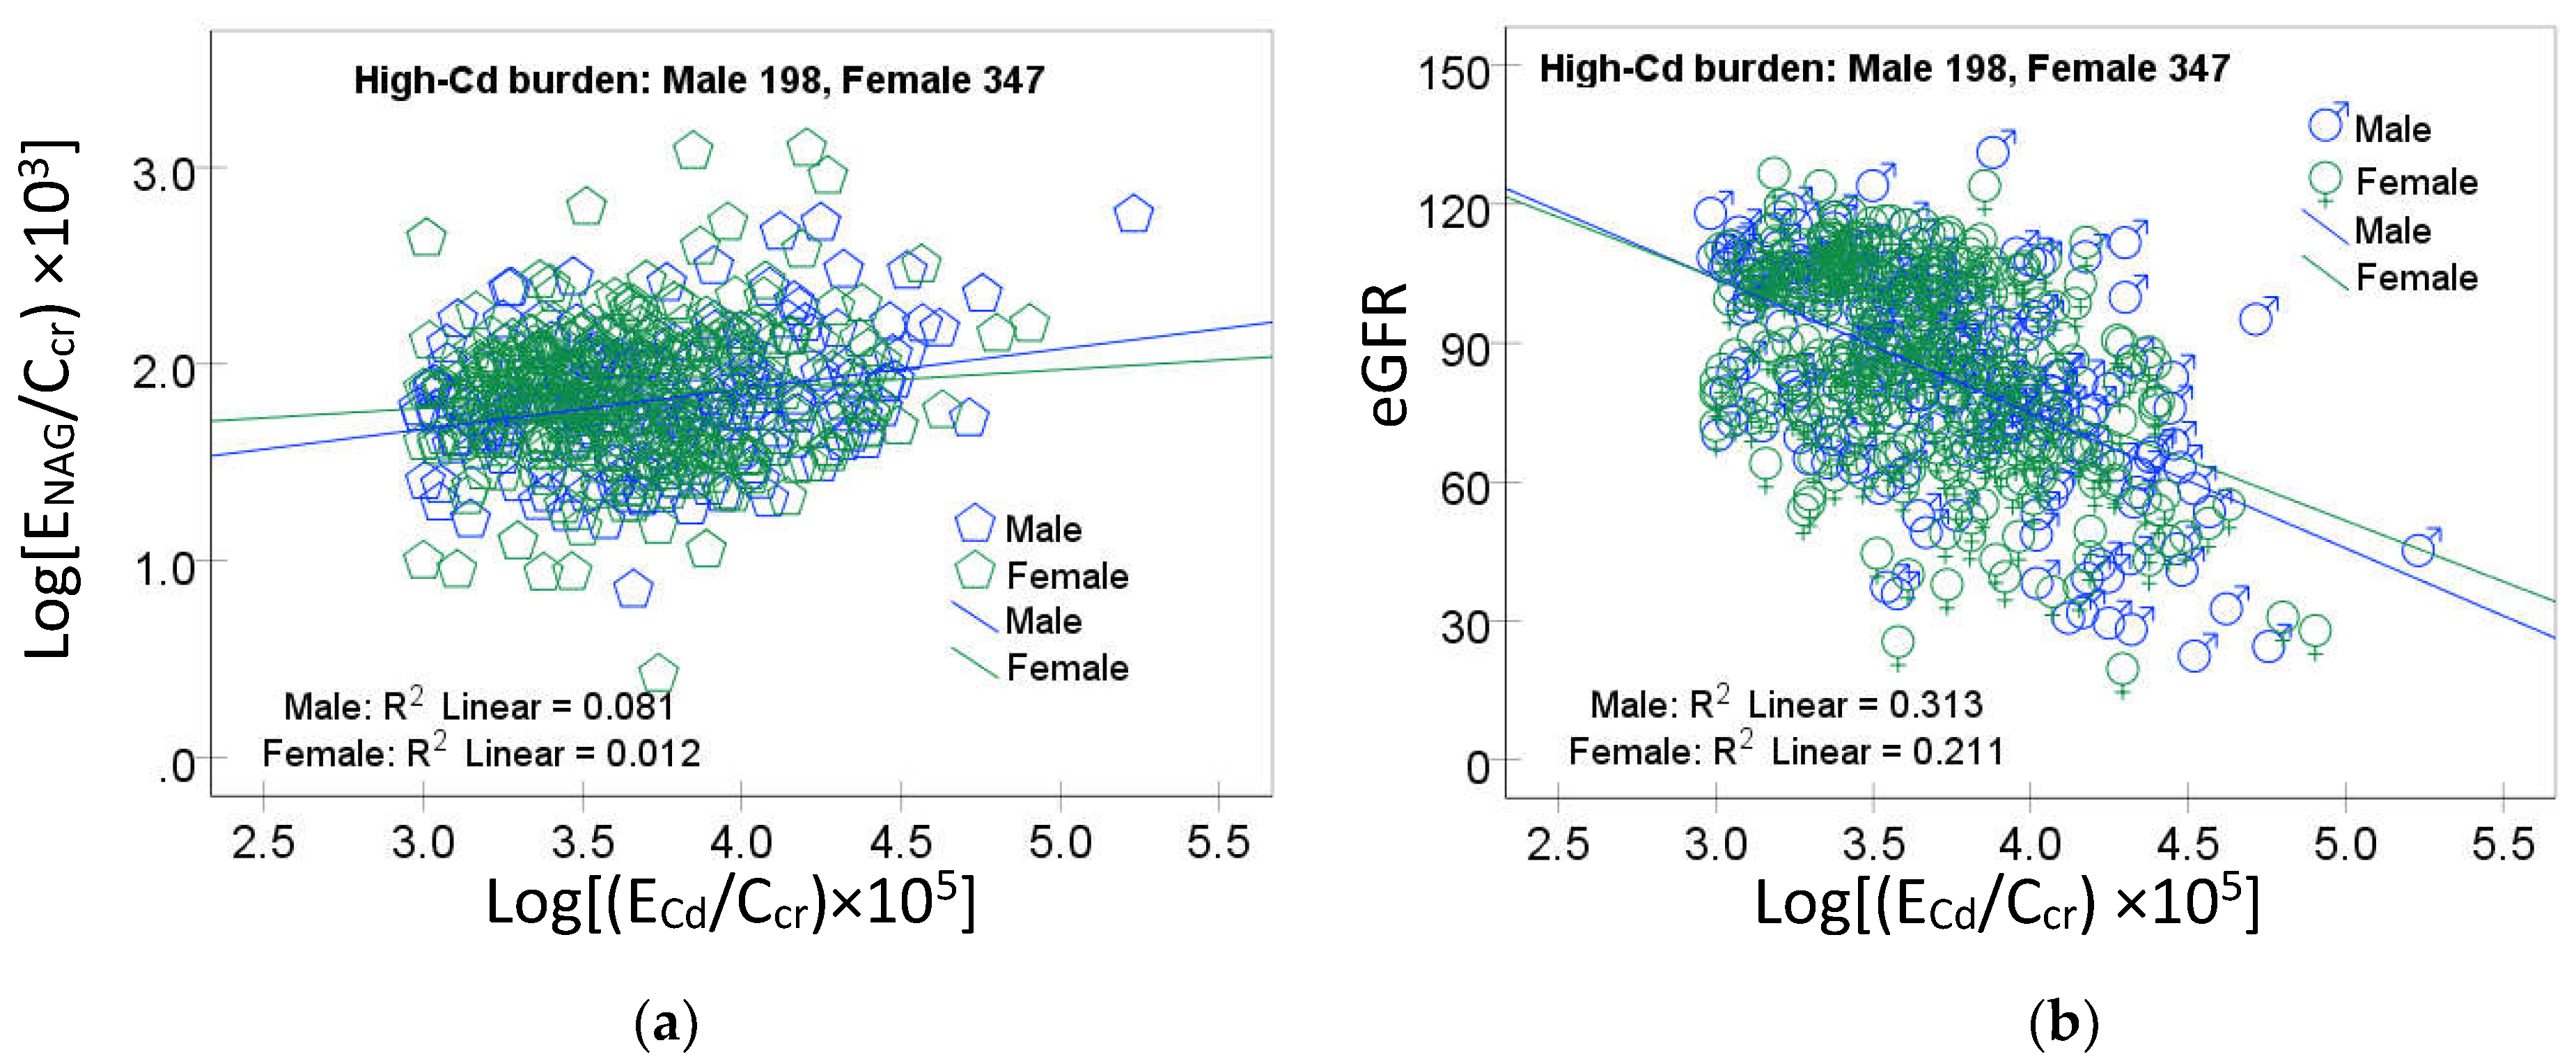
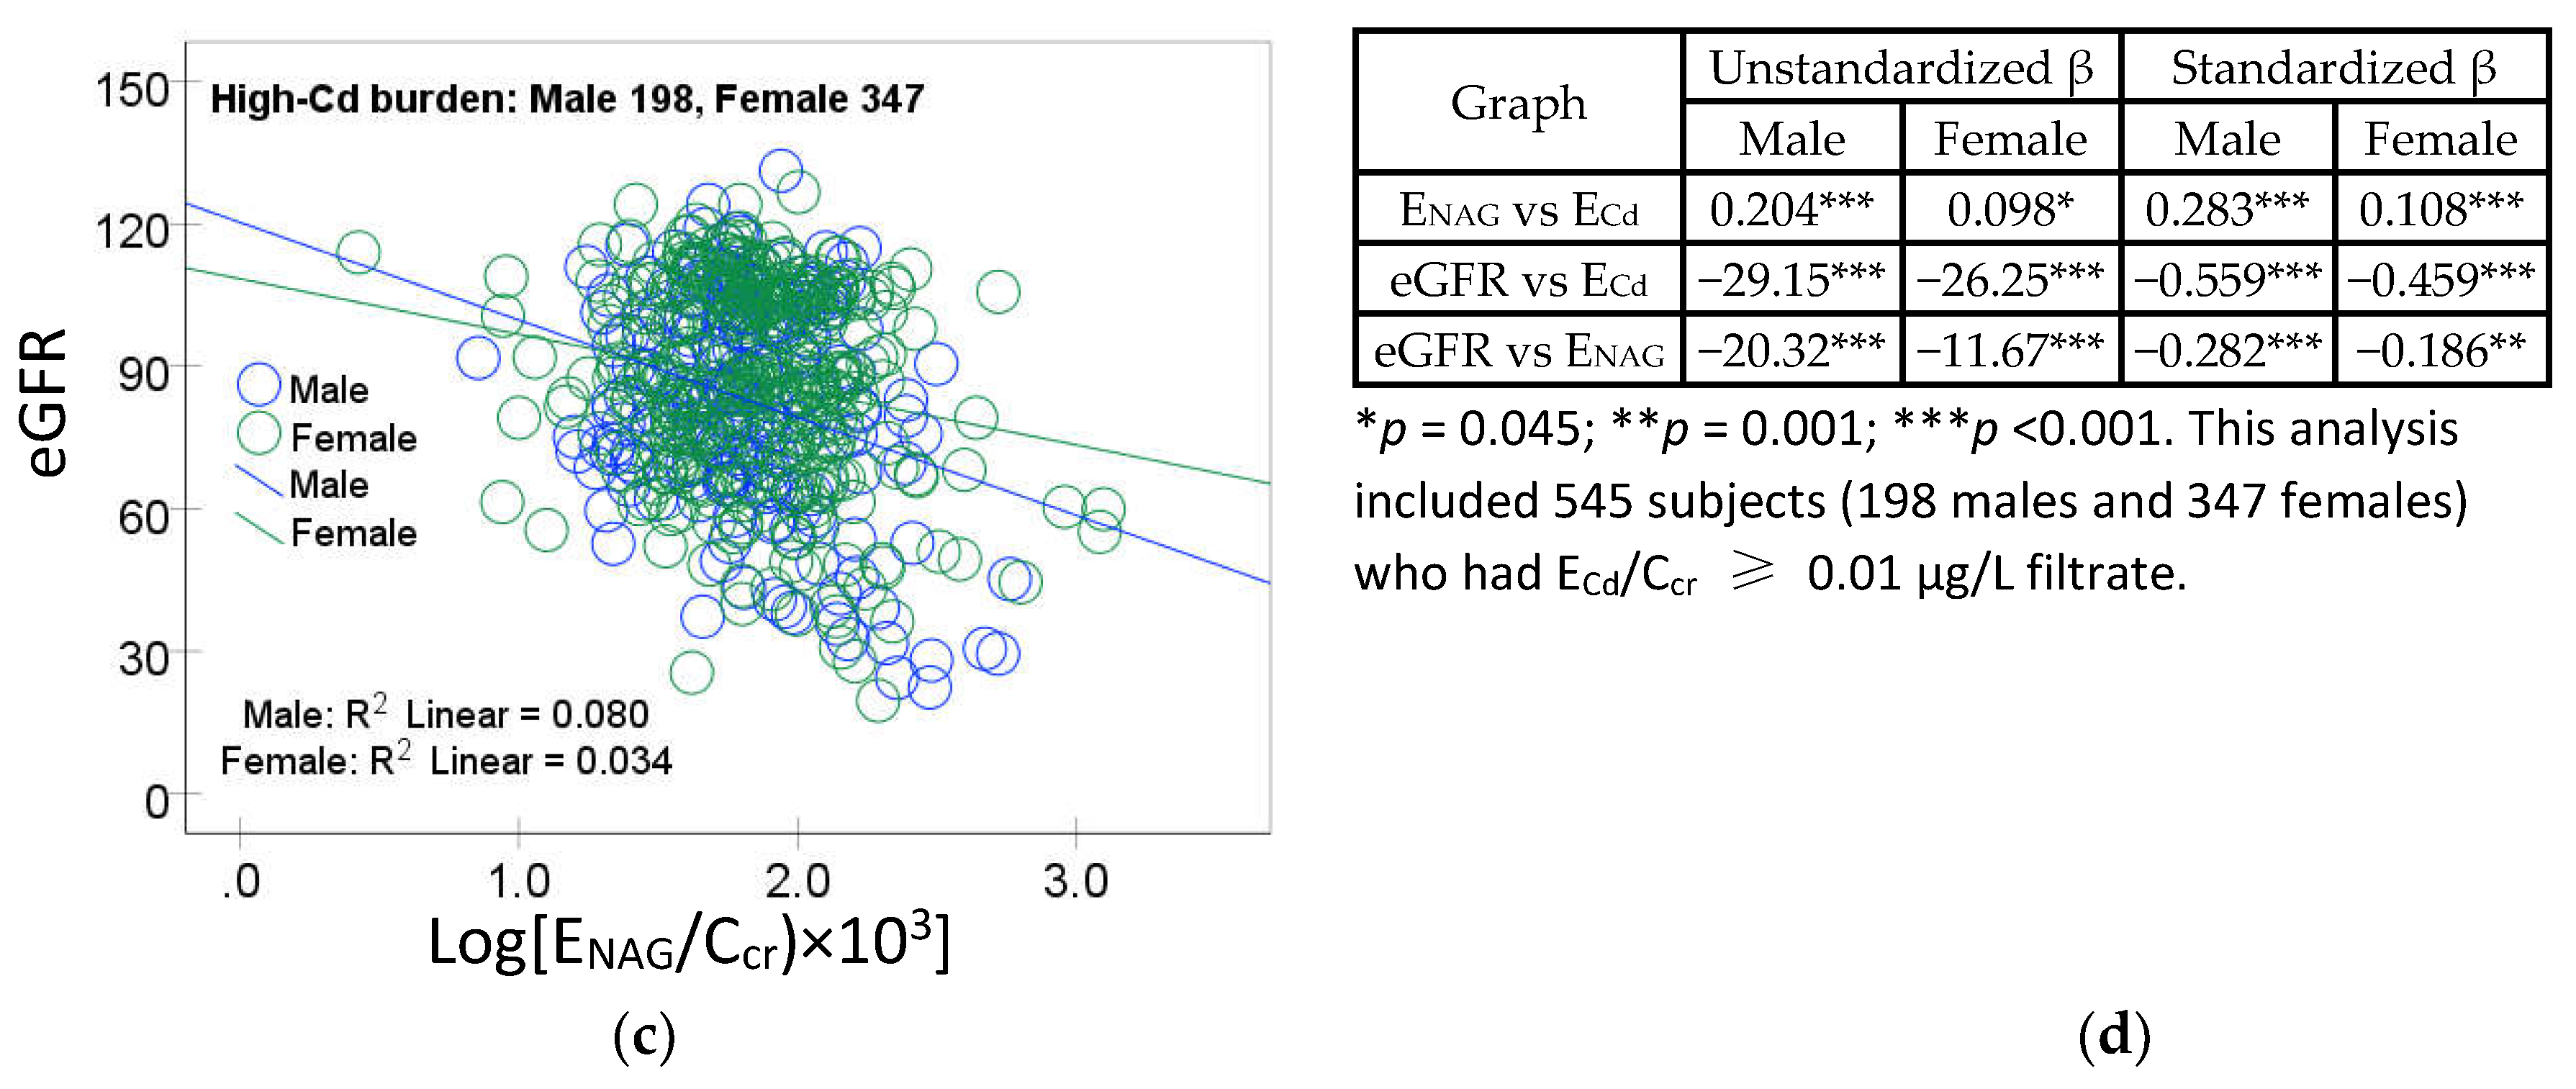
The scatterplots of the variables in mediation for the high-Cd burden group are provided in Figure 3.
A linear dose-response relationship was evident for log[(ENAG/Ccr) × 103) vs log [(ECd/Ccr) × 105] (Figure 3a), eGFR vs log [(ECd/Ccr) × 105] (Figure 3b) and eGFR vs log[(ENAG/Ccr) × 103) (Figure 1c) in both men and women.
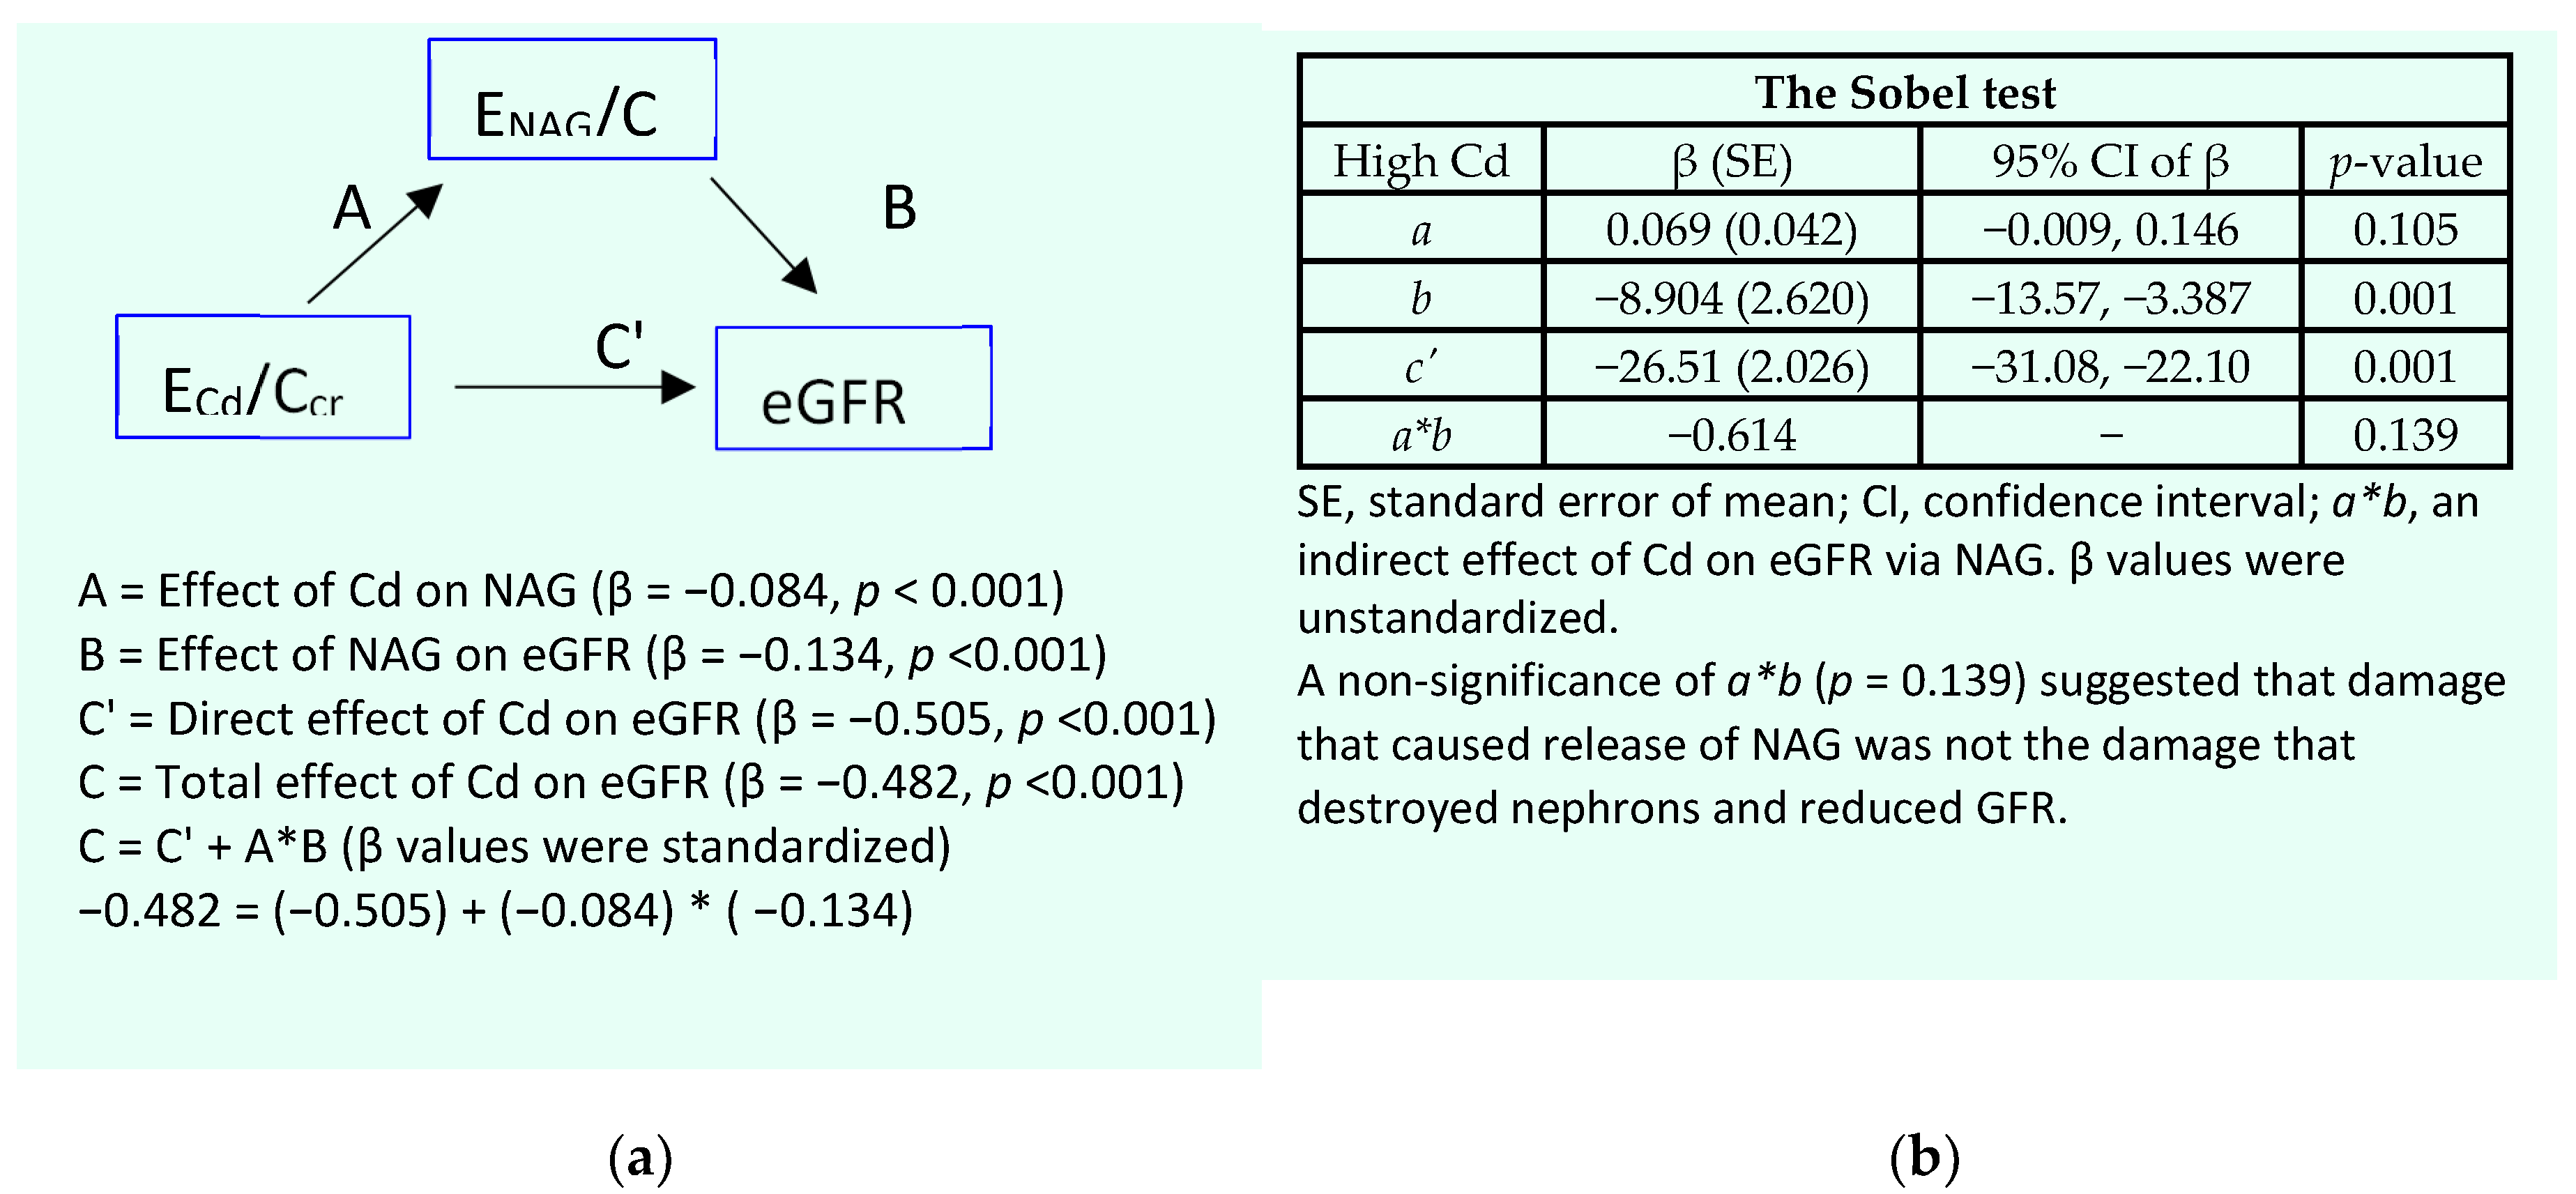
Results of mediation analysis model for the high-Cd burden group are provided in Figure 4.
In a simple mediation model (Figure 4a), there was a significant effect of ECd/Ccr on eGFR (β = −0.482, p <0.001). However, none of its effect was mediated through ENAG/Ccr as the Sobet test informed a nonstatistical significance figure of a*b (p = 0.139) by (Figure 4b).

4. Discussion

In following JECFA’s tolerable intake level of Cd in the human diet [13], most studies relied on a rise of β2-microglobulin (β2M) excretion above 300 µg/g creatinine, as a nephrotoxicity endpoint. However, Cd-induced tubular injury, assessed with an increased NAG excretion, has also been observed, especially in environmental low-dose exposure scenarios. For example, in a study from United Kingdom, ECd/Ecr of 0.5 μg/g creatinine was associated with 2.6- and 3.6-fold increases in the likelihood of having abnormal NAG excretion (ENAG/Ecr > 2 U/g creatinine), compared to an ECd/Ecr of 0.3 and < 0.5 μg/g creatinine, respectively [39]. Hence, a significant increase in risk of having kidney damage has been linked to an ECd/Ecr as low as 0.5 μg/g creatinine. This ECd/Ecr was one tenth of the current threshold at 5.24 μg/g creatinine. In theory, the most sensitive endpoint should be used as a basis from which exposure limits are determined [40].
At least 30 publications have shown a dose-response relationship of ENAG/Ecr and ECd/Ecr [41] Like urine Cd, urine NAG emanates from injured or dying tubular cells [13,42,43]. Therefore, an excreted amount of NAG is proportional to the number of surviving nephrons, and ENAG and ECd can be expected to be closely correlated as shown previously [13]. For these reasons, the present study focused on ENAG together with eGFR, which is employed in clinical trials to evaluate the effects of CKD treatment [3,4,5].
ECd and ENAG are most logically normalized to a function of intact nephron mass because they both are released by tubular cells [6]. GFR is the measurable analog of nephron number; if Ccr is accepted as a surrogate for GFR, Ccr-normalization corrects for differences in nephron mass. Ccr-normalization may overstate the toxicity implied by a robust ECd when nephron number is normal, and understate the toxicity implied by a modest ECd when nephron number is reduced. The impact of Ecr-normalization of ECd and ENAG are illustrated in SM (Fig. S4 vs Fig. S3).
By multiple regression analysis (Table 2), ENAG/Ccr was strongly associated with ECd/Ccr in men (β = 0.447) and women (β = 0.394). A linear-dose response relationship in every subgroup was indicated clearly by scatterplots (Figure 1a and Figure 3a). Similarly, an inverse association of eGFR and ECd/Ccr was consistent across subgroups (Figure 1b and Figure 3b). Notably, however, ENAG/Ccr was inversely associated with eGFR in women (β = −0.178) and the high-Cd burden group (β = −0.223), not in men or the low Cd-burden group (Table 2). These discrepancies could be interpreted to suggest that Cd-induced reduction in eGFR and Cd-induced tubular injury, which caused NAG release were independent or unrelated.
Results of mediation models lend support to the above interpretation; a significant effect of ECd/Ccr on eGFR was suggested for both the low -(β = −0.374) and high-Cd burden groups (β = −0.482) (Figure 2a and Figure 4a), while the Sobel test results informed a nonstatistical significance figures of a mediation effect (a*b) in both groups (Figure 2b and Figure 4b). Therefore, Cd-induced injury that causes release of NAG appeared to play little or no role in the nephron destruction that reduces GFR. The molecular basis of Cd induced nephron destruction was not apparent from the present study.
As data in Table 3 and Table 4 indicate, the risk of having low eGFR was influenced by age, BMI, a level of body burden of Cd, and the severity of tubular injury. A high-Cd body burden and tubular injury contributed, respectively to 15% (p <0.00) and 1.3% (p = 0.085) of the variation in eGFR among those who had ECd/Ccr ≥ 0.01 µg/L filtrate. In comparison, gender and a low-Cd body burden contributed, respectively to 5.1% (p = 0.007) and 0.034% (p = 0.828) in the eGFR variation among subjects who had ECd/Ccr < 0.01 µg/L filtrate. These finding suggested that Cd exposure level producing ECd/Ccr below 0.01 µg/L filtrate was the least likely to induce a significant damage to kidneys. This low body burden of Cd corresponds to ECd/Ecr of 0.01-0.02 µg/g creatinine.
ECd/Ccr of less than 0.01 µg/L filtrate, is in ranges with the benchmark dose limit (BMDL) of Cd body burden [28]. At present, BMDL is a replacement of the no-observed-adverse effect level (NOAEL) due to its shortcoming. NOAEL is referred to as the highest experimental dose level for which the response does not significantly differ from the response in the control group [41].
An increased risk of low eGFR can now be attributable to environmental Cd exposure [20]. The BMD values estimated from ENAG/Ecr and eGFR endpoints using data from 790 Swedish women, aged 53–64 years, were 0.5–0.8 and 0.7–1.2 μg/g creatinine, respectively [45]. However, in the China Health and Nutrition Survey (n = 8429), of which 641 (7.6%) of participants had CKD, dietary Cd exposure of 23.2, 29.6 and 36.9 μg/day were associated with 1.73-, 2.93- and 4.05-fold increases in the likelihood of having CKD, compared to a dietary exposure of 16.7 μg/day [44]. An inferred “safe” dietary Cd exposure level would be below 16.7 µg/day.
It seems illogical to base a designation of tolerable Cd intake on ECd, given its origin and the cause of its release are now known. Minimization of Cd exposure is always imperative, but there is no theoretical or empiric basis for delaying that intervention until ECd has reached a predetermined level, and no evidence that reduction of exposure reverses existing injury. Avoidance of foods containing high Cd concentrations, and minimization of exposure make the most sense when ECd/Ccr first suggests active tubular injury.

5. Conclusions

The risk of having low eGFR rose 2.7-fold per a twofold increase in the body burden of Cd. Severe tubular injury increased the risk of low eGFR a further 43.8%. Mediation analysis inferred that a destruction of nephrons by Cd, which reduces GFR, occurs via the mechanism other than those causing NAG release. Environmental Cd exposure that produces ECd/Ccr less than 0.01 µg/L filtrate contributes to 0.034 % of the eGFR variability. Thus, an ECd/Ccr of 0.01 µg/L filtrate could be used to reliably define a body burden of Cd below which there is no risk of kidney damage. This Cd exposure level is in ranges with the NOAEL equivalent obtained by benchmark dose computation.

Supplementary Materials

The following supporting information can be downloaded at the website of this paper posted on Preprints.org., Table S1: Predictors of tubular injury; Figure S1: Normal distribution of age; Figure S2: Left-skewed distribution of eGFR; Figure S3: Distribution of excretion of cadmium and NAG normalized to creatinine clearance; Figure S4: Distribution of excretion of cadmium and NAG normalized to creatinine excretion.

Funding

This research received no external funding.

Institutional Review Board Statement

Not applicable. This study analyzed archived data.

Informed Consent Statement

Informed consent was obtained from all subjects involved in the study.

Data Availability Statement

All data are contained within this article.

Acknowledgments

The author gratefully acknowledges overseas travel grants and partial research project funds through the Reverse Brain Drain Project, the Commission of Higher Education, Thailand Ministry of Education, and the National Science and Technology Development Agency, Thailand Ministry of Sciences and Technology.

Conflicts of Interest

The author declares no conflicts of interest.

References

  1. Foreman, K.J.; Marquez, N.; Dolgert, A.; Fukutaki, K.; Fullman, N.; McGaughey, M.; Pletcher, M.A.; Smith, A.E.; Tang, K.; Yuan, C.W.; et al. Forecasting life expectancy, years of life lost, and all-cause and cause-specific mortality for 250 causes of death: Reference and alternative scenarios for 2016-40 for 195 countries and territories. Lancet 2018, 392, 2052–2090. [Google Scholar] [CrossRef]
  2. GBD 2021 Forecasting Collaborators. Burden of disease scenarios for 204 countries and territories, 2022–2050: A forecasting analysis for the Global Burden of Disease Study 2021. Lancet 2024, 403, 2204–2256. [Google Scholar]
  3. Murton M, Goff-Leggett D, Bobrowska A, Garcia Sanchez JJ, James G, Wittbrodt E, Nolan S, Sörstadius E, Pecoits-Filho, R. ; Tuttle, K. Burden of Chronic Kidney Disease by KDIGO Categories of Glomerular Filtration Rate and Albuminuria: A Systematic Review. Adv. Ther. 2021, 38, 180–200. [Google Scholar] [CrossRef] [PubMed]
  4. Kalantar-Zadeh, K.; Jafar, T.H.; Nitsch, D.; Neuen, B.L.; Perkovic, V. Chronic kidney disease. Lancet 2021, 398, 786–802. [Google Scholar] [CrossRef] [PubMed]
  5. Farrell, D.R.; Vassalotti, J.A. Screening, identifying, and treating chronic kidney disease: why, who, when, how, and what? BMC Nephrol. 2024, 25, 34. [Google Scholar]
  6. Satarug, S.; Vesey, D.A.; Gobe, G.C.; Phelps, K.R. Estimation of health risks associated with dietary cadmium exposure. Arch. Toxicol. 2023, 97, 329–358. [Google Scholar] [PubMed]
  7. Fechner, C.; Hackethal, C.; Höpfner, T.; Dietrich, J.; Bloch, D.; Lindtner, O.; Sarvan, I. Results of the BfR MEAL Study: In Germany, mercury is mostly contained in fish and seafood while cadmium, lead, and nickel are present in a broad spectrum of foods. Food Chem. X 2022, 14, 100326. [Google Scholar] [CrossRef]
  8. Watanabe, T.; Kataoka, Y.; Hayashi, K.; Matsuda, R.; Uneyama, C. Dietary exposure of the Japanese general population to elements: Total diet study 2013–2018. Food Saf. 2022, 10, 83–101. [Google Scholar] [CrossRef] [PubMed]
  9. Hill, D.T.; Jandev, V.; Petroni, M.; Atallah-Yunes, N.; Bendinskas, K.; Brann, L.S.; Heffernan, K.; Larsen, D.A.; MacKenzie, J.A.; Palmer, C.D.; et al. Airborne levels of cadmium are correlated with urinary cadmium concentrations among young children living in the New York state city of Syracuse, USA. Environ. Res. 2023, 223, 115450. [Google Scholar] [PubMed]
  10. Almerud, P.; Zamaratskaia, G.; Lindroos, A.K.; Bjermo, H.; Andersson, E.M.; Lundh, T.; Ankarberg, E.H.; Lignell, S. Cadmium, total mercury, and lead in blood and associations with diet, sociodemographic factors, and smoking in Swedish adolescents. Environ Res. 2021, 197, 110991. [Google Scholar] [CrossRef] [PubMed]
  11. Pappas, R.S.; Fresquez, M.R.; Watson, C.H. Cigarette smoke cadmium breakthrough from traditional filters: implications for exposure. J. Anal. Toxicol. 2015, 39, 45–51. [Google Scholar] [CrossRef] [PubMed]
  12. JECFA. Summary and Conclusions. In Proceedings of the Joint FAO/WHO Expert Committee on Food Additives and Contaminants, Seventy-Third Meeting, Geneva, Switzerland, 8–17 June 2010; JECFA/73/SC. Food and Agriculture Organization of the United Nations/World Health Organization: Geneva, Switzerland, 2011. Available online: https://apps.who.int/iris/handle/10665/44521 (accessed on 12 August 2024).
  13. Satarug, S.; Vesey, D.A.; Ruangyuttikarn, W.; Nishijo, M.; Gobe, G.C.; Phelps, K.R. The Source and Pathophysiologic Significance of Excreted Cadmium. Toxics 2019, 7, 55. [Google Scholar] [CrossRef]
  14. Doccioli, C.; Sera, F.; Francavilla, A.; Cupisti, A.; Biggeri, A. Association of cadmium environmental exposure with chronic kidney disease: A systematic review and meta-analysis. Sci. Total Environ. 2024, 906, 167165. [Google Scholar] [CrossRef] [PubMed]
  15. Kikuchi, Y.; Nomiyama, T.; Kumagai, N.; Dekio, F.; Uemura, T.; Takebayashi, T.; Nishiwaki, Y.; Matsumoto, Y.; Sano, Y.; Hosoda, K.; et al. Uptake of cadmium in meals from the digestive tract of young non-smoking Japanese female volunteers. J. Occup. Health 2003, 45, 43–52. [Google Scholar] [CrossRef] [PubMed]
  16. Horiguchi, H.; Oguma, E.; Sasaki, S.; Miyamoto, K.; Ikeda, Y.; Machida, M.; Kayama, F. Comprehensive study of the effects of age, iron deficiency, diabetes mellitus, and cadmium burden on dietary cadmium absorption in cadmium-exposed female Japanese farmers. Toxicol. Appl. Pharmacol. 2004, 196, 114–123. [Google Scholar] [CrossRef] [PubMed]
  17. Peng, X.; Li, C.; Zhao, D.; Huang, L. Associations of micronutrients exposure with cadmium body burden among population: A systematic review. Ecotoxicol. Environ. Saf. 2023, 256, 114878. [Google Scholar]
  18. Satarug, S.; Baker, J.R.; Reilly, P.E.; Moore, M.R.; Williams, D.J. Cadmium levels in the lung, liver, kidney cortex, and urine samples from Australians without occupational exposure to metals. Arch. Environ. Health 2002, 57, 69–77. [Google Scholar] [CrossRef]
  19. Akerstrom, M.; Barregard, L.; Lundh, T.; Sallsten, G. The relationship between cadmium in kidney and cadmium in urine and blood in an environmentally exposed population. Toxicol. Appl. Pharmacol. 2013, 268, 286–293. [Google Scholar] [CrossRef] [PubMed]
  20. Barregard, L.; Sallsten, G.; Lundh, T.; Mölne, J. Low-level exposure to lead, cadmium and mercury, and histopathological findings in kidney biopsies. Environ. Res. 2022, 211, 113119. [Google Scholar] [CrossRef]
  21. Thévenod, F.; Lee, W.K.; Garrick, M.D. Iron and cadmium entry into renal mitochondria: Physiological and toxicological implications. Front. Cell Dev. Biol. 2020, 8, 848. [Google Scholar] [CrossRef]
  22. Ning, B.; Guo, C.; Kong, A.; Li, K.; Xie, Y.; Shi, H.; Gu, J. Calcium signaling mediates cell death and crosstalk with autophagy in kidney disease. Cells 2021, 10, 3204. [Google Scholar] [CrossRef] [PubMed]
  23. Li, K.; Guo, C.; Ruan, J.; Ning, B.; Wong, C.K.-C.; Shi, H.; Gu, J. Cadmium disrupted ER Ca2+ homeostasis by inhibiting SERCA2 expression and activity to induce apoptosis in renal proximal tubular cells. Int. J. Mol. Sci. 2023, 24, 5979. [Google Scholar] [CrossRef] [PubMed]
  24. Lv, Y.T.; Liu, T.B.; Li, Y.; Wang, Z.Y.; Lian, C.Y.; Wang, L. HO-1 activation contributes to cadmium-induced ferroptosis in renal tubular epithelial cells via increasing the labile iron pool and promoting mitochondrial ROS generation. Chem. Biol. Interact. 2024, 399, 111152. [Google Scholar]
  25. Satarug, S. Is Chronic Kidney Disease Due to Cadmium Exposure Inevitable and Can It Be Reversed? Biomedicines 2024, 12, 718. [Google Scholar] [CrossRef] [PubMed]
  26. Phelps, K.R.; Gosmanova, E.O. A generic method for analysis of plasma concentrations. Clin. Nephrol. 2020, 94, 43–49. [Google Scholar] [CrossRef] [PubMed]
  27. Satarug, S.; Vesey, D.A.; Gobe, G.C.; Đorđević, A.B. The Validity of Benchmark Dose Limit Analysis for Estimating Permissible Accumulation of Cadmium. Int. J. Environ. Res. Public Health 2022, 19, 15697. [Google Scholar] [CrossRef] [PubMed]
  28. Satarug, S.; Đorđević, A.B.; Yimthiang, S.; Vesey, D.A.; Gobe, G.C. The NOAEL Equivalent of Environmental Cadmium Exposure Associated with GFR Reduction and Chronic Kidney Disease. Toxics 2022, 10, 614. [Google Scholar] [CrossRef]
  29. Suwatvitayakorn, P.; Ko, M.S.; Kim, K.W.; Chanpiwat, P. Human health risk assessment of cadmium exposure through rice consumption in cadmium-contaminated areas of the Mae Tao sub-district, Tak, Thailand. Environ. Geochem. Health 2020, 42, 2331–2344. [Google Scholar] [CrossRef] [PubMed]
  30. Swaddiwudhipong, W.; Nguntra, P.; Kaewnate, Y.; Mahasakpan, P.; Limpatanachote, P.; Aunjai, T.; Jeekeeree, W.; Punta, B.; Funkhiew, T.; Phopueng, I. Human health effects from cadmium exposure: Comparison between persons living in cad-mium-contaminated and non-contaminated areas in northwestern Thailand. Southeast Asian J. Trop. Med. Publ. Health 2015, 46, 133–142. [Google Scholar]
  31. Satarug, S.; Swaddiwudhipong, W.; Ruangyuttikarn, W.; Nishijo, M.; Ruiz, P. Modeling cadmium exposures in low- and high-exposure areas in Thailand. Environ. Health Perspect. 2013, 121, 531–536. [Google Scholar] [CrossRef]
  32. Levey, A.S.; Stevens, L.A.; Scmid, C.H.; Zhang, Y.; Castro, A.F., III; Feldman, H.I.; Kusek, J.W.; Eggers, P.; Van Lente, F.; Greene, T.; et al. A new equation to estimate glomerular filtration rate. Ann. Intern. Med. 2009, 150, 604–612. [Google Scholar] [CrossRef] [PubMed]
  33. White, C.A.; Allen, C.M.; Akbari, A.; Collier, C.P.; Holland, D.C.; Day, A.G.; Knoll, G.A. Comparison of the new and traditional CKD-EPI GFR estimation equations with urinary inulin clearance: A study of equation performance. Clin. Chim. Acta 2019, 488, 189–195. [Google Scholar] [CrossRef] [PubMed]
  34. Hornung, R.W.; Reed, L.D. Estimation of average concentration in the presence of nondetectable values. Appl. Occup. Environ. Hyg. 1990, 5, 46–51. [Google Scholar] [CrossRef]
  35. Spencer, K. Analytical reviews in clinical biochemistry: The estimation of creatinine. Ann. Clin. Biochem. 1985, 23, 1–25. [Google Scholar] [CrossRef] [PubMed]
  36. Preacher, K.J. Advances in mediation analysis: a survey and synthesis of new developments. Annu. Rev. Psychol. 2015, 66, 825–52. [Google Scholar] [CrossRef] [PubMed]
  37. MacKinnon, D.P.; Warsi, G.; Dwyer, J.H. A simulation study of mediated effect measures. Multiv. Behav. Res. 1995, 30, 41–62. [Google Scholar] [CrossRef] [PubMed]
  38. Preacher, K.J.; Hayes, A.F. SPSS and SAS procedures for estimating indirect effects in simple mediation models. Behav. Res. Meth. Instrum. Comput. 2004, 36, 717–731. [Google Scholar] [CrossRef] [PubMed]
  39. Thomas, D.K.; Hodgson, S.; Nieuwenhuijsen, M.; Jarup, L. Early kidney damage in a population exposed to cadmium and other heavy metals. Environ. Health Perspect. 2009, 117, 181–184. [Google Scholar] [CrossRef] [PubMed]
  40. Moffett, D.B.; Mumtaz, M.M.; Sullivan, D.W., Jr.; Whittaker, M.H. Chapter 13, General Considerations of Dose-Effect and Dose-Response Relationships. In Handbook on the Toxicology of Metals, 5th ed.; Volume I: General, Considerations, Nordberg, G., Costa, M., Eds.; Academic Press: Cambridge, MA, USA, 2022; pp. 299–317. [Google Scholar]
  41. Liu, C.; Li, Y.; Zhu, C.; Dong, Z.; Zhang, K.; Zhao, Y.; Xu, Y. Benchmark dose for cadmium exposure and elevated N-acetyl-β-D-glucosaminidase: A meta-analysis. Environ. Sci. Pollut. Res. Int. 2016, 23, 20528–20538. [Google Scholar] [CrossRef] [PubMed]
  42. Price, R.G. Measurement of N-acetyl-beta-glucosaminidase and its isoenzymes in urine: Methods and clinical applications. Eur. J. Clin. Chem. Clin. Biochem. 1992, 30, 693–705. [Google Scholar] [PubMed]
  43. Pócsi, I.; Dockrell, M.E.; Price, R.G. Nephrotoxic biomarkers with specific indications for metallic pollutants: Implications for environmental health. Biomark. Insights 2022, 17, 11772719221111882. [Google Scholar] [CrossRef] [PubMed]
  44. Shi, Z.; Taylor, A.W.; Riley. , M.; Byles., J.; Liu, J.; Noakes, M. Association between dietary patterns, cadmium intake and chronic kidney disease among adults. Clin. Nutr. 2018, 37, 276–284. [Google Scholar] [CrossRef] [PubMed]
  45. Suwazono, Y.; Sand, S.; Vahter, M.; Filipsson, A.F.; Skerfving, S.; Lidfeldt, J.; Akesson, A. Benchmark dose for cadmium-induced renal effects in humans. Environ. Health Perspect. 2006, 114, 1072–1076. [Google Scholar] [CrossRef] [PubMed]
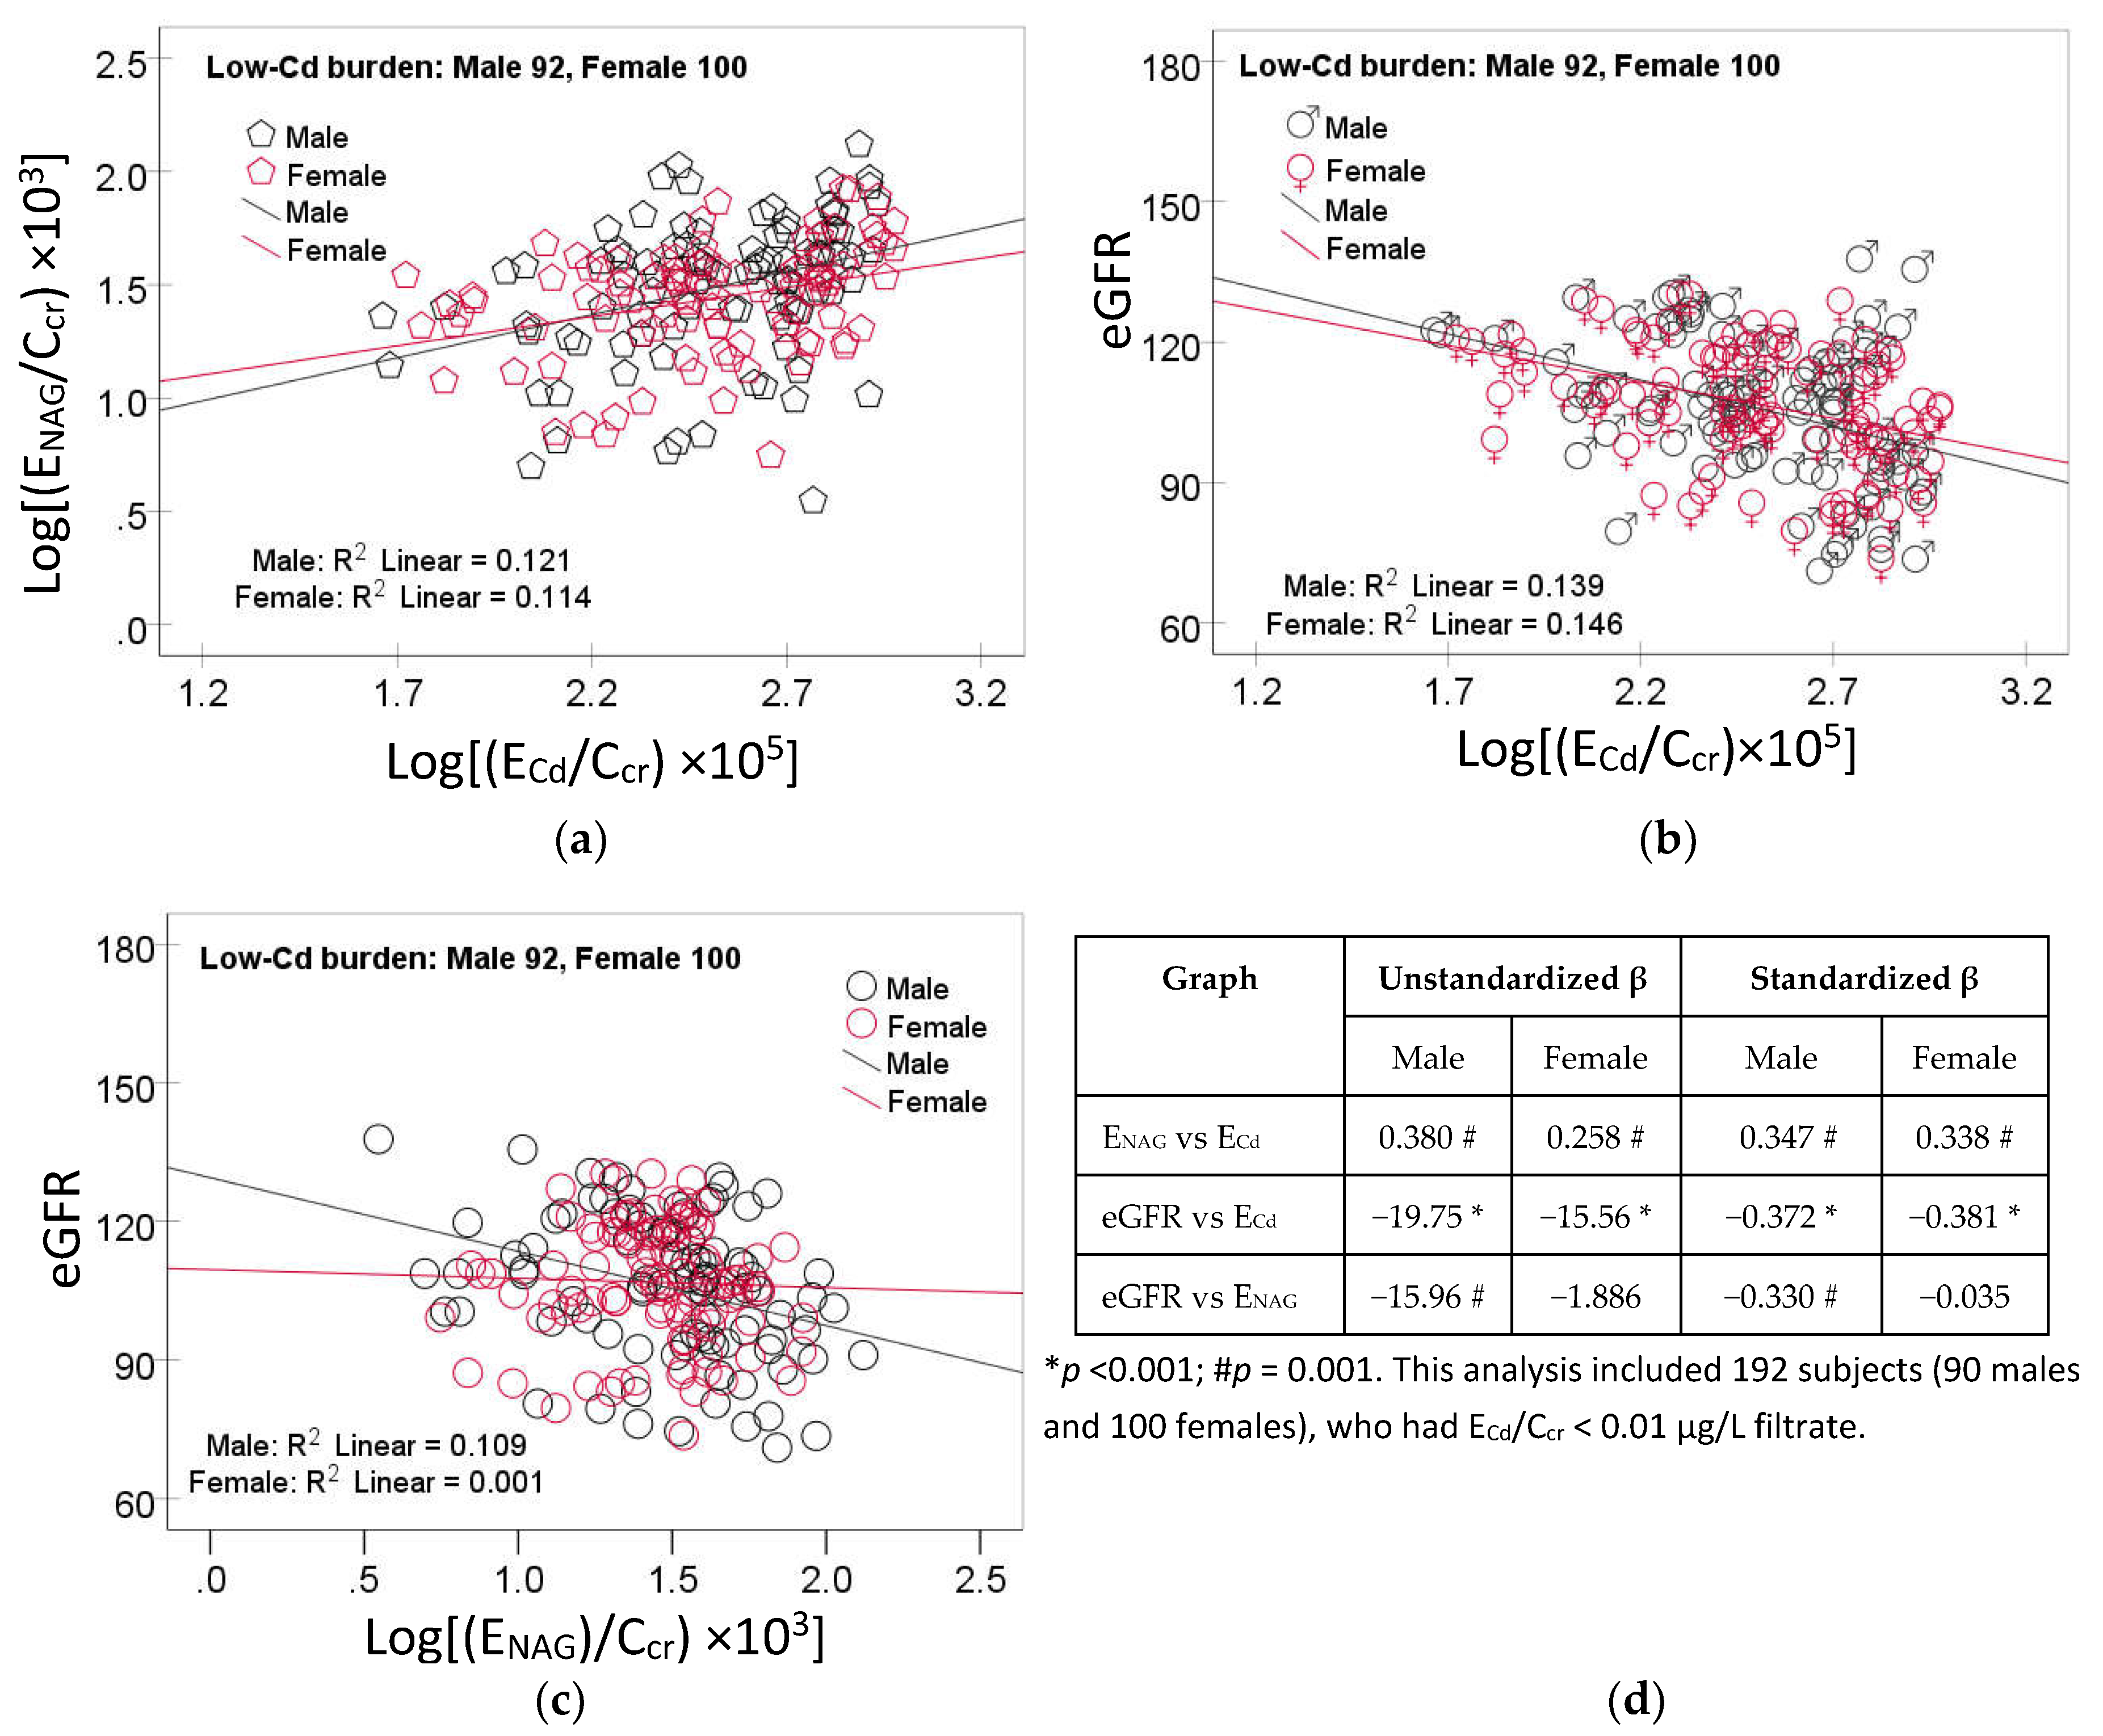
Figure 1. Linear dose-response relationships of NAG, eGFR and cadmium excretion. Scatterplots relate log[(ENAG/Ccr) × 103) to log [(ECd/Ccr) × 105] (a), eGFR to log [(ECd/Ccr) × 105] (b) and eGFR to log[(ENAG/Ccr) × 103) (c) in men and women who had ECd/Ccr <0.01 µg/L filtrate. Coefficients of determination (R2) and p-values are provided in each graph. A table (d) provides unstandardized and standardized β values and p-values.
Preprints 115316 g001
Figure 2. Analysis of tubular injury as a mediator of cadmium effect of GFR. A model depicts ENAG/Ccr as a mediator of an effect of Cd on eGFR (a) and the Sobel test (b) of unstandardized β coefficients describing relationships of ECd/Ccr with ENAG/Ccr (a), ENAG/Ccr with eGFR (b), and ECd/Ccr with eGFR (c’).
Preprints 115316 g002
Figure 3. Linear dose-response relationships of NAG, eGFR and cadmium excretion. Scatterplots relate log[(ENAG/Ccr) × 103) to log [(ECd/Ccr) × 105] (a), eGFR to log [(ECd/Ccr) × 105] (b) and eGFR to log[(ENAG/Ccr) × 103) (c) in men and women. Coefficients of determination (R2) and p-values are provided in each graph. A table (d) provides unstandardized and standardized β values and p-values.
Preprints 115316 g003aPreprints 115316 g003b
Figure 4. Analysis of tubular injury as a mediator of cadmium effect on GFR. A model depicts ENAG/Ccr as a mediator of an effect of Cd on eGFR (a) and the Sobel test (b) of unstandardized β coefficients describing relationships of ECd/Ccr and ENAG/Ccr (a), ENAG/Ccr with eGFR (b), and ECd/Ccr with eGFR (c’).
Preprints 115316 g004
Table 1. Descriptive characteristics of participants according to gender and cadmium burden levels
Parameters All, n 737 Low-Cd burden a High-Cd burden
Males, n 92 Females, n 100 Males, n 198 Females, n 347
Age, years 48.1 (11.0) 35.8 (10.2) 42.1 (9.1) *** 52.8 (11.3) 50.4 (8.2)
Age range, years 16−87 16−87 23−60 30−87 33−84
BMI, kg/m2 23.2 (3.8) 23.3 (3.4) 23.4 (3.8) 22.0 (3.3) 23.7 (4.1) ***
% Female 60.7 52.0 63.7
% Smoking 42.7 43.5 1.0 *** 81.8 32.3***
% Hypertension 32.2 27.0 15.8 30.9 39.2 *
eGFR a, mL/min/1.73 m2 91 (22) 106 (16) 107 (13) 83 (22) 87 (21) *
% eGFR ≤ 60 mL/min/1.73 m2 9.1 0 0 15.2 10.7
[cr]p, mg/dL 0.88 (0.28) 0.92 (0.12) 0.67 (0.10) *** 1.08 (0.34) 0.82 (0.23) ***
[cr]u, mg/dL 110.2 (73.8) 89.8 (80.3) 70.3 (58.3) 135.6 (65,2) 112.6 (74.5) ***
[Cd]u, µg/L 6.53 (11.71) 0.39 (0.48) 0.44 (0.57) 10.7 (18.7) 7.52 (7.82)
Normalized to Ecr (Ex/Ecr) b
ECd/Ecr, µg/g creatinine 3.72 (7.50) 0.42 (0.26) 0.50 (0.32) 6.01 (10.4) 4.21 (6.96) *
ENAG/Ecr, units/g creatinine 3.65 (3.98) 3.91 (2.45) 4.21 (2.41) 3.91 (4.43) 3.28 (4.36)
Normalized to Ccr, (Ex/Ccr) c
(ECd/Ccr) × 100, µg/L filtrate 5.67 (9.89) 0.39 (0.22) 0.40 (0.24) 9.08 (14.7) 6.64 (7.90)
(ENAG/Ccr) × 100, µg/L filtrate 7.70 (9.56) 3.85 (2.46) 3.14 (1.62) 8.59 (7.89) 9.53 (12.0)
n, number of subjects; BMI, body mass index; eGFR, estimated glomerular filtration rate; cr, creatinine; alb, albumin; Cd, cadmium. a Low and high burdens of Cd were defined as ECd/Ccr < 0.01 and ≥ 0.01 µg/L filtrate. b eGFR was determined using the CKD-EPI equations [x]. c ECd/Ecr = [Cd]u/[cr]u. c ECd/Ccr = [Cd]u[cr]p/[cr]u [26]. Data for BMI were from 712 subjects. All other data were from 737 subjects. Continuous variables are expressed as arithmetic mean and standard deviation (SD) values. For all tests, p ≤ 0.05 identifies statistical significance, determined with the Pearson Chi-Square test for differences in percentages and the Mann-Whitney U for male-female differences in mean values. *** p < 0.001, ** p = 0.001− 0.004, *p = 0.034−0.038.
Table 2. Predictors of tubular injury measured as ENAG/Ccr.
Independent Variables/
Factors
Log[(ENAG/Ccr)×103], U/L filtrate
Males,
n = 277
Females,
n = 427
Low-Cd burden a,
n = 186
High-Cd burden,
n = 538
β p β p β p β p
Age, years −0.012 0.892 −0.170 0.003 −0.094 0.419 −0.124 0.026
BMI, kg/m2 0.002 0.974 0.132 0.003 −0.008 0.924 0.087 0.063
Log2[(ECd/Ccr) × 105], µg/L filtrate 0.447 <0.001 0.394 <0.001 0.287 0.001 0.145 0.004
eGFR, mL/min/1.73 m2 −0.127 0.127 −0.178 0.002 −0.132 0.205 −0.223 <0.001
Hypertension 0.167 0.002 0.169 <0.001 0.180 0.022 0.158 <0.001
Smoking −0.037 0.496 0.111 0.016 −0.055 0.517 0.045 0.356
Gender −0.061 0.511 0.045 0.343
Adjusted R2 0.293 <0.001 0.266 <0.001 0.114 <0.001 0.090 <0.001
n, number of subjects; eGFR, estimated glomerular filtration rate; β, standardized regression coefficient; BMI, body mass index; adjusted R2, coefficient of determination. a Low and high levels of Cd burden were indicated by ECd/Ccr < 0.01 and ≥ 0.01 µg/L filtrate. β indicates strength of association of ENAG/Ccr with seven independent variables (first column). Adjusted R2 indicates the proportion of the variation of ENAG/Ccr, which was explained by all independent variables. p-values ≤ 0.05 indicate statistically significant associations of independent variables with ENAG/Ccr.
Table 3. Determinants of the prevalence odds ratios for low eGFR.
Independent
Variables/Factors
Low eGFR
β Coefficients POR 95% CI p
(SE) Lower Upper
Age, years 0.156 (0.022) 1.168 1.118 1.221 <0.001
BMI, kg/m2 0.104 (0.050) 1.109 1.006 1.222 0.037
Log2[(ECd/Ccr) × 105], µg/L filtrate 0.998 (0.164) 2.714 1.967 3.744 <0.001
Gender −0.389 (0.429) 0.678 0.292 1.572 0.365
Hypertension −0.707 (0.387) 0.493 0.231 1.052 0.068
Smoking 0.268 (0.414) 1.307 0.581 2.945 0.517
Tubular injury a
Minimal Referent
Mild −0.529 (0.754) 0.589 0.134 2.581 0.483
Moderate 0.218 (0.694) 1.244 0.320 4.843 0.753
Severe 1.570 (0.648) 4.804 1.350 17.09 0.015
POR, prevalence odds ratio; CI, confidence interval; β, regression coefficient; SE, standard error of mean; BMI, body mass index; eGFR, estimated glomerular filtration rate. a Minimal, mild, moderate, and severe tubular injury were defined according to ENAG/Ccr quartiles 1, 2, 3 and 4, respectively. Arithmetic means (SD) of (ENAG/Ccr) × 100 in the minimal, mild, moderate, and severe tubular groups were 2.19 (0.78), 4.29 (0.62), 6.90 (0.96) and 17.02 (14.96) U/L filtrate, respectively. Corresponding numbers of subjects in the Cd burden groups were 190, 171, 172, and 171. For all tests, p-values ≤ 0.05 indicate a statistical significance.
Table 4. Predictors of a reduction in eGFR and the magnitude of their effects.
Independent Variables/
Factors
eGFR, mL/min/1.73 m2
Males,
n = 277
Females,
n = 427
Low-Cd burden a,
n = 186
High-Cd burden,
n = 538
η2 p η2 p η2 p η2 p
Age, years 0.340 <0.001 0.249 <0.001 0.380 <0.001 0.300 <0.001
BMI, kg/m2 0.001 0.637 0.004 0.228 0.002 0.632 0.010 0.024
Log2[(ECd/Ccr) × 105], µg/L filtrate 0.081 <0.001 0.114 <0.001 0.000335 0.828 0.150 <0.001
Smoking 0.002 0.434 0.000171 0.792 0.000407 0.811 0.000248 0.724
Hypertension 0.016 0.044 0.002 0.420 0.000012 0.968 0.004 0.167
ENAG/Ccr quartiles 0.015 0.275 0.034 0.003 0.018 0.460 0.013 0.085
Gender 0.051 0.007 0.003 0.256
Smoking × Hypertension 0.022 0.003 0.013 0.176 0.004 0.147
Smoking × Hypertension × ENAG/Ccr quartile 0.059 0.014
Adjusted R2 0.633 <0.001 0.440 <0.001 0.494 <0.001 0.493 <0.001
n, number of subjects; eGFR, estimated glomerular filtration rate; η2, eta squared; BMI, body mass index; adjusted R2, coefficient of determination. a Low and high burdens of Cd were indicated by ECd/Ccr < 0.01 and ≥ 0.01 µg/L filtrate. η2 indicates a proportion of eGFR variability explained by each independent variable (first column). Adjusted R2 indicates the proportion of the variation of ENAG/Ccr, which was explained by all independent variables. p-values ≤ 0.05 indicate statistically significant.
Disclaimer/Publisher’s Note: The statements, opinions and data contained in all publications are solely those of the individual author(s) and contributor(s) and not of MDPI and/or the editor(s). MDPI and/or the editor(s) disclaim responsibility for any injury to people or property resulting from any ideas, methods, instructions or products referred to in the content.
Copyright: This open access article is published under a Creative Commons CC BY 4.0 license, which permit the free download, distribution, and reuse, provided that the author and preprint are cited in any reuse.
Prerpints.org logo

Preprints.org is a free preprint server supported by MDPI in Basel, Switzerland.

Subscribe

© 2024 MDPI (Basel, Switzerland) unless otherwise stated