Submitted:
15 August 2024
Posted:
16 August 2024
You are already at the latest version
Abstract
Keywords:
1. Introduction
2. Results
2.1. Survival and Weight Trend Analysis
2.2. Behavior
2.3. Gene Expression Analysis of Glial Protein Genes at the mRNA and Protein Level
3. Discussion
4. Materials and Methods
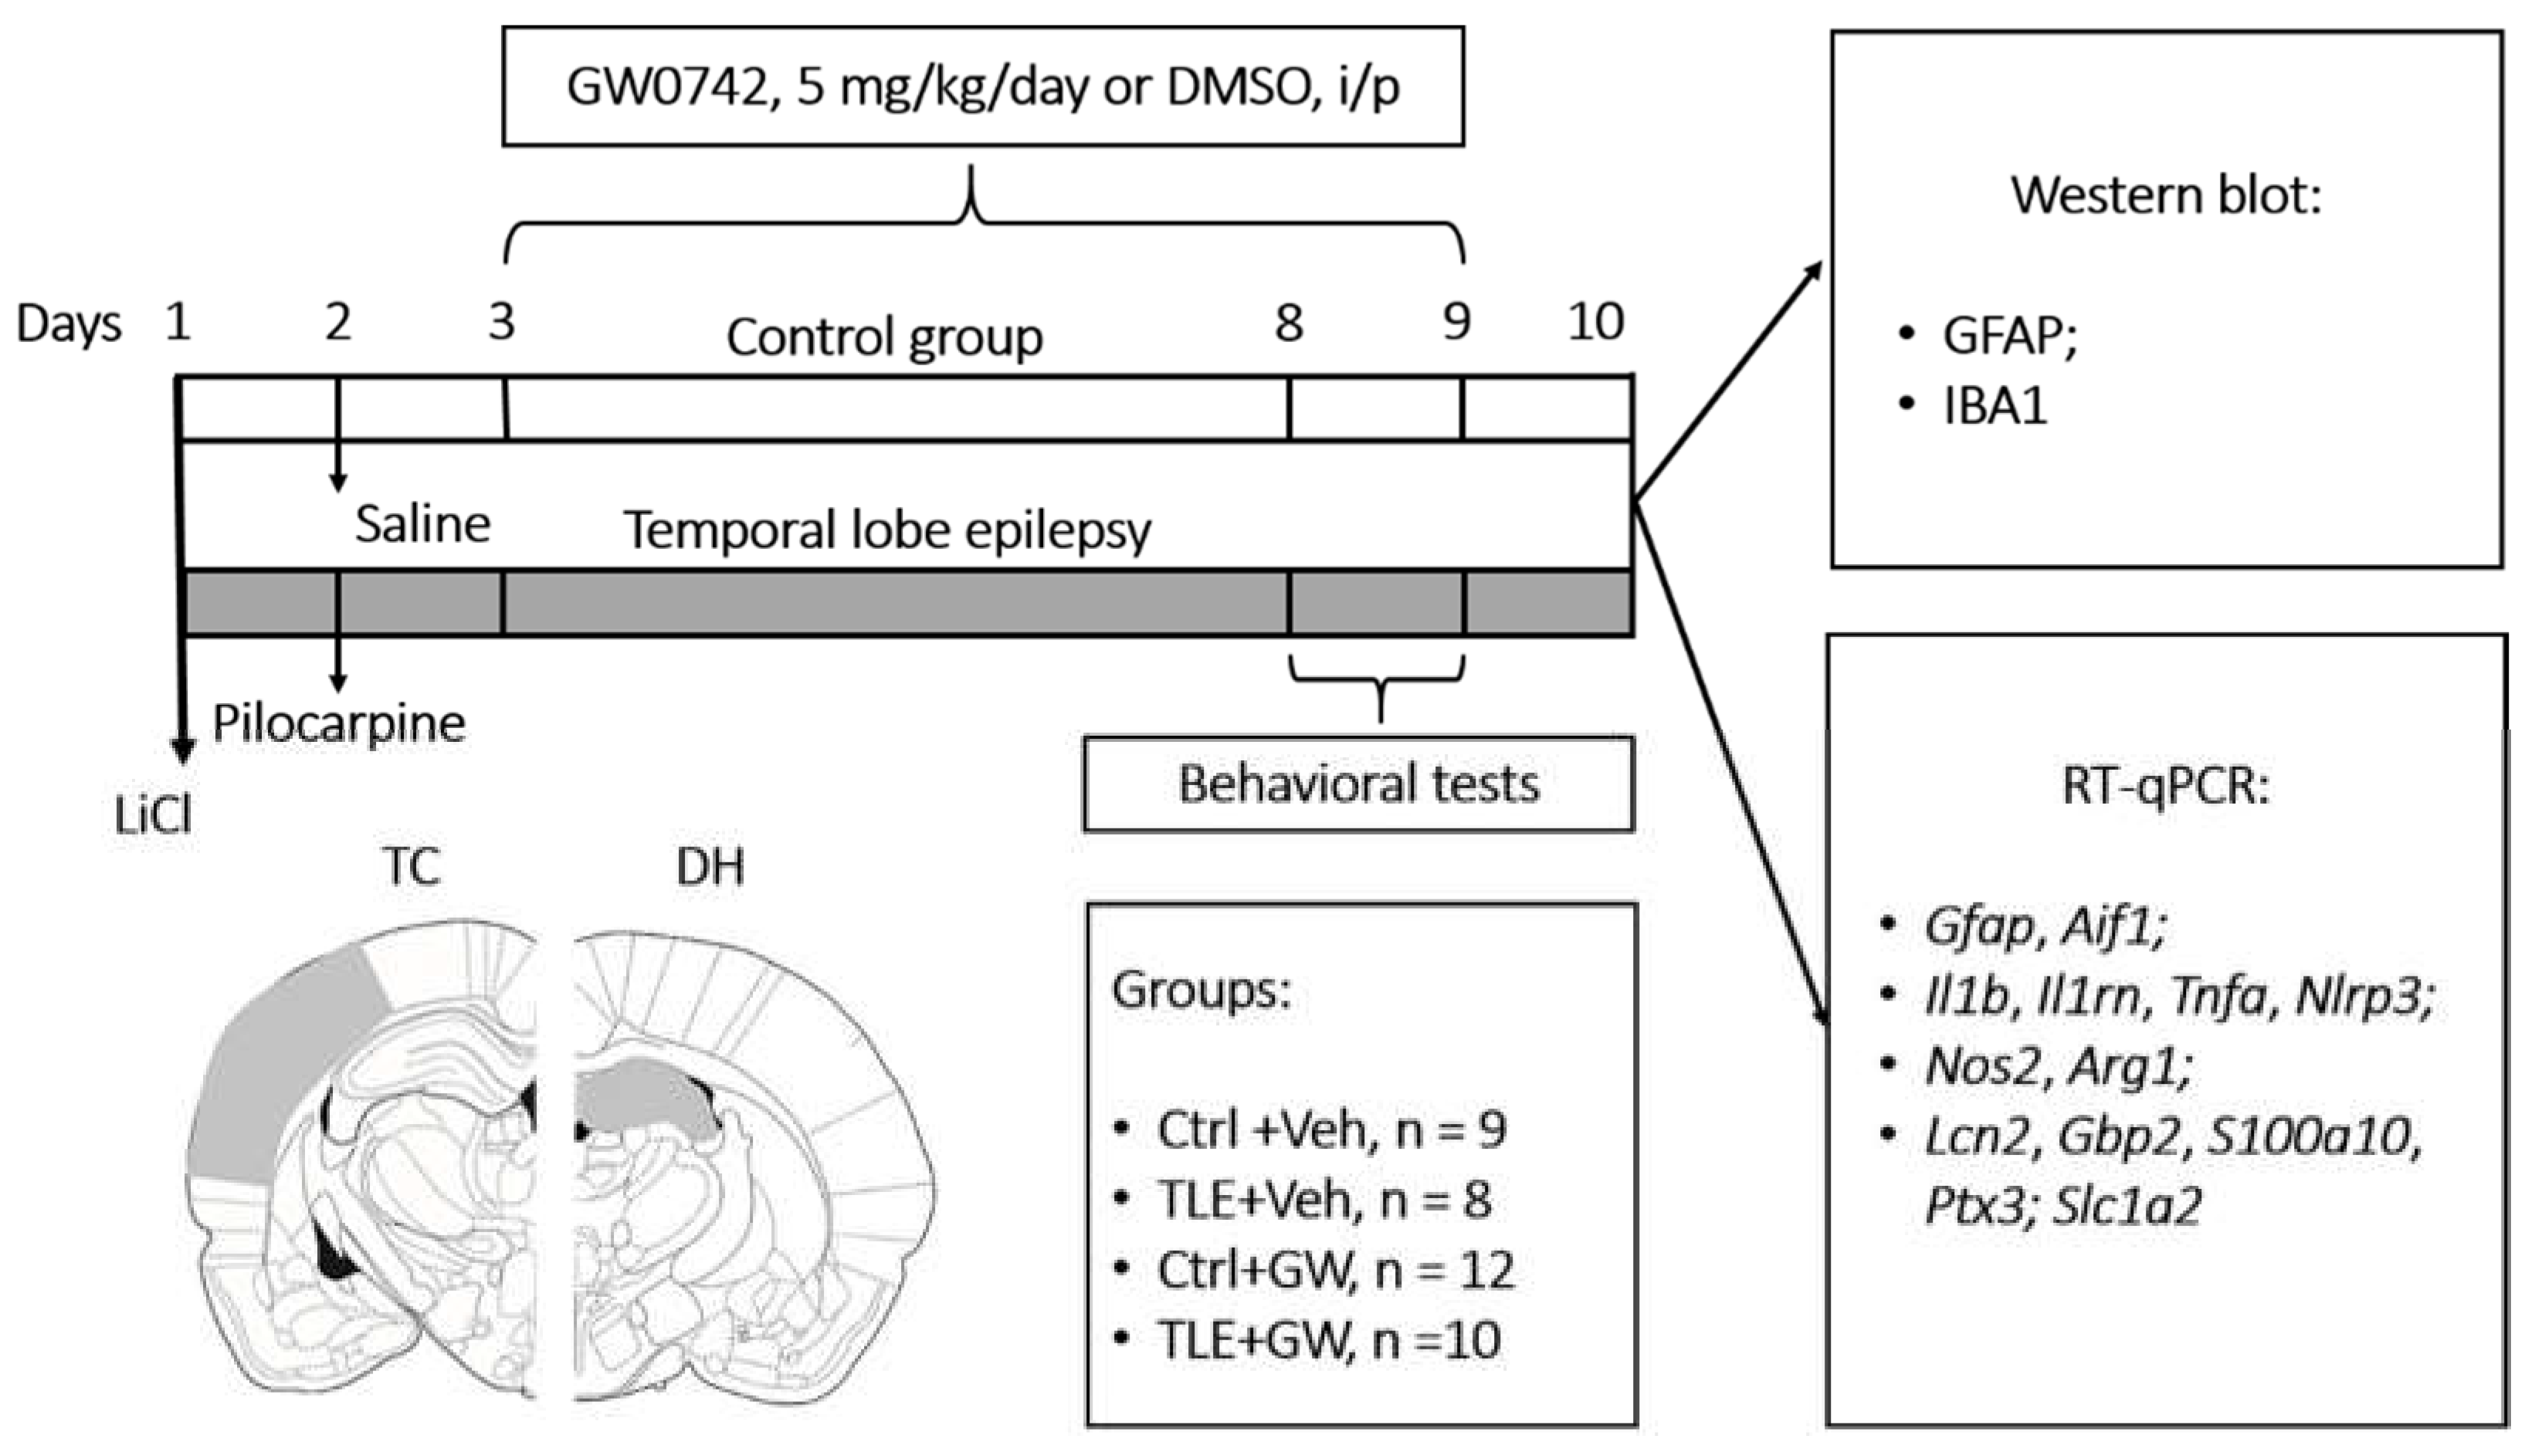
4.1. Experimental Design
4.2. Behavioral Tests
4.3. Real-Time RT-PCR
4.4. Western Blot Analysis
4.5. Statistical Analysis
Author Contributions
Funding
Institutional Review Board Statement
Informed Consent Statement
Data Availability Statement
Acknowledgments
Conflicts of Interest
Appendix A
| Gene Symbol RefSeq Accession Number |
Nucleotide Sequences (Forward, Reverse, TaqMan Probe) |
Final Primers and Probe Concentration (nM) | Reference |
|---|---|---|---|
|
Actb (actin beta) NM_031144 |
TGTCACCAACTGGGACGATA GGGGTGTTGAAGGTCTCAAA FAM-CGTGTGGCCCCTGAGGAGCAC-BHQ1 |
200 200 |
[98] (primers) [99] (probe) |
|
Gapdh (glyceraldehyde-3-phosphate dehydrogenase) NM_017008 |
TGCACCACCAACTGCTTAG GGATGCAGGGATGATGTTC R6G-ATCACGCCACAGCTTTCCAGAGGG-BHQ2 |
200 100 |
[100] |
|
B2m (beta-2-microglobulin) NM_012512 |
TGCCATTCAGAAAACTCCCC GAGGAAGTTGGGCTTCCCATT ROX-ATTCAAGTGTACTCTCGCCATCCACCG-BHQ1 |
200 100 |
[101] |
|
Rpl13a (ribosomal protein L13a) NM_173340 |
GGATCCCTCCACCCTATGACA CTGGTACTTCCACCCGACCTC FAM-CTGCCCTCAAGGTTGTGCGGCT-BHQ1 |
200 100 |
[102] (primers) [99] (probe) |
|
Sdha (succinate dehydrogenase complex flavoprotein subunit A) NM_130428 |
AGACGTTTGACAGGGGAATG TCATCAATCCGCACCTTGTA R6G-ACCTGGTGGAGACGCTGGAGCT-BHQ2 |
200 100 |
[103] (primers) [99] (probe) |
|
Ppia (peptidylprolyl isomerase A) NM_017101 |
AGGATTCATGTGCCAGGGTG CTCAGTCTTGGCAGTGCAGA ROX-CACGCCATAATGGCACTGGTGGCA-BHQ1 |
200 100 |
[104] |
|
Hprt1 (hypoxanthine phosphoribosyltransferase 1) NM_012583 |
TCCTCAGACCGCTTTTCCCGC TCATCATCACTAATCACGACGCTGG FAM-CCGACCGGTTCTGTCATGTCGACCCT-BHQ1 |
200 100 |
[105] (primers) [99] (probe) |
|
Pgk1 (phosphoglycerate kinase 1) NM_053291 |
ATGCAAAGACTGGCCAAGCTAC AGCCACAGCCTCAGCATATTTC R6G-TGCTGGCTGGATGGGCTTGGA-BHQ2 |
200 100 |
[106] (primers) [99] (probe) |
|
Ywhaz (tyrosine 3-monooxygenase/tryptophan 5-monooxygenase activation protein zet) NM_013011 |
GATGAAGCCATTGCTGAACTTG GTCTCCTTGGGTATCCGATGTC ROX-TGAAGAGTCGTACAAAGACAGCACGC-BHQ1 |
200 100 |
[106] (primers) [99] (probe) |
|
Il1b (interleukin 1 beta) NM_031512 |
CACCTCTCAAGCAGAGCACAG GGGTTCCATGGTGAAGTCAAC FAM-TGTCCCGACCATTGCTGTTTCCTAG-BHQ1 |
400 200 |
[107] |
|
Tnfa (tumor necrosis factor) NM_012675 |
CCAGGTTCTCTTCAAGGGACAA CTCCTGGTATGAAATGGCAAATC ROX-CCCGACTATGTGCTCCTCACCCACA-BHQ2 |
200 200 |
[107] |
|
Aif1 (allograft inflammatory factor 1) NM_017196.3 |
CAACACACTGCAGCCTCATC AAGCTTTTCCTCCCTGCAAA Cy5-CCCCACCTAAGGCCACCAGCGTCTGA-BHQ3 |
200 100 |
[39] |
|
Gfap (glial fibrillary acidic protein) NM_017009.2 |
TGGCCACCAGTAACATGCAA CAGTTGGCGGCGATAGTCAT HEX-CGGTCCAAGTTTGCAGACCTCACAG-BHQ2 |
200 200 |
[108] (primers) [6] (probe) |
|
Slc1a2 (solute carrier family 1 member 2) NM_017215.2 |
CCAGTGCTGGAACTTTGCCT TAAAGGGCTGTACCATCCAT FAM-AGCGTGTGACCAGATTCGTCCTCCCA-BHQ1 |
200 150 |
[109] (primers) [6] (probe) |
|
Il1rn (interleukin 1 receptor antagonist) NM_022194.2 |
GGGGACCTTACAGTCACCTAAT GGTTAGTATCCCAGATTCTGAAGG ROX-AGTCAGCTGGCCACCCTGCTGGGA-BHQ2 |
400 100 |
[39] |
|
Nlrp3 (NLR family pyrin domain containing 3) NM_001191642 |
CAGACCCTCATGTTGCCTGT AGACCTCGGCAGAAGCTAGA FAM-CCAGACTGGTGAACTGCTGCCTCA-BHQ1 |
200 100 |
[46] |
|
Lcn2 (lipocalin 2) NM_130741.1 |
AGCTACGATGTGCAAGTGGC CCCCTTGGTTCTTCCGTACA FAM-CGACACTGACTACGACCAGTTTGCCA-BHQ1 |
200 150 |
[46] |
|
Arg1 (arginase 1) NM_017134.3 |
AGCTGGGAATTGGCAAAGTG AACTCAGGTGAATGGGCCTT HEX-TGGAAGAGACCTTCAGCTACCTGC-BHQ2 |
300 100 |
[110] (primers) [46] (probe) |
|
S100a10 (S100 calcium binding protein A10) NM_031114.1 |
CATTTCACAGGTTTGCAGGGG GCACTGGTCCAGGTCTTTCA Cy5-AGGACCCTCTGGCTGTGGACA-BHQ3 |
200 250 |
[46] |
|
Ptx3 (pentraxin 3) NM_001109536.2 |
AAACTTCGCCTCTCCAGCAA CATGGTGTGGGGTCCTCG HEX-TGCTCTCTGGTCTGCAGTGTTGGC-BHQ2 |
400 200 |
[46] |
|
Gbp2 (guanylate binding protein 2) NM_133624.2 |
AGTCAATGGGCCACGTCTAA AGTGGGTGATGGCCTTTTGT HEX-AGCAGTGGGTCTCTCCCCTGCA-BHQ2 |
200 100 |
[46] |
|
Nos2 (nitric oxide synthase 2) NM_012611.3 |
CAGAAGCAGAATGTGACCATCAT CGGAGGGACCAGCCAAATC ROX-CCACCACACAGCCTCAGAGTCCTT-BHQ2 |
200 200 |
[111] |
References
- Löscher, W.; Klitgaard, H.; Twyman, R.E.; Schmidt, D. New avenues for anti-epileptic drug discovery and development. Nat. Rev. Drug Discov. 2013, 12, 757–776. [Google Scholar] [CrossRef]
- Sanz, P.; Rubio, T.; Garcia-Gimeno, M.A. Neuroinflammation and Epilepsy: From Pathophysiology to Therapies Based on Repurposing Drugs. Int. J. Mol. Sci. 2024, Vol. 25, Page 4161 2024, 25, 4161. [Google Scholar] [CrossRef]
- Devinsky, O.; Vezzani, A.; Najjar, S.; De Lanerolle, N.C.; Rogawski, M.A. Glia and epilepsy: excitability and inflammation. Trends Neurosci. 2013, 36, 174–184. [Google Scholar] [CrossRef]
- Riazi, K.; Galic, M.A.; Kuzmiski, J.B.; Ho, W.; Sharkey, K.A.; Pittman, Q.J. Microglial activation and TNFα production mediate altered CNS excitability following peripheral inflammation. Proc. Natl. Acad. Sci. 2008, 105, 17151–17156. [Google Scholar] [CrossRef] [PubMed]
- Rodgers, K.M.; Hutchinson, M.R.; Northcutt, A.; Maier, S.F.; Watkins, L.R.; Barth, D.S. The cortical innate immune response increases local neuronal excitability leading to seizures. Brain 2009, 132, 2478–2486. [Google Scholar] [CrossRef]
- Dyomina, A. V.; Zubareva, O.E.; Smolensky, I. V.; Vasilev, D.S.; Zakharova, M. V.; Kovalenko, A.A.; Schwarz, A.P.; Ischenko, A.M.; Zaitsev, A. V. Anakinra Reduces Epileptogenesis, Provides Neuroprotection, and Attenuates Behavioral Impairments in Rats in the Lithium–Pilocarpine Model of Epilepsy. Pharmaceuticals 2020, 13, 340. [Google Scholar] [CrossRef] [PubMed]
- Lee, S.-H.; Han, S.-H.; Lee, K.-W. Kainic acid-induced seizures cause neuronal death in infant rats pretreated with lipopolysaccharide. Neuroreport 2000, 11, 507–510. [Google Scholar] [CrossRef] [PubMed]
- Suleymanova, E.M. Behavioral comorbidities of epilepsy and neuroinflammation: Evidence from experimental and clinical studies. Epilepsy Behav. 2021, 117, 107869. [Google Scholar] [CrossRef]
- Li, D.; Wang, Y.; Guo, Y.; Wang, W. Bioinformatics analysis reveals multiple functional changes in astrocytes in temporal lobe epilepsy. Brain Res. 2024, 1831. [Google Scholar] [CrossRef]
- Guo, S.; Wang, H.; Yin, Y. Microglia Polarization From M1 to M2 in Neurodegenerative Diseases. Front. Aging Neurosci. 2022, 14, 815347. [Google Scholar] [CrossRef]
- Fan, Y.-Y.; Huo, J. A1/A2 astrocytes in central nervous system injuries and diseases: Angels or devils? Neurochem. Int. 2021, 148, 105080. [Google Scholar] [CrossRef] [PubMed]
- Paolicelli, R.C.; Sierra, A.; Stevens, B.; Tremblay, M.-E.; Aguzzi, A.; Ajami, B.; Amit, I.; Audinat, E.; Bechmann, I.; Bennett, M.; et al. Microglia states and nomenclature: A field at its crossroads. Neuron 2022, 110, 3458–3483. [Google Scholar] [CrossRef] [PubMed]
- Li, P.; Ji, X.; Shan, M.; Wang, Y.; Dai, X.; Yin, M.; Liu, Y.; Guan, L.; Ye, L.; Cheng, H. Melatonin regulates microglial polarization to M2 cell via RhoA/ROCK signaling pathway in epilepsy. Immunity, Inflamm. Dis. 2023, 11. [Google Scholar] [CrossRef]
- Zhao, Q.; Wu, X.; Yan, S.; Xie, X.; Fan, Y.; Zhang, J.; Peng, C.; You, Z. The antidepressant-like effects of pioglitazone in a chronic mild stress mouse model are associated with PPARγ-mediated alteration of microglial activation phenotypes. J. Neuroinflammation 2016, 13, 259. [Google Scholar] [CrossRef]
- Yonutas, H.M.; Sullivan, P.G. Targeting PPAR isoforms following CNS injury. Curr. Drug Targets 2013, 14, 733–742. [Google Scholar] [CrossRef]
- Grygiel-Górniak, B. Peroxisome proliferator-activated receptors and their ligands: nutritional and clinical implications--a review. Nutr. J. 2014, 13. [Google Scholar] [CrossRef]
- Li, J.; Guo, C.; Wu, J. 15-Deoxy-∆-12,14-Prostaglandin J2 (15d-PGJ2), an Endogenous Ligand of PPAR- γ: Function and Mechanism. PPAR Res. 2019, 2019. [Google Scholar] [CrossRef]
- Narala, V.R.; Adapala, R.K.; Suresh, M. V.; Brock, T.G.; Peters-Golden, M.; Reddy, R.C. Leukotriene B4 is a physiologically relevant endogenous peroxisome proliferator-activated receptor-alpha agonist. J. Biol. Chem. 2010, 285, 22067–22074. [Google Scholar] [CrossRef] [PubMed]
- Giordano Attianese, G.M.P.; Desvergne, B. Integrative and systemic approaches for evaluating PPARβ/δ (PPARD) function. Nucl. Recept. Signal. 2015, 13, e001. [Google Scholar] [CrossRef]
- Tufano, M.; Pinna, G. Is There a Future for PPARs in the Treatment of Neuropsychiatric Disorders? Molecules 2020, 25. [Google Scholar] [CrossRef]
- Warden, A.; Truitt, J.; Merriman, M.; Ponomareva, O.; Jameson, K.; Ferguson, L.B.; Mayfield, R.D.; Harris, R.A. Localization of PPAR isotypes in the adult mouse and human brain. Sci. Rep. 2016, 6. [Google Scholar] [CrossRef] [PubMed]
- Strosznajder, A.K.; Wójtowicz, S.; Jeżyna, M.J.; Sun, G.Y.; Strosznajder, J.B. Recent Insights on the Role of PPAR-β/δ in Neuroinflammation and Neurodegeneration, and Its Potential Target for Therapy. Neuromolecular Med. 2021, 23, 86–98. [Google Scholar] [CrossRef] [PubMed]
- Genolet, R.; Wahli, W.; Michalik, L. PPARs as drug targets to modulate inflammatory responses? Curr. Drug Targets. Inflamm. Allergy 2004, 3, 361–375. [Google Scholar] [CrossRef] [PubMed]
- Senn, L.; Costa, A.-M.; Avallone, R.; Socała, K.; Wlaź, P.; Biagini, G. Is the peroxisome proliferator-activated receptor gamma a putative target for epilepsy treatment? Current evidence and future perspectives. Pharmacol. Ther. 2023, 241, 108316. [Google Scholar] [CrossRef] [PubMed]
- Pérez-Segura, I.; Santiago-Balmaseda, A.; Rodríguez-Hernández, L.D.; Morales-Martínez, A.; Martínez-Becerril, H.A.; Martínez-Gómez, P.A.; Delgado-Minjares, K.M.; Salinas-Lara, C.; Martínez-Dávila, I.A.; Guerra-Crespo, M.; et al. PPARs and Their Neuroprotective Effects in Parkinson’s Disease: A Novel Therapeutic Approach in α-Synucleinopathy? Int. J. Mol. Sci. 2023, 24, 3264. [Google Scholar] [CrossRef] [PubMed]
- Yu, X.; Shao, X.G.; Sun, H.; Li, Y.N.; Yang, J.; Deng, Y.C.; Huang, Y.G. Activation of cerebral peroxisome proliferator-activated receptors gamma exerts neuroprotection by inhibiting oxidative stress following pilocarpine-induced status epilepticus. Brain Res. 2008, 1200, 146–158. [Google Scholar] [CrossRef] [PubMed]
- Adabi Mohazab, R.; Javadi-Paydar, M.; Delfan, B.; Dehpour, A.R. Possible involvement of PPAR-gamma receptor and nitric oxide pathway in the anticonvulsant effect of acute pioglitazone on pentylenetetrazole-induced seizures in mice. Epilepsy Res. 2012, 101, 28–35. [Google Scholar] [CrossRef] [PubMed]
- Peng, J.; Wang, K.; Xiang, W.; Li, Y.; Hao, Y.; Guan, Y. Rosiglitazone polarizes microglia and protects against pilocarpine-induced status epilepticus. CNS Neurosci. Ther. 2019, 25, 1363–1372. [Google Scholar] [CrossRef] [PubMed]
- Peng, Y.; Chen, L.; Qu, Y.; Wang, D.; Zhu, Y.; Zhu, Y. Rosiglitazone Prevents Autophagy by Regulating Nrf2-Antioxidant Response Element in a Rat Model of Lithium-pilocarpine-induced Status Epilepticus. Neuroscience 2021, 455, 212–222. [Google Scholar] [CrossRef]
- Puligheddu, M.; Pillolla, G.; Melis, M.; Lecca, S.; Marrosu, F.; De Montis, M.G.; Scheggi, S.; Carta, G.; Murru, E.; Aroni, S.; et al. PPAR-Alpha Agonists as Novel Antiepileptic Drugs: Preclinical Findings. PLoS One 2013, 8, e64541. [Google Scholar] [CrossRef]
- Sznaidman, M.L.; Haffner, C.D.; Maloney, P.R.; Fivush, A.; Chao, E.; Goreham, D.; Sierra, M.L.; LeGrumelec, C.; Xu, H.E.; Montana, V.G.; et al. Novel selective small molecule agonists for peroxisome proliferator-activated receptor delta (PPARdelta)--synthesis and biological activity. Bioorg. Med. Chem. Lett. 2003, 13, 1517–1521. [Google Scholar] [CrossRef] [PubMed]
- Nandhikonda, P.; Yasgar, A.; Baranowski, A.M.; Sidhu, P.S.; McCallum, M.M.; Pawlak, A.J.; Teske, K.; Feleke, B.; Yuan, N.Y.; Kevin, C.; et al. Peroxisome proliferation-activated receptor δ agonist GW0742 interacts weakly with multiple nuclear receptors, including the vitamin D receptor. Biochemistry 2013, 52, 4193–4203. [Google Scholar] [CrossRef] [PubMed]
- Niu, H.-S.; Ku, P.-M.; Niu, C.-S.; Cheng, J.-T.; Lee, K.-S. Development of PPAR-agonist GW0742 as antidiabetic drug: study in animals. Drug Des. Devel. Ther. 2015, 9, 5625–5632. [Google Scholar] [CrossRef] [PubMed]
- Di Paola, R.; Esposito, E.; Mazzon, E.; Paterniti, I.; Galuppo, M.; Cuzzocrea, S. GW0742, a selective PPAR-beta/delta agonist, contributes to the resolution of inflammation after gut ischemia/reperfusion injury. J. Leukoc. Biol. 2010, 88, 291–301. [Google Scholar] [CrossRef] [PubMed]
- Haskova, Z.; Hoang, B.; Luo, G.; Morgan, L.A.; Billin, A.N.; Barone, F.C.; Shearer, B.G.; Barton, M.E.; Kilgore, K.S. Modulation of LPS-induced pulmonary neutrophil infiltration and cytokine production by the selective PPARbeta/delta ligand GW0742. Inflamm. Res. Off. J. Eur. Histamine Res. Soc.... [et al.] 2008, 57, 314–321. [Google Scholar] [CrossRef]
- Tang, X.; Yan, K.; Wang, Y.; Wang, Y.; Chen, H.; Xu, J.; Lu, Y.; Wang, X.; Liang, J.; Zhang, X. Activation of PPAR-β/δ Attenuates Brain Injury by Suppressing Inflammation and Apoptosis in a Collagenase-Induced Intracerebral Hemorrhage Mouse Model. Neurochem. Res. 2020, 45, 837–850. [Google Scholar] [CrossRef]
- Das, N.R.; Gangwal, R.P.; Damre, M. V; Sangamwar, A.T.; Sharma, S.S. A PPAR-β/δ agonist is neuroprotective and decreases cognitive impairment in a rodent model of Parkinson’s disease. Curr. Neurovasc. Res. 2014, 11, 114–124. [Google Scholar] [CrossRef] [PubMed]
- An, Y.-Q.; Zhang, C.T.; Du, Y.; Zhang, M.; Tang, S.S.; Hu, M.; Long, Y.; Sun, H.B.; Hong, H. PPARδ agonist GW0742 ameliorates Aβ1-42-induced hippocampal neurotoxicity in mice. Metab. Brain Dis. 2016, 31, 663–671. [Google Scholar] [CrossRef] [PubMed]
- Zubareva, O.E.; Dyomina, A. V; Kovalenko, A.A.; Roginskaya, A.I.; Melik-Kasumov, T.B.; Korneeva, M.A.; Chuprina, A. V; Zhabinskaya, A.A.; Kolyhan, S.A.; Zakharova, M. V; et al. Beneficial Effects of Probiotic Bifidobacterium longum in a Lithium-Pilocarpine Model of Temporal Lobe Epilepsy in Rats. Int. J. Mol. Sci. 2023, 24. [Google Scholar] [CrossRef]
- Kelley, N.; Jeltema, D.; Duan, Y.; He, Y. The NLRP3 Inflammasome: An Overview of Mechanisms of Activation and Regulation. Int. J. Mol. Sci. 2019, 20. [Google Scholar] [CrossRef]
- Xiao, L.; Zheng, H.; Li, J.; Wang, Q.; Sun, H. Neuroinflammation Mediated by NLRP3 Inflammasome After Intracerebral Hemorrhage and Potential Therapeutic Targets. Mol. Neurobiol. 2020, 57, 5130–5149. [Google Scholar] [CrossRef]
- Rath, M.; Müller, I.; Kropf, P.; Closs, E.I.; Munder, M. Metabolism via Arginase or Nitric Oxide Synthase: Two Competing Arginine Pathways in Macrophages. Front. Immunol. 2014, 5, 120091. [Google Scholar] [CrossRef]
- Kim, J.H.; Ko, P.W.; Lee, H.W.; Jeong, J.Y.; Lee, M.G.; Kim, J.H.; Lee, W.H.; Yu, R.; Oh, W.J.; Suk, K. Astrocyte-derived lipocalin-2 mediates hippocampal damage and cognitive deficits in experimental models of vascular dementia. Glia 2017, 65, 1471–1490. [Google Scholar] [CrossRef]
- Bi, F.; Huang, C.; Tong, J.; Qiu, G.; Huang, B.; Wu, Q.; Li, F.; Xu, Z.; Bowser, R.; Xia, X.-G.; et al. Reactive astrocytes secrete lcn2 to promote neuron death. Proc. Natl. Acad. Sci. 2013, 110, 4069–4074. [Google Scholar] [CrossRef] [PubMed]
- El Baassiri, M.G.; Rahal, S.S.; Fulton, W.B.; Sodhi, C.P.; Hackam, D.J.; Nasr, I.W. Pharmacologic Toll-like receptor 4 inhibition skews toward a favorable A1/A2 astrocytic ratio improving neurocognitive outcomes following traumatic brain injury. J. Trauma Acute Care Surg. 2023, 95, 361–367. [Google Scholar] [CrossRef] [PubMed]
- Zakharova, M. V; Dyomina, A. V; Kovalenko, A.A.; Zubareva, O.E.; Ischenko, A.M.; Zaitsev, A. V Anakinra Promotes M2 Microglia Activation during the Latent Phase of the Lithium-Pilocarpine Model of Temporal Lobe Epilepsy. J. Evol. Biochem. Physiol. 2024, 60, 672–689. [Google Scholar] [CrossRef]
- Ding, Z.-B.; Song, L.-J.; Wang, Q.; Kumar, G.; Yan, Y.-Q.; Ma, C.-G. Astrocytes: a double-edged sword in neurodegenerative diseases. Neural Regen. Res. 2021, 16, 1702. [Google Scholar] [CrossRef]
- Zaitsev, A. V.; Smolensky, I. V.; Jorratt, P.; Ovsepian, S. V. Neurobiology, Functions, and Relevance of Excitatory Amino Acid Transporters (EAATs) to Treatment of Refractory Epilepsy. CNS Drugs 2020, 34, 1089–1103. [Google Scholar] [CrossRef] [PubMed]
- Zubareva, O.E.; Kovalenko, A.A.; Kalemenev, S. V.; Schwarz, A.P.; Karyakin, V.B.; Zaitsev, A. V. Alterations in mRNA expression of glutamate receptor subunits and excitatory amino acid transporters following pilocarpine-induced seizures in rats. Neurosci. Lett. 2018, 686, 94–100. [Google Scholar] [CrossRef]
- Soltani Khaboushan, A.; Yazdanpanah, N.; Rezaei, N. Neuroinflammation and Proinflammatory Cytokines in Epileptogenesis. Mol. Neurobiol. 2022, 59, 1724–1743. [Google Scholar] [CrossRef]
- Aleshin, S.; Reiser, G. Role of the peroxisome proliferator-activated receptors (PPAR)-α, β/δ and γ triad in regulation of reactive oxygen species signaling in brain. Biol. Chem. 2013, 394, 1553–1570. [Google Scholar] [CrossRef] [PubMed]
- Jimenez, R.; Toral, M.; Gómez-Guzmán, M.; Romero, M.; Sanchez, M.; Mahmoud, A.M.; Duarte, J. The Role of Nrf2 Signaling in PPARβ/δ-Mediated Vascular Protection against Hyperglycemia-Induced Oxidative Stress. Oxid. Med. Cell. Longev. 2018, 2018, 5852706. [Google Scholar] [CrossRef] [PubMed]
- Magadum, A.; Engel, F.B. PPARβ/δ: Linking Metabolism to Regeneration. Int. J. Mol. Sci. 2018, 19. [Google Scholar] [CrossRef]
- Chen, Z.-P.; Wang, S.; Zhao, X.; Fang, W.; Wang, Z.; Ye, H.; Wang, M.-J.; Ke, L.; Huang, T.; Lv, P.; et al. Lipid-accumulated reactive astrocytes promote disease progression in epilepsy. Nat. Neurosci. 2023, 26, 542–554. [Google Scholar] [CrossRef]
- Boison, D.; Steinhäuser, C. Epilepsy and astrocyte energy metabolism. Glia 2018, 66, 1235–1243. [Google Scholar] [CrossRef] [PubMed]
- Geronzi, U.; Lotti, F.; Grosso, S. Oxidative stress in epilepsy. Expert Rev. Neurother. 2018, 18, 427–434. [Google Scholar] [CrossRef]
- Subkhankulov, M.R.; Sinyak, D.S.; Guk, V.A.; Postnikova, T.Y.; Roginskaya, A.I.; Zubareva, O.E. Cardarin Effect on the Formation of Histopathological and Behavioral Abnormalities in the Lithium-Pilocarpine Model of Temporal Lobe Epilepsy in Rats. J. Evol. Biochem. Physiol. 2024 601 2024, 60, 316–331. [Google Scholar] [CrossRef]
- Dyomina, A. V; Smolensky, I. V; Zaitsev, A. V Refinement of the Barnes and Morris water maze protocols improves characterization of spatial cognitive deficits in the lithium-pilocarpine rat model of epilepsy. Epilepsy Behav. 2023, 147, 109391. [Google Scholar] [CrossRef]
- Smolensky, I. V; Zubareva, O.E.; Kalemenev, S. V; Lavrentyeva, V. V; Dyomina, A. V; Karepanov, A.A.; Zaitsev, A. V Impairments in cognitive functions and emotional and social behaviors in a rat lithium-pilocarpine model of temporal lobe epilepsy. Behav. Brain Res. 2019, 372, 112044. [Google Scholar] [CrossRef]
- Suleymanova, E.M.; Gulyaev, M. V.; Abbasova, K.R. Structural alterations in the rat brain and behavioral impairment after status epilepticus: An MRI study. Neuroscience 2016, 315, 79–90. [Google Scholar] [CrossRef]
- Wulsin, A.C.; Franco-Villanueva, A.; Romancheck, C.; Morano, R.L.; Smith, B.L.; Packard, B.A.; Danzer, S.C.; Herman, J.P. Functional disruption of stress modulatory circuits in a model of temporal lobe epilepsy. PLoS One 2018, 13. [Google Scholar] [CrossRef]
- Rojas, J.J.; Deniz, B.F.; Miguel, P.M.; Diaz, R.; Hermel, É. do E.S.; Achaval, M.; Netto, C.A.; Pereira, L.O. Effects of daily environmental enrichment on behavior and dendritic spine density in hippocampus following neonatal hypoxia-ischemia in the rat. Exp. Neurol. 2013, 241, 25–33. [Google Scholar] [CrossRef]
- Pan, H.-C.; Yang, C.-N.; Lee, W.-J.; Sheehan, J.; Wu, S.-M.; Chen, H.-S.; Lin, M.-H.; Shen, L.-W.; Lee, S.-H.; Shen, C.-C.; et al. Melatonin Enhanced Microglia M2 Polarization in Rat Model of Neuro-inflammation Via Regulating ER Stress/PPARδ/SIRT1 Signaling Axis. J. Neuroimmune Pharmacol. 2024, 19, 11. [Google Scholar] [CrossRef] [PubMed]
- Chen, L.; Xue, L.; Zheng, J.; Tian, X.; Zhang, Y.; Tong, Q. PPARß/δ agonist alleviates NLRP3 inflammasome-mediated neuroinflammation in the MPTP mouse model of Parkinson’s disease. Behav. Brain Res. 2019, 356, 483–489. [Google Scholar] [CrossRef] [PubMed]
- Konttinen, H.; Gureviciene, I.; Oksanen, M.; Grubman, A.; Loppi, S.; Huuskonen, M.T.; Korhonen, P.; Lampinen, R.; Keuters, M.; Belaya, I.; et al. PPARβ/δ-agonist GW0742 ameliorates dysfunction in fatty acid oxidation in PSEN1ΔE9 astrocytes. Glia 2019, 67, 146–159. [Google Scholar] [CrossRef] [PubMed]
- Xu, Z.; Xue, T.; Zhang, Z.; Wang, X.; Xu, P.; Zhang, J.; Lei, X.; Li, Y.; Xie, Y.; Wang, L.; et al. Role of signal transducer and activator of transcription-3 in up-regulation of GFAP after epilepsy. Neurochem. Res. 2011, 36, 2208–15. [Google Scholar] [CrossRef] [PubMed]
- Feng, L.; Murugan, M.; Bosco, D.B.; Liu, Y.; Peng, J.; Worrell, G.A.; Wang, H.L.; Ta, L.E.; Richardson, J.R.; Shen, Y.; et al. Microglial proliferation and monocyte infiltration contribute to microgliosis following status epilepticus. Glia 2019, 67, 1434–1448. [Google Scholar] [CrossRef]
- Kyriatzis, G.; Bernard, A.; Bôle, A.; Khrestchatisky, M.; Ferhat, L. In the Rat Hippocampus, Pilocarpine-Induced Status Epilepticus Is Associated with Reactive Glia and Concomitant Increased Expression of CD31, PDGFRβ, and Collagen IV in Endothelial Cells and Pericytes of the Blood–Brain Barrier. Int. J. Mol. Sci. 2024, 25. [Google Scholar] [CrossRef]
- Dyomina, A. V.; Kovalenko, A.A.; Zakharova, M. V.; Postnikova, T.Y.; Griflyuk, A. V.; Smolensky, I. V.; Antonova, I. V.; Zaitsev, A. V. MTEP, a Selective mGluR5 Antagonist, Had a Neuroprotective Effect but Did Not Prevent the Development of Spontaneous Recurrent Seizures and Behavioral Comorbidities in the Rat Lithium-Pilocarpine Model of Epilepsy. Int. J. Mol. Sci. 2022, 23, 497. [Google Scholar] [CrossRef]
- Postnikova, T.Y.; Diespirov, G.P.; Amakhin, D. V.; Vylekzhanina, E.N.; Soboleva, E.B.; Zaitsev, A. V. Impairments of Long-Term Synaptic Plasticity in the Hippocampus of Young Rats during the Latent Phase of the Lithium-Pilocarpine Model of Temporal Lobe Epilepsy. Int. J. Mol. Sci. 2021, 22, 13355. [Google Scholar] [CrossRef]
- Li, J.; Xiang, X.; Gong, X.; Shi, Y.; Yang, J.; Xu, Z. Cilostazol protects mice against myocardium ischemic/reperfusion injury by activating a PPARγ/JAK2/STAT3 pathway. Biomed. Pharmacother. 2017, 94, 995–1001. [Google Scholar] [CrossRef] [PubMed]
- Lin, D.T.; Kao, N.J.; Cross, T.W.L.; Lee, W.J.; Lin, S.H. Effects of ketogenic diet on cognitive functions of mice fed high-fat-high-cholesterol diet. J. Nutr. Biochem. 2022, 104. [Google Scholar] [CrossRef]
- Simeone, T.A.; Matthews, S.A.; Samson, K.K.; Simeone, K.A. Regulation of brain PPARgamma2 contributes to ketogenic diet anti-seizure efficacy. Exp. Neurol. 2017, 287, 54–64. [Google Scholar] [CrossRef] [PubMed]
- Robel, S.; Sontheimer, H. Glia as drivers of abnormal neuronal activity. Nat. Neurosci. 2016 191 2015, 19, 28–33. [Google Scholar] [CrossRef]
- Qi, R.; Wang, M.; Zhong, Q.; Wang, L.; Yang, X.; Huang, B.; Yang, Z.; Zhang, C.; Geng, X.; Luo, C.; et al. Chronic vagus nerve stimulation (VNS) altered IL-6, IL-1β, CXCL-1 and IL-13 levels in the hippocampus of rats with LiCl-pilocarpine-induced epilepsy. Brain Res. 2022, 1780. [Google Scholar] [CrossRef] [PubMed]
- Pohlentz, M.S.; Müller, P.; Cases-Cunillera, S.; Opitz, T.; Surges, R.; Hamed, M.; Vatter, H.; Schoch, S.; Becker, A.J.; Pitsch, J. Characterisation of NLRP3 pathway-related neuroinflammation in temporal lobe epilepsy. PLoS One 2022, 17, 1–20. [Google Scholar] [CrossRef] [PubMed]
- Shin, H.J.; Jeong, E.A.; Lee, J.Y.; An, H.S.; Jang, H.M.; Ahn, Y.J.; Lee, J.; Kim, K.E.; Roh, G.S. Lipocalin-2 Deficiency Reduces Oxidative Stress and Neuroinflammation and Results in Attenuation of Kainic Acid-Induced Hippocampal Cell Death. Antioxidants (Basel, Switzerland) 2021, 10, 1–13. [Google Scholar] [CrossRef]
- Liu, R.; Wang, J.; Chen, Y.; Collier, J.M.; Capuk, O.; Jin, S.; Sun, M.; Mondal, S.K.; Whiteside, T.L.; Stolz, D.B.; et al. NOX activation in reactive astrocytes regulates astrocytic LCN2 expression and neurodegeneration. Cell Death Dis. 2022, 13. [Google Scholar] [CrossRef]
- Jha, M.K.; Suk, K. Glia-based biomarkers and their functional role in the CNS. Expert Rev. Proteomics 2013, 10, 43–63. [Google Scholar] [CrossRef]
- Hoellenriegel, J.; Meadows, S.A.; Sivina, M.; Wierda, W.G.; Kantarjian, H.; Keating, M.J.; Giese, N.; O’Brien, S.; Yu, A.; Miller, L.L.; et al. The phosphoinositide 3’-kinase delta inhibitor, CAL-101, inhibits B-cell receptor signaling and chemokine networks in chronic lymphocytic leukemia. Blood 2011, 118, 3603–3612. [Google Scholar] [CrossRef]
- Babiychuk, E.B.; Draeger, A. Annexins in cell membrane dynamics. Ca(2+)-regulated association of lipid microdomains. J. Cell Biol. 2000, 150, 1113–1123. [Google Scholar] [CrossRef]
- Milosevic, A.; Liebmann, T.; Knudsen, M.; Schintu, N.; Svenningsson, P.; Greengard, P. Cell- and region-specific expression of depression-related protein p11 (S100a10) in the brain. J. Comp. Neurol. 2017, 525, 955–975. [Google Scholar] [CrossRef] [PubMed]
- Svenningsson, P.; Greengard, P. p11 (S100A10)--an inducible adaptor protein that modulates neuronal functions. Curr. Opin. Pharmacol. 2007, 7, 27–32. [Google Scholar] [CrossRef]
- Bagdy, G.; Kecskemeti, V.; Riba, P.; Jakus, R. Serotonin and epilepsy. J. Neurochem. 2007, 100, 857–873. [Google Scholar] [CrossRef] [PubMed]
- Dahal, A.; Govindarajan, K.; Kar, S. Administration of Kainic Acid Differentially Alters Astrocyte Markers and Transiently Enhanced Phospho-tau Level in Adult Rat Hippocampus. Neuroscience 2023, 516, 27–41. [Google Scholar] [CrossRef]
- Murphy, M.P. Nitric oxide and cell death. Biochim. Biophys. Acta 1999, 1411, 401–414. [Google Scholar] [CrossRef] [PubMed]
- Hardbower, D.M.; Asim, M.; Luis, P.B.; Singh, K.; Barry, D.P.; Yang, C.; Steeves, M.A.; Cleveland, J.L.; Schneider, C.; Piazuelo, M.B.; et al. Ornithine decarboxylase regulates M1 macrophage activation and mucosal inflammation via histone modifications. Proc. Natl. Acad. Sci. U. S. A. 2017, 114, E751–E760. [Google Scholar] [CrossRef]
- Kharisova, A.R.; Roginskaya, A.I.; Zubareva, O.E. Effect of Cardarine on Gene Expression of Proteins Involved in Epileptogenesis in Rat Hippocampus in the Lithium-Pilocarpine Model of Temporal Lobe Epilepsy. J. Evol. Biochem. Physiol. 2024 603 2024, 60, 1064–1081. [Google Scholar] [CrossRef]
- Racine, R.J. Modification of seizure activity by electrical stimulation: cortical areas. Electroencephalogr. Clin. Neurophysiol. 1975, 38, 1–12. [Google Scholar] [CrossRef]
- Malm, T.; Mariani, M.; Donovan, L.J.; Neilson, L.; Landreth, G.E. Activation of the nuclear receptor PPARδ is neuroprotective in a transgenic mouse model of Alzheimer’s disease through inhibition of inflammation. J. Neuroinflammation 2015, 12, 7. [Google Scholar] [CrossRef]
- Paxinos, G.; Watson, C. The rat brain in stereotaxic coordinates: hard cover edition; Elsevier: Amsterdam, The Netherlands, 2006; ISBN 9780080475134. [Google Scholar]
- Chauhan, P.; Philip, S.E.; Chauhan, G.; Mehra, S. The Anatomical Basis of Seizures. In Epilepsy; Exon Publications, 2022; pp. 15–24.
- Livak, K.J.; Schmittgen, T.D. Analysis of Relative Gene Expression Data Using Real-Time Quantitative PCR and the 2−ΔΔCT Method. Methods 2001, 25, 402–408. [Google Scholar] [CrossRef]
- Schwarz, A.P.; Kovalenko, A.A.; Malygina, D.A.; Postnikova, T.Y.; Zubareva, O.E.; Zaitsev, A. V. Reference gene validation in the brain regions of young rats after pentylenetetrazole-induced seizures. Biomedicines 2020, 8, 1–12. [Google Scholar] [CrossRef]
- Kopec, A.M.; Rivera, P.D.; Lacagnina, M.J.; Hanamsagar, R.; Bilbo, S.D. Optimized solubilization of TRIzol-precipitated protein permits Western blotting analysis to maximize data available from brain tissue. J. Neurosci. Methods 2017, 280, 64–76. [Google Scholar] [CrossRef] [PubMed]
- Harrington, C.R. Lowry protein assay containing sodium dodecyl sulfate in microtiter plates for protein determinations on fractions from brain tissue. Anal. Biochem. 1990, 186, 285–287. [Google Scholar] [CrossRef] [PubMed]
- Laemmli, U.K. Cleavage of structural proteins during the assembly of the head of bacteriophage T4. Nature 1970. [Google Scholar] [CrossRef]
- Bonefeld, B.E.; Elfving, B.; Wegener, G. Reference genes for normalization: A study of rat brain tissue. Synapse 2008, 62, 302–309. [Google Scholar] [CrossRef]
- Schwarz, A.P.; Malygina, D.A.; Kovalenko, A.A.; Trofimov, A.N.; Zaitsev, A. V. Multiplex qPCR assay for assessment of reference gene expression stability in rat tissues/samples. Mol. Cell. Probes 2020, 53. [Google Scholar] [CrossRef]
- Lin, W.; Burks, C.A.; Hansen, D.R.; Kinnamon, S.C.; Gilbertson, T.A. Taste Receptor Cells Express pH-Sensitive Leak K + Channels. J. Neurophysiol. 2004, 92, 2909–2919. [Google Scholar] [CrossRef]
- Yamaguchi, M.; Yamauchi, A.; Nishimura, M.; Ueda, N.; Naito, S. Soybean Oil Fat Emulsion Prevents Cytochrome P450 mRNA Down-Regulation Induced by Fat-Free Overdose Total Parenteral Nutrition in Infant Rats. Biol. Pharm. Bull. 2005, 28, 143–147. [Google Scholar] [CrossRef]
- Swijsen, A.; Nelissen, K.; Janssen, D.; Rigo, J.-M.; Hoogland, G. Validation of reference genes for quantitative real-time PCR studies in the dentate gyrus after experimental febrile seizures. BMC Res. Notes 2012, 5, 685. [Google Scholar] [CrossRef] [PubMed]
- Pohjanvirta, R.; Niittynen, M.; Lindén, J.; Boutros, P.C.; Moffat, I.D.; Okey, A.B. Evaluation of various housekeeping genes for their applicability for normalization of mRNA expression in dioxin-treated rats. Chem. Biol. Interact. 2006, 160, 134–149. [Google Scholar] [CrossRef] [PubMed]
- Malkin, S.L.; Amakhin, D. V; Veniaminova, E.A.; Kim, K.K.; Zubareva, O.E.; Magazanik, L.G.; Zaitsev, A. V Changes of AMPA receptor properties in the neocortex and hippocampus following pilocarpine-induced status epilepticus in rats. Neuroscience 2016, 327, 146–55. [Google Scholar] [CrossRef] [PubMed]
- Cook, N.L.; Vink, R.; Donkin, J.J.; van den Heuvel, C. Validation of reference genes for normalization of real-time quantitative RT-PCR data in traumatic brain injury. J. Neurosci. Res. 2009, 87, 34–41. [Google Scholar] [CrossRef] [PubMed]
- Langnaese, K.; John, R.; Schweizer, H.; Ebmeyer, U.; Keilhoff, G. Selection of reference genes for quantitative real-time PCR in a rat asphyxial cardiac arrest model. BMC Mol. Biol. 2008, 9, 53. [Google Scholar] [CrossRef]
- Rioja, I.; Bush, K.A.; Buckton, J.B.; Dickson, M.C.; Life, P.F. Joint cytokine quantification in two rodent arthritis models: kinetics of expression, correlation of mRNA and protein levels and response to prednisolone treatment. Clin. Exp. Immunol. 2004, 137, 65–73. [Google Scholar] [CrossRef] [PubMed]
- Raghavendra, V.; Tanga, F.Y.; DeLeo, J.A. Attenuation of Morphine Tolerance, Withdrawal-Induced Hyperalgesia, and Associated Spinal Inflammatory Immune Responses by Propentofylline in Rats. Neuropsychopharmacology 2004, 29, 327–334. [Google Scholar] [CrossRef] [PubMed]
- O’Donovan, S.M.; Hasselfeld, K.; Bauer, D.; Simmons, M.; Roussos, P.; Haroutunian, V.; Meador-Woodruff, J.H.; McCullumsmith, R.E. Glutamate transporter splice variant expression in an enriched pyramidal cell population in schizophrenia. Transl. Psychiatry 2015, 5, e579. [Google Scholar] [CrossRef]
- Su, J.; Zhang, Y.; Cheng, C.; Zhu, Y.; Ye, Y.; Sun, Y.; Xiang, S.; Wang, Y.; Liu, Z.; Zhang, X. Hydrogen regulates the M1/M2 polarization of alveolar macrophages in a rat model of chronic obstructive pulmonary disease. Exp. Lung Res. 2021, 47, 301–310. [Google Scholar] [CrossRef]
- Sang, N.; Yun, Y.; Li, H.; Hou, L.; Han, M.; Li, G. SO2 inhalation contributes to the development and progression of ischemic stroke in the brain. Toxicol. Sci. 2010, 114, 226–236. [Google Scholar] [CrossRef]
Disclaimer/Publisher’s Note: The statements, opinions and data contained in all publications are solely those of the individual author(s) and contributor(s) and not of MDPI and/or the editor(s). MDPI and/or the editor(s) disclaim responsibility for any injury to people or property resulting from any ideas, methods, instructions or products referred to in the content. |
© 2024 by the authors. Licensee MDPI, Basel, Switzerland. This article is an open access article distributed under the terms and conditions of the Creative Commons Attribution (CC BY) license (https://creativecommons.org/licenses/by/4.0/).


