
Submitted:
16 August 2024
Posted:
16 August 2024
You are already at the latest version
Abstract
This study investigates the collapse of the medial longitudinal arch (MLA) as a risk factor for medial tibial stress syndrome (MTSS), hypothesizing that overuse of extrinsic foot muscles to prevent MLA collapse can lead to disability. Twenty healthy adults (39 feet) with a foot posture index score below 6 and no recent lower extremity orthopedic history participated. Ultrasonog-raphy measured foot muscle cross-sectional areas, while three-dimensional motion analysis us-ing VICON assessed foot kinematics during gait, focusing on navicular height at initial contact (ICNH) and dynamic navicular drop (DND) during the stance phase. Hierarchical cluster analy-sis based on ICNH and DND compared muscle cross-sectional areas between clusters using ANOVA or Kruskal–Wallis test. The analysis indicated that ICNH was lower in clusters 1 and 3 than in cluster 2, and DND was smaller in clusters 1 and 2 than in cluster 3. Although there was no significant difference in muscle cross-sectional area between the clusters, the flexor hallucis longus tended to be thicker in cluster 1 than in cluster 3 (p = 0.051). The findings suggest that the flexor hallucis longus may help prevent MLA compression during loading, indicating that over-use of extrinsic foot muscles may contribute to MTSS development.
Keywords:
Flat foot
; Foot kinematics
; Foot muscle morphology
; Medial tibial stress syndrome
1. Introduction
Medial longitudinal arch (MLA) collapse, commonly known as flat foot, is one of the most prevalent foot alignment disorders and a significant risk factor for overuse injuries such as medial tibial stress syndrome [1] and plantar fasciitis [2]. Recent research has increasingly focused on foot kinematics [3,4] and muscle function [5,6,7,8,9] in the context of overuse syndrome prevention.
Studies have shown that individuals with flat feet exhibit distinctive gait characteristics, including increased tibialis posterior muscle activity [5] and enhanced plantar flexion and external rotation of the ankle joint during the stance phase [3]. Angin et al. [10] investigated the relationship between the six-item foot posture index (FPI), which assesses flat foot severity, and the cross-sectional area (CSA) of foot muscles. They found negative correlations between FPI and intrinsic foot muscle CSAs, and positive correlations with extrinsic foot muscle CSAs.
These findings suggest that flat-footed individuals may compensate for MLA collapse and intrinsic foot muscle dysfunction in static situations by increasing extrinsic muscle activity, which affects ankle joint dynamics. For instance, medial tibial stress syndrome is thought to result from tibial periosteum traction stress due to overactivity of extrinsic foot muscles like the tibialis posterior and flexor digitorum longus [1,11,12].
While these studies provide valuable insights, they primarily predict dynamic activity based on static foot alignment assessments. However, some reports indicate that static assessments poorly predict dynamic foot kinematics [3,13]. Consequently, there has been growing interest in dynamic evaluation of foot kinematics [14,15].
Understanding the relationship between MLA collapse characteristics during gait and muscle morphology is crucial for accurately determining the etiology of overuse syndromes. Although ultrasonography cannot directly measure dynamic muscle activity, muscle morphology likely reflects repeated muscle activity and offers a non-invasive method to predict muscle function.
Therefore, this study aims to investigate the characteristics of MLA collapse during gait and its relationship with foot muscle CSAs. We hypothesize that individuals exhibiting less MLA collapse during gait will have hypertrophied extrinsic foot muscles, particularly those contributing to ankle joint rotation. This research could provide valuable insights into the compensatory mechanisms in flat feet and contribute to more effective prevention and treatment strategies for related overuse injuries.
2. Materials and Methods
Participants
This study was conducted with approval from the Ethics Committee of the Prefectural University of Hiroshima, and all participants provided written informed consent. The research team approached 148 students at the Prefectural University of Hiroshima to provide details about the study and invite participation. Exclusion criteria were established, including any history of lower extremity injury within the six months preceding the study, and a score exceeding 6 points on the six-item Foot Posture Index (FPI). Participants meeting the eligibility criteria based on these standards were included in the study.
Measurement of Foot Kinematics during Gait
This study examined foot kinematics during gait, focusing on two key measurements: the navicular height at initial contact (ICNH) and the dynamic navicular drop (DND). The DND was calculated as the difference between ICNH and the lowest point of the navicular during the stance phase [14,15] (Figure 1). This method of DND measurement is widely accepted and has demonstrated reliability [14,15].
We utilized a motion capture system (Vicon, Oxford Metrics, Oxford, UK) consisting of 12 MX-T20S cameras operating at 100 Hz, in conjunction with six force platforms (two Kistler and four AMTI) sampling at 1000 Hz. Data processing was performed using Vicon Nexus software and Visual3D (C-Motion Inc., Germantown, MD, USA).
A trained researcher (KF) placed 9.5-mm reflective markers on specific anatomical landmarks: the navicular tuberosity, the medial aspect of the first metatarsal head, the lateral aspect of the fifth metatarsal head, and the distal end of the calcaneus (Figure 2). For statistical analysis, we used the average values of ICNH and DND from five stance phases.
Measurement of Foot Muscle Morphology
Ultrasound imaging was employed to assess the cross-sectional areas (CSAs) of select foot muscles: abductor hallucis, flexor hallucis brevis, flexor digitorum brevis, flexor hallucis longus, flexor digitorum longus, and peroneus longus. To capture these measurements, we utilized a SONIMAGE MX1 ultrasound system (Konica Minolta, Tokyo, Japan) with an 11-MHz linear array probe. The measurement protocol followed procedures detailed in previous studies [6,16], with all examinations conducted by a single experienced investigator (KO). Recognizing the significant relationship between lower limb muscle volume and body weight [17], we normalized each muscle's CSA to the participant's body weight (mm2/kg) to account for inter-individual differences. In our statistical analysis, we used the mean of three measurements for each muscle.
Statistical Analysis
To categorize participants based on foot kinematics during gait, we employed hierarchical cluster analysis. The model incorporated ICNH and DND measurements. We selected Euclidean distance as the metric and applied the Ward linkage method. After identifying clusters of participants with flat feet, we verified data normality using the Shapiro-Wilk test. Differences in cluster variables, demographic characteristics, and CSAs of selected foot muscles were analyzed using either one-way analysis of variance or the Kruskal-Wallis test, depending on data distribution. For post hoc comparisons, we utilized the Tukey and Steel-Dwass methods. We calculated effect sizes (d or r) for continuous variables based on their normality. The effect size d was interpreted as small (0.2-0.5), medium (0.5-0.8), or large (>0.8), while r was considered small (0.1-0.3), medium (0.3-0.5), or large (≥0.5). Statistical significance was set at p<0.05. All analyses were conducted using SPSS 20.0 for Windows (SPSS Inc, Chicago, IL, USA).
3. Results
We conducted hierarchical cluster analysis using ICNH and DND, resulting in three distinct clusters (Figure 3). The NH patterns during the gait stance phase for each cluster are illustrated in Figure 4. Table 1 presents the cluster variables and additional foot kinematics data. Significant differences in ICNH were observed between clusters 1 and 2 (p<0.01, d = 3.07), and clusters 2 and 3 (p<0.01, d = 2.33). For DND, significant differences were found between clusters 1 and 3 (p<0.01, r = 0.70), and clusters 2 and 3 (p<0.01, r = 0.84). Table 2 details the demographic variables and FPI scores, which assess static foot alignment. While age, height, and weight showed no significant differences across clusters, body mass index differed significantly between clusters 1 and 2 (p<0.05, d = 1.24). No significant differences were observed in FPI scores or CSAs of any muscle among the clusters.
3.2. Figures and Tables
Figure 1.
Navicular height during the stance phase of gait and the definition of dynamic navicular drop. Dynamic navicular drop was defined as the difference between navicular height at initial contact and minimum value during the stance phase of gait.
Figure 1.
Navicular height during the stance phase of gait and the definition of dynamic navicular drop. Dynamic navicular drop was defined as the difference between navicular height at initial contact and minimum value during the stance phase of gait.
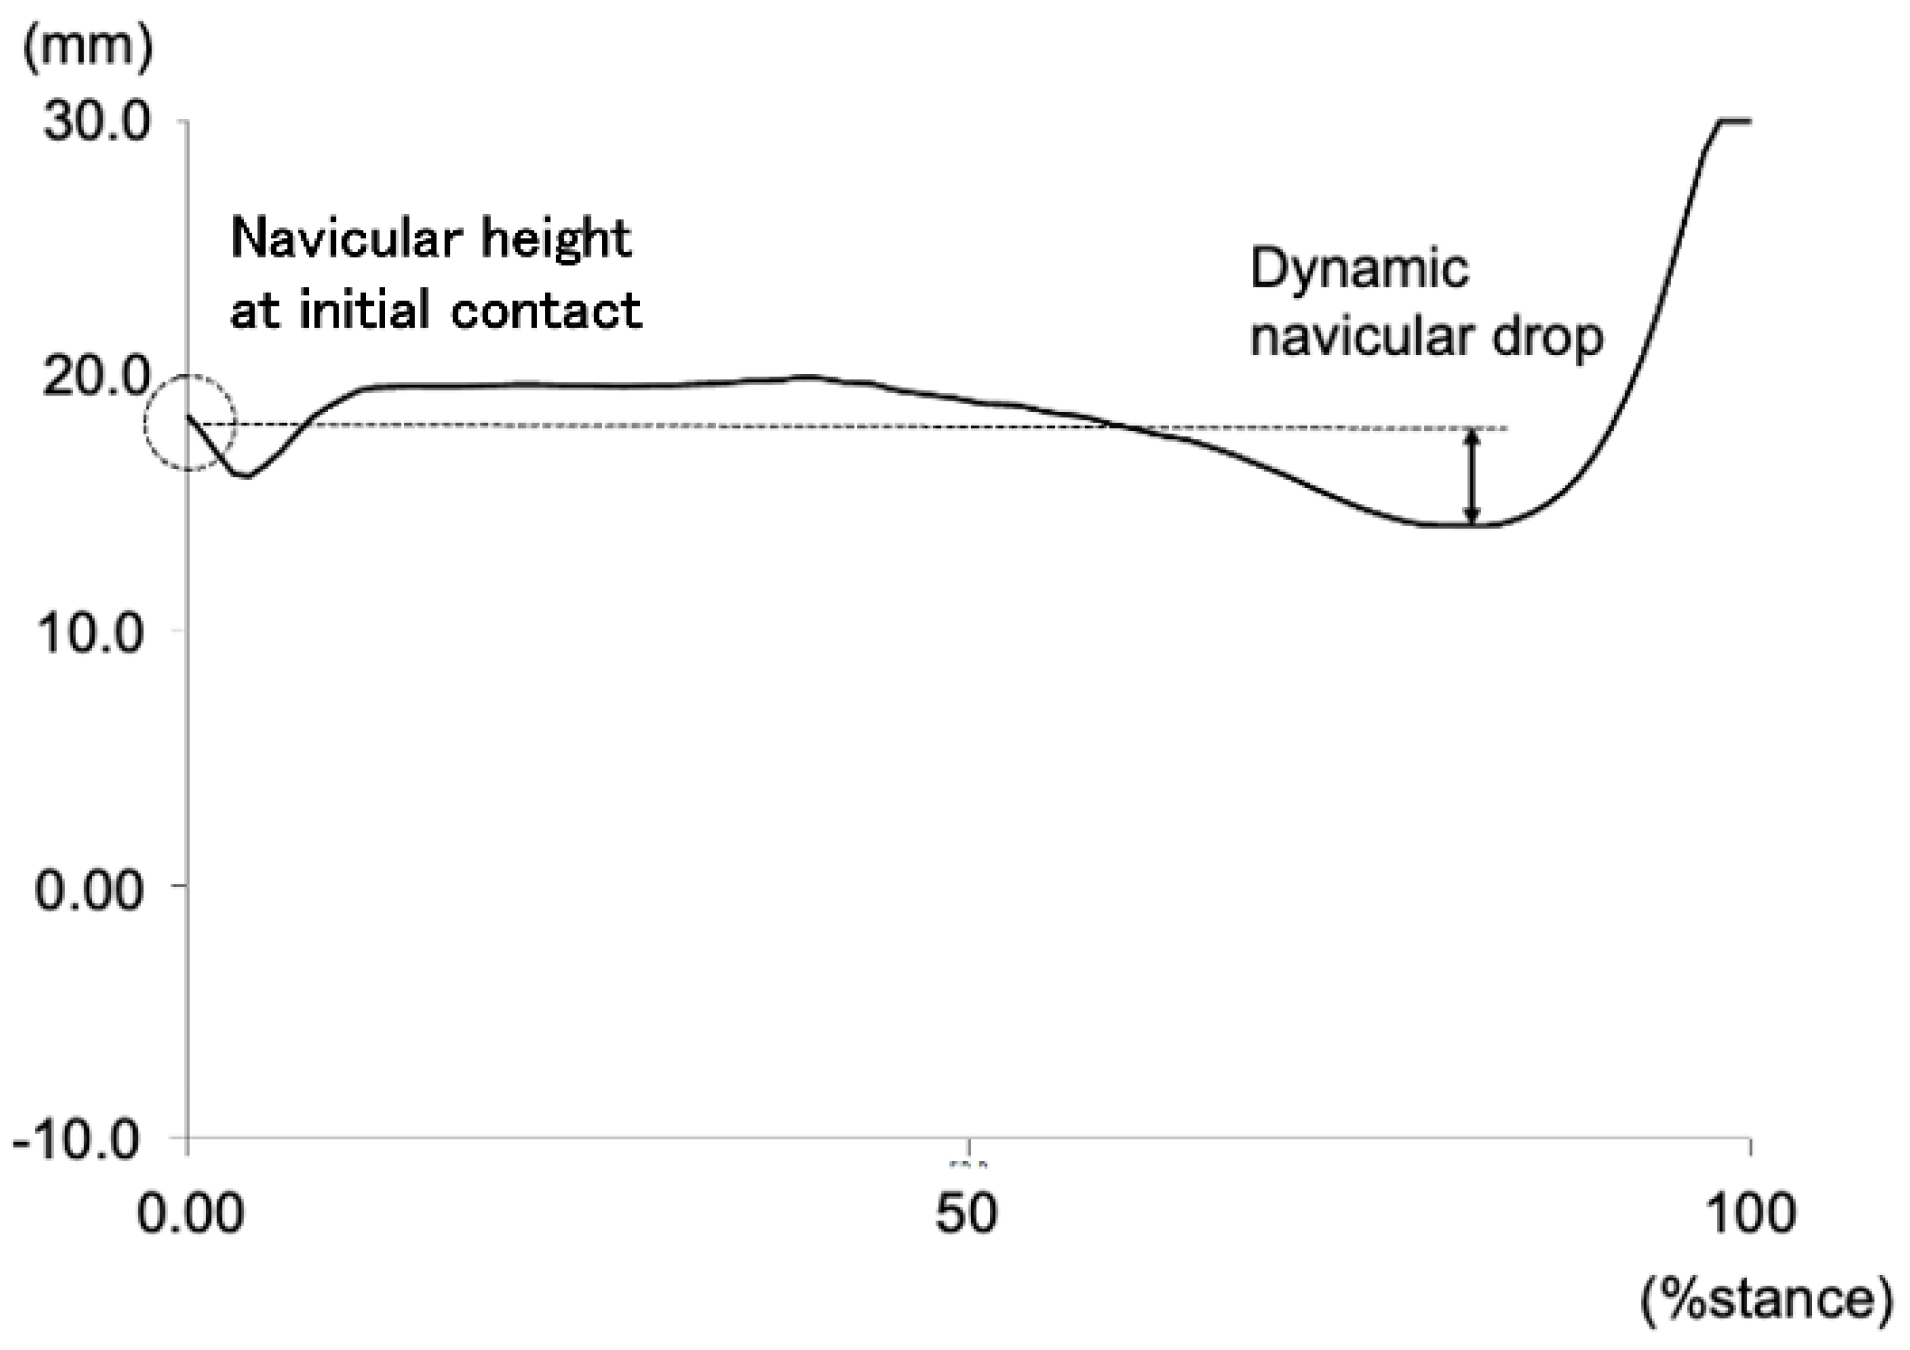
Figure 2.
The marker attachment positions. DCA, distal end of the calcaneus; NAV, navicular tuberosity; 1 MH, medial aspect of the first metatarsal head; 5 MH, lateral aspect of the fifth metatarsal head.
Figure 2.
The marker attachment positions. DCA, distal end of the calcaneus; NAV, navicular tuberosity; 1 MH, medial aspect of the first metatarsal head; 5 MH, lateral aspect of the fifth metatarsal head.
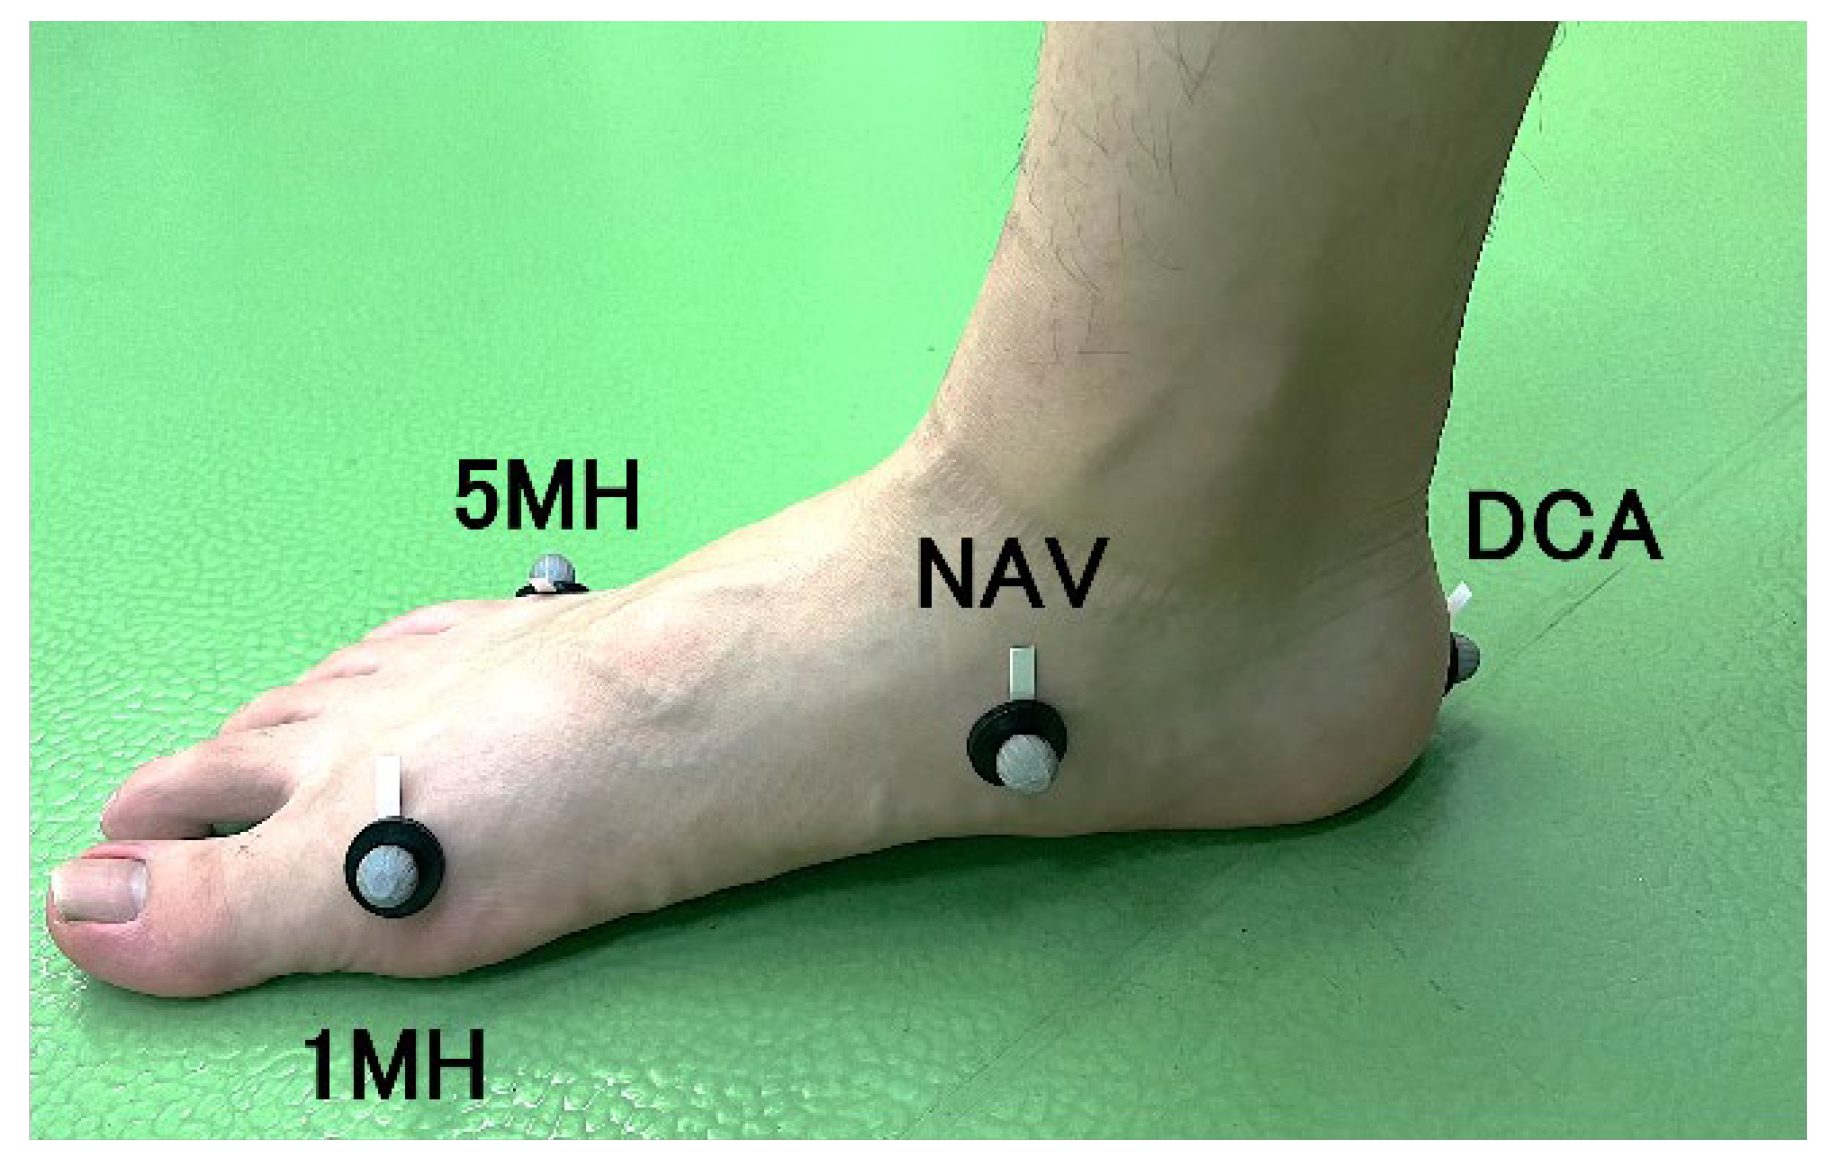
Figure 3.
Ward’s minimum variance linkage dendrogram of the hierarchical cluster analysis of medial longitudinal arch kinematics during gait representing the 3-cluster solution. Three groups are highlighted by red color for cluster 1, green for cluster 2, and blue for cluster 3.
Figure 3.
Ward’s minimum variance linkage dendrogram of the hierarchical cluster analysis of medial longitudinal arch kinematics during gait representing the 3-cluster solution. Three groups are highlighted by red color for cluster 1, green for cluster 2, and blue for cluster 3.
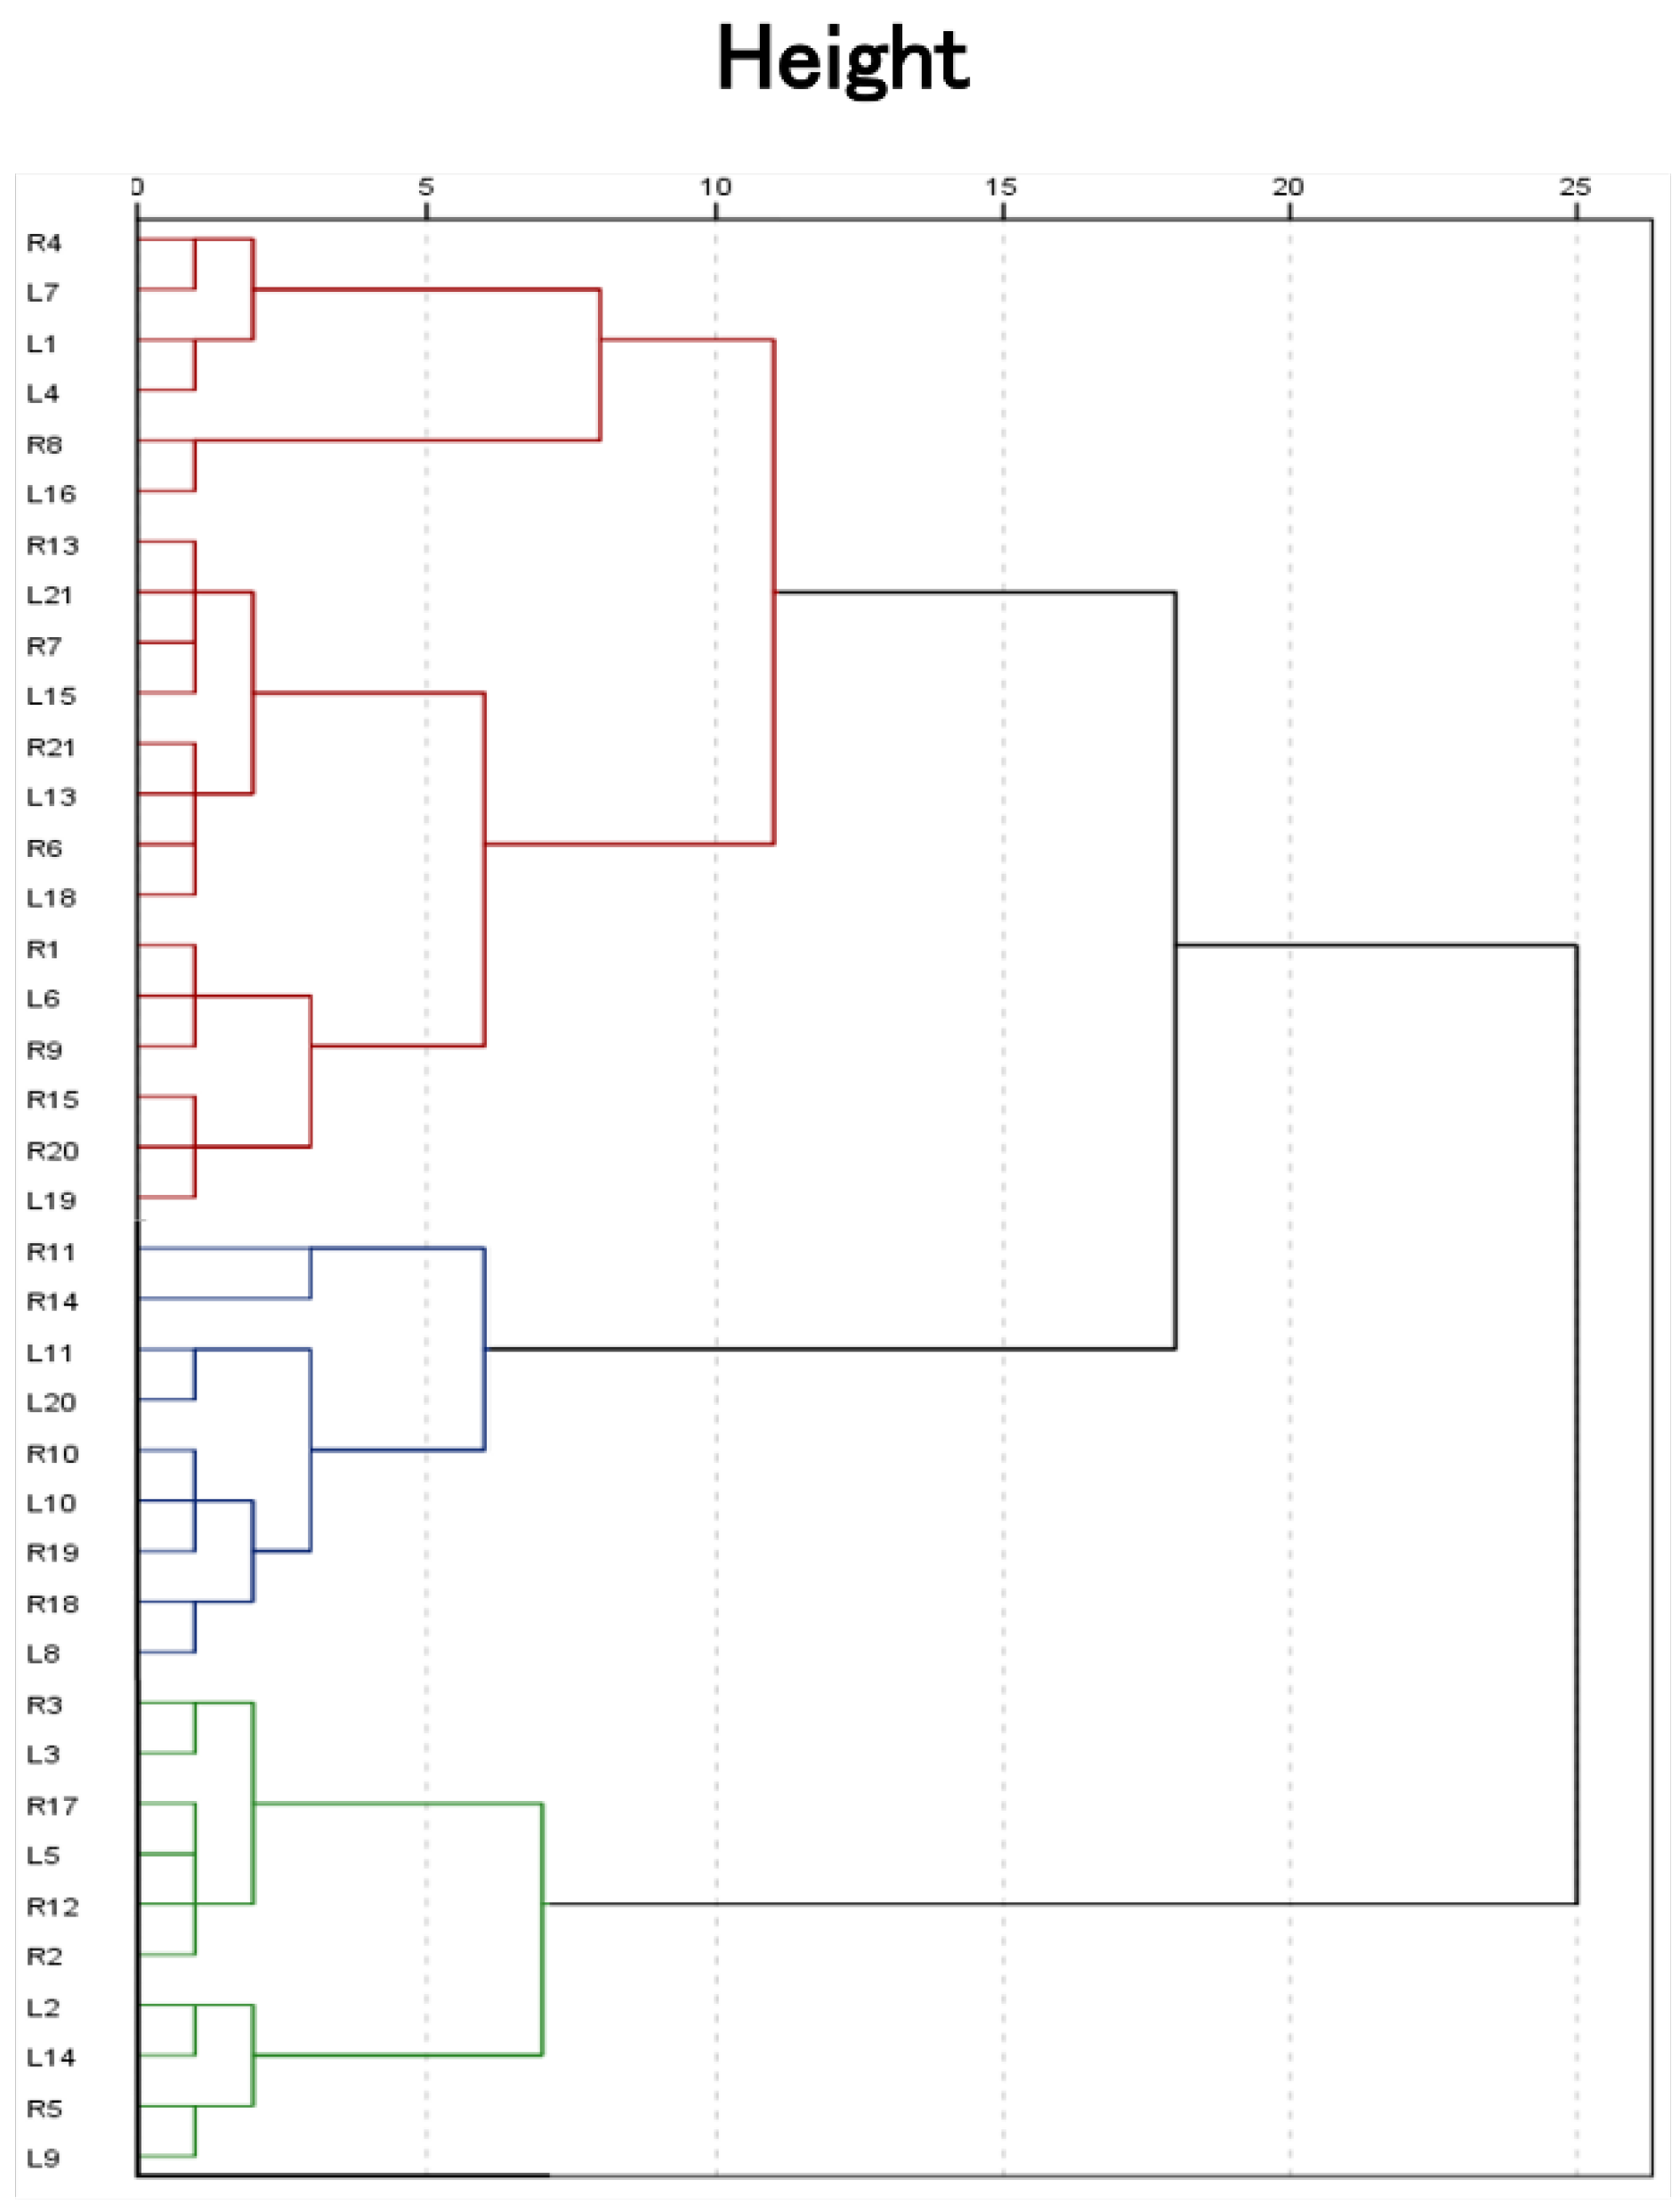
Figure 4.
Navicular height during the stance phase of gait in 3 clusters.
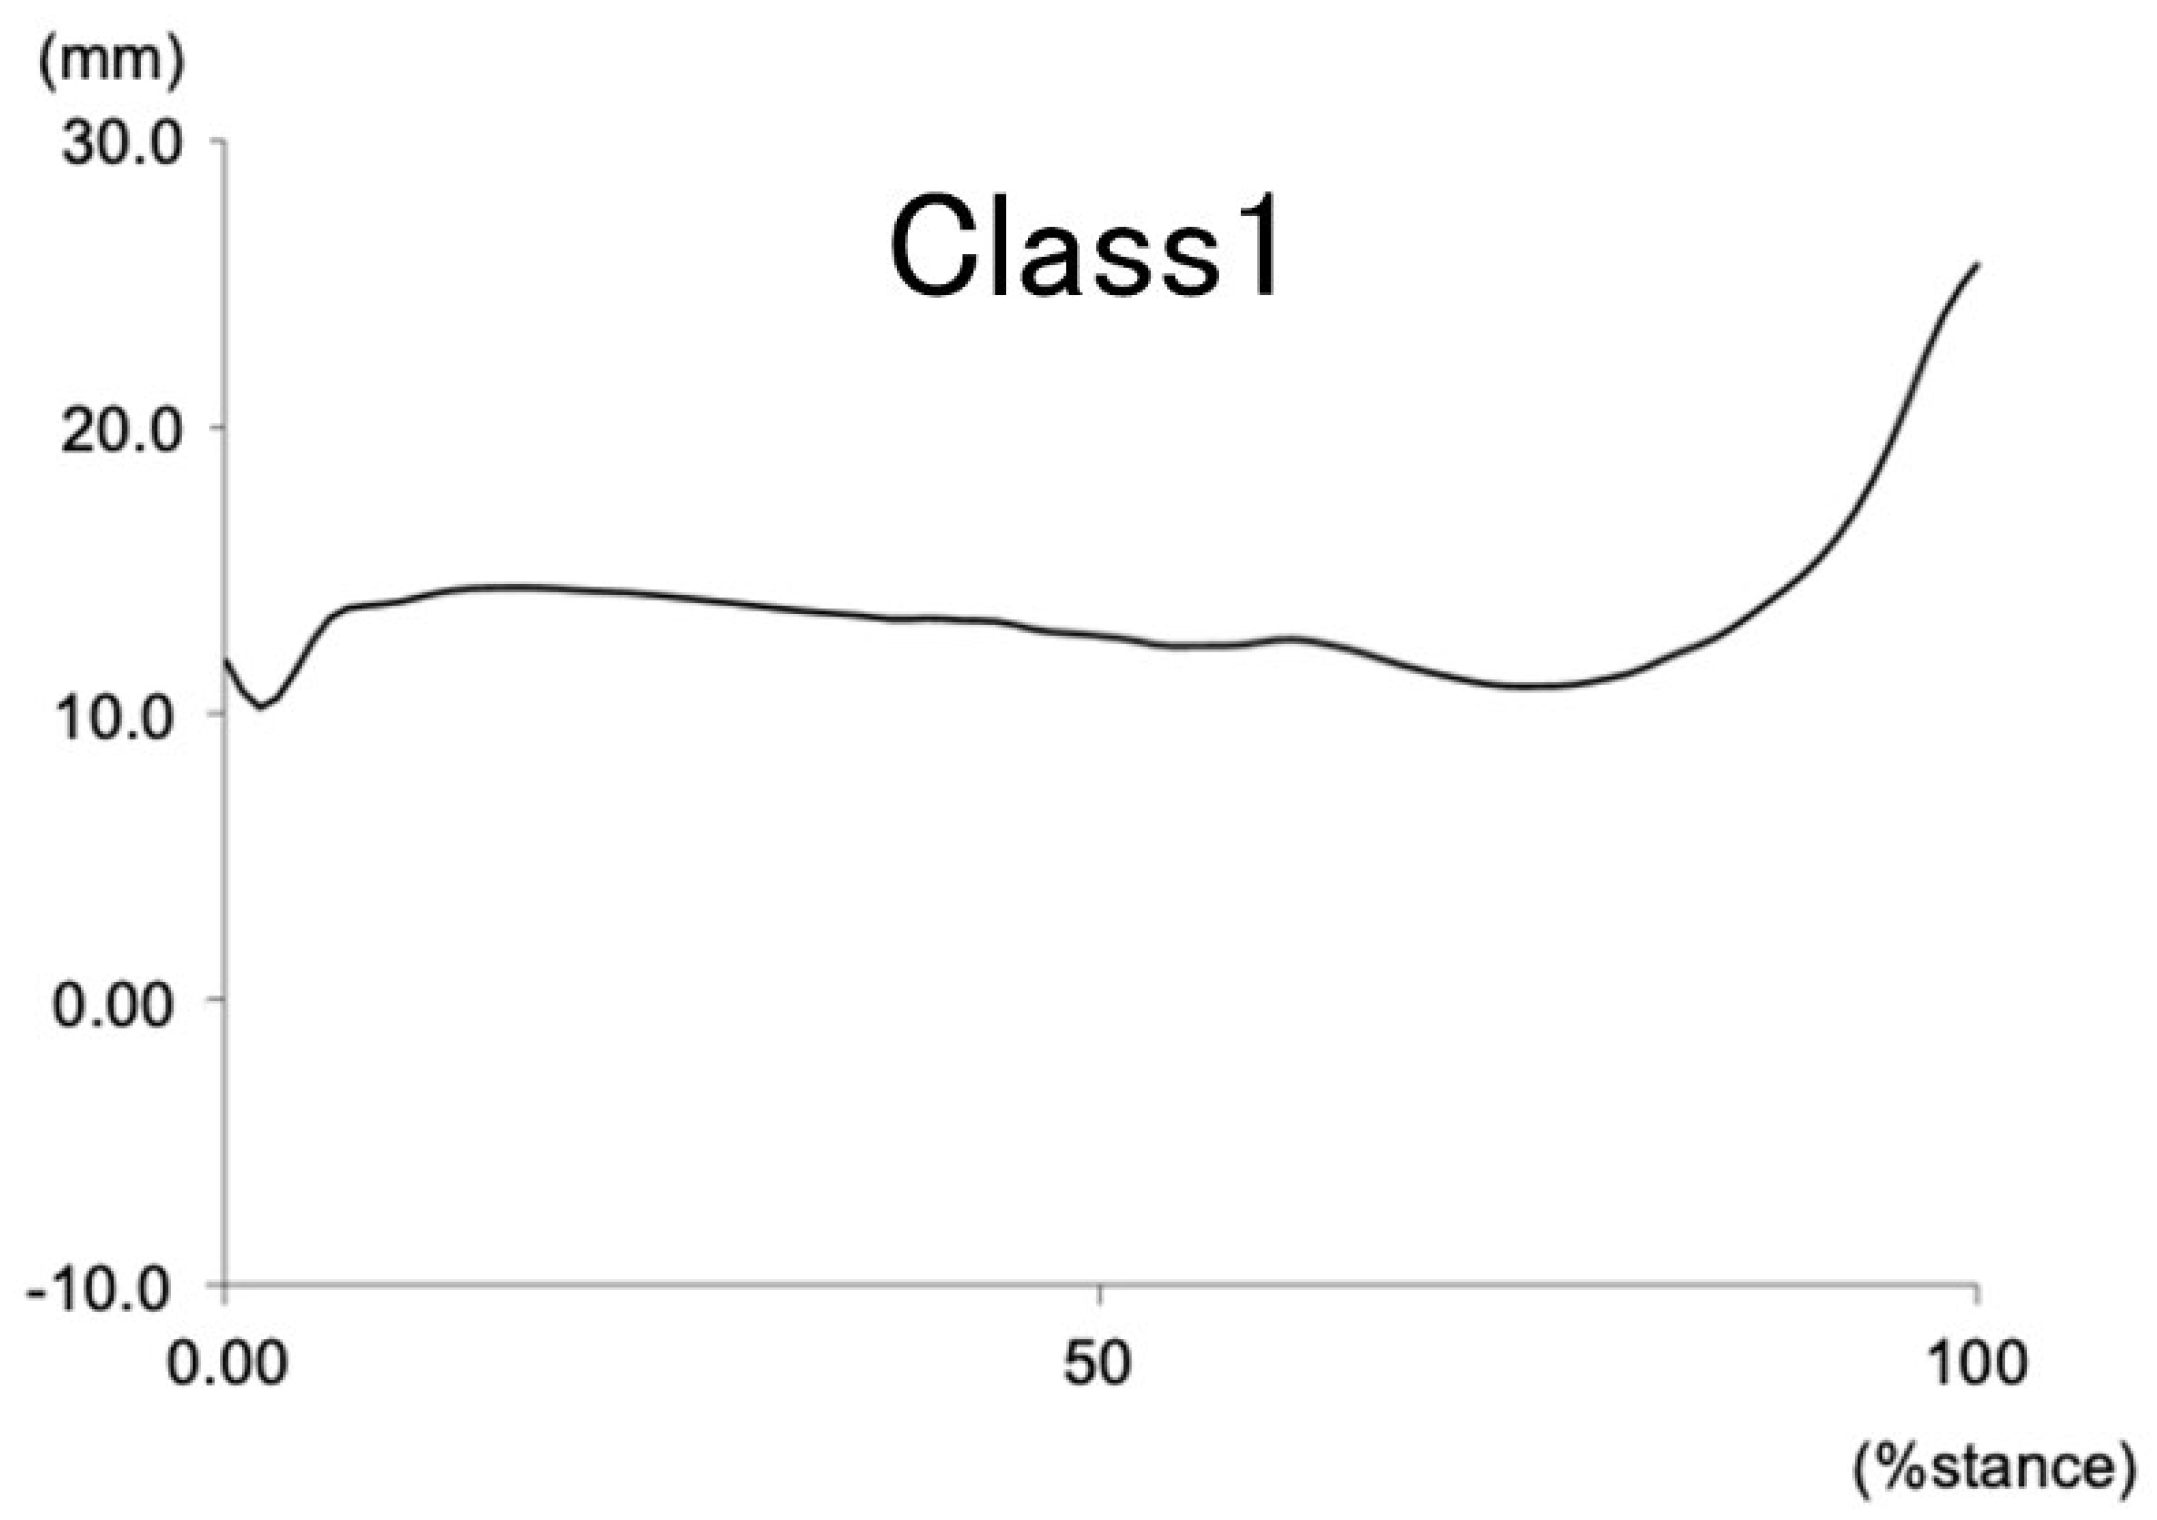
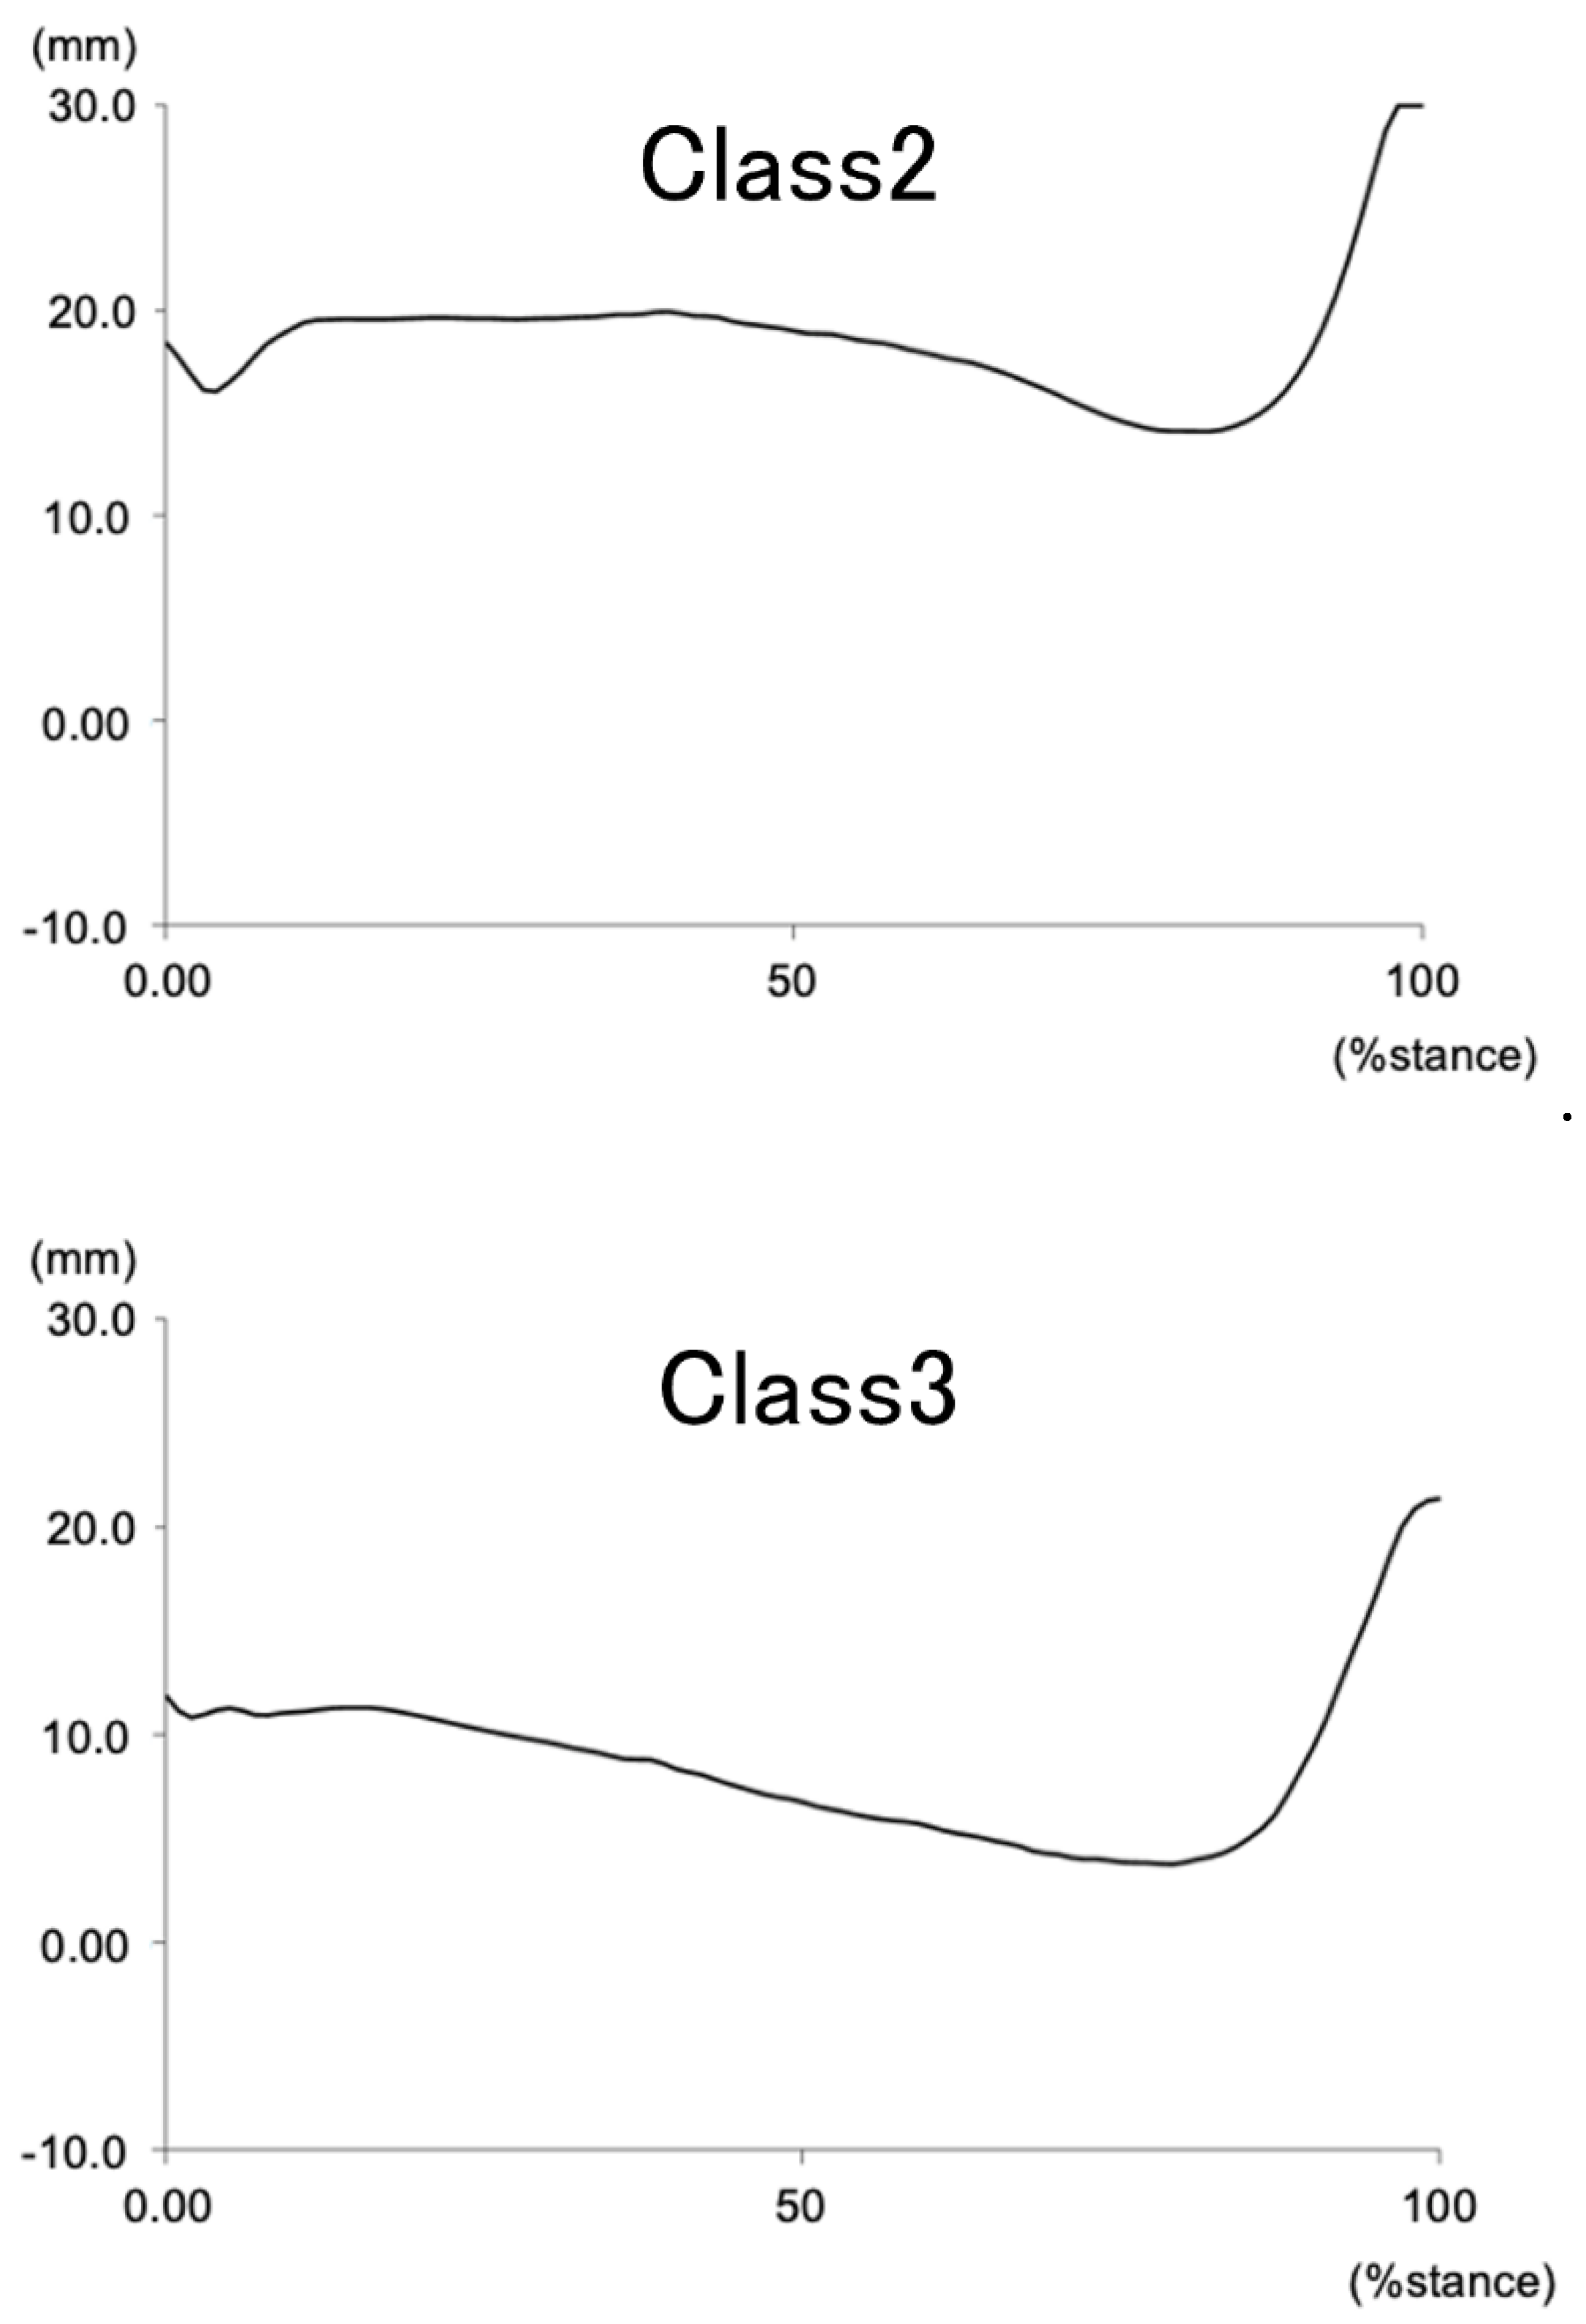

Table 1.
Cluster variables for each of the clusters. Values are mean ± standard deviation or median [25th/75th interquartile].*significant difference compared with cluster 1; **significant difference compared with cluster 2; ***significant difference compared with cluster 3.
Table 1.
Cluster variables for each of the clusters. Values are mean ± standard deviation or median [25th/75th interquartile].*significant difference compared with cluster 1; **significant difference compared with cluster 2; ***significant difference compared with cluster 3.
| Variables |
Cluster 1 n=20 (51.3%) |
Cluster 2 n=10 (25.6%) |
Cluster 3 n=9 (23.1%) |
| Navicular height at initial contact (mm) |
11.5±2.7** | 19.5±2.6*,*** | 14.1±2.3** |
| Dynamic navicular drop (mm) |
3.7[2.9/4.5]*** | 4.5[4.0/5.5]*** | 8.7[8.5/10.9]*,** |
Table 2.
Demographic variables and external variables in each of the clusters. Values excluding sex are mean ± standard deviation or median [25th/75th interquartile]. *significant difference compared with cluster 1; **significant difference compared with cluster 2; ***significant difference compared with cluster 3.
| Variables | Cluster 1 n=20 (51.3%) |
Cluster 2 n=10 (25.6%) |
Cluster 3 n=9 (23.1%) |
|---|---|---|---|
| Demographic variables Sex (woman/man) |
14/6 | 4/6 | 7/2 |
| Age (years) | 21.0[20.0/21.0] | 21.0[20.8/21.0] | 21.0[21.0/22.0] |
| Height (cm) | 160.9±8.5 | 165.5±9.6 | 161.4±11.3 |
| Weight (kg) | 54.4±7.2 | 54.1±6.3 | 53.6±5.8 |
| Body mass index (kg/m2) |
20.9±1.1** | 19.7±0.7* | 20.6±1.4 |
| Six item foot posture index (points) |
9.1±1.4 | 7.8±1.0 | 8.4±1.5 |
| Muscle cross-sectional area | |||
| Abductor halluces (mm2/kg) |
2.0[1.8/2.3] | 2.3[1.8/2.8] | 2.1[1.6/2.3] |
| Flexor hallucis brevis (mm2/kg) |
2.8[2.5/3.6] | 2.7[2.6/3.2] | 2.6[2.5/2.8] |
| Flexor digitorum brevis (mm2/kg) |
1.8[1.5/2.2] | 1.8[1.6/2.4] | 1.5[1.4/1.8] |
| Flexor hallucis longus (mm2/kg) |
2.2±0.5 | 2.4±0.6 | 2.0±0.5 |
| Flexor digitorum longus (mm2/kg) |
1.7[1.3/1.9] | 1.3[1.2/1.7] | 1.2[1.1/1.5] |
| Peroneus longus (mm2/kg) |
2.9[2.6/4.0] | 3.2[2.9/3.6] | 2.9[2.8/3.2] |
4. Discussion
In this study, participants with flat feet were classified into three clusters based on medial longitudinal arch (MLA) kinematics during gait. Although not statistically significant, notable differences in the cross-sectional area (CSA) of the flexor digitorum longus (FDL), an extrinsic foot muscle, were observed between clusters.
Particularly, a noteworthy trend was observed in FDL CSA between Cluster 1 (low ICNH, small DND) and Cluster 3 (low ICNH, large DND). While not reaching statistical significance (p=0.051), a moderate effect size (r=0.43) was observed, suggesting that Cluster 1 tended to have larger FDL compared to Cluster 3. This finding partially aligns with previous studies reporting the crucial role of FDL in preventing MLA compression [6,18,19].
The smaller DND observed in Cluster 1 suggests that this group may utilize FDL more to prevent MLA collapse. Kobayashi et al. [19] reported that individuals with flat feet tend to use FDL to maintain the MLA. Our results support the possibility that overuse of FDL in Cluster 1 participants may have contributed to the reduced MLA collapse observed in this group.
However, no statistically significant differences were found in the CSA of intrinsic muscles between clusters. This may relate to the findings of Okamura et al. [18], who reported an increase in MLA after fatiguing intrinsic muscles, suggesting that extrinsic muscles might compensate for intrinsic muscle dysfunction to prevent MLA collapse. Our results suggest that in flat feet, the degree of MLA collapse may differ depending on whether FDL compensates for intrinsic muscle dysfunction.
Conversely, Angin et al. [10] reported a negative correlation between FPI scores and CSA of intrinsic muscles such as abductor hallucis and flexor hallucis brevis. The lack of clear differences in intrinsic muscles in our study might be due to comparing similar flat-footed participants.
Furthermore, our previous study [15] changing the kinematic task from gait to running showed that participants with larger CSAs of abductor hallucis and flexor hallucis brevis had larger DND, while those with smaller CSAs of intrinsic muscles had smaller DND. This suggests the possibility that some participants use active intrinsic muscles to endure the load, while others shift the load position laterally due to inability to endure the load with small intrinsic muscles.
These results suggest that during gait, intrinsic muscle dysfunction may be compensated by extrinsic muscles (particularly FDL), while during higher loads such as running, the foot kinetic strategy may change by shifting the load laterally in response to the amount of load.
The novelty of this study lies in investigating the relationship between MLA collapse during gait and muscle morphology, suggesting that flat foot may prevent MLA collapse by overusing the FDL. This could contribute to understanding the pathophysiology of medial tibial stress syndrome (MTSS), where flat foot is a risk factor [1,11].
However, this study has limitations including small sample size, use of ultrasound for muscle evaluation rather than direct measurement of muscle activity, and use of only ICNH and DND for MLA kinematics clustering. Future studies should confirm these trends with larger sample sizes, directly evaluate FDL and intrinsic muscle activity using electromyography, and employ more comprehensive MLA kinematic indicators.
5. Conclusions
This study classified participants with flat feet into three distinct groups based on their medial longitudinal arch (MLA) kinematics during gait. We observed differences in MLA collapse among these groups, suggesting potential variations in the cross-sectional area (CSA) of the flexor digitorum longus (FDL) muscle. While no significant differences were found in the CSA of intrinsic foot muscles, our findings indicate that individuals with less MLA collapse may possess larger FDL muscle CSA. This trend, although not statistically significant, exhibited a moderate effect size, highlighting the potential role of FDL in maintaining arch stability during gait in flat-footed individuals. These results contribute to our understanding of the complex relationship between foot muscle morphology and MLA kinematics in flat feet. Future studies employing larger sample sizes and incorporating electromyographic evaluation are expected to further validate these initial findings and deepen our understanding of muscle function in flat feet.
Author Contributions
Kengo Fukuda: Conceptualization, Methodology, Validation, Formal Analysis, Investigation, Resources, Data Curation, Writing – Original Draft, Project Administration. Kazunori Okamura: Conceptualization, Methodology, Validation, Investigation, Data Curation, Writing – Review & Editing, Visualization, and Project Administration. Tomohiro Ikeda: Conceptualization, Methodology, Validation, Investigation, Writing – Review & Editing, Visualization, and Project Administration. Kohei Egawa: Conceptualization, Methodology, Validation, Writing – Review & Editing, and Visualization. Shusaku Kanai: Conceptualization, Methodology, Resources, Data Curation, Writing – Review & Editing, Supervision, Project Administration.
Funding
This research received no external funding.
Institutional Review Board Statement
The study was conducted in accordance with the Declaration of Helsinki, and approved by the ethics committee of Prefectural University of Hiroshima (protocol code 20MH00 and September 10, 2020.
Informed Consent Statement
Informed consent was obtained from all subjects involved in the study.
Data Availability Statement
Data available in a publicly accessible repository.( https://doi.org/10.5281/zenodo.13151375).
Conflicts of Interest
The authors declare no conflicts of interest.
References
- Newman, P.; Witchalls, J.; Waddington, G.; Adams, R. Risk factors associated with medial tibial stress syndrome in runners: A systematic review and meta-analysis. Open Access J Sports Med 2013, 4, 229–241. [Google Scholar] [CrossRef] [PubMed]
- Pohl, M.B.; Hamill, J.; Davis, I.S. Biomechanical and anatomic factors associated with a history of plantar fasciitis in female runners. Clin J Sport Med 2009, 19, 372–376. [Google Scholar] [CrossRef] [PubMed]
- Hunt, A.E.; Smith, R.M. Mechanics and control of the flat versus normal foot during the stance phase of walking. Clin Biomech (Bristol, Avon) 2004, 19, 391–397. [Google Scholar] [CrossRef] [PubMed]
- Hösl, M.; Böhm, H.; Multerer, C.; Döderlein, L. Does excessive flatfoot deformity affect function? A comparison between symptomatic and asymptomatic flatfeet using the Oxford Foot Model. Gait Posture 2014, 39, 23–28. [Google Scholar] [CrossRef] [PubMed]
- Murley, G.S.; Menz, H.B.; Landorf, K.B. Foot posture influences the electromyographic activity of selected lower limb muscles during gait. J Foot Ankle Res 2009, 2, 35. [Google Scholar] [CrossRef] [PubMed]
- Angin, S.; Crofts, G.; Mickle, K.J.; Nester, C.J. Ultrasound evaluation of foot muscles and plantar fascia in pes planus. Gait Posture 2014, 40, 48–52. [Google Scholar] [CrossRef] [PubMed]
- Mulligan, E.P.; Cook, P.G. Effect of plantar intrinsic muscle training on medial longitudinal arch morphology and dynamic function. Man Ther 2013, 18, 425–430. [Google Scholar] [CrossRef] [PubMed]
- Zhang, X.; Aeles, J.; Vanwanseele, B. Comparison of foot muscle morphology and foot kinematics between recreational runners with normal feet and with asymptomatic over-pronated feet. Gait Posture 2017, 54, 290–294. [Google Scholar] [CrossRef] [PubMed]
- Kelly, L.A.; Cresswell, A.G.; Racinais, S.; Whiteley, R.; Lichtwark, G. Intrinsic foot muscles have the capacity to control deformation of the longitudinal arch. J R Soc Interface 2014, 11, 20131188. [Google Scholar] [CrossRef] [PubMed]
- Angin, S.; Mickle, K.J.; Nester, C.J. Contributions of foot muscles and plantar fascia morphology to foot posture. Gait Posture 2018, 61, 238–242. [Google Scholar] [CrossRef] [PubMed]
- Reshef, N.; Guelich, D.R. Medial tibial stress syndrome. Clin Sports Med 2012, 31, 273–290. [Google Scholar] [CrossRef]
- Wacker, J.; Calder, J.D.; Engstrom, C.M.; Saxby, T.S. MR morphometry of posterior tibialis muscle in adult acquired flat foot. Foot Ankle Int 2003, 24, 354–357. [Google Scholar] [CrossRef] [PubMed]
- Deng, J.; Joseph, R.; Wong, C.K. Reliability and validity of the sit-to-stand navicular drop test: Do static measures of navicular height relate to the dynamic navicular motion during gait? J Stud Phys Ther Res 2010, 2, 21–28. [Google Scholar]
- Eichelberger, P.; Blasimann, A.; Lutz, N.; Krause, F.; Baur, H. A minimal markerset for three-dimensional foot function assessment: Measuring navicular drop and drift under dynamic conditions. J Foot Ankle Res 2018, 11, 15. [Google Scholar] [CrossRef] [PubMed]
- Okamura, K.; Hasegawa, M.; Ikeda, T.; Fukuda, K.; Egawa, K.; Kanai, S. Classification of medial longitudinal arch kinematics during running and characteristics of foot muscle morphology in novice runners with pronated foot. Gait Posture 2022, 93, 20–25. [Google Scholar] [CrossRef] [PubMed]
- Crofts, G.; Angin, S.; Mickle, K.J.; Hill, S.; Nester, C.J. Reliability of ultrasound for measurement of selected foot structures. Gait Posture 2014, 39, 35–39. [Google Scholar] [CrossRef] [PubMed]
- Handsfield, G.G.; Meyer, C.H.; Hart, J.M.; Abel, M.F.; Blemker, S.S. Relationships of 35 lower limb muscles to height and body mass quantified using MRI. J Biomech 2014, 47, 631–638. [Google Scholar] [CrossRef] [PubMed]
- Okamura, K.; Kanai, S.; Oki, S.; Tanaka, S.; Hirata, N.; Sakamura, Y.; Idemoto, N.; Wada, H.; Otsuka, A. Does the weakening of intrinsic foot muscles cause the decrease of medial longitudinal arch height? J Phys Ther Sci 2017, 29, 1001–1005. [Google Scholar] [CrossRef] [PubMed]
- Kobayashi, T.; Hirota, K.; Otsuki, R.; Onodera, J.; Kodesho, T.; Taniguchi, K. Morphological and mechanical characteristics of the intrinsic and extrinsic foot muscles under loading in individuals with flat feet. Gait Posture 2024, 108, 15–21. [Google Scholar] [CrossRef] [PubMed]
Disclaimer/Publisher’s Note: The statements, opinions and data contained in all publications are solely those of the individual author(s) and contributor(s) and not of MDPI and/or the editor(s). MDPI and/or the editor(s) disclaim responsibility for any injury to people or property resulting from any ideas, methods, instructions or products referred to in the content. |
© 2024 by the authors. Licensee MDPI, Basel, Switzerland. This article is an open access article distributed under the terms and conditions of the Creative Commons Attribution (CC BY) license (http://creativecommons.org/licenses/by/4.0/).
Copyright: This open access article is published under a Creative Commons CC BY 4.0 license, which permit the free download, distribution, and reuse, provided that the author and preprint are cited in any reuse.


