4.2. Conflict Probability Detection Based on Ship Encounter Scenarios
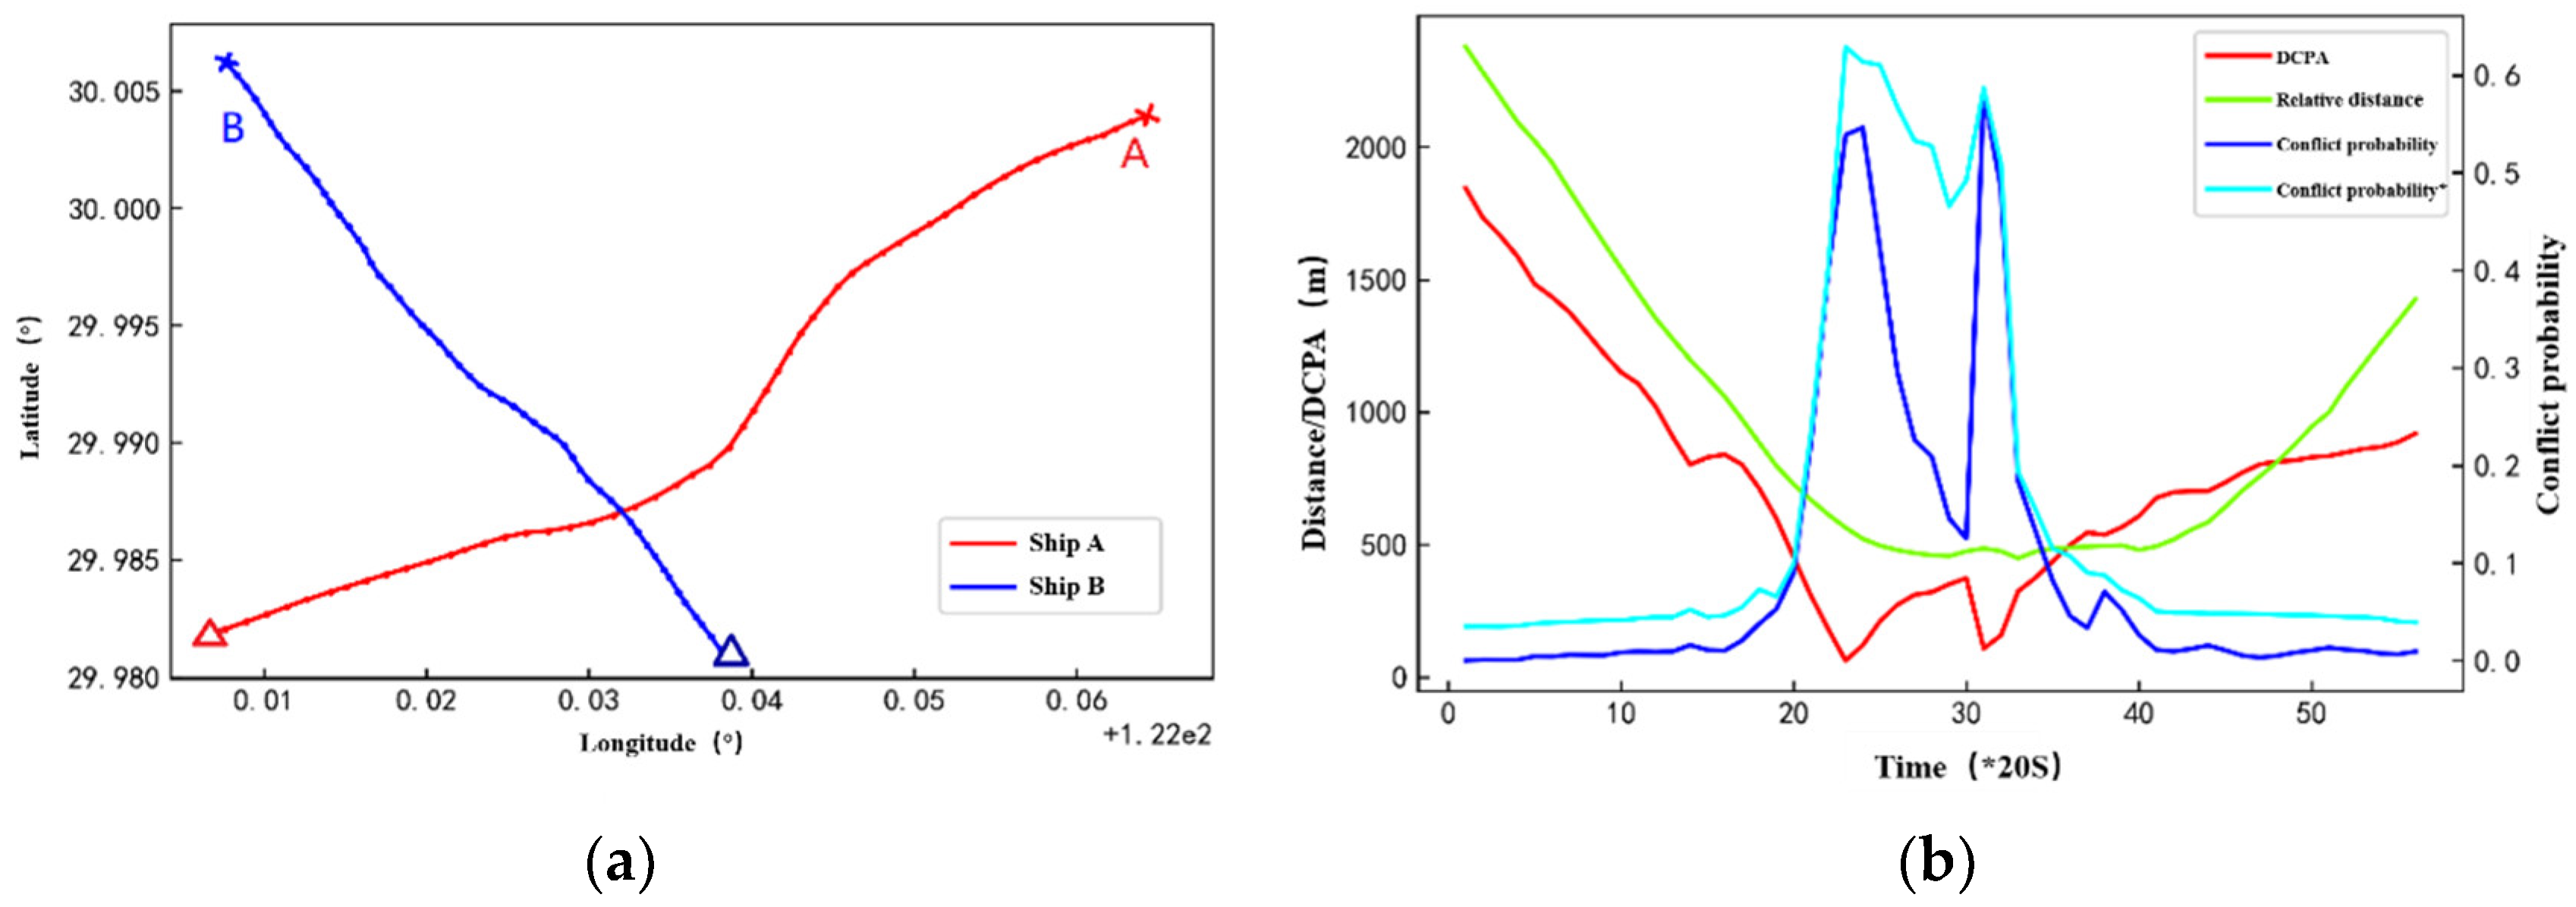
To test the performance of the proposed approach under the condition that the encountering ships have changeable spatiotemporal motion behaviors, a ship-pair encounter scenario derived from the historical data is presented (see
Figure 10). The lines in
Figure 10 are the trajectories of the ship-pair involved in the encounter, where “x” marks the ships starting locations and “△” are their final locations. It can be seen that one ship basically sails linearly, while another one has a turning behavior during the encounter. The data of the ships at corresponding times are input into the conflict probability calculation model to obtain the ship conflict analysis diagram, as shown in
Figure 10 (b).
Figure 10 (b) shows the change of the conflict probability with and without considering the turning point in the encounter scenario (where the conflict probability * curve is the conflict probability detection result obtained based on the method proposed in this paper). Due to the turning behavior of ship A, DCPA has two troughs during the encounter.
Figure 10 (b) shows that without considering the turning point, the conflict probability value fluctuates greatly with the change of DCPA, which may confuse the marine navigator when identifying the collision risk. Obviously, conflict identification without considering the turning point becomes invalid in this encounter scenario. This is because DCPA assumes that the ship sails linearly without changing its heading and speed. Therefore, traditional collision risk assessment methods based on DCPA may provide false alarms, hindering their application in highly dynamic traffic environments. The conflict probability detection method proposed in this paper can take into account the dynamics and uncertainty of ship motion, thereby providing accurate and timely collision warnings.
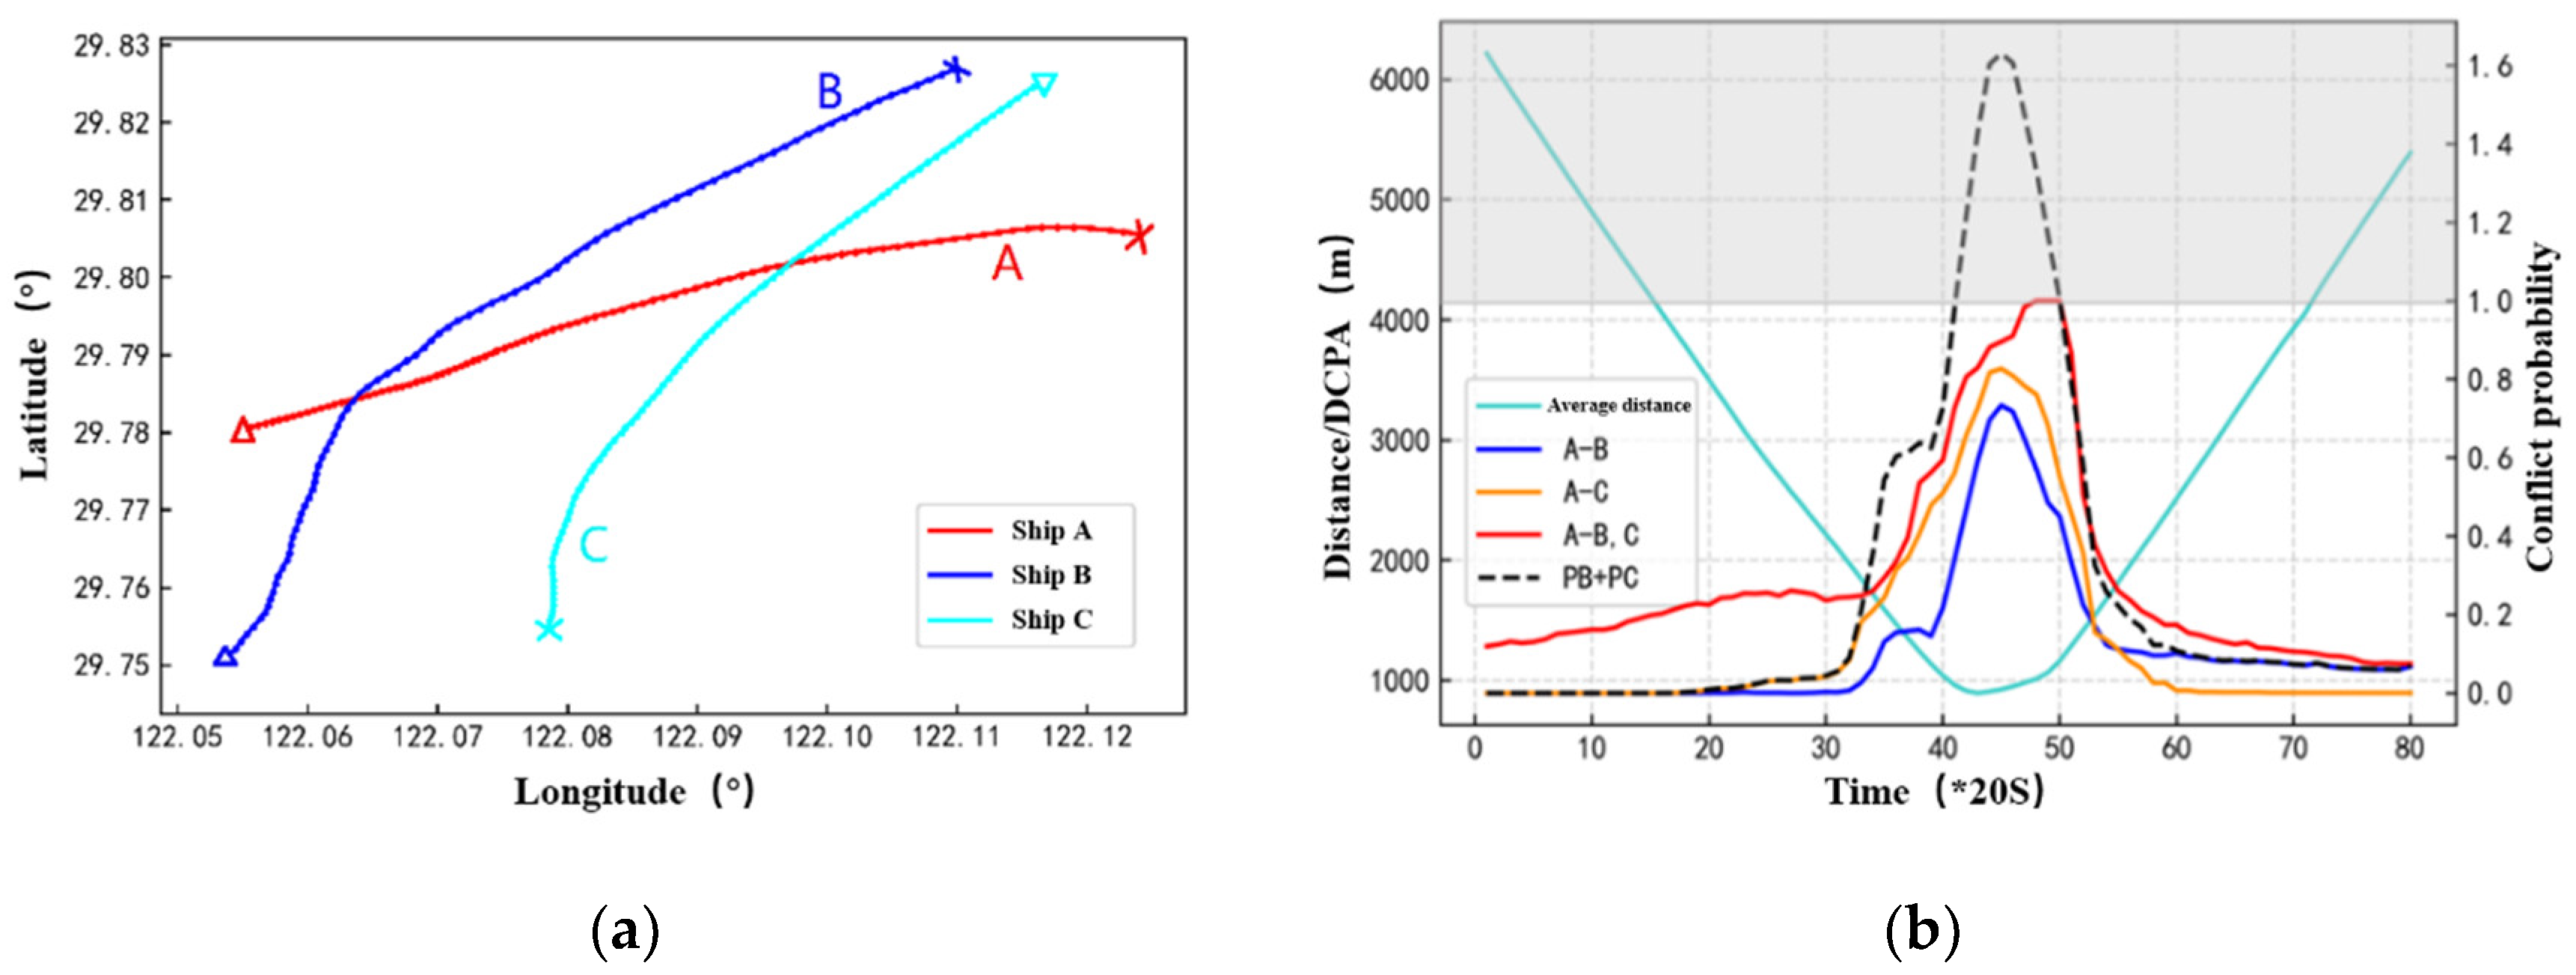
In order to further verify the effectiveness of the proposed conflict probability detection method in multi-ships encounter scenario, a three-ship encounter scenario extracted from real AIS data was selected for experiment. The ship navigation trajectory is shown in
Figure 11 (a). This paper measures the distance between multiple ships using the average ship spacing, as shown below:
Where
is the distance between ship
and ship
. The change of conflict probability and average distance over time in the multi-ships encounter scenario is shown in
Figure 11 (b). The red curve is the total
value of ship A and the other two ships in the multi-ship encounter scenario, and the blue curve and orange curve represent the conflict probability values
,
of ship A and ship B, ship A and ship C, respectively. The dotted line is the sum. It can be observed that the total value
is higher than that of any single target ship. This finding is consistent with the general understanding of collision risk, that is, ships participating in multi-ships encounter usually face greater risks than two-ship encounter. It can be seen from
Figure 11 (b) that the average distance between ships is negatively correlated with the conflict probability. In addition, by comparing the red curve and the black dotted line, it is found that the total value
of ship A with ships B and ship C is not the sum of its and each target ship. Therefore, the proposed conflict probability detection method can not only detect the conflict probability of the ship when multiple ships encounter, but also provide the probability of occurrence of multi-ship conflicts.
The conflict probability provides a criticality measure that can be used to distinguish between conflicts that can be ignored (below the conflict probability detection standard threshold) and conflicts that need to be avoided (above the conflict detection standard threshold). In addition, the conflict probability can also be used to determine the priority of conflict resolution.
4.3. Ship Grouping Experiment
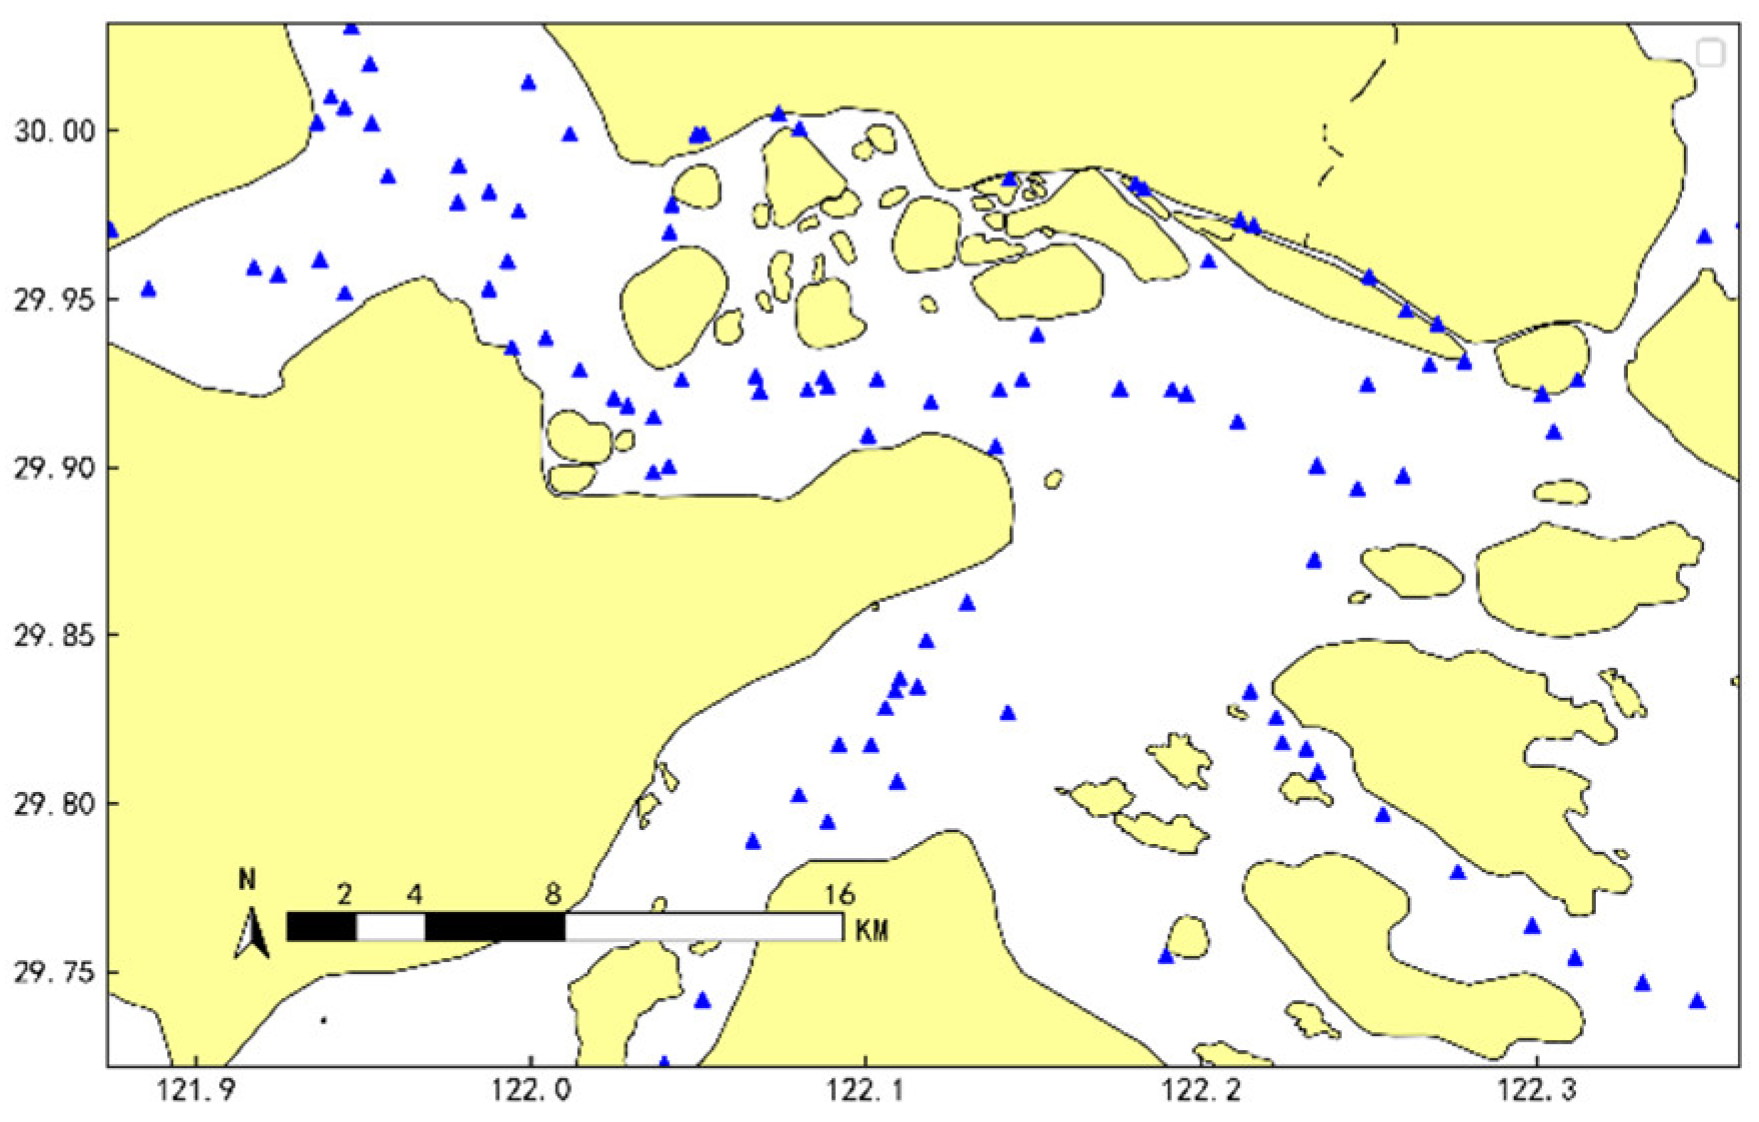
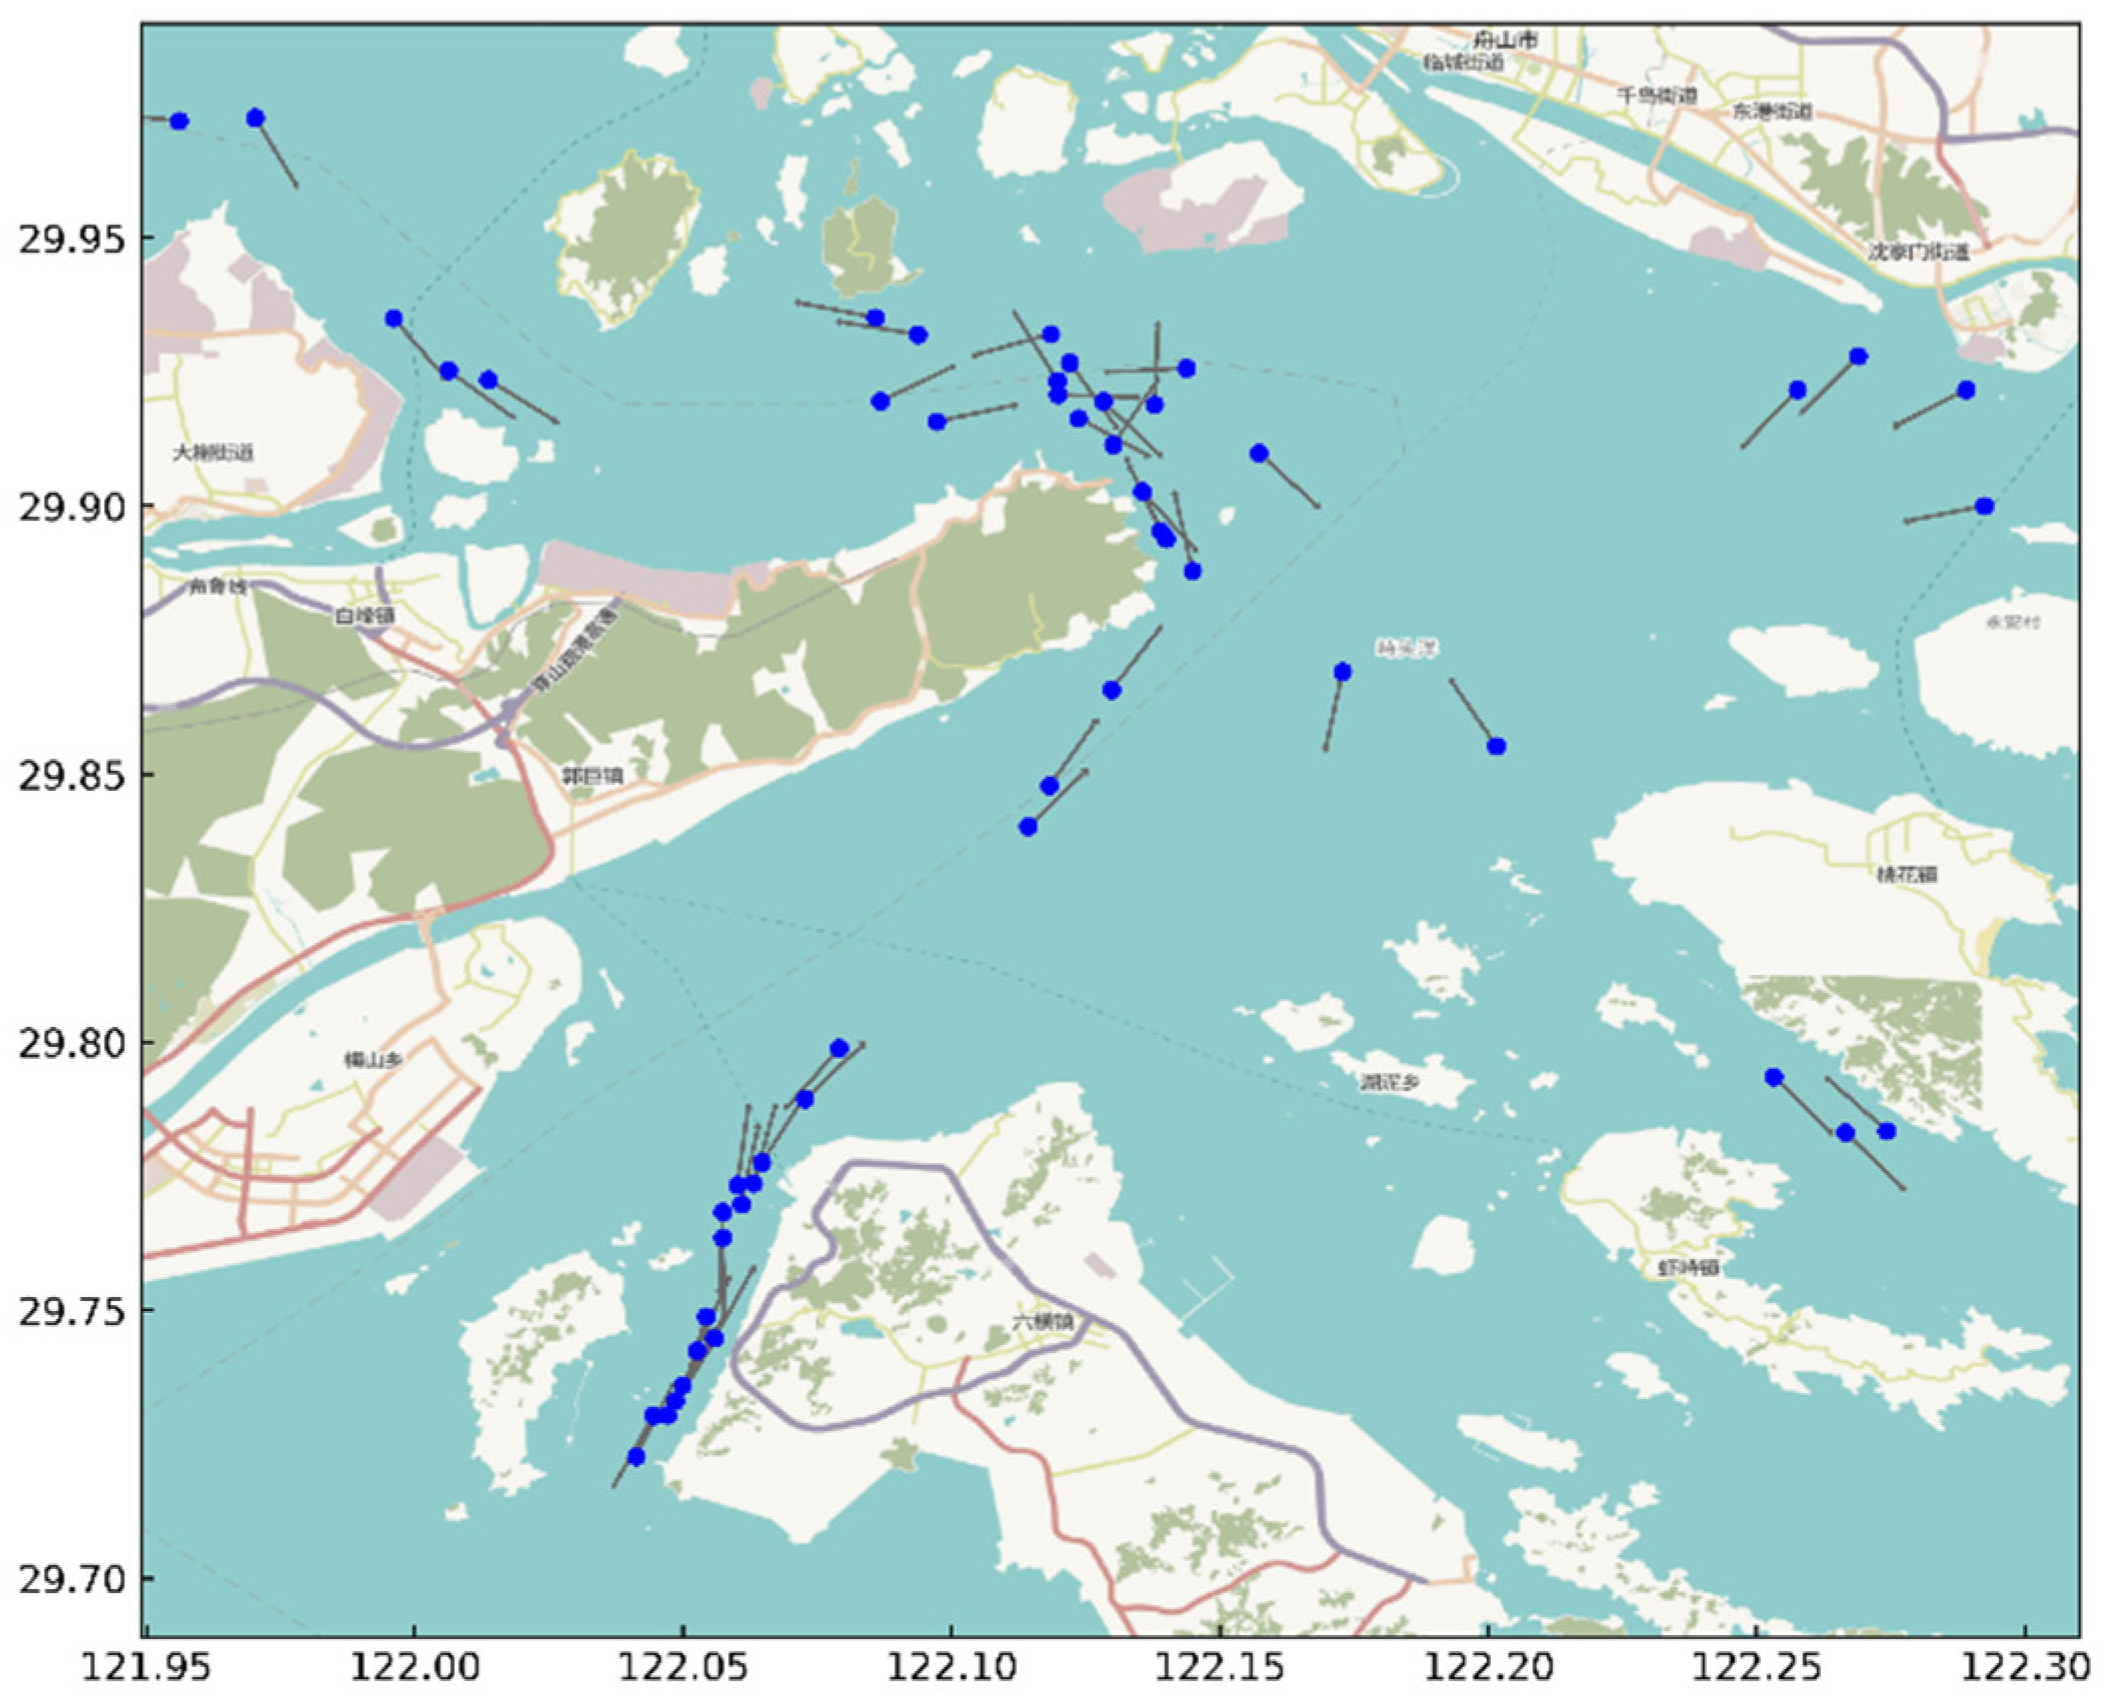
The ships in the research waters at a certain moment (as shown in
Figure 12) were grouped using the FMO, SC and FMOASC algorithms, and a comparative experiment was conducted using modularity and the number of noise points as grouping indicators. FMOASC was used as the experimental group, and FMO and SC were used as the control group. The results are shown in
Figure 13.
As can be seen from
Figure 13 (a), in terms of modularity index, the results of FMO and SC algorithms are quite different, especially when the number of groups is small. Overall, the modularity of SC is also lower than that of FMO. The FMOASC algorithm proposed in this paper combines the advantages of both FMO and SC algorithms, so the modularity of the FMOASC algorithm can be maintained at a high level. From the curve corresponding to the FMOASC algorithm, it can be seen that since the algorithm comprehensively considers the topological connection relationship and spatial characteristics of ship conflicts, as the number of groups decreases, the modularity of the FMOASC algorithm decreases significantly slower than that of the SC algorithm, indicating that the loss value of the modularity of the algorithm will not be large when the number of groups is small. The modularity value of FMOASC becomes closer and closer to that of FMO as the number of groups increases, until it almost completely overlaps. Therefore, the modularity of the grouping results obtained by the FMOASC algorithm proposed in this paper is high, which can achieve the effect of division with close connections within the group and sparse connections between groups.
It can be seen from
Figure 13 (b) that the number of noise points of the SC algorithm is significantly lower than that of the FMO, while the number of noise points obtained by the FMOASC algorithm proposed in this paper is very close to that of the SC algorithm. As the number of groups increases, especially when the number of groups is 10 or more, the noise point number curves of FMOASC and SC almost overlap, so the number of noise points obtained by FMOASC is small. FMOASC combines the FMO and SC algorithms to divide the ship groups. The algorithm integrates the advantages of the two algorithms, which can not only maintain a high modularity, but also minimize the number of noise points, and has a balanced performance in modularity and the number of noise points.
Figure 14 shows the comprehensive evaluation index values of different grouping schemes when the ships in the study area (shown in
Figure 3-13) are divided into ship groups using the FMOASC algorithm. By analyzing
Figure 14, it can be found that the highest comprehensive evaluation value (I=0.5828) is the division scheme with 10 ship groups, so this division scheme is adopted. The ship group division results obtained by the three algorithms are shown in
Figure 15.
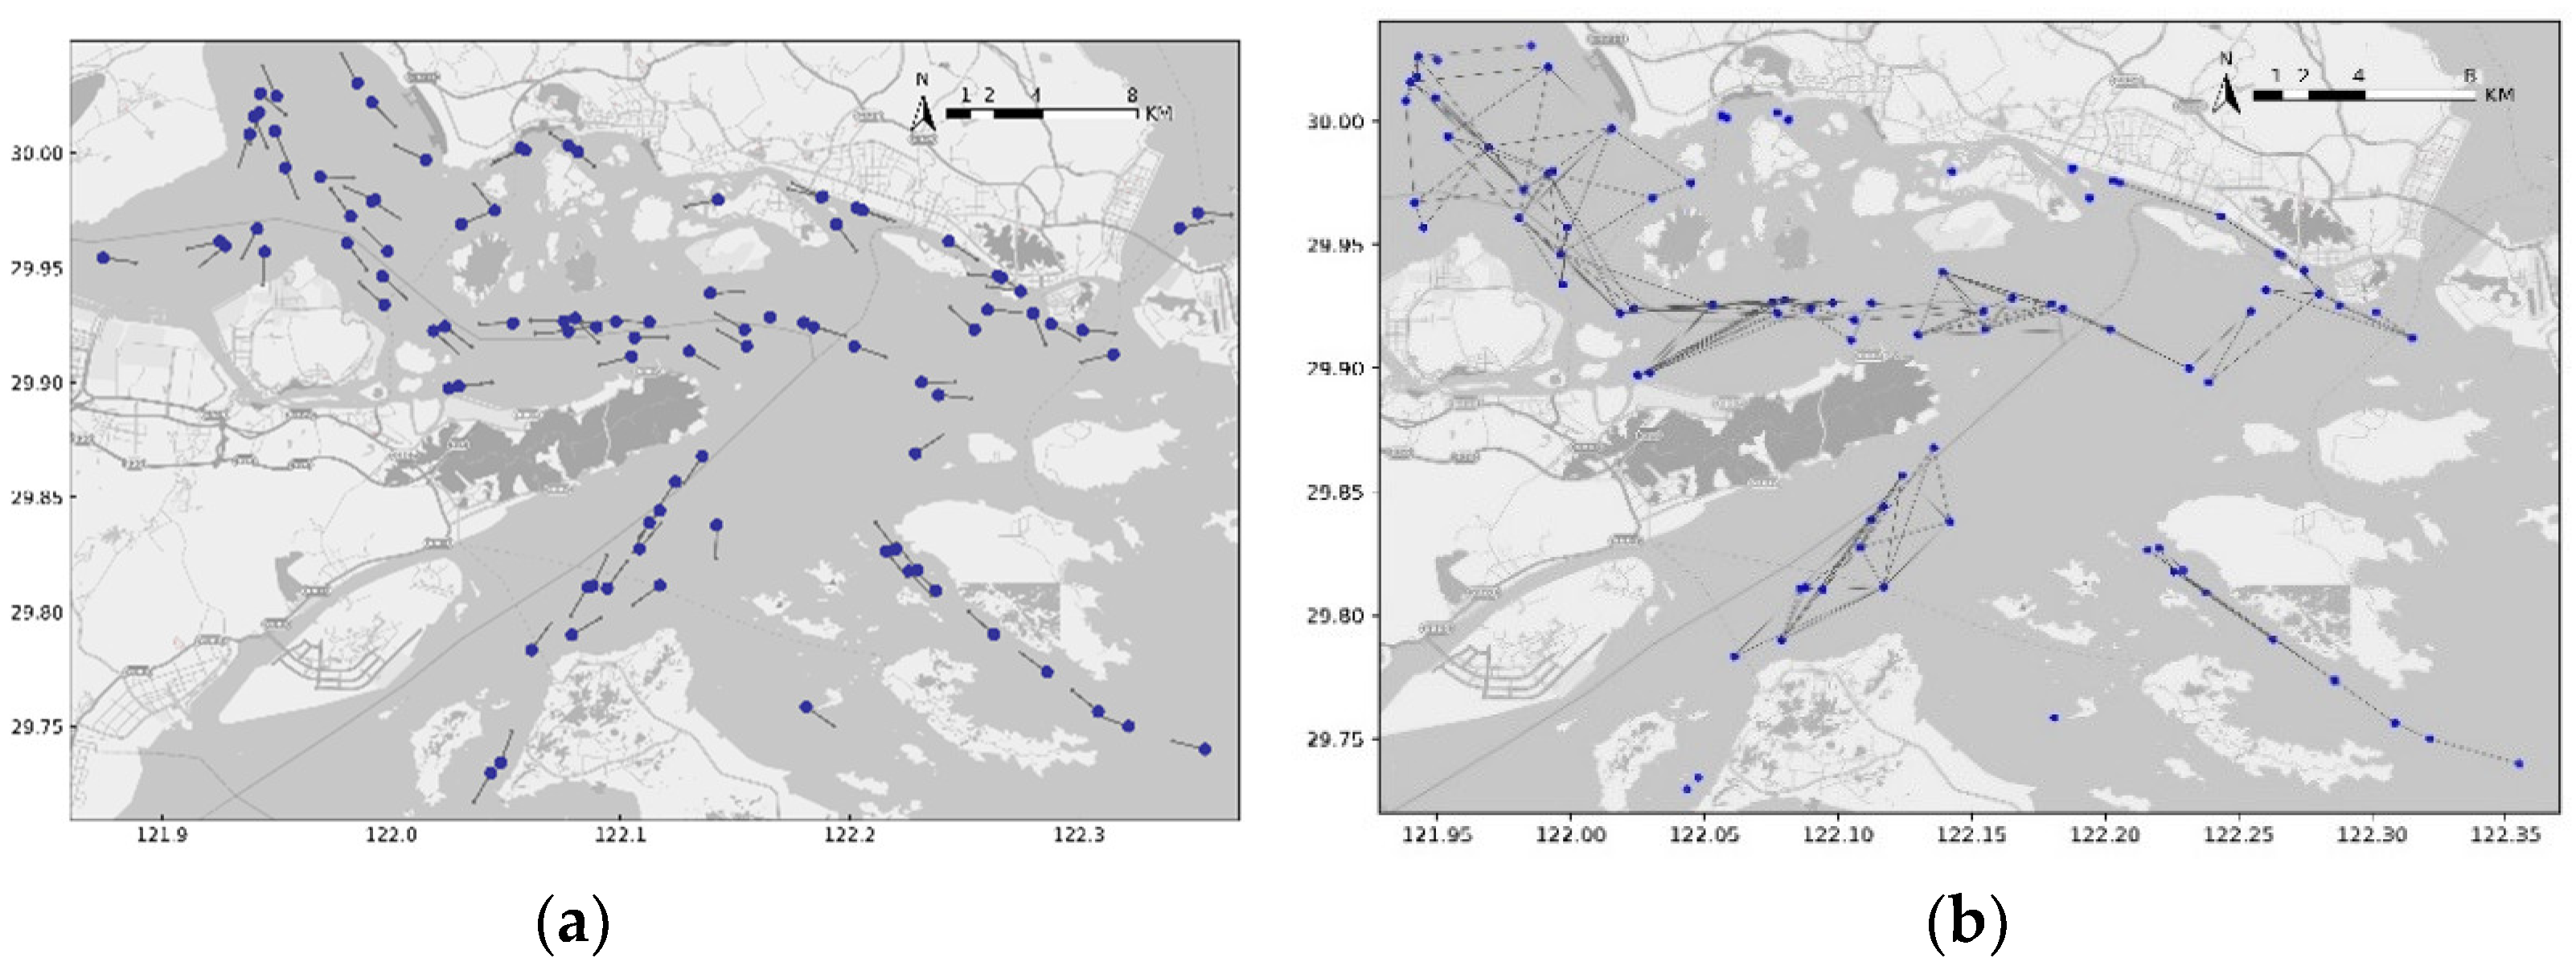
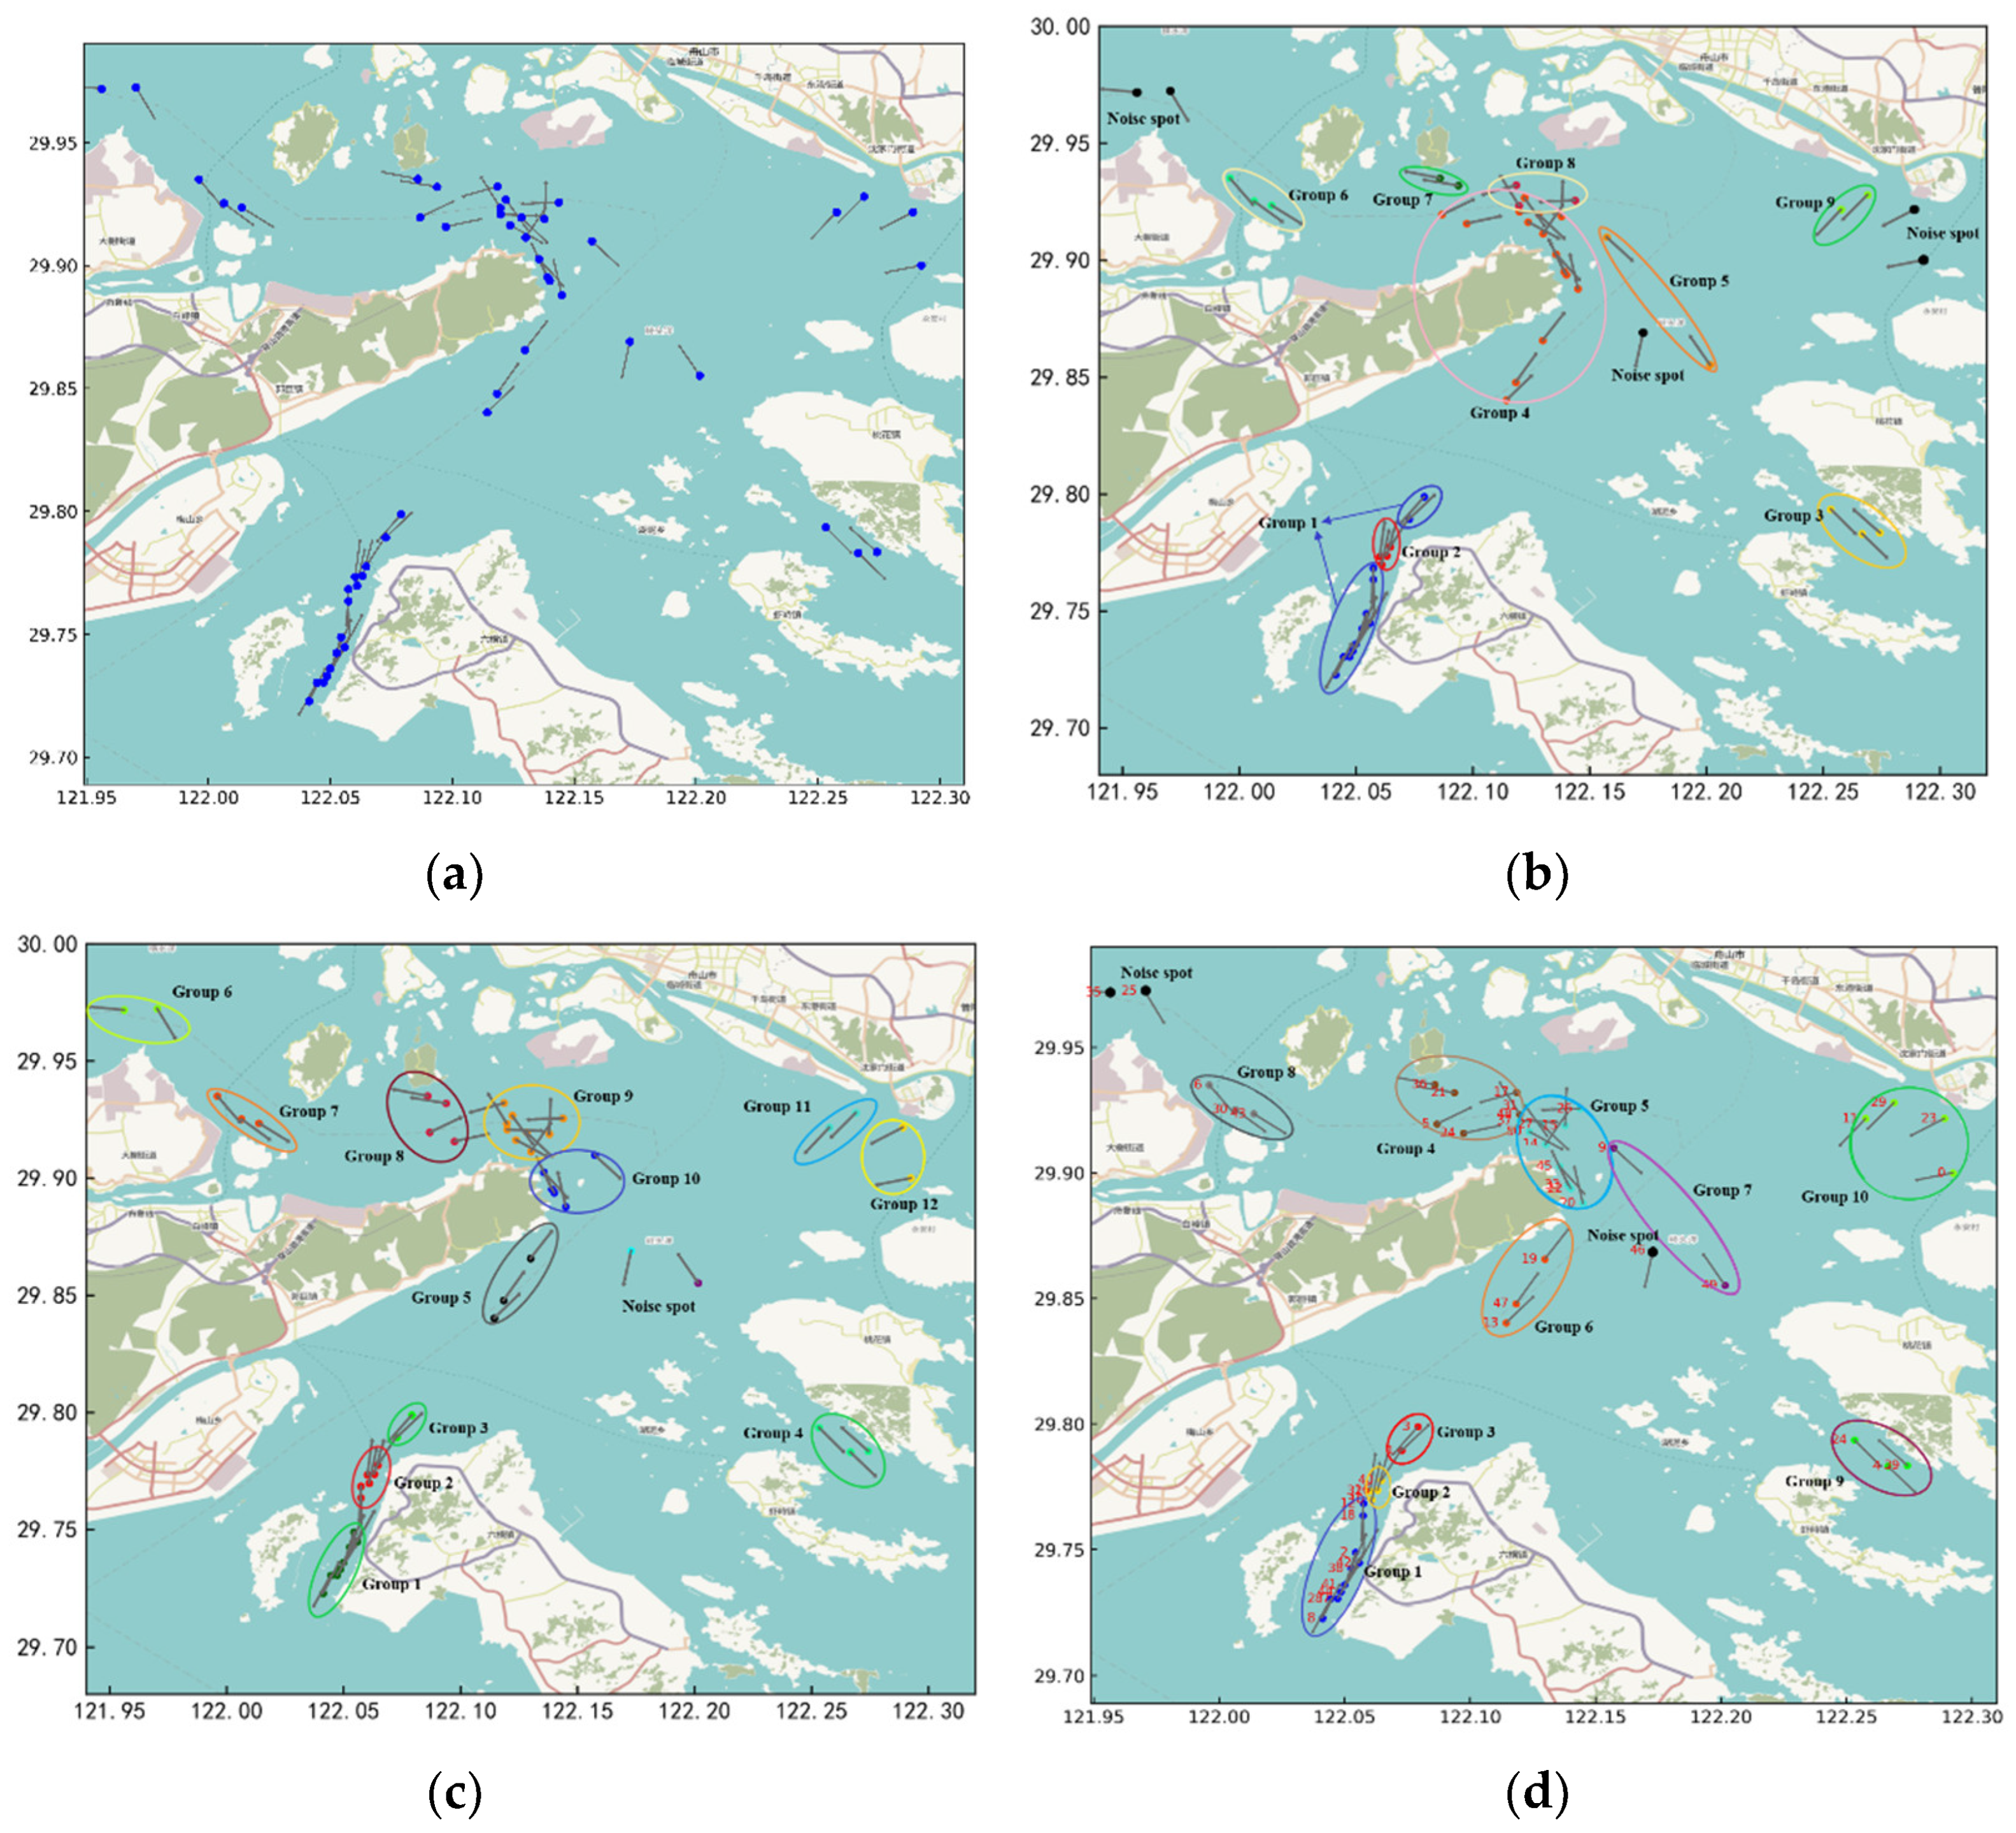
Figure 15 (a) shows the position distribution and heading of ships in the research waters at a certain moment. The ellipses in
Figure 15 (b), (c), and (d) represent different groups. As can be seen from
Figure 15 (b), Group 4 spans the spatial distance. This is because FMO only considers the conflict relationship between ships and does not consider the spatial position of ships. Considering only the current conflict relationship has another disadvantage. Some ships do not have a conflict relationship currently, but they have a tendency to approach each other and should be put in one group for comprehensive consideration. The advantage is that the FMO algorithm can divide ships that are close in spatial distance but have a tendency to move away from each other (no conflict relationship) into different groups.
By observing the results of the SC algorithm, we can find two types of situations that do not meet the principles of group division proposed in this paper. The first type: the distance between ships is close but they are already in a state of leaving each other and do not pose a risk. The SC algorithm will classify such ships into a group. It is not meaningful to manage such ships as a group; the second type: there is a conflict relationship between ships, but the ships that are far apart at the moment are not classified into a group. Such ships should be classified into a group for management, so as to timely discover the risks of ship navigation. These two types of divisions occur because the SC algorithm only uses the spatial distance between ships as the edge weight and constructs a similarity matrix to divide ships into groups. The FMOASC algorithm proposed in this paper divides ship groups by comprehensively considering the conflict connection relationship and spatial position between ships. On the basis of considering the conflict connection relationship, the spatial position of the ship is considered, so that a more ideal group division result can be obtained from the perspective of water navigation management.
4.4. Quantifying Risks in Different Local Waters
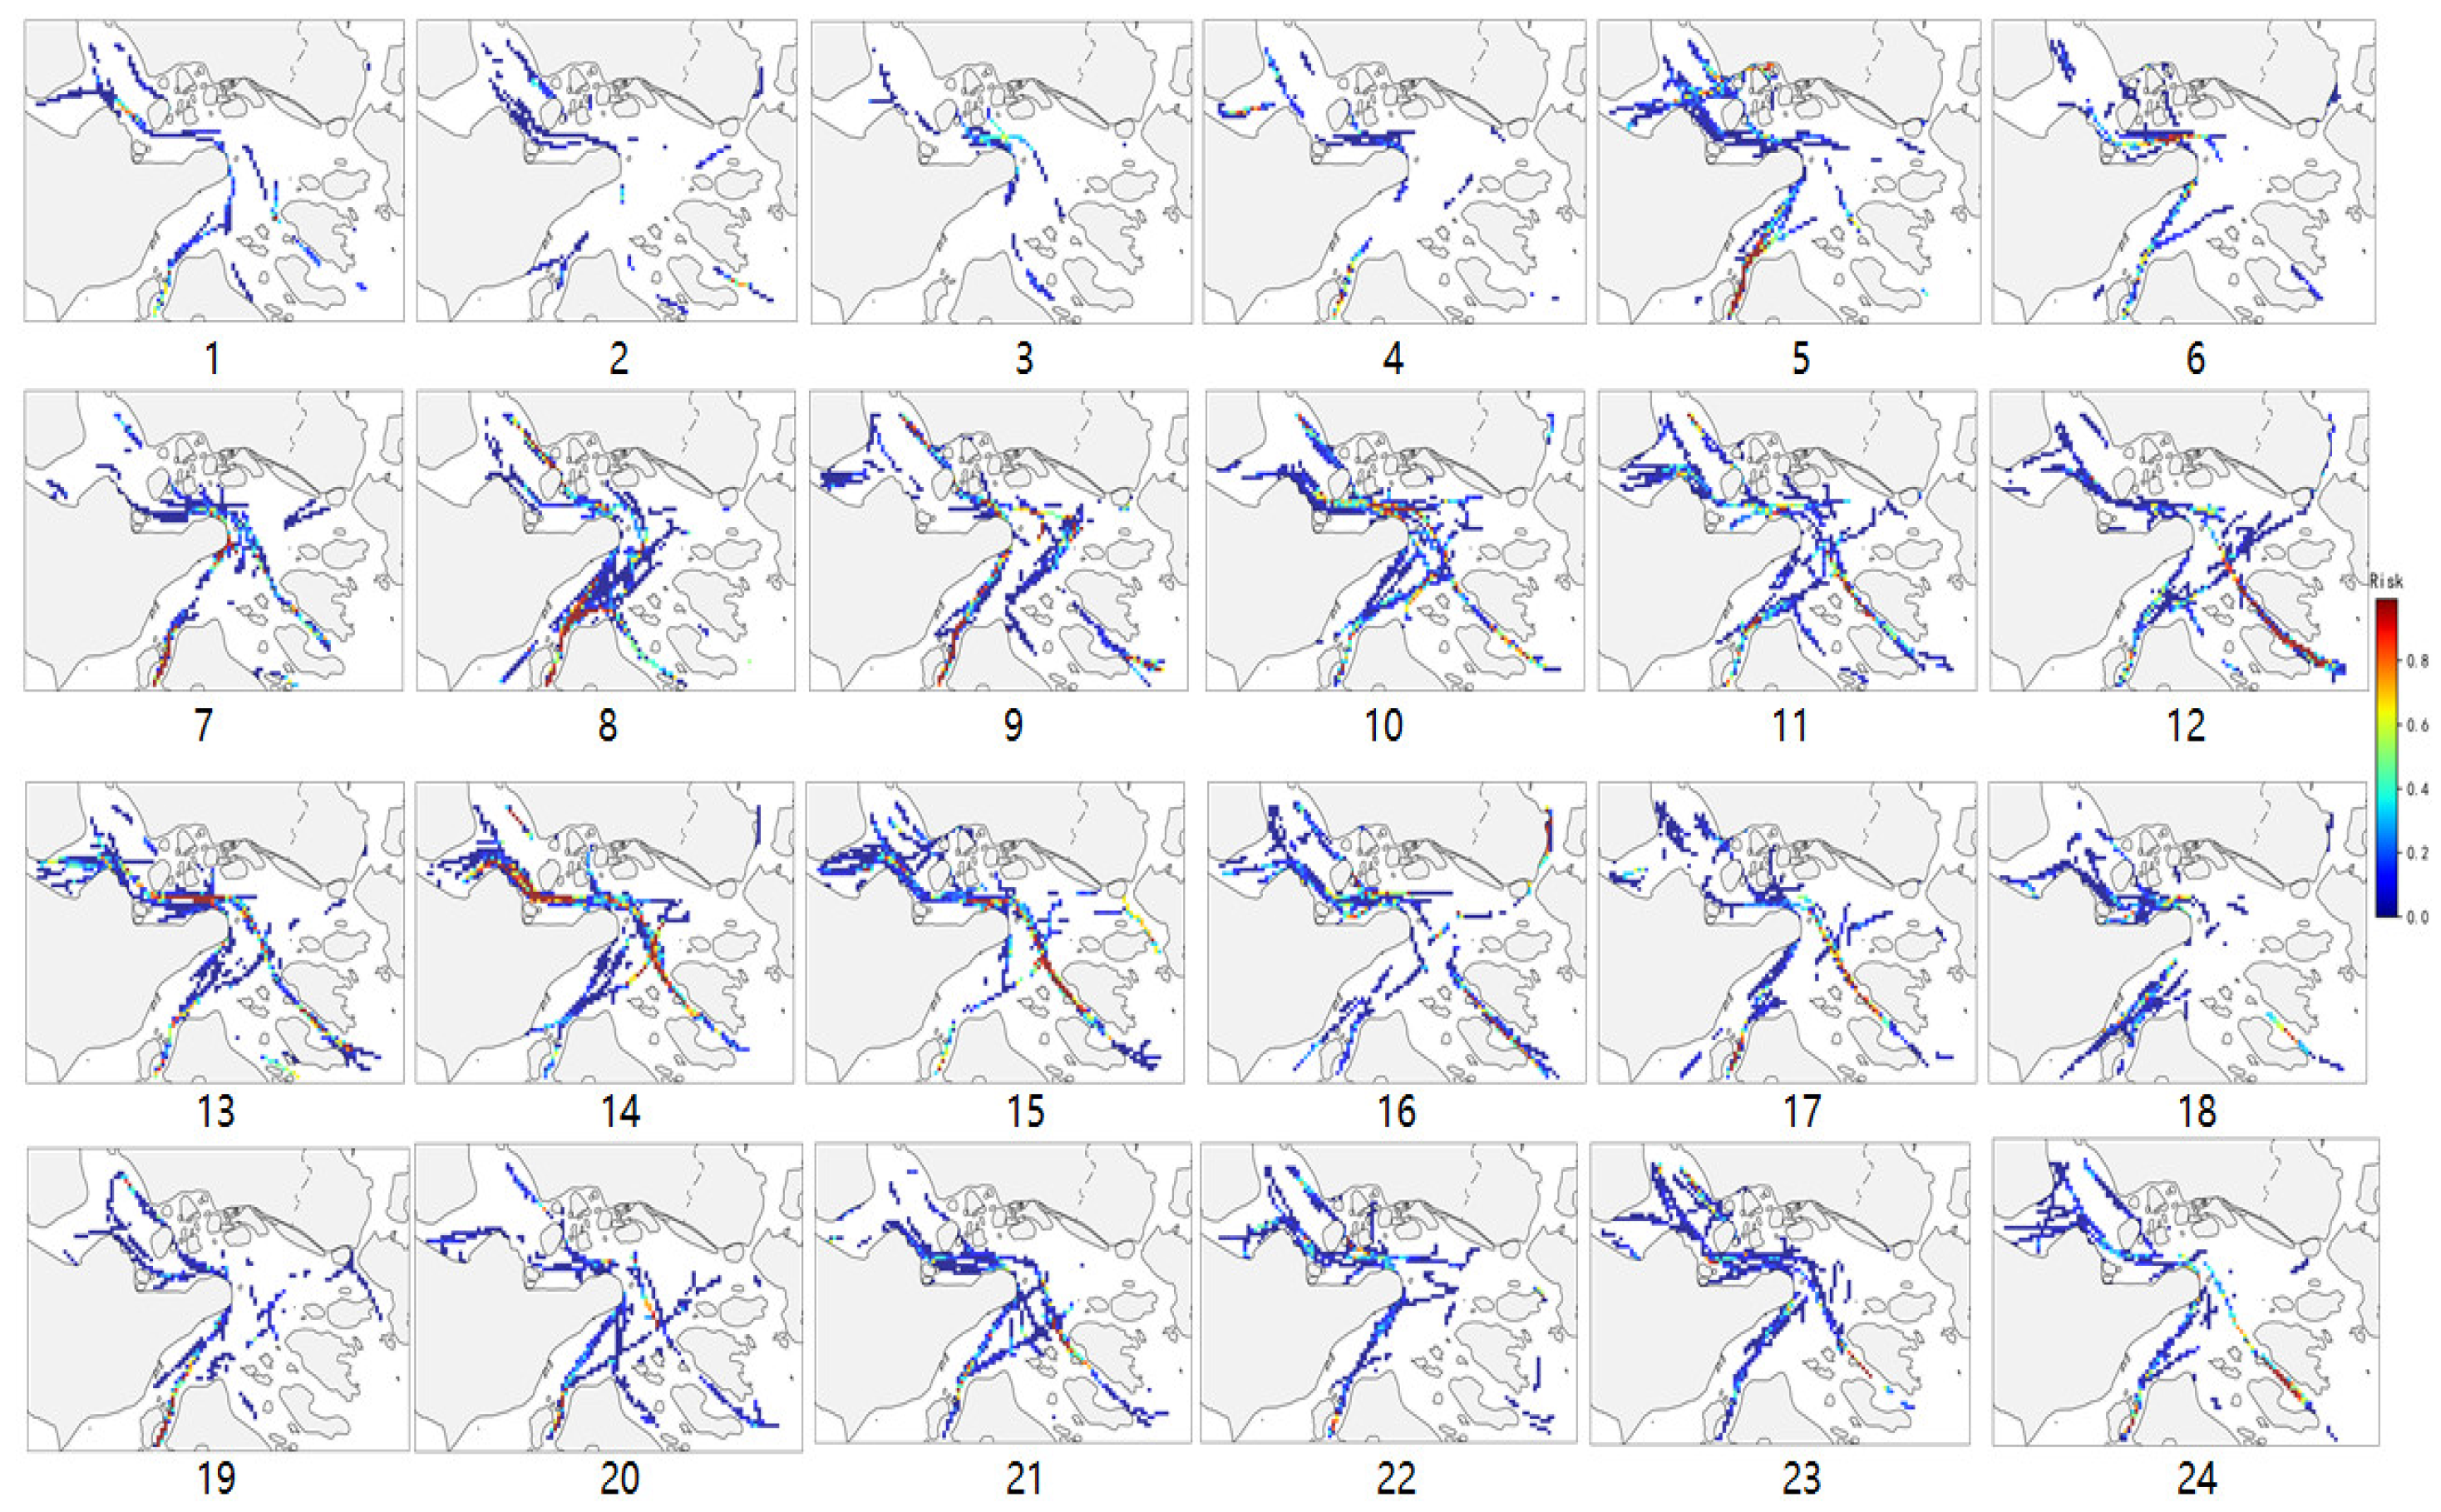
Using 7,680,496 AIS data from the study area for one month, conflict data was calculated. The conflict distribution visualization diagram for each hour is shown in
Figure 16. The numbers under each sub-figure in the figure represent 24 time periods, such as “1” represents the conflict distribution during the 00:00-01:00 time period. As shown in sub-figures 16 (1)-(4), the number of ship conflicts during the 00:00-04:00 time period is relatively small; in
Figures 16 (5)-(15), the conflict distribution area is wider and is roughly distributed in the Fudu Waterway, Luotou Waterway, and Xiazhimen Channel. Among them, the frequency of ship conflicts in Luotou Waterway and Xiazhimen Channel is higher. The reason for the higher frequency of conflicts in Luotou Waterway is that ship traffic from other directions converges in this water area, increasing the frequency of multiple ship encounters. In addition, ship turning due to terrain geometric constraints in this water area may also be one of the reasons for this result. In fact, Luotou Waterway is an official warning area issued by the Ningbo-Zhoushan VTS Center, which to some extent verifies the effectiveness of the conflict probability detection method proposed in this paper in identifying high collision risk areas. Xiazhimen Channel is the main channel for large ships to enter and leave the port, but the navigation width is narrow, so it becomes one of the areas with high collision risk. One possible reason for the high frequency of ship conflicts in Fudu Waterway is that the traffic width in this water area is narrow, resulting in a reduction in the minimum passing distance between encountering ships, so, many high-severity conflicts occur. The degree and distribution range of ship conflicts are expanding in the time period of 20:00-24:00, which may be due to the increase in the number of ship conflicts caused by reduced visibility at night.
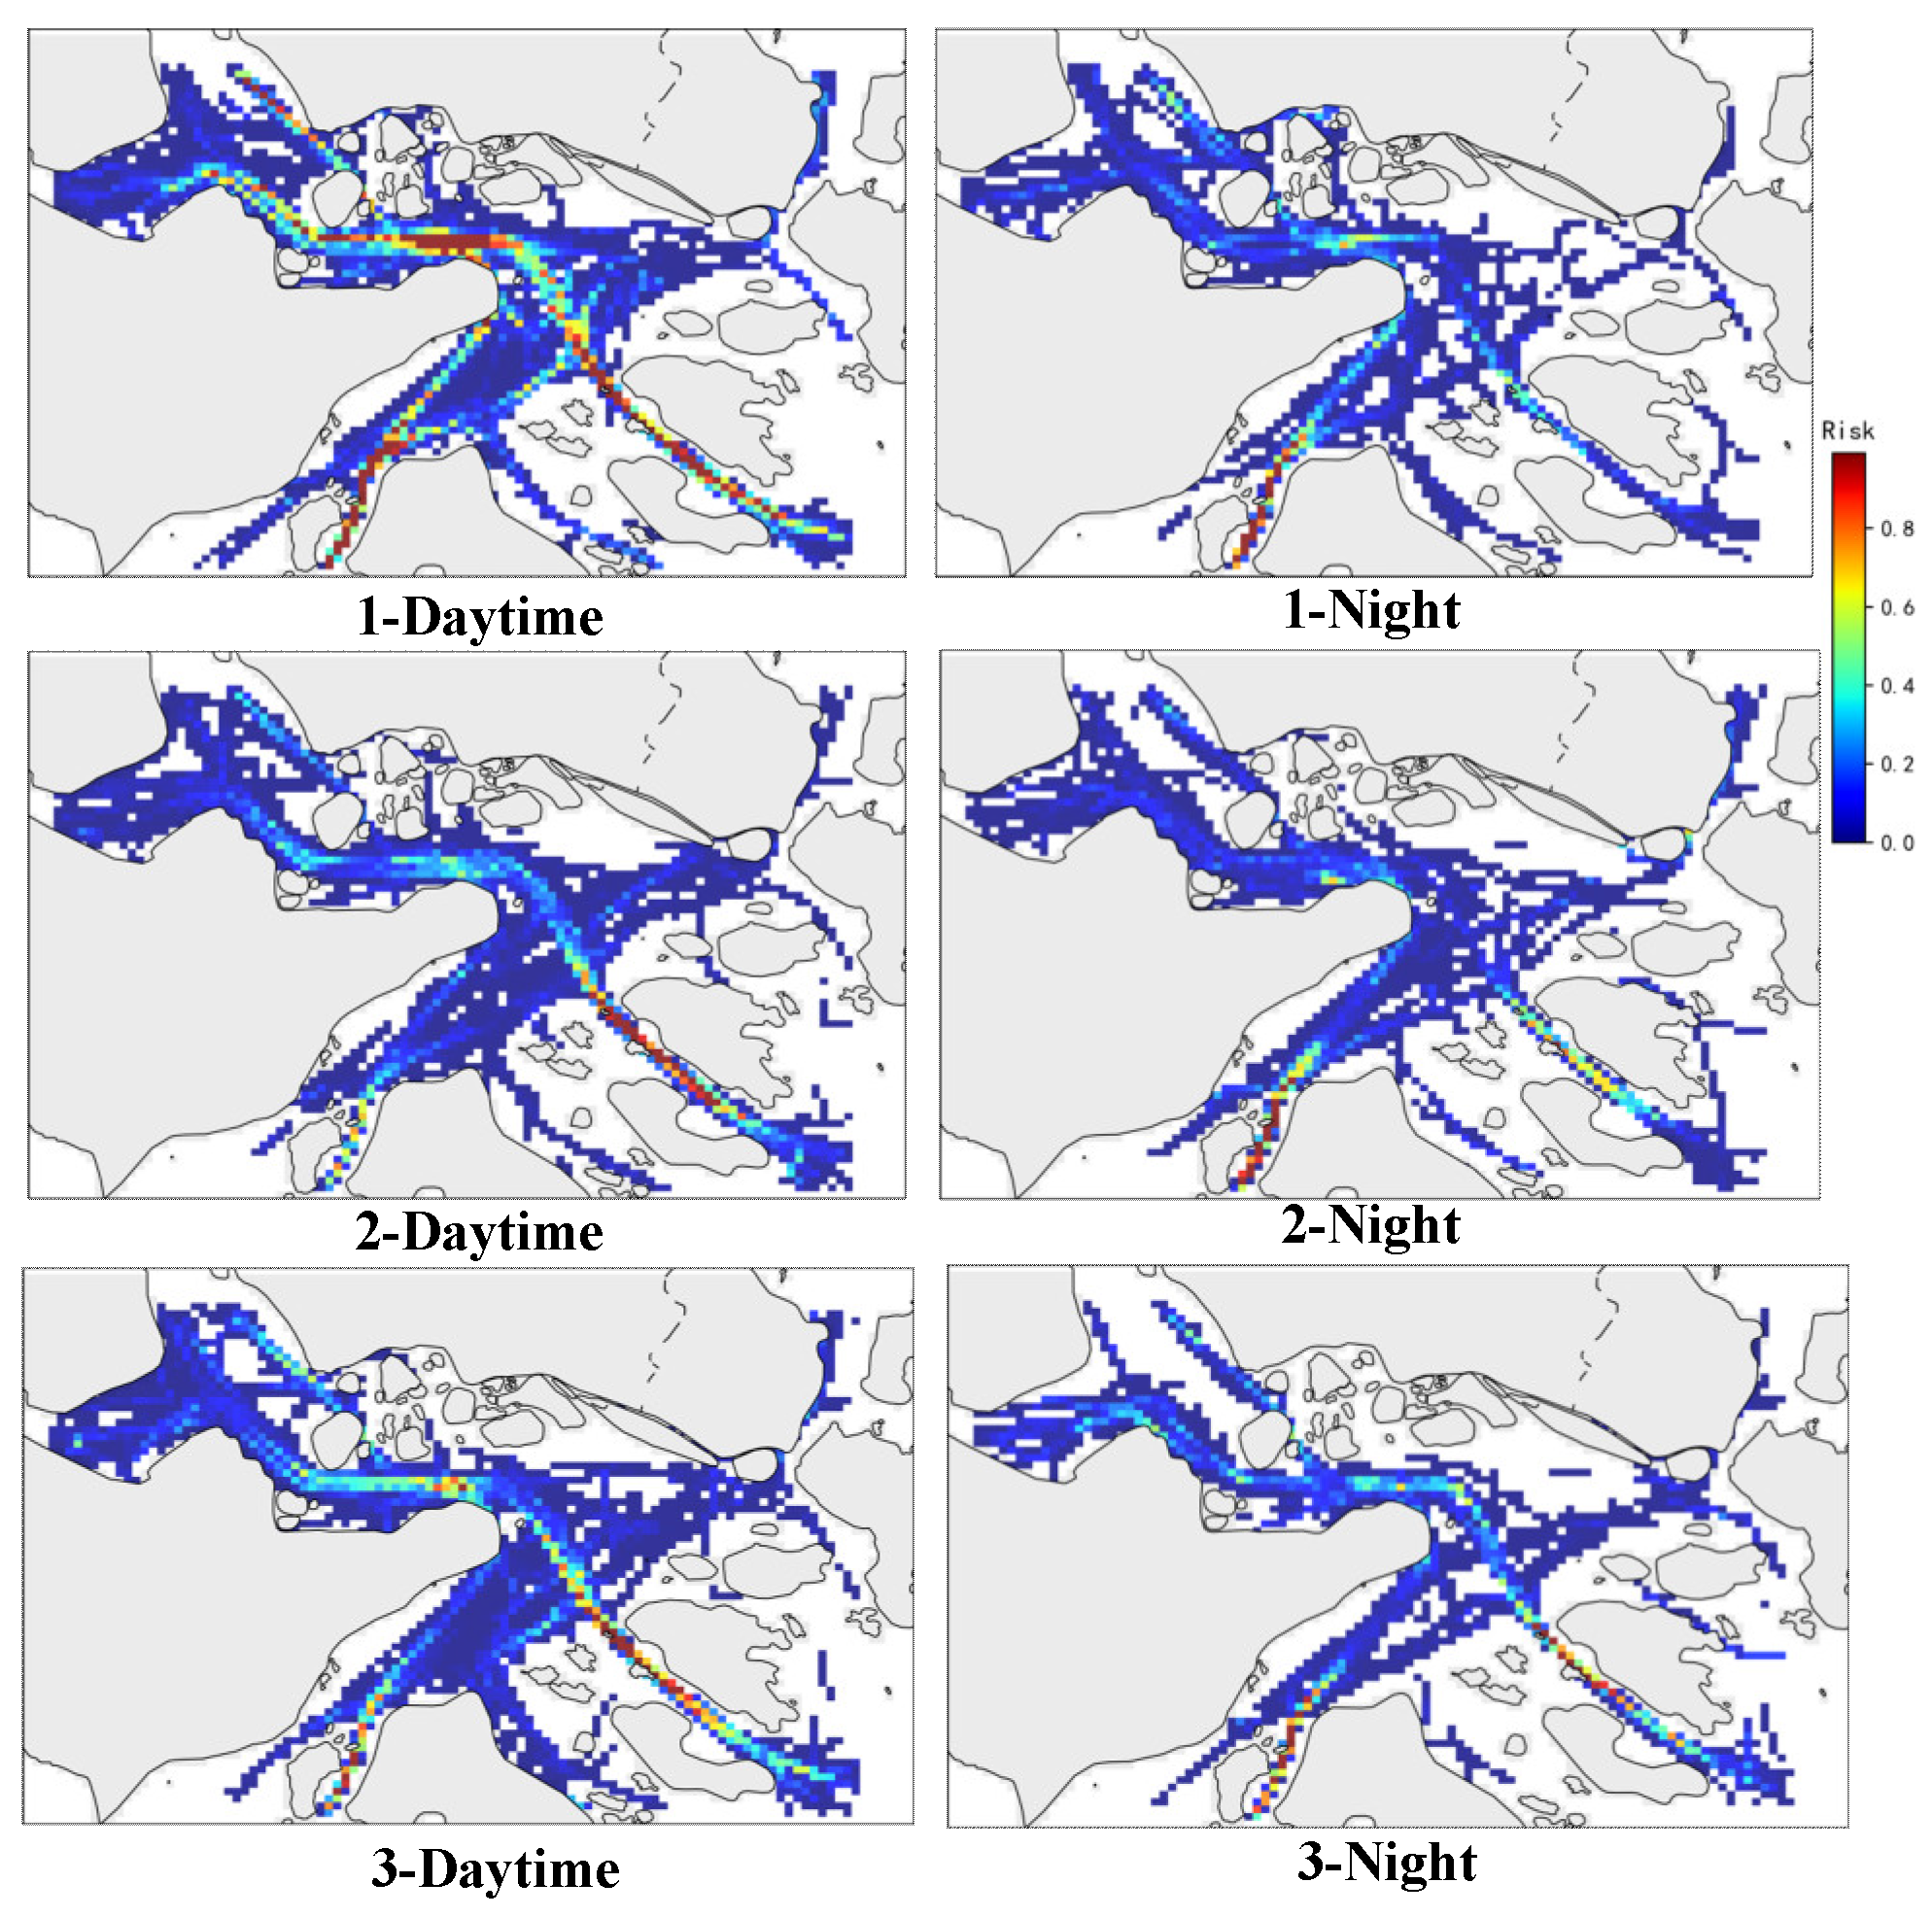
The distribution of ship conflicts during the day and at night is explored, that is, the ship conflicts in the time periods of 06:00-18:00 and 18:00-06:00 are counted, and two conflict distribution images are generated every 10 days, as shown in
Figure 17, where “Daytime” in the sub-image represents the conflict distribution in the time period of 06:00-18:00, and “Night” represents the conflict distribution image in the time period of 18:00-06:00. As can be seen from the figure, the degree of conflict is more severe during the day than at night, the number of conflicts is larger, and the high-risk areas are concentrated in the waters of the intersection of Luotou Waterway and Zhitouyang, Fodu Waterway, Xiazhimen Channel, and the southern part of Damao Island. Among them, the waters south of Damao Island are the main roads connecting the port hub with offshore ship traffic. It is the area with the highest ship traffic density and the highest frequency of ship encounters in the port; the intersection of Luotou Waterway and Zhitouyang waters, and the intersection of Xiazhimen Channel and Zhitouyang waters are both navigation warning areas officially established by the maritime department, which verifies the accuracy and effectiveness of this article’s conflict research at the micro-time and space scale.
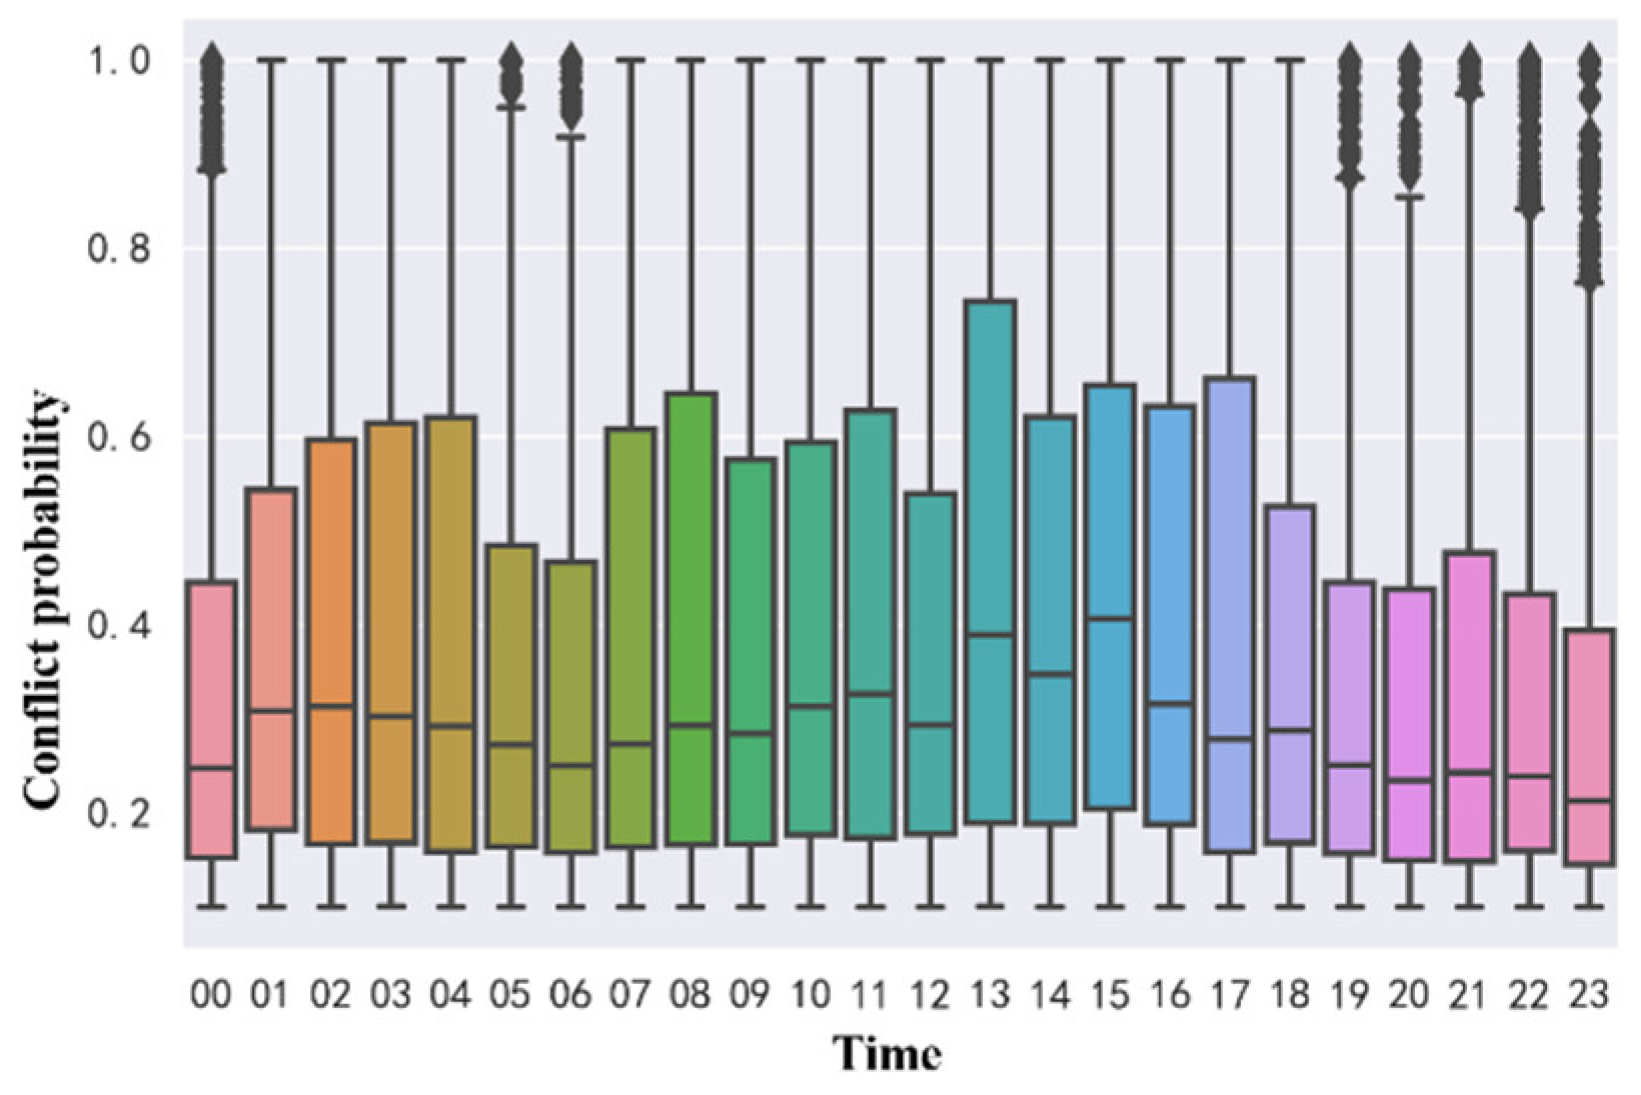
Figure 18 shows the characteristics of the distribution of the hourly conflict probability values in the study waters. It can be observed that the median conflict probability fluctuates slightly over time. In the 11:00-15:00 time period, the median of conflicts between ships is larger than that in other time periods. The possible reason is that the ship traffic volume in this time period is large and the possibility of dangerous encounters between ships is high. The maximum conflict probability is basically maintained at 1, which means that ship encounters with high conflict severity will occur in every time period. VTS centers can use indicators such as median and maximum values to more comprehensively understand the real-time collision risks and traffic complexity in the region, thereby improving their ability to deal with dangerous encounters caused by high traffic intensity.
Figure 18.
Time distribution of conflict.
Figure 18.
Time distribution of conflict.
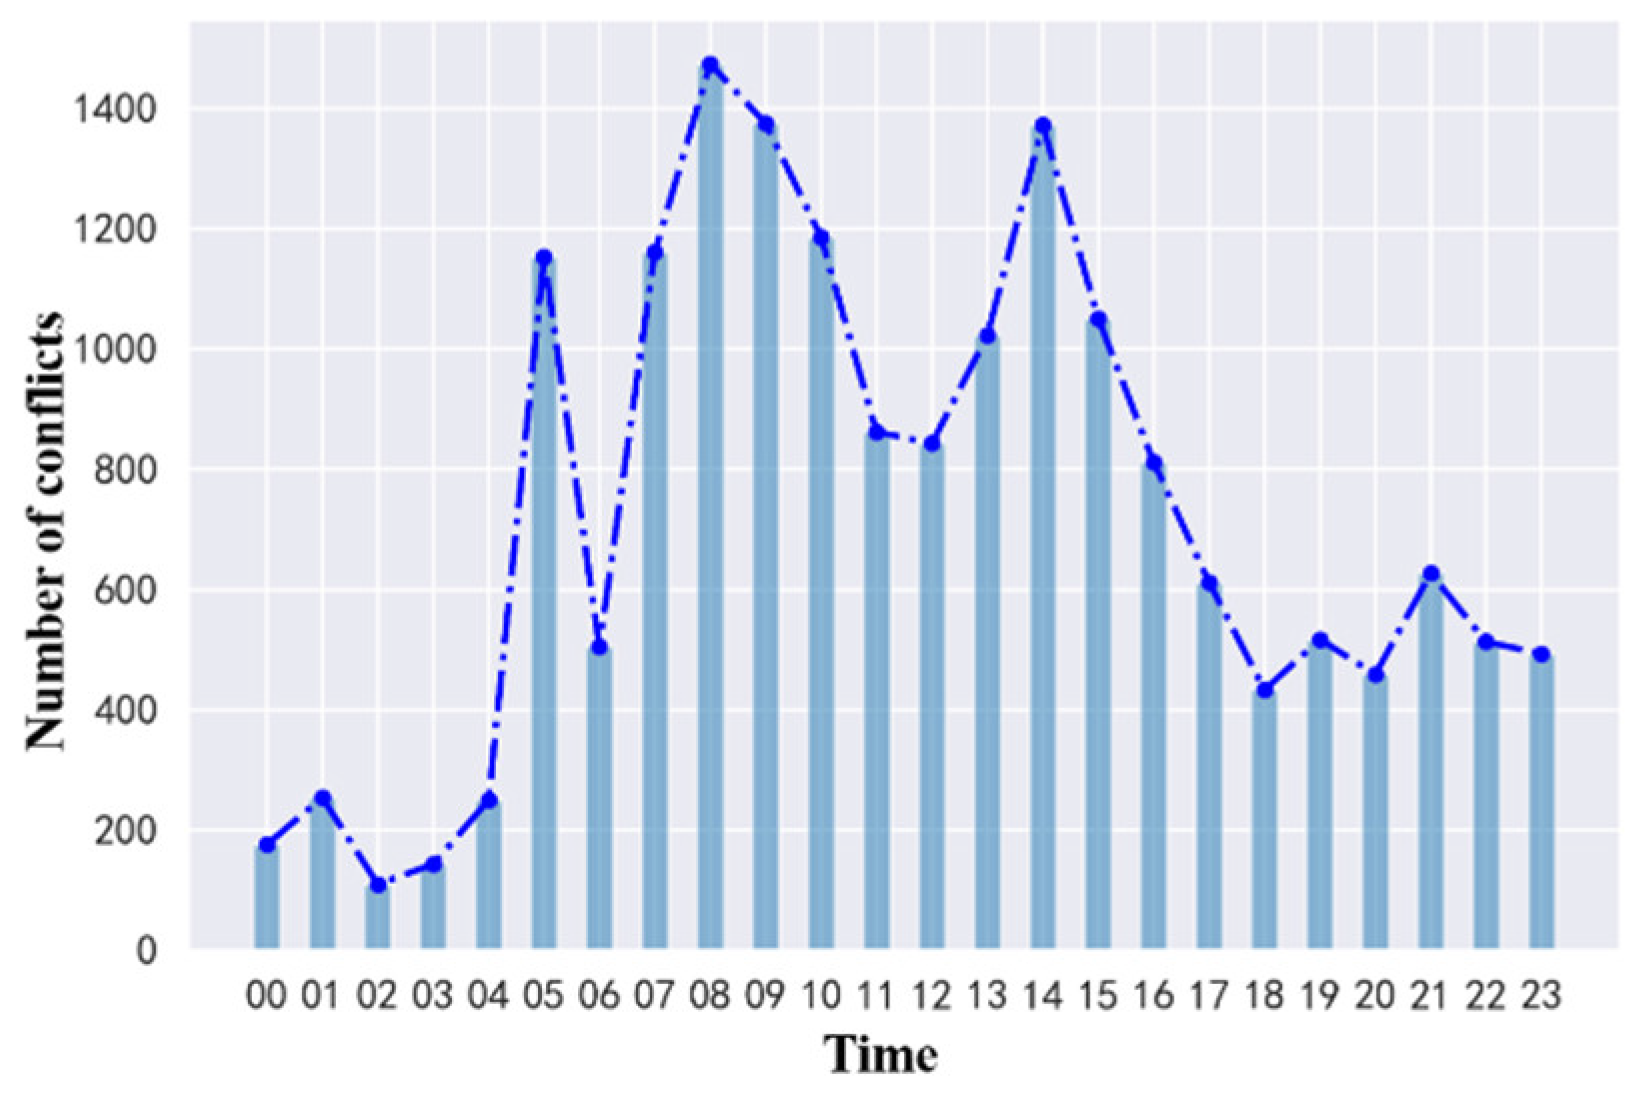
Figure 19.
Time distribution of the number of conflicts.
Figure 19.
Time distribution of the number of conflicts.
Figure 19 shows the number of conflicts per hour in the study waters. It can be seen that ship conflicts occur more frequently in the time periods of 05:00, 07:00-11:00, and 13:00-17:00, which is consistent with the actual traffic conditions in the study waters, because the ship traffic density is higher during the day. Based on the identification results of the conflict distribution in time and space, marine navigators and maritime departments can have a deeper understanding of when and where to enhance situational awareness during the navigation process of ships, providing valuable reference for traffic regulatory departments to formulate and implement appropriate regulatory strategies.
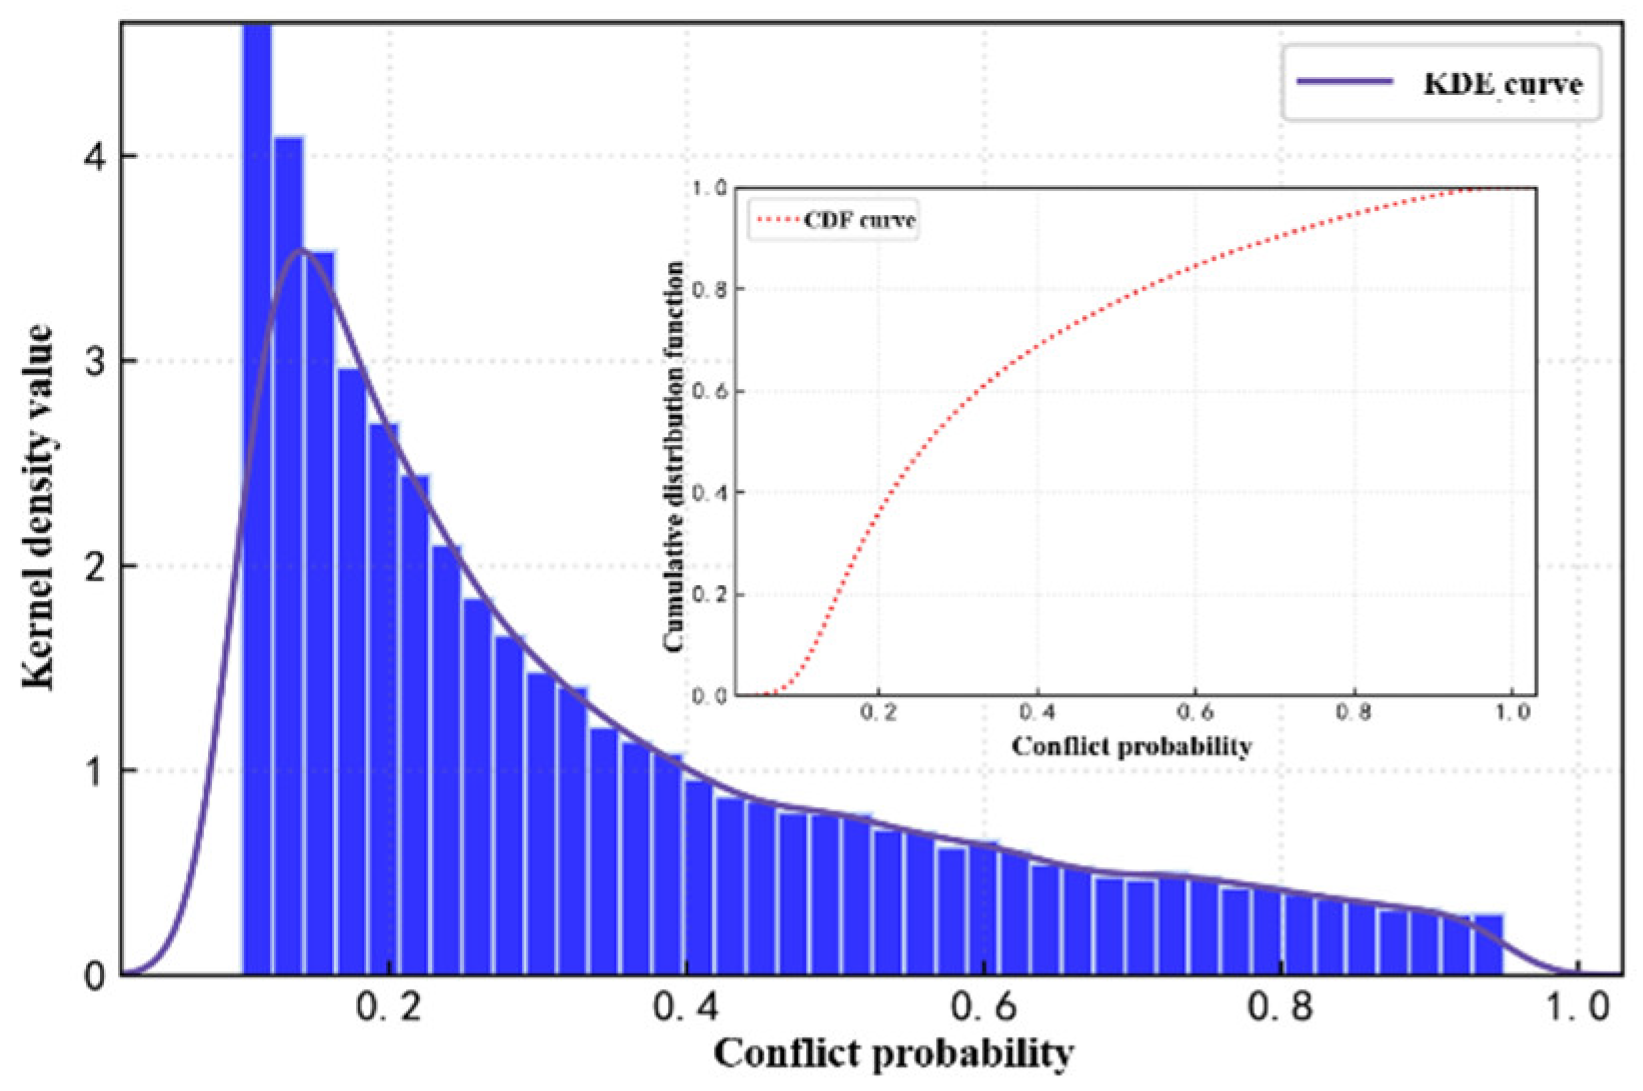
The distribution of conflict severity and the corresponding cumulative probability distribution are shown in
Figure 20. It can be seen from the figure that the severity of most conflicts is below 0.2, which indicates that the probability of a ship being involved in a higher conflict is much lower than the probability of being involved in a minor conflict. In order to further demonstrate the characteristics of the detected conflicts,
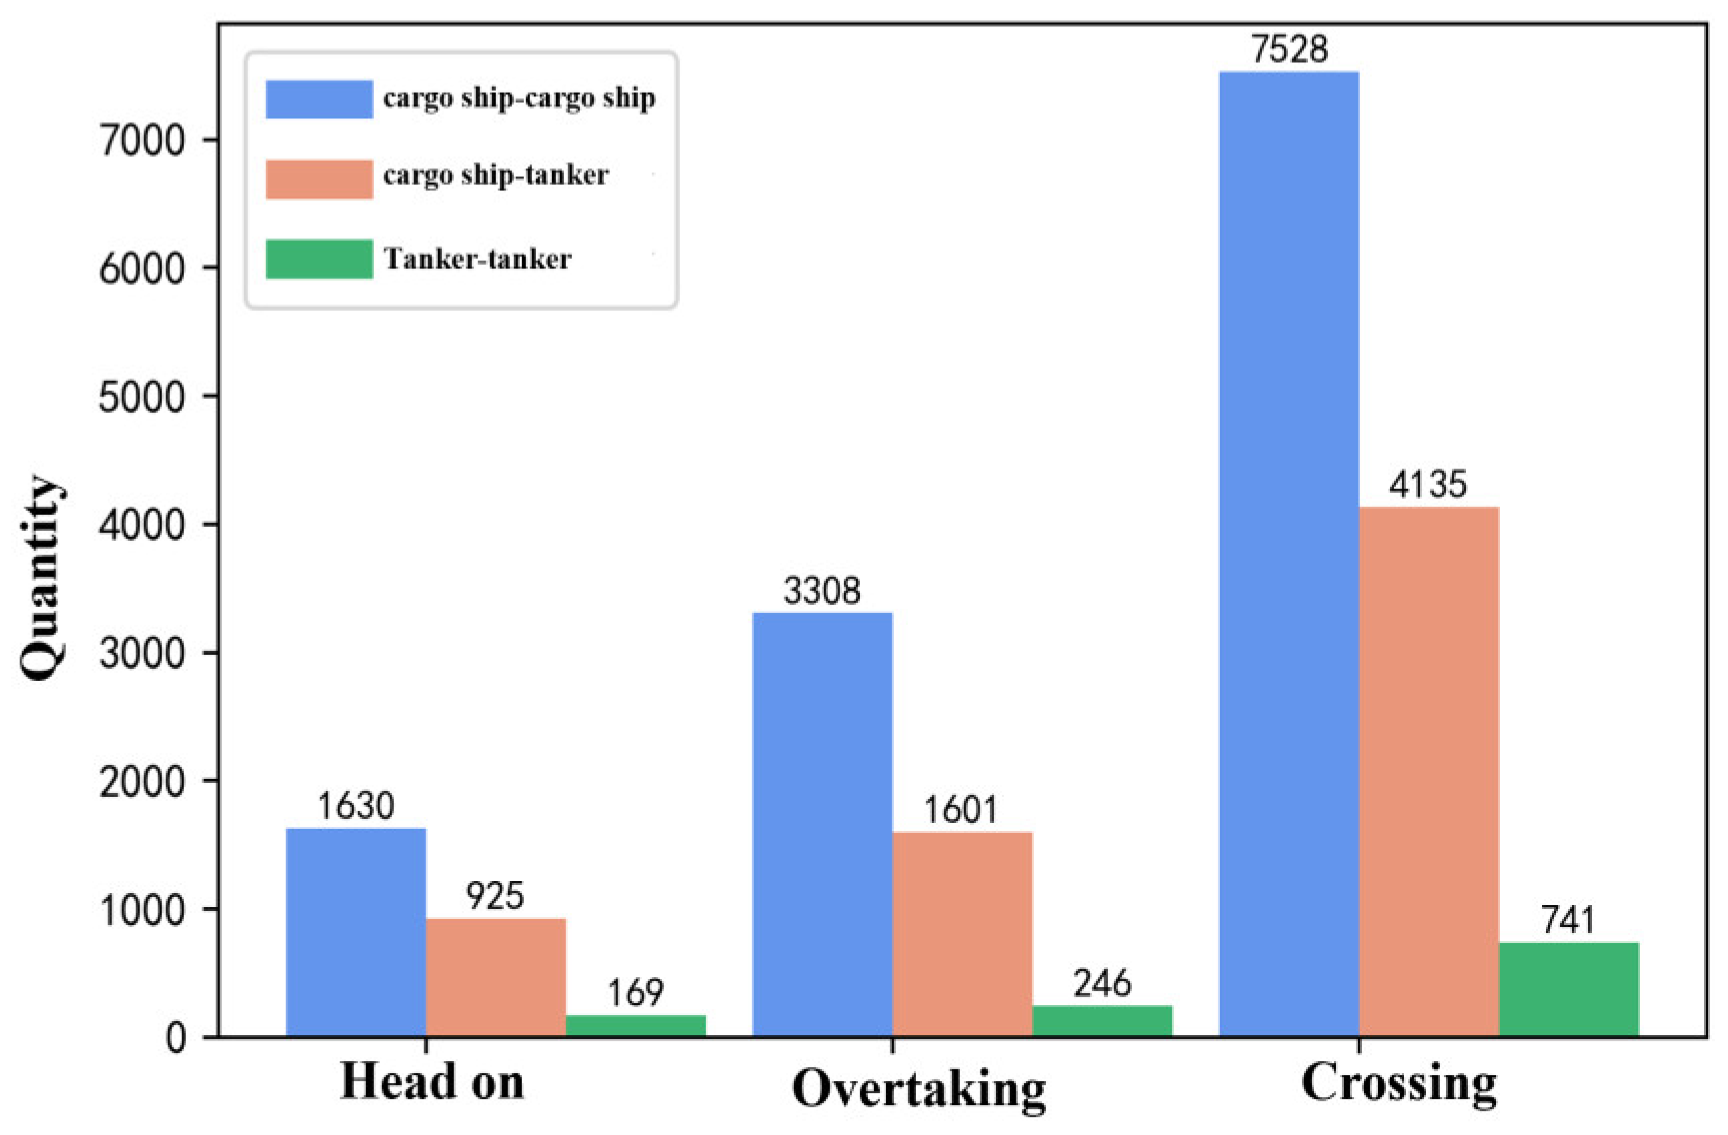
Figure 21 shows the number of different conflict types among different ship types. It can be seen that the number of crossing encounter conflict types is the largest, followed by overtaking, and then head-on. Compared with overtaking and head-on conflicts, the proportion of conflicts in crossing encounter scenarios is higher, mainly because the relatively large angle range is classified as crossing encounters. In addition, the number of conflicts between cargo ships in the three encounter scenarios is much higher than that of other ships, which may be due to the large number of cargo ships in the study waters and the frequent encounters.
In order to verify the effectiveness and feasibility of the global risk assessment method proposed in this paper, the complexity of maritime traffic is introduced as a collision risk indicator for evaluation. The complexity of maritime traffic is used to indicate the degree of traffic conditions, including the degree of congestion and risk. Although the traffic complexity model is not a traditional risk assessment model, it can reflect the instantaneous collision risk to a certain extent. Generally speaking, the higher the traffic complexity, the higher the collision risk, because when the traffic situation becomes complicated, the difficulty of avoiding collision increases. In addition, compared with simple indicators such as traffic density and ship distance, it can more fully reflect the risk of ship collision. Therefore, this paper uses traffic complexity as an indicator of the effectiveness of the global risk assessment framework.
The definition of the maritime traffic complexity model includes two parts: traffic density factor and traffic conflict factor. The traffic density factor is described by the relative distance between ships, and the traffic conflict factor is described by the length, speed and relative orientation of the ship. The traffic complexity is expressed as follows:
Among them, 、、are the traffic complexity, traffic density complexity, and traffic conflict complexity of the ship and ship , respectively. are the relative distance, relative speed, and relative orientation between the ship and ship, respectively; is the traffic complexity of the ship, is the average of the sum of all complexities involving ship.
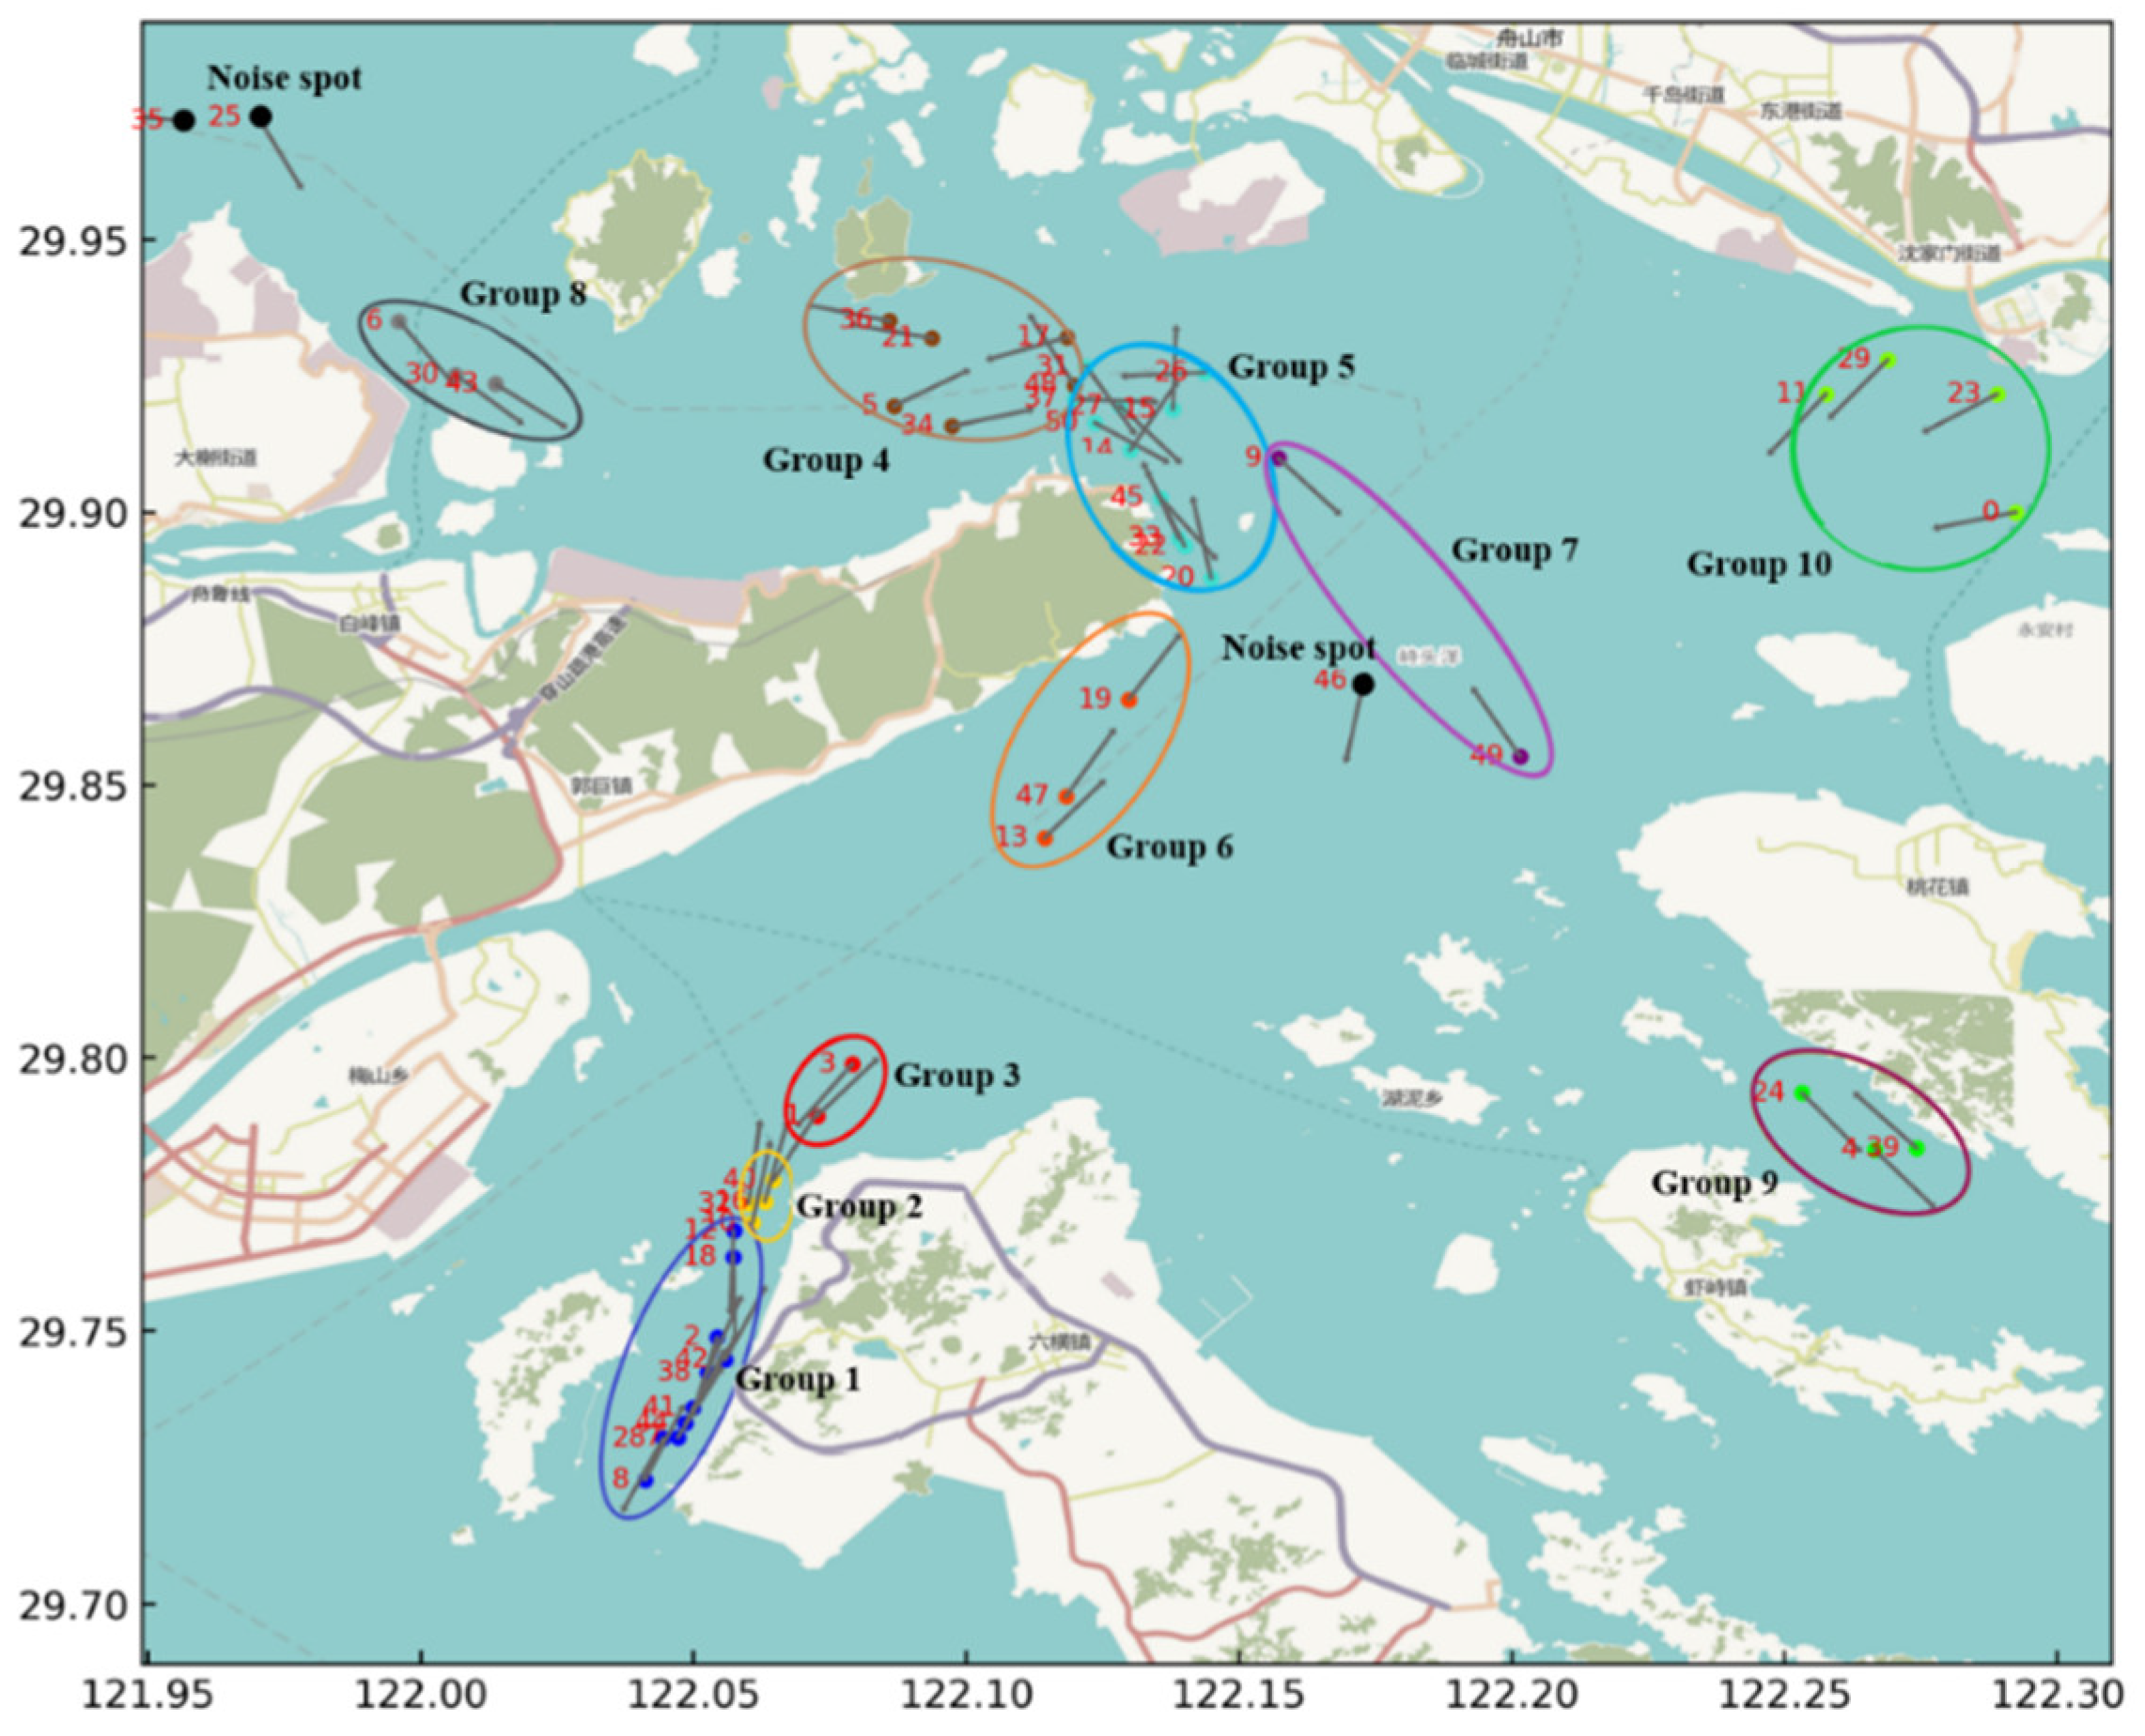
According to the ship group extraction algorithm proposed in this paper, the ships in the study waters at a certain time are divided into 10 ship groups, as shown in
Figure 22. The contribution value of each ship in each ship group obtained by the Shapley value method in cooperative game is shown in
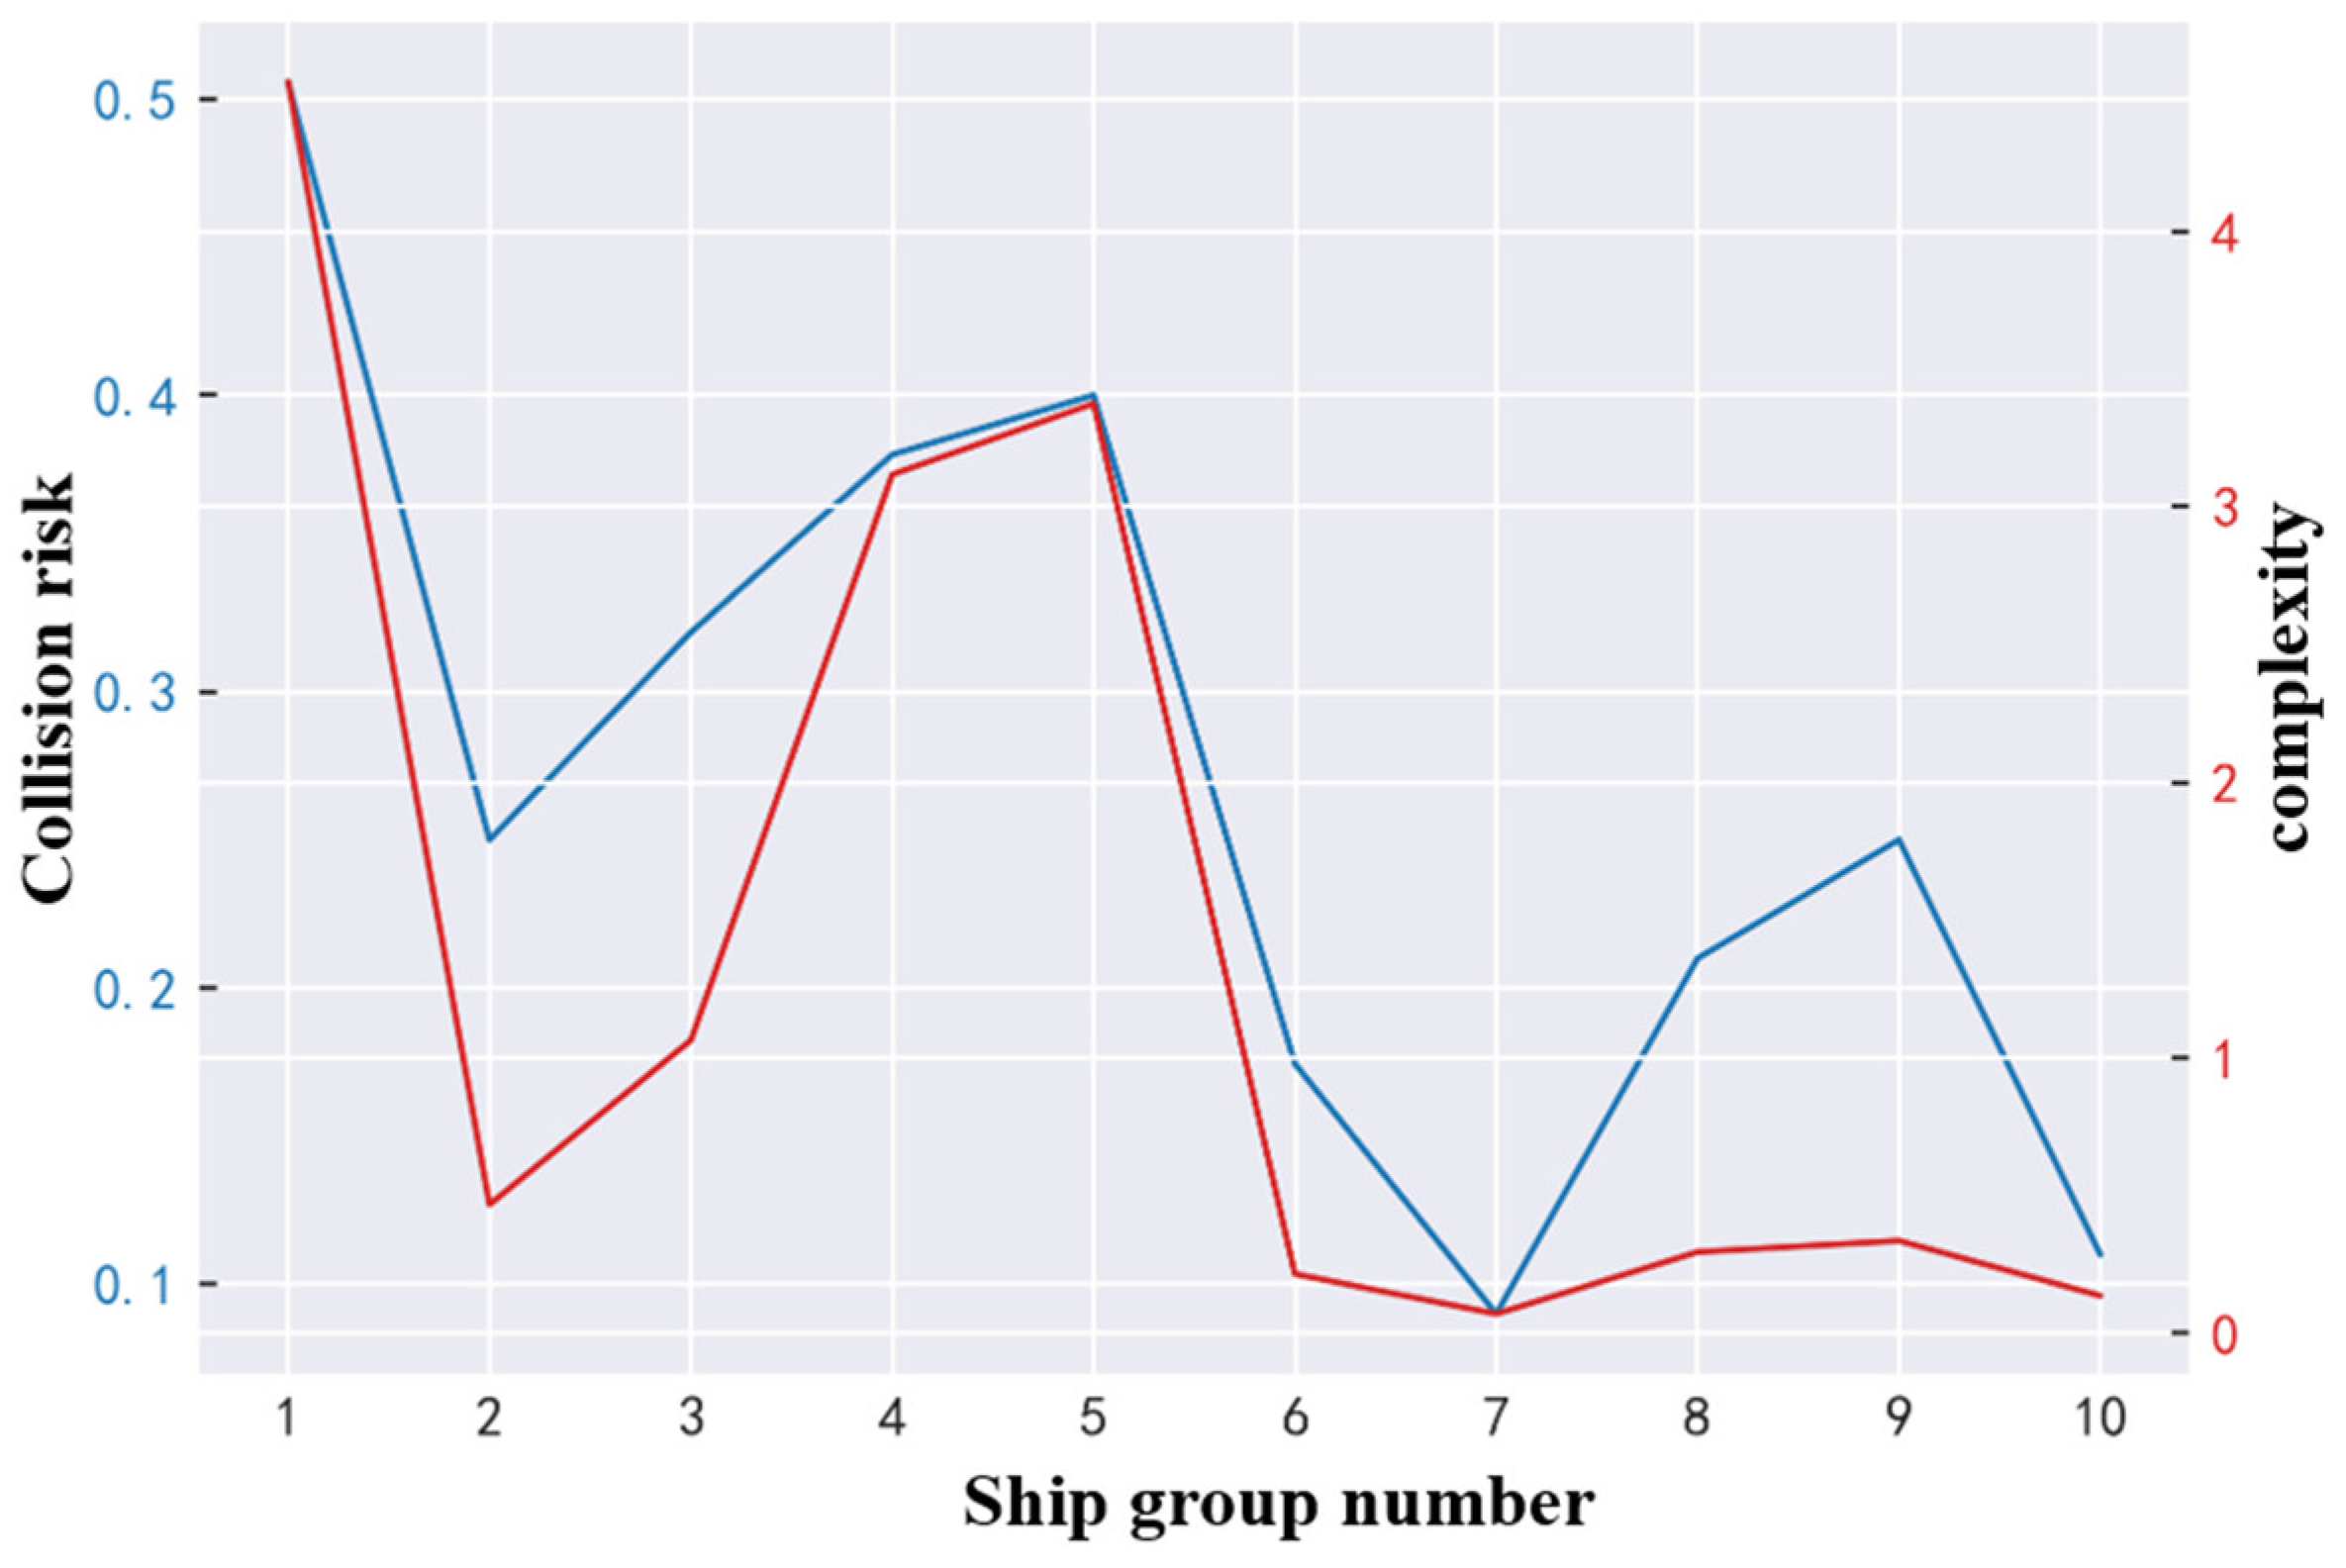
Figure 23. The collision risk and traffic complexity of each ship group are shown in
Figure 24.
It can be seen from
Figure 24 that the group with the highest collision risk is Group 1, which reaches 0.5058. It can be seen that: the ship traffic density in Group 1 is large, there are many ship conflicts, and the narrow channel width leads to a reduced passing distance between ships, resulting in a high risk within the group; Group 7 has the lowest collision risk of 0.09, and the distance between ships in the group is relatively large, resulting in a conflict of lower severity; and the collision risk in Group 3 is significantly greater than that in Group 7. This is because the distance between ships in Group 3 is much smaller than that in Group 7. When approaching each other, the distance is negatively correlated with the collision risk. Therefore, the collision risk calculated according to this framework is consistent with the actual traffic conditions in the study waters. In addition, it can be seen from
Figure 24 that the traffic complexity curve and collision risk curve of each group have the same change trend. In order to quantitatively analyze the correlation between the change trend of collision risk and traffic complexity of the 10 ship groups, a Pearson correlation analysis was performed. The analysis results show that at a confidence level of 99%, the change trend of collision risk of the 10 ship groups is strongly correlated with the change trend of traffic complexity, with a correlation coefficient of 0.923 and a P value of less than 0.001. Therefore, it can be proved that the collision risk of different ship groups in the waters calculated according to the proposed framework is effective.
